Article

Screening and Verification of Aquaporin Gene AsPIP1-3 in Garlic (Allium sativum L.) under Salt and Drought Stress

1
College of Horticulture, Nanjing Agricultural University, Nanjing 210095, China
2
Department of Food Science, Aarhus University, Agro Food Park 48, 8200 Aarhus, Denmark
*
Authors to whom correspondence should be addressed.
These authors contributed equally to this work.
Horticulturae 2024, 10(7), 738; https://doi.org/10.3390/horticulturae10070738
Submission received: 5 June 2024 / Revised: 1 July 2024 / Accepted: 5 July 2024 / Published: 12 July 2024

Abstract

:
In order to screen candidate aquaporin genes involved in resisting osmotic stress, we analyzed the physiological responses and the expression levels of aquaporin genes in garlic under drought and salt stress with ‘Er Shuizao’ as plant material. Different physiological indicators were detected under drought and salt stress treatments. RT-qPCR was used to detect the expression levels of the candidate aquaporin genes in specific tissues. Finally, we screened AsPIP1-3 as a candidate gene and analyzed its function. The results showed that the relative water content and chlorophyll content of leaves decreased, the O2 production rate increased, and H2O2 accumulated in garlic under drought and salt stress. The activities of SOD, POD, and CAT enzymes first increased and then decreased in garlic. The content of soluble sugar and proline increased to maintain cell osmotic balance, and the content of MDA and relative conductivity continued to increase. Most aquaporin gene expression first increased and then decreased in garlic under drought and salt stress. AsPIP1-3 gene expression is up-regulated under drought and salt stress in garlic. The relative expression was the highest on the 6th day of stress, being related to antioxidant enzyme activity and osmotic regulation. The consistent changes in gene expressions and physiological responses indicated that AsPIP1-3 played a role in resisting garlic osmotic stress. AsPIP1-3 was located on the cell membrane, being consistent with the predicted results of subcellular localization. The germination rate and root length of transgenic Arabidopsis under drought stress were significantly different from the wild type. Drought stress reduced the ROS accumulation of transgenic Arabidopsis, and the antioxidant enzyme activity was significantly higher than the wild type. The relative conductivity and MDA content significantly decreased, and the proline content increased under drought stress. The expression level of the genes related to drought stress response (AtRD22, AtP5CS, AtABF3, and AtLEA) significantly increased. The overexpression of AsPIP1-3 genes improved the drought tolerance of transgenic Arabidopsis plants, showing that AsPIP1-3 proteins enhanced drought tolerance. Our study laid a foundation for exploring the regulatory mechanism of garlic to abiotic stress.

1. Introduction

Garlic (Allium sativum L.) is an annual and biennial herb of the genus Allium in the family Liliaceae. It is an important vegetable for both medicine and food [1,2]. Garlic is an important vegetable crop in China, especially as an important export vegetable [3]. However, with the shortage of water resources and the aggravation of soil salinization, abiotic stresses such as drought and salt stress are becoming more and more serious. The abiotic stresses not only seriously affect the yield and quality of garlic and restrict the sustainable development of the garlic industry, but also adversely restrict the breeding of new garlic varieties.
Osmotic stress includes drought and salt stress. These two stresses reduce soil water potential, destroy physiological and biochemical mechanisms, and limit plant growth and development [4,5]. Drought stress usually leads to a decrease in plant biomass accumulation, leaf area, and stem growth, and reduces plant root length, root number, root surface area, and volume [6]. Similar to drought stress, salt stress can cause osmotic and oxidative stress to plants, resulting in reduced plant height, yellowing, and the wilting of leaves.
Under stress, due to cell dehydration, the structure and function of the cell membrane are damaged, resulting in increased plasma membrane permeability and osmotic potential in plants. Under osmotic stress, plants accumulate osmotic regulators to maintain cell osmotic potential, including proline, soluble sugar, betaine, and other organic compounds [7]. Meanwhile, plants reduce photosynthesis by closing stomata and reducing transpiration in order to maintain water balance. Plants produce a large amount of reactive oxygen species (ROS) under osmotic stress. The excessive accumulation of ROS leads to protein degradation and cell membrane lipid peroxidation, which increases cell membrane permeability and damages the membrane system, resulting in damage to plants.
Plasma membrane intrinsic proteins (PIPs) are members of the aquaporin family and play an important role in maintaining water balance in plants. The expression of ZmPIP2-6 in maize was up-regulated under osmotic stress, and overexpression could improve the tolerance of plants to osmotic stress [8]. Moderate OsPIP1 expression could improve the salt tolerance and water conductivity of rice; low OsPIP1 overexpression could increase rice seed yield and germination rate [9]. In Ricinus communis, the expression of the PcPIP2-1 protein can improve the water permeability of the hypocotyl elongation region [10]. We previously identified 38 garlic aquaporins, and found that PIP subfamily genes may play an important role in the tolerance of garlic to abiotic stress. This study systematically analyzed the physiological and biochemical changes in garlic under drought and salt stress, and verified the biological function of AsPIP1-3. This study will further enrich the knowledge of the aquaporin family, better understand the evolution and mechanism of the AQP family, discover and excavate the drought and salt tolerance genes of the AQP family, and lay a foundation for the creation of garlic stress-tolerant germplasm resources and the cultivation of new varieties.

2. Materials and Methods

2.1. Experimental Materials

‘Ershuizao’, a highly adaptable garlic cultivar that is cultivated throughout China, was used as the experimental material. The garlic variety ‘Ershuizao’ was used as the test. The garlic cloves were seeded in a mixed culture medium (turf/vermiculite/perlite = 2:1:1, volume ratio) and cultured in a light incubator. The culture conditions were: 14 h/10 h day and night, 25 °C/18 °C, photosynthetically active radiation of 360 μmol m−2 s−1, and relative humidity of 75%.
The Arabidopsis thaliana used in this experiment was wild-type Arabidopsis thaliana Col-0, and the tobacco was Nicotiana benthamiana, both of which were stored in the Vegetable Physiology and Ecology Laboratory of Nanjing Agricultural University.

2.2. Drought and Salt Stress Treatment

2.2.1. Garlic Drought and Salt Stress Treatment

Garlic plants with uniform growth potential were selected for the drought and salt stress treatments, respectively. The 20% polyethylene glycol 6000 (PEG 6000) was used for the drought treatment, 200 mM sodium chloride solution was used for the salt stress treatment, and clear water was used as control.
The samples of 0 d, 2 d, 4 d, 6 d, 8 d, and 10 d after treatment were taken for the determination of growth indicators and biochemical indicators, and three biological replicates were set at each time point. In order to reduce the error caused by individual differences, three samples were repeated each time.

2.2.2. Treatment of Drought Stress in Transgenic Arabidopsis thaliana

The full-length AsPIP1-3 cDNA was ligated into the pCBIMA 1300::GFP vector which was stored in the Vegetable Physiology and Ecology Laboratory of Nanjing Agricultural University. An empty vector was used as a control. The recombinant plasmid was transformed into Agrobacterium tumefaciens GV3101. Arabidopsis thaliana was transformed by the floral dip method. Transgenic Arabidopsis was selected on MS medium containing 50 μg/L hygromycin B.
Homozygous transgenic lines and wild-type Arabidopsis were vernalized in a refrigerator at 4 °C for 2 days, and then the seeds were sterilized. To detect drought tolerance, the Arabidopsis seeds were sown on MS medium and placed in a light incubator for cultivation. The transgenic Arabidopsis lines were transferred to a medium containing MS plus 20% PEG6000. After 10 days of treatment, the root length of the Arabidopsis seedlings was measured and the germination rate was counted. The remaining seedlings were moved to a culture medium to grow normally for about 3 weeks. Stress experiments were repeated at least three times.

2.3. Measurement Indicators and Methods

2.3.1. Growth Indicators

The plant height, stem diameter, leaf length, leaf width, fresh weight, and dry weight of the garlic were measured at 0 d, 2 d, 4 d, 6 d, 8 d, and 10 d after drought and salt stress. The whole plant of garlic was rinsed with deionized water, the surface moisture was absorbed by an absorbent paper, the fresh weight was weighed, and then the weighed plant was put into an envelope and sealed, and the green plant was killed in the oven for 30 min (105 °C), dried to a constant weight (60 °C), and its dry weight was weighed.

2.3.2. Relative Moisture Content

Fresh leaves were taken and weighed as Wf, soaked in distilled water for 6 h, removed and weighed, and the leaves were soaked in distilled water again for 1 h. If there was no change in weight, constant weight was reached. At this time, the weight of the leaves was weighted as Wt, after which they were dried in an oven until constant weight as Wd.
Relative   water   content   ( % ) = W f W d W t W d × 100

2.3.3. Photosynthetic Pigment Content

We took 0.2 g leaves, cut and mixed them, added 10 mL 95% ethanol, and soaked them in the dark for 24 h. The absorbance of the extract was measured at 665 nm, 649 nm, and 470 nm, respectively, with 95% ethanol as the control.

2.3.4. Superoxide Anion (O2) Generation Rate

The 0.1 g sample was ground with a high-throughput tissue grinding instrument, 1.6 mL of 50 mmol/L phosphate buffer was added, centrifuged at 12,000 rpm for 10 min, and 0.5 mL of supernatant was taken. The supernatant was added with 0.5 mL phosphate buffer and 1 mL hydroxylamine chloride and reacted at 25 °C for 1 h. Then, 1 mL aminobenzenesulfonic acid and 1 mL α-naphthoic acid were added, and reacted at 25 °C for 20 min. The absorbance was measured at 530 nm.

2.3.5. Hydrogen Peroxide (H2O2) Content

We took a 0.2 g sample, ground it, added 1.6 mL TCA (0.1%, m/v), and centrifuged it at 12,000 rpm at 4 °C for 15 min. We added 0.2 mL supernatant with 0.25 mL 0.1 M phosphate buffer (PH 7.0) and 1 mL 1 M KI solution. After standing in darkness at 25 °C for 1 h, the absorbance is determined at 390 nm.

2.3.6. Antioxidant Enzyme Activity
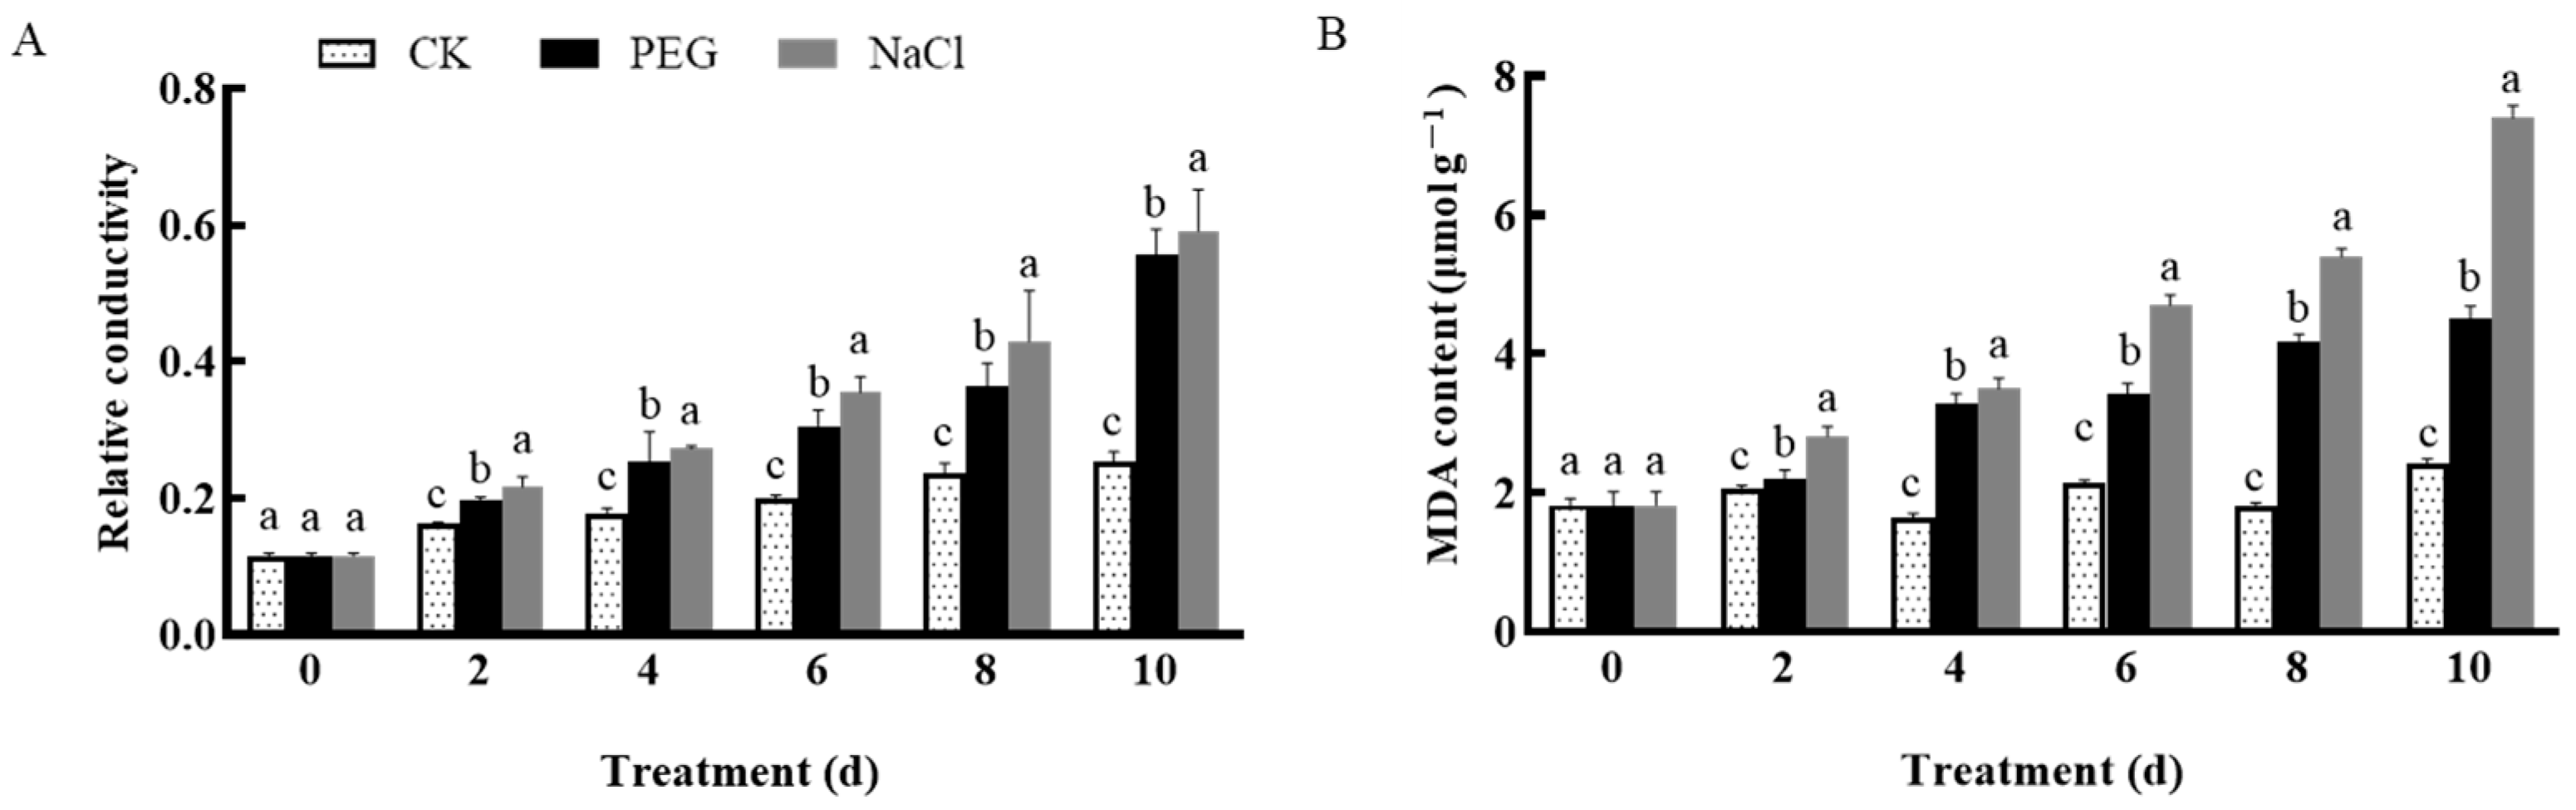
We took a 0.5 g fresh sample, added 5 mL phosphate buffer (PH 7.8), and ground it on ice. The homogenate was centrifuged, and the supernatant was used to determine the activity of antioxidant enzymes. SOD activity was measured by the nitrogen blue tetrazole (NBT) method. The activity of POD was detected by the guaiacol colorimetric method. CAT activity was detected by ultraviolet spectrophotometry.

2.3.7. MDA Content

Take 0.2 g fresh sample, grind with TCA (5%, w/v), centrifuge homogenate. Take 1 mL of supernatant, add 1 mL TBA (0.67%, w/v), and bathe in water at 100 °C for 30 min. Cool to room temperature and centrifuge at 12,000 rpm for 5 min. The absorbance of the supernatant was measured at 450 nm, 532 nm, and 600 nm.

2.3.8. Relative Conductivity

The garlic leaves were punched and the 0.1 g of garlic leaf discs were taken and then immersed in 10 mL of distilled water. The initial conductivity E1 was measured using a conductivity meter. The sample was placed in hot water in a water bath for 20 min, cooled to room temperature, and then the conductivity E2 was measured as Relative Electrical Conductivity (REL) = E1/E2.

2.3.9. Soluble Sugar Content

The content of soluble sugar was determined by the anthrone colorimetric method.

2.3.10. Proline Content

We weighed 0.5 g leaves, added 5 mL 3% sulfosalicylic acid solution, and boiled in a water bath for 10 min. The 2 mL extract was added with 2 mL glacial acetic acid and 2 mL acidic ninhydrin reagent, and the solution was red in a boiling water bath for 30 min. The absorbance of the upper proline red toluene solution was measured at a wavelength of 520 nm.

2.4. Expression Analysis of Garlic AQP Genes under Abiotic Stress

qRT-PCR was used to analyze the expression patterns of AQPs under drought and salt stress. RT-qPCR was performed using the TOROIVD qRT Master Mix kit (Toroivd, Shanghai, China) and amplification was performed using the Quantstudio 3 real-time quantitative fluorescent PCR apparatus (AppliedBiosystems, Foster City, CA, USA). The reaction procedure was as follows: predenaturation at 95 °C for 60 s, denaturation at 95 °C for 10 s, annealing at 60 °C for 30 s, and 40 cycles were carried out. Using AsACTIN as a reference gene, the expression of each gene was calculated by the 2−ΔΔCt method using primers from Table 1. Three biological replicates were performed at each stage, and three technical replicates were performed at each biological replicate.

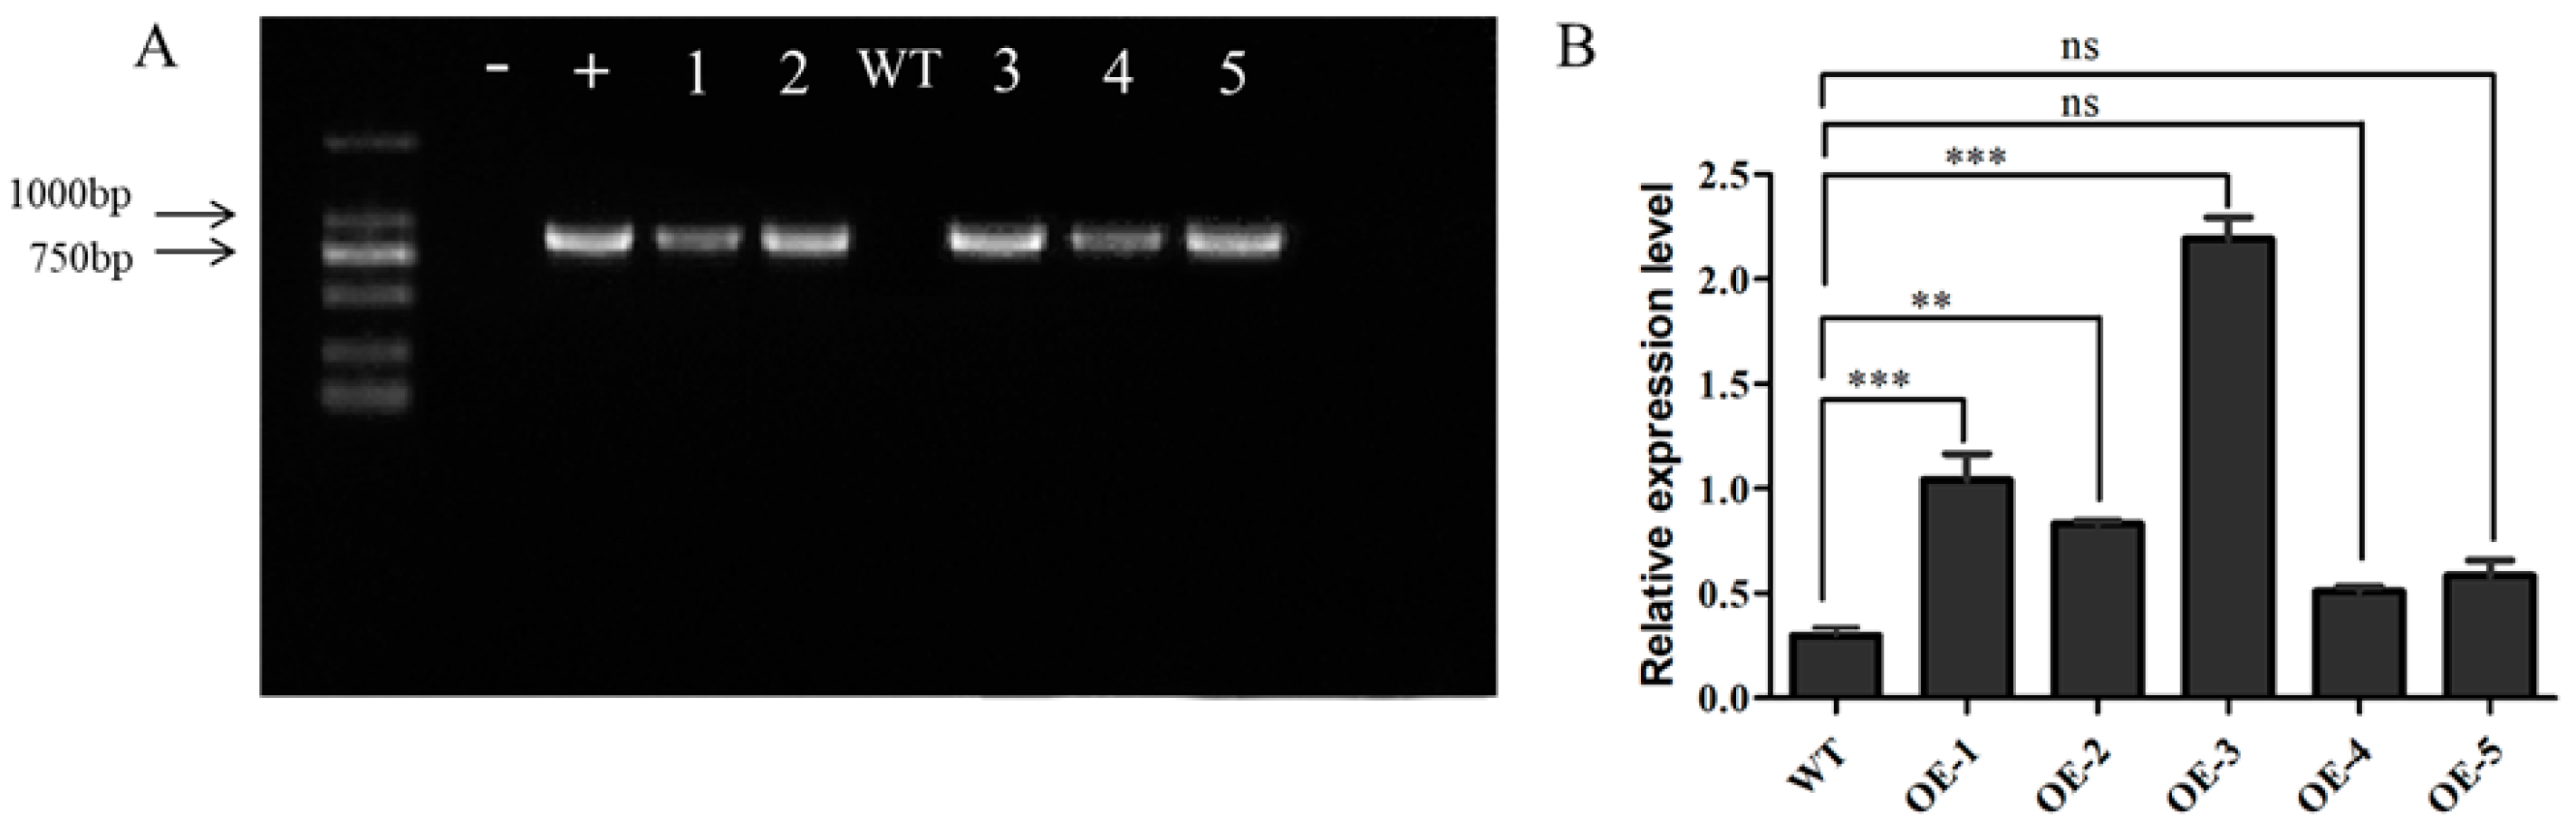
2.5. Garlic AsPIP3-1 Overexpression in Arabidopsis thaliana

The primers were designed according to the open reading frame (ORF) sequence of the AsPIP1-3 gene, and the ORF sequence of the AsPIP1-3 gene was connected to pBinGFP4 (the primers are shown in Table 2), and then transformed into Agrobacteria GV3101 receptor cells. Agrobacterium containing positive clones was transformed into Arabidopsis thaliana by the dipping flower method. Wild-type Arabidopsis seeds were disinfected with 75% alcohol for 5 min and 10% sodium hypochlorite for 10 min, and then washed with ddH2O for 5 times. The seeds were placed on 1/2 MS medium, vernalized in a refrigerator at 4 °C for 2 days, and then placed in an incubator for 10 days before being transplanted into a mixed culture medium. We grew them to the flowering stage, selected the plants with the same flowering, and infected Arabidopsis thaliana with the dipping flower method. They were infected once a week, a total of 2 infections.

2.6. Subcellular Localization of AsPIP3-1

The primers were designed according to the open reading frame (ORF) sequence of the AsPIP1-3 gene, and the ORF sequence of the AsPIP1-3 gene was connected to the fluorescent expression vector pCBIMA1300::GFP using the primers from Table 2. Then, the samples were transformed into the receptive cells of Agrobacterium EAH105. Agrobacterium containing positive clones was injected into the leaves of six-leaf tobacco, and the fluorescence position was observed under a confocal laser microscope three days later.

2.7. Analysis of Stress-Related Gene Expression in Overexpressed Strains

RNA was extracted from the wild-type Arabidopsis thaliana and transgenic Arabidopsis thaliana, and cDNA was obtained by reverse transcription as a template. The expression of stress-related genes in Arabidopsis thaliana was detected by qRT-PCR using the primers from Table 2.

2.8. Data Analysis

The results of this experiment were replicated three times in order to minimize errors. Excel 2007 and IBM SPSS Statistics 25.0 were used for data statistics and analysis, Duncan’s new complex range method was used to test the difference significance at different time points (p < 0.05), and Graphpad prism8.0 was used for plotting.

3. Results

3.1. Effects of Drought and Salt Stress on Garlic Plant Growth

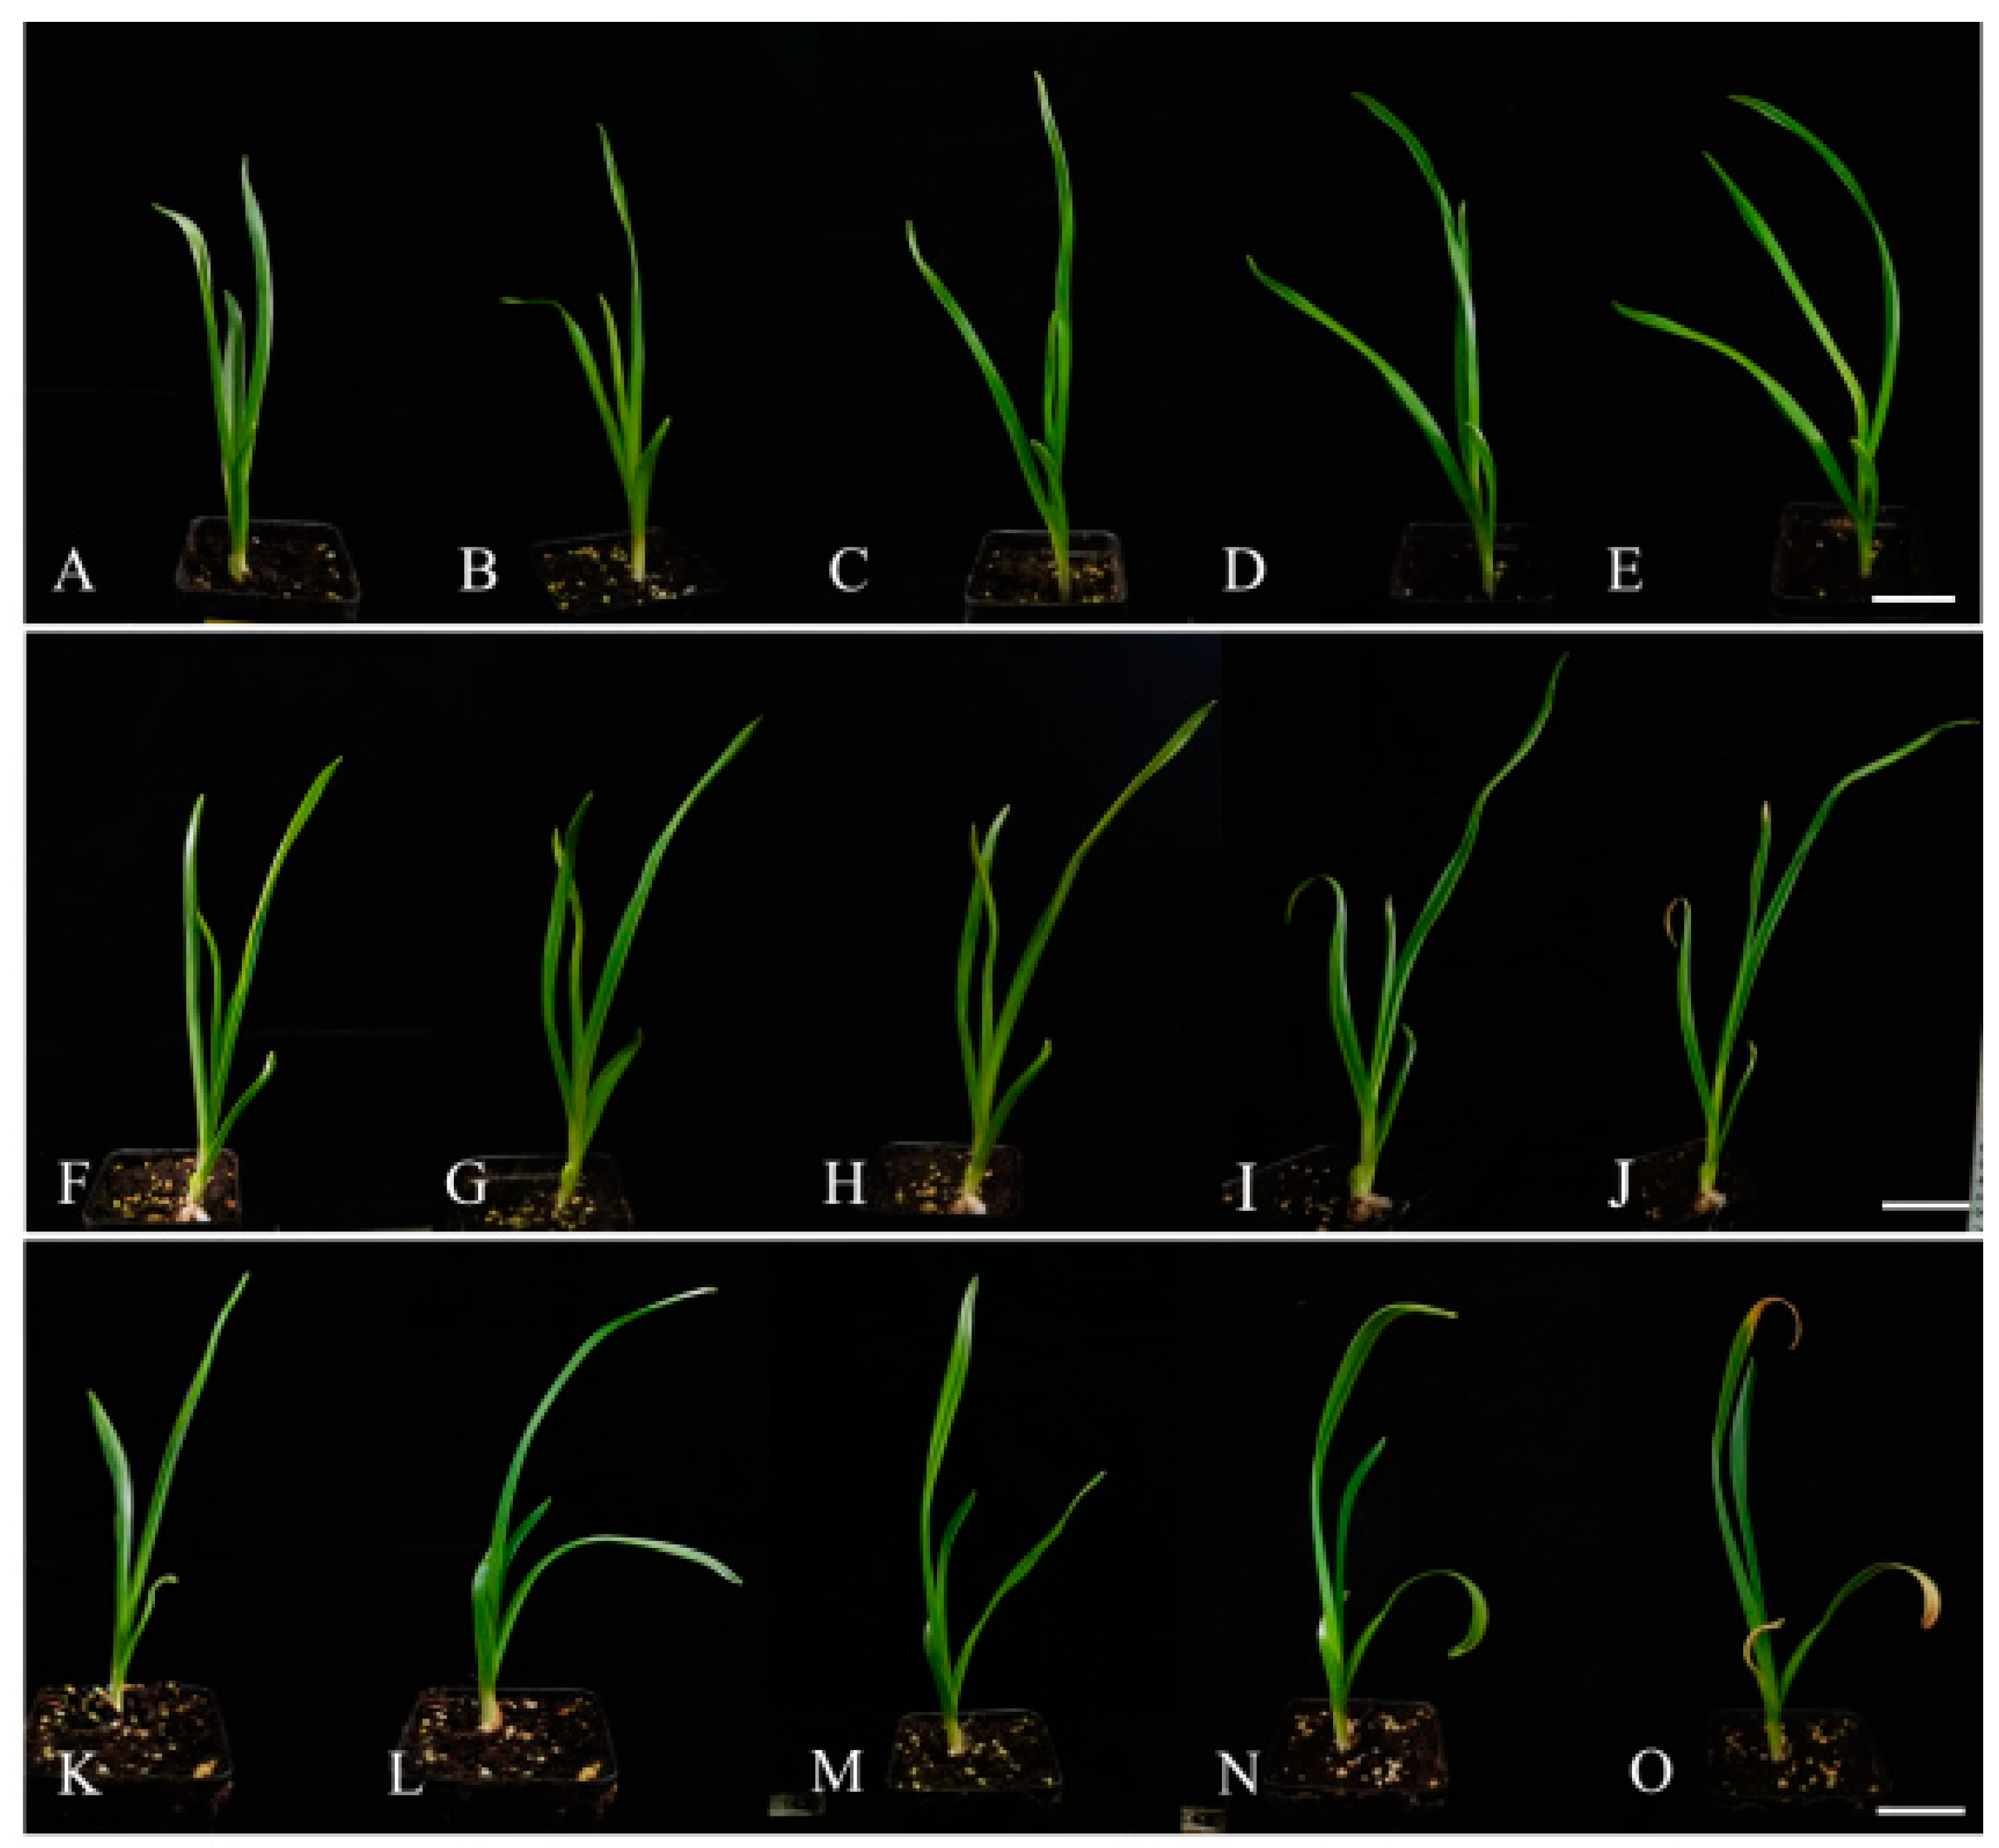
3.1.1. Effect on Garlic Morphology

In order to explore the effects of drought and salt stress on the development of garlic, drought and salt stress treatments were performed. As shown in Figure 1, compared with the control, there was no significant change in drought stress on days 0–4, and the leaf edge and leaf center showed chlorosis on day 6. The leaves began to curl, and the leaf tip yellowed on day 8 and the leaves curled and shrunk and began to dry on day 10. Under salt stress, the plant morphology did not change much when treated for days 0–4; on day 6, the leaf edge was slightly curled, and the whole leaf was green. The top of the leaves was obviously yellowing, curling obviously, and water shortage and drooping were noticed on day 8. Nearly half of the whole leaf at the base yellowed, and the leaves curled and dried up on day 10. This suggests that drought and salt have a negative impact on garlic development.

3.1.2. Effect on Garlic Growth

The effects of drought and salt stress on garlic growth are shown in Table 3. Compared with the control, the plant height and leaf width of the garlic under drought and salt stress had no significant difference, but the leaf length, pseudostem diameter, fresh weight, and dry weight of the garlic were significantly reduced. Under drought and salt stress, fresh weight decreased by 37% and 31%, and dry weight decreased by 51.02% and 50.81%, respectively.

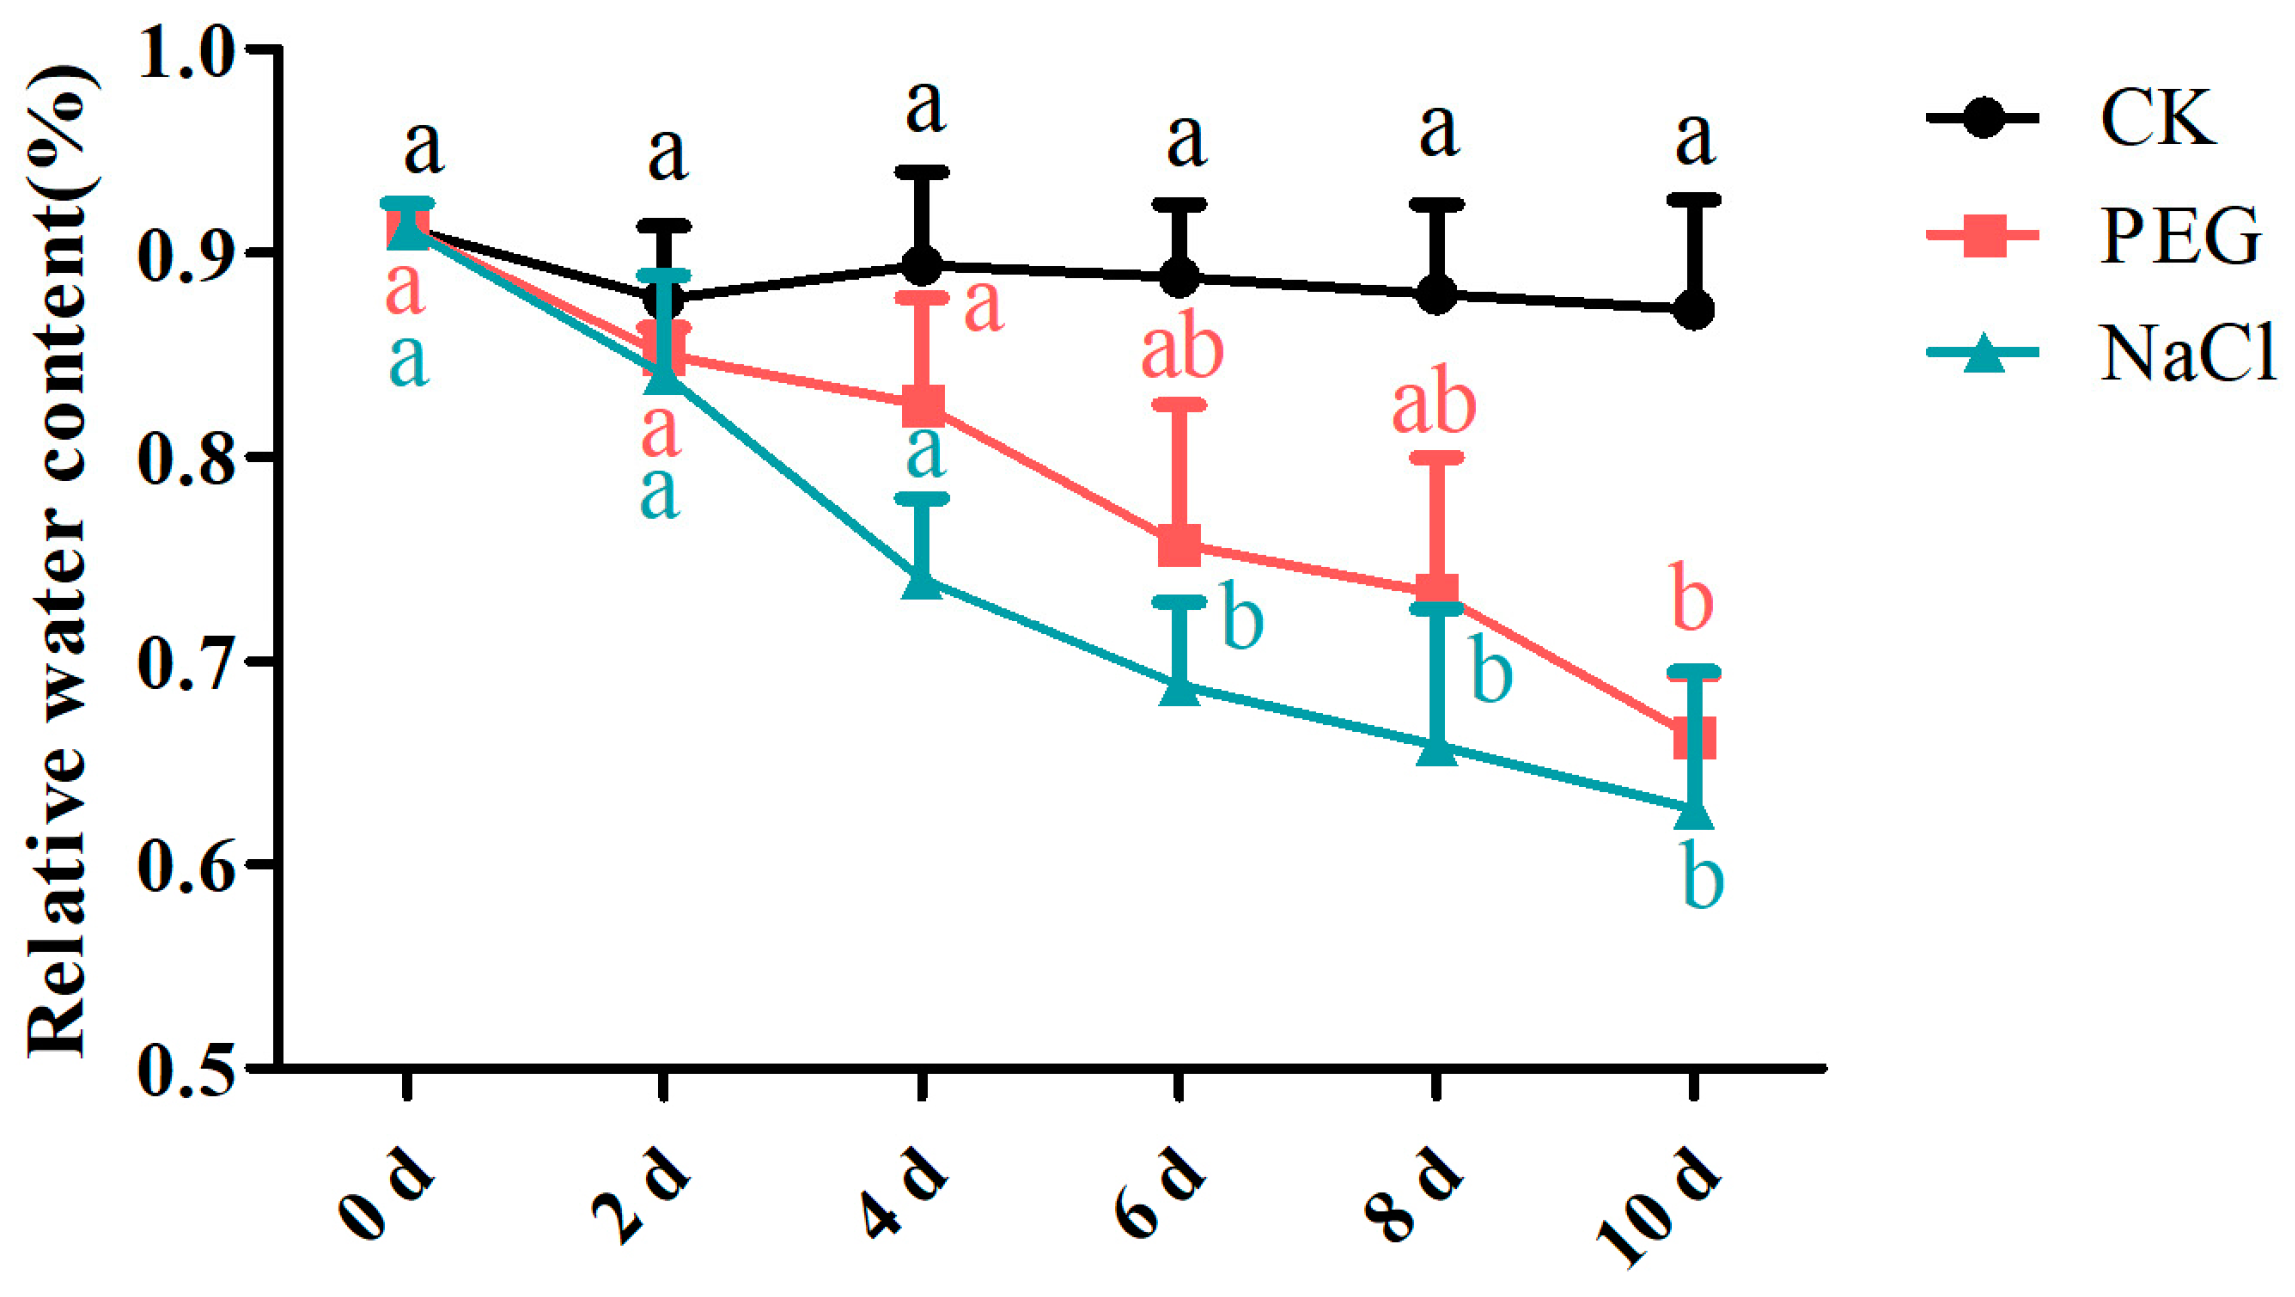
3.2. Changes in Leaf Relative Water Content and Chlorophyll Content under Drought and Salt Stress

As shown in Figure 2, the relative water content showed a downward trend. Compared with the control, the water content of the garlic leaves under drought and salt stress treatment decreased more sharply. On day 10, the relative water content of the leaves in the treatment group decreased to the lowest level, and the relative water content of the leaves under drought and salt stress decreased by 66.28% and 62.5%, respectively, with significant differences.
In the change in chlorophyll content, the content of total chlorophyll, chlorophyll a in the control showed an increasing trend. Chlorophyll b tends to increase and then decrease (Figure 3). After the drought and salt stress treatment, the contents of total chlorophyll, chlorophyll a and chlorophyll b, showed a decreasing trend, and were significantly different from the control after the 4th day (Figure 3).

3.3. Changes in Active Oxygen Species and Antioxidant Enzymes in Garlic under Drought and Salt Stress

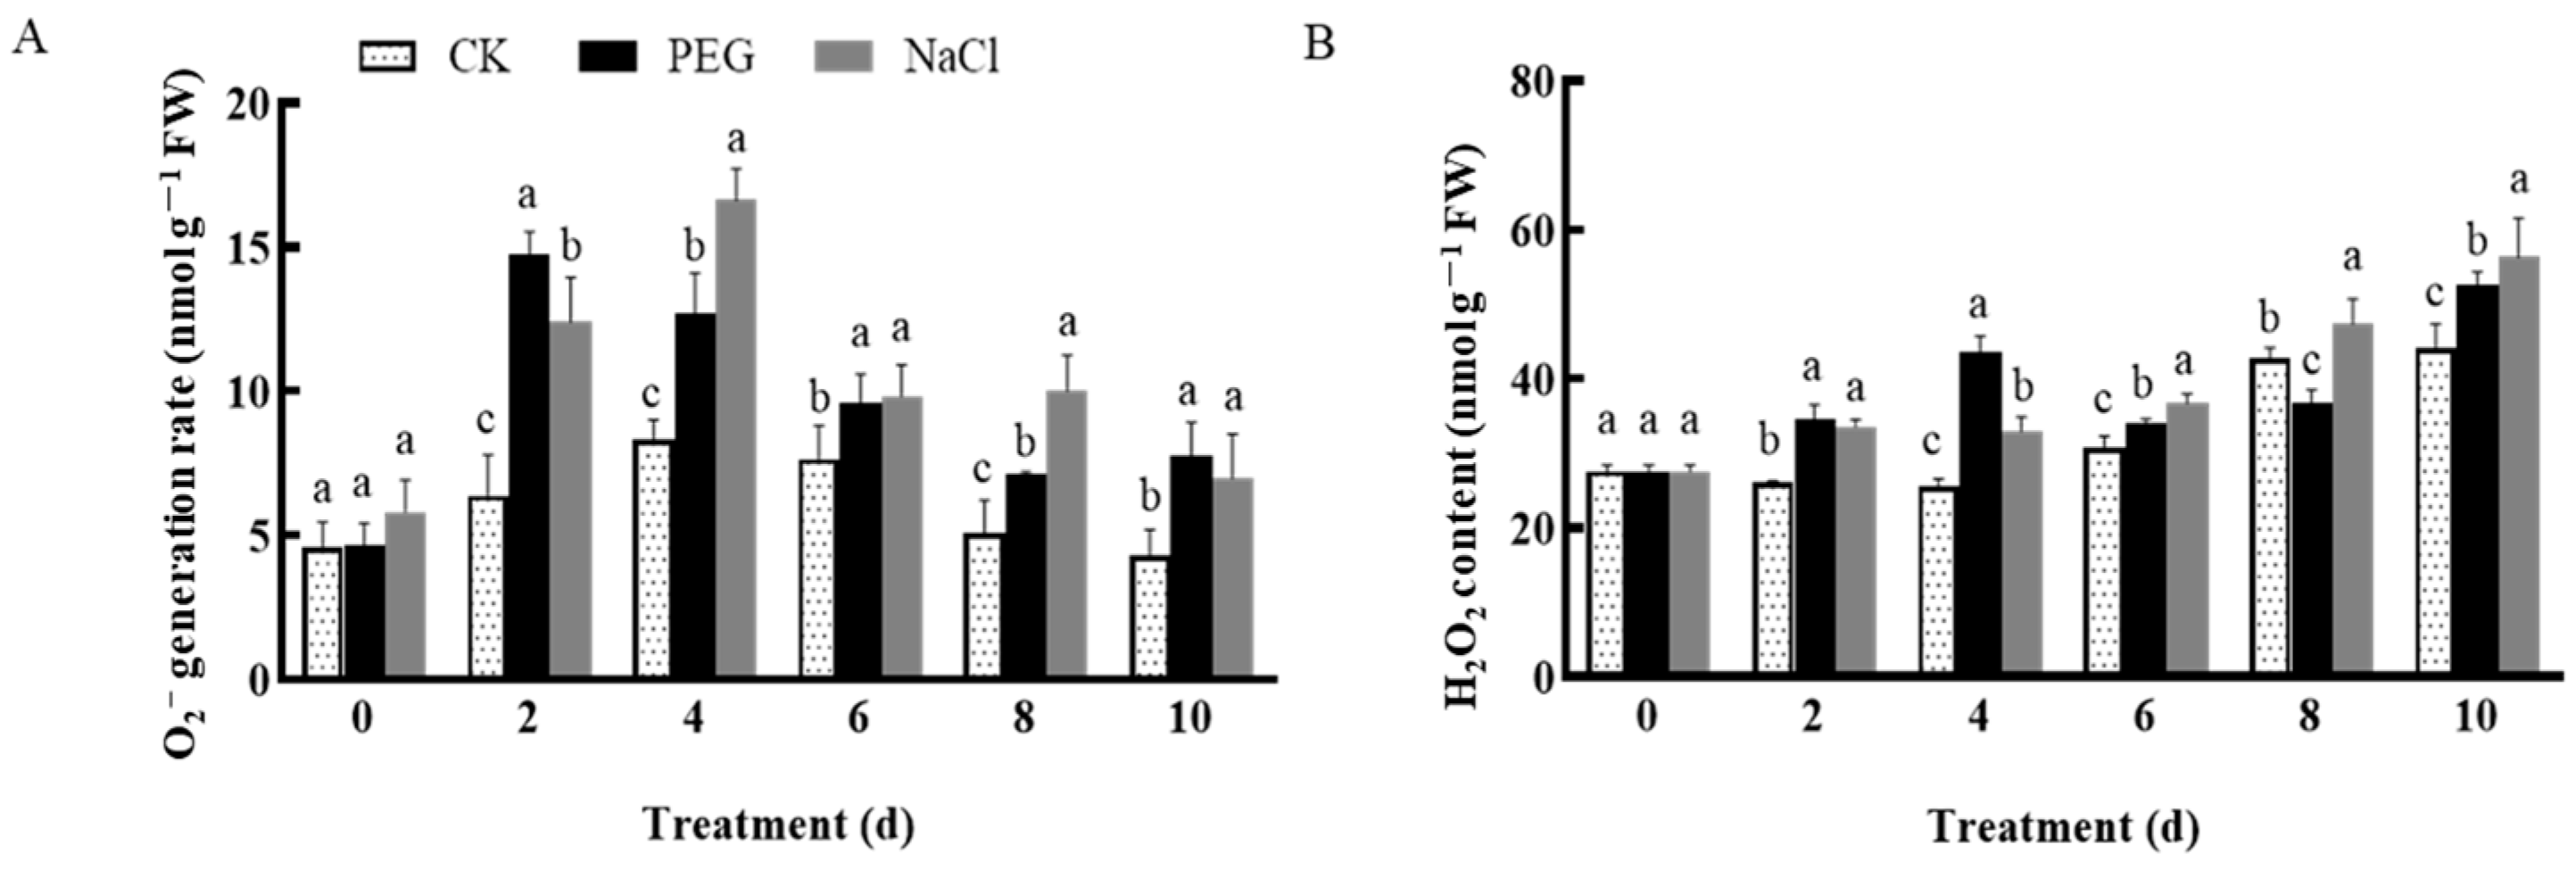
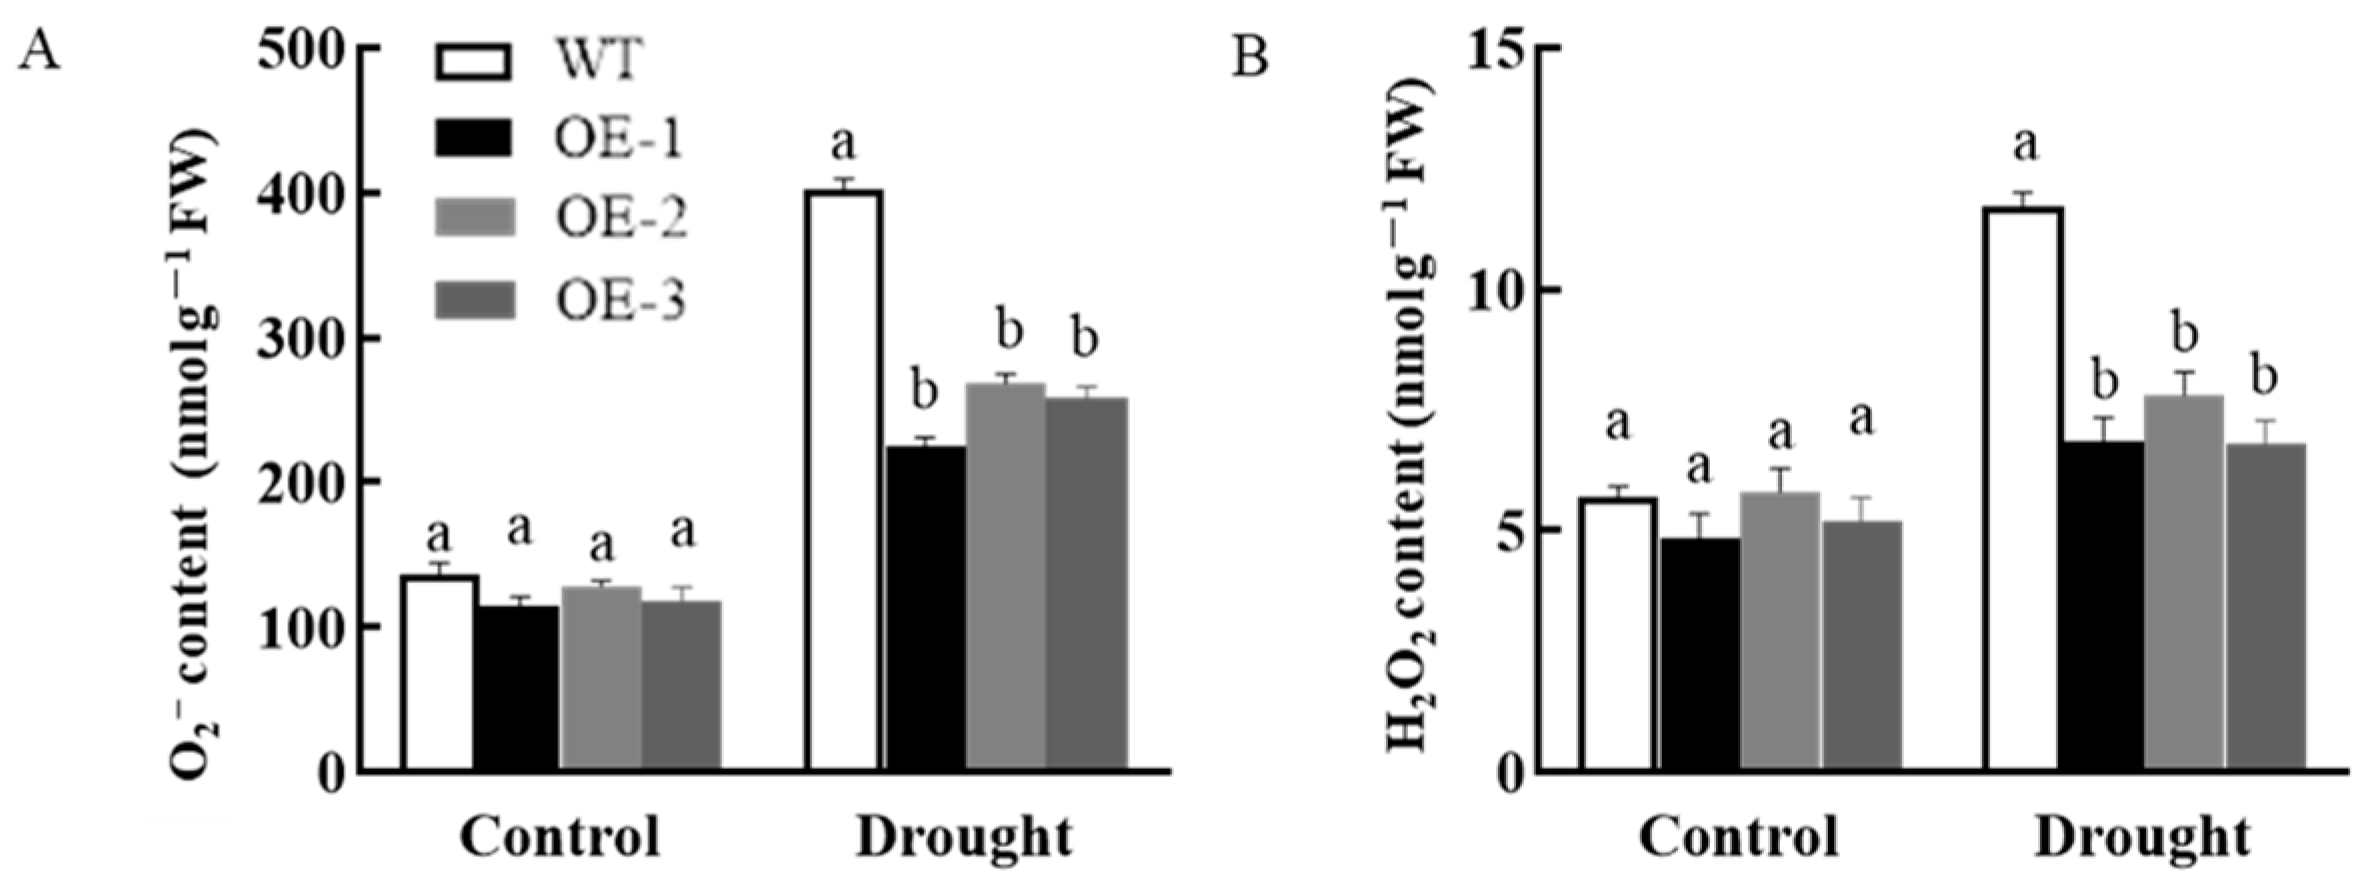
3.3.1. Changes in Reactive Oxygen Species

The O2 production rate increased when the plants were under stress (Figure 4). The O2 production rate under stress showed a trend of first increasing and then decreasing, which was significantly different from the control (Figure 4). After the drought and salt stress treatment, the H2O2 content in the garlic leaves increased and showed an upward trend (Figure 4). On the 2nd and 4th days of drought stress treatment, H2O2 content increased continuously and was significantly higher than the control level (Figure 4). However, the content decreased on day 6, indicating that the active oxygen scavenging system in garlic may play a role. However, after the salt stress treatment, H2O2 content continued to accumulate (Figure 4).

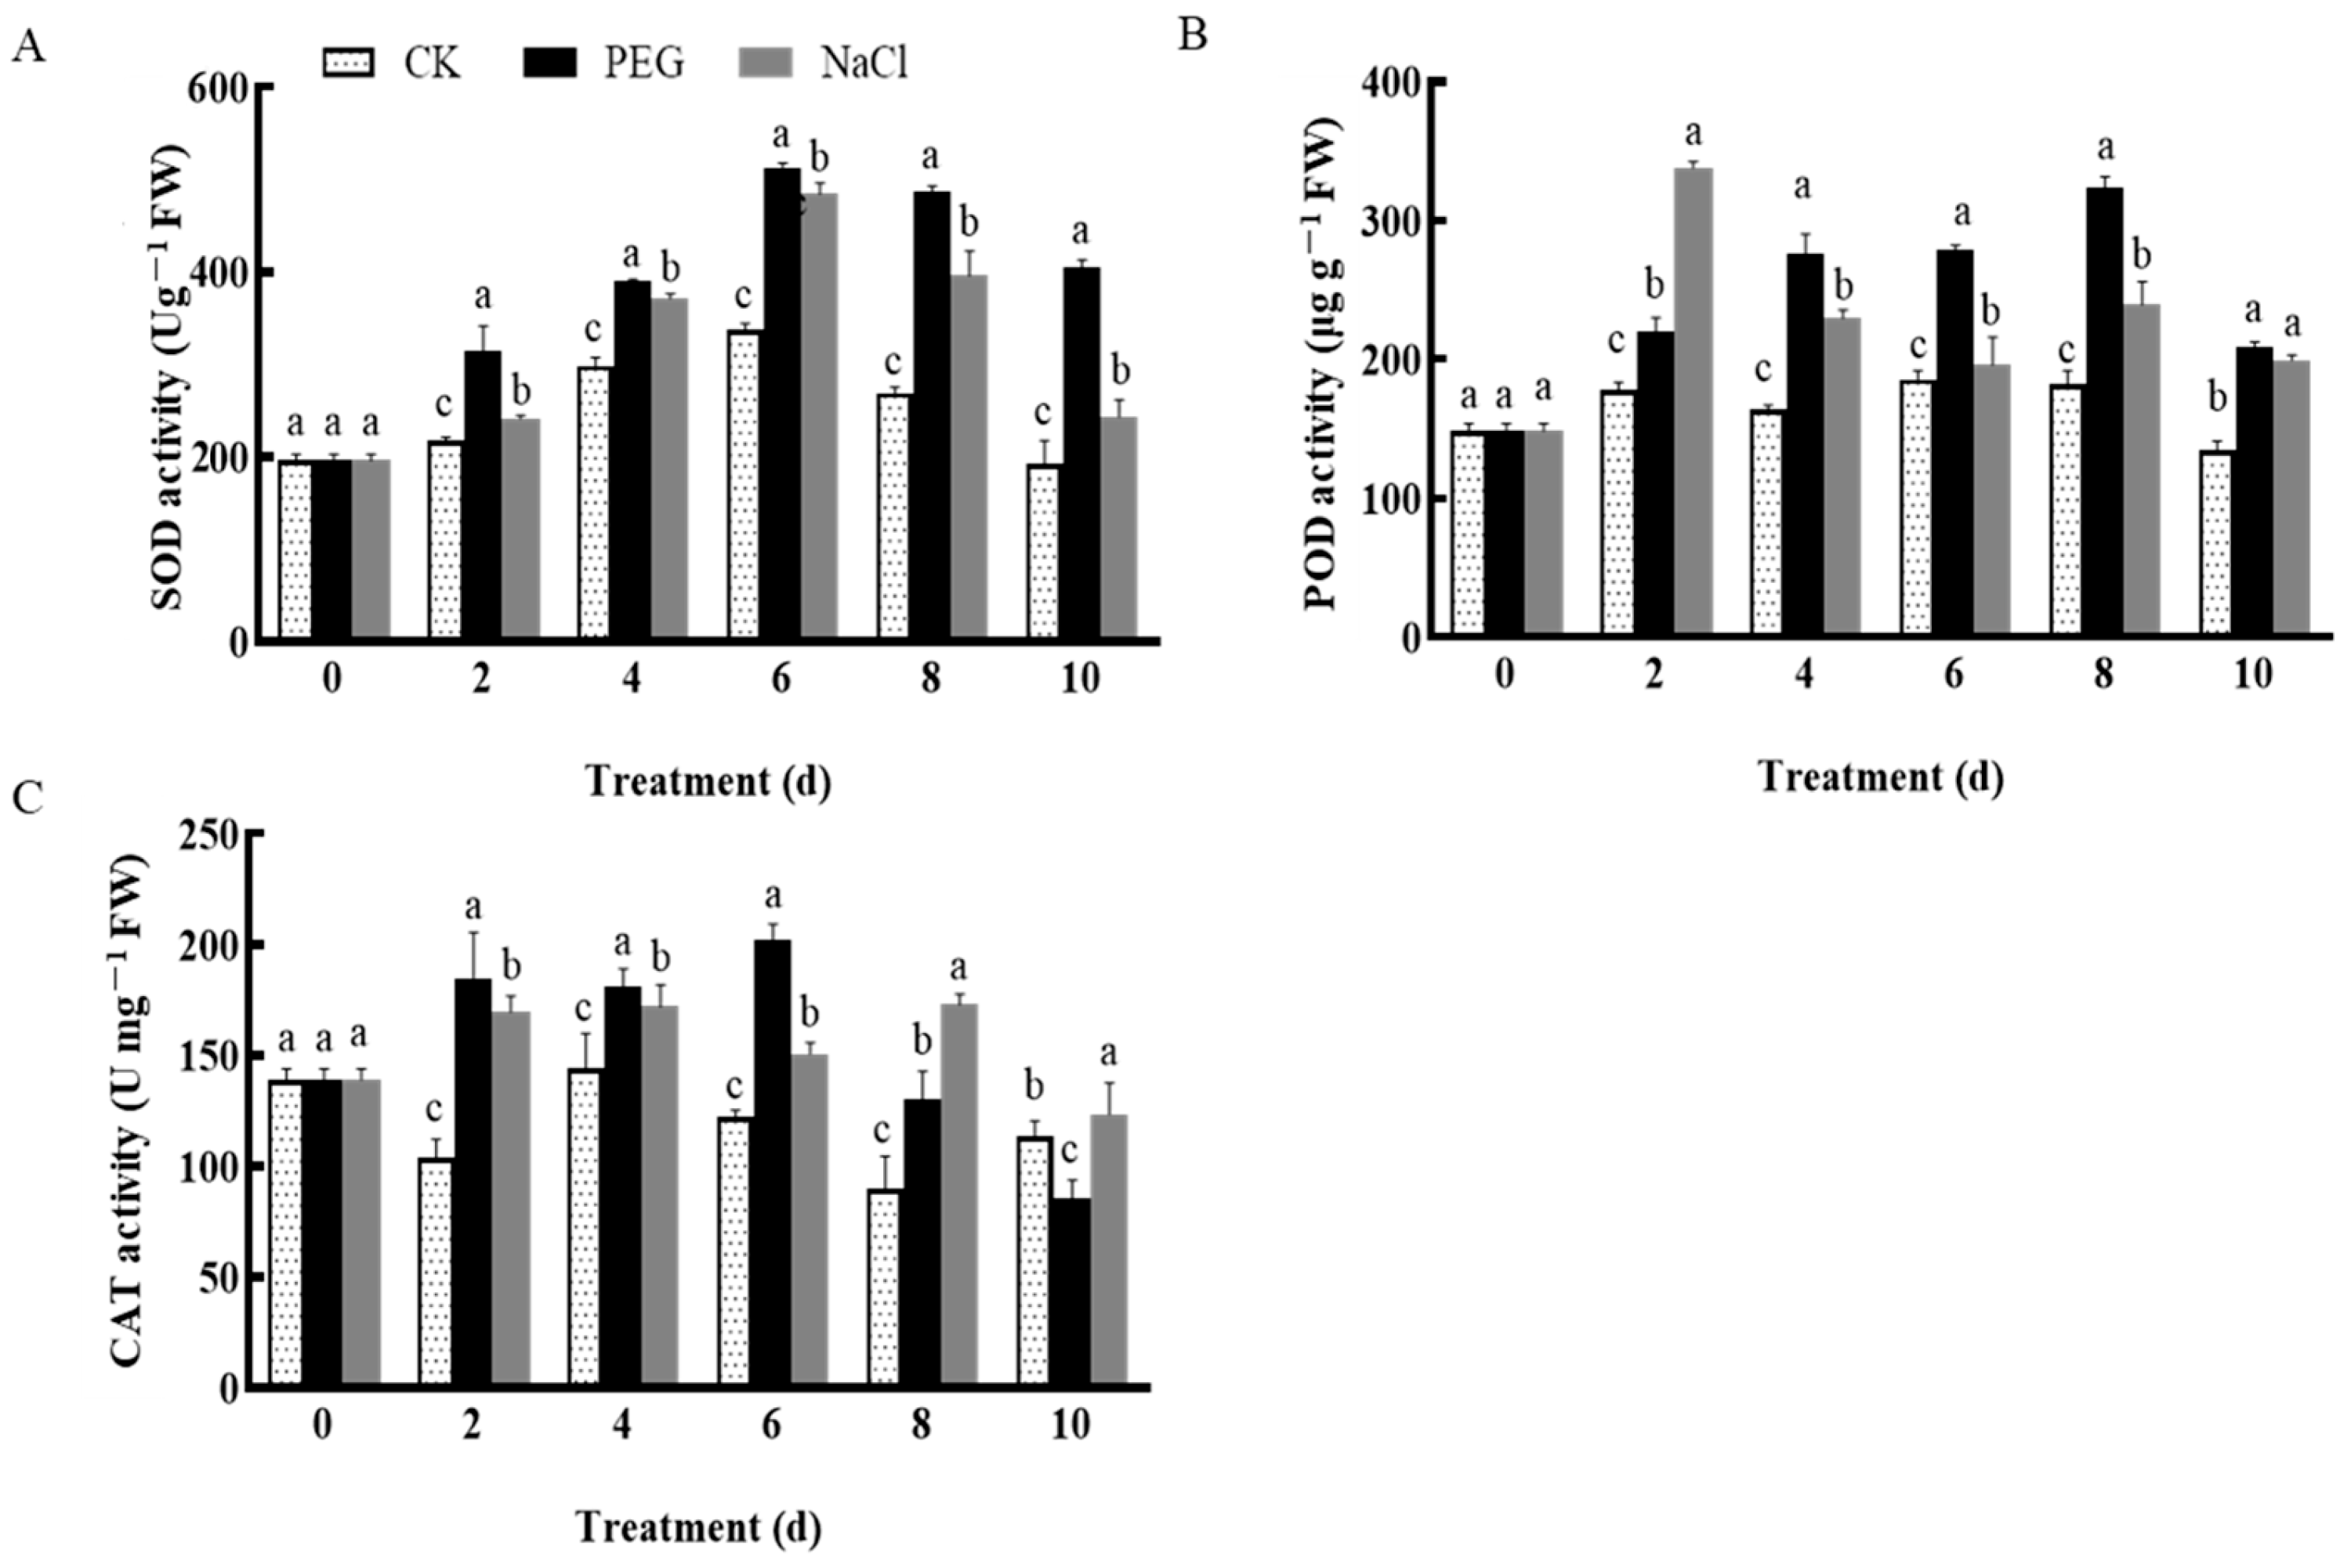
3.3.2. Changes in Antioxidant Enzyme Activity

Superoxide dismutase (SOD), peroxidase (POD), and catalase (CAT) are the key protective enzymes for scavenging free radicals and alleviating osmotic stress in plants. After the drought and salt stress treatment, SOD, POD, and CAT activities first increased and then decreased, which were significantly different from the control (Figure 5A). The POD enzyme activity reached the highest under drought on day 2 and under salt stress on day 8 (Figure 5B). In the control group, the activity of the CAT enzyme was decreased. By comparison, the activity of the CAT enzyme reached its maximum under drought on day 6 (Figure 5C).

3.4. Effects of Drought and Salt Stress on Garlic Plasma Membrane Permeability and Osmotic Regulatory Substance Content

3.4.1. Changes in Garlic Plasma Membrane Permeability

Malondialdehyde (MDA) content is an index reflecting the peroxidation of the plasma membrane of plants under stress. The relative conductivity and MDA content gradually increased under drought and salt stress, which were significantly different from the control (Figure 6). MDA content under salt stress was significantly higher than that under drought stress (Figure 6), indicating that the damage degree of the plants under salt stress was higher than that under drought stress.

3.4.2. Changes in the Content of Osmotic Regulating Substances

Under osmotic stress, plants can reduce osmotic potential and regulate osmosis by accumulating soluble sugars. As shown in Figure 7, soluble sugar content under drought stress first increased in the early stage and reached the maximum value on the 4th day of stress, which was 54.66% higher than that under control and 42.02% higher than that under salt stress. The soluble sugar content under salt stress reached the maximum value on day 8, which was 72.06% higher than the control, and 16.67% higher than drought stress.
When plants are subjected to stress, proline content increases to regulate cell osmosis. With the extension of drought stress time, the proline content first increased and then decreased (Figure 7). At the initial stage of salt stress, the proline content continuously increased and reached the maximum value on day 6, which was significantly higher than the control and drought stress. Under drought stress, the proline content reached the maximum value on day 8, which was significantly higher than the control and salt stress. The proline content decreased under drought and salt stress on day 10, which was significantly higher than the control.

3.5. Expression Analysis of AsAQPs Genes under Drought and Salt Stress

AQPs play an important role in response to abiotic stresses. In order to explore the changes in AQPs in drought stress, Q-PCR was performed. The transcription level of AsTIP2-6 significantly decreased under drought, and the other seven genes were up-regulated to varying degrees (Figure 8). The expression patterns of AsPIP1-3, AsPIP2-8, AsPIP2-9, and AsNIP5-1 were relatively similar. Under stress, the expression level of the gene was first up-regulated and then down-regulated, and then significantly up-regulated during eight days. The relative expression of AsPIP1-3 was the highest on day 6, which was significantly higher than the expression of AsPIP1-3 under salt stress at the same period. The expression of AsPIP2-7 and AsTIP2-8 was up-regulated under drought stress, with the highest expression levels on day 4, and then the expression levels changed slightly. AsPIP2-1, AsPIP2-7, and AsTIP2-8 expression levels were down-regulated on days 2 and 4, and then returned to pre-treatment levels.
The expression of AsPIP2-9 was significantly down-regulated, and the expression of other genes was up-regulated (Figure 8). Among them, the transcription levels of AsPIP2-8 and AsTIP2-6 significantly decreased and then increased. The up-regulation time points were all on day 8, and both were significantly higher than the expression levels of the control. AsPIP1-3 and AsPIP2-1 in the expression were significantly up-regulated on days 2 and 4. The expression reached the highest level and then decreased on day 6. AsPIP2-7, AsTIP2-8, and AsNIP5-1 were significantly down-regulated after the salt treatment, and their expression was up-regulated on day 4, and then the expression levels stabilized. The results suggest that the aquaporin gene responds to the salt stress treatment, and the response patterns of different aquaporins to drought and salt stress are different.

3.6. AsPIP1-3 Protein Subcellular Localization Results

To address the possible functions of AsPIP1-3, we analysis the expression of AsPIP1-3. The vector bearing the fusion construct AsPIP1-3-GFP and the control GFP vector were transformed into Nicotiana benthamiana. The leaves after the injection were observed by a laser confocal microscope, and green fluorescence was observed on the nucleus and cell membrane of 35S::GFP. Green fluorescence was observed only on the cell membrane of 35S::AsPIP1-3-GFP (Figure 9). The results indicated that the AsPIP1-3 protein may play a role in the cell membrane.

3.7. Functional Identification of Transgenic Arabidopsis thaliana Overexpressing AsPIP1-3

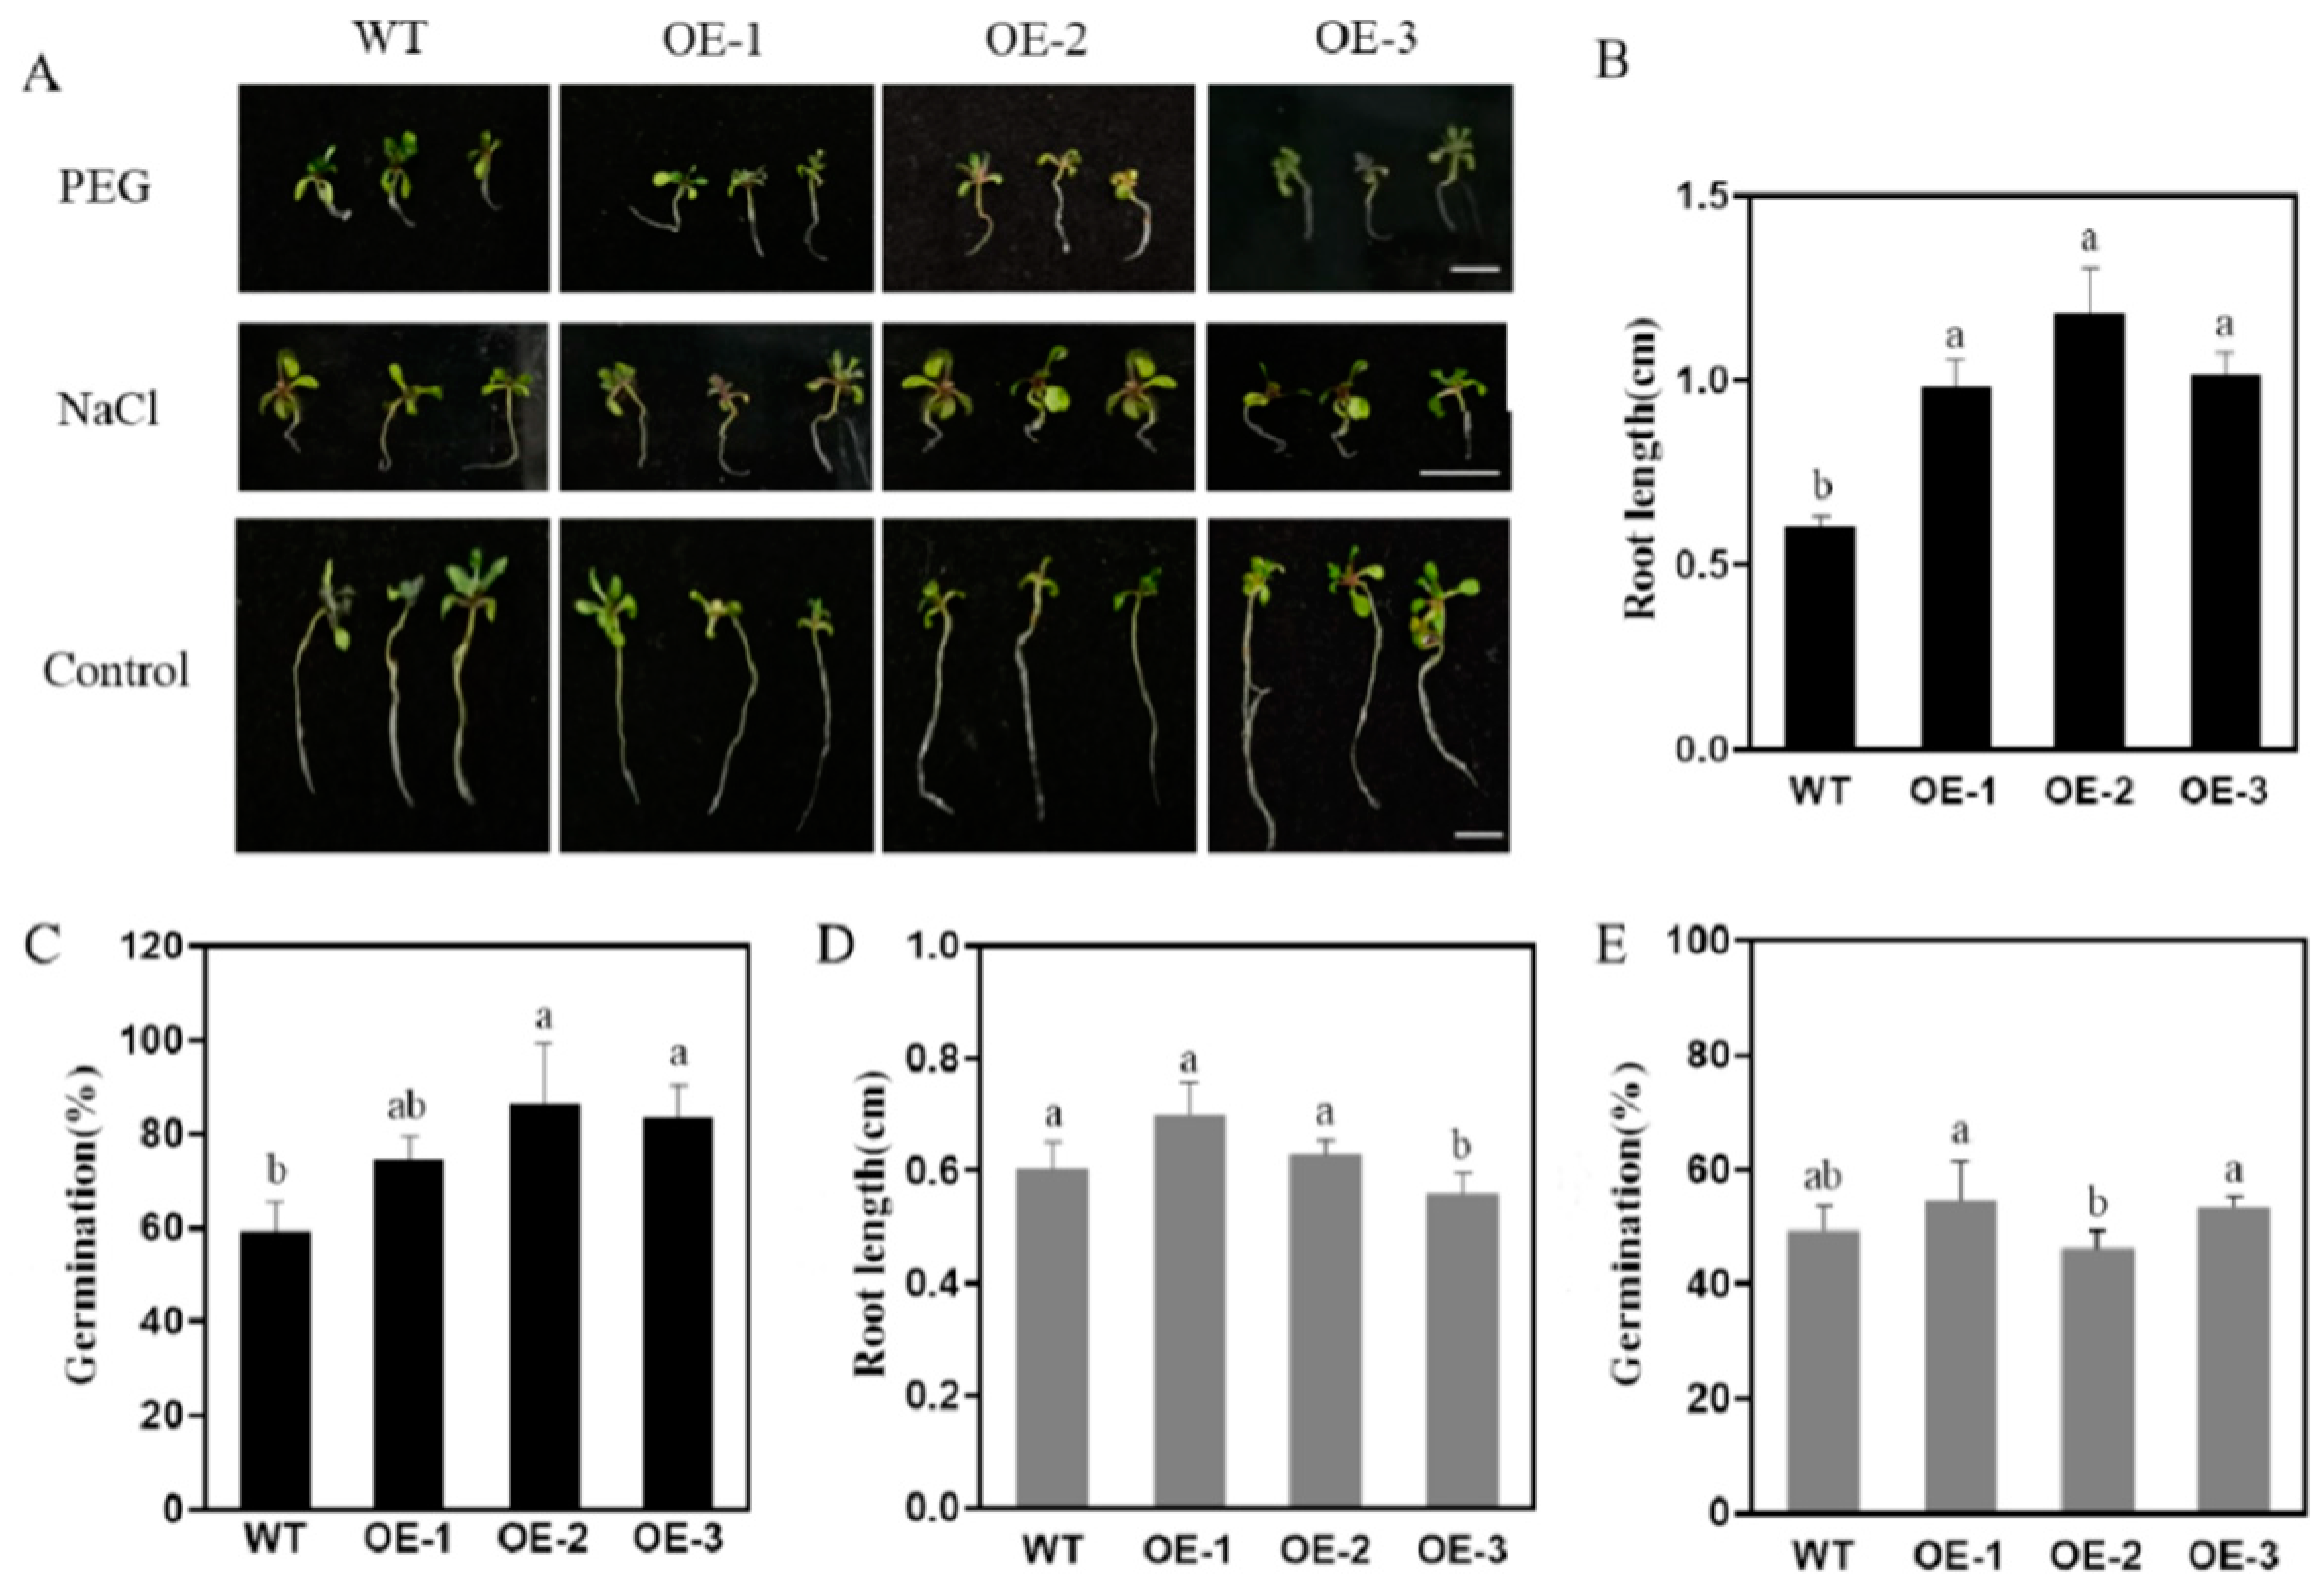
3.7.1. Phenotypic Analysis of Arabidopsis thaliana Seedlings Transgenic with AsPIP1-3 under Osmotic Stress

We generated overexpressing lines to uncover the role of AsPIP1-3 in stress. As shown in Figure 10, with WT as the negative control, the length of the amplified band was basically the same as that of the inserted target gene AsPIP1-3. Further RNA extraction and RT-qPCR identification showed that the expression level of AsPIP1-3 in overexpressed plants was 1-2 times higher than that in WT, indicating that the AsPIP1-3 gene was successfully transferred into Arabidopsis thaliana. OE-1, OE-2, and OE-3 with high expression levels were selected and cultured to homozygous lines for further study.
Homozygous Arabidopsis seeds were seeded on the MS medium, and the seedlings were transferred to the MS medium containing 20% PEG6000 and 200 mM sodium chloride, respectively, for drought and salt stress. As shown in Figure 11, after 14 days of drought treatment, the root length and germination rate of the transgenic plants were significantly higher than those of the wild type. We further analyzed the phenotype of AsPIP1-3 transgenic Arabidopsis thaliana under drought stress (Figure 12). Transgenic Arabidopsis thaliana plants were transplanted to a mixed culture medium for 4 weeks after the drought treatment. After 19 days of treatment, compared with the wild type, the transgenic plants had larger leaves and greener leaves, and the phenotype showed greater drought tolerance. These results indicated that overexpression of AsPIP1-3 enhanced the drought resistance of Arabidopsis plants.

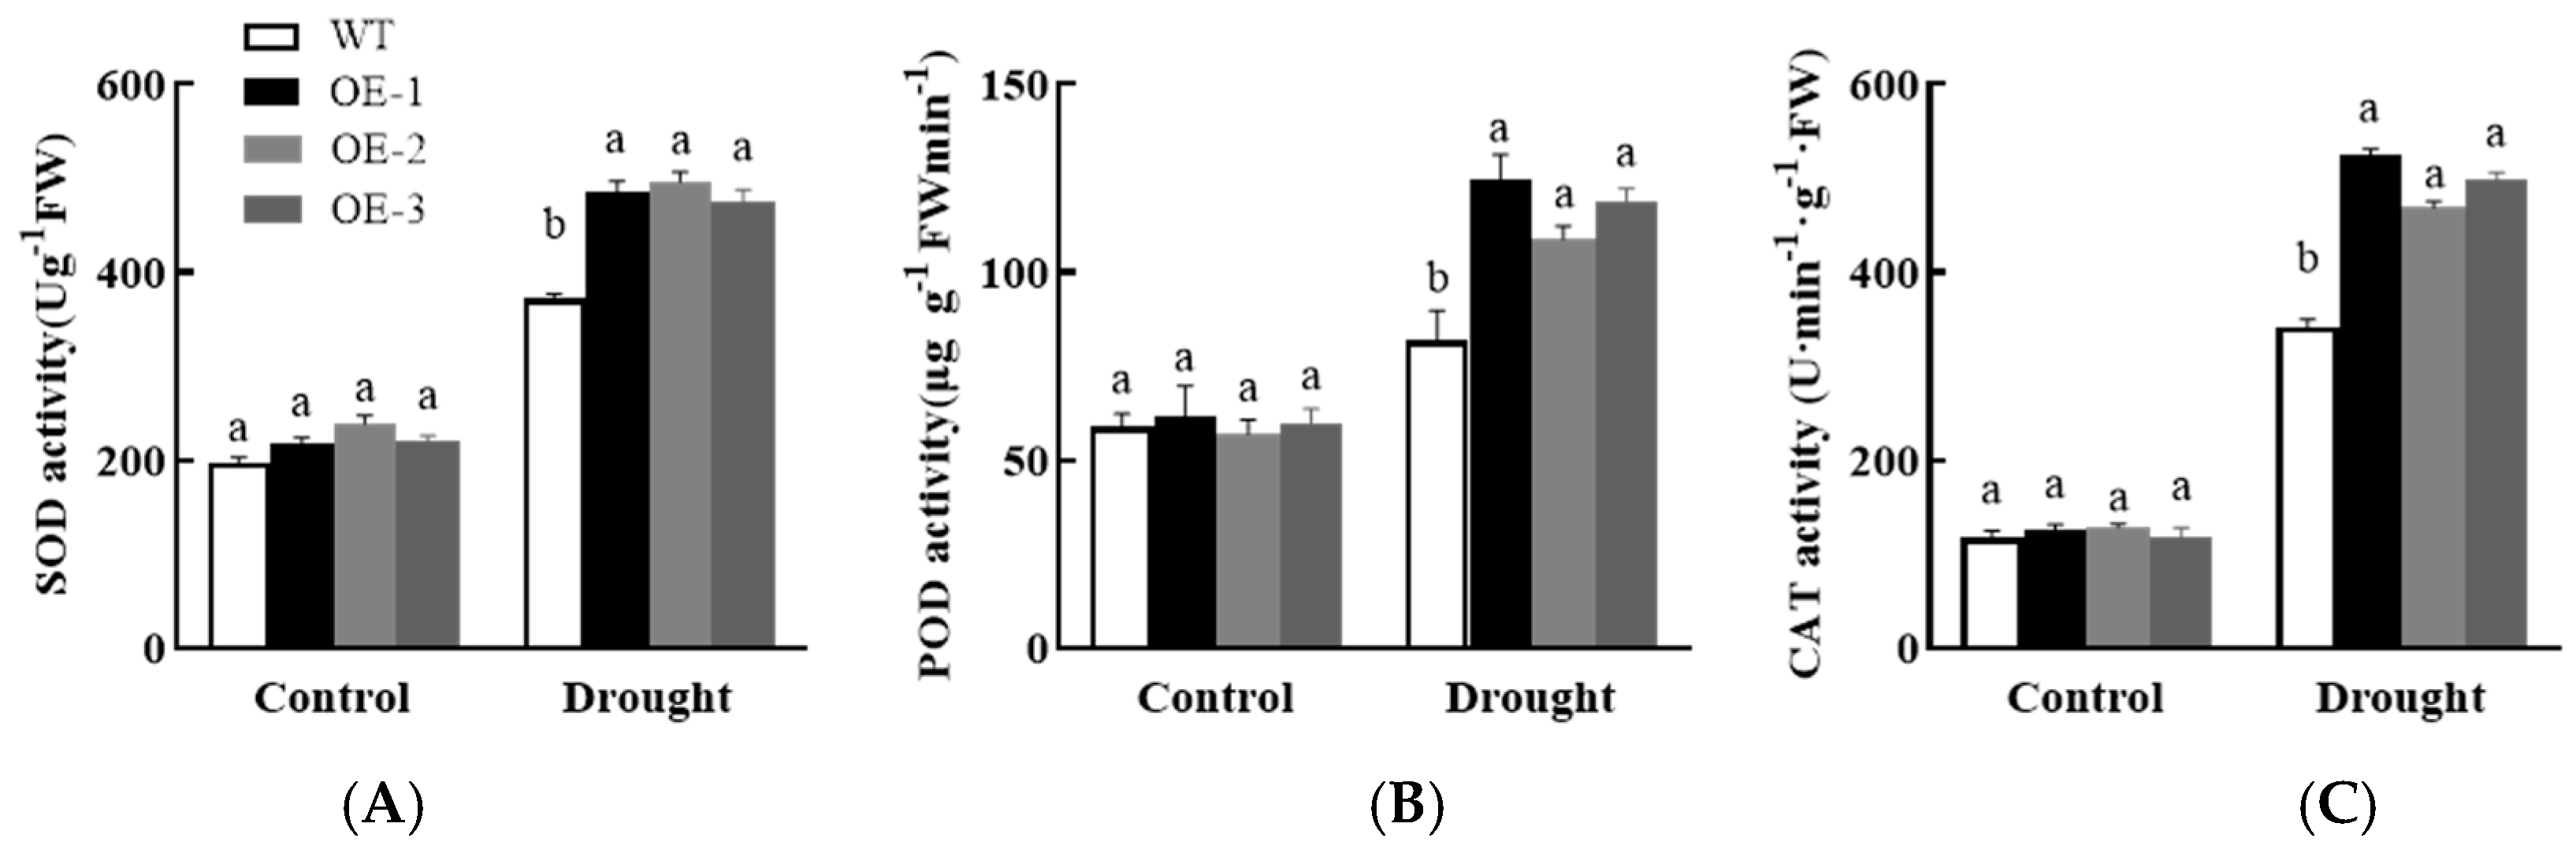
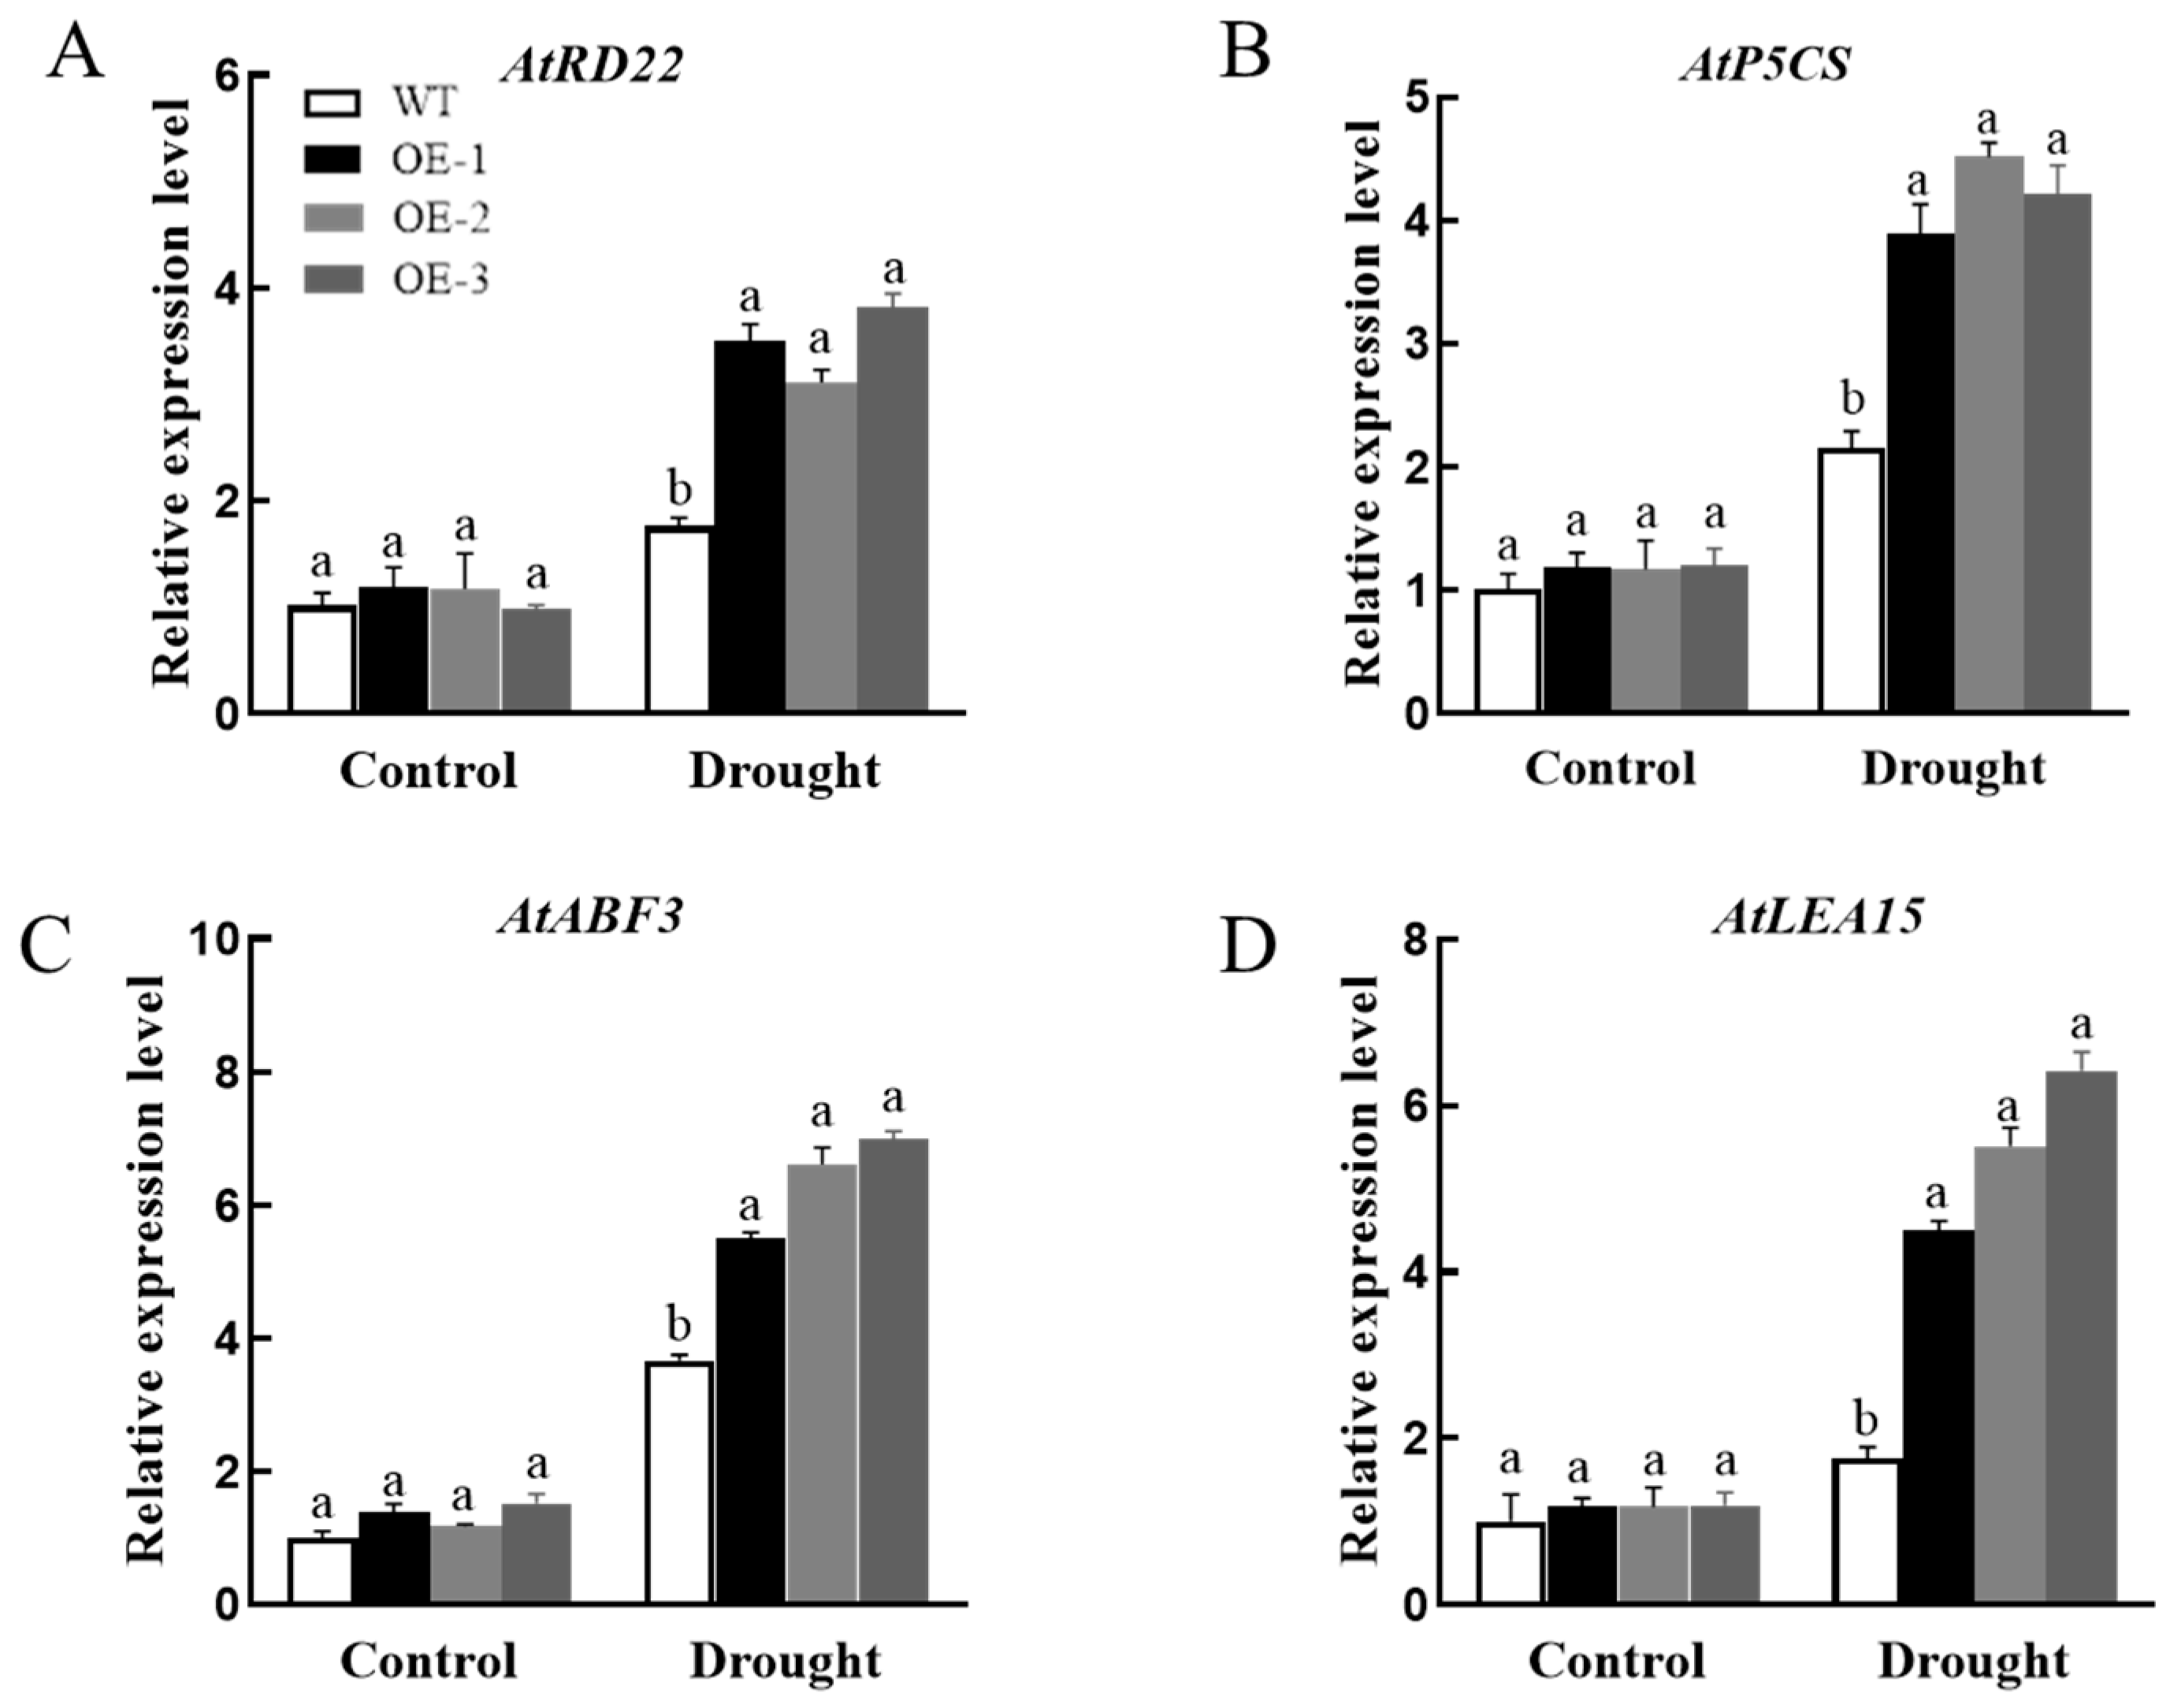
3.7.2. Analysis of Physiological, Biochemical, and Drought Stress-Related Gene Expression in Plants Overexpressing AsPIP1-3

When the external environment changes, in order to alleviate the oxidative damage caused by stress, plants regulate the activity of intracellular antioxidant enzymes through metabolic activities to adapt to environmental changes, and reduce the damage caused by stress by accumulating osmotic adjustment substances. Therefore, the content of osmotic adjustment substances in plants can be used as an important index to evaluate their salt tolerance. As shown in Figure 13, Figure 14 and Figure 15, under the drought treatment, the O2 production rate of the overexpressing plants decreased; the relative conductivity, hydrogen peroxide, and MDA content decreased; and the antioxidant enzyme (SOD, POD, and CAT) activity and proline content increased. Overexpressing lines significantly increased the activity of antioxidant enzymes in the garlic plants under salt stress.
In this study, the expression of four drought stress-related genes (AtRD22, AtP5CS, AtABF3, and AtLEA) in Arabidopsis thaliana was further examined in order to elucidate the function of AsPIP1-3 plants under drought stress at the molecular level (Figure 16). Under normal culture conditions, there was no significant difference in the transcription levels of four drought-related genes between the overexpressed plants and wild-type plants. The transcription levels of AtRD22, AtP5CS, AtABF3, and AtLEA were significantly increased under drought stress, indicating that the AsPIP1-3 gene responds to drought stress in plants.

4. Discussion

4.1. Response of Garlic Aquaporin to Drought and Salt Stress

Aquaporins can respond to adversity stress and play an important role in the process of plants resisting adversity stress. Under osmotic stress, aquaporin genes respond to stress by up-regulation or down-regulation [11]. Previous studies have reported some genes involved in the salt stress responses in plants, such as LRX in cucumber [12], GSK3 in celery [13], and KRP in eggplant [14]. For example, in rice, osmotic stress caused by 10% polyethylene glycol (PEG) has no effect on OsPIP1-3, and the expression of OsPIP1-1 and OsPIP1-2 is up-regulated [15]; but under salt stress, the expression of rice OsPIP1-1 gene is significantly down-regulated [9]. Under salt stress, the expression levels of ClaPIP2-4 and ClaNIP2-1 in leaves increased after 3 h of treatment, and decreased significantly after 72 h of treatment [16]. Similarly, in this study, the expression of garlic aquaporin gene AsTIP2-6 was down-regulated under drought stress, but up-regulated under salt stress. Under 20% PEG treatment, AsPIP2-8 expression had no effect.
The up-regulation of aquaporin can change cell membrane permeability and increase water absorption. Under drought and salt stress, the up-regulated expression of AsPIP1-3 and AsPIP2-1 may increase the water absorption of garlic and resist drought and salt stress. The expression of AsPIP2-9 was down-regulated under salt stress, and the transcription levels of NtPIP1-1 and NtPIP2-1 in tobacco were also significantly down-regulated [17], which reduced the water permeability of roots. In grapes, VvTIP2-1 expression levels decreased significantly in roots and leaves, resulting in decreased intracellular protein activity, reduced water loss in plants, and the maintenance of water balance [18]. Salt stress is the main environmental stress affecting plant growth and development. Plants must develop appropriate mechanisms to adapt to high-salt environments.

4.2. Overexpression of AsPIP1-3 Improves Drought Tolerance of Transgenic Plants

With the development of molecular biology, plant transgenic technology has become an important means to study gene function. Through transgenic technology, plants can be genetically improved to obtain excellent traits. In recent years, there have been more and more studies on the mechanism of the PIP subfamily regulating plant response to stress [19]. We found that the germination rate and root length of AsPIP1-3 transgenic Arabidopsis were significantly higher than those of wild-type Arabidopsis under drought stress. The water loss of the wild-type Arabidopsis plants after drought treatment was serious, but the degree of the wilting of transgenic Arabidopsis was low. Similarly, in alfalfa, the SpPIP1 gene was overexpressed in Arabidopsis, and no obvious wilting occurred after 15 days of drought, and the leaf water content was significantly higher than that of wild-type Arabidopsis [20]. These results indicated that Arabidopsis thaliana with the overexpression of the AsPIP1-3 gene had increased resistance to drought stress, suggesting that AsPIP1-3 was involved in the defense response of garlic to drought stress.

4.3. Mechanism of Overexpression of AsPIP1-3 to Improve Drought Tolerance in Transgenic Plants

When plants are exposed to drought stress, reactive oxygen species accumulate rapidly, leading to membrane damage and oxidation [21]. Plants reduce the damage caused by ROS by enhancing the activity of antioxidant enzymes [22]. Under drought stress, the H2O2 content and superoxide anion content of Arabidopsis thaliana overexpressed with AsPIP1-3 decreased significantly, which alleviated the oxidative damage of plants. In addition, the activities of the antioxidant enzymes SOD, POD, and CAT in the transgenic plants were significantly higher than those of the wild type, which was also one of the reasons for the enhanced stress resistance of the transgenic plants [23,24]. The AsPIP1-3 transgenic plants enhanced the activity of the antioxidant enzymes, reduced the damage of ROS to the plants, and improved the ability of the Arabidopsis plants to resist drought stress.
MDA is a peroxidation product of the plasma membrane caused by reactive oxygen species, which can indicate the degree of membrane damage, and its relative conductance can also reflect the degree of the membrane damage of plant material [25]. The maize aquaporin ZmPIP1-1 and barley HvPIP2-5 genes were overexpressed in Arabidopsis thaliana and subjected to osmotic stress such as PEG. The results showed that the MDA content and relative conductivity of transgenic Arabidopsis thaliana were significantly lower than those of the wild type [26]. After the garlic aquaporin gene was transferred into Arabidopsis thaliana, the MDA content and relative conductivity of the transgenic plants were significantly lower than those of the wild-type plants, indicating that the transgenic plants had enhanced drought tolerance. As an important osmoregulatory substance in plants, proline content can be used as an important index of plant stress resistance [27]. The proline content in the transgenic Arabidopsis thaliana increased significantly compared with that of the wild type, and the drought tolerance of the transgenic plants was improved.
Rice OsABF2 was induced by drought, low temperature, and other abiotic stresses [28]. RD22 proteins play an important role in plant resistance to abiotic stress. AtLEA plays a role in the osmoregulation and protection of cell structure under water stress [11], and the up-regulation of AtP5CS mainly promotes the accumulation of proline [29]. In summary, the overexpression of the AsPIP1-3 gene can increase antioxidant enzyme activity, and reduce membrane damage and oxidation in garlic plants under drought stress, leading to enhanced drought tolerance.

Author Contributions

Conceptualization, Z.W. and F.J.; methodology, H.W.; software, H.W.; validation, H.W., R.Z. and J.R.; formal analysis, H.W., R.Z. and J.R.; writing—original draft preparation, H.W., R.Z., J.R. and Y.B.; writing—review and editing, R.Z., J.R. and M.L.; supervision, Z.W. and F.J.; project administration. All authors have read and agreed to the published version of the manuscript.

Funding

This research was funded by the National Natural Science Foundation of China (31372056; 31872125), Priority Academic Program Development of Jiangsu Higher Education Institutions (PAPD), and Fundamental Research Funds for the Central Universities (KJFP201702).

Data Availability Statement

The original contributions presented in the study are included in the article, further inquiries can be directed to the corresponding author.

Conflicts of Interest

The authors declare no conflicts of interest.

References

  1. Namazi, H. The role of garlic in the prevention of ischemia-reperfusion injury: A new mechanism. Mol. Nutr. Food Res. 2010, 52, 739. [Google Scholar] [CrossRef] [PubMed]
  2. Botas, J.; Fernandes, N.; Barros, L.; Alves, M.J.; Carvalho, A.M.; Ferreira, I. A comparative study of black and white Allium sativum L: Nutritional composition and bioactive properties. Molecules 2019, 24, 2194. [Google Scholar] [CrossRef] [PubMed]
  3. Kumari, N.; Kumar, M.; Radha Lorenzo, J.M.; Sharma, D.; Puri, S.; Pundir, A.; Dhumal, S.; Bhuyan, D.J.; Jayanthy, G.; Selim, S.; et al. Onion and garlic polysaccharides: A review on extraction, characterization, bioactivity, and modifications. Int. J. Biol. Macromol. 2022, 219, 1047–1061. [Google Scholar] [CrossRef] [PubMed]
  4. Murtaza, G.; Usman, M.; Iqbal, J.; Tahir, M.N.; Elshikh, M.S.; Alkahtani, J.; Toleikienė, M.; Iqbal, R.; Akram, M.I.; Gruda, N.S. The impact of biochar addition on morpho-physiological characteristics, yield and water use efficiency of tomato plants under drought and salinity stress. BMC Plant Biol. 2024, 24, 356. [Google Scholar] [CrossRef] [PubMed]
  5. Tester, M.; Davenport, R. Na+ tolerance and Na+ transport in higher plants. Ann. Bot. 2003, 91, 503–527. [Google Scholar] [CrossRef] [PubMed]
  6. Saha, D.; Choyal, P.; Mishra, U.N.; Dey, P.; Bose, B.; Md, P.; Gupta, N.K.; Mehta, B.K.; Kumar, P.; Pandey, S.; et al. Drought stress responses and inducing tolerance by seed priming approach in plants. Plant Stress 2022, 4, 100066. [Google Scholar] [CrossRef]
  7. Khan, M.N.; Khan, Z.; Luo, T.; Liu, J.; Rizwan, M.; Zhang, J.; Xu, Z.; Wu, H.; Hu, L. Seed priming with gibberellic acid and melatonin in rapeseed: Consequences for improving yield and seed quality under drought and non-stress conditions. Ind. Crops Prod. 2020, 156, 112850. [Google Scholar] [CrossRef]
  8. Zhou, L.; Zhou, J.; Xiong, Y.; Liu, C.; Wang, J.; Wang, G.; Cai, Y. Overexpression of a maize plasma membrane intrinsic protein ZmPIP1;1 confers drought and salt tolerance in Arabidopsis. PLoS ONE 2018, 13, e0198639. [Google Scholar] [CrossRef]
  9. Liu, C.; Fukumoto, T.; Matsumoto, T.; Gena, P.; Frascaria, D.; Kaneko, T.; Katsuhara, M.; Zhong, S.; Sun, X.; Zhu, Y.; et al. Aquaporin OsPIP1;1 promotes rice salt resistance and seed germination. Plant Physiol. Biochem. 2013, 63, 151–158. [Google Scholar] [CrossRef]
  10. Else, M.A.; Coupland, D.; Dutton, L.; Jackson, M.B. Decreased root hydraulic conductivity reduces leaf water potential, initiates stomatal closure and slows leaf expansion in flooded plants of castor oil (Ricinus communis) despite diminished delivery of ABA from the roots to shoots in xylem sap. Physiol. Plant. 2001, 111, 46–54. [Google Scholar] [CrossRef]
  11. Pedrosa, A.M.; Martins, C.P.; Gonçalves, L.P.; Costa, M.G. Late embryogenesis abundant (LEA) constitutes a large and diverse family of proteins involved in development and abiotic stress responses in sweet orange (Citrus sinensis L. Osb.). PLoS ONE 2015, 10, e0145785. [Google Scholar] [CrossRef] [PubMed]
  12. Fan, S.; Yang, S.; Shi, K.; Yang, L.; An, M.; Wang, F.; Qi, F.; Feng, M.; Wang, M.; Gen, P.; et al. Genome-wide identification of the LRX gene family in Cucurbitaceae and expression analysis under salt and drought stress in Cucumber. Veg. Res. 2024, in press. [Google Scholar] [CrossRef]
  13. Guo, X.; Zhang, L.; Zhang, Q.; Yan, X.; Zuo, C.; Song, X.; Yuan, M. Comprehensive identification of GSK3 gene family in celery and functional characterization of AgSK22 involvement in salt stress. Veg. Res. 2023, 3, 23. [Google Scholar] [CrossRef]
  14. Shen, L.; Yang, S.; Xia, X.; Nie, W.; Yang, X. Genome-wide identification of Kip-related protein (KRP) gene family members in eggplant and the function of SmKRP3 under salt stress. Veg. Res. 2024, 4, e013. [Google Scholar] [CrossRef]
  15. Guo, L.; Wang, Z.Y.; Lin, H.; Cui, W.E.; Chen, J.; Liu, M.; Chen, Z.L.; Qu, L.J.; Gu, H. Expression and functional analysis of the rice plasma-membrane intrinsic protein gene family. Cell Res. 2006, 16, 277–286. [Google Scholar] [CrossRef] [PubMed]
  16. Raturi, G.; Kumawat, S.; Mandlik, R.; Duhan, D.; Thakral, V.; Sudhakaran, S.; Ram, C.; Sonah, H.; Deshmukh, R. Deciphering the Role of Aquaporins Under Different Abiotic Stress Conditions in Watermelon (Citrullus lanatus). J. Plant Growth Regul. 2023, 42, 3137–3149. [Google Scholar] [CrossRef]
  17. Mahdieh, M.; Mostajeran, A.; Horie, T.; Katsuhara, M. Drought stress alters water relations and expression of PIP-type aquaporin genes in Nicotiana tabacum plants. Plant Cell Physiol. 2008, 49, 801–803. [Google Scholar] [CrossRef] [PubMed]
  18. Yang, S.D.; Guo, D.L.; Pei, M.S.; Liu, H.N.; Weng, T.L.; Yu, Y.H. Identification of grapevine AQP family and prediction for transcriptional regulatory network underdrought stress. J. Fruit Sci. 2021, 38, 1638–1652. [Google Scholar]
  19. Boursiac, Y.; Boudet, J.; Postaire, O.; Luu, D.T.; Tournaire-Roux, C.; Maurel, C. Stimulus-induced downregulation of root water transport involves reactive oxygen species-activated cell signalling and plasma membrane intrinsic protein internalization. Plant J. 2008, 56, 207–218. [Google Scholar] [CrossRef]
  20. Chen, Q.; Yang, S.; Kong, X.; Wang, C.; Xiang, N.; Yang, Y.; Yang, Y. Molecular cloning of a plasma membrane aquaporin in Stipa purpurea, and exploration of its role in drought stress tolerance. Gene 2018, 665, 41–48. [Google Scholar] [CrossRef]
  21. Al-Quraan, N.A.; Samarah, N.H.; Tanash, A.A. Effect of drought stress on wheat (Triticum durum) growth and metabolism: Insight from GABA shunt, reactive oxygen species and dehydrin genes expression. Funct. Plant Biol. 2022, 51, FP22177. [Google Scholar] [CrossRef] [PubMed]
  22. Blokhina, O.; Virolainen, E.; Fagerstedt, K.V. Antioxidants, oxidative damage and oxygen deprivation stress: A review. Ann. Bot. 2003, 91, 179–194. [Google Scholar] [CrossRef] [PubMed]
  23. Xu, Y.; Hu, W.; Liu, J.; Zhang, J.; Jia, C.; Miao, H.; Xu, B.; Jin, Z. A banana aquaporin gene, MaPIP1;1, is involved in tolerance to drought and salt stresses. BMC Plant Biol. 2014, 14, 59. [Google Scholar] [CrossRef] [PubMed]
  24. Zhuo, C.; Wang, T.; Guo, Z.; Lu, S. Overexpression of MfPIP2-7 from Medicago falcata promotes cold tolerance and growth under NO3 deficiency in transgenic tobacco plants. BMC Plant Biol. 2016, 16, 138. [Google Scholar] [CrossRef] [PubMed]
  25. Zhu, Y.; Liu, Y.; Zhou, K.; Tian, C.; Aslam, M.; Zhang, B.; Liu, W.; Zou, H. Overexpression of ZmEREBP60 enhances drought tolerance in maize. J. Plant Physiol. 2022, 275, 153763. [Google Scholar] [CrossRef] [PubMed]
  26. Alavilli, H.; Awasthi, J.P.; Rout, G.R.; Sahoo, L.; Lee, B.H.; Panda, S.K. Overexpression of a barley aquaporin gene, Hvpip2;5 confers salt and osmotic stress tolerance in yeast and plants. Front. Plant Sci. 2016, 7, 1566–1578. [Google Scholar] [CrossRef]
  27. Yamada, M.; Morishita, H.; Urano, K.; Shiozaki, N.; Yamaguchi-Shinozaki, K.; Shinozaki, K.; Yoshiba, Y. Effects of free proline accumulation in petunias under drought stress. J. Exp. Bot. 2005, 56, 1975–1981. [Google Scholar] [CrossRef] [PubMed]
  28. Hossain, M.A.; Cho, J.I.; Han, M.; Ahn, C.H.; Jeon, J.S.; An, G.; Park, P.B. The ABRE-binding bZIP transcription factor OsABF2 is a positive regulator of abiotic stress and ABA signaling in rice. J. Plant Physiol. 2010, 167, 1512–1520. [Google Scholar] [CrossRef]
  29. Trovato, M.; Mattioli, R.; Costantino, P. From A. rhizogenes RolD to plant P5CS: Exploiting proline to control plant development. Plants 2018, 7, 108. [Google Scholar] [CrossRef]
Figure 1. Phenotype of garlic under normal growth, drought stress, and salt stress. (AE) The phenotypes of garlic under normal growth on 2, 4, 6, 8, and 10 days. (FJ) The phenotypes of garlic under drought stress on 2, 4, 6, 8, and 10 days. (KO) The phenotypes of garlic under salt stress on 2, 4, 6, 8, and 10 days. Scale bars = 2 cm.
Horticulturae 10 00738 g001
Figure 2. Changes in the relative water content of garlic leaves under drought and salt stress. Different lowercase letters represent a significant difference at 0.05 level by the Duncan test, the same as below.
Horticulturae 10 00738 g002
Figure 3. Effects of drought stress in the leaves of garlic. (A) The content of chlorophyll a. (B) The content of chlorophyll b. (C) The content of total chlorophyll. Different lowercase letters represent a significant difference at 0.05 level by the Duncan test.
Horticulturae 10 00738 g003
Figure 4. Changes in leaf O2 generation rates (A) and H2O2 content (B) of garlic under drought and salt stress. Different lowercase letters represent a significant difference at 0.05 level by the Duncan test.
Horticulturae 10 00738 g004
Figure 5. Changes in SOD (A), POD (B), and CAT (C) activity in garlic leaves under drought stress. Different lowercase letters represent a significant difference at 0.05 level by the Duncan test.
Horticulturae 10 00738 g005
Figure 6. Changes in relative conductivity (A) and MDA content (B) in garlic leaves under drought and salt stress. Different lowercase letters represent a significant difference at 0.05 level by the Duncan test.
Horticulturae 10 00738 g006
Figure 7. Changes in soluble sugar (A) and proline content (B) in garlic under drought and salt stress. Different lowercase letters represent a significant difference at 0.05 level by the Duncan test.
Horticulturae 10 00738 g007
Figure 8. Expression pattern of AsAQPs under drought and salt stress in garlic. Different lowercase letters represent a significant difference at 0.05 level by the Duncan test.
Horticulturae 10 00738 g008
Figure 9. Subcellular localization of the garlic AsPIP1-3 protein. (A): Control vector pCAMBIA1300-GFP; (B): AsPIP1-3 tobacco leaves. GFP: green fluorescence; Bright field: bright field; Merge: fusion field.
Horticulturae 10 00738 g009
Figure 10. Identification of AsPIP1-3-overexpressing transgenic Arabidopsis. (A): PCR identification for overexpressing transgenic Arabidopsis lines. M, DNA marker DL2000; +, positive control; −, negative control; (B): Quantitative RT-PCR analysis of AsPIP1-3-overexpressing transgenic Arabidopsis lines. Asterisks denote significant differences (** p < 0.01; *** p < 0.001).
Horticulturae 10 00738 g010
Figure 11. Effects of drought and salt stress on the WT and transgenic Arabidopsis seedlings. (A): The phenotype of WT and transgenic lines under normal conditions and grown on the MS medium with 20% PEG 6000 and 200 mM NaCl; (B,D): The root length of the WT and transgenic Arabidopsis seedlings with PEG and NaCl; (C,E): The germination rate of the WT and transgenic Arabidopsis seedling with PEG and NaCl. Different lowercase letters indicate significant differences at the p < 0.05 level. Scale bar = 5 mm.
Horticulturae 10 00738 g011
Figure 12. Phenotypes of AsPIP1-3-overexpressing transgenic Arabidopsis and WT under drought stress conditions.
Horticulturae 10 00738 g012
Figure 13. Effect of drought stress on the active oxygen accumulation of WT and AsPIP1-3 transgenic Arabidopsis. (A): O2 content; (B): H2O2 content; different lowercase letters indicate significant differences at the p < 0.05 level, the same below.
Horticulturae 10 00738 g013
Figure 14. Effect of drought stress on antioxidant enzyme activity of WT and AsPIP1-3 transgenic Arabidopsis. (A) SOD activity; (B) POD activity; (C) CAT activity. Different lowercase letters indicate significant differences at the p < 0.05 level.
Horticulturae 10 00738 g014
Figure 15. Effect of drought stress on (A) relative conductivity, (B) MDA, and (C) proline content of WT and AsPIP1-3 transgenic Arabidopsis. Different lowercase letters indicate significant differences at the p < 0.05 level.
Horticulturae 10 00738 g015
Figure 16. Expression analysis of drought-related genes in WT and AsPIP1-3 transgenic Arabidopsis under control and drought conditions. (AD) Relative expression level of AtRD22, AtP5CS, AtABF3 and AtLEA15. Different lowercase letters indicate significant differences at the p < 0.05 level.
Horticulturae 10 00738 g016
Table 1. Primer list for qRT-PCR.
Primer NameForward Primer (5′-3′)Reverse Primer (5′-3′)
AsPIP1-3TTCCGCTACTGATGCCAAGATGCCGGTAATCGGAATCGTA
AsPIP2-1GTAGCCACGGTTATCGGGTAAAGATCATGCCACCGAAAGC
AsPIP2-7TATCCCTAGTGCGAGCAGTGTCACGAATCCTACACCGCAT
AsPIP2-8GGATTTGCCGTGTTCATGGTGTCATGCCATGCTTCGTCTT
AsPIP2-9TATGGTGCACTTGGCTACGAAAACAACAGCAGCGCCTAAA
AsTIP2-6TTACTGGGTAGGTCCGCTTGATCCTGAGCACAGGCTCAT
AsTIP2-8CGGAGACAGGAACACCTACAAGTGAGTCGATTCTCGCTGT
AsNIP5-1CGGAGACAGGAACACCTACAAGTGAGTCGATTCTCGCTGT
AsACTINTCCTAACCGAGCGAGGCTACATGGAAAAGCACTTCTGGGCACC
Table 2. Primer list for vector construction.
Primer NamePrimer Sequence (5′-3′)
pBinGFP4-FCAAGCAATCAAGCATTCTAC
pBinGFP4-RCGGACACGCTGAACTTGTGG
AsPIP1-3–pBinGFP4-FatttacgaacgatagggtaccATGGCAGAGAAAGATGAAAGTGTG
AsPIP1-3–pBinGFP4-RgcccttgctcaccatggatccGTCCTTGGTTTTGAACGGTATAGC
AsPIP1-3–pCBIMA1300-FcacgttgccatgcagcgtacgATGGCAGAGAAAGATGAAAGTGTG
AsPIP1-3–pCBIMA1300-RgttcttggccttcttcgtacgGTCCTTGGTTTTGAACGGTATAGC
AtP5CS-FGGGACAAGTTGTGGATGGAGAC
AtP5CS-RTGGTACAAACCTCAAGGAACAC
AsLEA15-FTTCGACTTGGTACCCTGATTAC
AsLEA15-RGGAAGAAGATCAGCTACATCGA
AtABF3-FGATGTGGTTAACCGTTCTCAAC
AtABF3-RCAGCTTGCAGTAGATTGTTGTT
AtRD22-FGACTTTCGATTTTACCGACGAG
AtRD22-RCGCTACCGGTTTTACCTTTATG
AtACTIN-FGAATGGAAGCTGCTGGAATCCACG
AtACTIN-RAACGATTCCTGGACCTGCCTCATC
Table 3. Measurement of morphological indices.
TreatmentsDays
(d)
Plant Height
(cm)
Pseudo Stem
Diameter (mm)
Leaf Length
(cm)
Leaf Width
(mm)
Fresh Weight
(g)
Dry Weight
(g)
CK017.93 ± 0.98 c5.16 ± 0.12 cd13 ± 0.58 d10.37 ± 0.39 ab4.7 ± 0.32 d0.8 ± 0.15 c
218.87 ± 0.26 bc5.69 ± 0.07 bc13.83 ± 0.23 d10.56 ± 0.29 ab5.3 ± 0.45 d0.99 ± 0.11 bc
421.47 ± 1.07 abc5.55 ± 0.28 bc16.17 ± 0.6 cd10.07 ± 0.89 ab5.47 ± 0.24 cd1.19 ± 0.11 abc
622.53 ± 1.52 ab5.93 ± 0.26 b19.07 ± 1.41 bc10.67 ± 0.35 ab6.63 ± 0.32 bc1.23 ± 0.32 ab
822.53 ± 1.73 ab6.02 ± 0.1 ab17.37 ± 1.26 cd10.57 ± 0.37 ab7.83 ± 0.73 ab1.3 ± 0.26 ab
1023.43 ± 1.42 a6.16 ± 0.13 a22.4 ± 1.51 a11.83 ± 0.93 a9.13 ± 1.62 a1.48 ± 0.34 a
PEG017.93 ± 0.98 c5.16 ± 0.12 cd13 ± 0.58 d10.37 ± 0.39 ab4.37 ± 0.33 d0.89 ± 0.17 bc
219.37 ± 0.09 bc5.47 ± 0.22 bc13.6 ± 1.62 d10.01 ± 0.47 ab4.63 ± 0.19 d0.97 ± 0.09 bc
421.83 ± 0.84 ab5.73 ± 0.3 bc15.73 ± 0.37 cd9.25 ± 0.17 b5.17 ± 0.69 cd1.01 ± 0.12 bc
620.63 ± 0.55 abc5.81 ± 0.35 abc18.4 ± 1.63 bc10.13 ± 0.72 ab5.78 ± 0.18 cd0.96 ± 0.09 bc
822.6 ± 1.46 ab5.76 ± 0.45 bc18.77 ± 1.66 bc10.27 ± 0.3 ab5.71 ± 0.2 cd0.9 ± 0.15 bc
1023.37 ± 1.52 a5.89 ± 0.44 ab20.07 ± 2.49 b11.03 ± 0.52 ab6.67 ± 0.67 bc0.98 ± 0.2 bc
NaCl017.93 ± 0.98 c5.16 ± 0.12 c13 ± 0.58 f10.37 ± 0.39 ab3.66 ± 0.5 d0.79 ± 0.16 c
219.37 ± 0.09 bc5.11 ± 0.05 d14.43 ± 0.94 def9.96 ± 0.14 ab5.23 ± 0.92 cd1.04 ± 0.09 bc
421.83 ± 0.84 ab5.34 ± 0.1 cd16.53 ± 0.29 de9.25 ± 0.17 b5.67 ± 0.96 bc1.04 ± 0.16 bc
620.63 ± 0.55 abc5.61 ± 0.2 bc17.67 ± 0.52 bc10.1 ± 0.23 ab6.27 ± 0.27 bc1.01 ± 0.15 bc
822.1 ± 1.46 ab5.46 ± 0.09 bc18.43 ± 1.24 bc10.25 ± 1.02 ab6.51 ± 0.32 bc0.92 ± 0.14 bc
1023.17 ± 1.52 a5.75 ± 0.11 bc19.43 ± 0.98 b10.63 ± 1.21 ab6.3 ± 0.57 bc0.96 ± 0.14 bc
Note: Different lowercase letters represent a significant difference at 0.05 level by the Duncan test.
Disclaimer/Publisher’s Note: The statements, opinions and data contained in all publications are solely those of the individual author(s) and contributor(s) and not of MDPI and/or the editor(s). MDPI and/or the editor(s) disclaim responsibility for any injury to people or property resulting from any ideas, methods, instructions or products referred to in the content.

