Article

Genome-Wide Identification of Litchi SPL Gene Family and Expression Analysis in Pericarp Anthocyanin Biosynthesis

1
Hainan Provincial Key Laboratory of Quality Control of Tropical Horticultural Crops, School of Tropical Agriculture and Forestry, Hainan University, Danzhou 571737, China
2
Sanya Institute of Breeding and Multiplication, Hainan University, Sanya 71763, China
3
Institute of Tropical Fruit Trees, Hainan Academy of Agricultural Sciences/Key Laboratory of Genetic Resources and Utilization of Tropical Fruits and Vegetables (Co-Construction by Ministry and Province) of Ministry of Agriculture and Rural Affairs/Key Laboratory of Tropical Fruit Tree Biology of Hainan Province/Investigation Station of Tropical Fruit Trees of Ministry of Agriculture, Haikou 571100, China
4
State Key Laboratory of Biological Breeding of Tropical Crops, Institute of Tropical Bioscience and Biotechnology, Chinese Academy of Tropical Agricultural Sciences, Haikou 571101, China
*
Authors to whom correspondence should be addressed.
These authors contributed equally to this work.
Horticulturae 2024, 10(7), 762; https://doi.org/10.3390/horticulturae10070762
Submission received: 5 June 2024 / Revised: 11 July 2024 / Accepted: 16 July 2024 / Published: 18 July 2024

Abstract

:
During the ripening of litchi (Litchi chinensis Sonn.) fruit, anthocyanin biosynthesis is crucial in providing vibrant coloring. Previous studies on anthocyanin-related transcription factors have made significant discoveries relating to plants. However, the role of the SQUAMOSA promoter-binding protein-like (SPL) transcription factors in anthocyanin biosynthesis has rarely been studied in litchi. SPL genes are widely involved in the developmental mechanisms of plants. In this study, a total of 17 SPL genes have been identified from the litchi genome. Phylogenetic analysis revealed that these genes were divided into eight groups (Group I-VIII). Analysis of gene structure conserved domains, conserved motifs, and miR156 target prediction showed that LcSPLs were highly conserved during evolution. RNA-seq analysis of litchi revealed that six LcSPL genes have a role in regulating anthocyanin biosynthesis. Further, weighted correlation network analysis (WGCNA) revealed LcSPL7’s role in anthocyanin synthesis and chlorophyll degradation in litchi fruit ripening. These findings collectively suggest that the LcSPL gene family plays an essential role in anthocyanin biosynthesis in litchi pericarp. In summary, comprehensive bioinformatics analysis of the SPL family expands our understanding of anthocyanin synthesis in litchi pericarp.

1. Introduction

Transcription factors (TFs) are a class of proteins possessing domains that can bind to the specific DNA of the promoter regions of particular genes [1]. Transcription factors are involved in gene regulatory mechanisms via the suppression and induction of specific genes [2]. This TF-regulated complex gene regulatory mechanism is involved in plant development and abiotic stress response [3]. SQUAMOSA promoter-binding protein-like (SPL), also known as SQUAMOSA promoter-binding protein (SBP), is a plant-specific TF that plays a vital role in multiple developmental mechanisms, including flower development [4,5,6,7], fruit ripening [8], leaf growth [7], pericarp color development [9,10], and plant architecture [11]. The model plant Arabidopsis thaliana contains 17 SPL members [12,13]. SPL TFs are characterized by a highly conserved 75-79-amino-acid-residue SBP domain. The SPL domain has two typical zinc finger structures, C3H (C-C-CH) and C2HC (C-C-HC), along with a conserved nuclear localization signal (NLS) at the end of the C-terminal [14]. It has been demonstrated that the SBP domain of SBP/SPL TFs mandatorily binds to the cis-element of TNCGTACAA with a palindromic GTAC core motif [14,15].
Firstly, SBP-box-containing genes (SBP1 and SBP2) were identified in snapdragon (Antirrhinum majus). SPB genes can precisely identify the floral development gene SQUAMOSA promoter and control gene expression patterns [7,14]. Since the discovery of SPL orthologous, these gene family members have been identified in many plants, such as rice (Oryza sativa) [16], tomato (Solanum lycopersicum) [17], grapevine (Vitis vinifera) [18], pear (Pyrus communis) [19], jujube (Ziziphus jujuba) [20], petunia (Petunia × atkinsiana) [21], soybean (Glycine max) [22], populus (Populus trichocarpa) [23], and Chinese chestnut (Castanea mollissima) [24]. Various SPL genes are negatively controlled by the miRNA156 family, one of the plants’ highly conserved miRNA families, through the direct division of the SPL transcript [25].
MicroRNAs (miRNAs) are endogenous, non-coding small RNAs. Mostly, miRNAs can target TFs and regulate multiple developmental mechanisms in plants [26]. However, miRNAs also regulate anthocyanin biosynthesis via their targeting TFs [27]. In Arabidopsis and switch grass, the overexpression of miRNA156 regulates anthocyanin biosynthesis and lignin production [28]. Moreover, miR828 negatively regulates anthocyanin synthesis by suppressing MYB75, MYB90, and MYB113 TF in Arabidopsis [29]. Furthermore, miRNA156 promotes the anthocyanin content by suppressing SLP9 [28]. SPL genes have complementary binding sites with miRl56, which is related to the synthesis and regulation of anthocyanins [7,30]. The miRl56 containing 20 nucleotides was first identified in Arabidopsis, and later studies showed that the miRl56-SPL module regulates plant color [7,31]. miRl56 promotes the biosynthesis of anthocyanins, flavonoids, and flavanols in Populus (Populus tremula L.) by targeting and regulating the mRNA expression levels of the SPL gene [32].
Anthocyanin accumulation in grapes is induced by drought, induced ABA signals, and the miRl56-SBP-MBW complex regulatory module [9]. In pears, the expression of miRl56 increased after bagging, but the expression of its target gene PpSPLs decreased. PpSPL10 and PpSPL13 can interact with PpMYB10 to affect the triplet protein complex formed by MYB10, bHLH, and WD40 so that it can be involved in photoinduced pear skin coloring and anthocyanin accumulation [19]. AtSPL9 coordinates anthocyanin biosynthesis in Arabidopsis by disrupting the MYB-bHLH-WD40 transcription complex [28]. In addition, the overexpression of Vc-miRl56a in blueberries (Vaccinium corymbosum L.) enhances the biosynthesis of anthocyanins and ethylene and decreases the accumulation of chlorophyll, while the target gene VcSPL12 promotes chlorophyll accumulation in fruits and inhibits the synthesis of anthocyanins and the ethylene precursor ACC. It is suggested that the miR156-SPL module may have some intrinsic relationship with the ethylene pathway [33].
Litchi (Litchi chinensis Sonn.) is a widely cultivated evergreen fruit tree from the Sapindaceae family’s genus litchi [34]. Litchi is ranked as the world’s third most cultivated tropical fruit, with high nutritive and commercial values. In litchi marketing, fruit coloration is a vital external quality trait. Most consumer markets demand ripe and highly colored litchi fruits [35]. Anthocyanins and chlorophyll are mainly found in the outer cell layer of the pericarp, while carotenoids are found in the flesh [36]. The color of litchi fruit is mainly the result of chlorophyll degradation and anthocyanin accumulation in the pericarp. Anthocyanin content concentration and distribution vary among litchi cultivars [37,38]. The availability of a whole-genome sequence of litchi will aid in identifying genes related to pericarp color development [39]. The regulation of plant color change by the miRl56-SPL module has been confirmed in Arabidopsis and other plants, but the SPL gene related to litchi anthocyanin synthesis and chlorophyll degradation has not been clarified [28].
This study identified 17 putative LcSPL genes in the litchi genome. Moreover, bioinformatics analysis was conducted from the perspective of gene physicochemical properties, gene structure, species collinearity, cis-acting elements, protein interaction prediction, gene co-expression, and LcSPL gene expression patterns. Then, the genes related to litchi pericarp coloring were screened out. The results of this study lay an essential foundation for the further exploration of the litchi pericarp coloration mechanism. Further functional verification and genetic improvement can be conducted to explore the molecular mechanism involved in litchi pericarp color regulation and provide the scientific basis for litchi quality improvement and cultivation.

2. Materials and Methods

2.1. Identification of SPL Genes in Litchi and Chromosomal Location Analysis

The litchi genome data used in this study were downloaded from SapBase (http://www.sapindaceae.com/Download.html, accessed on 6 April 2024). The Arabidopsis AtSPLs sequences were obtained from TAIR (http://www.arabidopsis.org/, accessed on 6 April 2024). TBtools-II 2.043 was used to blastp with AtSPLs as bait sequences. Batch CDD-Search (https://www.ncbi.nlm.nih.gov/Structure/bwrpsb/bwrpsb.cgi, accessed on 7 April 2024). InterPro (https://www.ebi.ac.uk/interpro/, accessed on 7 April 2024) was used to screen SBP domain-containing and non-containing proteins [40]. The Pfam-A models file was downloaded from Pfam (https://www.ebi.ac.uk/interpro/download/Pfam/, accessed on 7 April 2024). TBtools-II 2.043 further identified the litchi SPL family genes with the SBP domain (PF03110).
The chromosomal localization of the LcSPLs was performed using litchi genome annotation information. The physicochemical properties of LcSPL proteins were analyzed using online ExPASy (http://web.expasy.org/, accessed on 9 April 2024), including coding amino acid length, molecular weight (MW), isoelectric point (PI), instability index, aliphatic index, and the grand average of hydropathicity (GRAVY). The CELLO v.2.5 website was used to forecast the subcellular location.

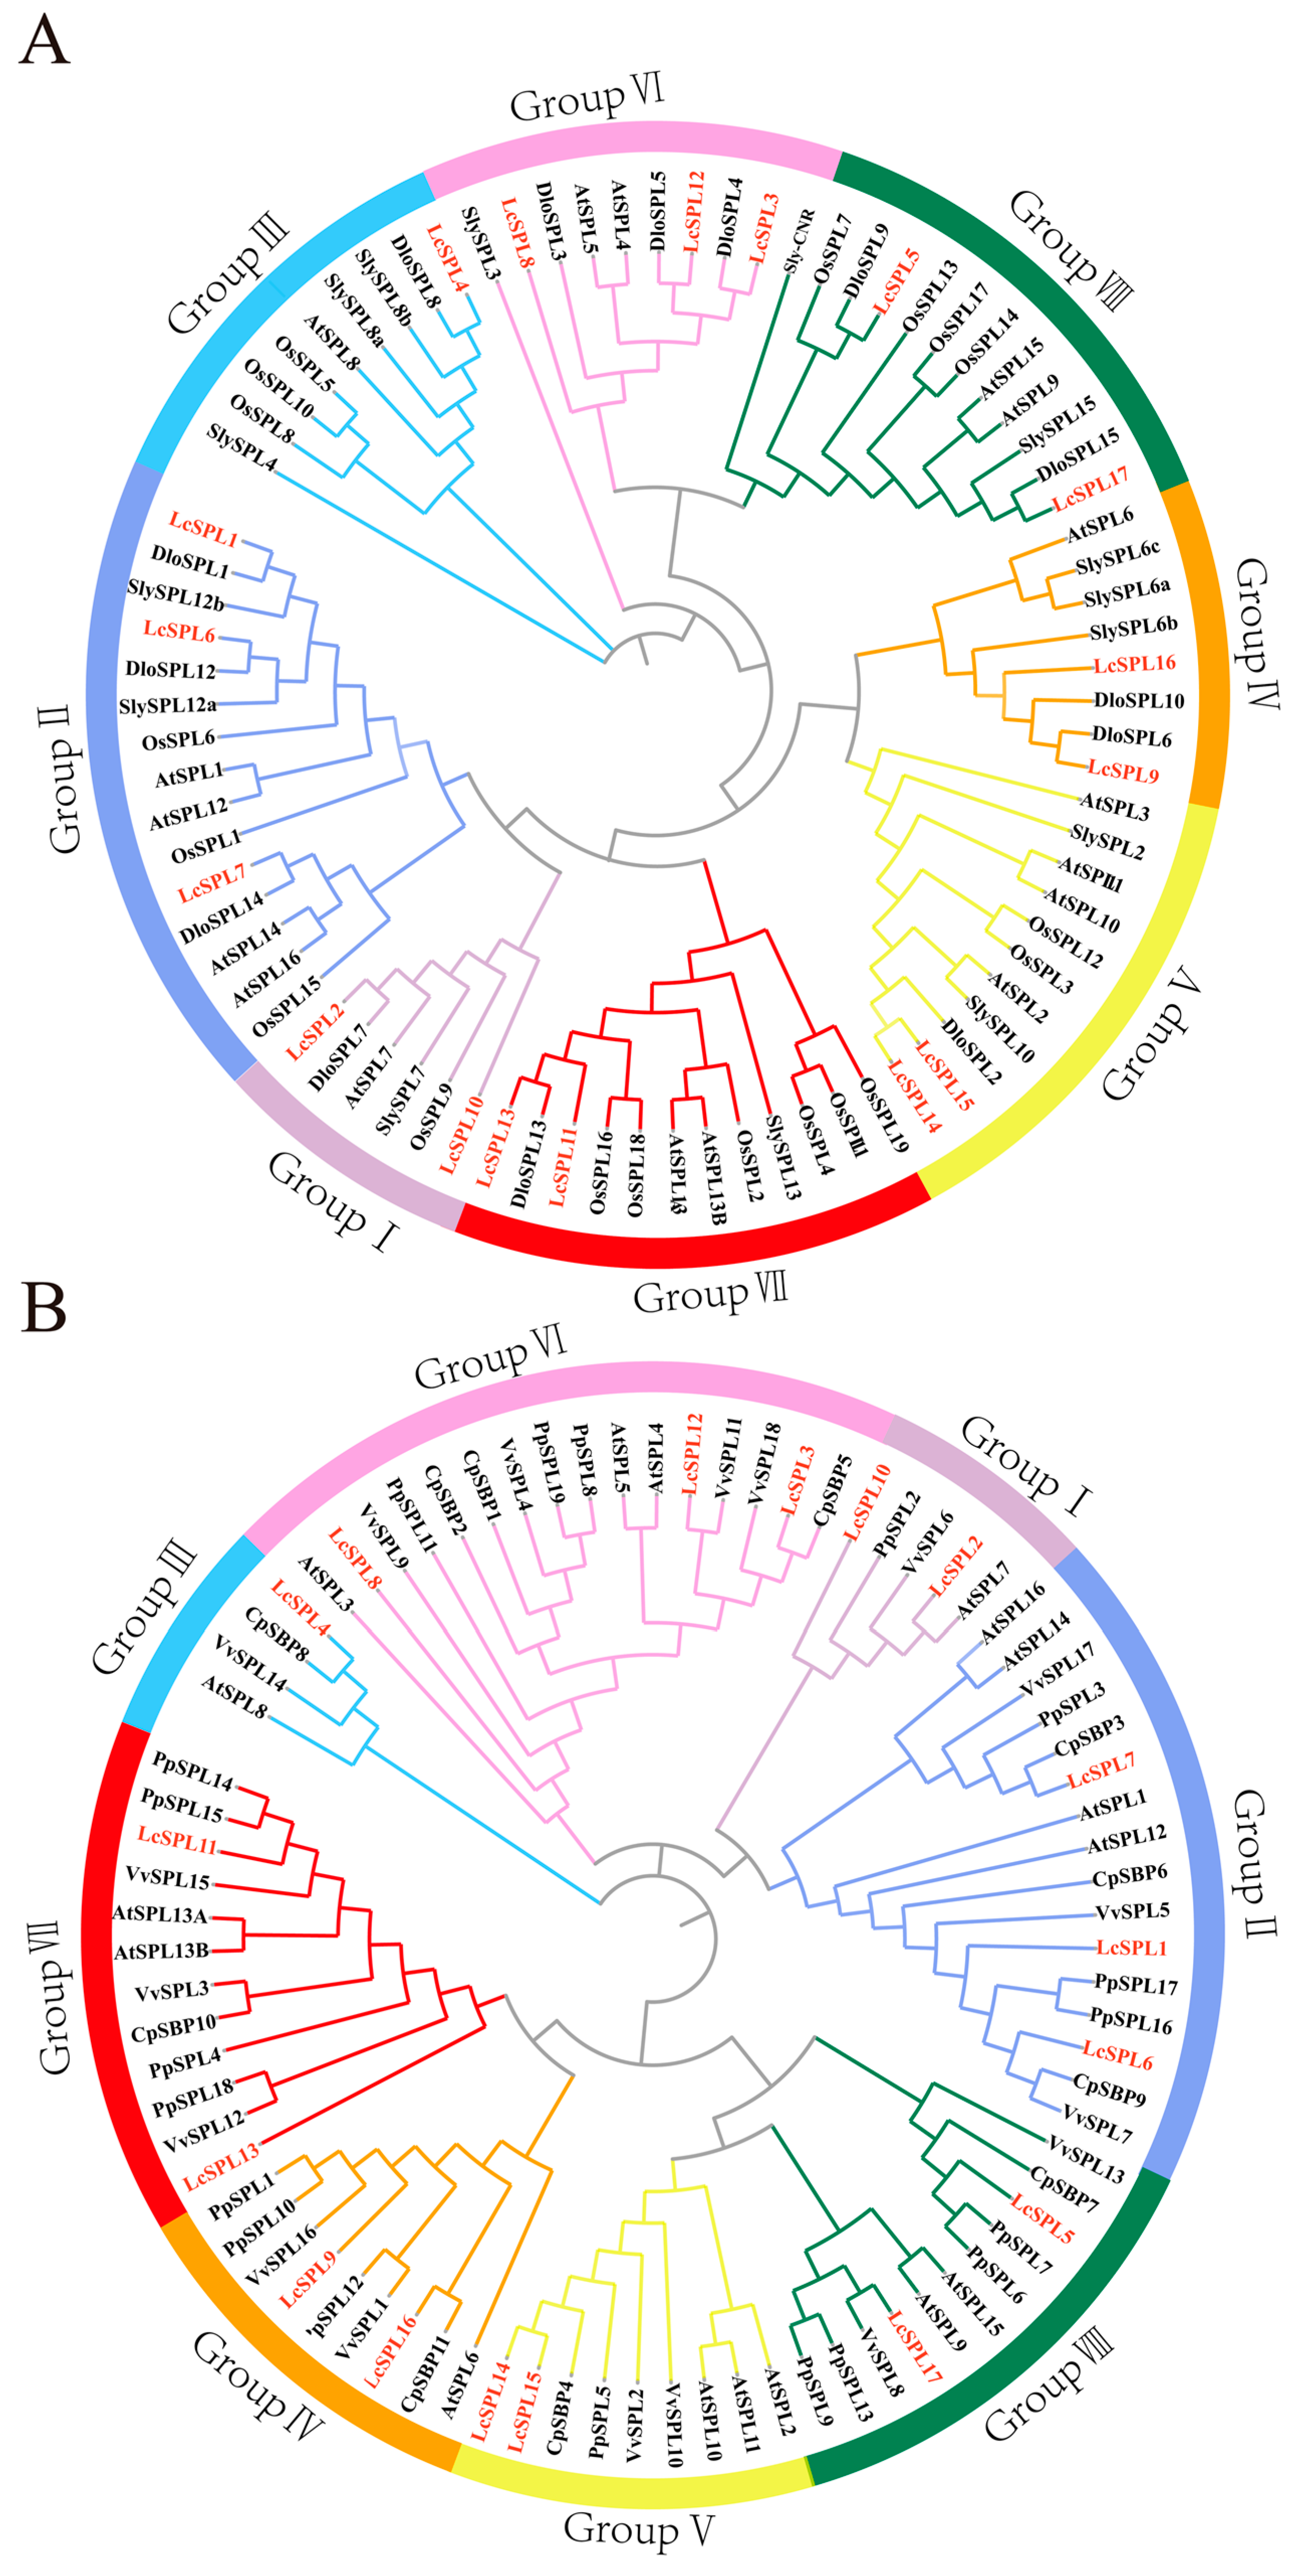
2.2. Phylogenetic Analysis of the LcSPL Family Genes

The SPL amino acid sequences of Arabidopsis, rice, tomato, and longan (Dimocarpus longan) were acquired from Tair, Rice Genome Annotation Project, Sol Genomics Network, and GIGADB. The phylogenetic tree was constructed to analyze the evolutionary relationship of LcSPLs. A phylogenetic tree was constructed to further identify the function of LcSPLs in pericarp coloration. SPL amino acid sequences of grape, pear, papaya, and Arabidopsis were retrieved from NCBI, PearMODB, PlantTFDB, and Tair. The phylogenetic tree was constructed using MEGA 11.0 software with the neighbor-joining (NJ) method, and the bootstrap replications were stetted 1000 times. The phylogenetic tree was visualized using the iTOL (http://itol.embl.de/, accessed on 11 April 2024) online website.

2.3. Gene Structures, Multiple Sequence Alignment Analysis and MicroRNA Target Prediction

MEME (http://meme-suite.org/tools/meme, accessed on 12 April 2024) was used to search the 10 motifs in the litchi SPL family proteins. TBtools-II 2.043 utilize the gene structures and domains of LcSPL family members. All miR156 sequences in litchi were retrieved from the SapBase database. All miR156 sequences and 17 litchi LcSPL proteins were uploaded to the online profiling software psRNATarget (2017 edition) (using default settings) to predict the miR156 target sequences. Multiple sequence alignment and visualization of SBP domains of the 17 LcSPLs proteins and all miR156 sequences and their targets used the DNAMAN v.10.3.2.221 program.

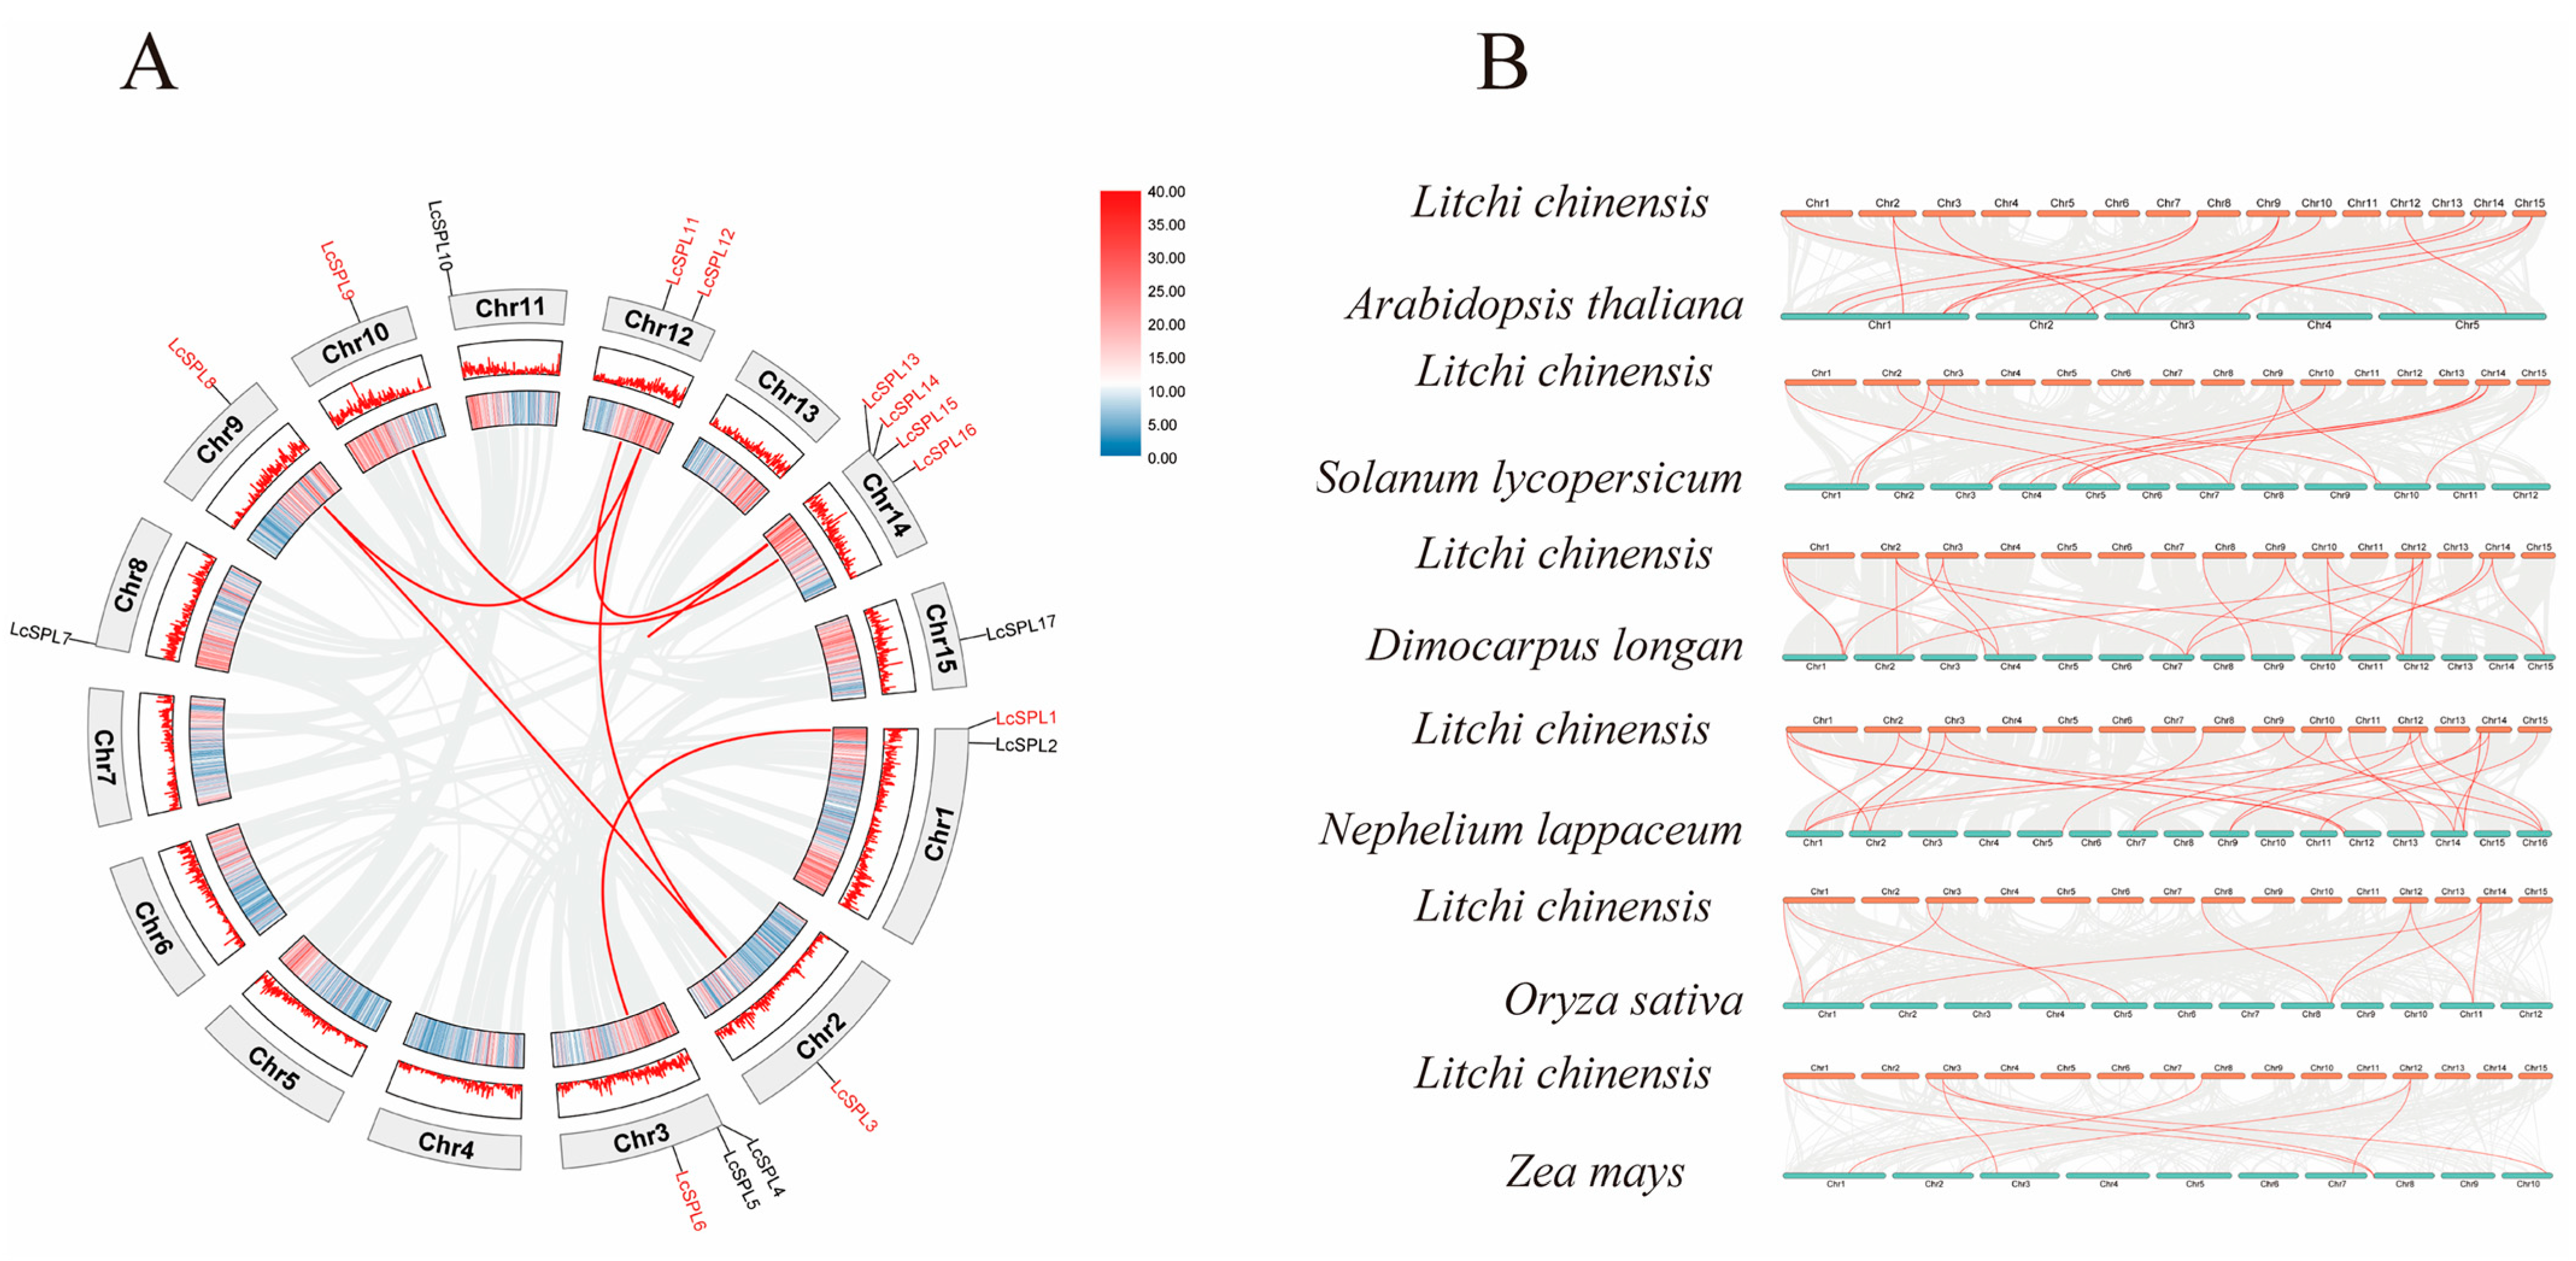
2.4. Gene Duplication and Syntenic Analysis of the Litchi SPL Gene Family

Genome and gene annotation files of Arabidopsis, tomato, rice, maize, rambutan, and longan were downloaded from Ensemble (http://plants.ensembl.org/index.html, accessed on 15 April 2024) and SapBase. Fragment duplication events of litchi with six representative species were analyzed and plotted for covariance analysis using TBtools-II 2.043 [40].

2.5. Cis-Element Identification in the Promoter and Protein Interaction Prediction Analysis

To comprehend the potential roles and expression regulation mechanisms of LcSPL genes, 2000 bp upstream promoter sequences of the genes were extracted and uploaded to the PlantCARE (http://bioinformatics.psb.ugent.be/webtools/plantcare/html/, accessed on 14 April 2024) database and TBtools-II 2.043 was used for visualization. Protein interaction predictions were analyzed using the online site STRING (https://cn.string-db.org/, accessed on 14 April 2024), and information on interacting proteins was retrieved on UniProt (https://www.uniprot.org/, accessed on 14 April 2024).

2.6. Gene Ontology (GO) Enrichment Analysis and Expression Pattern Analysis of LcSPL Genes in Litchi

This step consisted of cloning all litchi genes into eggNOG-mapper and acquiring GO-annotated background information [41]. GO hierarchical structural files were downloaded from Gene Ontology (https://geneontology.org/, accessed on 26 April 2024) and GO annotation and enrichment analyses of LcSPL genes were conducted using TBtools-II 2.043 [42].
The RNA-seq data used in this study consisted of four public databases and two sets of home data (Table S1):
  • RNA-seq data relating to pericarp, flower, leaf, flesh, and seed samples of naturally grown ‘Feizixiao’ litchi (unpublished).
  • RNA-seq data relating to carpopodium, aril, seed, pericarp, and fruitlet samples of naturally grown ‘Feizixiao’ litchi, accession number isPRJNA271242 (https://www.ncbi.nlm.nih.gov/bioproject/PRJNA271242/, accessed on 26 April 2024) [43].
  • Normal growth of green, yellow, and red ‘Nuomici’ litchi pericarp sample RNA-seq data; the accession number is PRJNA261000 (https://www.ncbi.nlm.nih.gov/bioproject/?term=PRJNA261000, accessed on 26 April 2024) [44].
  • RNA-seq data relating to ‘Feizixiao’ litchi pericarp samples at different periods after 5-(1-hydroxy-2,6,6-trimethy1-4-oxo-2cyclohexen-1-yl)-ethy1-(22,4E)-pentadienoic acid (ABA) and N-(2-Chloro-4-pyridyl)-N’-phenylurea (CPPU) treatment; the accession number is PRINA415698 (https://www.ncbi.nlm.nih.gov/bioproject/?term=PRJNA415698, accessed on 26 April 2024) [45].
  • RNA-seq of CPPU-treated ‘Feizixiao’ litchi pericarp samples at the all-green and best-eat periods (unpublished).
  • RNA-seq data of ‘Feizixiao’ litchi pericarp samples at different periods after lifting the shading treatment; the accession number is PRJNA303128 (https://www.ncbi.nlm.nih.gov/bioproject/PRJNA303128, accessed on 26 April 2024) [46].

2.7. Weighted Gene Co-Expression Network Analysis (WGCNA)

In order to improve out understanding of the association and regulatory network among LcSPL genes, WGCNA shiny was used to analyze the differentially expressed genes in litchi at different coloring stages (PRJNA261000) and at different periods after lifting shade avoidance (PRJNA303128) [42]. The dynamic tree-cutting method divided the screened genes into different co-expression modules. The essential genes were screened and identified based on the correlation between the gene modules and the phenotypic samples and by combining the expression patterns of the module feature values in different samples. Cytoscape 3.10.1 was used to visualize and construct the co-expression network analysis map.

3. Results

3.1. Identification of LcSPL Genes and Their Characterization in Litchi

In this study, the amino acids encoded by Arabidopsis SPL genes were used as bait proteins, and the litchi genome data were searched via a comparison of blastp and HMM methods. A total of 17 candidate LcSPL genes were identified after removing redundant sequences, and the encoding genes were named LcSPL1~LcSPL17 according to their ordered positions on the chromosomes (Text S1). The length of the protein sequences, MW, PI, instability index, GRAVY, and subcellular localization are illustrated in Table 1. The length of the 17 LcSPL proteins ranged from 124 (LcSPL10) to 1062 AA (LcSPL7). The lowest MW was 14.57 kDa (LcSPL10), and the highest MW was 118.46 kDa (LcSPL7). The value of the PI varied from 5.91 (LcSPL6) to 9.31 (LcSPL14, LcSPL15). The changes in PI were relatively small, and four acidic proteins (LcSPL1, LcSPL2, LcSPL5, and LcSPL6) and one neutral protein were obtained. The instability index varied from 42.32 (LcSPL15) to 97.99 (LcSPL10); all family members were unstable proteins. The values of the GRAVY ranged from −1.305 (LcSPL10) to −0.267 (LcSPL2). The predicted locations of LcSPL genes were found to be nuclear-localized.
The chromosome mapping of the LcSPL gene family was performed using the litchi genome. Overall, 17 LcSPL genes were unevenly distributed in 10 litchi genome linkage groups (Figure 1).

3.2. Phylogenetic Analysis

To investigate the evolutionary relationship of litchi (17 LcSPLs) with SPL genes of Arabidopsis (17 AtSPLs) [13], rice (19 OsSPLs) [47], tomato (15 SlySPLs) [17], and longan (14 DloSPLs) [48] were used to construct a neighbor-joining phylogenetic tree (Figure 2 and Figure 3A) (Text S1). The results revealed that the LcSPL gene family was classified into eight groups (Group I to Group VIII), consistent with a previous SPL family distribution classification [49]. There was one member in Group III and two members in Group I, group VIII, Group IV, Group V, and Group VII. Group II and Group VI had three members (Figure 3). We also explored the orthologous relationship among the Arabidopsis, rice, and logan SPL families. We found that the LcSPL genes had high similarity and evolutionary relationship with longan DloSPL genes. It indicated that the biological functions of these genes could be similar in the two species. Except for Group VI and Group IV, which did not contain OsSPLs, the other six groups all contained SPL genes from five species, implying that the SPL genes may not have strictly followed the characteristics of monocotyledonous and dicotyledonous plants in evolution. Instead, two types of plants may have shared a similar evolutionary history [50].
The phylogenetic relationship of the LcSPL family with carotenoid and anthocyanin-producing plants, including pears, grapevine, and papaya, was investigated. Understanding the phylogenetic relationship between LcSPL genes and other SPL genes with known functions from other species is helpful in predicting their roles in terms of pericarp coloration (Figure 3B) (Supplementary Text S1). The 82 full-length protein sequences can also be divided into eight groups. PpSPL10, which has been reported to be involved in repressing anthocyanin synthesis during the pericarp coloring stage, is in Group IV with LcSPL9 and LcSPL16 [19]. This result indicates that LcSPL9 and LcSPL16 may be associated with anthocyanin synthesis during the fruit coloring stage. The CpSBP1 gene, which is involved in carotenoid synthesis [51], belongs to Group VI (LcSPL8, LcSPL12, LcSPL3), and its closer evolutionary relationship to LcSPL8 suggests that LcSPL8 may also be correlated with carotenoid synthesis.

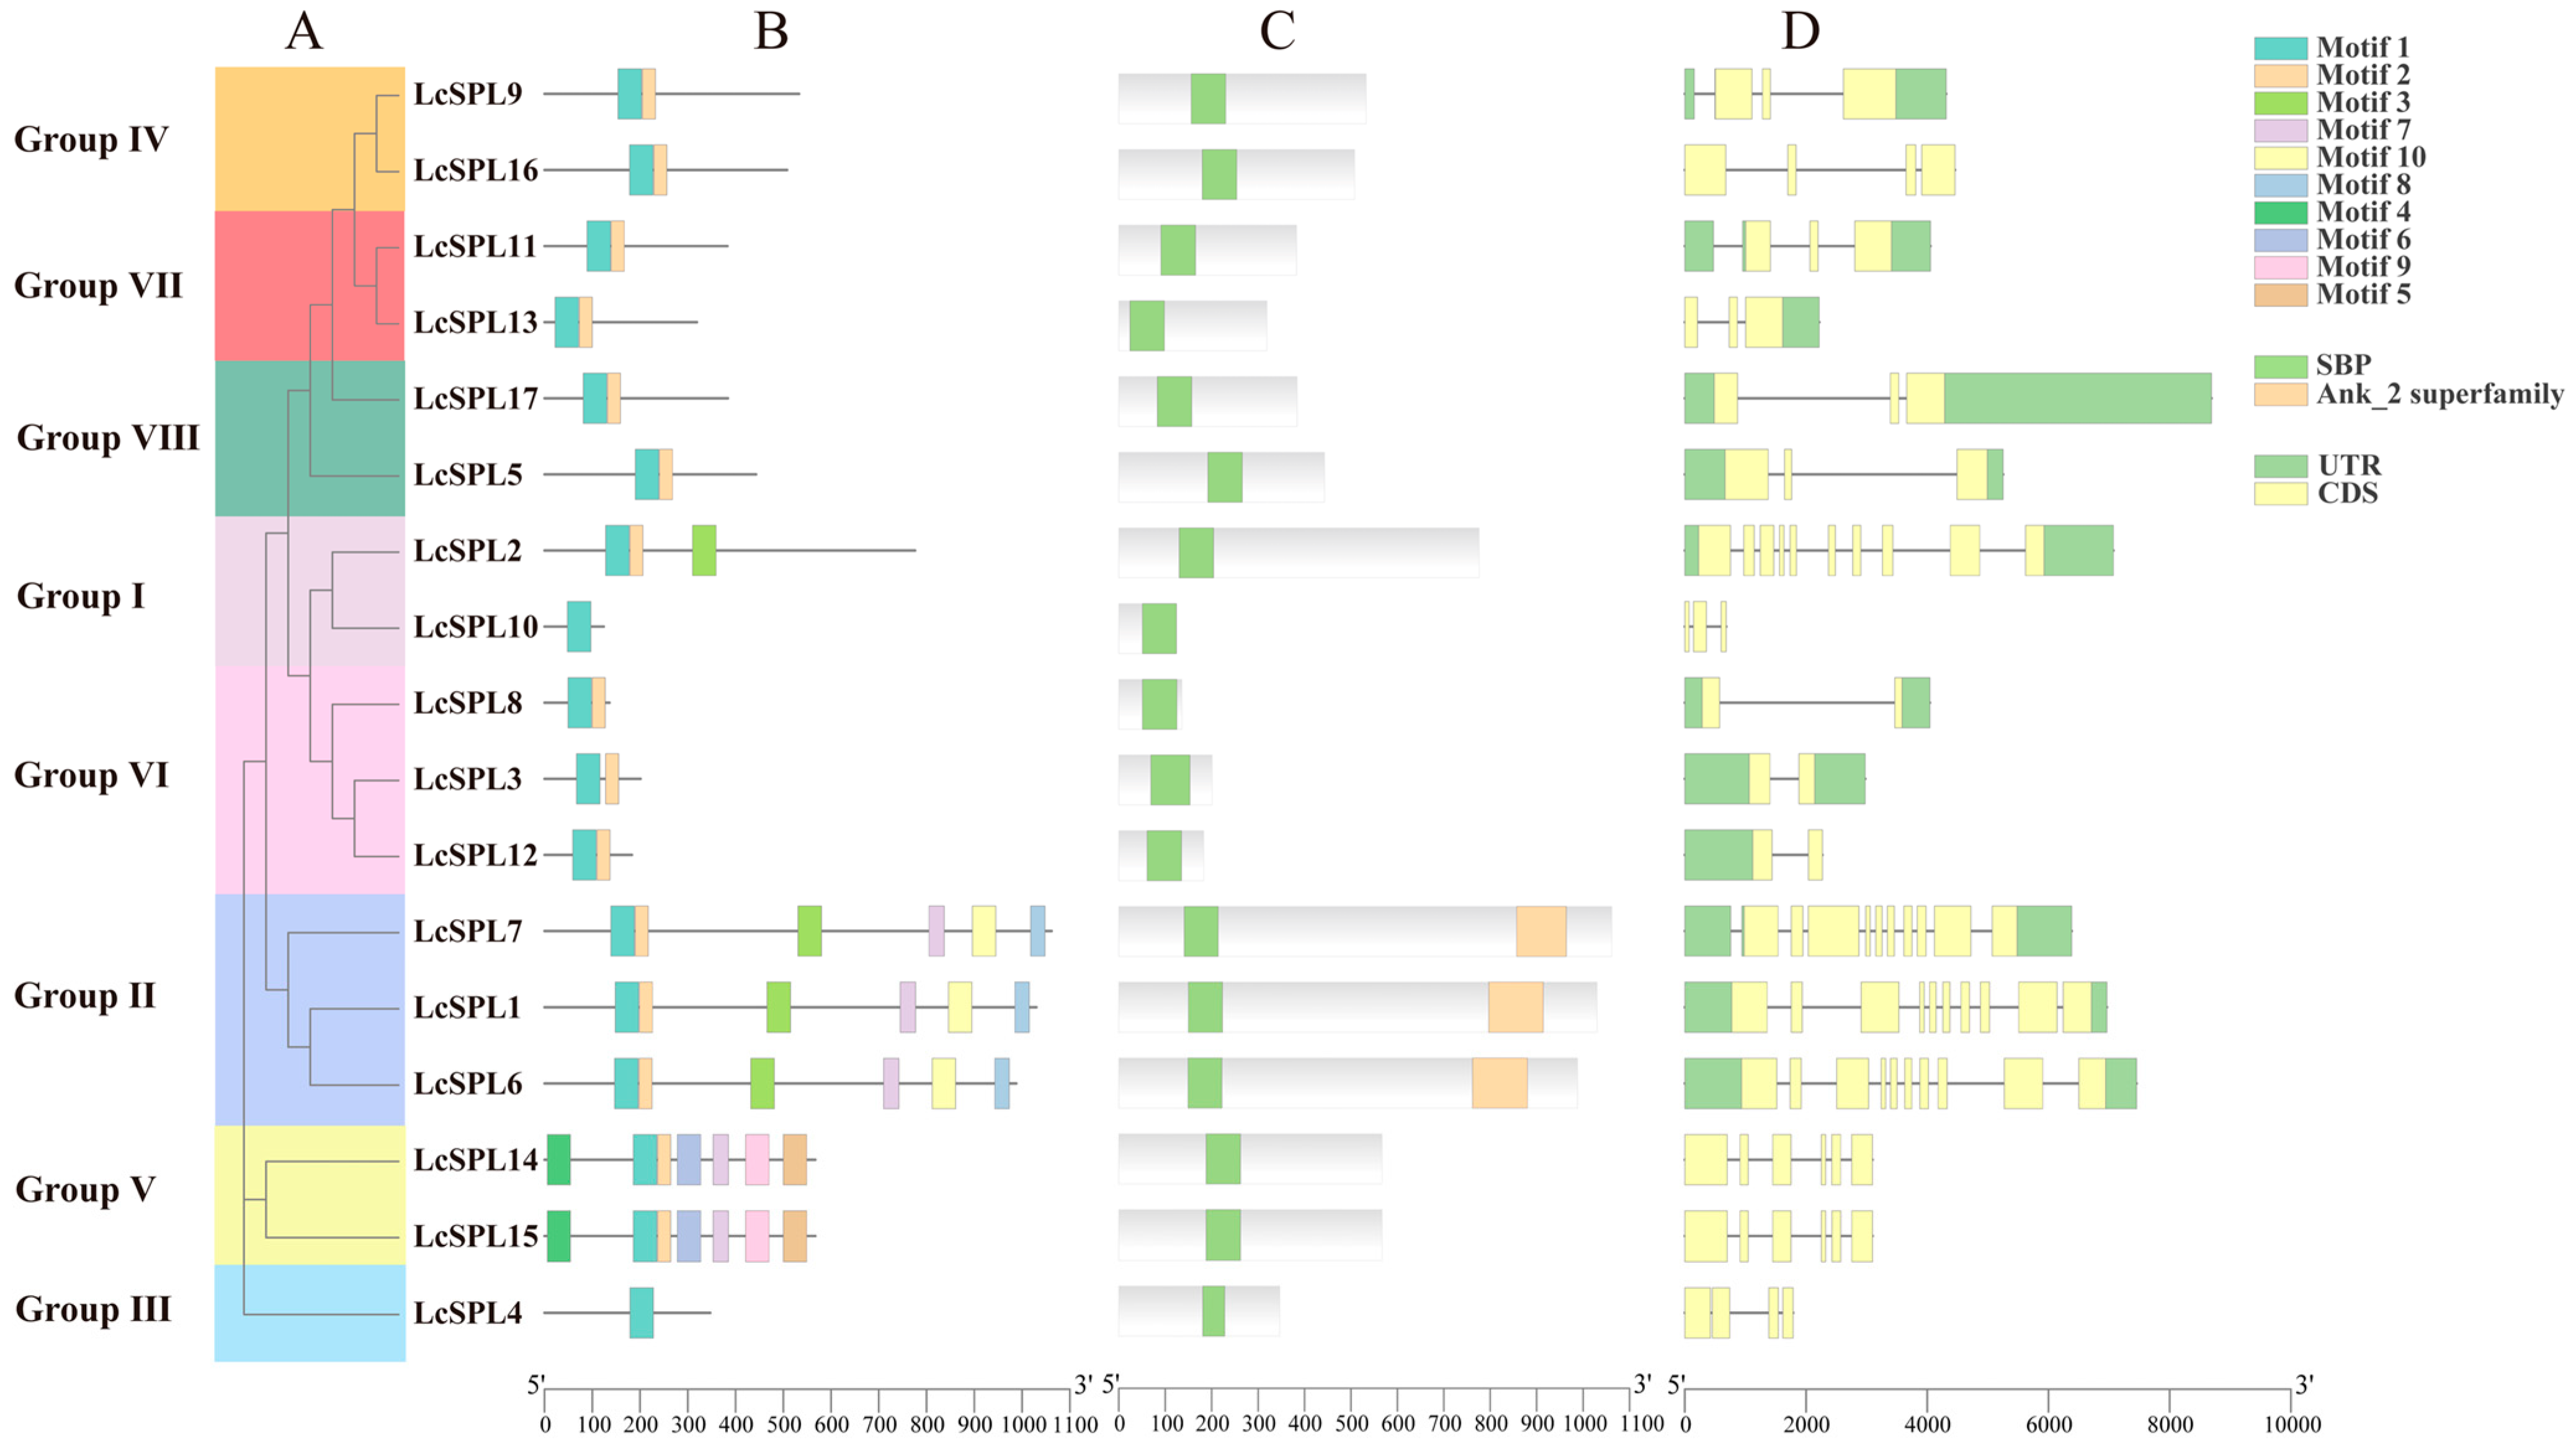
3.3. Analysis of Gene Structures, Conserved Domains, and Motifs

Gene structure analysis is an important indicator in terms of knowing the evolutionary history of gene families. Exon/intron structures were identified to understand the structural differences of the LcSPL gene family. According to Figure 4D, LcSPL genes contain 1–10 introns.
The MEME website was used to analyze the differences in the conserved motifs of the LcSPL proteins (Figure 4B). Motif 1 and 2 were distributed in 15 LcSPL genes, whereas motif 2 was absent in the LcSPL4 and LcSPL10 members. Motif 1 and motif 2 may form part of the conserved domain of SBP (Figure S1). In addition, the members of Group II were similar in structure, and all of them contained two domains, the SBP and Ank domains (Figure 4C). The SBP domain was conserved among all family members. This result explained why the groups classified via phylogenetic analysis shared homogenous motifs. The Ank domain has been shown to regulate protein–protein interactions and mediate molecular recognition [47], indicating that LcSPL1, LcSPL6, and LcSPL7 may play important roles in the signal transduction process. In addition, the analysis revealed that LcSPL14 and LcSPL15 have 99% sequence similarity and are located four genes apart at the chromosome location, but are not as similar to LcSPL13, which is fourteen genes apart, suggesting that they may have similar functions or involved in similar biological processes, whereas LcSPL13, which is far away from them, may play a role in a different biological pathway.

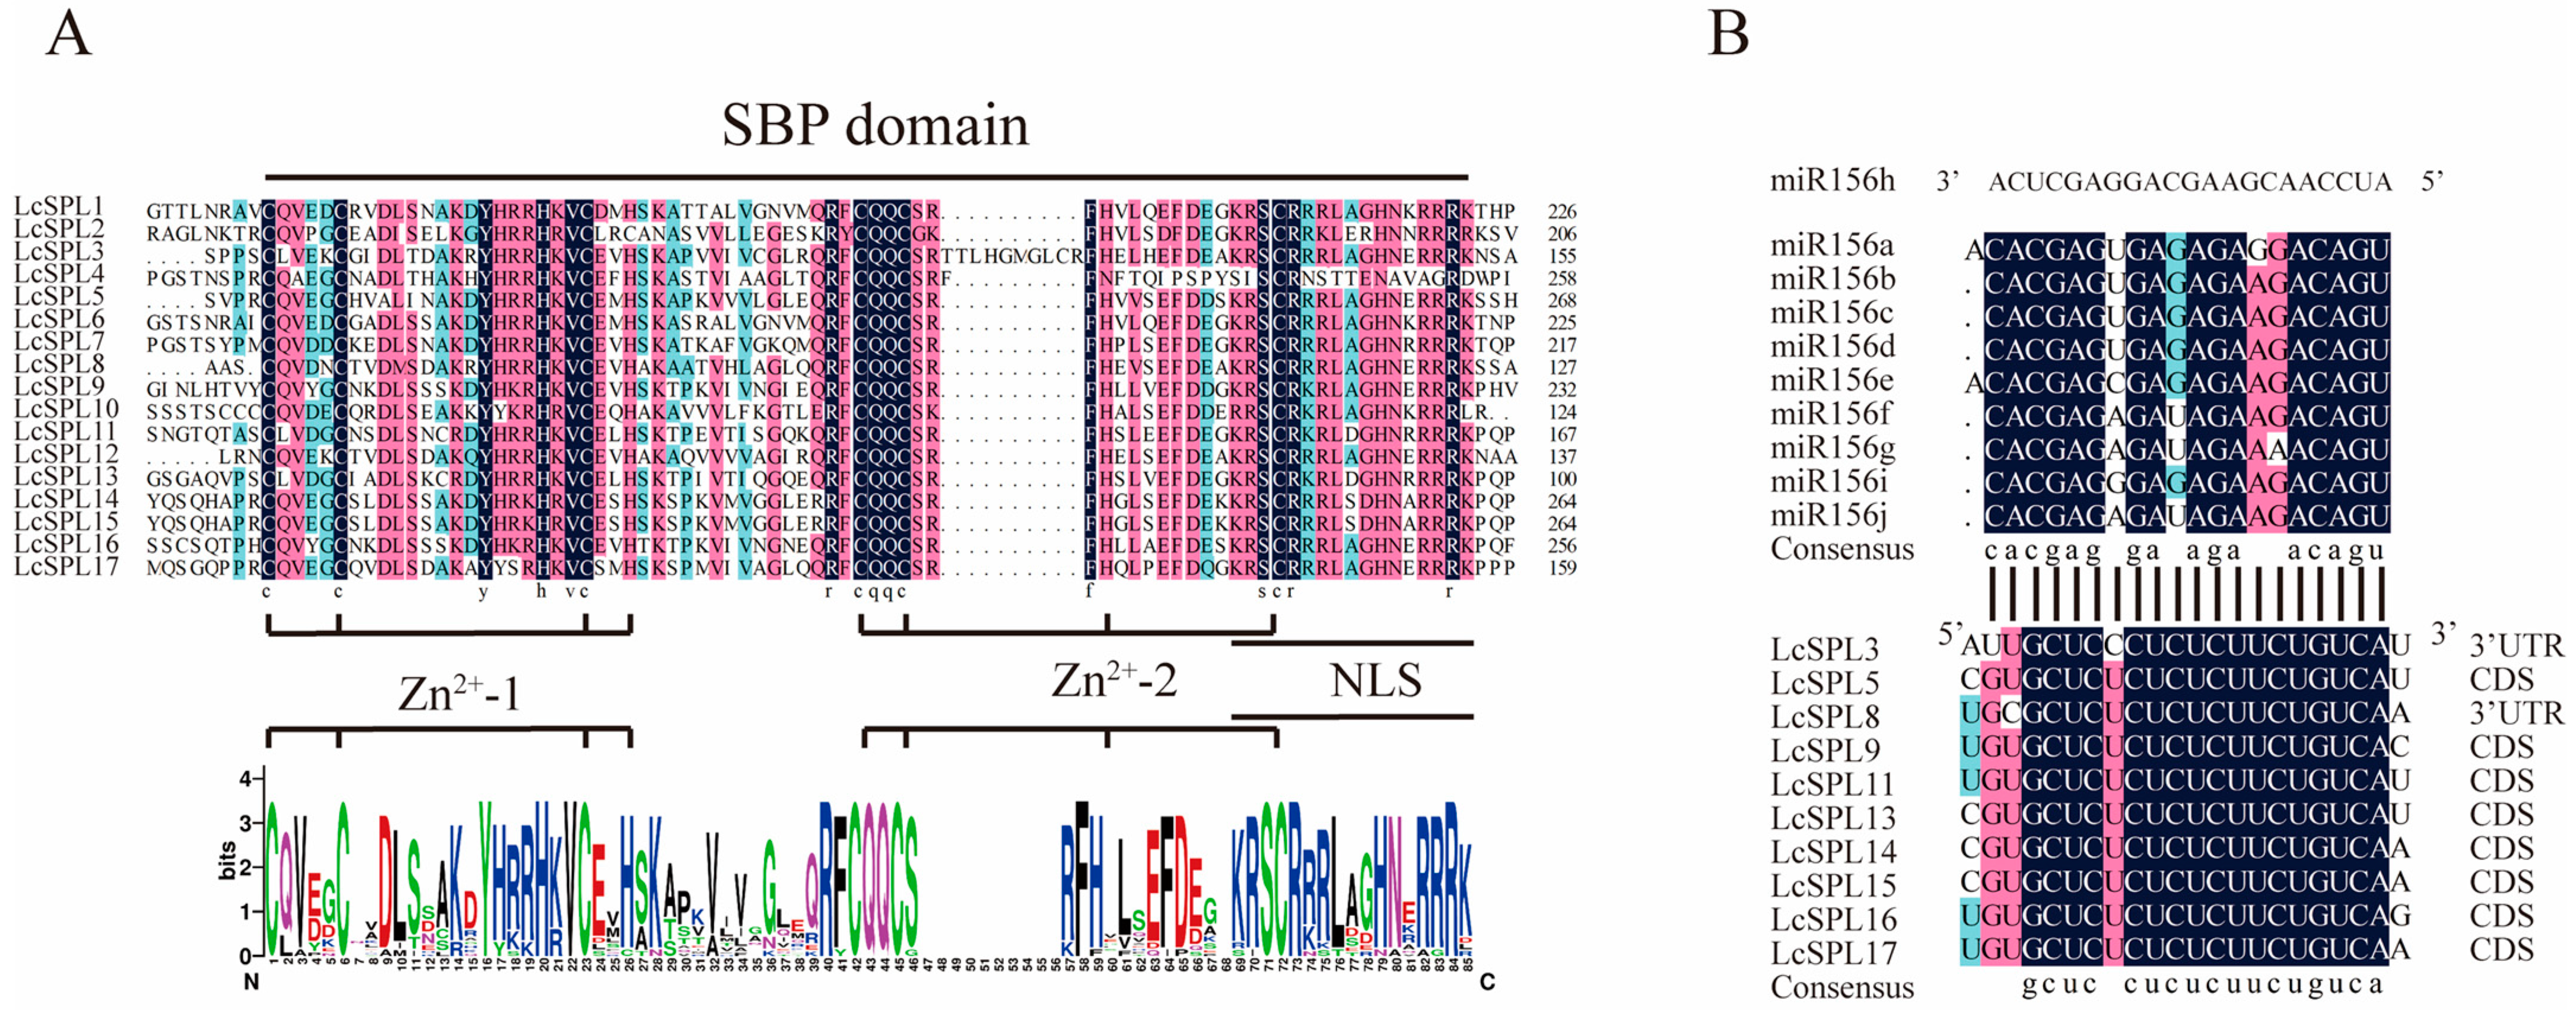
3.4. Multiple Sequence Alignment Analysis and MicroRNA Target Prediction

Multiple sequence alignment of the SBP domains of 17 litchi LcSPL proteins showed that the SBP domains consisted of three motifs: two zinc-finger structures (Zn-1 and Zn-2) and a nuclear localization signal, NLS (Figure 5A). The two zinc-finger structures consisted of either cysteine (Cys) or histidine (His) residues, including sixteen members of the Zn-1 sequence template as C3H (LcSPL2 is C4 structure), and all the members of Zn-2 satisfy C2HC [52]. In addition, the insertion of 10 amino acids into the SBP structural domain of LcSPL3 may lead to structural or functional changes to the protein [16].
We also used psRNATarget to predict miR156 target sites of the LcSPL family members, and 10 of these genes were identified as targets [53]. Based on the location of the miR156 target sites in SPL genes, we found that the miR156 targeting sequences in LcSPL3 and LcSPL8 were in the 3’-UTR, and the target sites of the other eight genes were in the last CDS, which indicates that it may affect mRNA stability when miR156 binds to the 3’-end of LcSPL genes, leading to the degradation of the target gene or transcriptional repression (Figure 5B) [54]. Moreover, there was no target site for miR156 in LcSPL3, and none of the target genes had a target site for miR156h, which may be related to the targeting specificity of miR156.

3.5. Distribution of LcSPL Genes in the Litchi Genome and Their Evolutionary Relationships

The chromosomal distributions of 17 LcSPL genes were evaluated using the litchi genome, which allocated them into seven fragment duplication events (LcSPL1/LcSPL6, LcSPL9/LcSPL16, LcSPL11/LcSPL13, LcSPL12/LcSPL3, LcSPL12/LcSPL8, LcSPL14/LcSPL15, and LcSPL3/LcSPL8) (Figure 6A). Tandem repeats and segmental repeats are the main replication modes of SPL genes [55], and the SPL family was found to have two tandem duplication events (LcSPL13/LcSPL14/LcSPL15 and LcSPL4/LcSPL5).
To further understand the gene duplication mechanism of the SPL family, we performed interspecies covariance analyses between litchi and six representative species, including four dicotyledons, Arabidopsis, tomato, longan, and rambutan (Nephelium lappaceum) (Sapindaceae family members), and two monocotyledons, such as rice and maize (Zea mays). The results showed that litchi had 14, 13, 22, 22, 10, and 7 pairs of homologous genes with Arabidopsis, tomato, longan, rambutan, rice, and maize (Figure 5B). There were more homologous gene pairs with Arabidopsis and tomato than with rice and maize, suggesting that litchi is homologous to dicotyledonous. In addition, litchi has more homologous gene pairs with longan and rambutan relative to the other plants, indicating that they diverged from each other at a more recent evolutionary time and that retained SPL homologous gene pairs may be associated with the evolution of common biological traits or adaptations.

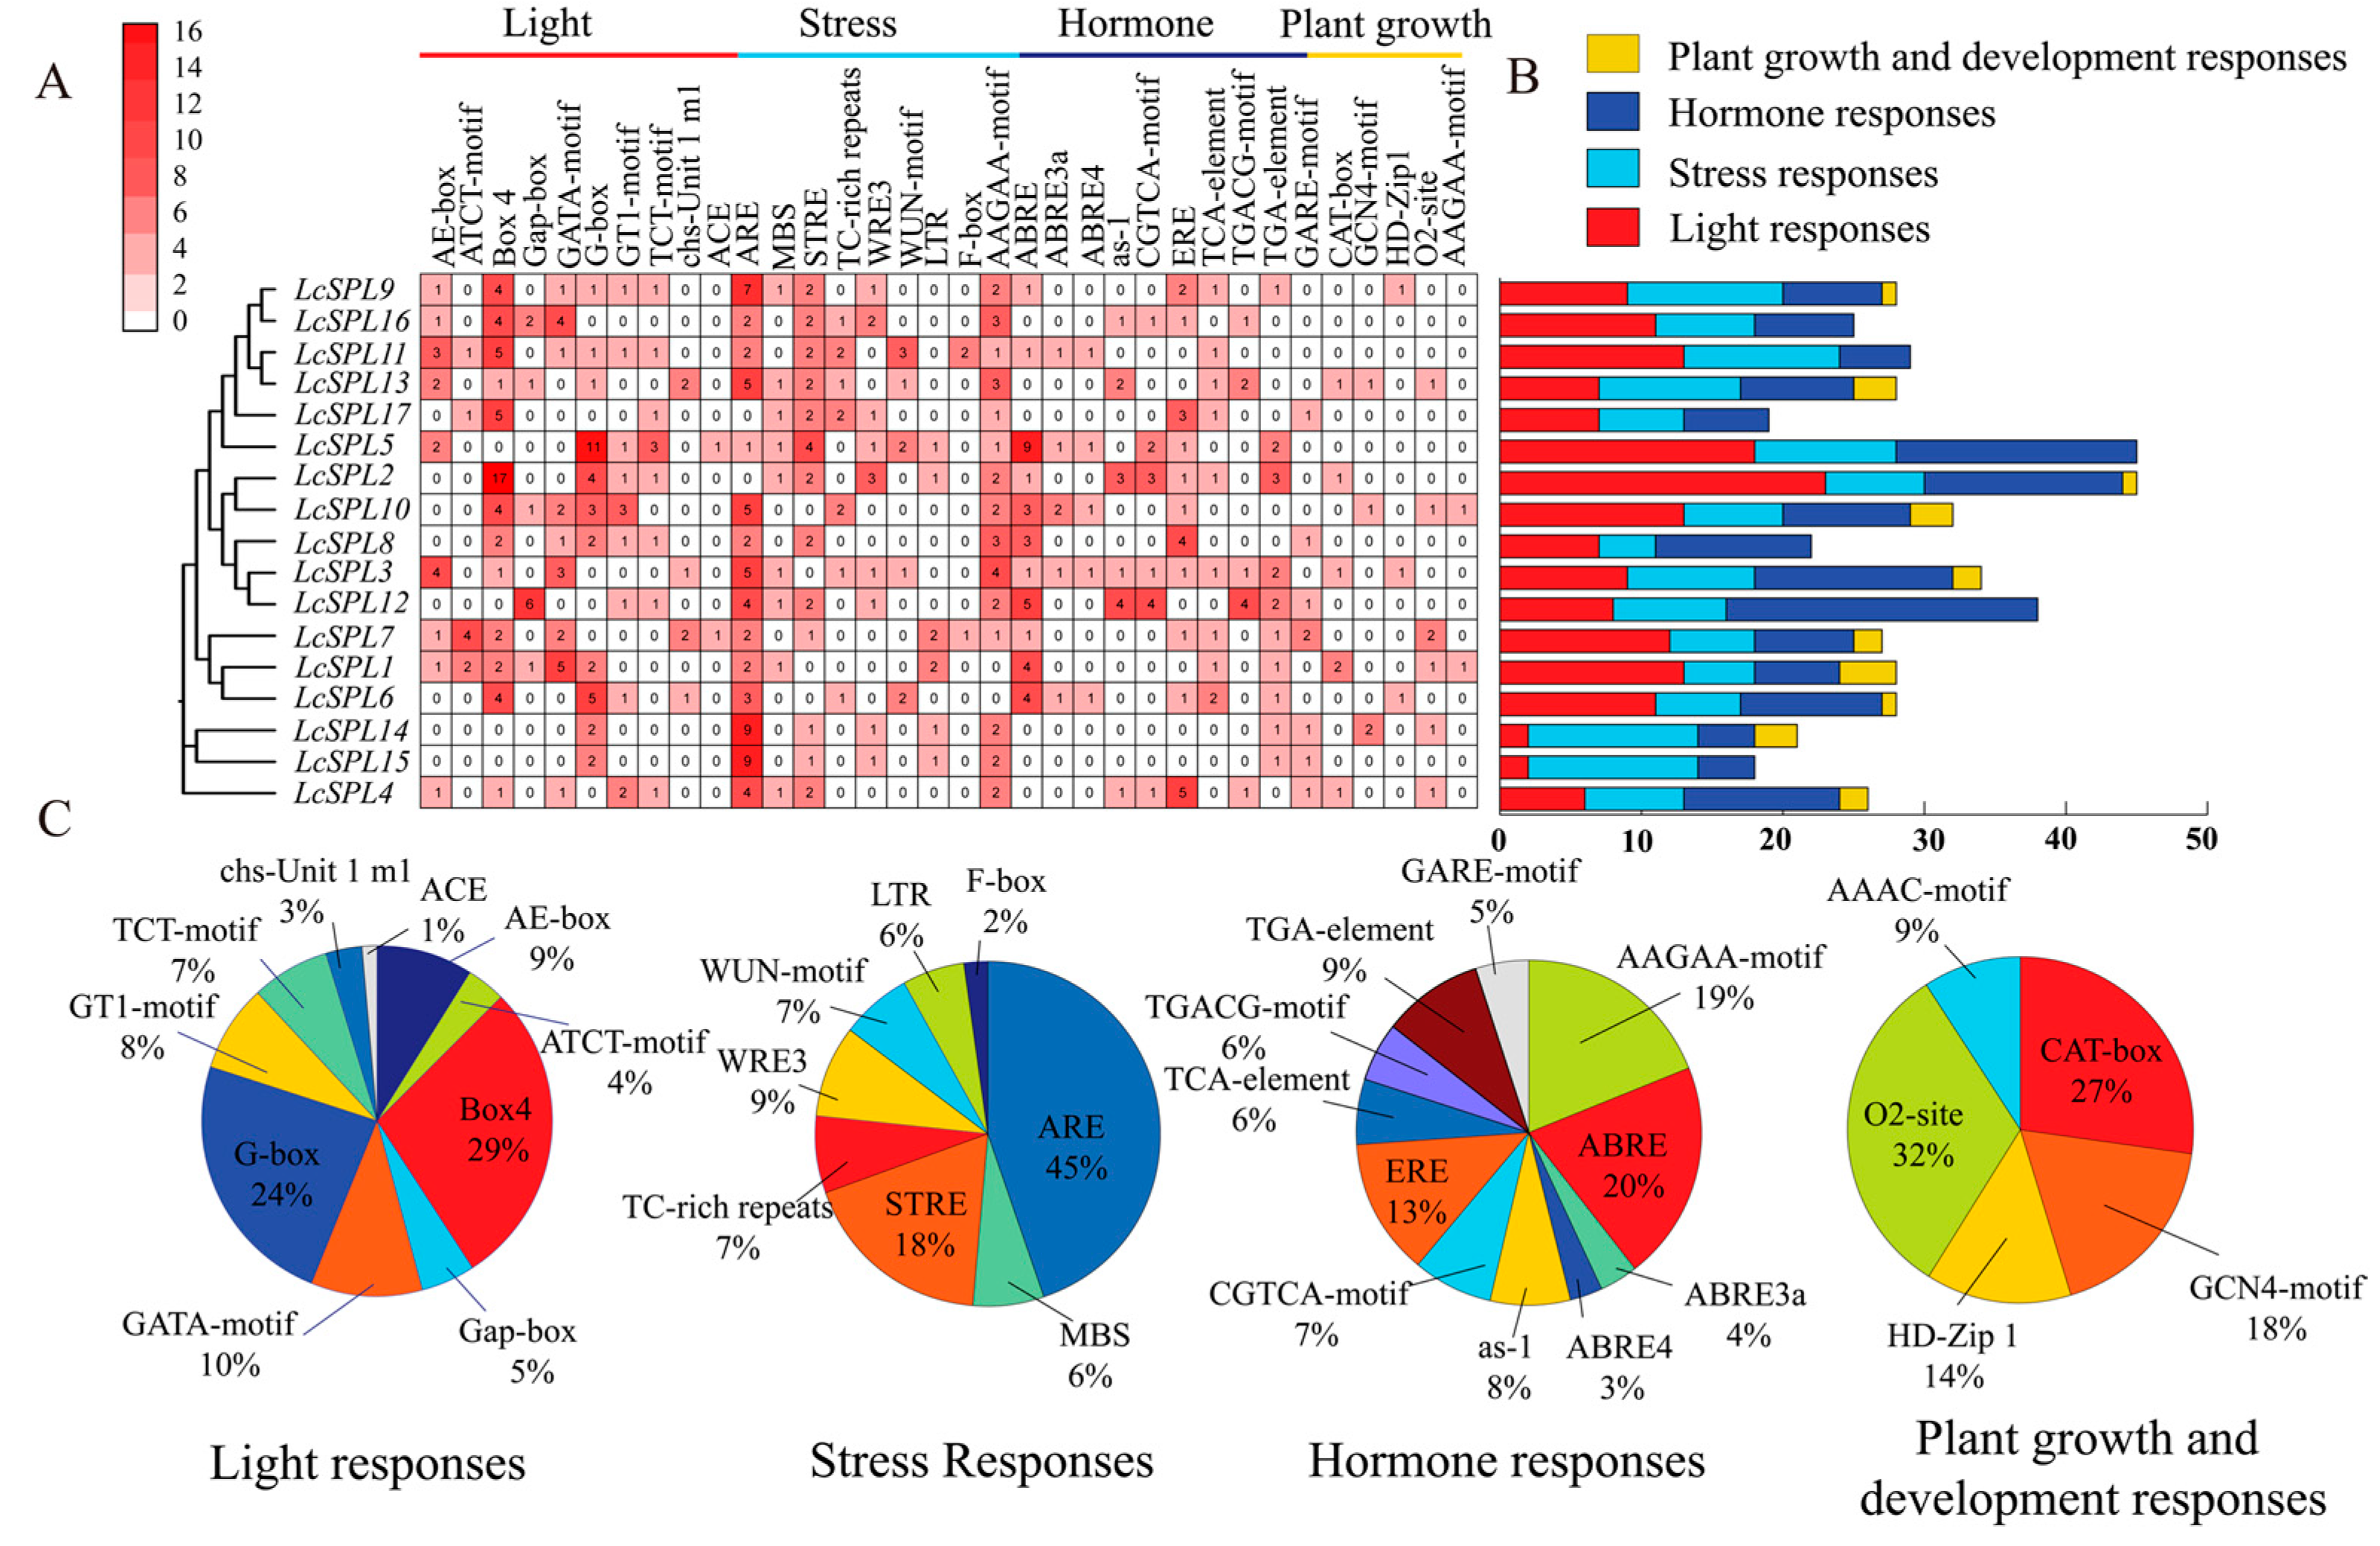
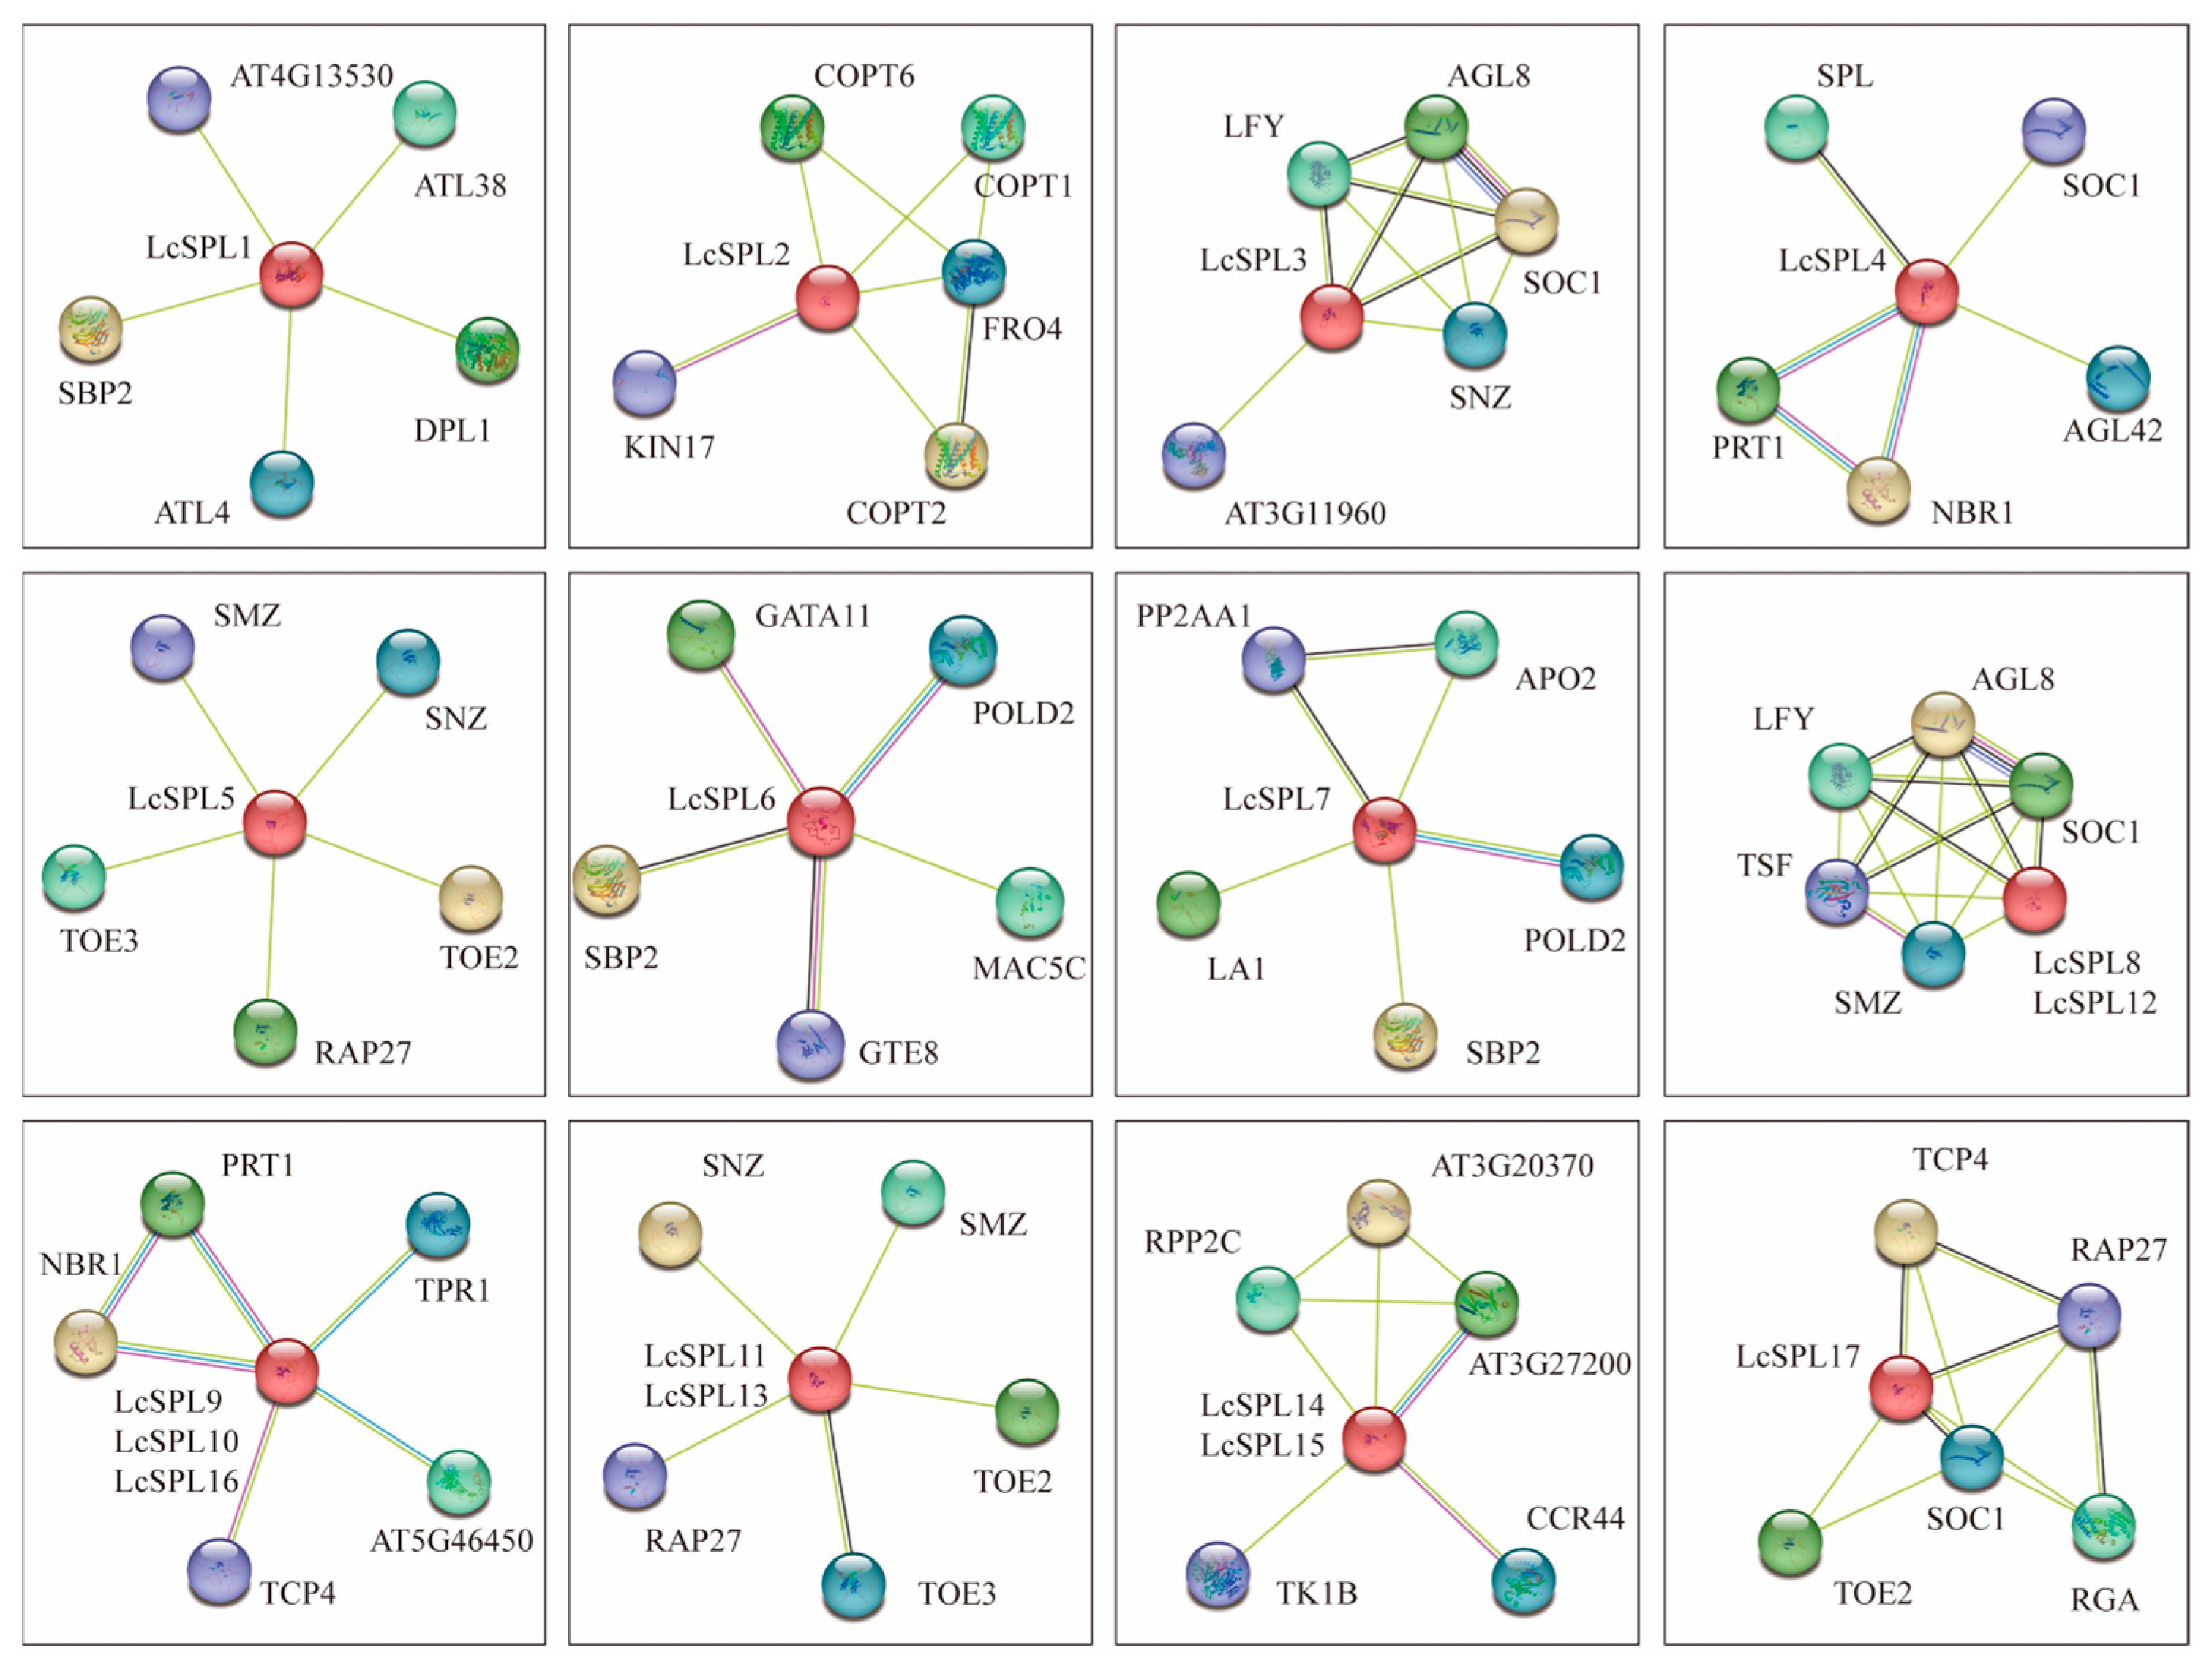
3.6. Cis-Element Identification in the Promoter and Protein Interaction Prediction Analysis

To gain further insight into the litchi LcSPL genes family, we analyzed the cis-elements 2 kb upstream of the promoter region of LcSPL genes using the PlantCARE website. They are divided into four categories, including light-responsive (G-box, ATCT motif, AE-box, Gap-box, TCT-motif, GATA motif, and box-4), stress-responsive elements (MBS, TC-rich repeats, LTR, STRE, F-box, and WUN-motif), phytohormone-responsive elements (ABRE, GARE-motif, TGA-element, TGACG-motif, TCA-elements, ERE, and CGTCA-motif), and plant growth and development-responsive elements (CAT-box, HD-ZIP1, GCN4-motif, AAGAA-motif, and O2-site) (Figure 7). The result showed that the largest category of cis-elements was light-responsive elements (222), followed by phytohormone-responsive elements (162). Although various motifs have not yet been functionally evaluated, whether these motifs confer peculiar functional roles to LcSPLs remains to be further identified.
Gene homology and protein interaction networks were predicted using the STRING database with Arabidopsis as a reference to further determine the functional role of LcSPLs (Figure 8) (Table S2). The results showed that LcSPL14 and LcSPL15 interact with TK1B CCR44, which participates in the RNA anabolism process. LcSPL9 interacts with PRT1, which mediates target proteins’ ubiquitination and subsequent proteasomal degradation. On the other hand, anthocyanin can also be ubiquitinated and degraded by proteins [56].

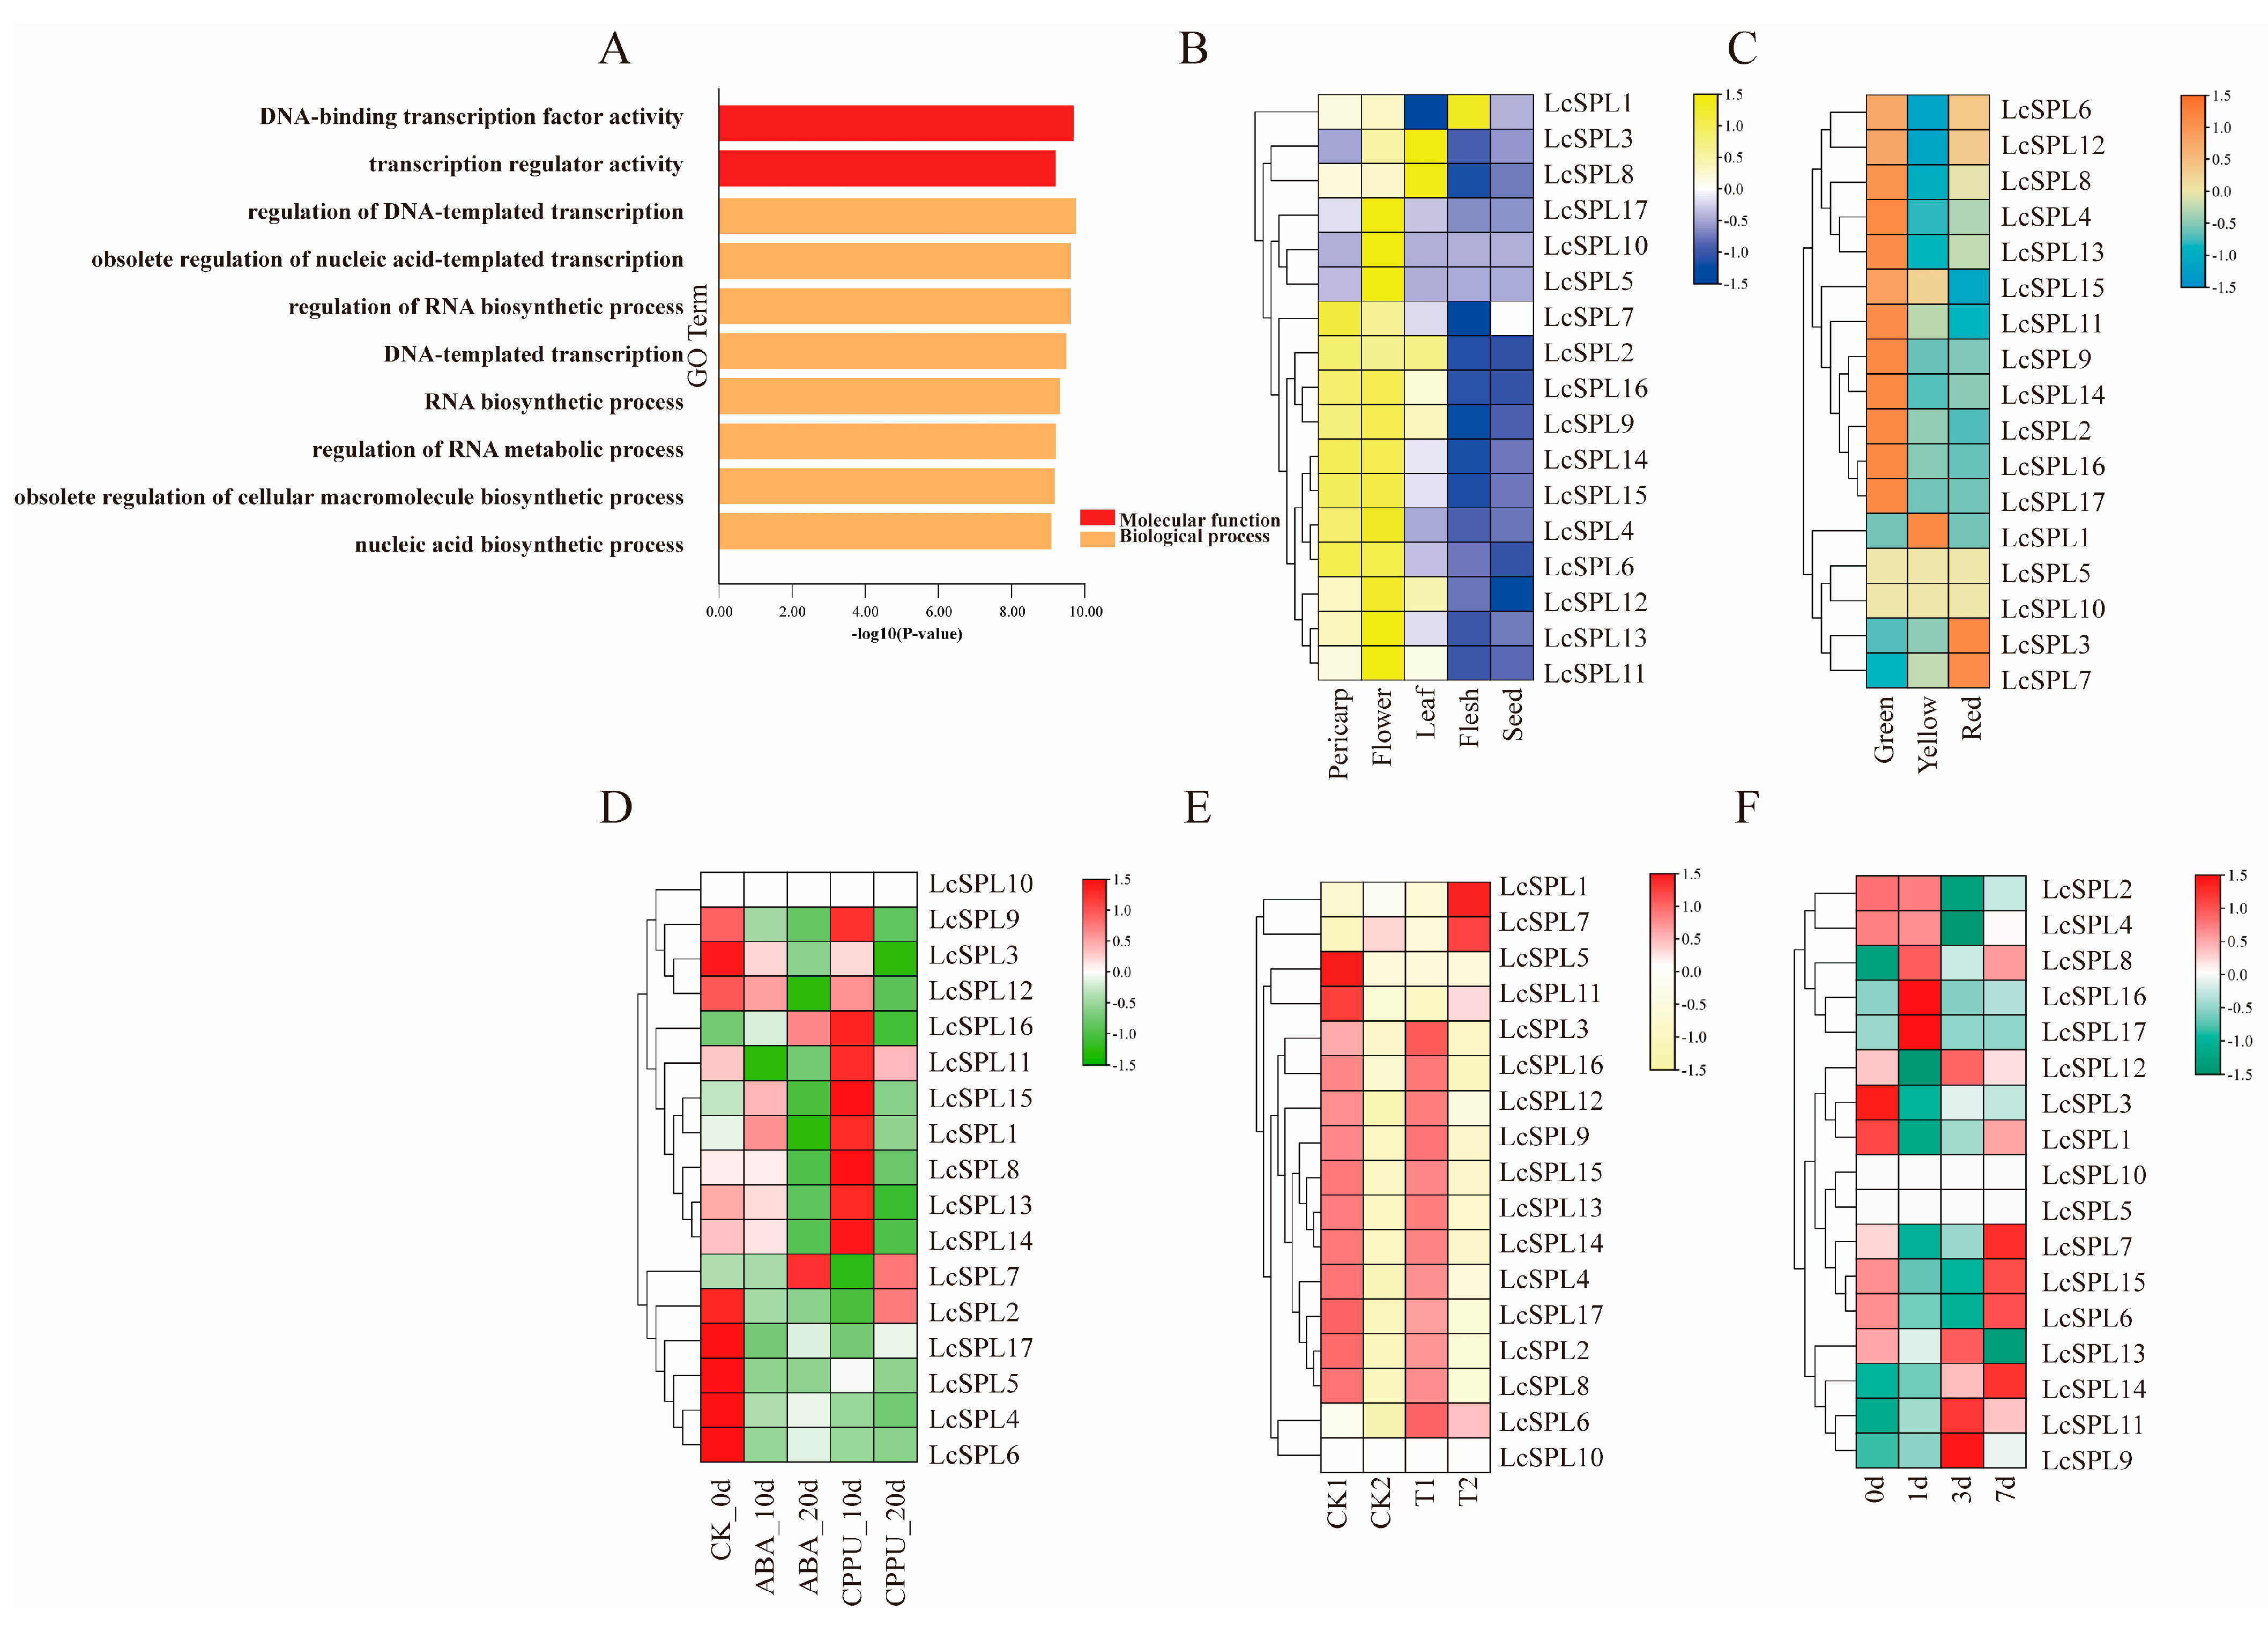
3.7. Gene Ontology (GO) Enrichment Analysis and Analysis of Expression Profile of LcSPL Genes

3.7.1. Gene Ontology (GO) Enrichment Analysis

GO enrichment analysis was performed to understand the functional role of LcSPLs in litchi growth and development (Figure 9A). The results showed that LcSPL genes mainly play a vital role in DNA–protein binding and transcriptional regulation. In biological processes, LcSPL genes are mainly involved in the regulation of DNA-templated transcription, the obsolete regulation of nucleic acid-templated transcription, the regulation of RNA biosynthetic process, DNA-templated transcription, RNA biosynthetic processes, the regulation of RNA metabolic processes, the regulation of cellular macromolecule biosynthetic processes, and nucleic acid biosynthetic processes.

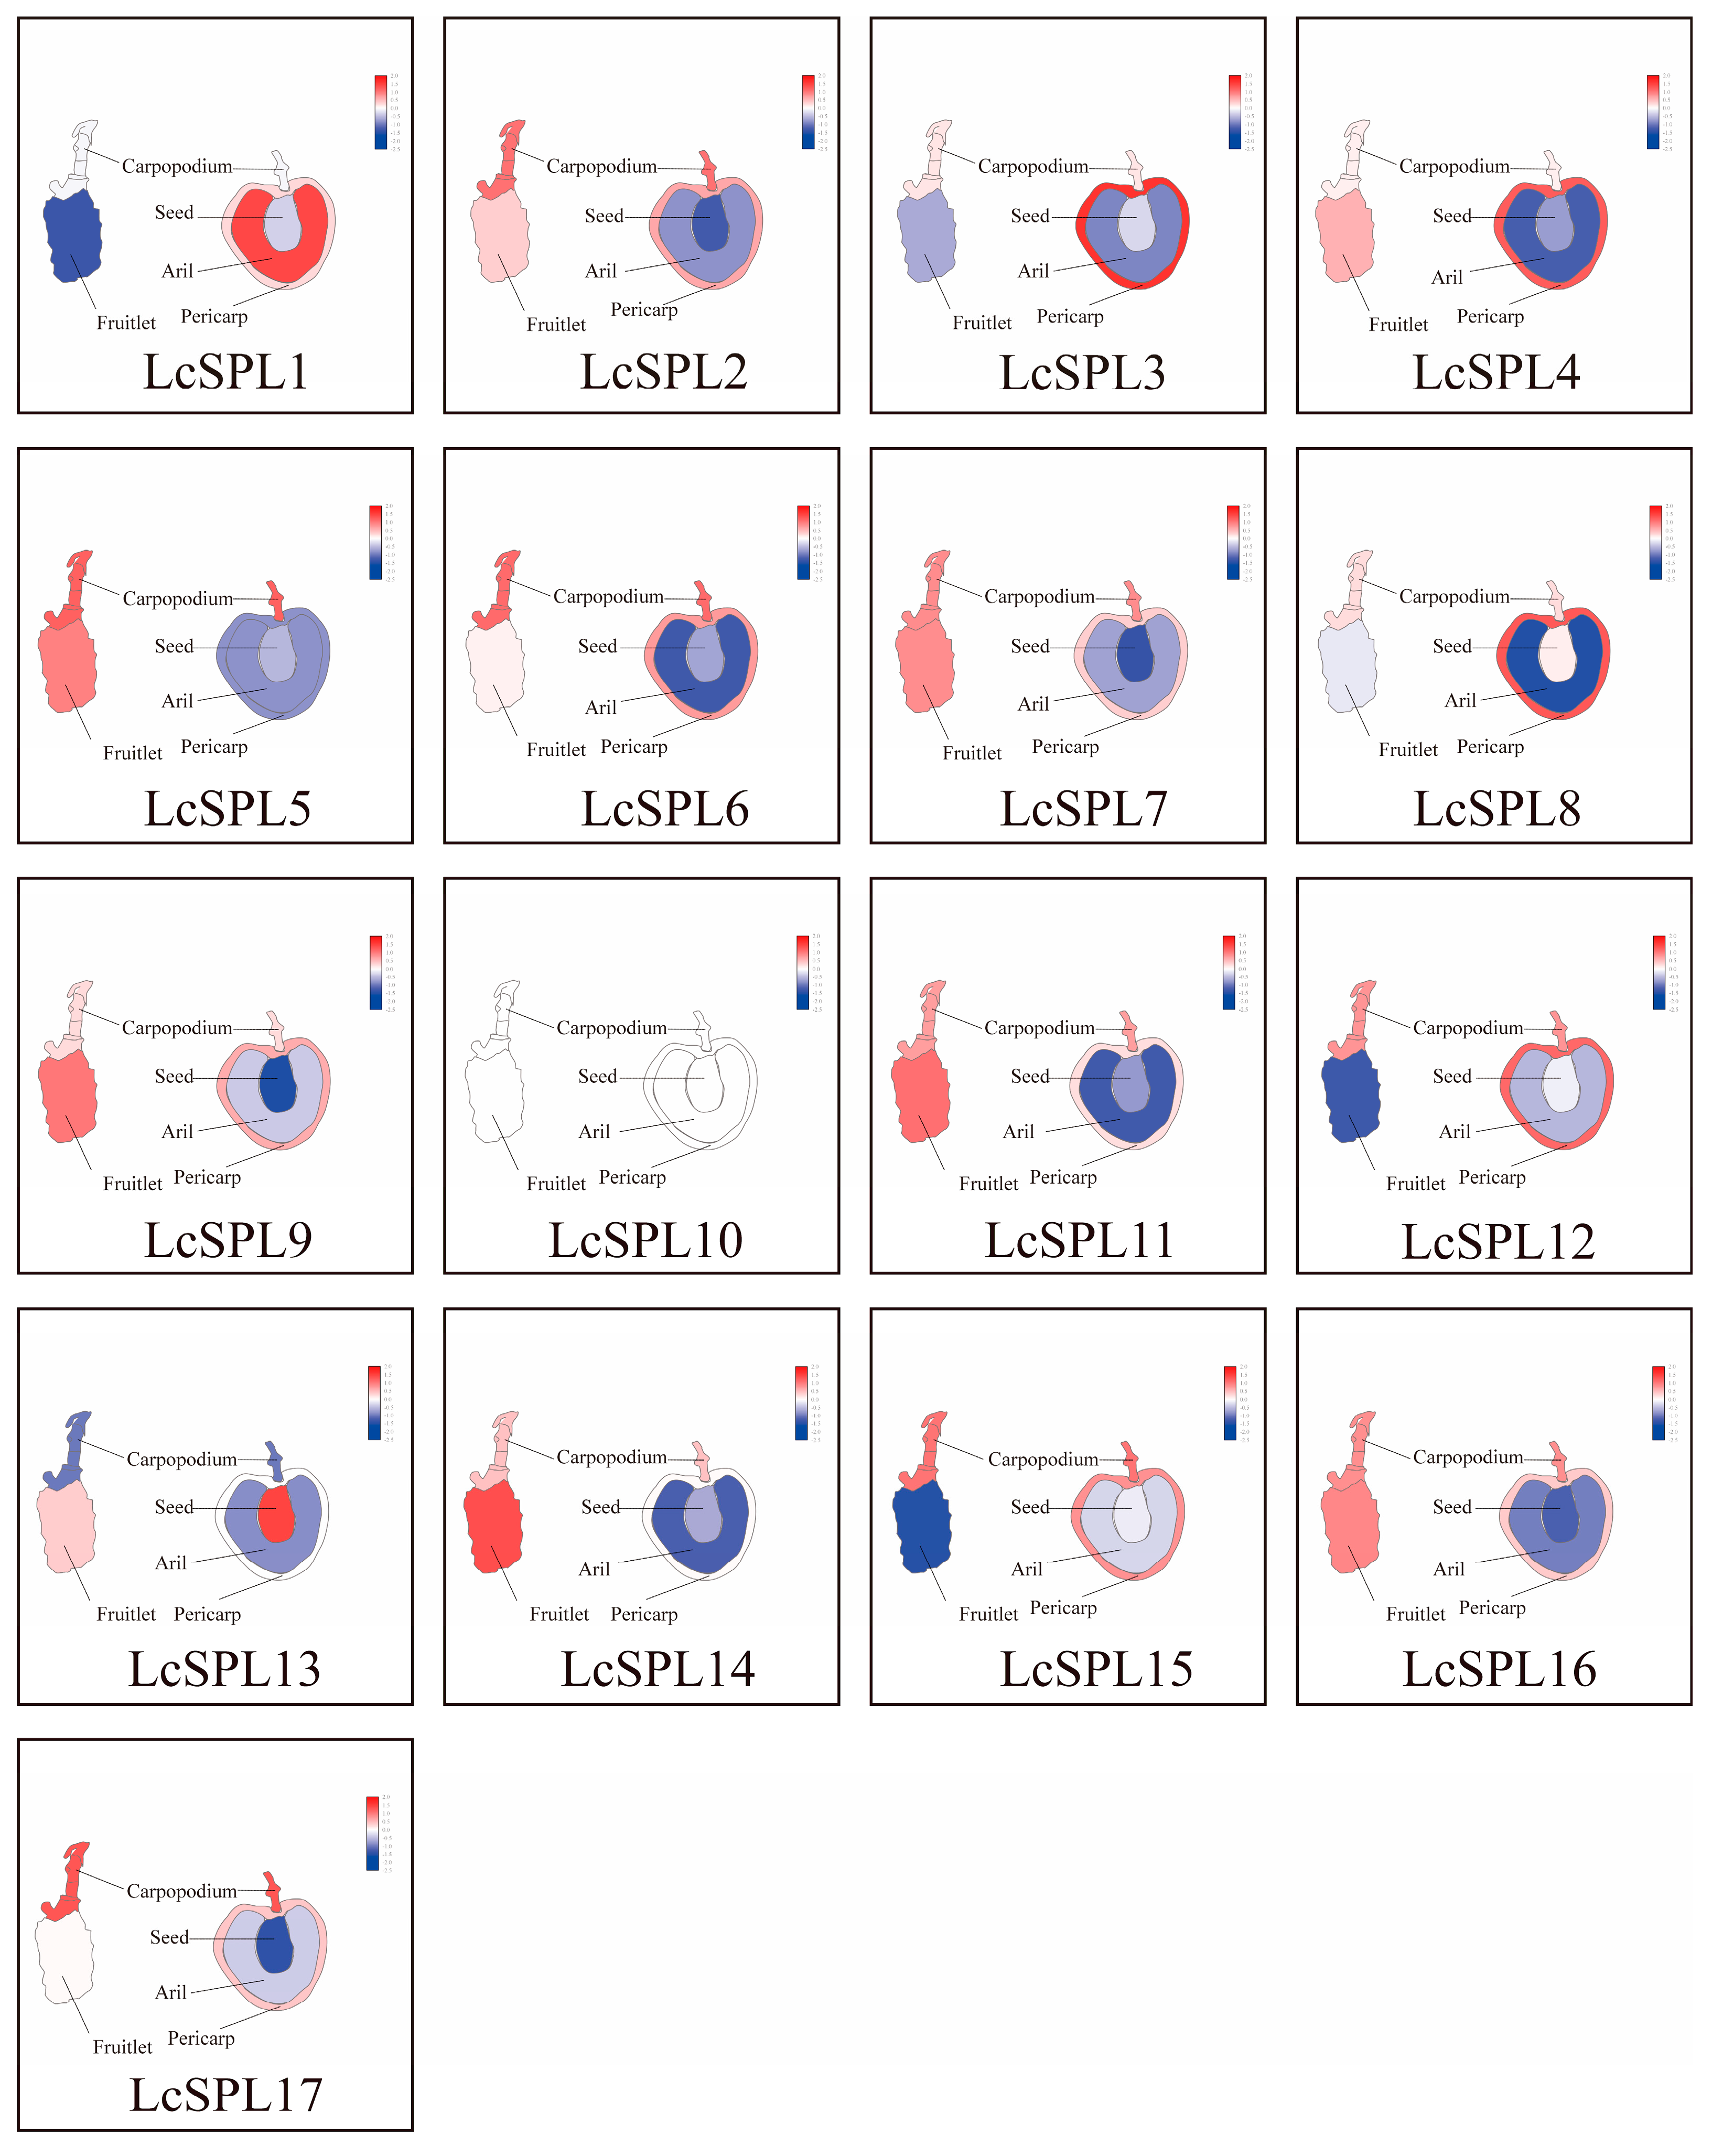
3.7.2. Expression Profiles of LcSPLs in Different Tissues and Fruit Organs in Litchi

To investigate the significant role of LcSPL genes, we evaluated tissue-specific expression patterns using RNA-seq data from ‘Feizixiao’ litchi. RNA-seq data revealed that LcSPL genes were differentially expressed in five tissues, including pericarp, flower, leaf, flesh, and seeds (Figure 9B) (Table S3). Thirteen LcSPLs (LcSPL1, LcSPL8, LcSPL7, LcSPL2, LcSPL16, LcSPL9, LcSPL14, LcSPL15, LcSPL4, LcSPL6, LcSPL12, LcSPL13, and LcSPL11) members were highly expressed in the pericarp, and seven LcSPLs (LcSPL3, LcSPL8, LcSPL2, LcSPL16, LcSPL9, LcSPL12, and LcSPL11) genes were highly expressed in leaves; one element (LcSPL1) was explicitly highly expressed in flesh and all members were highly expressed in flowers and lowly expressed in seeds.
Further, transcriptome analysis of three litchi cultivars, ‘Hehuadahongli’, ‘Nuomici’, and ‘Heiye’ revealed LcSPL gene expression patterns in carpopodium, aril, seed, pericarp, and fruitlet (Figure 9C) (Table S4) [43]. The results suggested that those 15 members of LcSPLs (LcSPL1, LcSPL2, LcSPL3, LcSPL4, LcSPL6, LcSPL7, LcSPL8, LcSPL9, LcSPL11, LcSPL12, LcSPL13, LcSPL14, LcSPL15, LcSPL16, and LcSPL17) were highly expressed in the pericarp, suggesting their role in litchi pericarp development or pericarp coloration.

3.7.3. Expression Profile of LcSPLs in Different Colored Pericarp Types

Compared to ‘Feizixiao’ litchi, we choose to analyze the RNA-seq data of ‘Nuomici’ litchi, which has more uniform and consistent fruit coloration (Figure 9C) (Table S5) [37,44]. The results showed that 12 LcSPL members (LcSPL6, LcSPL12, LcSPL8, LcSPL4, LcSPL13, LcSPL15, LcSPL11, LcSPL9, LcSPL14, LcSPL2, LcSPL16, and LcSPL17) were highly expressed in the green stage of the fruit, and they may play a role in the early stage of fruit coloration. The expression of LcSPL3 and LcSPL7 peaked with the red fruit color, which might function in the ripening process of ‘Nuomici’ litchi fruits.

3.7.4. Expression Profile Analysis of LcSPLs under Different Hormone Treatments

To investigate whether ABA (abscisic acid) and CPPU (N-(2-chloro-4-pyridyl)-N′-phenylurea) treatments are responsible for ‘Feizixiao’ litchi pericarp coloration. We found that LcSPL7 responded significantly after 20 days of ABA treatment and may play a significant role in promoting the anthocyanin biosynthesis of litchi pericarp. At that time, the expression patterns of LcSPL9, LcSPL16, LcSPL11, LcSPL15, LcSPL1, LcSPL8, LcSPL13, and LcSPL14 increased significantly after 10 days of CPPU treatment when compared to the control (CK). Together, these results suggest that genes responsive to CPPU treatment participate in the inhibition of CPPU-regulated anthocyanin biosynthesis (Figure 9D) (Table S6).
In order to further understand the effect of LcSPL genes on litchi pericarp coloration. We observed a significant inhibitory effect of ‘Feizixiao’ litchi pericarp color relating to the exogenous application of CPPU (Figure 9E) (Table S7). Compared with the all-green fruit stage (small fruit stage), the expression of eleven genes (LcSPL3, LcSPL16, LcSPL12, LcSPL9, LcSPL15, LcSPL13, LcSPL14, LcSPL4, LcSPL17, LcSPL2, and LcSPL8) was downregulated in both the CK group and the CPPU-treated group in the best-eat period, and the expression of two genes was upregulated. Furthermore, the expression of LcSPL2, LcSPL8, LcSPL9, LcSPL12, LcSPL13, LcSPL14, and LcSPL15 was significantly decreased in comparison with the control group, suggesting the essential role of the exogenous CPPU treatment on litchi pericarp color inhibition. The expression of LcSPL1 and LcSPL7 genes were both upregulated (1.24 times and 1.71 times in the CK group; 2.04 times and 2.03 times in the CPPU-treated group). Surprisingly, the expression of LcSPL1 and LcSPL7 was higher in the CPPU-treated group than in the CK group during the best-eat period, which may be associated with the regulatory mechanisms triggered by the exogenous CPPU treatment (the best-eat period is not consistent with the period in which CPPU has an effect), which may include the activation of anthocyanin biosynthesis and the inhibition of chlorophyll degradation of the pericarp coloration-related gene network [45].

3.7.5. Expression Profile Analysis of LcSPLs Released from Shade Conditions

In different periods of ‘Faizixiao’ litchi use after the shading treatment was lifted, LcSPL9, LcSPL11, and LcSPL14 responded significantly to just lifting the shading treatment for 3d, with significant growth in expression. LcSPL14, LcSPL7, LcSPL15, and LcSPL6 were highly expressed in response to the lifting of the shading treatment after 7d (Figure 9F) (Table S8). The results indicate that these LcSPLs may be critical genes involved in the light regulation process and play an essential role in promoting anthocyanin biosynthesis or inhibiting chlorophyll degradation in litchi pericarp [46]. In addition, LcSPL3, LcSPL1, and LcSPL13 were highly expressed at 0d, and the expression levels decreased after lifting the shading treatment, which may inhibit anthocyanin synthesis (Figure 10).

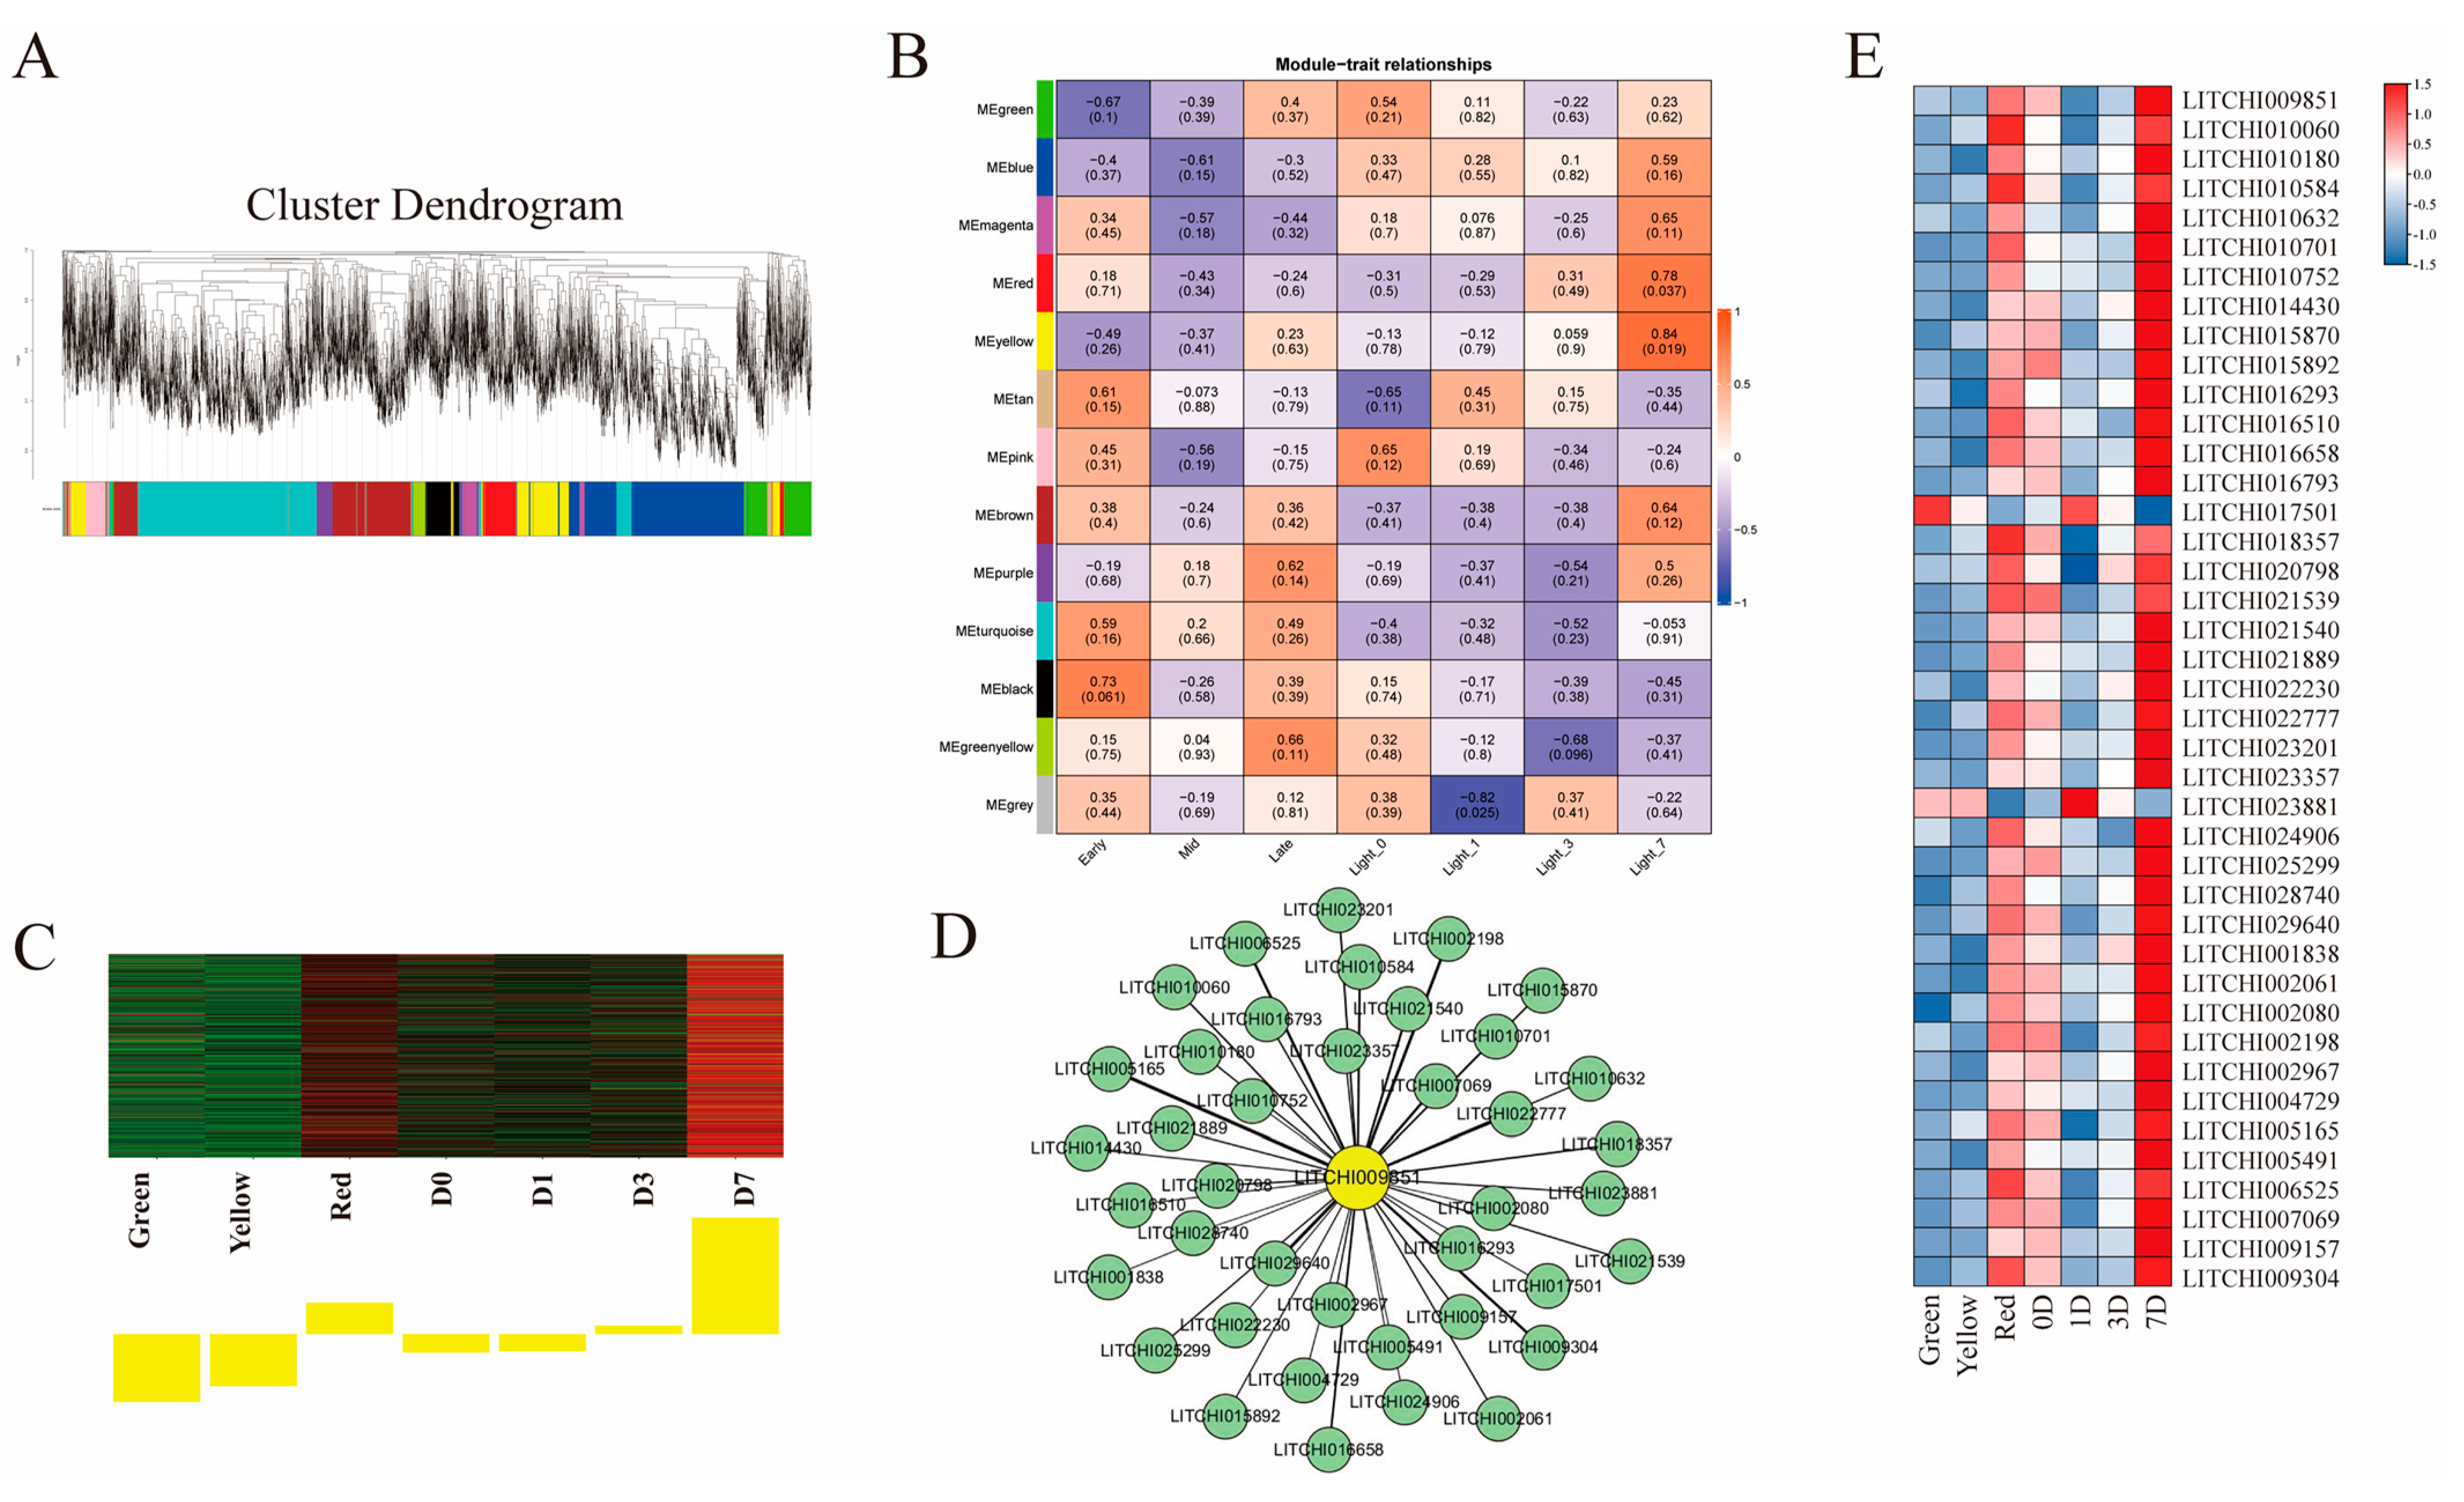
3.8. Co-Expression Analysis of Key LcSPL Genes

To further explore the regulatory mechanisms of anthocyanin biosynthesis in litchi. WGCNA was used to screen 8000 differential genes, construct gene co-expression modules and screen essential SPL genes based on the correlation of the gene modules with the phenotypic samples. In this study, a total of 13 co-expression modules were generated (Figure 11A), each of which contained both positively and negatively correlated genes, and the yellow module showed a very high positive correlation with the Light_7 group (r = 0.7, p = 2.1 × 10 − 120) (Figure 11B). In addition, the yellow module showed higher positive expression of significance values in red and Light_7 samples. It was hypothesized that the genes in the yellow module might be involved in the anthocyanin synthesis of litchi during the ripening stage (Figure 11C). The analysis also revealed that LcSPL7 (LITCHI009851) had a high expression pattern (Figure 11D,E; Tables S9 and S10). We observed a high positive correlation between the hub LcSPL7 and 38 genes and a negative correlation with 2 genes (LITCHI017501 and LITCHI023881), which were described as LHCA6 and SPA, according to the annotations. It might be an important component of chlorophyll synthesis. Some previous studies have reported that the chlorophyll changes inversely with anthocyanin biosynthesis during litchi ripening. The LcSPL7 gene may be critical in anthocyanin synthesis during litchi ripening.

4. Discussion

Litchi is known as one of the kings of fruit and is native to China’s Fujian and Guangdong regions [34]. Its bright color, aroma, taste, and high nutritive value make it attractive to consumers. The bright red color of litchi fruit is considered a central attribute in terms of the quality of litchi fruit and marketing, emphasizing the need to uncover the underlying molecular mechanism involved in anthocyanin biosynthesis. SPL genes have significant functional roles in fruit coloration in many plant species [15]. Here, through genome-wide analysis, we identified 17 LcSPL in the litchi genome, and these genes were clustered into eight groups, with 17 AtSPL genes from Arabidopsis [57]. Similar groups of SPL genes have been reported in tomato [17], rapeseed (Brassica napus) [49], and grapevine [18].
In this study, evolutionary analysis, gene structure, and sequence alignment revealed similar taxonomic relationships in litchi. Each LcSPL gene contains an SBP domain, whereas LcSPL1, LcSPL6, and LcSPL7 also contain an Ank domain. LcSPL14 and LcSPL15 genes have multiple motifs with very high sequence similarity, possibly due to internal tandem duplications in the same chromosome. In addition, target prediction identified 10 LcSPL genes with miR156 target sites that may function in the miR156-SPL module. Tandem and segmental duplications are the main modes of gene family amplification [58]. Gene duplication and syntenic analysis of litchi identified seven segmental and two tandem duplications. Segmental duplications were found in every group except for Group I and Group III, and it was obvious that segmental duplications (64.7%) contributed much more than tandem duplications, which was also confirmed in maize [59], rice [16], wheat (Triticum aestivum) [50], and alfalfa (Medicago sativa) [60]. The results of interspecies collinearity analysis illustrated that LcSPLs had more colinear gene pairs with Arabidopsis and tomato than with rice and maize, verifying that litchi is a dicotyledonous plant. In addition, the number of covariances between LcSPLs with rambutan and longan was much higher than that with Arabidopsis and tomato, suggesting that the evolutionary relationships between litchi, longan, and rambutan and their similarity are highly conserved.
In general, gene expression patterns are closely related to biological functions. Tissue-specific RNA-seq data analysis of the litchi exposed significant changes in LcSPL gene expression. In total, thirteen LcSPL genes were highly expressed in the pericarp, and three LcSPL genes were expressed in the leaves. The results of cis-acting element analysis indicated that LcSPL2 contained an abundance of light-responsive elements and predicted that LcSPL2 may significantly impact leaf morphogenesis and life activities, such as photosynthesis. It has been reported that AtSPL9 [28], PpSPL13 [19], VvSPL8, and VvSPL13 [9] were regulated in response to miR156, which is involved in forming MBW complexes by interfering with the MBW complex. Further, phylogenetics revealed that litchi LcSPL5 and LcSPL17 were clustered with these genes in the same group, demonstrating their role in fruit coloration. According to the results, LcSPL5 and LcSPL17 were not expressed in the litchi pericarp. The gene structure analysis showed that the extended 3’UTR region of the LcSPL17 gene may affect its expression in the pericarp. In contrast, we did not find any growth and development related to cis-elements in LcSPL5, but it is undeniable that it is still a primary factor for SPL gene expansion due to species-specificity in litchi.
RNA-Seq data from different developmental stages of litchi showed that 12 LcSPL genes were highly expressed in the green stage of the pericarp, whereas LcSPL3 and LcSPL7 showed high expression during the ripening stage of the pericarp. The coloration of litchi pericarp is due to the gradual degradation of chlorophyll and the gradual synthesis and accumulation of anthocyanins [61]. Previous studies have shown that light and ABA promotes the accumulation of anthocyanins in the pericarp, while CPPU slows down chlorophyll breakdown and inhibits anthocyanin accumulation, thereby delaying coloration [37]. Additionally, data obtained after exogenous t ABA and CPPU treatments demonstrated that LcSPL9, LcSPL15, LcSPL8, LcSPL13, and LcSPL14 might inhibit chlorophyll degradation or anthocyanin synthesis in response to CPPU signaling, whereas LcSPL7 was the only gene identified that may promote anthocyanin synthesis in response to ABA signaling. In grapes, ABA signaling-regulated TF VvAREB2 directly binds to the MIR156b promoter and activates its expression, thus repressing the expression of downstream VvSBP8 and VvSBP13 and subsequently inhibiting their ability to interfere with MBW repeat transcription complex formation [9].
Interestingly, neither litchi LcSPL7 nor LcSPL1 and LcSPL6 possess the target site of miR156, but both possess the Ank domain. GO analysis suggested that the LcSPL genes perform their biological functions mainly by affecting other molecular proteins. The results of WGCNA show that LcSPL7 may affect two genes (LHCA6 and SPA) and play significant roles in anthocyanin synthesis and chlorophyll degradation. These results revealed that LcSPL7 might act independently of the miR156-SPL and MBW modules to promote litchi pericarp coloration.
In addition, we found that PpSPL10 clustered with LcSPL9 and LcSPL16, which have been reported to inhibit anthocyanin synthesis in pear [19]. Our protein interaction prediction results demonstrated that LcSPL9 and LcSPL16 may interact with PRT1 protein, which can participate in protein ubiquitination and degradation processes in the post-transcriptional regulation of anthocyanin synthesis, thus inhibiting anthocyanin accumulation [56]. The papaya CpSPL1 gene mediates fruit softening and carotenoid accumulation by repressing CpPME1/2 and CpPDS4 [51], whereas LcSPL8 is evolutionarily closest to CpSBP1; whether LcSPL8 affects litchi pericarp coloration mainly through carotenoids or anthocyanins needs to be further explored. Previous studies have explained that LcSPL1 is bound to LcMYB1 and negatively regulates anthocyanin biosynthesis [62]. By comparison, we found that LcSPL1’s homologous gene, LcSPL13 (95.3% similarity), was also highly expressed in response to CPPU treatment, acting as an inhibitor of anthocyanin synthesis. The RNA-Seq data of litchi released from shade treatment revealed that four genes, LcSPL14, LcSPL7, LcSPL15, and LcSPL6, were highly expressed in response to the release of shade treatment for 7 days and may be instrumental in fruit anthocyanin synthesis or chlorophyll degradation. LcSPL14 and LcSPL15 have been identified as tandem duplication events on the chromosome; thus, whether these highly similar genes affect pericarp coloration in terms of gene dosages needs further study.
In summary, through genome-wide identification and bioinformatics analysis, we successfully identified 17 members of the LcSPL family and predicted their potential functions by analyzing their physicochemical properties, structures, evolutionary relationships, gene duplications, and protein interaction predictions. In addition, we conducted an in-depth study on the expression patterns of LcSPL genes. We found that some LcSPL genes showed significant expression differences under hormone treatment, suggesting they may be necessary for regulating anthocyanin biosynthesis in response to hormone signals. In particular, we observed that LcSPL7 strongly responded to ABA and light signals and had an opposite expression pattern to that of LHCA6 and SPA proteins, indicating that they may be critical regulators of the regulatory pathway of anthocyanin metabolism. These findings provide valuable insights into the functional study of LcSPL genes and important clues for further research on the regulatory mechanisms, signaling networks, and genetic improvement of LcSPL genes in litchi pericarp coloring.

5. Conclusions

The LcSPL genes were characterized using a comprehensive analysis of their phylogenetic relationship, conserved motifs, gene structure, chromosomal location, physiochemical properties, miR156 target sites, duplication events, cis-elements, protein-protein predictions, GO enrichment, expression profile, and evolutionary relationship. This study reports the identification of 17 LcSPL genes of the litchi genome. The results showed that 17 LcSPLs and 16 AtSPLs clustered into eight groups. Target site prediction revealed that miR156 binds to the 3’ end of some members. The expression pattern and molecular biological functions were determined via RNA-seq and GO analysis, which revealed the promotion or inhibition of LcSPL genes in anthocyanin synthesis in litchi pericarp. In addition, WGCNA-weighted network analysis using RNA-Seq data further identified the specific functions of LcSPL7. This work provides a comprehensive study of LcSPL genes in anthocyanin synthesis in litchi pericarp, which is of great significance for exploring its role in future fruit coloring and quality control.

Supplementary Materials

The following supporting information can be downloaded at: https://www.mdpi.com/article/10.3390/horticulturae10070762/s1, Figure S1: Distribution of conserved motifs in pineapple litchi SPL proteins. Table S1: Plant materials used for RNA-Seq [22,23,24,25]. Table S2: Information on proteins interacting with LcSPLs among the protein regulatory networks. Table S3: Expression profile of LcSPL genes in different tissues of litchi. Table S4: Expression profile of LcSPL genes in different litchi fruit organs. Table S5: Expression profile of LcSPL genes in different colored pericarp types. Table S6: Expression profile of LcSPL genes under ABA and CPPU treatments. Table S7: Expression profile of LcSPL genes under CPPU treatments. Table S8: Expression profile of LcSPL genes released from shade conditions. Table S9: Co-expression genes of LcSPL7. Table S10: Expression profile of LcSPL7 and co-expression genes. Text S1: Sequence files used in this article.

Author Contributions

Writing—original draft preparation, Z.X. and J.W.; Methodology, Z.C. and Y.C.; Data curation and Software, Z.X. and X.J.; Writing—review and editing, F.S.K. and Y.C.; Supervision: H.Z., and Y.W.; Conceptualization, H.Z. and Y.W.; Resources and Investigation, Z.X. and Z.C.; Funding acquisition: H.Z. All authors have read and agreed to the published version of the manuscript.

Funding

The project was funded by the major science and technology project of Hainan Province (ZDKJ2021006) and Key R&D Project of Hainan Province in 2023 (ZDYF2023XDNY052). Key Laboratory of Tropical Fruit Tree Biology of Hainan Province open project in 2023 (HAAS2023PT0205). Priming Scientific Research Foundation of Hainan University (KYQD (ZR)-20090).

Data Availability Statement

The original contributions presented in the study are included in the article and Supplementary Materials, further inquiries can be directed to the corresponding authors.

Conflicts of Interest

The authors declare no conflicts of interest.

References

  1. Gong, W.; Shen, Y.-P.; Ma, L.-G.; Pan, Y.; Du, Y.-L.; Wang, D.-H.; Yang, J.-Y.; Hu, L.-D.; Liu, X.-F.; Dong, C.-X. Genome-wide ORFeome cloning and analysis of Arabidopsis transcription factor genes. Plant Physiol. 2004, 135, 773–782. [Google Scholar] [CrossRef] [PubMed]
  2. Shafique Khan, F.; Zeng, R.-F.; Gan, Z.-M.; Zhang, J.-Z.; Hu, C.-G. Genome-wide identification and expression profiling of the WOX gene family in Citrus sinensis and functional analysis of a CsWUS member. Int. J. Mol. Sci. 2021, 22, 4919. [Google Scholar] [CrossRef] [PubMed]
  3. Khan, F.S.; Goher, F.; Hu, C.-G.; Zhang, J.-Z. WUSCHEL-related homeobox (WOX) transcription factors: Key regulators in combating abiotic stresses in plants. Hortic. Adv. 2024, 2, 2. [Google Scholar] [CrossRef]
  4. Hu, L.; Chen, W.; Yang, W.; Li, X.; Zhang, C.; Zhang, X.; Zheng, L.; Zhu, X.; Yin, J.; Qin, P. OsSPL9 regulates grain number and grain yield in rice. Front. Plant Sci. 2021, 12, 682018. [Google Scholar] [CrossRef] [PubMed]
  5. Wu, G.; Poethig, R.S. Temporal regulation of shoot development in Arabidopsis thaliana by miR156 and its target SPL3. Development 2006, 133, 3539–3547. [Google Scholar] [CrossRef] [PubMed]
  6. Yamaguchi, A.; Wu, M.-F.; Yang, L.; Wu, G.; Poethig, R.S.; Wagner, D. The microRNA-regulated SBP-Box transcription factor SPL3 is a direct upstream activator of LEAFY, FRUITFULL, and APETALA1. Dev. Cell 2009, 17, 268–278. [Google Scholar] [CrossRef] [PubMed]
  7. Zeng, X.; Chen, R.; Shi, Y.; Gai, C.; Fan, K.; Li, Z. Research Advances in Biological Functions of Plant SPL Transcription Factors. Chin. Bull. Bot. 2023, 58, 982–997. [Google Scholar]
  8. Cui, L.; Zheng, F.; Wang, J.; Zhang, C.; Xiao, F.; Ye, J.; Li, C.; Ye, Z.; Zhang, J. miR156a-targeted SBP-Box transcription factor SlSPL13 regulates inflorescence morphogenesis by directly activating SFT in tomato. Plant Biotechnol. J. 2020, 18, 1670–1682. [Google Scholar] [CrossRef]
  9. Guo, S.; Zhang, M.; Feng, M.; Liu, G.; Torregrosa, L.; Tao, X.; Ren, R.; Fang, Y.; Zhang, Z.; Meng, J. miR156b-targeted VvSBP8/13 functions downstream of the abscisic acid signal to regulate anthocyanins biosynthesis in grapevine fruit under drought. Hortic. Res. 2024, 11, uhad293. [Google Scholar] [CrossRef]
  10. Xu, Y.; Xu, H.; Wall, M.M.; Yang, J. Roles of transcription factor SQUAMOSA promoter binding protein-like gene family in papaya (Carica papaya) development and ripening. Genomics 2020, 112, 2734–2747. [Google Scholar] [CrossRef]
  11. Jiao, Y.-Q.; Wang, Y.-H.; Xue, D.-W.; Wang, J.; Yan, M.-X.; Liu, G.-F.; Dong, G.-J.; Zeng, D.-L.; Lu, Z.-F.; Zhu, X.-D. Regulation of OsSPL14 by OsmiR156 defines ideal plant architecture in rice. Nat. Genet. 2010, 42, 541–544. [Google Scholar] [CrossRef] [PubMed]
  12. Yang, Z.-F.; Wang, X.-F.; Gu, S.-L.; Hu, Z.-Q.; Xu, H.; Xu, C.-W. Comparative study of SBP-box gene family in Arabidopsis and rice. Gene 2008, 407, 1–11. [Google Scholar] [CrossRef] [PubMed]
  13. Chen, W.; Wu, H.; Chen, Y. Gene duplications and functional divergence analyses of the SPL gene family. J. Nanjing For. Univ. 2020, 44, 55–66. [Google Scholar]
  14. Birkenbihl, R.P.; Jach, G.; Saedler, H.; Huijser, P. Functional dissection of the plant-specific SBP-domain: Overlap of the DNA-binding and nuclear localization domains. J. Mol. Biol. 2005, 352, 585–596. [Google Scholar] [CrossRef] [PubMed]
  15. Cardon, G.; Höhmann, S.; Klein, J.; Nettesheim, K.; Saedler, H.; Huijser, P. Molecular characterisation of the Arabidopsis SBP-box genes. Gene 1999, 237, 91–104. [Google Scholar] [CrossRef] [PubMed]
  16. Xie, K.; Wu, C.; Xiong, L. Genomic organization, differential expression, and interaction of SQUAMOSA promoter-binding-like transcription factors and microRNA156 in rice. Plant Physiol. 2006, 142, 280–293. [Google Scholar] [CrossRef] [PubMed]
  17. Salinas, M.; Xing, S.; Höhmann, S.; Berndtgen, R.; Huijser, P. Genomic organization, phylogenetic comparison and differential expression of the SBP-box family of transcription factors in tomato. Planta 2012, 235, 1171–1184. [Google Scholar] [CrossRef] [PubMed]
  18. Hou, H.; Li, J.; Gao, M.; Singer, S.D.; Wang, H.; Mao, L.; Fei, Z.; Wang, X. Genomic organization, phylogenetic comparison and differential expression of the SBP-box family genes in grape. PLoS ONE 2013, 8, e59358. [Google Scholar] [CrossRef] [PubMed]
  19. Qian, M.; Ni, J.; Niu, Q.; Bai, S.; Bao, L.; Li, J.; Sun, Y.; Zhang, D.; Teng, Y. Response of miR156-SPL module during the red peel coloration of bagging-treated Chinese sand pear (Pyrus pyrifolia Nakai). Front. Physiol. 2017, 8, 550. [Google Scholar] [CrossRef]
  20. Shao, F.-j.; Lu, Q.; Wilson, I.W.; Qiu, D.-y. Genome-wide identification and characterization of the SPL gene family in Ziziphus jujuba. Gene 2017, 627, 315–321. [Google Scholar] [CrossRef]
  21. Zhou, Q.; Zhang, S.; Chen, F.; Liu, B.-J.; Wu, L.; Li, F.; Zhang, J.-Q.; Bao, M.-Z.; Liu, G.-F. Genome-wide identification and characterization of the SBP-box gene family in Petunia. BMC Genom. 2018, 19, 193. [Google Scholar] [CrossRef] [PubMed]
  22. Tripathi, R.K.; Goel, R.; Kumari, S.; Dahuja, A. Genomic organization, phylogenetic comparison, and expression profiles of the SPL family genes and their regulation in soybean. Dev. Genes Evol. 2017, 227, 101–119. [Google Scholar] [CrossRef] [PubMed]
  23. Li, C.-L.; Lu, S.-F. Molecular characterization of the SPL gene family in Populus trichocarpa. BMC Plant Biol. 2014, 14, 131. [Google Scholar] [CrossRef] [PubMed]
  24. Chen, G.-S.; Li, J.-T.; Liu, Y.; Zhang, Q.; Gao, Y.-R.; Fang, K.-F.; Cao, Q.-Q.; Qin, L.; Xing, Y. Roles of the GA-mediated SPL gene family and miR156 in the floral development of Chinese chestnut (Castanea mollissima). Int. J. Mol. Sci. 2019, 20, 1577. [Google Scholar] [CrossRef] [PubMed]
  25. Schwab, R.; Palatnik, J.F.; Riester, M.; Schommer, C.; Schmid, M.; Weigel, D. Specific effects of microRNAs on the plant transcriptome. Dev. Cell 2005, 8, 517–527. [Google Scholar] [CrossRef] [PubMed]
  26. Samad, A.F.; Sajad, M.; Nazaruddin, N.; Fauzi, I.A.; Murad, A.M.; Zainal, Z.; Ismail, I. MicroRNA and transcription factor: Key players in plant regulatory network. Front. Plant Sci. 2017, 8, 565. [Google Scholar] [CrossRef] [PubMed]
  27. Cho, E.; Seddon, J.M.; Rosner, B.; Willett, W.C.; Hankinson, S.E. Prospective study of intake of fruits, vegetables, vitamins, and carotenoidsand risk of age-related maculopathy. Arch. Ophthalmol. 2004, 122, 883–892. [Google Scholar] [CrossRef] [PubMed]
  28. Gou, J.; Felippes, F.; Liu, C.; Weigel, D.; Wang, J. Negative regulation of anthocyanin biosynthesis in Arabidopsis by a miR156-targeted SPL transcription factor. Plant Cell 2011, 23, 1512–1522. [Google Scholar] [CrossRef] [PubMed]
  29. Luo, Q.-J.; Mittal, A.; Jia, F.; Rock, C.D. An autoregulatory feedback loop involving PAP1 and TAS4 in response to sugars in Arabidopsis. Plant Mol. Biol. 2012, 80, 117–129. [Google Scholar] [CrossRef]
  30. Munusamy, P.; Zolotarov, Y.; Meteignier, L.-V.; Moffett, P.; Strömvik, M.V. De novo computational identification of stress-related sequence motifs and microRNA target sites in untranslated regions of a plant translatome. Sci. Rep. 2017, 7, 43861. [Google Scholar] [CrossRef]
  31. Rhoades, M.W.; Reinhart, B.J.; Lim, L.P.; Burge, C.B.; Bartel, B.; Bartel, D.P. Prediction of plant microRNA targets. Cell 2002, 110, 513–520. [Google Scholar] [CrossRef] [PubMed]
  32. Wang, Y.; Liu, W.; Wang, X.; Yang, R.; Wu, Z.; Wang, H.; Wang, L.; Hu, Z.; Guo, S.; Zhang, H. MiR156 regulates anthocyanin biosynthesis through SPL targets and other microRNAs in poplar. Hortic. Res. 2020, 7, 118. [Google Scholar] [CrossRef]
  33. Li, H.; Wang, S.; Zhai, L.; Cui, Y.; Tang, G.; Huo, J.; Li, X.; Bian, S. The miR156/SPL12 module orchestrates fruit colour change through directly regulating ethylene production pathway in blueberry. Plant Biotechnol. J. 2024, 22, 386–400. [Google Scholar] [CrossRef]
  34. Singh, S.K.; Marboh, E.; Nath, V. Litchi. In Fruit and Nut Crops; Springer: Berlin/Heidelberg, Germany, 2023; pp. 1–28. [Google Scholar]
  35. Ghosh, S. World trade in litchi: Past, present and future. In Proceedings of the I International Symposium on Litchi and Longan, Guangzhou, China, 16 June 2000; Volume 558, pp. 23–30. [Google Scholar]
  36. Underhill, S.; Critchley, C. Anthocyanin decolorisation and its role in lychee pericarp browning. Aust. J. Exp. Agric. 1994, 34, 115–122. [Google Scholar] [CrossRef]
  37. Wei, Y.-Z.; Hu, F.-C.; Hu, G.-B.; Li, X.-J.; Huang, X.-M.; Wang, H.-C. Differential expression of anthocyanin biosynthetic genes in relation to anthocyanin accumulation in the pericarp of Litchi chinensis Sonn. PLoS ONE 2011, 6, e19455. [Google Scholar] [CrossRef] [PubMed]
  38. Li, J.; Wang, H.; Zhou, B.; Zhao, M.; Li, C.; Xia, R.; Huang, X. Research advances in physiology and molecular biology of flower and fruit development in litchi. J. South China Agric. Univ. 2019, 40, 119–127. [Google Scholar]
  39. Li, J.; Chen, C.; Zeng, Z.; Wu, F.; Feng, J.; Liu, B.; Mai, Y.; Chu, X.; Wei, W.; Li, X. SapBase (Sapinaceae Genomic DataBase): A central portal for functional and comparative genomics of Sapindaceae species. bioRxiv 2022. bioRvix:2022.2011. 2025.517904. [Google Scholar]
  40. Chen, C.; Chen, H.; Zhang, Y.; Thomas, H.R.; Frank, M.H.; He, Y.; Xia, R. TBtools: An integrative toolkit developed for interactive analyses of big biological data. Mol. Plant 2020, 13, 1194–1202. [Google Scholar] [CrossRef]
  41. Cantalapiedra, C.P.; Hernández-Plaza, A.; Letunic, I.; Bork, P.; Huerta-Cepas, J.; Tamura, K. eggNOG-mapper v2: Functional Annotation, Orthology Assignments, and Domain Prediction at the Metagenomic Scale. Mol. Biol. Evol. 2021, 38, 5825–5829. [Google Scholar] [CrossRef]
  42. Chen, C.; Wu, Y.; Li, J.; Wang, X.; Zeng, Z.; Xu, J.; Liu, Y.; Feng, J.; Chen, H.; He, Y. TBtools-II: A one for all, all for one” bioinformatics platform for biological big-data mining. Mol. Plant 2023, 16, 1733–1742. [Google Scholar] [CrossRef]
  43. Li, C.; Wang, Y.; Huang, X.; Li, J.; Wang, H.; Li, J. De novo assembly and characterization of fruit transcriptome in Litchi chinensis Sonn and analysis of differentially regulated genes in fruit in response to shading. BMC Genom. 2013, 14, 552. [Google Scholar] [CrossRef] [PubMed]
  44. Lai, B.; Hu, B.; Qin, Y.; Zhao, J.; Wang, H.; Hu, G. Transcriptomic analysis of Litchi chinensis pericarp during maturation with a focus on chlorophyll degradation and flavonoid biosynthesis. BMC Genom. 2015, 16, 225. [Google Scholar] [CrossRef] [PubMed]
  45. Hu, B.; Li, J.; Wang, D.; Wang, H.; Qin, Y.; Hu, G.; Zhao, J. Transcriptome profiling of Litchi chinensis pericarp in response to exogenous cytokinins and abscisic acid. Plant Growth Regul. 2018, 84, 437–450. [Google Scholar] [CrossRef]
  46. Zhang, H.-N.; Li, W.-C.; Wang, H.-C.; Shi, S.-Y.; Shu, B.; Liu, L.-Q.; Wei, Y.-Z.; Xie, J.-H. Transcriptome profiling of light-regulated anthocyanin biosynthesis in the pericarp of litchi. Front. Plant Sci. 2016, 7, 963. [Google Scholar] [CrossRef] [PubMed]
  47. Zhuang, K.; Du, J.; Weng, Y.; Xu, Y.; Xiong, J.; Deng, Z.; Liu, H.; Liu, Y.; Song, H.; Li, H.; et al. Genome-Wide Study of the Rice SBP Gene Family. Acta Agric. Univ. Jiangxiensis 2023, 45, 1315–1323. [Google Scholar]
  48. Lu, B.; Zhu, Y.; Zhang, S.; Lü, Y.; Li, X.; Song, Y.; Lai, Z.; Lin, Y. Whole-genome identification and expression analysis of SPL gene family in Dimocarpus Longan. Sci. Agric. Sin. 2020, 53, 4259–4270. [Google Scholar]
  49. Cheng, H.; Hao, M.; Wang, W.; Mei, D.; Tong, C.; Wang, H.; Liu, J.; Fu, L.; Hu, Q. Genomic identification, characterization and differential expression analysis of SBP-box gene family in Brassica napus. BMC Plant Biol. 2016, 16, 1–17. [Google Scholar] [CrossRef] [PubMed]
  50. Zhu, T.; Liu, Y.; Ma, L.; Wang, X.; Zhang, D.; Han, Y.; Ding, Q.; Ma, L. Genome-wide identification, phylogeny and expression analysis of the SPL gene family in wheat. BMC Plant Biol. 2020, 20, 420. [Google Scholar] [CrossRef] [PubMed]
  51. Han, Y.; Gao, H.; Chen, H.; Fu, C. The involvement of papaya CpSBP1 in modulating fruit softening and carotenoid accumulation by repressing CpPME1/2 and CpPDS4. Sci. Hortic. 2019, 256, 108582. [Google Scholar] [CrossRef]
  52. Yamasaki, K.; Kigawa, T.; Inoue, M.; Tateno, M.; Yamasaki, T.; Yabuki, T.; Aoki, M.; Seki, E.; Matsuda, T.; Nunokawa, E. A novel zinc-binding motif revealed by solution structures of DNA-binding domains of Arabidopsis SBP-family transcription factors. J. Mol. Biol. 2004, 337, 49–63. [Google Scholar] [CrossRef]
  53. Hu, G.; Feng, J.; Xiang, X.; Wang, J.; Salojärvi, J.; Liu, C.; Wu, Z.; Zhang, J.; Liang, X.; Jiang, Z. Two divergent haplotypes from a highly heterozygous lychee genome suggest independent domestication events for early and late-maturing cultivars. Nat. Genet. 2022, 54, 73–83. [Google Scholar] [CrossRef]
  54. Zhong, H.; Kong, W.; Gong, Z.; Fang, X.; Deng, X.; Liu, C.; Li, Y. Evolutionary analyses reveal diverged patterns of SQUAMOSA promoter binding protein-like (SPL) gene family in Oryza genus. Front. Plant Sci. 2019, 10, 565. [Google Scholar] [CrossRef] [PubMed]
  55. Ling, L.-Z.; Zhang, S.-D. Unraveling the Distribution and Evolution of miR156 targeted SPLs in Plants by Phylogenetic Analysis. Plant Divers. 2012, 34, 33. [Google Scholar] [CrossRef]
  56. Zhuang, W.; Liu, T.; Shu, X.; Qu, S.; Zhai, H.; Wang, T.; Zhang, F.; Wang, Z. The molecular regulation mechanism of anthocyanin biosynthesis and coloration in plants. Plant Physiol. J. 2018, 54, 1630–1644. [Google Scholar]
  57. Preston, J.C.; Hileman, L.C. Functional evolution in the plant SQUAMOSA-PROMOTER BINDING PROTEIN-LIKE (SPL) gene family. Front. Plant Sci. 2013, 4, 80. [Google Scholar] [CrossRef] [PubMed]
  58. Panchy, N.; Lehti-Shiu, M.; Shiu, S.-H. Evolution of gene duplication in plants. Plant Physiol. 2016, 171, 2294–2316. [Google Scholar] [CrossRef] [PubMed]
  59. Peng, X.; Wang, Q.; Zhao, Y.; Li, X.; Ma, Q. Comparative genome analysis of the SPL gene family reveals novel evolutionary features in maize. Genet. Mol. Biol. 2019, 42, 380–394. [Google Scholar] [CrossRef]
  60. He, F.; Long, R.; Wei, C.; Zhang, Y.; Li, M.; Kang, J.; Yang, Q.; Wang, Z.; Chen, L. Genome-wide identification, phylogeny and expression analysis of the SPL gene family and its important role in salt stress in Medicago sativa L. BMC Plant Biol. 2022, 22, 295. [Google Scholar] [CrossRef]
  61. Lee, H.; Wicker, L. Anthocyanin pigments in the skin of lychee fruit. J. Food Sci. 1991, 56, 466–468. [Google Scholar] [CrossRef]
  62. Liu, R.; Lai, B.; Hu, B.; Qin, Y.; Hu, G.; Zhao, J. Identification of microRNAs and their target genes related to the accumulation of anthocyanins in Litchi chinensis by high-throughput sequencing and degradome analysis. Front. Plant Sci. 2017, 7, 241260. [Google Scholar] [CrossRef]
Figure 1. Systematic representations of the litchi LcSPL genes. The LcSPLs were located on Chr1,2,3,8,9,10,11,12,14,15 chromosomes. The length of each chromosome was estimated in megabases (Mb).
Horticulturae 10 00762 g001
Figure 2. The phylogenetic analysis of LcSPL proteins with Arabidopsis. The phylogenetic tree was made by using e MEGA 11.0 software with the neighbor-joining (NJ) method, and the bootstrap replications were stetted to 1000 times.
Horticulturae 10 00762 g002
Figure 3. (A) The phylogenetic analysis of LcSPL proteins with Arabidopsis, rice (Oryza sativa), tomato (Solanum lycopersicum), and longan (Dimocarpus longan). The phylogenetic tree was made by using MEGA 11.0 software with the neighbor-joining (NJ) method, and the bootstrap replications were stetted to 1000 times. (B) Phylogenetic analysis of litchi, Arabidopsis, grape, pear, and papaya based on the neighbor-joining (NJ) method.
Horticulturae 10 00762 g003
Figure 4. Characterization of litchi SPL genes. (A) Neighbor-joining tree analysis and its grouping of SPL proteins in litchi; (B) conserved motifs in the 17 SPL proteins; (C) domains in the 17 SPL proteins; (D) exon–intron structure of LcSPL genes. Ten color boxes indicate different motifs. The green icon means UTR (untranslated region), the yellow icon means CDS (coding sequence), and the line between UTR and CDS means intron (a non-coding part of a gene or mRNA molecule).
Horticulturae 10 00762 g004
Figure 5. Sequence alignment of the SBP domain of LcSPL family genes and miR156 target gene binding sites. (A) Multiple sequence alignment of SBP domains. The two conserved zinc finger structures (C3H and C2HC) and NLS are indicated. The height of the letters in the sequence identifiers indicates the relative frequency of the corresponding amino acids. (B) Multiple sequence alignment of miR156 and its target LcSPL gene binding site. The regions where the LcSPL target gene binding sites are located are indicated. The black color indicates 100% similarity. Red and blue indicate 75% and 50% similarity.
Horticulturae 10 00762 g005
Figure 6. Synteny analysis of SPL genes in litchi. (A) The distribution and collinearity of SPL gene in litchi and Arabidopsis, tomato, longan, rambutan, rice, and maize, respectively. The numbers represent chromosome identifiers. (B) Collinearity of SPL genes in litchi. The eight chromosomes of litchi are arranged in a circular pattern. The grey line represents all collinearity of litchi, and the red line represents the collinearity of the LcSPLs.
Horticulturae 10 00762 g006
Figure 7. cis-element analysis of LcSPL promoters: (A) the cis-element analysis of LcSPL promoter region; (B) the quantities of the various components of the LcSPL promoter were counted and differentiated by different color shades; (C) the pie chart shows the relative distribution of each cis-element across the four different types of response elements.
Horticulturae 10 00762 g007
Figure 8. Prediction of the regulatory network of LcSPLs and their interacting proteins. Sky blue lines are from selected databases; purple lines are experimentally determined; dark blue lines are gene co-emergence; green lines are text mining; black lines are co-expression; and light blue lines are protein homology.
Horticulturae 10 00762 g008
Figure 9. GO enrichment analysis of the LcSPL genes of litchi and expression pattern analysis of RNA-seq data. (A) GO enrichment analysis of the LcSPL genes. (B) Expression of LcSPL genes in different tissues of ‘Feizixiao’ litchi. (C) Expression of LcSPL genes in ‘Nuomici’ litchi fruits at three different developmental stages. Green: The pericarp is completely green; yellow: the pericarp is colored yellow; red: the pericarp is red. (D) Expression of LcSPL genes in the pericarp of ‘Feizixiao’ litchi at different stages after treatment with exogenous ABA and CPPU. (E) Expression of LcSPL genes during the coloring process of the pericarp of ‘Feizixiao’ litchi treated with exogenous CPPU. CK1 and T1 are in the green stage (the pericarp has just completely covered the flesh); CK2 and T2 are in the best-eating stage of the fruit. (F) Expression of LcSPL genes in the coloring process of ‘Feizixiao’ litchi pericarp at different periods after lifting the shading treatment.
Horticulturae 10 00762 g009
Figure 10. Expression of LcSPL genes in different fruit organs of litchi. Red modules represent tissues with high expression, and blue modules represent low expression. All heatmaps were visualized using TBtools.
Horticulturae 10 00762 g010
Figure 11. Co-expression network analysis of litchi anthocyanin synthesis. (A) Hierarchical clustering tree of modules based on WGCNA analysis. (B) Association analysis of sample phenotypes with critical features of gene modules. (C) Comparison of expression patterns of module eigenvalues in different samples. Green, yellow, and red represent samples at different stages of fruit development; D0, D1, D3, and D7 represent samples in different periods of lifting shade. (D) Co-expression network profiles of the LcSPL7 gene and related genes in yellow modules. (E) Expression pattern analysis of LcSPL7 gene and related genes.
Horticulturae 10 00762 g011
Table 1. Detailed information of LcSPL gene family members in litchi.
Gene NameGene IDProtein/AAMolecular Weight (kDa)pIInstability IndexAliphatic IndexGRAVYSubcellular Localization
LcSPL1LITCHI014255.m11030114.616.6449.7282.68−0.367Nucleus
LcSPL2LITCHI014612.m177686.756.2950.8586.51−0.267Nucleus
LcSPL3LITCHI013083.m120122.878.9570.4754.23−1.002Nucleus
LcSPL4LITCHI025415.m134738.418.3751.0251.24−0.678Nucleus
LcSPL5LITCHI025416.m144348.986.9150.4659.03−0.679Nucleus
LcSPL6LITCHI026667.m1988109.725.9151.878.83−0.434Nucleus
LcSPL7LITCHI009851.m31062118.467.8761.0972.82−0.528Nucleus
LcSPL8LITCHI029170.m113615.407.0475.3143.09−1.281Nucleus
LcSPL9LITCHI023329.m153358.22752.7665.25−0.54Nucleus
LcSPL10LITCHI006358.m112414.578.9797.9934.6−1.305Nucleus
LcSPL11LITCHI020317.m138342.237.6457.5258.56−0.746Nucleus
LcSPL12LITCHI021016.m118320.629.2151.559.07−0.945Nucleus
LcSPL13LITCHI004632.m131934.558.7457.1160.85−0.571Nucleus
LcSPL14LITCHI004647.m156762.279.3142.5465.54−0.554Nucleus
LcSPL15LITCHI004652.m156762.309.3142.3265.54−0.554Nucleus
LcSPL16LITCHI005348.m150856.457.5154.3570.02−0.57Nucleus
LcSPL17LITCHI019149.m138440.659.2359.9850.55−0.666Nucleus
pI: isoelectric points; GRAVY: grand average of hydropathicity.
Disclaimer/Publisher’s Note: The statements, opinions and data contained in all publications are solely those of the individual author(s) and contributor(s) and not of MDPI and/or the editor(s). MDPI and/or the editor(s) disclaim responsibility for any injury to people or property resulting from any ideas, methods, instructions or products referred to in the content.

