
Improving the Salt Tolerance of “Old Limachino Tomato” by Using a New Salt-Tolerant Rootstock
 , , , , and
Abstract
:1. Introduction
2. Material and Methods
2.1. Plant Material and Growing Conditions
2.2. Measurements
2.2.1. Plant Growth and Water Status
2.2.2. Leaf Stomatal Conductance, Chlorophyll Fluorescence, and Pigment Concentrations
2.2.3. Oxidative Damage and Total Antioxidant Capacity
2.2.4. Non-Enzymatic Antioxidant Compounds
2.2.5. Antioxidant Enzyme Activity
2.2.6. Ion Concentration
2.2.7. Differential Gene Expression in Roots
2.3. Statistical Analysis
3. Results
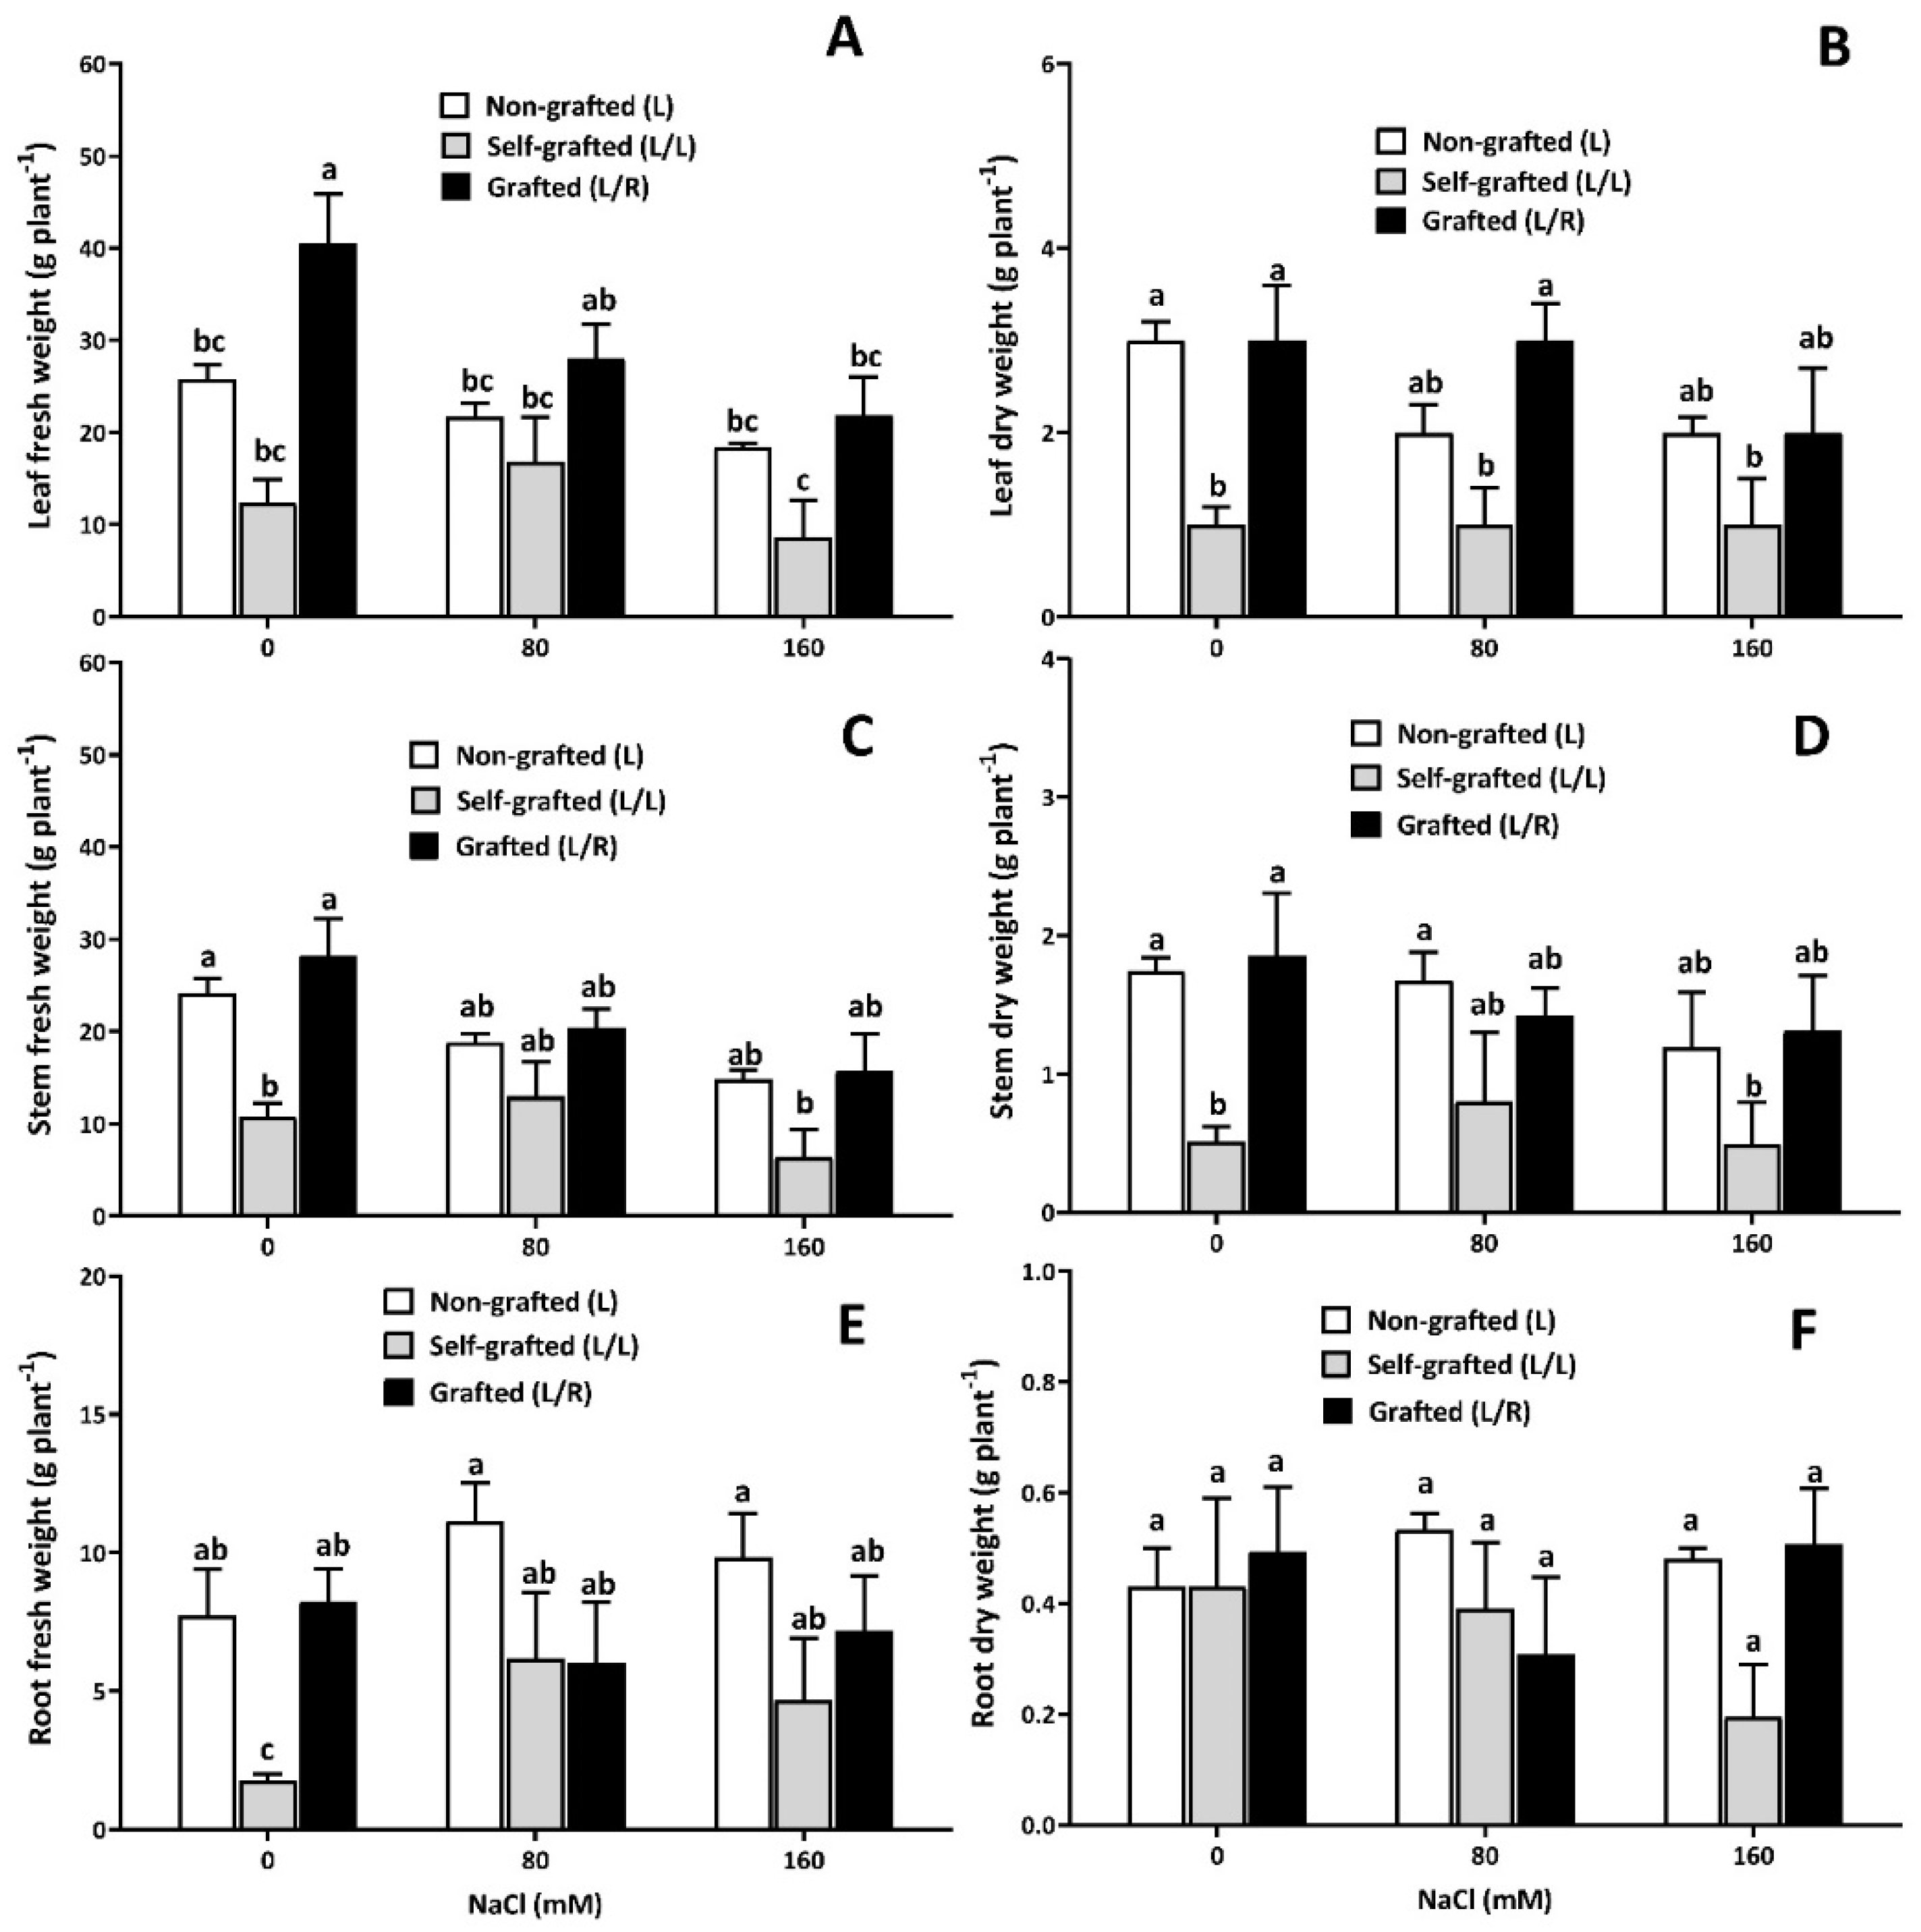
3.1. Plant Growth
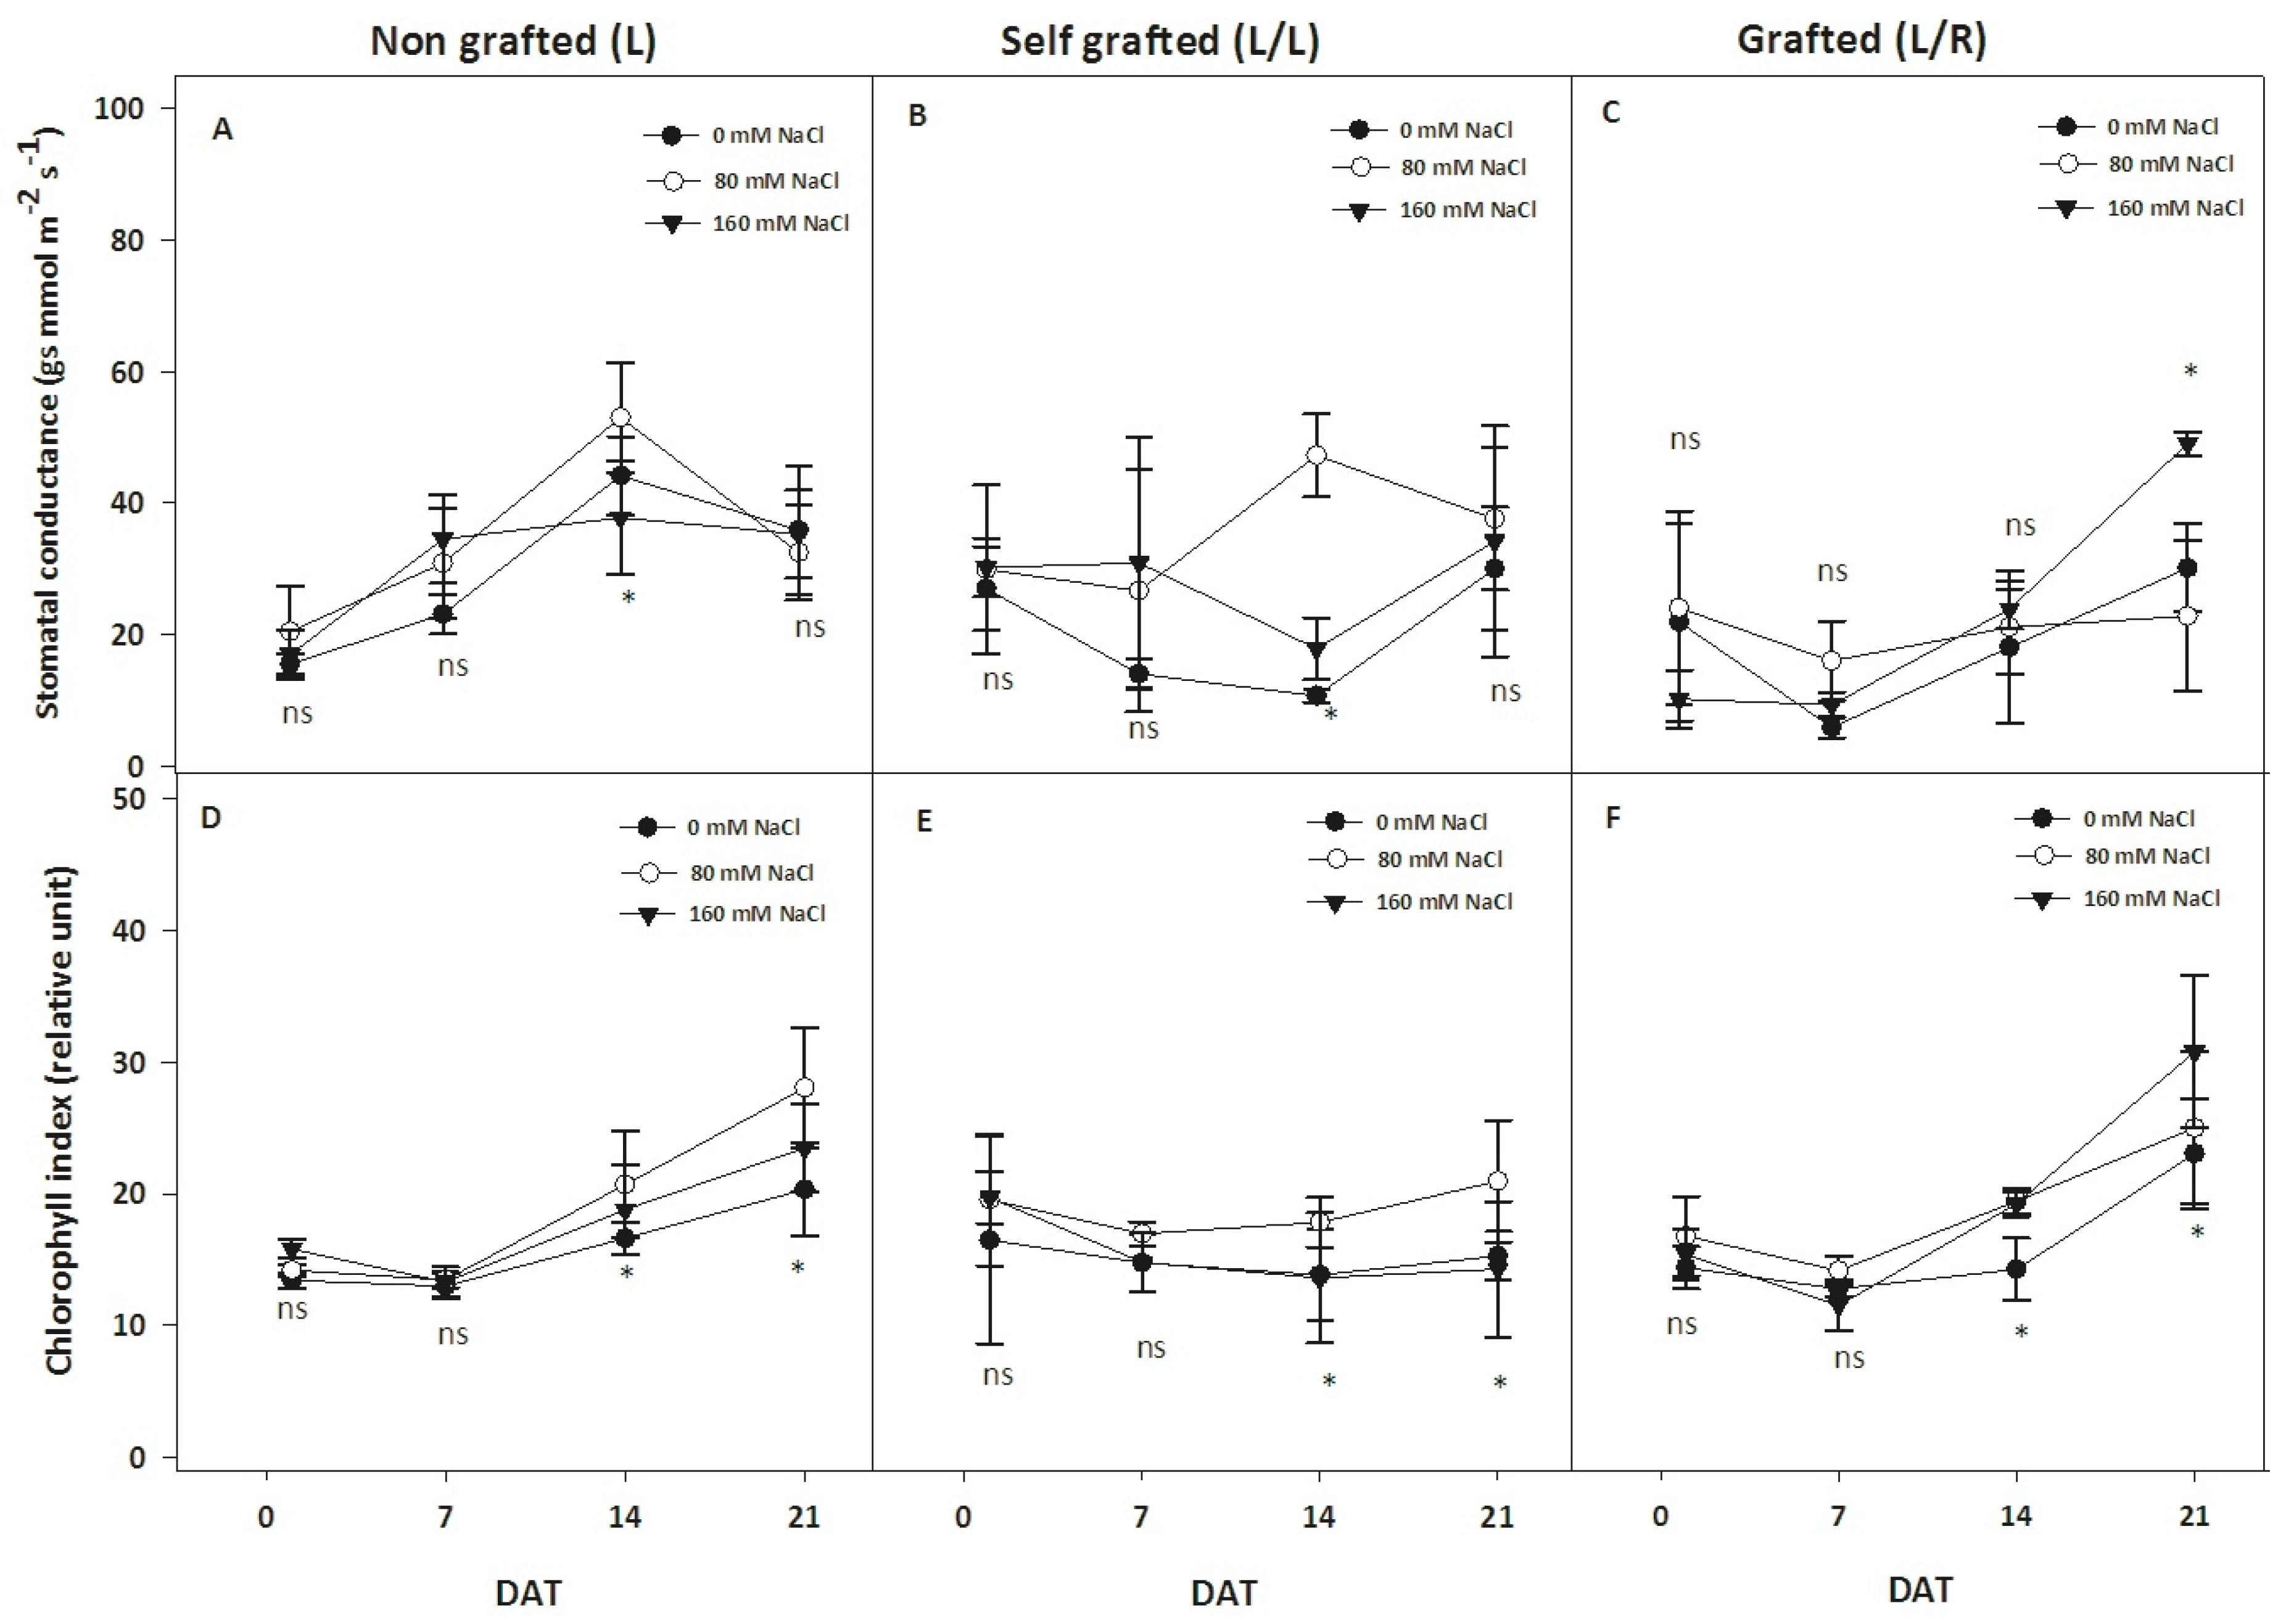
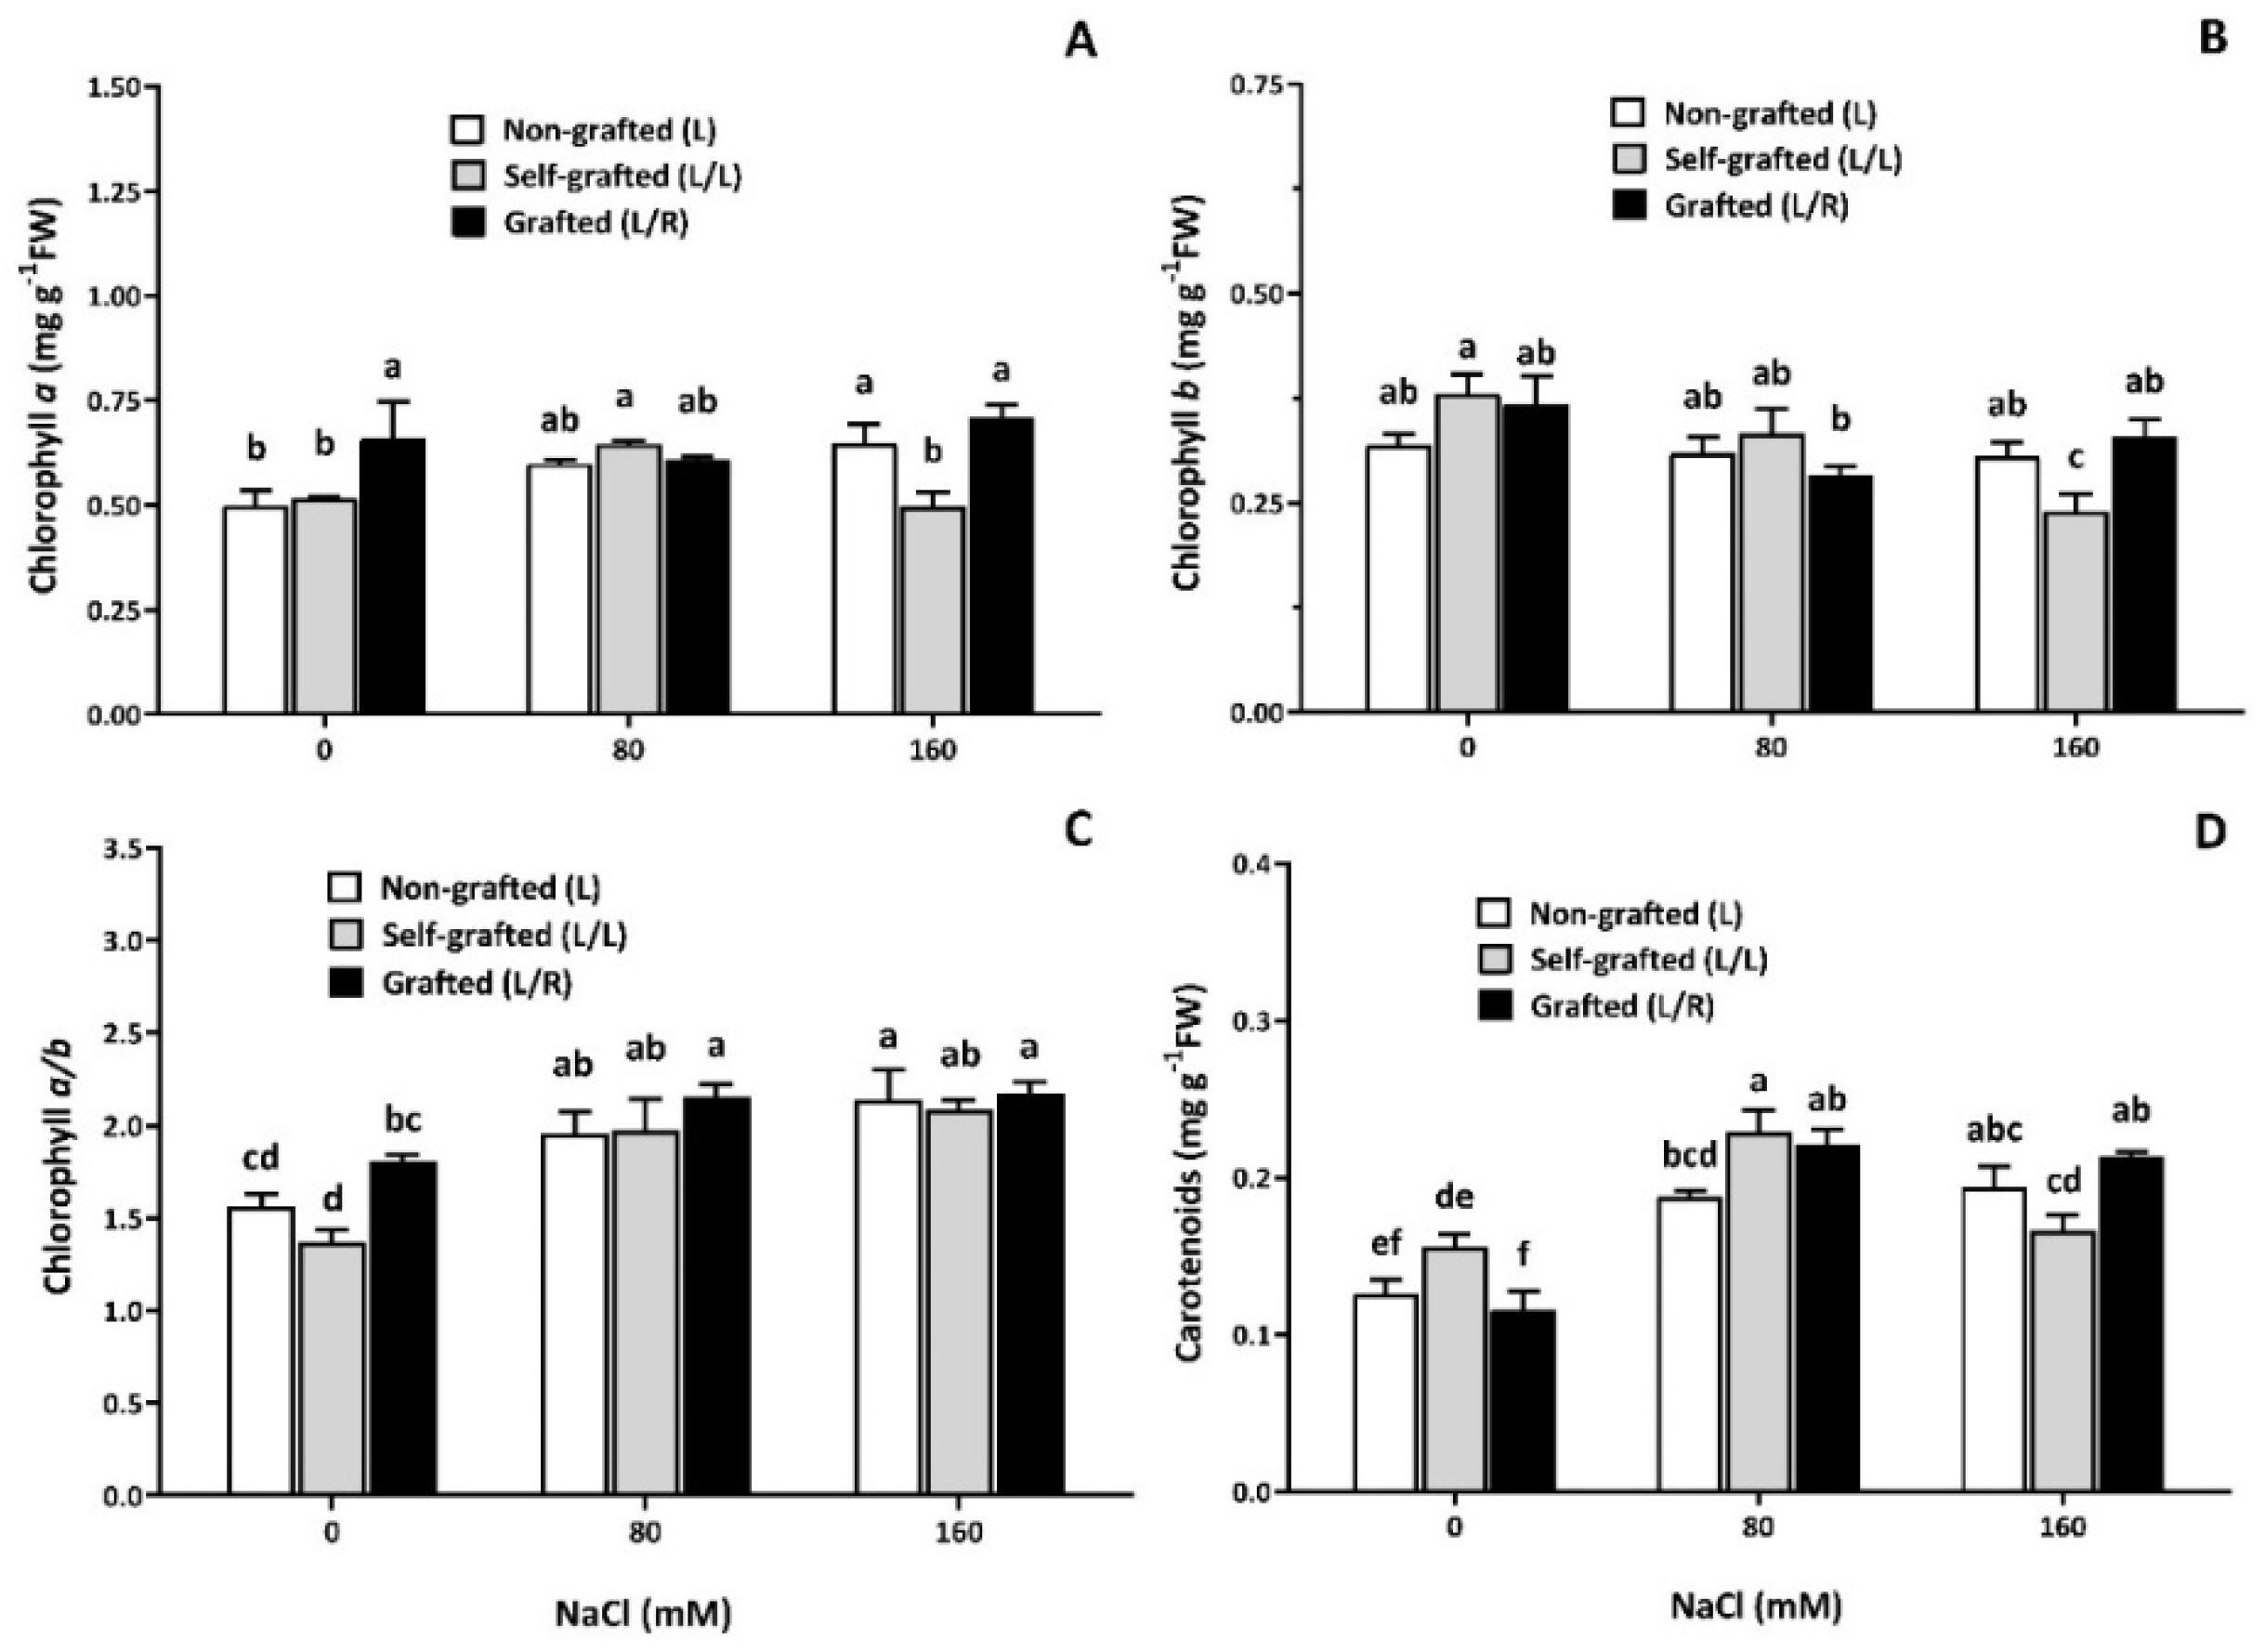
3.2. Plant Water Status and Photosynthesis-Related Parameters
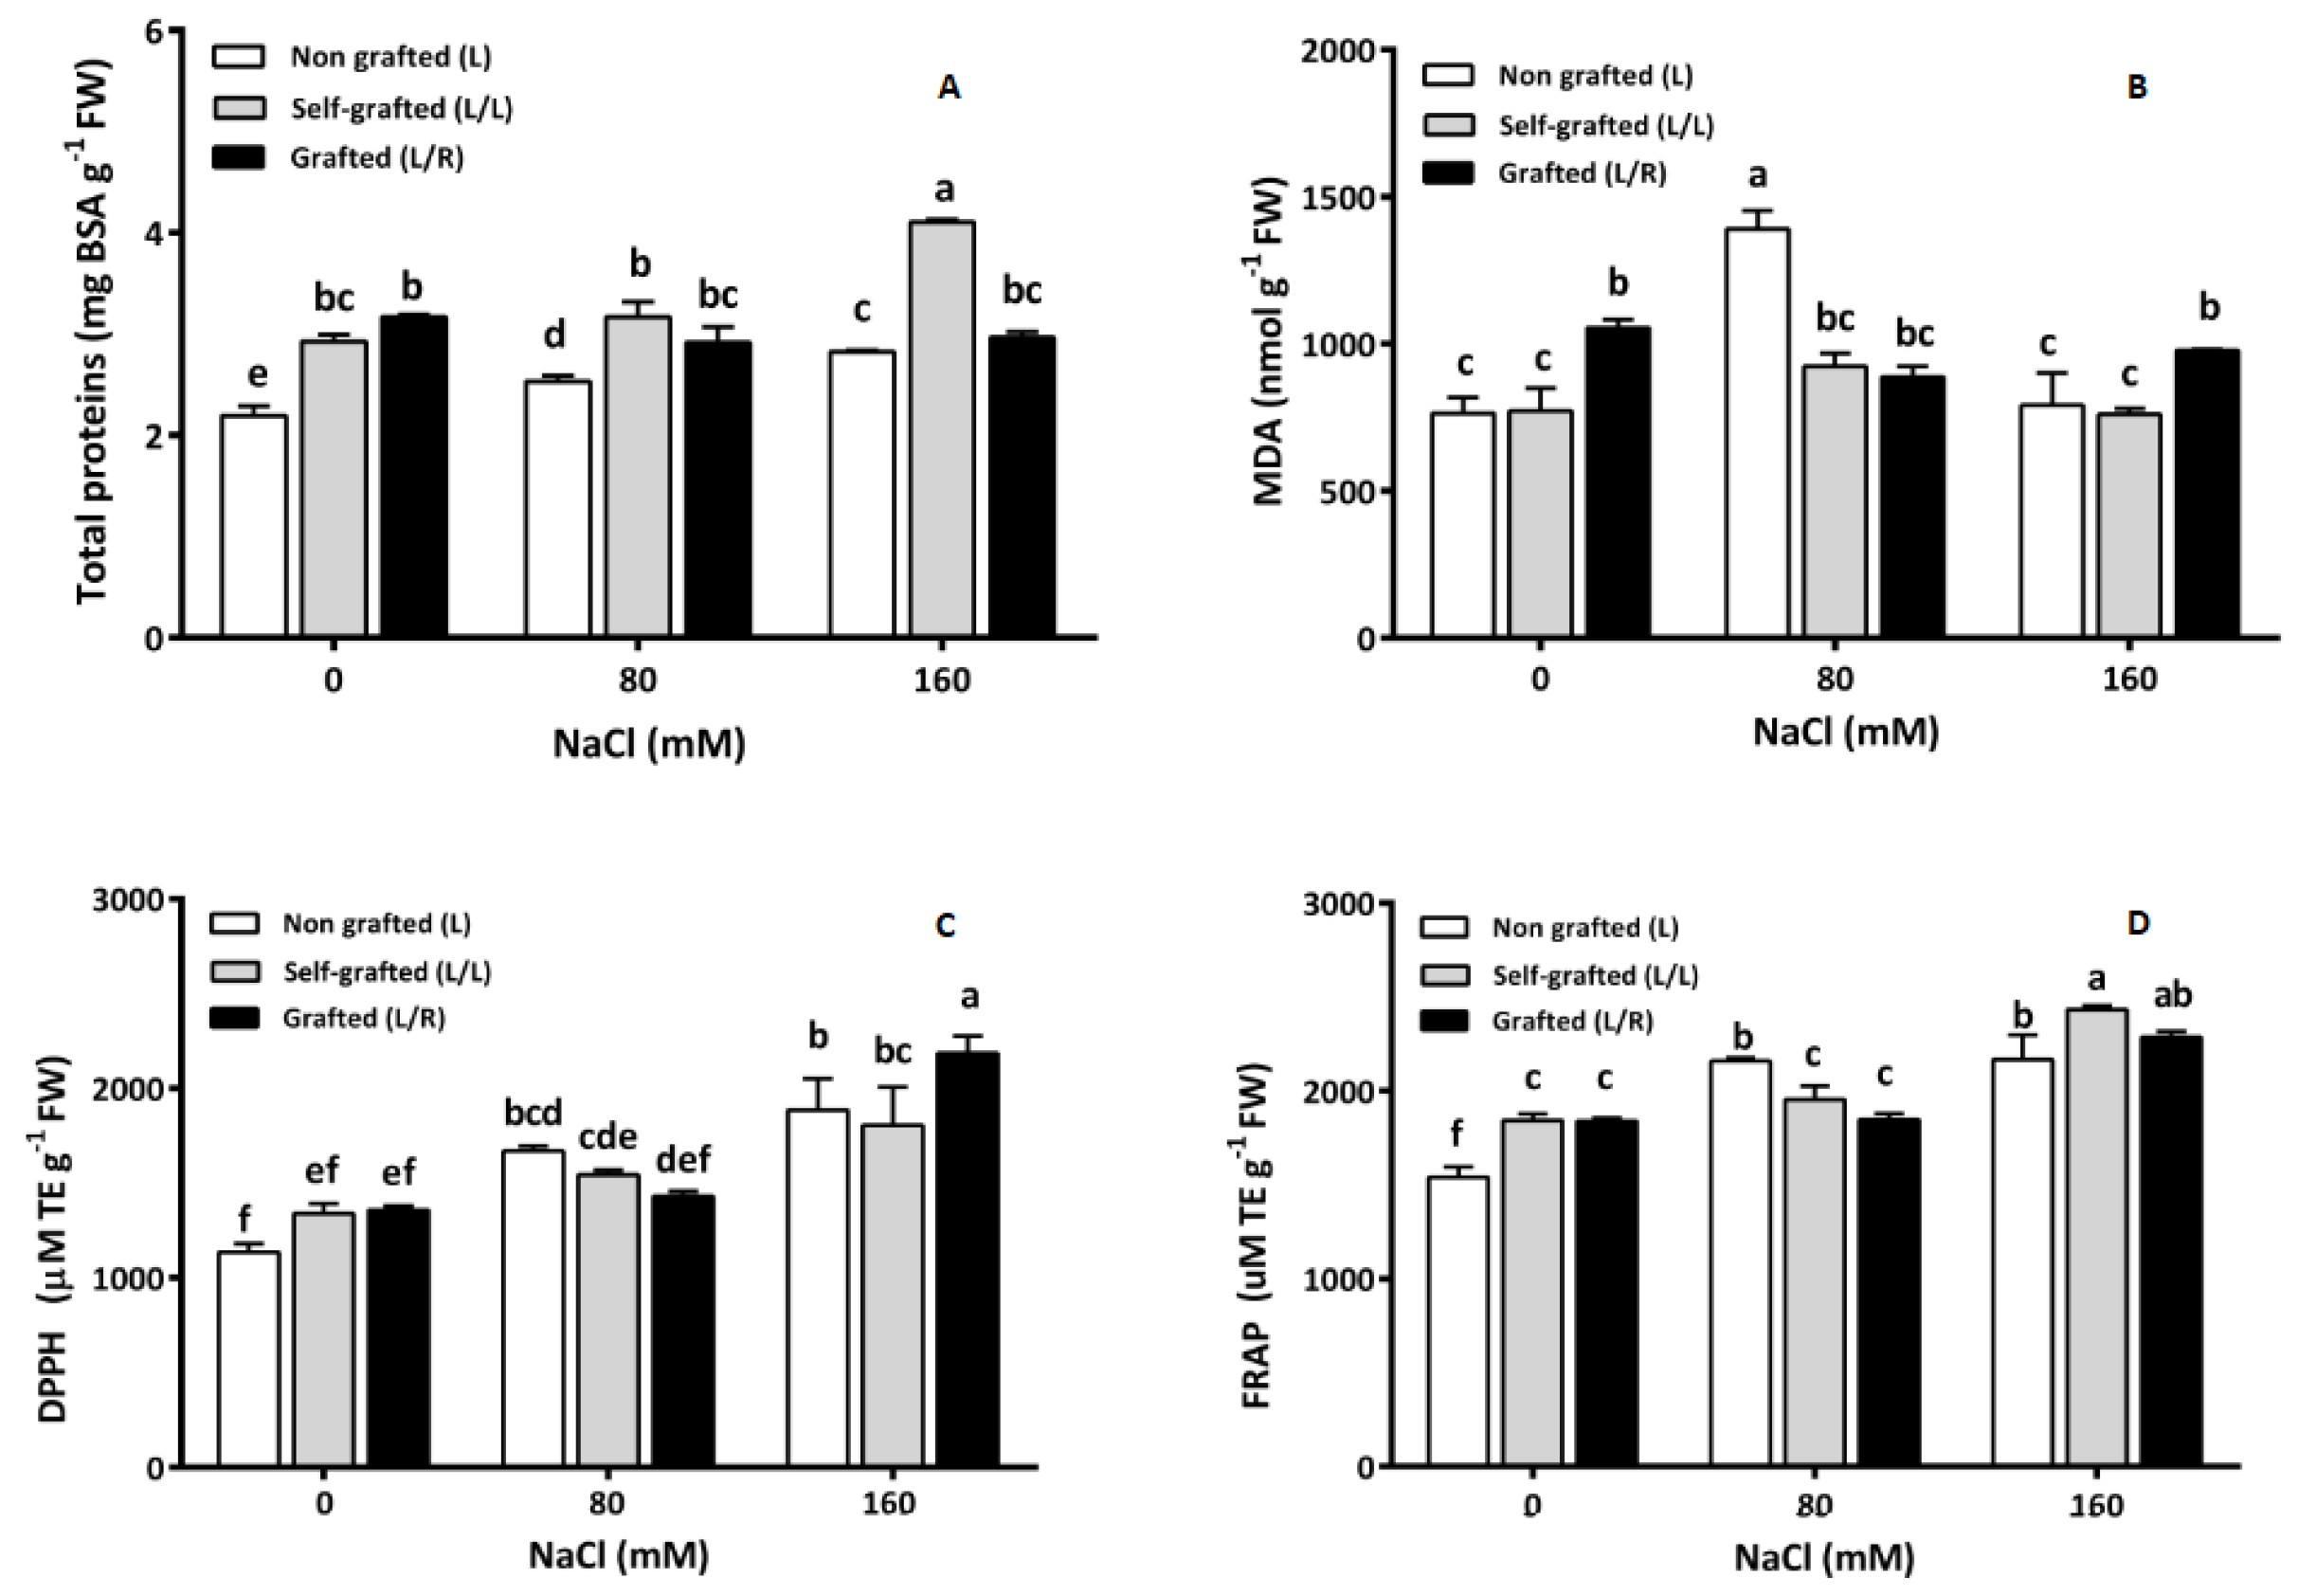
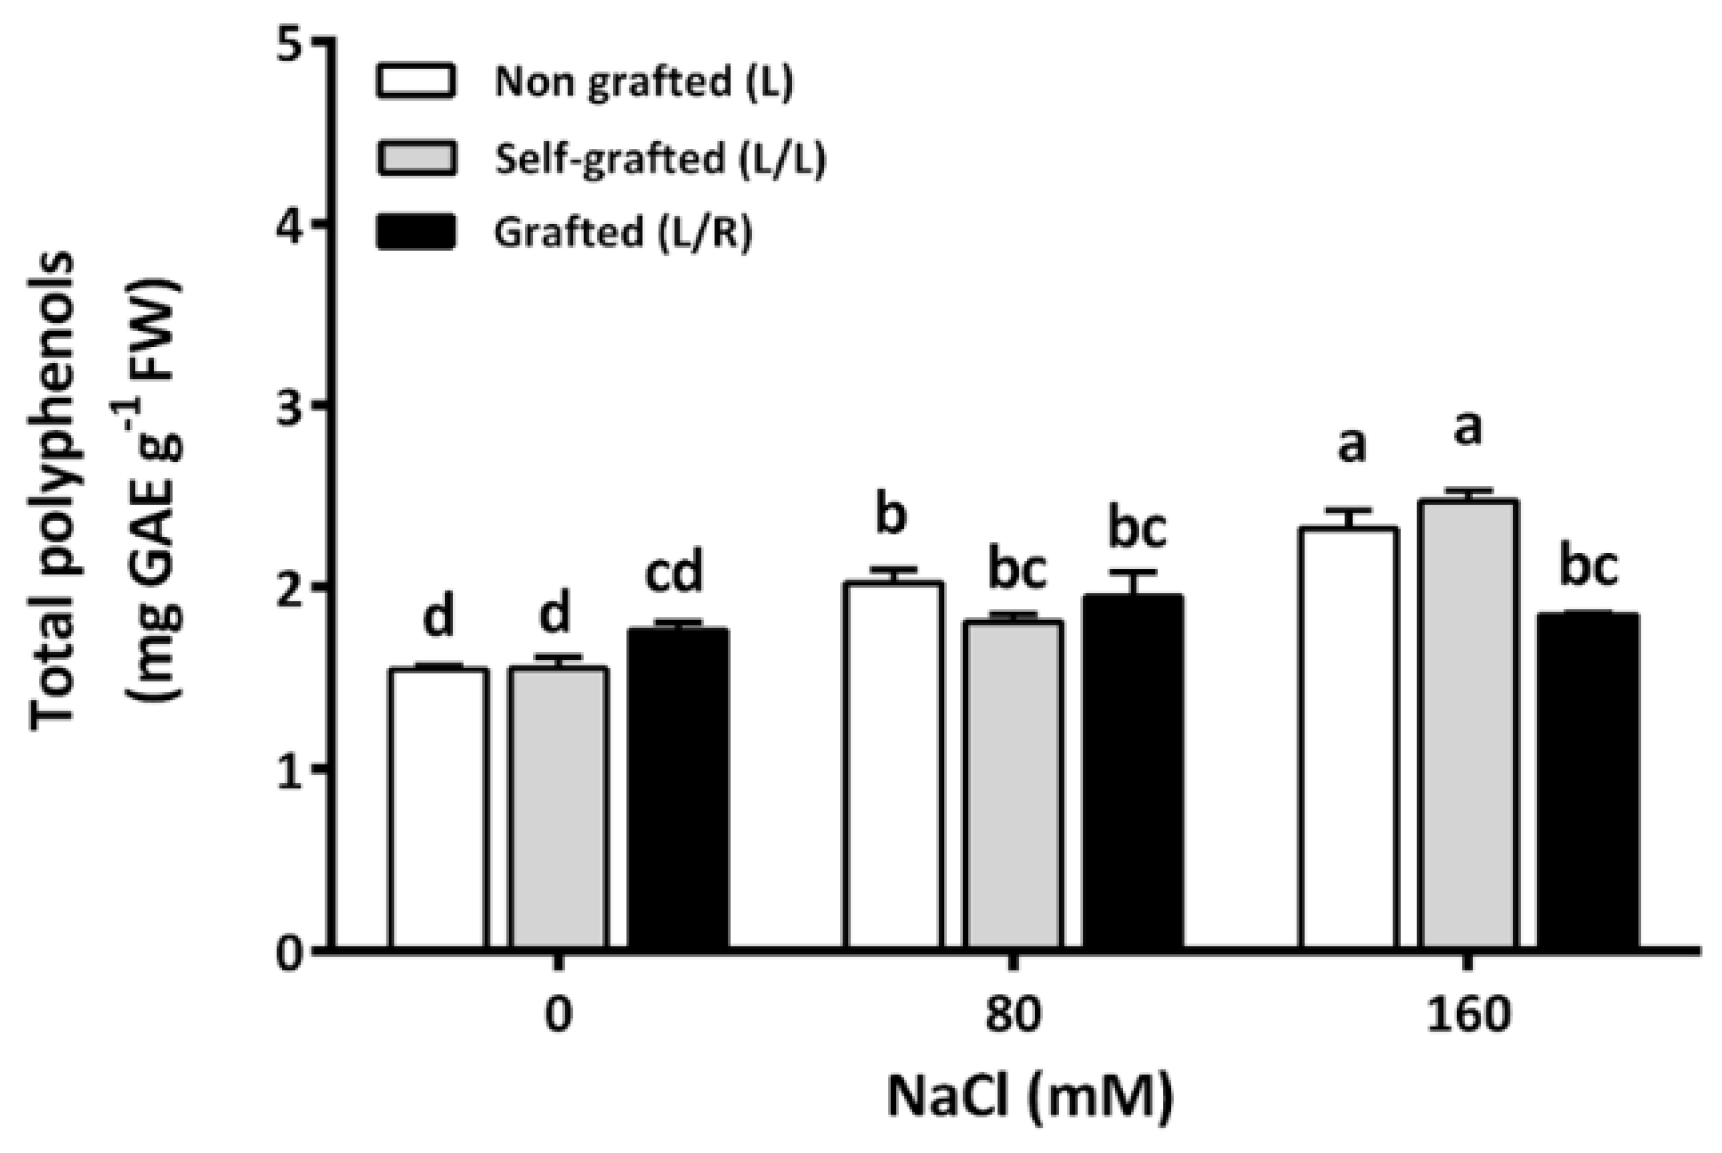
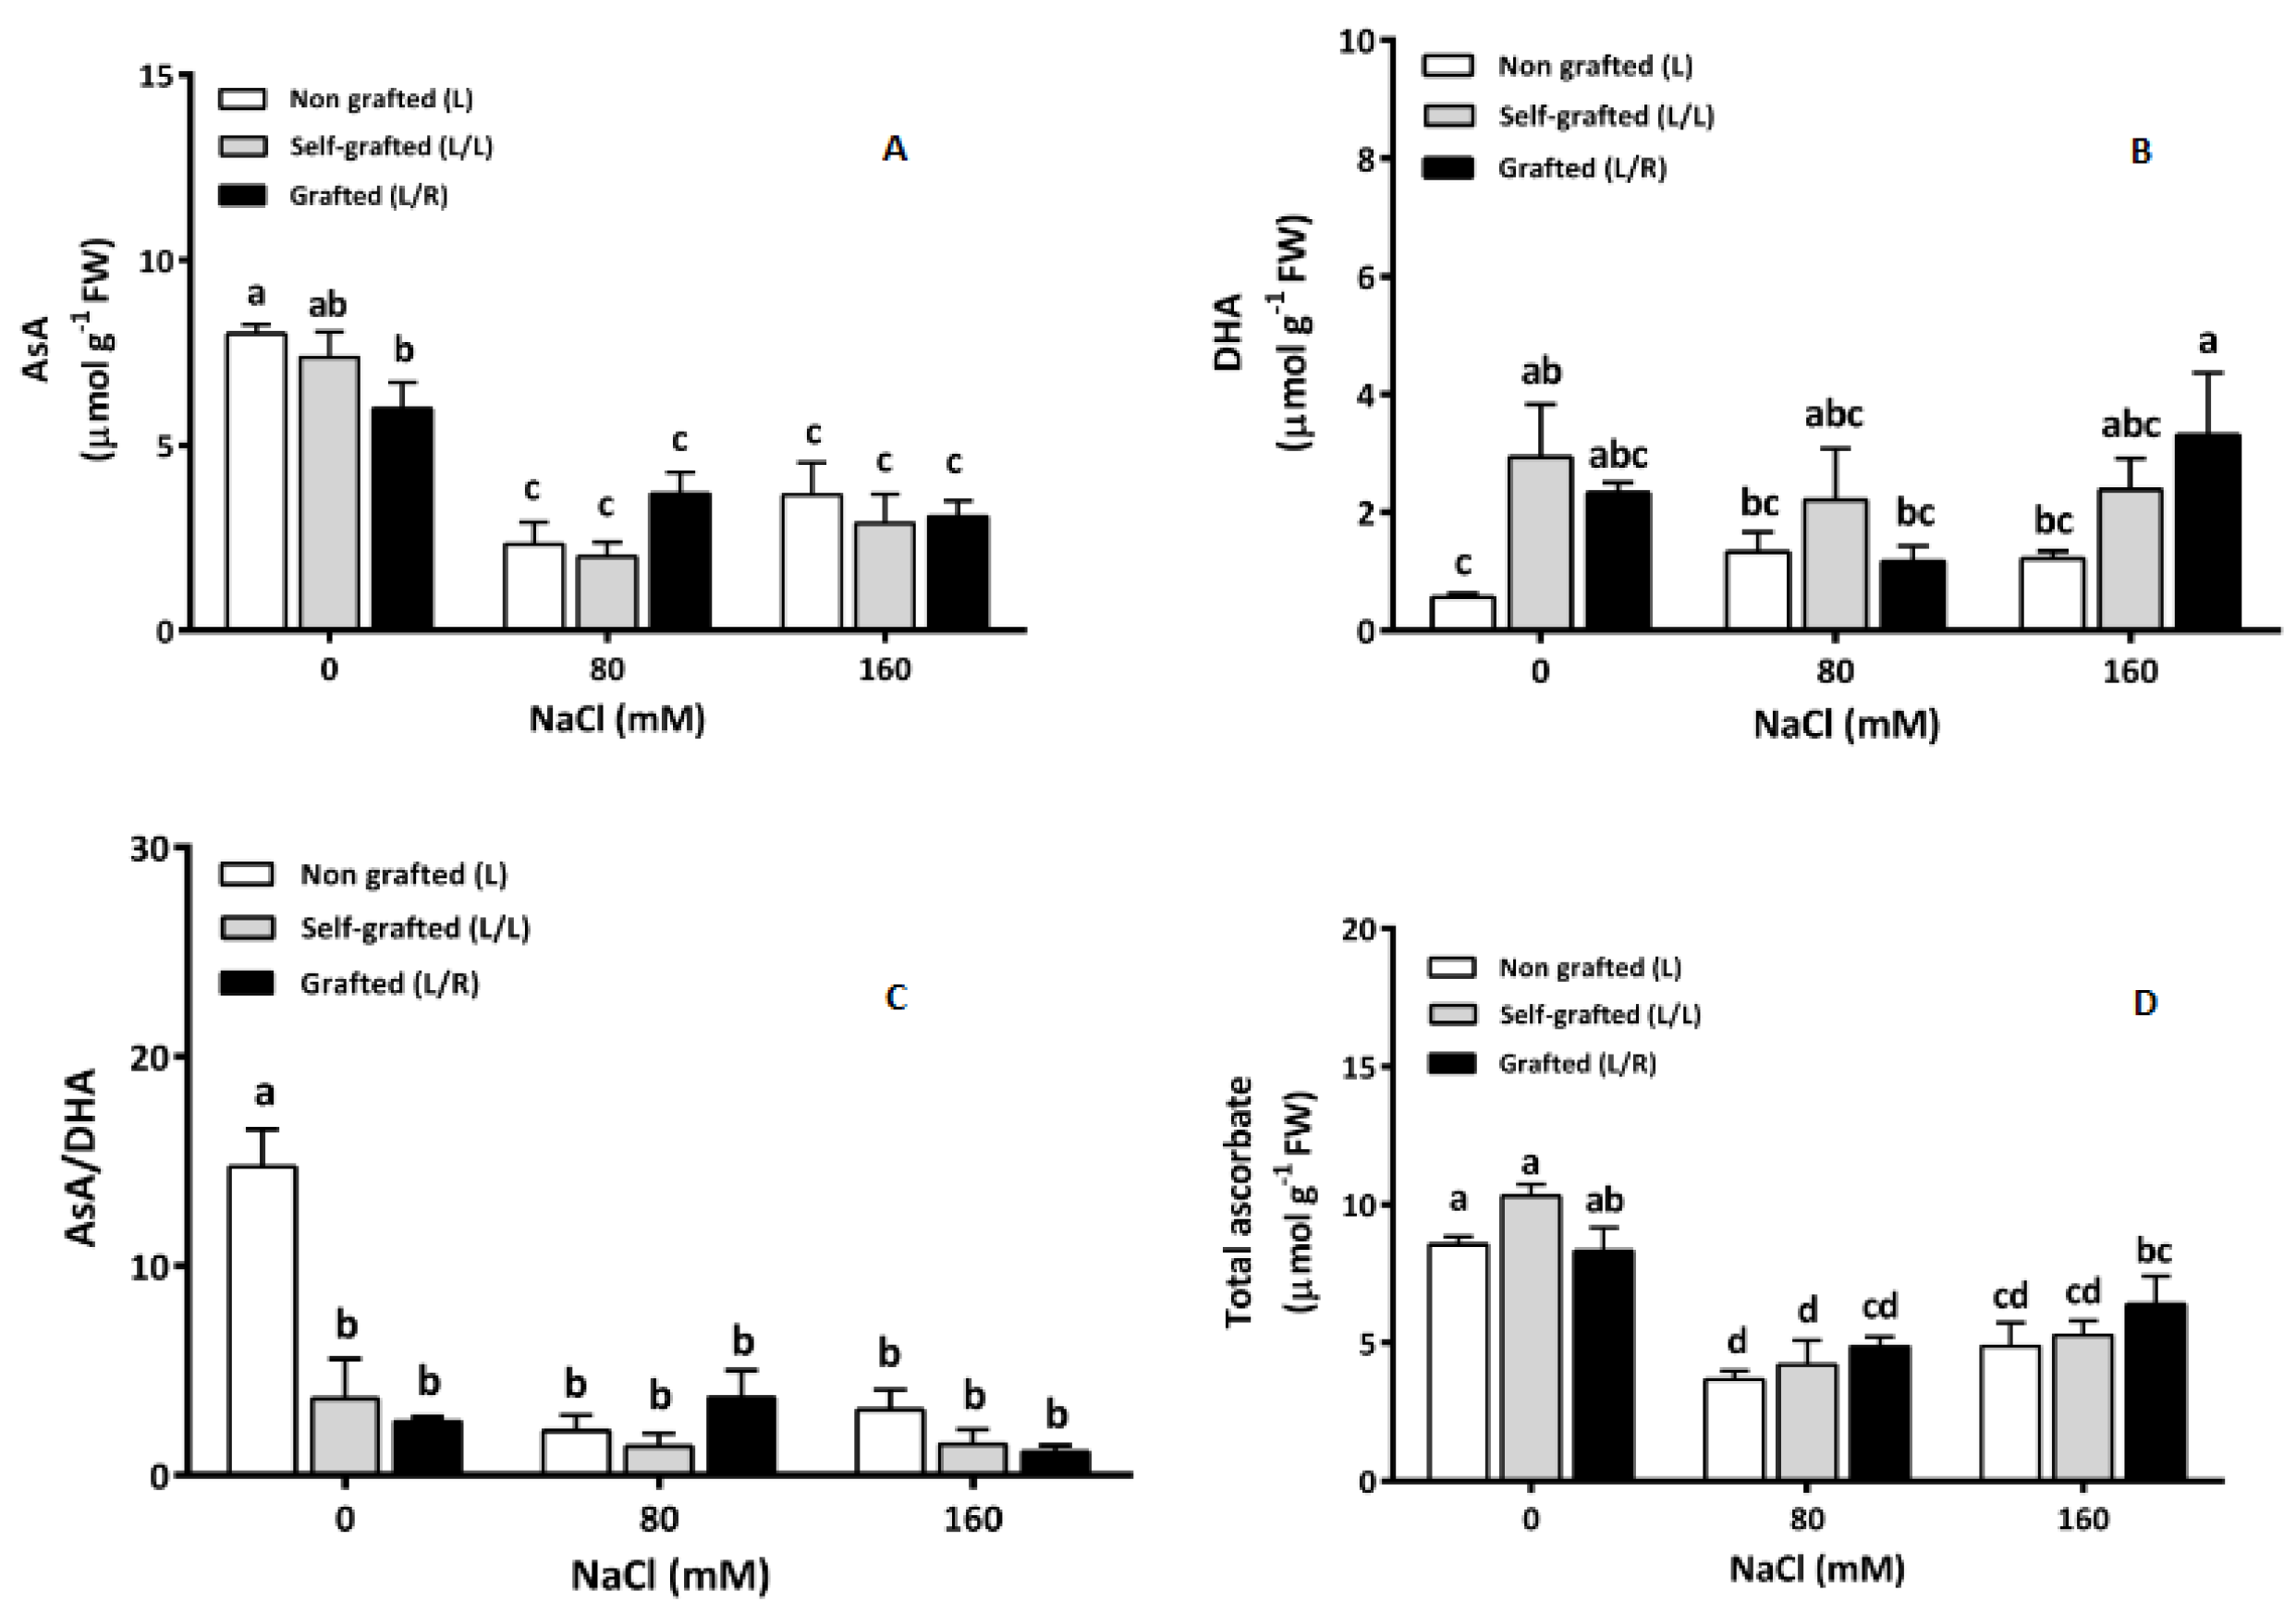
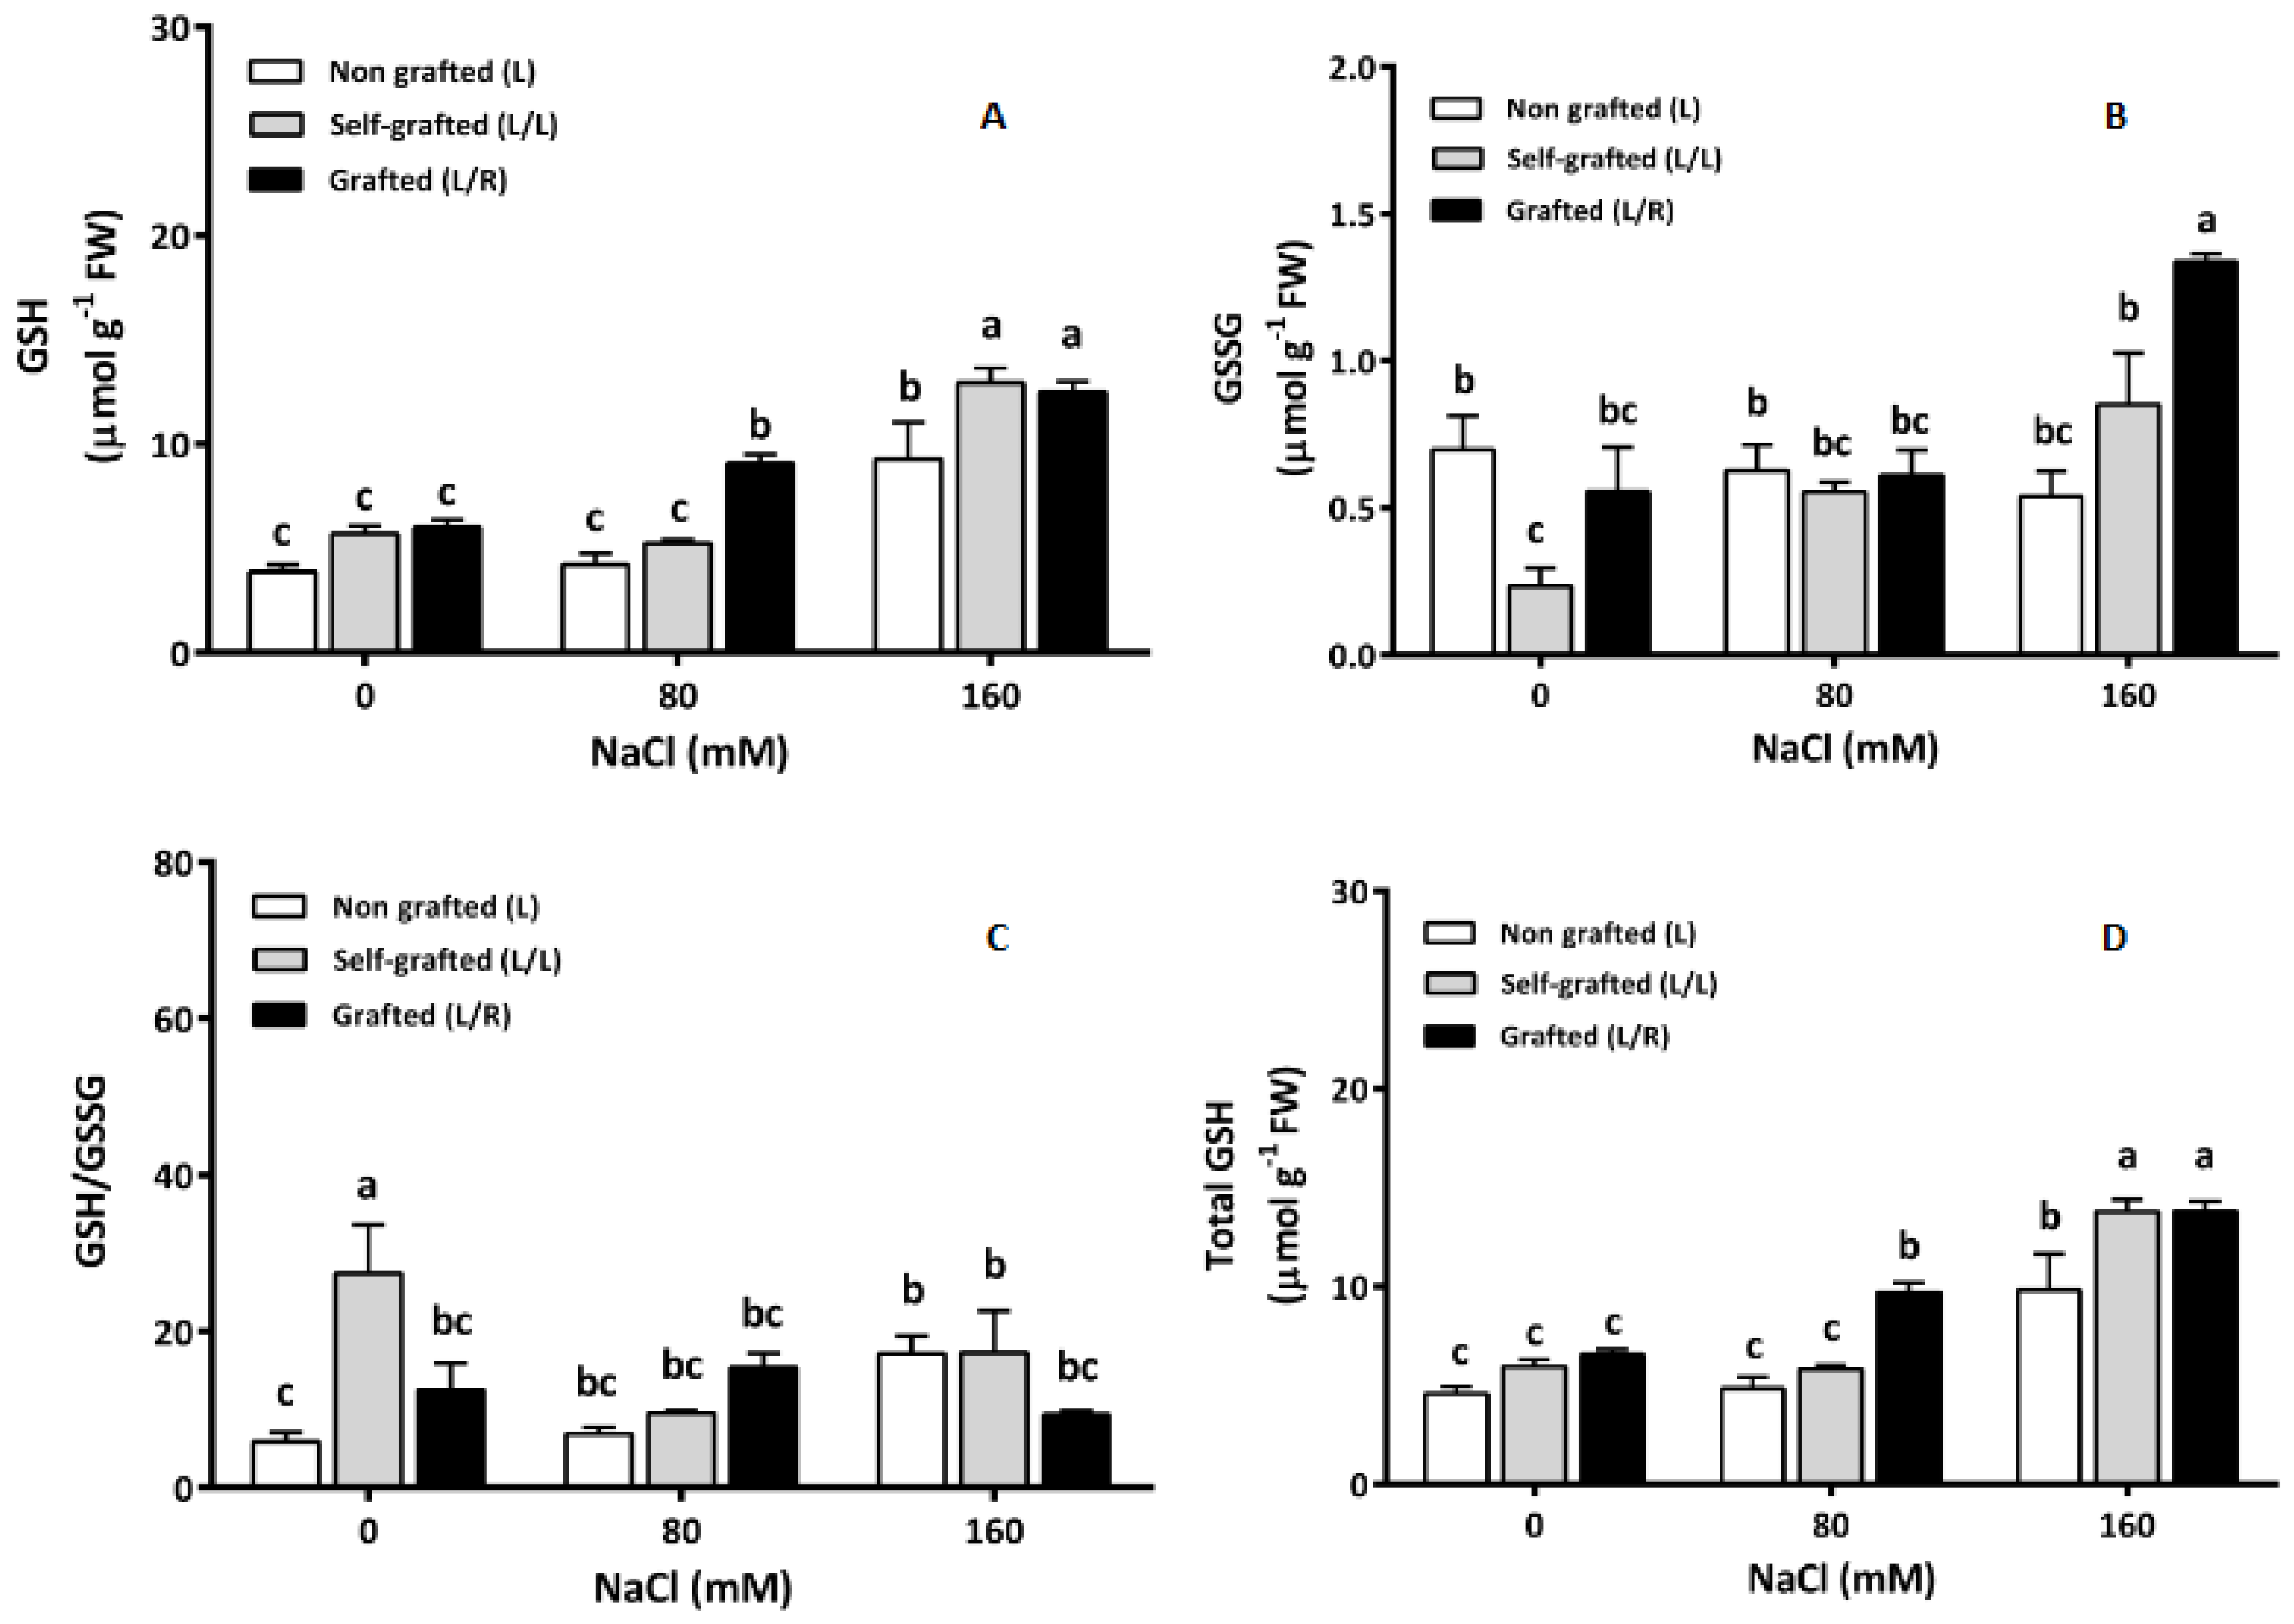
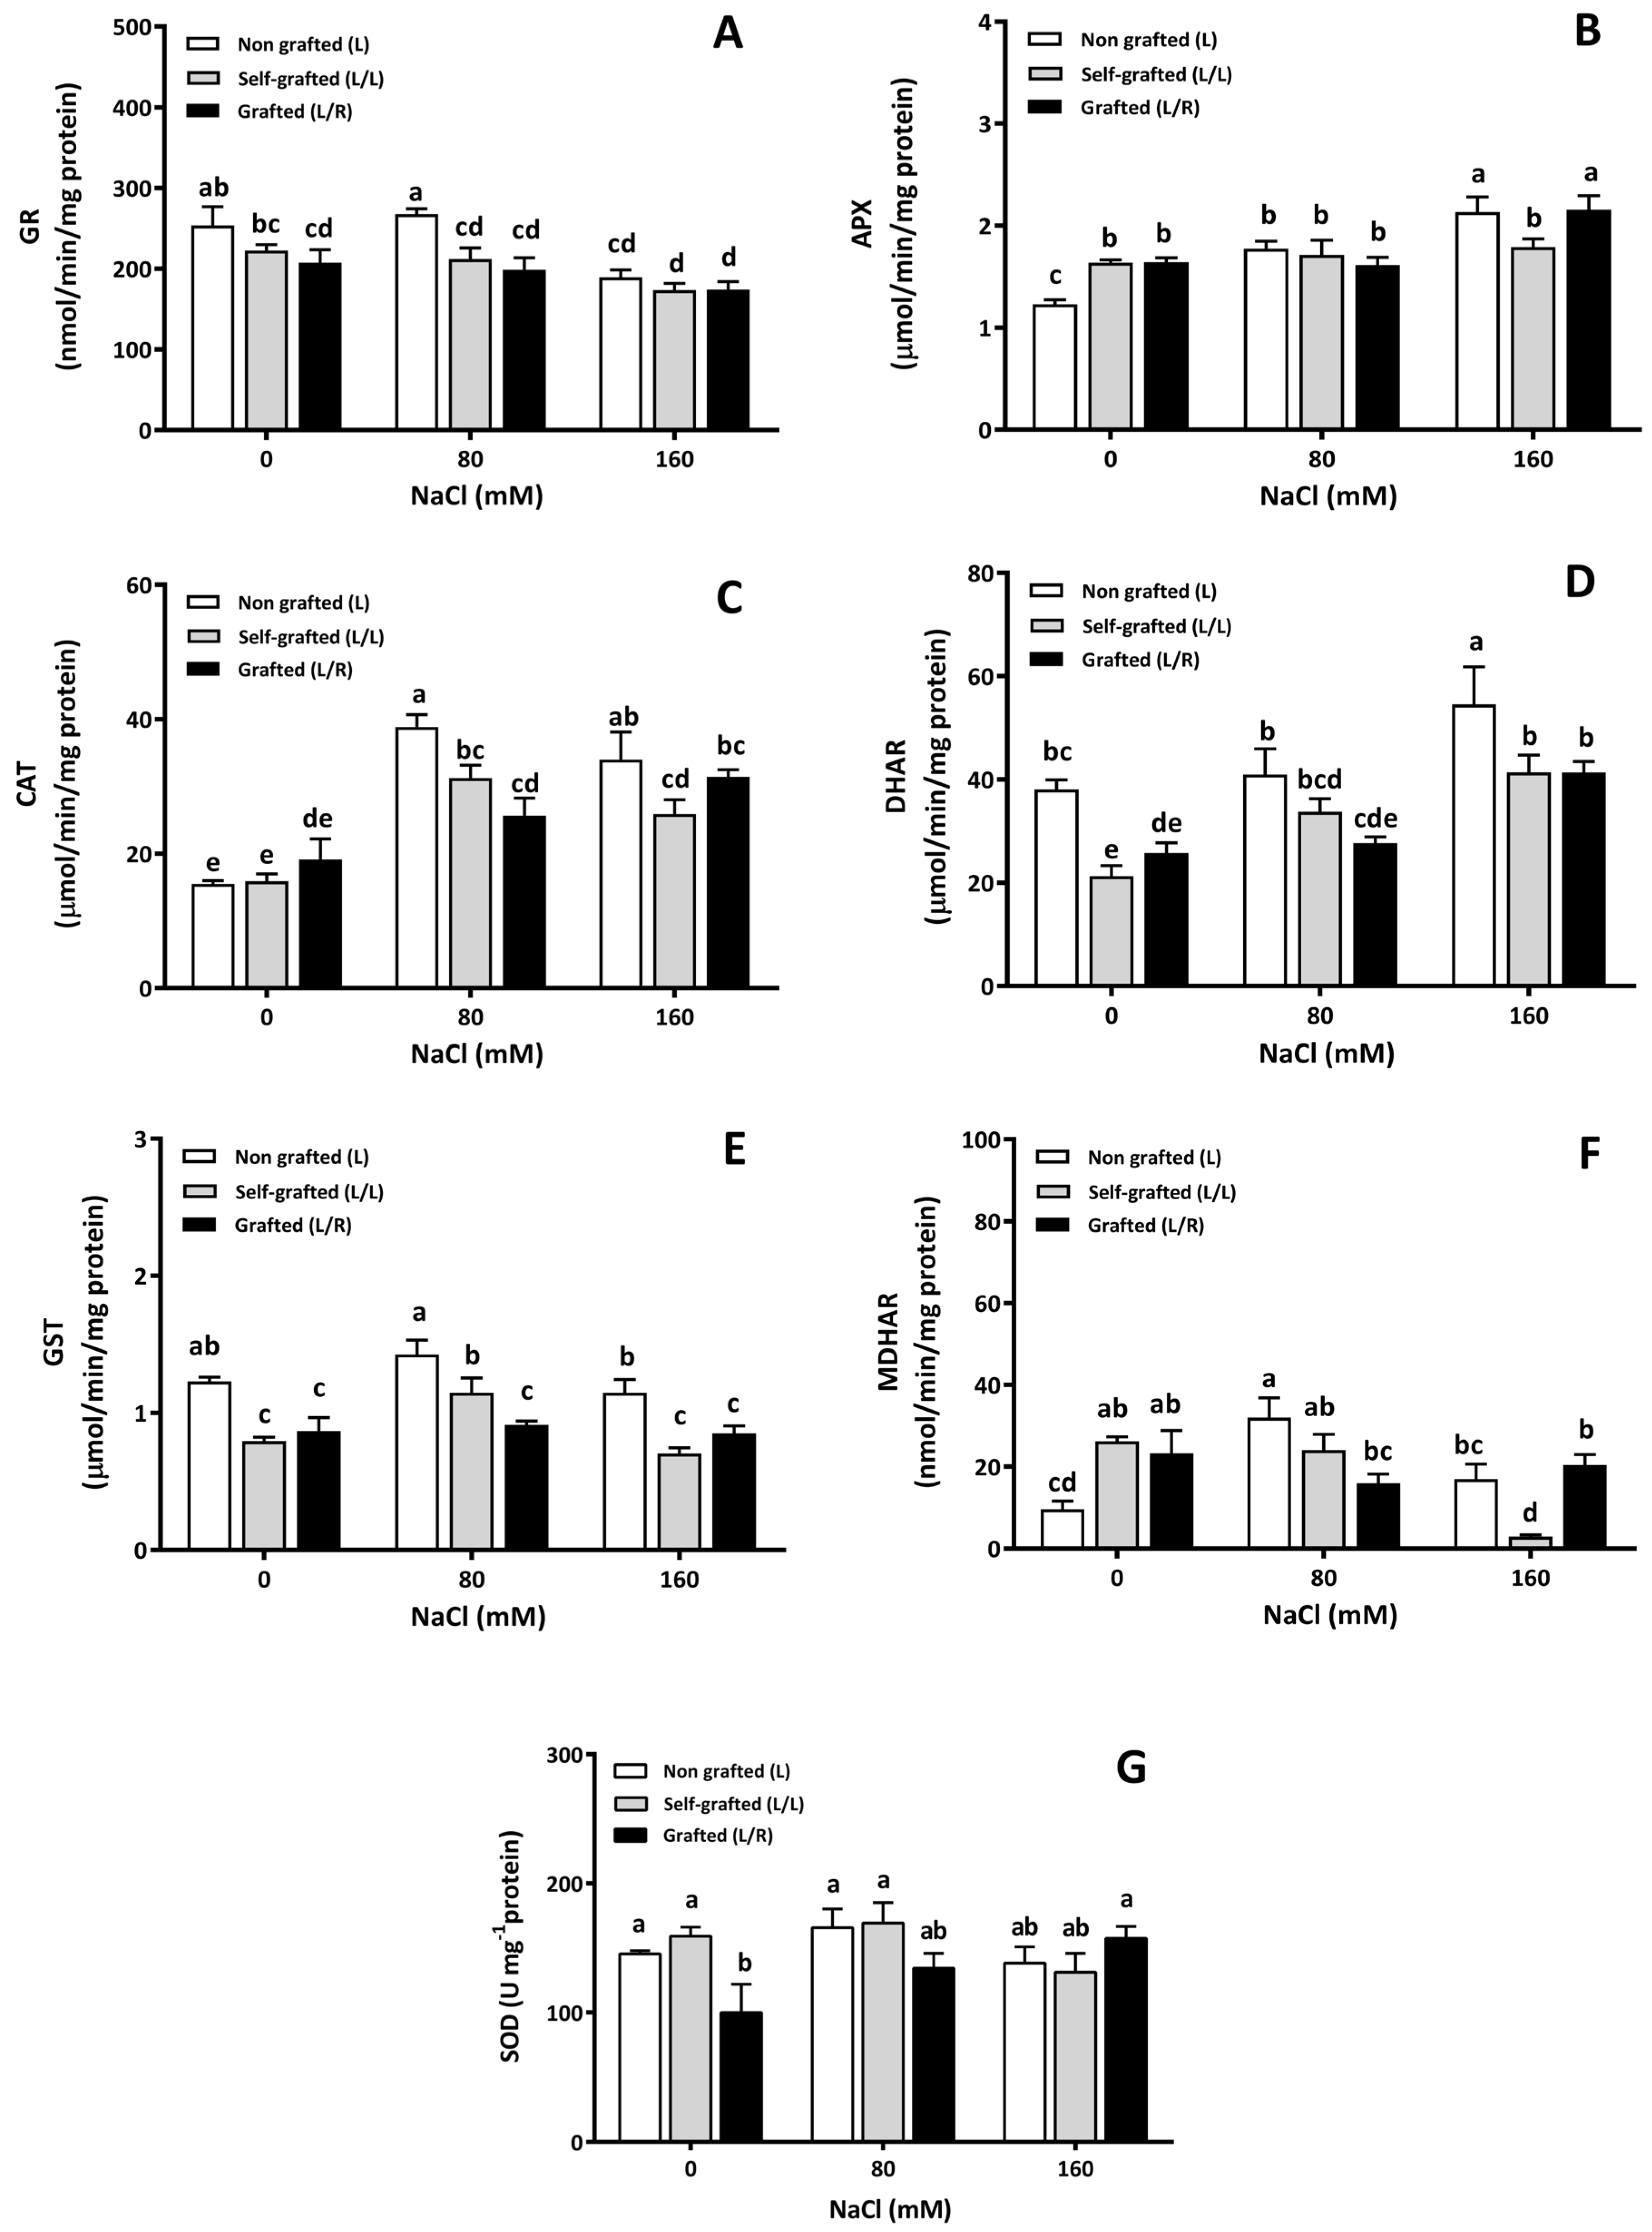
3.3. Management of Oxidative Stress
3.4. Na+ and K+ Concentrations
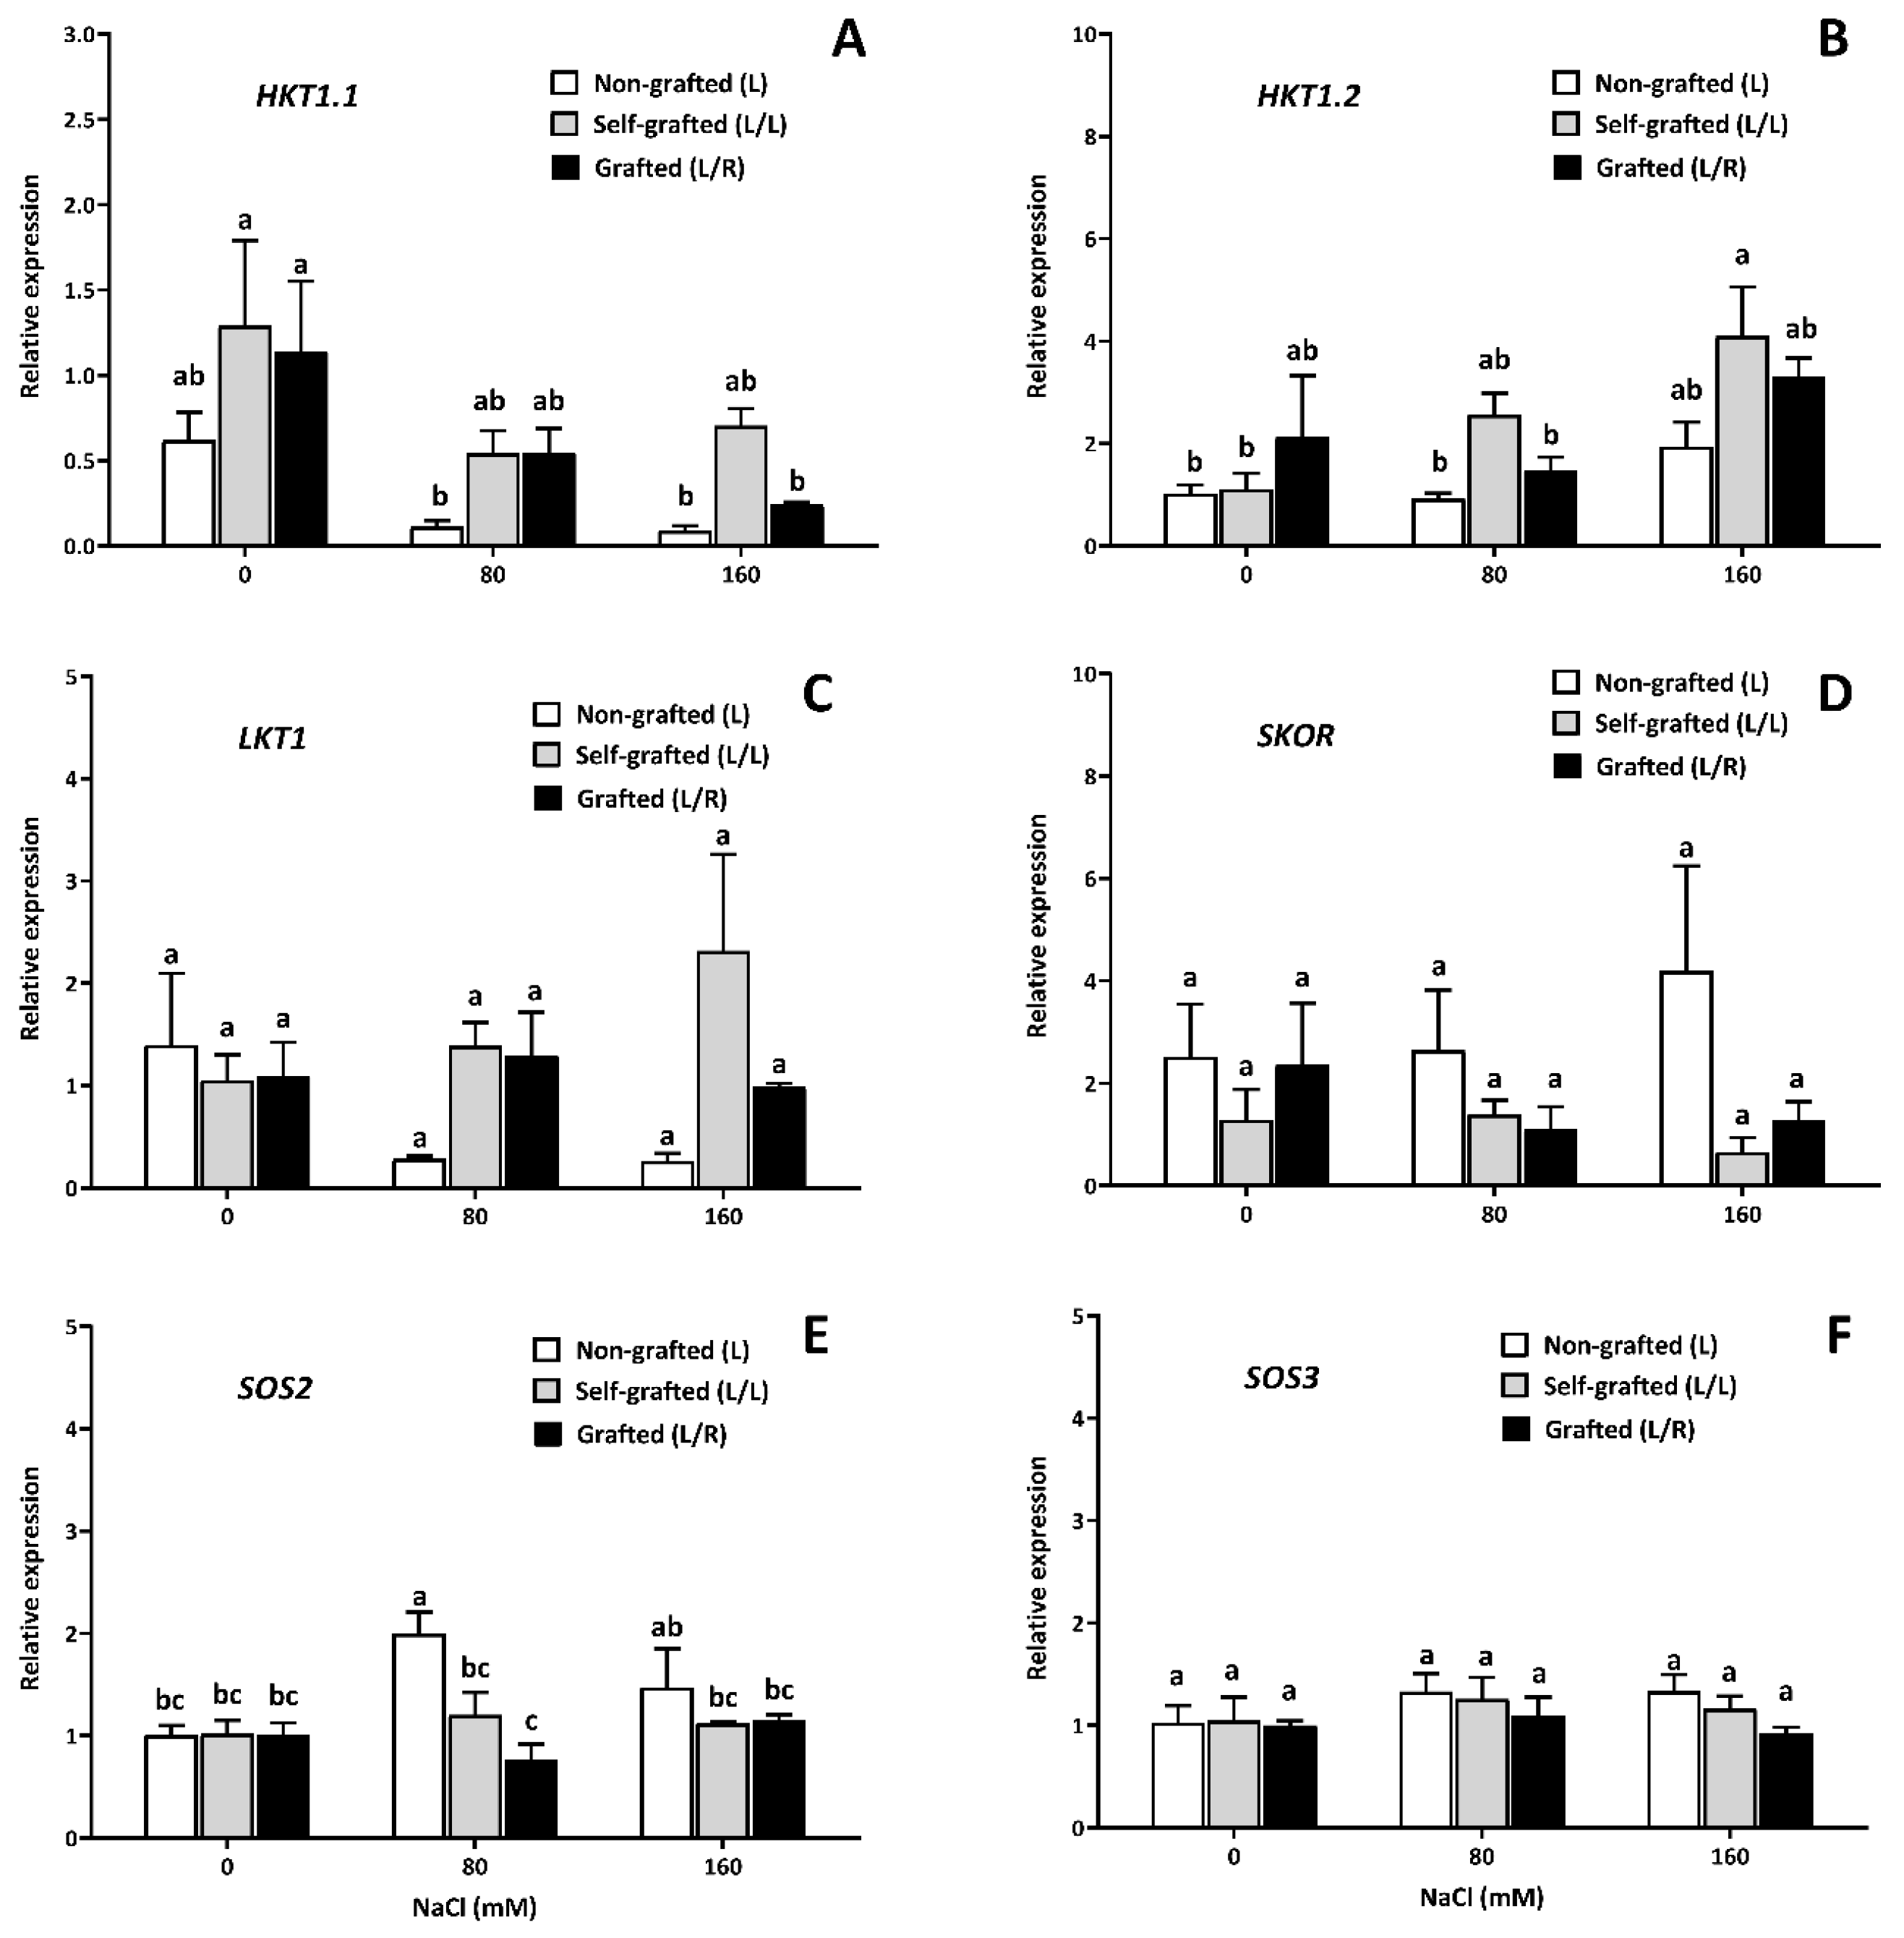
3.5. Gene Expression
4. Discussion
4.1. Effect of JUPAFORT1 Rootstock on Growth and Plant Water Status under Salinity
4.2. Effect of JUPAFORT1 on the Content of Photosynthetic Pigments, Protein, and MDA in the Plant under Saline Conditions
4.3. Effect of JUPAFORT1 on Plant Antioxidant Capacity and Activity under Salinity Conditions
4.4. Effect of JUPAFORT1 on Plant Na+ and K+ Levels under Salinity Conditions and Expression of Genes Coding for Ion Transporters
5. Conclusions
Supplementary Materials
Author Contributions
Funding
Institutional Review Board Statement
Informed Consent Statement
Data Availability Statement
Acknowledgments
Conflicts of Interest
References
- Fu, H.; Yang, Y. How plant tolerate salt stress. Curr. Issues Mol. Biol. 2023, 45, 5914–5934. [Google Scholar] [CrossRef]
- Rahman, M.M.; Mostofa, M.G.; Keya, S.S.; Siddiqui, M.N.; Ansary, M.E.U.; Das, A.K.; Rahman, M.A.; Tran, L.S.P. Adapatative mechanisms of halophyte and their potential in improving salinity tolerance in plants. Int. J. Mol. Sci. 2021, 22, 10733. [Google Scholar] [CrossRef]
- Atta, K.; Mondal, S.; Gorai, S.; Singh, A.P.; Kumari, A.; Ghosh, T.; Roy, A.; Hembram, S.; Gaiwad, D.J.; Mondal, S.; et al. Impacts of salinity stress on crop plants: Improving salt tolerance through genetic and molecular dissection. Front. Plant Sci. 2023, 14, 1241736. [Google Scholar] [CrossRef]
- Mann, A.; Lata, C.; Kumar, N.; Kumar, A.; Kumar, A.; Sheoran, P. Halophyte as new model plant species for salt tolerance strategies. Front. Plant Sci. 2023, 14, 1137211. [Google Scholar] [CrossRef]
- Marsic, N.K.; Vodnik, D.; Mikulic-Prtkovesk, M.; Veberic, R.; Sircelj, H. Photosynthetic traits of plants and biochemical profile of tomato fruits are influenced by grafting, salinity stress and growing season. J. Agric. Food Chem. 2018, 66, 5439–5450. [Google Scholar] [CrossRef]
- He, Y.; Zhu, Z.; Yang, J.; Ni, X.; Zhu, B. Grafting increases the salt tolerance of tomato by improvement of photosynthesis and enhancement of antioxidant enzymes activity. Environ. Exp. Bot. 2009, 66, 270–278. [Google Scholar] [CrossRef]
- Asins, M.J.; Villalta, A.M.M.; Olías, R.; Alvarez, D.E.; Morales, P.; Huertas, R.; Li, J.; Jaime-Pérez, N.; Haro, R.; Raga, V.; et al. Two closely linked tomato HKT coding genes are positional candidates for the major tomato QTL involved in Na+/K+ homeostasis. Plant Cell Environ. 2013, 36, 1171–1191. [Google Scholar] [CrossRef]
- Adams, E.; Shin, R. Transport, signaling, and homeostasis of potassium and sodium in plants. J. Integr. Plant Biol. 2014, 56, 231–249. [Google Scholar] [CrossRef]
- Coskun, D.; Britto, D.T.; Kronzucker, H.J. The physiology of channel-mediated K+ acquisition in roots of higher plants. Physiol. Plant. 2014, 151, 305–312. [Google Scholar] [CrossRef]
- Ali, A.; Raddatz, N.; Pardo, J.M.; Yun, D.J. HKT sodium and potassium transporters in Arabidopsis thaliana and related halophyte species. Physiol. Plant. 2021, 171, 546–558. [Google Scholar] [CrossRef]
- Ishikawa, T.; Shabala, S. Control of xylem Na+ loading and transport to the shoot in rice and barley as a determinant of differential salinity stress tolerance. Physiol. Plant. 2019, 165, 619–631. [Google Scholar] [CrossRef]
- Munns, R.; Tester, M. Mechanisms of salinity tolerance. Ann. Rev. Plant Biol. 2008, 59, 651–681. [Google Scholar] [CrossRef]
- Xie, Q.; Zhou, Y.; Jiang, X. Structure, function and regulation of the plasma membrane Na+/H+ antiporter Salt Overly Sensitive 1 in plants. Front. Plant Sci. 2022, 13, 866265. [Google Scholar] [CrossRef]
- Parvin, K.; Hasanuzzaman, M.; Bhuyan, M.H.; Nahar, K.; Mohsin, S.M.; Fujita, M. Comparative physiological and biochemical changes in Tomato (Solanum lycopersicum L.) under salt stress and recovery: Role of antioxidant defense and glyoxalase systems. Antioxidants 2019, 8, 350. [Google Scholar] [CrossRef]
- Chen, J.H.; Jiang, H.W.; Hsieh, E.J.; Chen, H.Y.; Chien, C.T.; Hsieh, H.L.; Lin, T.P. Drought and salt stress tolerance of an Arabidopsis glutathione S-transferase U17 knockout mutant are attributed to the combined effect of glutathione and abscisic acid. Plant Physiol. 2012, 158, 340–351. [Google Scholar] [CrossRef]
- Kunert, K.J.; Foyer, C.H. The ascorbate/glutathione cycle. Adv. Bot. Res. 2023, 105, 77–112. [Google Scholar]
- Martínez, J.P.; Jana, C.; Muena, V.; Salazar, E.; Rico, J.J.; Calabrese, N.; Hernandez, J.E.; Lutts, S.; Ruentes, F. The Recovery of the Old Limachino Tomato: History, Findings, Lessons, Challenges and Perspectives. In Agriculture Value Chain—Challenges and Trends in Academia and Industry; Hernández, J., Kacprzyk, J., Eds.; Studies in Systems, Decision and Control; Springer: Cham, Switzerland, 2021; Volume 280. [Google Scholar] [CrossRef]
- Jara, C. Efecto de la Fertilizacion (Convencional y Compost) Sobre la Productividad y Calidad de Tomate Limachino Antiguo y Larga Vida Bajo Adero en la Cuenca de Limache. Master’s Thesis, Universidad Técnica Federico Santa María, Santiago, Chile, 2016; 70p. [Google Scholar]
- Singh, H.; Kumar, P.; Kyriacou, M.C.; Colla, G.; Rouphael, Y. Grafting tomato as a tool to improve salt tolerance. Agronomy 2020, 10, 263. [Google Scholar] [CrossRef]
- Di Gioia, F.; Signore, A.; Serio, F.; Santamaria, P. Grafting improves tomato salinity tolerance through sodium partitioning within the shoot. HortScience 2013, 48, 855–862. [Google Scholar] [CrossRef]
- Contreras, C.; Montoya, A.; Pacheco, P.; Martínez-Ballesta, M.C.; Carvajal, M.; Bastías, E. The effects of the combination of salinity and excess boron on the water relations of tolerant tomato (Solanum lycopersicum L.) cv. Poncho Negro, in relation to aquaporin functionality. Span. J. Agric. Res. 2011, 9, 494–503. [Google Scholar] [CrossRef]
- Huanca-Mamani, W.; Cárdenas-Ninasivincha, S.; Acosta-García, G.; Alache, K.; Bastías, E. Expression analysis of three stress-related genes in response to excess of boron in Solanum lycopersicum cv. Poncho Negro. Idesia 2018, 36, 35–40. [Google Scholar] [CrossRef]
- Alfaro-Quezada, J.F.; Martínez, J.P.; Molinett, S.; Valenzuela, M.; Montenegro, I.; Ramírez, I.; Dorta, F.; Ávila-Valdés, A.; Gharbi, E.; Zhou, M.; et al. Rootstock increases the physiological defence of tomato plants against Pseudomonas syringae pv. tomato infection. J. Exp. Bot. 2023, 74, 2891–2911. [Google Scholar] [CrossRef]
- Tapia, G.; Mendez, J.; Inostroza, L. Different combinations of morpho-physiological traits are responsible for tolerance to drought in wild tomatoes Solanum chilense and Solanum peruvianum. Plant Biol. 2016, 18, 406–416. [Google Scholar] [CrossRef]
- Gálvez, F.J.; Baghour, M.; Hao, G.; Cagnac, O.; Rodríguez-Rosales, M.P.; Venema, K. Expression of LeNHX isoforms in response to salt stress in salt sensitive and salt tolerant tomato species. Plant Physiol. Biochem. 2012, 51, 109–115. [Google Scholar] [CrossRef]
- Aydin, A. The growth, leaf antioxidant enzymes and amino acid content of tomato as affected by grafting in wild tomato rootstocks (S. pimpinellifolium and S. habrochaites) under salt stress. Sci. Hortic. 2024, 325, 112679. [Google Scholar] [CrossRef]
- Albacete, A.; Martínez-Andújar, C.; Ghanem, M.E.; Acosta, M.; Sánchez-Bravo, J.; Asins, M.J.; Cuartero, J.; Lutts, S.; Dodd, I.C.; Pérez-Alfocea, F. Rootstock-mediated changes in xylem ionic and hormonal status are correlated with delayed leaf senescence and increased leaf area and crop productivity in salinized tomato. Plant Cell Environ. 2009, 32, 928–938. [Google Scholar] [CrossRef]
- Zeist, A.C.; Henschel, J.M.; Silva Júnior, A.D.; Almeida Oliveira, G.J.; Neto, J.G.; Beauboeuf, C.M.; Parthasarathi, T.; Vilela de Resende, J.T. Responses of rootstock viability to toleate salinity in tomato. S. Afr. J. Bot. 2023, 153, 280–289. [Google Scholar] [CrossRef]
- Martínez, J.P.; Antúnez, A.; Pertuzé, R.; Acosta, M.P.; Palma, X.; Fuentes, L.; Ayala, A.; Araya, H.; Lutts, S. Effects of saline water on water status, yield and fruit quality of wild (Solanum chilense) and domesticated (Solanum lycopersicum var. cerasiforme) tomatoes. Exp. Agric. 2012, 48, 573–586. [Google Scholar] [CrossRef]
- Martínez, J.P.; Antúnez, A.; Araya, H.; Pertuzé, R.; Fuentes, L.; Lizana, X.C.; Lutts, S. Salt stress differently affects growth, water status and antioxidant enzyme activities in Solanum lycopersicum and its wild relative Solanum chilense. Aust. J. Bot. 2014, 62, 359. [Google Scholar] [CrossRef]
- Gharbi, E.; Martínez, J.P.; Benahmed, H.; Fauconnier, M.L.; Lutts, S.; Quinet, M. Salicylic acid differently impacts ethylene and polyamine synthesis in the glycophyte Solanum lycopersicum and the wild-related halophyte Solanum chilense exposed to mild salt stress. Physiol. Plant. 2016, 158, 152–167. [Google Scholar] [CrossRef]
- Gharbi, E.; Martínez, J.P.; Benahmed, H.; Lepoint, G.; Vanpee, B.; Quinet, M.; Lutts, S. Inhibition of ethylene synthesis reduces salt-tolerance in tomato wild relative species Solanum chilense. J. Plant Physiol. 2017, 210, 24–37. [Google Scholar] [CrossRef]
- Gharbi, E.; Martínez, J.P.; Benahmed, H.; Dailly, H.; Quinet, M.; Lutts, S. The salicylic acid analog 2,6-dichloroisonicotinic acid has specific impact on the response of the halophyte plant species Solanum chilense to salinity. Plant Growth Regul. 2017, 82, 517–525. [Google Scholar] [CrossRef]
- Bigot, S.; Pongrac, P.; Šala, M.; van Elteren, J.T.; Martínez, J.P.; Lutts, S.; Quinet, M. The halophyte species Solanum chilense Dun. maintains its reproduction despite sodium accumulation in its floral organs. Plant 2022, 11, 672. [Google Scholar] [CrossRef]
- Bigot, S.; Fuksová, M.; Martínez, J.P.; Lutts, S.; Quinet, M. Sodium and chloride accumulation and repartition differed between the cultivated tomato (Solanum lycopersicum) and its wild halophyte relative Solanum chilense under salt stress. Sci. Hortic. 2023, 321, 112324. [Google Scholar] [CrossRef]
- Bigot, S.; Leclef, C.; Rosales, C.; Martínez, J.P.; Lutts, S.; Quinet, M. Comparison of the salt resistance of Solanum lycopersicum x Solanum chilense hybrids and their parents. Front. Hortic. 2023, 2, 1130702. [Google Scholar] [CrossRef]
- Ghanem, M.E.; Hichri, I.; Smigocki, A.C.; Albacete, A.; Fauconnier, M.L.; Diatloff, E.; Martinez-Andujar, C.; Lutts, S.; Dodd, I.C.; Pérez-Alfocea, F. Root-targeted biotechnology to mediate hormonal signalling and improve crop stress tolerance. Plant Cell Rep. 2011, 30, 807–823. [Google Scholar] [CrossRef]
- Martínez-Andújar, C.; Martínez-Pérez, A.; Albacete, A.; Martínez Melgarejo, P.A.; Dodd, I.A.; Thompson, A.J.; Mohareb, F.; Estelles-Lopez, L.; Kevei, Z.; Ferrández-Ayela, A.; et al. Overproduction of ABA in rootstocks alleviates salinity stress in tomato shoots. Plant Cell Environ. 2021, 44, 2966–2986. [Google Scholar] [CrossRef]
- Martínez, J.P.; Rosales, C.; Salinas, L.; Farías, K.; Lizana, C.; Quinet, M.; Lutts, S.; Tan, M.L. Micropropagación de un portainjerto INIA tolerante a la salinidad creado a partir del cruce entre Solanum lycopersicum y Solanum chilense. In Proceedings of the 70° Congreso Agronómico Formación Agronómica para el 2030 Tradición y Futuro, Santiago, Chile, 7–9 January 2020. [Google Scholar]
- Martínez, J.P.; Fuentes, R.; Farías, K.; Lizana, C.; Alfaro, J.F.; Fuentes, L.; Calabrese, N.; Bigot, S.; Quinet, M.; Lutts, S. Effects of saline stress on fruit antioxidant capacity of wild (Solanum chilense) and domesticated (Solanum lycopersicum var. cerasiforme) tomatoes. Agronomy 2020, 10, 1481. [Google Scholar] [CrossRef]
- Martínez, J.P.; Fuentes, R.; Farías, K.; Loyola, N.; Freixas, A.; Stange, C.; Sagredo, B.; Quinet, M.; Lutts, S. Effects of a local tomato rootstock on the agronomic, functional and sensory quality of the fruit of a recovered local tomato (Solanum lycopersicum L.) named “Tomate Limachino Antiguo”. Agronomy 2022, 12, 2178. [Google Scholar] [CrossRef]
- Martínez, J.P.; Lutts, S.; Schanck, A.; Bajji, M.; Kinet, J.M. Is osmotic adjustment required for water stress resistance in the Mediterranean shrub Atriplex halimus L.? J. Plant Physiol. 2004, 161, 1041–1051. [Google Scholar] [CrossRef]
- Swoczyna, T.; Kalaji, H.M.; Bussotti, F.; Mojski, J.; Pllastrini, M. Environmental stress—What can we learn from chlorophyll a fluorescence analysis in woody plants? A review. Front. Plant Sci. 2022, 13, 1048582. [Google Scholar] [CrossRef]
- Lichtenthaler, H.K. Chlorophylls and carotenoids: Pigments of photosynthetic biomembranes. Methods Enzymol. 1987, 148, 350–382. [Google Scholar]
- Heath, R.L.; Packer, L. Photoperoxidation in isolated chloroplasts: I. Kinetics and stoichiometry of fatty acid peroxidation. Arch. Biochem. Biophys. 1968, 125, 189–198. [Google Scholar] [CrossRef]
- Benzie, I.; Strain, J.J. The ferric reducing ability of plasma (FRAP) as a measure of “antioxidant power”: The FRAP assay. Anal. Biochem. 1996, 239, 70–76. [Google Scholar] [CrossRef]
- Brand-Williams, W.; Cuvelier, M.E.; Berset, C. Use of freee radical method to evaluate antioxidant activity. Food Sci. Technol. 1995, 28, 25–30. [Google Scholar]
- Singleton, V.; Rossi, J. Colorimetry of total phenolics with phosphomolybdic and phosphotungstic acid reagents. Am. J. Enol. Vitic. 1965, 16, 144–148. [Google Scholar] [CrossRef]
- Kampfenkel, K.; Vanmontagu, M.; Inze, D. Extraction and determination of ascorbate and dehydroascorbate from plant tissue. Anal. Biochem. 1995, 225, 165–167. [Google Scholar] [CrossRef]
- Cereser, C.; Guichard, J.; Drai, J.; Bannier, E.; Garcia, I.; Boget, S.; Parvaz, P.; Revol, A. Quantitation of reduced and total glutathione at the femtomole level by high-performance liquid chromatography with fluorescence detection: Application to red blood cells and cultured fibroblasts. J. Chromatogr. B Biomed. Sci. Appl. 2001, 752, 123–132. [Google Scholar] [CrossRef]
- Zhou, M.X.; Dailly, H.; Renard, M.E.; Han, R.M.; Lutts, S. NaCl impact on Kosteletzkya pentacarpos seedlings simultaneously exposed to cadmium and zinc toxicities. Environ. Sci. Pollut. Res. 2018, 25, 17444–17456. [Google Scholar] [CrossRef]
- Gupta, A.S.; Webb, R.P.; Holaday, A.S.; Allen, R.D. Overexpression of superoxide dismutase protects plants from oxidative stress (induction of ascorbate peroxidase in superoxide dismutase-overexpressing plants). Plant Physiol. 1993, 103, 1067–1073. [Google Scholar] [CrossRef]
- Nakano, Y.; Asada, K. Hydrogen peroxide scavenged by ascorbate specific peroxidase in spinach chloroplast. Plant Cell Physiol. 1981, 22, 867–880. [Google Scholar] [CrossRef]
- Miyake, C.; Asada, K. Thylakoid bound ascorbate peroxidase in spinach chloroplasts and photoreduction of its primary oxidation product monodehydroascorbate radicals in thylakoids. Plant Cell Physiol. 1992, 33, 541–553. [Google Scholar] [CrossRef]
- Beyer, W.F.; Fridovitch, I. Assaying for superoxide dismutase activity: Some large consequences of minor changes in conditions. Anal. Biochem. 1987, 161, 559–566. [Google Scholar] [CrossRef]
- Yu, Q.; Osborne, L.; Rengel, Z. Micronutrient deficiency changes activities of superoxide dismutase and ascorbate peroxidase in tobacco plants. J. Plant Nutr. 1998, 21, 1427–1437. [Google Scholar] [CrossRef]
- Bradford, M.M. A rapid sensitive method for the quantification of microquantities of protein utilizing the principle of protein dye binding. Anal. Biochem. 1976, 161, 559–566. [Google Scholar]
- López-Gómez, R.; Gómez-Lim, M.A. A method for extracting intact RNA from fruits rich in polysaccharides using ripe mango mesocarp. HortScience 1992, 27, 440–442. [Google Scholar] [CrossRef]
- Pfaffl, M.W. A new mathematical model for relative quantification in real-time RT-PCR. Nucleic Acids Res. 2001, 29, e45. [Google Scholar] [CrossRef]
- Öztekin, G.B.; Giuffrida, F.; Tüzel, Y.; Leonardi, C. Is the vigour of grafted tomato plants related to root characteristics. J. Agric. Food Environ. 2009, 7, 364–368. [Google Scholar]
- Munns, R.; Gilliham, M. Salinity tolerance of crops—What is the cost? New Phytol. 2015, 208, 668–673. [Google Scholar] [CrossRef]
- Munns, R.; Day, D.A.; Fricke, W.; Watt, M.; Arsova, B.; Barkla, B.J.; Bose, J.; Byrt, C.S.; Chen, Z.-H.; Foster, K.J.; et al. Energy costs of salt tolerance in cop plants. New Phytol. 2020, 225, 1072–1090. [Google Scholar] [CrossRef]
- Martínez, J.P.; Silva, H.; Ledent, J.F.; Pinto, M. Effect of drought stress on the osmotic adjustment, cell wall elasticity and cell volume of six cultivars of common beans (Phaseolus vulgaris L.). Eur. J. Agron. 2007, 26, 30–38. [Google Scholar] [CrossRef]
- Hussain, H.A.; Hussain, S.; Khaliq, A.; Ashraf, U.; Anjum, S.A.; Men, S.; Wang, L. Chilling and drought stresses in crop plants: Implication, cross talk, and potential management opportunities. Front. Plant Sci. 2018, 9, 393. [Google Scholar] [CrossRef] [PubMed]
- Coban, A.; Akhoundnejad, Y.; Dere, S.; Yildiz Dasgan, H. Impact of salt-tolerant rootstock on the enhancement of sensitive tomato plant responses to salinity. HortScience 2020, 55, 35–39. [Google Scholar] [CrossRef]
- Hochberg, U.; Rockwell, F.E.; Holbrook, N.M.; Cochard, H. Iso/Anisohydry: A plant-environment interaction rather tan a simple hydraulic traiy. Trends Plant Sci. 2018, 23, 112–120. [Google Scholar] [CrossRef] [PubMed]
- Martínez, J.P.; Araya, H. Ascorbate–Glutathione Cycle: Enzymatic and Non-enzymatic Integrated Mechanisms and Its Biomolecular Regulation. In Ascorbate-Glutathione Pathway and Stress Tolerance in Plants; Anjum, N., Chan, M.T., Umar, S., Eds.; Springer: Dordrecht, The Netherland, 2010. [Google Scholar] [CrossRef]
- Considine, M.J.; Foyer, C.H. Oxygen and reactive oxygen species-dependent regulation of plant growth and development. Plant Physiol 2021, 186, 79–92. [Google Scholar] [CrossRef] [PubMed]
- Considine, M.J.; Foyer, C.H. Stress effects on the reacyiove oxygen species-dependent regulation of plant growth and development. J. Exp. Bot. 2021, 72, 5795–5806. [Google Scholar] [CrossRef] [PubMed]
- Alzahib, R.H.; Migdadi, H.M.; Al Ghamdi, A.A.; Alwahibi, M.S.; Ibrahim, A.A.; Al-Selwey, W.A. Assessment of morpho-physiological, biochemical and antioxidant responses of tomato landraces to salinity stress. Plants 2021, 10, 696. [Google Scholar] [CrossRef] [PubMed]
- Xu, J.; Xing, X.J.; Tian, Y.S.; Peng, R.H.; Xue, Y.; Zhao, W.; Yao, Q.H. Transgenic Arabidopsis plants expressing tomato Glutathione S-Transferase showed enhanced resistance to salt and drought stress. PLoS ONE 2015, 10, e0136960. [Google Scholar] [CrossRef]
- Hasanuzzaman, M.; Bhuyan, M.H.M.B.; Anee, T.I.; Parvin, K.; Nahar, K.; Mahmud, J.A.; Fujita, M. Regulation of ascorbate-glutathione pathway in mitigating oxidative damage in plants under abiotic stress. Antioxidants 2019, 8, 384. [Google Scholar] [CrossRef] [PubMed]
- Litalien, A.; Zeed, B. Curing the earth: A review of anthropogenic soil salinization and plant-based strategy for sustainable mitigation. Sci. Total Environ. 2020, 698, 134235. [Google Scholar] [CrossRef] [PubMed]
- Almeida, P.; de Boer, G.-J.; de Boer, A.H. Differences in shoot Na+ accumulation between two tomato species are due to differences in ion affinity of HKT1;2. J. Plant Physiol. 2014, 171, 438–447. [Google Scholar] [CrossRef]
- Venkatarama, G.; Shabal, S.; Véry, A.A.; Hariharan, G.N.; Somasundaram, S.; Pulipati, S.; Sellamuthu, G.; Harikrishnan, M.; Kumari, K.; Shabala, L.; et al. To exclude or accumulate? Revealing the role of sodium HKT1;5 transporter in plant adaptative responses to varying soil salinity. Plant Physiol. Biochem. 2021, 169, 333–342. [Google Scholar] [CrossRef] [PubMed]
- Ji, H.; Pardo, J.M.; Batelli, G.; Van Oosten, M.J.; Bressan, R.A.; Li, X. The Salt Overly Sensitive (SOS) pathway: Established and emerging roles. Mol. Plant 2013, 6, 275–286. [Google Scholar] [CrossRef] [PubMed]
- Belver, A.; Olías, R.; Huertas, R.; Rodríguez-Rosales, M.P. Involvement of SlSOS2 in tomato salt tolerance. Bioengineered 2012, 3, 298–302. [Google Scholar] [CrossRef] [PubMed]
- Nieves-Cordones, M.; Al Shiblawi, F.R.; Sentenac, H. Roles and transport of sodium and potassium in plants. In The Alkali Metal Ions: Their Role For Life; Sigel, A., Sigel, H., Sigel, R.K.O., Eds.; Metal Ions in Life Sciences; Springer International Publishing: Cham, Switzerland, 2016; Volume 16, pp. 291–324. [Google Scholar]
- Yang, Y.; Guo, Y. Unraveling salt stress signaling in plants. J. Integr. Plant Biol. 2018, 60, 796–804. [Google Scholar] [CrossRef] [PubMed]
- Guo, M.; Wang, X.S.; Guo, H.D.; Bai, S.Y.; Khan, A.; Wang, X.M.; Gao, Y.M.; Li, J.S. Tomato salt tolerance mechanisms and their potential applications for fighting salinity: A review. Front. Plant Sci. 2022, 13, 949541. [Google Scholar] [CrossRef]
- Huertas, R.; Olias, R.; Eljakaoui, Z.; Gálvez, F.J.; Li, J.U.N.; De Morales, P.A.; Belver, A.; Rodríguez-Rosales, M.P. Overexpression of SlSOS2 (SlCIPK24) confers salt tolerance to transgenic tomato. Plant Cell Environ. 2012, 35, 1467–1482. [Google Scholar] [CrossRef]


| Non-Grafted (L) | Self-Grafted (L/L) | Grafted (L/R) | |||||||
|---|---|---|---|---|---|---|---|---|---|
| NaCl (mM) | NaCl (mM) | NaCl (mM) | |||||||
| Water status variable | 0 | 80 | 160 | 0 | 80 | 160 | 0 | 80 | 160 |
| Ψwp (MPa) | −0.46 ± 0.06 a | −0.37 ± 0.10 a | −0.24 ± 0.03 a | −0.33 ± 0.03 a | −0.29 ± 0.05 a | −0.37 ± 0.11 a | −0.39 ± 0.08 a | −0.34 ± 0.08 a | −0.26 ± 0.06 a |
| Ψwn (MPa) | −0.45 ± 0.07 ab | −0.51 ± 0.09 a | −0.49 ± 0.09 a | −0.53 ± 0.07 a | −0.56 ± 0.12 a | −0.33 ± 0.06 b | −0.33 ± 0.05 b | −0.35 ± 0.06 b | −0.22 ± 0.01 c |
| Ψwx (MPa) | −0.31 ± 0.04 a | −0.40 ± 0.09 a | −0.36 ± 0.08 a | −0.39 ± 0.06 a | −0.42 ± 0.06 a | −0.59 ± 0.10 a | −0.43± 0.06 a | −0.31 ± 0.05 a | −0.44 ± 0.15 a |
| RWCp (%) | 93.63 ± 0.94 a | 84.76 ± 2.43 abc | 79.26 ± 1.97 c | 91.74 ± 2.40 ab | 82.05 ± 2.21 c | 82.03 ± 5.69 c | 91.76 ± 2.32 ab | 86.83 ± 2.62 abc | 81.68 ± 2.59 c |
| RWCn (%) | 82.90 ± 3.00 a | 80.00 ± 1.25 b | 73.60 ± 0.84 b | 82.17 ± 5.59 a | 80.67 ± 1.59 a | 72.39 ± 2.09 b | 78.38 ± 3.48 a | 78.18 ± 2.39 a | 72.54 ± 3.22 b |
| WCDWp (g/g) | 10.17 ± 0.43 a | 8.86 ± 0.33 a | 8.50 ± 0.17 a | 10.78 ± 0.74 a | 9.42 ± 0.68 a | 9.96 ± 1.79 a | 10.37 ± 1.31 a | 10.22 ± 1.50 a | 11.82 ± 0.41 a |
| WCDWn (g/g) | 9.23 ± 0.87 a | 8.76 ± 0.32 a | 9.27 ± 1.51 a | 8.71 ± 0.54 a | 8.77 ± 0.76 a | 9.72 ± 0.23 a | 7.76 ± 1.02 a | 9.25 ± 0.81 a | 9.85 ± 2.61 a |
| Non-Grafted (L) | Self-Grafted (L/L) | Grafted (L/R) | ||||||||
|---|---|---|---|---|---|---|---|---|---|---|
| NaCl (mM) | NaCl (mM) | NaCl (mM) | ||||||||
| 0 | 80 | 160 | 0 | 80 | 160 | 0 | 80 | 160 | ||
| Leaf | Na+(mmol g−1 DW) | 0.07 ± 0.01 b | 0.54 ± 0.10 a | 0.67 ± 0.10 a | 0.09 ± 0.03 b | 0.67 ± 0.22 a | 0.86 ± 0.09 a | 0.08 ± 0.01 b | 0.61 ± 0.16 a | 0.79 ± 0.27 a |
| K+ (mmol g−1 DW) | 1.29 ± 0.1 abc | 1.02 ± 0.04 cde | 0.99 ± 0.06 cde | 1.39 ± 0.10 ab | 1.08 ± 0.12 bcd | 0.74 ± 0.17 e | 1.40 ± 0.07 a | 1.03 ± 0.06 cd | 0.93 ± 0.1 cde | |
| Na+/K+ | 0.06 ± 0.02 c | 0.52 ± 0.09 b | 0.70 ± 0.12 b | 0.08 ± 0.03 c | 0.71 ± 0.19 b | 1.30 ± 0.27 a | 0.06 ± 0.01 c | 0.63 ± 0.21 b | 0.87 ± 0.32 b | |
| Stem | Na+(mmol g−1 DW) | 0.09 ± 0.01 b | 0.70 ± 0.13 a | 0.77 ± 0.09 a | 0.09 ± 0.01 b | 0.79 ± 0.07 a | 1.03 ± 0.19 a | 0.13 ± 0.02 b | 0.74 ± 0.19 a | 0.93 ± 0.31 a |
| K+ (mmol g−1 DW) | 2.20 ± 0.14 b | 1.95 ± 0.07 c | 1.91 ± 0.10 c | 2.46 ± 0.18 b | 1.88 ± 0.06 c | 1.85 ± 0.08 c | 2.78 ± 0.23 a | 1.93 ± 0.11 c | 1.83 ± 0.11 c | |
| Na+/K+ | 0.04 ± 0.00 b | 0.35 ± 0.06 a | 0.41 ± 0.06 a | 0.04 ± 0.01 b | 0.43 ± 0.05 a | 0.57 ± 0.05 a | 0.05 ± 0.01 b | 0.40 ± 0.13 a | 0.49 ± 0.14 a | |
| Root | Na+(mmol g−1) | 0.08 ± 0.02 c | 0.45 ± 0.03 ab | 0.67 ± 0.07 a | 0.04 ± 0.01 c | 0.56 ± 0.11 ab | 0.73 ± 0.08 a | 0.14 ± 0.02 c | 0.43 ± 0.02 ab | 0.59 ± 0.02 ab |
| K+ (mmol g−1) | 0.49 ± 0.08 a | 0.48 ± 0.06 a | 0.69 ± 0.07 a | 0.51 ± 0.09 a | 0.83 ± 0.31 a | 0.64 ± 0.13 a | 0.65 ± 0.17 a | 0.45 ± 0.17 a | 0.37 ± 0.16 a | |
| Na+/K+ | 0.22 ± 0.07 c | 1.06 ± 0.19 b | 1.08 ± 0.18 b | 0.09 ± 0.03 c | 0.90 ± 0.26 b | 1.28 ± 0.25 ab | 0.28 ± 0.06 c | 1.09 ± 0.20 b | 1.66 ± 0.17 a | |
Disclaimer/Publisher’s Note: The statements, opinions and data contained in all publications are solely those of the individual author(s) and contributor(s) and not of MDPI and/or the editor(s). MDPI and/or the editor(s) disclaim responsibility for any injury to people or property resulting from any ideas, methods, instructions or products referred to in the content. |
© 2024 by the authors. Licensee MDPI, Basel, Switzerland. This article is an open access article distributed under the terms and conditions of the Creative Commons Attribution (CC BY) license (https://creativecommons.org/licenses/by/4.0/).
Share and Cite
Martínez, J.-P.; Fuentes, R.; Badilla, D.; Rosales, C.; Alfaro-Quezada, J.F.; Correa, F.; Lizana, C.; Sagredo, B.; Quinet, M.; Lutts, S. Improving the Salt Tolerance of “Old Limachino Tomato” by Using a New Salt-Tolerant Rootstock. Horticulturae 2024, 10, 780. https://doi.org/10.3390/horticulturae10080780
Martínez J-P, Fuentes R, Badilla D, Rosales C, Alfaro-Quezada JF, Correa F, Lizana C, Sagredo B, Quinet M, Lutts S. Improving the Salt Tolerance of “Old Limachino Tomato” by Using a New Salt-Tolerant Rootstock. Horticulturae. 2024; 10(8):780. https://doi.org/10.3390/horticulturae10080780
Chicago/Turabian StyleMartínez, Juan-Pablo, Raúl Fuentes, Danitza Badilla, Camila Rosales, Juan Felipe Alfaro-Quezada, Francisco Correa, Carolina Lizana, Boris Sagredo, Muriel Quinet, and Stanley Lutts. 2024. "Improving the Salt Tolerance of “Old Limachino Tomato” by Using a New Salt-Tolerant Rootstock" Horticulturae 10, no. 8: 780. https://doi.org/10.3390/horticulturae10080780