Article

Effects of Low-Phosphorus Stress on Use of Leaf Intracellular Water and Nutrients, Photosynthesis, and Growth of Brassica napus L.

1
School of Agricultural Engineering, Jiangsu University, Zhenjiang 212013, China
2
State Key Laboratory of Environmental Geochemistry, Institute of Geochemistry, Chinese Academy of Sciences, Guiyang 550081, China
3
Key Laboratory of Aqueous Environment Protection and Pollution Control of Yangtze River in Anhui of Anhui Provincial Education Department, School of Resource and Environment, Anqing Normal University, Anqing 246133, China
*
Authors to whom correspondence should be addressed.
Horticulturae 2024, 10(8), 821; https://doi.org/10.3390/horticulturae10080821 (registering DOI)
Submission received: 15 June 2024 / Revised: 31 July 2024 / Accepted: 1 August 2024 / Published: 2 August 2024
(This article belongs to the Special Issue Advances in Ecophysiology of Horticultural Crops)

Abstract

:
Phosphorus (P) deficiency is one of the main reasons limiting plant production of Brassica napus L. Exploring the dynamics of leaf intracellular substances and the correlations with photosynthesis and growth helps to understand the response mechanisms of B. napus L. to P deficiency. This study conducted experiments on B. napus L. plants by measuring the leaf electrophysiological parameters, leaf structure, elastic modulus (Em), photosynthesis, and growth indices under different P treatment conditions. The dynamics of leaf intracellular water and nutrients of B. napus L. were calculated and analyzed by using the electrophysiological parameters, and the plant tolerance threshold to low-P stress was discovered. The results indicated that the status of the leaf intracellular water and nutrients remained stable when the P concentration was not lower than 0.250 mmol·L−1, but maximized the photosynthesis and growth at a P level of 0.250 mmol·L−1. The 0.125 mmol·L−1 P concentration significantly decreased the mesophyll cell volume, and the palisade–sponge ratio and tightness degree of leaf tissue structure were remarkably increased. This led to an increase in cell elastic modulus, and significantly improved the water retention capacity of leaf cells. At the same time, the intracellular water use efficiency and total nutrient transport capacity of leaves remained stable. As a result, the photosynthesis and growth of plants were maintained at the same level as that of the control group. However, photosynthesis and growth were clearly inhibited with a further decrease in P concentration. Therefore, 0.125 mmol·L−1 was the tolerance threshold of B. napus L. to low P. With the help of electrophysiological information, the effects of the dynamics of intracellular substances on photosynthesis and growth of B. napus L. under low-P stress can be investigated, and the plant’s adaptive response can be revealed. However, the findings of the current hydroponic study are not directly applicable to field conditions with naturally P-deficient soils.

1. Introduction

Brassica napus L., a commonly cultivated type of rape, can be eaten as a healthy vegetable and has ornamental value; it is characterized by wide adaptabilities [1]. However, B. napus L. is sensitive to phosphorus (P) deficiency [2]. Rape is an important oil crop in China; the main planting area of this crop is located in southern China, where plants always suffer from P deficiency because of considerably shallow soil and very low P availability, leading to a significant decrease in yield production [3]. The rapeseed yield can be improved by widely applying phosphate fertilizer; however, the excessive application will decrease its use efficiency, resulting in environmental pollution and causing a threat to the sustainable development of the agroecosystem [4,5]. Improving the accuracy of fertilization is an effective way to increase the use efficiency of phosphate fertilizer. In addition, natural P resources are limited and decreasing, which threatens food security and agricultural production. Reducing the use of P helps to protect the ecological environment and promote the sustainable development of agriculture [6]. Research on the response traits of plants to low P helps to accurately obtain the P demand information and improve the phosphate use efficiency in plants.
P is one of the essential macronutrients for plant growth and development [7]. It is not only an important component of organic compounds in plants but also participates in physiological processes including energy metabolism, photosynthesis, respiration, and carbohydrate metabolism [8,9,10]. The application of P fertilizer can affect the absorption and accumulation of nutrients in B. napus L. [11]. Compared with high-P conditions, low-P treatment reduced the biomass and seed yield of B. napus L., and affected the absorption of P and root growth [12]. Photosynthesis of B. napus L decreased due to P deficiency [13]. Under low-P treatment, B. napus L. can mobilize more soluble P to maintain growth by increasing root surface area and root hair length [14,15], or produce local rhizosphere acidification to adapt to a low-P environment [16]. B. napus L. can increase the activity of phosphate transporters by upregulating the expression of genes encoding high-affinity phosphate transport, thereby improving the transport and reuse of P in plants [17,18]. Low-P stress can promote the upregulation of genes that synthesize plant cell walls, cause cell wall loosening, change cell volume, and affect the stability of cell membrane structure [19,20], and finally affect the transmembrane transport of intracellular substances, which are closely related to the photosynthesis and growth of plants and subsequently change the plant tolerance to P deficiency. At present, most studies have explored the effects of low-P stress on the growth, photosynthesis, and nutrient elements of B. napus L. Research on elastic modulus and leaf anatomical structure, especially on the dynamic changes of intracellular substances of B. napus L. under P deficiency, are still limited; the use traits of leaf intracellular water and nutrients and the influences on photosynthesis and growth of B. napus L. under low-P conditions remain unknown.
Water retained within leaf cells and other intracellular substances are directly related to plant photosynthesis, growth, and other life activities [21]. At present, research on the metabolic characteristics of intracellular water and other substances is mostly conducted by using methods including molecular, live imaging, transmission electron microscopy and spectroscopy [22,23,24,25]. However, they cannot quickly determine the dynamics of the intracellular water and nutrients. As a newly emerging sensor technology, electrophysiology is sensitive to environmental changes and can be measured easily and in a timely manner; it has been increasingly used for monitoring plant responses to the environments [26]. When plants are subjected to adversities, their physiological activities will change and then generate corresponding electrical signals. Plant electrical signals refer to signals that can record the fluctuation of potential, current, and resistance in plant cells or tissues [27], which can quickly characterize the internal growth of plants and changes in the external environment. Plants rely on electrical signals to coordinate with chemical and hydraulic signals to regulate their physiological functions [28]. Many scientists have carried out a lot of work in determining changes in plant bioelectricity to characterize plant growth and development and stress resistance, and have made certain contributions to the progress and development of plant electrophysiology. In our previous study, we successfully measured the real-time and intrinsic electrophysiological information of plants using a self-made parallel plate capacitive sensor, which can quickly determine the metabolism of intracellular water and nutrients [29,30]. The electrophysiological technique is easy to operate, responsive, and meanwhile, causes no damage to plants, so it can be used to study the dynamic change in water content in plant leaf cells.
Plant cells are composed of cell walls and protoplasts surrounded by cell membranes. The electrical properties of cells are derived from the cell membrane with an electric double-layer structure [31]. The main components of the cell membrane are membrane lipids and various membrane proteins. The resistivity of the membrane lipid is very high, which is equivalent to an insulating layer, so that the cells have the function of storing charge. Due to the special structure and composition described above, a mesophyll cell can be modeled as a concentric spherical capacitor [32]. The cell membrane has strict selective permeability to various ions, so the electrolyte solution on both sides of the membrane forms a specific conductive state, which is equivalent to the bipolar plate of the capacitor, and the cell membrane is equivalent to the intermediate medium of the capacitor, showing capacitance [33]. Vacuoles and cytoplasm are considered as resistors [34]. In the process of cell damage, cell structure, composition, and ion permeability will undergo complex changes, resulting in significant changes in electrical parameters [26]. Therefore, electrophysiological parameters can be used to quickly characterize the dynamic changes in leaf intracellular water and nutrients.
Currently, there are few studies on the dynamic changes in intracellular substances of B. napus L. and their role in regulating plant adaptability to low-P conditions. The response mechanism of B. napus L. to low P in the aspect of dynamic use traits of the intracellular water and nutrients has not been reported yet. In this study, B. napus L. plants were used as the experimental materials and were subjected to low-P treatments. The parameters of water and nutrient utilization within leaf cells based on electrophysiological parameters were calculated according to the Nernst equation. The changes in leaf elastic modulus, leaf anatomical structure, photosynthesis, nutrient accumulation, and growth parameters of B. napus L. were analyzed. This study aimed at exploring the dynamics of leaf intracellular water and nutrients in B. napus L. under low-P conditions, investigating the effects on photosynthesis and growth, and understanding the tolerance threshold of B. napus L. to low-P stress. The results reveal the response mechanisms of B. napus L. to P deficiency at the cellular level and help understand the adaptations of B. napus L. plants.

2. Materials and Methods

2.1. Plant Materials and Treatments

The experiment was carried out in the greenhouse of Jiangsu University (32.11° N, 119.25° E), China. Brassica napus L. (Ningyou 26) was selected as the experimental material in this study. B. napus L. is an important crop in China. It is widely cultivated in karst areas and is sensitive to P deficiency. It is often affected by low-P stress in karst areas. Ningyou 26 is a new variety developed by Jiangsu Academy of Agricultural Sciences based on B. napus L. It has the advantages of good resistance and high yield, and is also suitable for spreading cultivation in China, including the southwest karst area. Rapeseed seeds were first placed onto a wet gauze in a light incubator for germination. The light intensity was set as 40 μmol·m−2·s−1, and water was sprayed daily to keep the gauze moist. After germination, the seeds were sown in 12-hole trays filled with perlite. When the seedlings grew out, 300 mL 1/4-Hoagland nutrient solution was added into each tray for cultivation, and the conductivity of the nutrient solution was 1.2 ms·cm−1, pH = 6.0. The nutrient solution was replaced every two days, and the matrix was fully washed with pure water every 10 days to keep the nutrient solution concentration in the tray stable. After two months of cultivation, 96 healthy and uniform seedlings were randomly selected for low-P treatments, and the nutrient solution in each 12-hole tray was replaced with the treatment solution. By adding different proportions of NH4H2PO4 and NH4Cl to the modified Hoagland nutrient solution [35] [6 mmol·L−1 KNO3, 4 mmol·L−1 Ca(NO3)2, 2 mmol·L−1 MgSO4, 2 mmol·L−1 Fe(Na)EDTA, 2 μmol·L−1 KCl, 50 μmol·L−1 H3BO3, 4 μmol·L−1 MnSO4, 4 μmol·L−1 ZnSO4, 0.2 μmol·L−1 CuSO4, and 0.2 μmol·L−1 (NH4)6MO7O24], four levels of P content (1.000, 0.250, 0.125, and 0.034 mmol·L−1) were configured, and 1.000 mmol·L−1 was used as the control (CK), and 24 seedlings were treated at each level, where four seedlings in each 12-hole tray were taken as a repetition, with a total of six repetitions. The experiment was arranged in a completely randomized design. During the experiment, the treatment solution was updated daily and the tray matrix was fully washed with water to ensure that the nutrient levels in the trays of each treatment level remained constant.
After 20 days of low-P treatment, the parameters were measured. The culture environment was as follows: light/dark cycle (12 h/9 h), CO2 concentration (390 ± 20) μmol·mol−1, air relative humidity (65 ± 5) %, daytime/night cycle temperature (28 °C/18 °C), light intensity (300 ± 10) μmol·m−2·s−1.

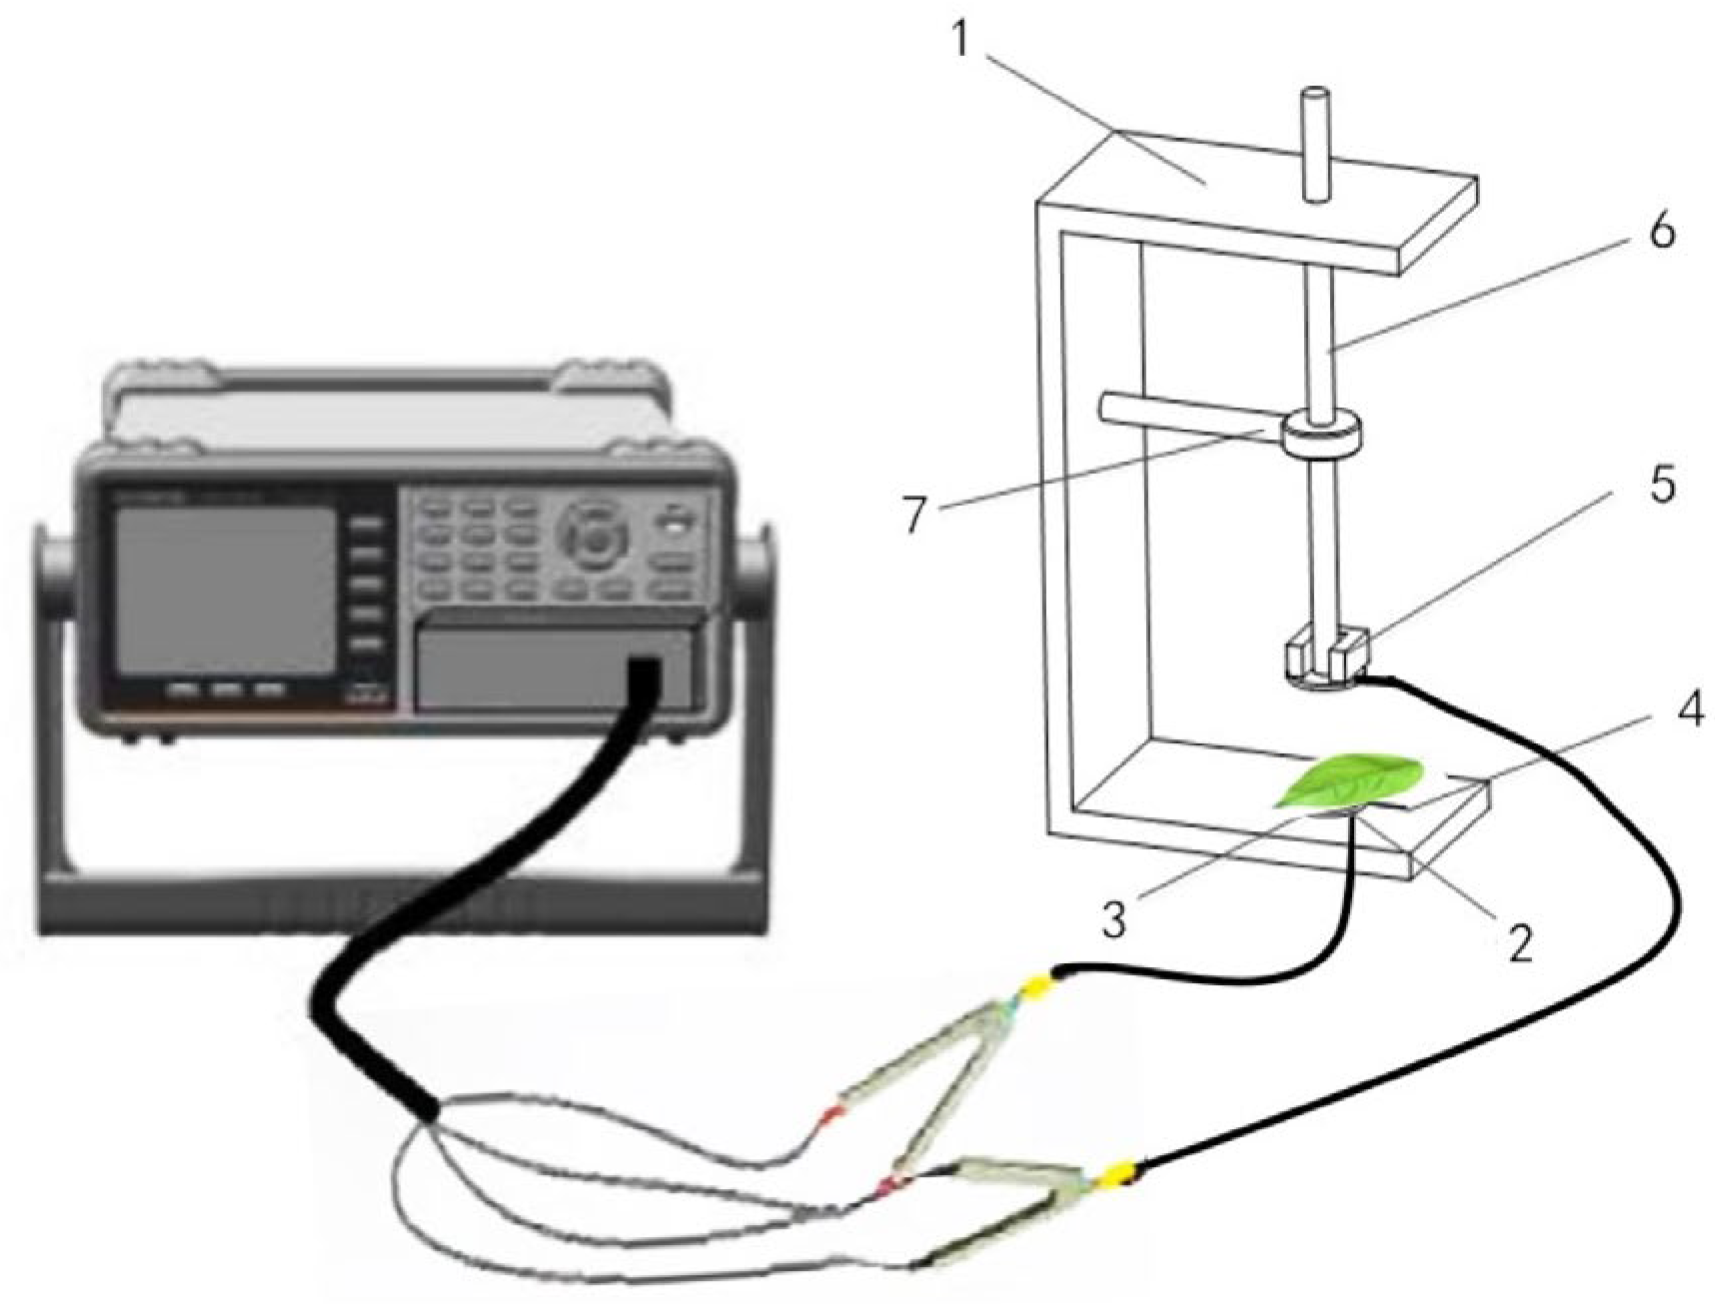
2.2. Determination of Electrophysiological Parameters

At least three fresh leaves per plant were selected and clamped between the self-made parallel electrode plates connected with the LCR tester (Model 3532-50, Hioki, Nagano, Japan) (Figure 1). The measured frequency and voltage were 3 kHz and 1.5 V, respectively. The leaves were subjected to different clamping forces by adding equal mass weights (M = 100 g) in turn. The clamping force (F) gradients were set to 1.1 N, 2.1 N, 4.1 N, 6.1 N, and 8.1 N, respectively. The physiological capacitance (C, pF), physiological resistance (R, MΩ), and impedance (Z, MΩ) were recorded. Three different parts of each leaf were measured, and the average value was calculated. The measurement was repeated three times at each level by selecting three different plants in different 12-hole trays. Subsequently, the physiological capacitance (XC, MΩ) was calculated according to the C value, and the physiological inductance (XL, MΩ) was calculated using R, Z, and XC. The relationship models between the electrophysiological parameters and clamping forces were constructed, respectively, and the parameters of the above models were used to calculate the specific effective thickness (d) and intrinsic electrophysiological parameters (IC, IR, IZ, IXC, IXL) of plant leaves [36]. On this basis, the leaf intracellular water-holding capacity (LIWHC), water use efficiency (LIWUE), water transport rate (LIWTR), total nutrient transport capacity (TNTC), and nutrient use efficiency (NSUE) were calculated, respectively [30,37]. The specific calculation formulas were as follows:
LIWHC = C 3
LIWUE = d L I W H C
LIWTR = −Z′ = bk
TNTC = I X L + I X c I R
NSUE = 100 N A T + N P T

2.3. Determination of Leaf Anatomical Structure

Leaf anatomy was observed by the paraffin section method [38]. Leaves were collected after 20 days of stress treatment. Small leaf pieces (0.5 × 0.5 cm) were cut between the main veins and immersed in the formalin–acetic acid–alcohol (FAA) fixing solution. After being placed in FAA fixative for more than 24 h, these samples were soaked and rinsed with 70% alcohol, and they were then dehydrated in a gradient of alcohol solutions (50%, 70%, 85%, 95%, and 100%) for 1–3 h, and treated twice in the solutions (first in alcohol:xylene = 1:1, followed by 100% xylene) for 2–3 h per step. Then, the samples were immersed in paraffin solution in the embedding machine for 24 h. The wax block was sliced using a rotary slicer (Leica, RM2235, Heidelberg, Germany) with a thickness of 12 μm. These paraffin sections were stained with saffranine and fast green dye and mounted on slides. Samples were observed by using inverted light microscopes (DMi8, Leica, Wetzlar, Germany). The total thickness of leaves, upper and lower epidermis thickness, palisade parenchyma thickness, and sponge parenchyma thickness were measured by the ImageJ software (version 1.52t, National Institutes of Health, NIH, Bethesda, MD, USA). The palisade–sponge ratio (P/S ratio, %), tightness degree of leaf tissue structure (CTR, %), and loose degree of leaf tissue structure (SR, %) were calculated according to the following formulas:
P / S   ratio = P a l i s a d e       p a r e n c h y m a       t h i c k n e s s S p o n g e       p a r e n c h y m a       t h i c k n e s s × 100 %
CTR = P a l i s a d e       p a r e n c h y m a       t h i c k n e s s T o t a l       t h i c k n e s s       o f       l e a v e s × 100 %
SR = S p o n g e       p a r e n c h y m a       t h i c k n e s s T o t a l       t h i c k n e s s       o f       l e a v e s × 100 %

2.4. Leaf Elastic Modulus Measurement

The SMS texture analyzer (TA.XT Plus, Surrey, UK) was used to measure the pressing distance of plant leaves under different pressures, and the veins were avoided during the test. The test was set as follows. The test mode was compression, the probe type was a compression probe with a diameter of 4 mm, the probe downward speed was 1 mm·s−1 before the test, the probe downward speed was 0.2 mm·s−1 during the test, and the probe upward speed was 10 mm·s−1 after the test, and the strain was selected as the target parameter. Different pressure gradients (1.1 N, 2.1 N, 4.1 N, 6.1 N, 8.1 N) were set in each group, and the downward pressure distance of the leaves under different pressures was measured, respectively. The linear model between the deformation and the external force was constructed, and the elastic modulus of the leaves could be obtained. Each level was repeated three times. The linear model is Hooke’s law, and the formula is as follows [39]:
Fe = Emx
where Fe is pressure of the external force, N; x is the deformation, mm; Em is the elastic modulus, N ·mm−1.

2.5. Measurement of Leaf Nutrient Content

Plant leaves were collected and dried to constant weight. The samples were crushed by a pulverizer and passed through a 0.25–0.50 mm sieve. The 0.15–0.20 g sieved samples were weighed and cooked by the concentrated H2SO4-H2O2 method. The contents of phosphorus (P) and calcium (Ca) were determined by the Mo-Sb colorimetric method and atomic absorption spectrophotometry, respectively [40,41,42]. The determination wavelengths of P and Ca elements were 700 nm and 422.7 nm, respectively. Each treatment was carried out in triplicate.

2.6. Determination of Photosynthetic Parameters

The fourth and fifth fully expanded leaves of the plant were selected, and the net photosynthetic rate (PN, μmol (CO2)·m−2·s−1), stomatal conductance (gs, mol (CO2)·m−2·s−1), and transpiration rate (E, mmol (H2O)·m−2·s−1) were measured by a portable Li-6400 XT photosynthesis measurement system (LI-COR, Lincoln, NE, USA) during 9:00–11:00 a.m., and the instantaneous water use efficiency (WUEi, μmol (CO2)·mmol−1 (H2O)) was calculated. The photosynthetically active radiation during the measurement period was 800 μmol·m−2·s−1 [43]. The measurement at each treatment level was repeated five times. The WUEi calculation formula is as follows [37]:
WUE i = P N E

2.7. Using the 4-Parameter Logistics Model to Fit the Growth Index

The plants were treated with phosphorus stress for 20 days. From day 0, the stem diameter and leaf area were measured every 4 days a total of 6 times. Stem diameter was measured by vernier caliper and leaf area was measured by leaf area meter (hand-held laser leaf area meter, CI, 203, CID, Camas, Washington, DC, USA). Finally, the growth curves of stem diameter and leaf area were fitted by a 4-parameter Logistic equation with the X-axis being treatment days and the Y-axis being growth index data collected [44]. The 4-parameter Logistic equation is as follows:
Y = Y 0   + a ( 1 + x x 0 ) b
where Y is the growth index; Y0 is the starting value of the logarithmic growth phase; a is the upper limit of growth; X is the number of processing days; X0 is the number of days required to reach 50% of the maximum growth in the logarithmic growth period; b is the fitting coefficient; G R 50 = a b 4 X 0 , which is the growth rate at half of the logarithmic growth phase; D T l o g = 4 X 0 b is the duration of the logarithmic growth phase.

2.8. Data Statistics and Analysis

SigmaPlot 14.0 software was used for fitting curves. By using SPSS software (version 14.0, SPSS Inc., New York, NY, USA), the Shapiro–Wilk test was used to evaluate the normality of the data, and Levene’s test was used to evaluate the homogeneity of the data. Then, Duncan’s multiple comparison was used to analyze the results by one-way ANOVA at 5 % significance level (p ≤ 0.05). The data are shown as the means ± SE. Origin 2019 software was used for plotting.

3. Results

3.1. Effects of Low-P Stress on Electrophysiological Parameters

The LIWHC value was the highest at the 0.125 mmol·L−1 P level. The LIWTR value under 0.034 mmol·L−1 P treatment was significantly lower than that under 0.125 mmol·L−1 P treatment. There was no significant change in LIWUE, TNTC, and NSUE values as P concentration decreased (Table 1).

3.2. Effects of Low-P Stress on Leaf Anatomical Structure

With the decrease in P concentration, the total leaf thickness values showed a clear reduction and became the lowest at the 0.034 mmol·L−1 P level. When the P concentration was more than 0.125 mmol·L−1, the upper epidermis and lower epidermis thickness values increased as P concentration decreased. The palisade parenchyma thickness value was the highest at the 0.125 mmol·L−1 P level and the lowest at the 0.034 mmol·L−1 P level. The sponge parenchyma thickness value was the highest in the control group and lowest at the 0.125 mmol·L−1 P level (Table 2).
The P/S ratio was highest at a P concentration of 0.125 mmol·L−1 and lowest at P concentrations of 1.000 and 0.034 mmol·L−1, respectively (Table 3). The CTR value significantly increased at 0.125 mmol·L−1, but that at 0.034 mmol·L−1 became the lowest. The SR value was the highest in the control and lowest at 0.125 mmol·L−1, whilst similar values were recorded under 0.250 mmol·L−1 (51.837) and 0.034 mmol·L−1 (51.264), respectively (Table 3).

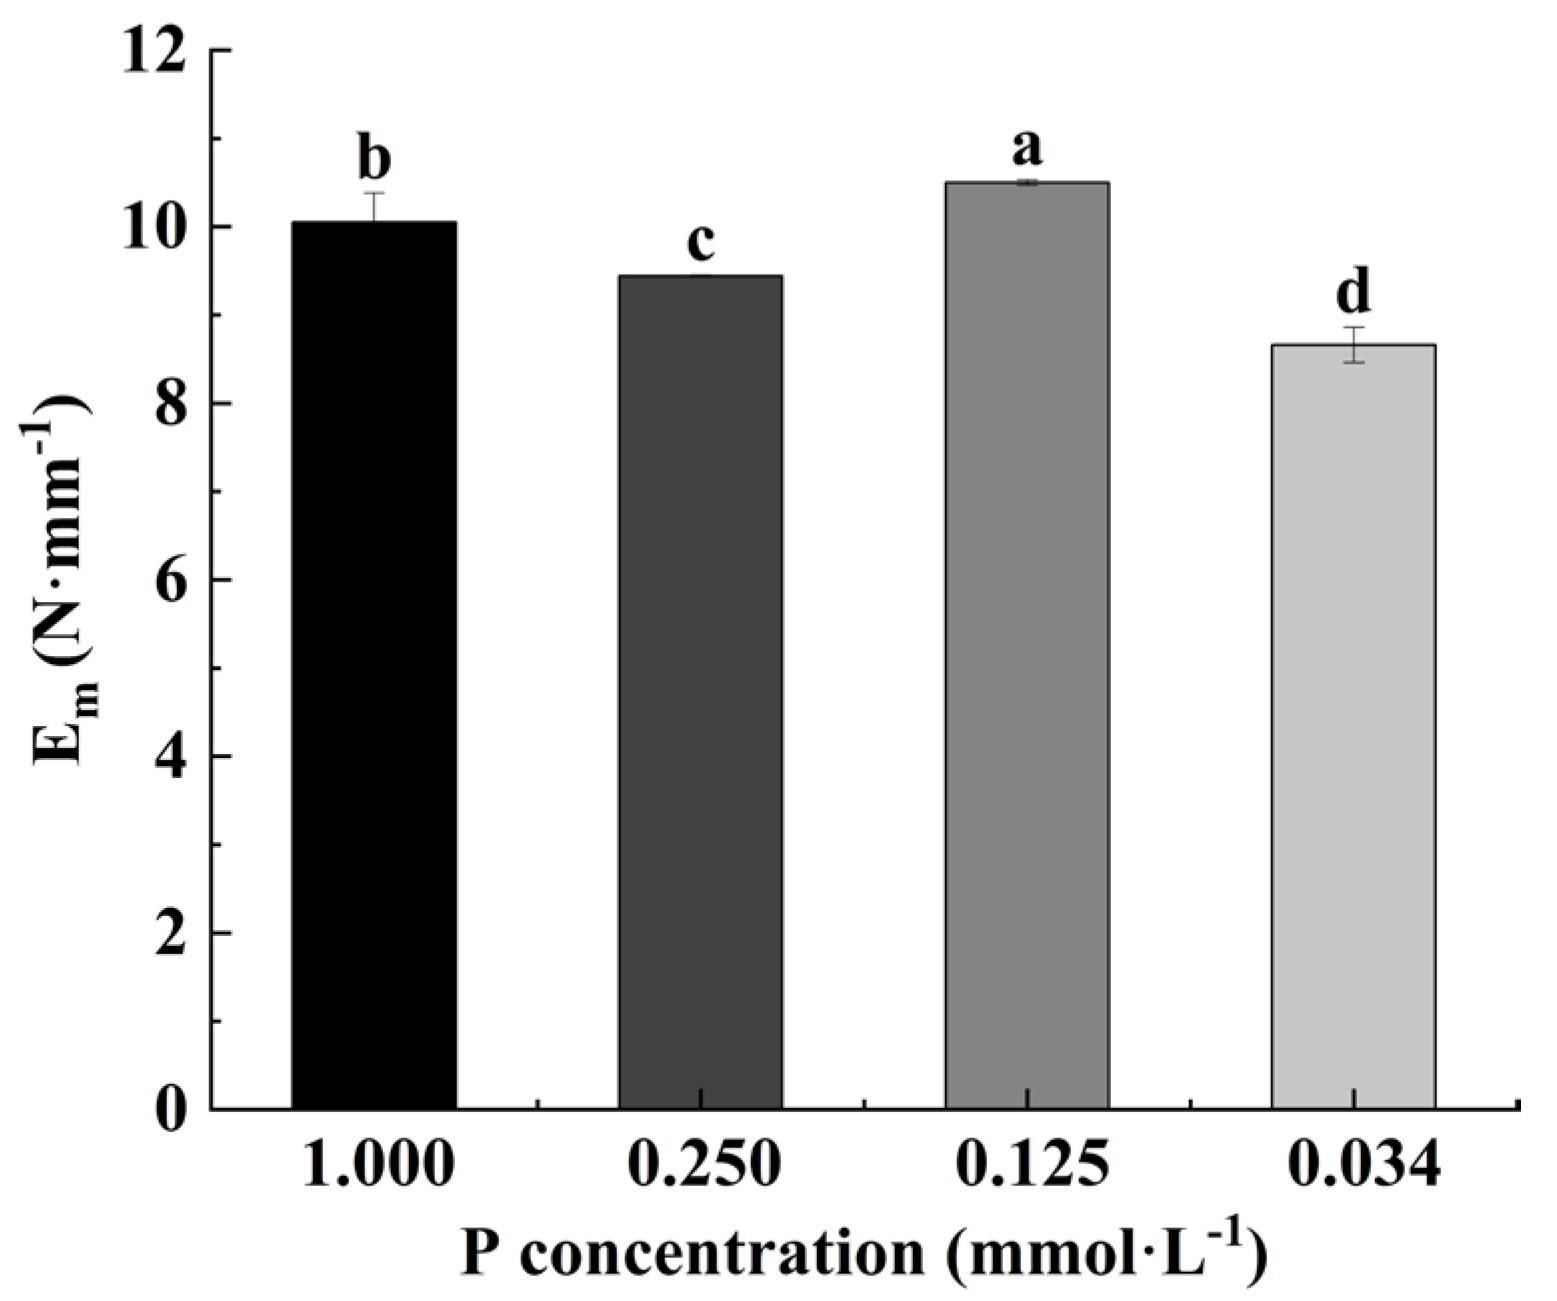
3.3. Effects of Low-P Stress on Leaf Elastic Modulus

The Em value at the 0.125 mmol·L−1 P level was the highest, and that at 0.034 mmol·L−1 was the lowest. The value at 0. 250 mmol·L−1 was lower than that in the control (Figure 2).

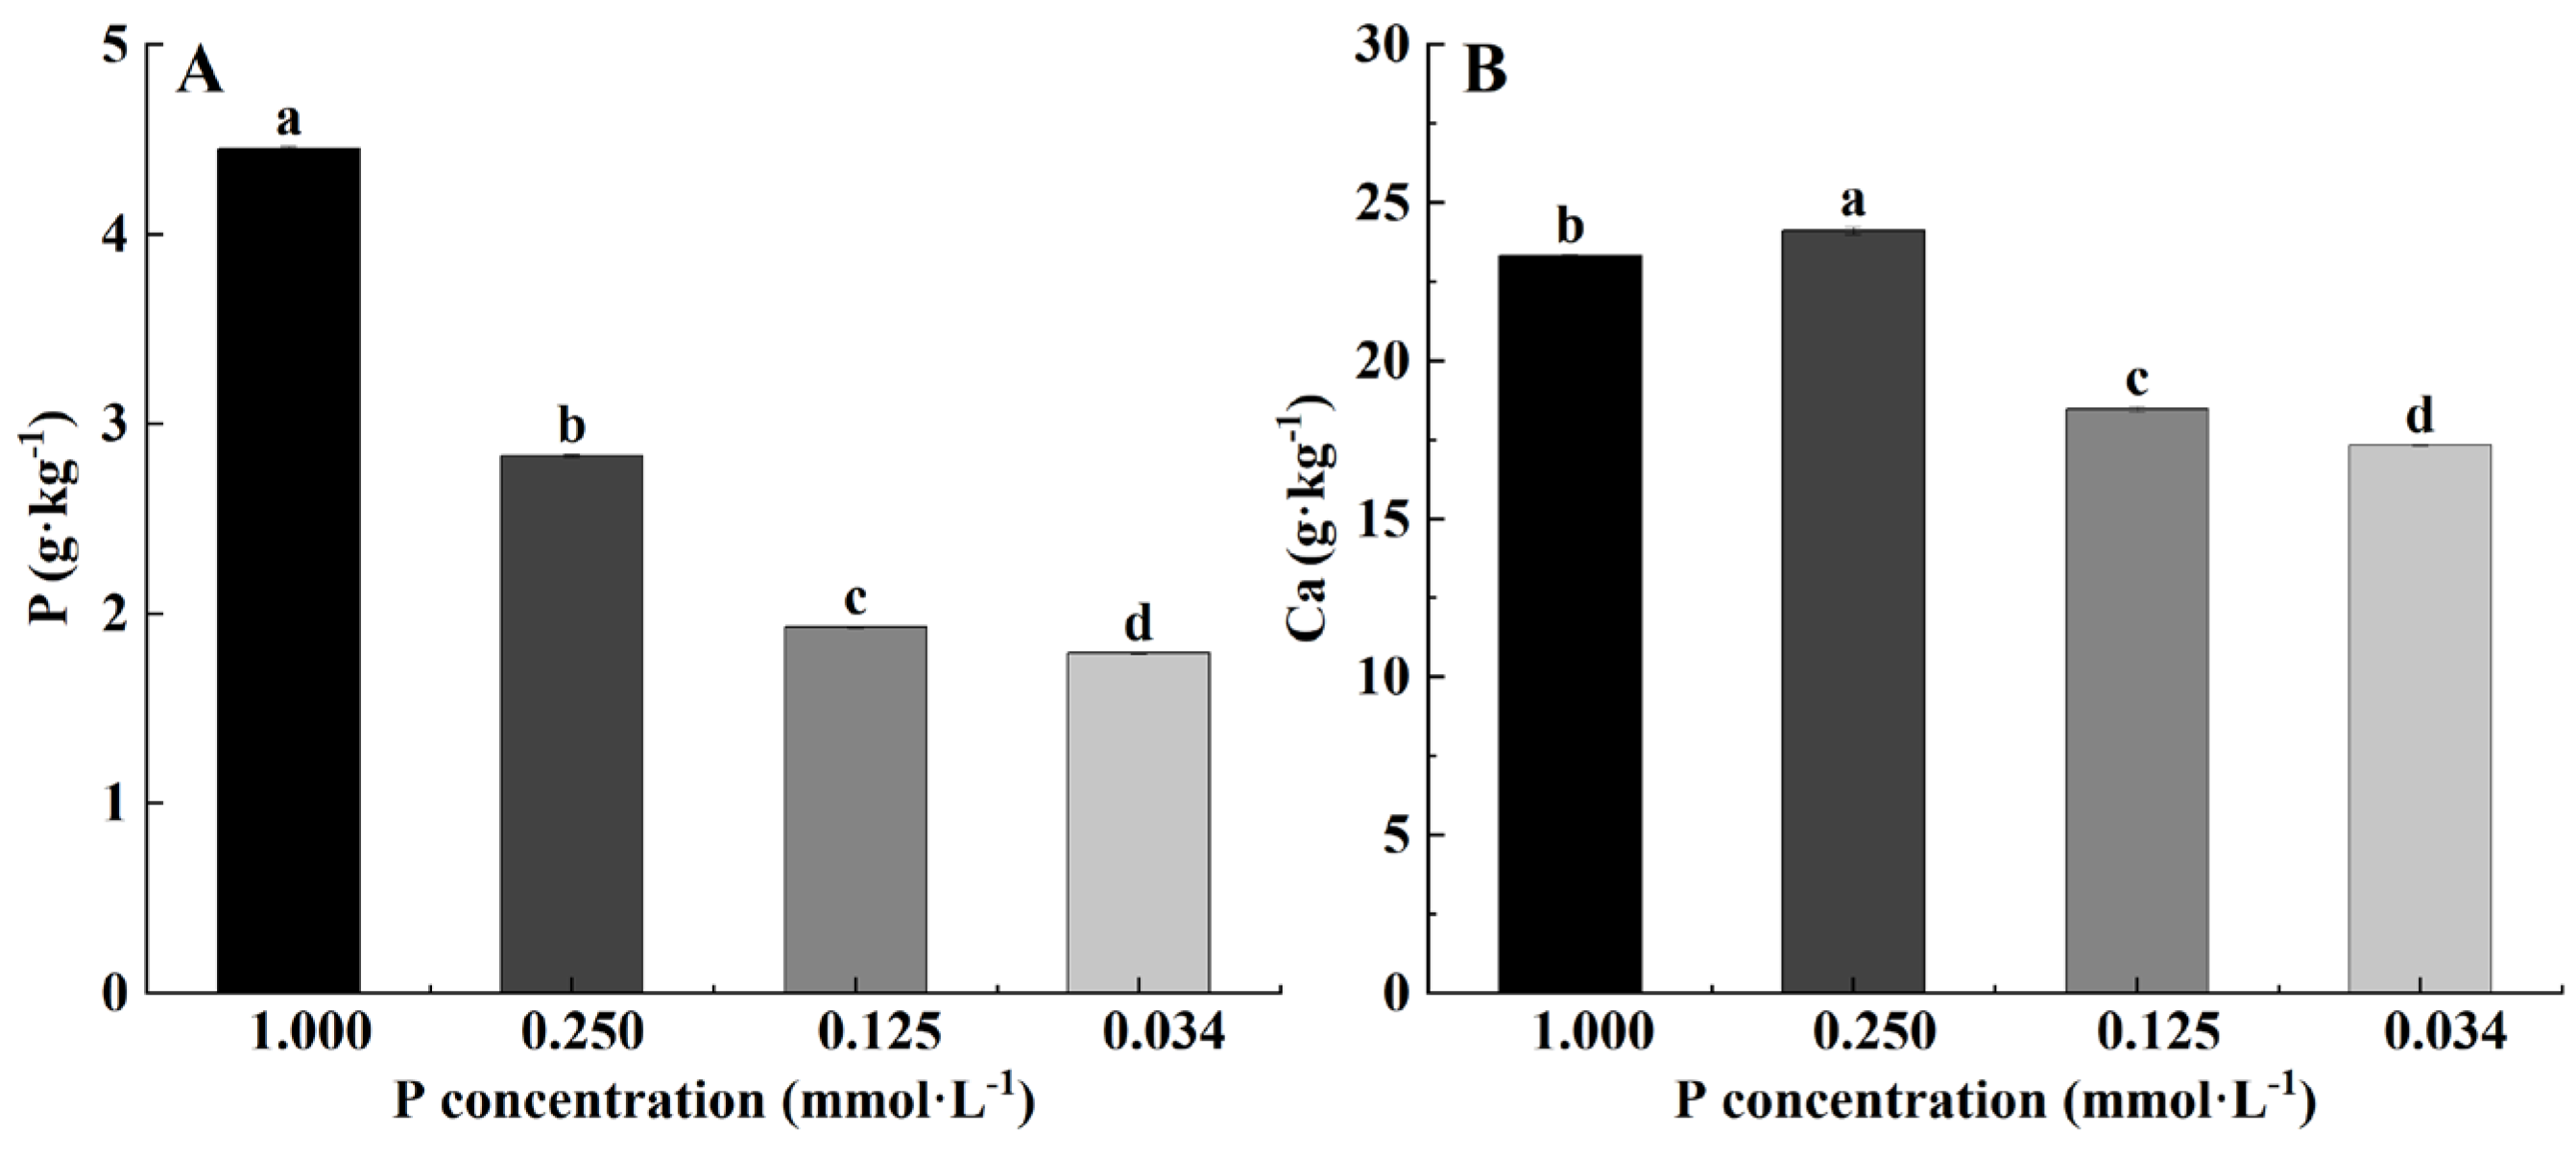
3.4. Effects of Low-P Stress on Leaf Nutrient Content

The P content in leaves decreased with the decrease in P concentration (Figure 3A). The content of Ca in leaves at 0.250 mmol·L−1 increased remarkably compared to the control group, and the contents of Ca decreased significantly as P concentration decreased between the level ranging from 0.250 to 0.034 mmol·L−1 (Figure 3B).

3.5. Effects of Low-P Stress on Photosynthetic Parameters

The PN value at the 0.250 mmol·L−1 P level was significantly higher than that at other levels, 0.125 mmol·L−1 had no significant difference compared to the control, and the PN value at 0.034 mmol·L−1 was the lowest (Figure 4A). The gs and E values were the highest under 0.250 mmol·L−1 P treatment, there was no significant difference between 0.125 mmol·L−1 and the control, and the value of 0.034 mmol·L−1 was the lowest (Figure 4B,C). However, the WUEi values at 0.250 mmol·L−1 and 0.125 mmol·L−1 were remarkably lower than the 0.034 mmol·L−1 P treatment level (Figure 4D).

3.6. Effects of Low-P Stress on Growth Indices

With the increase in treatment time, the leaf area and stem diameter of B. napus L. at each P level gradually increased. The leaf area and stem diameter at the 0.250 mmol·L−1 P level were higher than those at other levels, respectively. The leaf area and stem diameter at the 0.125 mmol·L−1 P level were not significantly different from those in the control group. Those at the 0.034 mmol·L−1 P level were the lowest, respectively (Figure 5A,B).
The a, X0, and DTlog values of leaf area were the highest at the 0.250 mmol·L−1 P level, respectively. The a, X0, and GR50 values at the 0.034 mmol·L−1 P level were the lowest, respectively. And the DTlog value was the lowest at the 0.125 mmol·L−1 P level (Table 4).
The a value of stem diameter was the highest at 0.250 mmol·L−1 and the lowest at the 0.034 mmol·L−1 P level. The X0 and DTlog values gradually increased with the decrease in P concentration. The GR50 value decreased with the reduction in P concentration (Table 5).

4. Discussion

The leaf is the main organ for transpiration and photosynthesis of plants, and it is very sensitive to stress. Low-P stress can change leaf morphology and structure, and affect the photosynthesis and growth of plants [45,46]. The electrophysiological parameters can be used to quickly characterize the dynamic changes in leaf intracellular water and nutrients, which help to understand the adaptation of plants to low-P stress.
At the 0.250 mmol·L−1 P treatment level in this study, although the decrease in P concentration in the solution resulted in a decrease in P accumulation in leaves, the content of Ca increased. The accumulation of Ca could promote the activities of related proteins and enzymes, such as Ca-dependent protein kinase, which indirectly regulates the stomatal movement [47]. The high Ca accumulation might contribute to the opening of leaf stomata at this level. Moreover, the stomatal movement was also closely correlated with the water status within leaves, and a slight increase in LIWHC and stable LIWTR indicated that plants at this level showed slightly better water status within leaf cells compared with plants in the control condition. With the increasing gs, the gas exchange was promoted, and the photosynthetic capacity of B. napus L. was significantly enhanced. The plants at this treatment level grew better, and the stem diameter and leaf area were higher than those of the control group. Lu et al. found that under the condition of P deficiency, the photosynthetic capacity, biomass, and leaf area of B. napus L. all decreased, which was different from the results of this study [48]. The results in this study indicated that the appropriate reduction in P concentration (at 0.250 mmol·L−1 P) was conducive to the growth of B. napus L. However, the increased gs promoted transpiration water consumption and slightly decreased the WUEi. With regard to the leaf morphology and intracellular substances, lack of P can increase the thickness of the upper and lower epidermis of leaves, which is consistent with the observation in B. napus L. by Lu et al. [48]. Furthermore, B. napus L. plants decreased the sponge parenchyma and increased the palisade–sponge ratio. Meanwhile, the cell wall showed elasticity, which was indicated by the decreased Em value compared to that in the control. As a result, changes in leaf anatomical structure and cell wall elasticity were conducive to maintaining the stability of intracellular water and nutrients, which could be reflected by electrophysiological parameters, that is, LIWHC, LIWUE, LIWTR, TNTC, and NSUE values had no significant changes compared with the control group. The results indicated that plants that underwent the 0.250 mmol·L−1 P treatment exhibited good adaptability through maintaining the stable use of the intracellular water and nutrients, which could be influenced by the cell volume and cell wall elasticity. The stable intracellular water and nutrient use efficiency and strong photosynthetic capacity promoted the growth of plants. In other words, the plants at the 0.250 mmol·L−1 P treatment level adapted to the surroundings by changing the leaf structure and cell wall elasticity rather than evoking changes in the use of intracellular water and nutrients.
At the 0.125 mmol·L−1 P treatment level, the stable photosynthetic capacity of plants was conducive to the steady production of carbohydrate, which could be decomposed and transformed into energy under stress conditions. In this study, the energy was used for maintaining the nutrient-active transport; although the growth rate of stem diameter in the logarithmic growth period decreased, its logarithmic growth period was prolonged, so that the maximum leaf area and stem diameter were at the same level as the control, and the leaf area had the highest growth rate in the logarithmic growth period. However, the NSUE declined slightly, and the accumulations of P and Ca in leaves were clearly inhibited; the result is consistent with the findings of previous studies [11,12]. Low P inhibits the growth of mesophyll cells, leading to small cell volume [49]. Plants at the 0.125 mmol·L−1 P treatment level further shrank their sponge parenchyma, which became only half the size of that at the 0.250 mmol·L−1 P treatment level. However, the palisade parenchyma increased remarkably, which consequently improved the P/S ratio and CTR significantly. The cell wall stiffness was enhanced, and the Em value was significantly increased, which helped to prevent a decline in cell volume (mainly the palisade tissue) and improve their water storage capacity. As a result, the LIWHC was significantly increased. The stable and good water status within leaf cells, which was reflected by the slight increase in LIWHC and LIWTR values compared to those at the 0.250 mmol·L−1 P treatment level, helped to maintain the opening of the leaf stomata at the 0.125 mmol·L−1 P treatment level. Meanwhile, the stable transpiration provided a continuous driving force for water transport in plants; in this case, the use of the intracellular water was continuously kept stable even if the WUEi was decreased when compared with the control. This indicated that the intracellular water became increasingly important at this low-P treatment level. The above-mentioned changes in leaf structure and use traits of intracellular water were conducive to maintaining the carbon assimilation at the 0.125 mmol·L−1 P level when compared to that under the control conditions. In a word, plants at this level mainly started regulating the dynamics of leaf intracellular water, which maintained the LIWUE in response to the decline in WUEi.
Low P will limit the photosynthetic rate of B. napus L. [50]. At the 0.034 mmol·L−1 P treatment level, the decrease in PN led to the decrease in photosynthetic products; meanwhile, the energy produced by the decomposition and transformation of carbohydrates in plants was partly used for resisting P stress adversity, and the other part was used to support the active transport of nutrients. Therefore, compared with the 0.125 mmol·L−1 P treatment level, TNTC did not change significantly. Although the NSUE value remained stable, the accumulations of P and Ca in leaves decreased significantly. Meanwhile, the growth rate and growth upper limit of stem diameter and leaf area of plants under the lowest P concentration treatment were clearly inhibited. Some studies have also shown that low P will restrict the photosynthesis and growth of B. napus L. [12,13], and the results of 0.034 mmol·L−1 P treatment in this study show similar findings. With regard to the intracellular water and nutrients, the Em value decreased and the mesophyll cells exhibited better elasticity compared to those at other levels. The transfer of intracellular water from palisade parenchyma to sponge parenchyma increased the thickness of sponge parenchyma but decreased the thickness of palisade parenchyma. As a result, the R/S ratio and CTR value were significantly decreased compared to those at the 0.125 mmol·L−1 P level. Furthermore, the stomata of plants at the 0.034 mmol·L−1 P treatment level were close to the closed state, which reduced the transpiration but simultaneously inhibited the CO2 acquisition by plants and clearly depressed the PN [51,52]. Consequently, compared with the 0.125 mmol·L−1 P treatment level, the LIWTR was significantly reduced, while LIWHC and LIWUE did not change significantly. The plants in this situation closed the stomata but exhibited a more remarkable decrease in transpiration than that in PN, thereby improving the WUEi value compared to that at the 0.125 mmol·L−1 level. In fact, the intracellular water of plants at this level had lower mobility compared to other levels, which was not conducive to the accumulation of P and Ca elements, therefore inhibiting photosynthesis and growth. The intracellular water and nutrients could not easily regulate photosynthesis and growth when the P deficiency became serious.
In addition to the above, the current hydroponic study also has some limitations. Although the response mechanisms of B. napus L. to P deficiency and the plants’ adaptation have been evaluated in a hydroponic experiment, the results of this study are not directly applicable to field conditions with naturally P-deficient soils, and the P fertilization strategies of B. napus L. in naturally P-deficient soils require further experiments and investigation. However, the establishment of methods for quickly and accurately determining the plant P demand information using electrophysiology techniques is of great importance for reducing phosphate fertilizer use and protecting phosphate rock resources.

5. Conclusions

Phosphorus deficiency affects the dynamics of intracellular water and nutrients in the leaves of B. napus L. by changing the leaf structure and cell mechanical properties, thus affecting the photosynthesis and growth of plants. When the P concentration was 0.250 mmol·L−1, the leaf structure and cell mechanical properties changed, but the use of intracellular water and nutrients in leaves of B. napus L. remained stable, and the photosynthetic and growth indices reached the maximum. Therefore, an appropriate reduction in P supplement was conducive to improving the growth of B. napus L. plants. The 0.125 mmol·L−1 P concentration clearly decreased the mesophyll cell volume, but increased the palisade–sponge ratio and tightness degree of leaf tissue structure. In addition, it led to increasing cell elastic modulus; plants at this level mainly started regulating the transport and holding capacity of leaf intracellular water, which maintained the use of intracellular water. As a result, the photosynthesis and growth of plants were maintained. However, the photosynthesis and growth were clearly inhibited with a further decrease in P concentration at 0.034 mmol·L−1. Therefore, 0.125 mmol·L−1 was the tolerance threshold of B. napus L. to low P. The results indicated that the effects of the dynamics of intracellular water and nutrients on photosynthesis and growth can be investigated by using electrophysiological information, which helps to understand the plant’s adaptive response. However, it needs further study for the timely investigation of P fertilization strategies of B. napus L. in naturally P-deficient soils.

Author Contributions

Conceptualization, D.X. and Y.W.; methodology, D.X. and Y.W.; validation, R.M; formal analysis, Q.Z. and J.W.; investigation, J.W. and R.M.; data curation, Q.Z. and R.M.; writing—original draft preparation, Q.Z.; writing—review and editing, D.X. and K.Z.; project administration, K.Z.; funding acquisition, Y.W. and K.Z. All authors have read and agreed to the published version of the manuscript.

Funding

This research was funded by the project of the National Key Research and Development Program of China, grant number “2016YFC0502602”, the Provincial Natural Science Foundation of Anhui, grant number “1908085QD149”, and the Priority Academic Program Development of Jiangsu Higher Education Institutions, grant number “PAPD-2023-87”.

Data Availability Statement

The raw data supporting the conclusions of this article will be made available by the authors on request.

Conflicts of Interest

The authors declare no conflicts of interest.

References

  1. Schiessl, S.; Iniguez-Luy, F.; Wei, Q.; Snowdon, R.J. Diverse regulatory factors associate with flowering time and yield responses in winter-type Brassica napus. BMC Genom. 2015, 16, 737. [Google Scholar] [CrossRef] [PubMed]
  2. Xu, P.; Li, H.; Xu, K.; Cui, X.; Liu, Z.; Wang, X. Genetic variation in the glycine-rich protein gene BnGRP1 contributes to low phosphorus tolerance in Brassica napus. J. Exp. Bot. 2023, 74, 3531–3543. [Google Scholar] [CrossRef] [PubMed]
  3. Wang, L.; Zheng, J.; You, J.; Li, J.; Qian, C.; Leng, S.; Yang, G.; Zuo, Q. Effects of Phosphorus Supply on the Leaf Photosynthesis, and Biomass and Phosphorus Accumulation and Partitioning of Canola (Brassica napus L.) in Saline Environment. Agronomy 2021, 11, 1918. [Google Scholar] [CrossRef]
  4. Hu, Z.; Ding, Z.; Al-Yasi, H.M.; Ali, E.F.; Eissa, M.A.; Abou-Elwafa, S.F.; Sayed, M.A.; Said, M.T.; Said, A.A.; Ibrahim, K.A.M.; et al. Modeling of Phosphorus Nutrition to Obtain Maximum Yield, High P Use Efficiency and Low P-Loss Risk for Wheat Grown in Sandy Calcareous Soils. Agronomy 2021, 11, 1950. [Google Scholar] [CrossRef]
  5. Cadot, S.; Bélanger, G.; Ziadi, N.; Morel, C.; Sinaj, S. Critical plant and soil phosphorus for wheat, maize, and rapeseed after 44 years of P fertilization. Nutr. Cycl. Agroecosys. 2018, 112, 417–433. [Google Scholar] [CrossRef]
  6. Li, S.; Wang, Z.; Stewart, B.A. Differences of Some Leguminous and Nonleguminous Crops in Utilization of Soil Phosphorus and Responses to Phosphate Fertilizers. Adv. Agron. 2011, 110, 125–249. [Google Scholar] [CrossRef]
  7. Khan, F.; Siddique, A.B.; Shabala, S.; Zhou, M.; Zhao, C. Phosphorus Plays Key Roles in Regulating Plants’ Physiological Responses to Abiotic Stresses. Plants 2023, 12, 2861. [Google Scholar] [CrossRef] [PubMed]
  8. Hasan, M.M.; Hasan, M.M.; Teixeira da Silva, J.A.; Li, X. Regulation of phosphorus uptake and utilization: Transitioning from current knowledge to practical strategies. Cell. Mol. Biol. Lett. 2016, 21, 7. [Google Scholar] [CrossRef] [PubMed]
  9. Timofeeva, A.; Galyamova, M.; Sedykh, S. Prospects for Using Phosphate-Solubilizing Microorganisms as Natural Fertilizers in Agriculture. Plants 2022, 11, 2119. [Google Scholar] [CrossRef] [PubMed]
  10. Sharma, S.B.; Sayyed, R.Z.; Trivedi, M.H.; Gobi, T.A. Phosphate solubilizing microbes: Sustainable approach for managing phosphorus deficiency in agricultural soils. Springerplus 2013, 2, 587. [Google Scholar] [CrossRef] [PubMed]
  11. Shen, J.; Li, Z.; Liao, X.; Guo, Q. Effect of phosphorus on yield, absorption and accumulation of mineral nutrients in Brassica napus (L.). Acta Agron. Sin. 2006, 8, 1231–1235. (In Chinese) [Google Scholar]
  12. Pan, Y.; Ding, G.; Cai, H.; Jin, K.; Broadley, M.R.; Xu, F.; Shi, L. A novel Brassica–rhizotron system to unravel the dynamic changes in root system architecture of oilseed rape under phosphorus deficiency. Ann. Bot. 2016, 118, 173–184. [Google Scholar] [CrossRef]
  13. Yu, L.; Tian, L.; Zhang, C.; Ma, N.; Li, J. Effects of Low Phosphorus Stress on Photosynthesis of Rapeseed Leaves in Different Periods. Chin. Agric. Sci. Bull. 2008, 24, 232–236. (In Chinese) [Google Scholar]
  14. Zhang, H.; Huang, Y.; Ye, X.; Shi, L.; Xu, F. Genotypic differences in phosphorus acquisition and the rhizosphere properties of Brassica napus in response to low phosphorus stress. Plant Soil 2009, 320, 91–102. [Google Scholar] [CrossRef]
  15. Foehse, D.; Jungk, A. Influence of phosphate and nitrate supply on root hair formation of rape, spinach and tomato plants. Plant Soil 1983, 74, 359–368. [Google Scholar] [CrossRef]
  16. Hoffland, E.; Findenegg, G.R.; Nelemans, J.A. Solubilization of rock phosphate by rape. Plant Soil 1989, 113, 161–165. [Google Scholar] [CrossRef]
  17. Yang, J.; Zhou, J.; Zhou, H.; Wang, M.; Liu, M.; Ke, Y.; Li, P.; Li, J.; Du, H. Global Survey and Expressions of the Phosphate Transporter Gene Families in Brassica napus and Their Roles in Phosphorus Response. Int. J. Mol. Sci. 2020, 21, 1752. [Google Scholar] [CrossRef] [PubMed]
  18. Yao, Y.; Sun, H.; Xu, F.; Zhang, X.; Liu, S. Comparative proteome analysis of metabolic changes by low phosphorus stress in two Brassica napus genotypes. Planta 2011, 233, 523–537. [Google Scholar] [CrossRef] [PubMed]
  19. Kohli, P.S.; Pazhamala, L.T.; Mani, B.; Thakur, J.K.; Giri, J. Root Hair-Specific Transcriptome Reveals Response to Low Phosphorus in Cicer Arietinum. Front. Plant Sci. 2022, 13, 983969. [Google Scholar] [CrossRef] [PubMed]
  20. Maejima, E.; Watanabe, T.; Osaki, M.; Wagatsuma, T. Phosphorus deficiency enhances aluminum tolerance of rice (Oryza sativa) by changing the physicochemical characteristics of root plasma membranes and cell walls. J. Plant Physiol. 2014, 171, 9–15. [Google Scholar] [CrossRef] [PubMed]
  21. Xing, D.; Wang, W.; Wu, Y.; Qin, X.; Li, M.; Chen, X.; Yu, R. Translocation and Utilization Mechanisms of Leaf Intracellular Water in Karst Plants Orychophragmus violaceus (L.) O. E. Schulz and Brassica napus L. Horticulturae 2022, 8, 1082. [Google Scholar] [CrossRef]
  22. Guo, Z.; Gong, J.; Luo, S.; Zuo, Y.; Shen, Y. Role of Gamma-Aminobutyric Acid in Plant Defense Response. Metabolites 2023, 13, 741. [Google Scholar] [CrossRef] [PubMed]
  23. Li, L.; Verstraeten, I.; Roosjen, M.; Takahashi, K.; Rodriguez, L.; Merrin, J.; Chen, J.; Shabala, L.; Smet, W.; Ren, H.; et al. Cell surface and intracellular auxin signalling for H+ fluxes in root growth. Nature 2021, 599, 273–277. [Google Scholar] [CrossRef] [PubMed]
  24. Ma, P.; Zang, J.; Shao, T.; Jiang, Q.; Li, Y.; Zhang, W.; Liu, M. Cadmium Distribution and Transformation in Leaf Cells Involved in Detoxification and Tolerance in Barley. Ecotoxicol. Environ. Saf. 2023, 249, 114391. [Google Scholar] [CrossRef] [PubMed]
  25. Tian, L.; Zhang, Z.; Wang, Z.; Zhang, P.; Xiong, C.; Kuang, Y.; Peng, X.; Yu, M.; Qian, Y. Compositional Variations in Algal Organic Matter during Distinct Growth Phases in Karst Water. Front. Environ. Sci. 2023, 11, 1112522. [Google Scholar] [CrossRef]
  26. Jócsák, I.; Végvári, G.; Vozáry, E. Electrical Impedance Measurement on Plants: A Review with Some Insights to Other Fields. Theor. Exp. Plant Physiol. 2019, 31, 359–375. [Google Scholar] [CrossRef]
  27. Galvani, L. Aloysii Galvani De Viribus Electricitatis in Motu Musculari Commentarius, 1st ed.; Typographia Instituti Scientiarum: Bologna, Italy, 1791; pp. 363–418. [Google Scholar] [CrossRef]
  28. Malone, M. Wound-induced hydraulic signals and stimulus transmission in Mimosa pudica L. New Phytol. 1994, 128, 49–56. [Google Scholar] [CrossRef] [PubMed]
  29. Zhao, X.; Wu, Y.; Xing, D.; Li, H.; Zhang, F. Water Metabolism of Lonicera japonica and Parthenocissus quinquefolia in Response to Heterogeneous Simulated Rock Outcrop Habitats. Plants 2023, 12, 2279. [Google Scholar] [CrossRef] [PubMed]
  30. Zhang, C.; Su, Y.; Wu, Y.; Li, H.; Zhou, Y.; Xing, D. Comparison on the Nutrient Plunder Capacity of Orychophragmus violaceus and Brassica napus L. Based on Electrophysiological Information. Horticulturae 2021, 7, 206. [Google Scholar] [CrossRef]
  31. Priveé, J.; Zhang, M.I.N. Estimating Cold Stress in ‘Beautiful Arcade’ Apple Roots using Electrical Impedance Analysis. Horttechnology 1996, 6, 54–58. [Google Scholar] [CrossRef]
  32. Xing, D.; Chen, L.; Wu, Y.; Zwiazek, J.J. Leaf Physiological Impedance and Elasticity Modulus in Orychophragmus Violaceus Seedlings Subjected to Repeated Osmotic Stress. Sci. Hortic. 2021, 276, 109763. [Google Scholar] [CrossRef]
  33. Qin, X.; Xing, D.; Wu, Y.; Wang, W.; Li, M.; Solangi, K. Diurnal Variation in Transport and Use of Intracellular Leaf Water and Related Photosynthesis in Three Karst Plants. Agronomy 2022, 12, 2758. [Google Scholar] [CrossRef]
  34. Zhang, C.; Wu, Y.; Su, Y.; Xing, D.; Dai, Y.; Wu, Y.; Fang, L. A Plant’s Electrical Parameters Indicate Its Physiological State: A Study of Intracellular Water Metabolism. Plants 2020, 9, 1256. [Google Scholar] [CrossRef] [PubMed]
  35. Hoagland, D.R.; Arnon, D.I. The Water-Culture Method for Growing Plants without Soil. Calif. Agric. Exp. Stn. 1950, 347, 1–32. Available online: http://www.cabdirect.org/abstracts/19500302257.html (accessed on 15 May 2024).
  36. Li, H.; Lv, J.; Su, Y.; Wu, Y. Appropriate Sodium Bicarbonate Concentration Enhances the Intracellular Water Metabolism, Nutrient Transport and Photosynthesis Capacities of Coix lacryma-jobi L. Agronomy 2023, 13, 1790. [Google Scholar] [CrossRef]
  37. Ali Solangi, K.; Wu, Y.; Xing, D.; Ahmed Qureshi, W.; Hussain Tunio, M.; Ali Sheikh, S.; Shabbir, A. Can electrophysiological information reflect the response of mangrove species to salt stress? A case study of rewatering and Sodium nitroprusside application. Plant Signal Behav. 2022, 17, 2073420. [Google Scholar] [CrossRef] [PubMed]
  38. Li, Z.L. Plant Section Technique; Science Press: Beijing, China, 1978. [Google Scholar]
  39. Xing, D.; Chen, X.; Wu, Y.; Li, Z.; Khan, S. Changes in elastic modulus, leaf tensity and leaf density during dehydration of detached leaves in two plant species of Moraceae. Chil. J. Agric. Res. 2021, 81, 434–447. [Google Scholar] [CrossRef]
  40. Guo, X.; Jiang, Y. Spatial characteristics of ecological stoichiometry and their driving factors in farmland soils in Poyang Lake Plain, Southeast China. J. Soils Sediments 2019, 19, 263–274. [Google Scholar] [CrossRef]
  41. Schade, J.D.; Kyle, M.; Hobbie, S.E.; Fagan, W.F.; Elser, J.J. Stoichiometric tracking of soil nutrients by a desert insect herbivore. Ecol. Lett. 2003, 6, 96–101. [Google Scholar] [CrossRef]
  42. Shafie, N.A.; Aris, A.Z.; Puad, N.H.A. Influential factors on the levels of cation exchange capacity in sediment at Langat River. Arabian J. Geosci. 2013, 6, 3049–3058. [Google Scholar] [CrossRef]
  43. Javed, Q.; Wu, Y.; Xing, D.; Azeem, A.; Ullah, I.; Zaman, M. Re-watering: An effective measure to recover growth and photosynthetic characteristics in salt-stressed Brassica napus L. Chilean J. Agric. Res. 2017, 77, 78–86. [Google Scholar] [CrossRef]
  44. Yu, R.; Wu, Y.; Xing, D. Can Electrophysiological Parameters Substitute for Growth, and Photosynthetic Parameters to Characterize the Response of Mulberry and Paper Mulberry to Drought? Plants 2021, 10, 1772. [Google Scholar] [CrossRef] [PubMed]
  45. Chu, S.; Li, H.; Zhang, X.; Yu, K.; Chao, M.; Han, S.; Zhang, D. Physiological and Proteomics Analyses Reveal Low-Phosphorus Stress Affected the Regulation of Photosynthesis in Soybean. Int. J. Mol. Sci. 2018, 19, 1688. [Google Scholar] [CrossRef] [PubMed]
  46. Sarker, B.C.; Rashid, P.; Karmoicer, J.L. Anatomical Changes of Lentil (Lens Culinaris Medik.) Under Phosphorus Deficiency Stress. Bangladesh J. Bot. 2015, 44, 73–78. [Google Scholar] [CrossRef]
  47. Choi, H.-I.; Park, H.-J.; Park, J.H.; Kim, S.; Im, M.-Y.; Seo, H.-H.; Kim, Y.-W.; Hwang, I.; Kim, S.Y. Arabidopsis Calcium-Dependent Protein Kinase AtCPK32 Interacts with ABF4, a Transcriptional Regulator of Abscisic Acid-Responsive Gene Expression, and Modulates Its Activity. Plant Physiol. 2005, 139, 1750–1761. [Google Scholar] [CrossRef] [PubMed]
  48. Lu, Z.; Ren, T.; Li, J.; Hu, W.; Zhang, J.; Yan, J.; Li, X.; Cong, R.; Guo, S.; Lu, J. Nutrition-mediated cell and tissue-level anatomy triggers the covariation of leaf photosynthesis and leaf mass per area. J. Exp. Bot. 2020, 71, 6524–6537. [Google Scholar] [CrossRef] [PubMed]
  49. Zambrosi, F.C.B.; Mesquita, G.L.; Tanaka, F.A.O. Assessment of leaf ultrastructure offers insights into mechanisms regulating sugarcane performance under low-phosphorus stress. Acta Physiol. Plant 2020, 42, 54. [Google Scholar] [CrossRef]
  50. Yaryura, P.; Cordon, G.; Leon, M.; Kerber, N.; Pucheu, N.; Rubio, G.; Garcia, A.; Lagorio, M.G. Effect of Phosphorus Deficiency on Reflectance and Chlorophyll Fluorescence of Cotyledons of Oilseed Rape (Brassica napus L.). J. Agron. Crop. Sci. 2009, 195, 186–196. [Google Scholar] [CrossRef]
  51. Asif, I.; Dong, Q.; Wang, X.; Gui, H.; Zhang, H.; Zhang, X.; Song, M. Phosphorus and carbohydrate metabolism contributes to low phosphorus tolerance in cotton. BMC Plant Biol. 2023, 23, 97. [Google Scholar] [CrossRef]
  52. Ellsworth, D.S.; Crous, K.Y.; De Kauwe, M.G.; Verryckt, L.T.; Goll, D.; Zaehle, S.; Bloomfield, K.J.; Ciais, P.; Cernusak, L.A.; Domingues, T.F.; et al. Convergence in phosphorus constraints to photosynthesis in forests around the world. Nat. Commun. 2022, 13, 5005. [Google Scholar] [CrossRef] [PubMed]
Figure 1. Schematic of the parallel plate capacitor: (1) bracket; (2) foam board; (3) electrode; (4) wire; (5) iron; (6) plastic bar; (7) fixation clamp.
Horticulturae 10 00821 g001
Figure 2. Effects of low-P stress on elastic modulus (Em, N·mm−1) (Note: Different letters appear above the error bars when subsequent values differ significantly at p ≤ 0.05, according to one-way ANOVA, n = 3).
Horticulturae 10 00821 g002
Figure 3. Phosphorus (P) element content (A) and calcium (Ca) element content (B) of B. napus L. under low P stress. (Note: Different letters appear above the error bars of the same parameter when subsequent values differ significantly at p ≤ 0.05, according to one-way ANOVA, n = 3).
Horticulturae 10 00821 g003
Figure 4. Photosynthetic parameters of B. napus L. under low-P stress. (A) Net photosynthetic rate (PN) of B. napus L.; (B) stomatal conductance (gs) of B. napus L.; (C) transpiration rate (E) of B. napus L.; (D) instantaneous water use efficiency (WUEi) of B. napus L. (Note: Different letters appear above the error bars of the same parameter when subsequent values differ significantly at p ≤ 0.05, according to one-way ANOVA, n = 5).
Horticulturae 10 00821 g004
Figure 5. The leaf area (A) and stem diameter (B) of B. napus L. under low-P stress.
Horticulturae 10 00821 g005
Table 1. Electrophysiological parameters of B. napus L. leaves under low-phosphorus stress.
P Concentration (mmol·L−1)LIWHCLIWUELIWTRTNTCNSUE
1.000144.235 ± 12.951 b0.230 ± 0.036 a5.842 ± 0.591 ab1.198 ± 0.105 a84.781 ± 7.680 a
0.250220.389 ± 24.101 ab0.173 ± 0.033 a6.295 ± 1.456 ab1.579 ± 0.270 a67.057 ± 11.080 a
0.125300.171 ± 51.566 a0.119 ± 0.055 a8.700 ± 0.487 a2.013 ± 0.509 a55.908 ± 12.604 a
0.034254.037 ± 35.185 ab0.176 ± 0.065 a4.556 ± 1.437 b1.660 ± 0.690 a79.637 ± 23.370 a
Note: leaf intracellular water-holding capacity (LIWHC), water use efficiency (LIWUE), water transport rate (LIWTR), total nutrient transport capacity (TNTC), and nutrient substance use efficiency (NSUE) of B. napus L. leaves under low-P stress. Means ± SE (n = 3) followed by different letters in the same column are significantly different at p ≤ 0.05, according to one-way ANOVA.
Table 2. Leaf anatomical parameters of B. napus L. under low-phosphorus stress.
P Concentration (mmol·L−1)Thickness (μm)
Total Leaf
Thickness
Upper EpidermisPalisade
Parenchyma
Sponge
Parenchyma
Lower Epidermis
1.000162.574 ± 0.869 a11.221 ± 0.421 c48.248 ± 1.364 b93.321 ± 1.776 a9.786 ± 0.343 b
0.250156.961 ± 0.353 b15.937 ± 0.484 ab47.581 ± 1.386 b81.358 ± 1.189 b12.085 ± 0.242 a
0.125128.669 ± 0.487 c17.077 ± 0.330 a57.941 ± 0.935 a40.597 ± 0.353 d13.055 ± 0.335 a
0.034122.519 ± 0.194 d15.187 ± 0.173 b32.418 ± 0.173 c62.805 ± 0.883 c12.110 ± 0.363 a
Note: Means ± SE (n = 3) followed by different letters in the same column are significantly different at p ≤ 0.05, according to one-way ANOVA.
Table 3. Leaf tissue characteristics of B. napus L. under low-phosphorus stress.
P Concentration (mmol·L−1)P/S Ratio (%)CTR (%)SR (%)
1.00051.790 ± 2.437 b29.675 ± 0.780 b57.406 ± 1.145 a
0.25058.556 ± 2.538 b30.311 ± 0.819 b51.837 ± 0.872 b
0.125142.752 ± 2.837 a45.029 ± 0.652 a31.551 ± 0.212 c
0.03451.662 ± 1.616 b26.458 ± 0.420 c51.264 ± 0.802 b
Note: Palisade–sponge ratio (P/S ratio, %), tightness degree of leaf tissue structure (CTR, %), and loose degree of leaf tissue structure (SR, %) of B. napus L. leaves under low-P stress. Means ± SE (n = 3) followed by different letters in the same column are significantly different at p ≤ 0.05, according to one-way ANOVA.
Table 4. The leaf area growth parameters of B. napus L. estimated using Logistic equation under low-P stress.
P Concentration (mmol·L−1)aX0GR50DTlogEquationR2p
1.00027.8696.6701.48118.809 Y = 25.261 + 27.869 1 + ( X 6.670 ) 1.419 1.000<0.0001
0.25049.25113.7121.00049.272 Y = 25.287 + 49.251 1 + ( X 13.712 ) 1.113 0.995<0.0001
0.12526.7256.5101.77115.092 Y = 26.143 + 26.725 1 + ( X 6.510 ) 1.725 1.000<0.0001
0.03425.6516.3180.98626.042 Y = 25.310 + 25.651 1 + ( X 6.318 ) 0.986 1.000<0.0001
Table 5. The stem diameter growth parameters of B. napus L. estimated using Logistic equation under low P-stress.
P Concentration (mmol·L−1)aX0GR50DTlogEquationR2p
1.0000.7485.9680.04516.601 Y = 2.113 + 0.748 1 + ( X 5.968 ) 1.438 0.999<0.0001
0.2501.0727.6540.03728.983 Y = 2.077 + 1.072 1 + ( X 7.654 ) 1.056 1.000<0.0001
0.1250.8529.1200.02830.861 Y = 2.130 + 0.852 1 + ( X 9.120 ) 1.182 1.000<0.0001
0.0340.53410.2270.01535.879 Y = 2.133 + 0.534 1 + ( X 10.227 ) 1.140 1.000<0.0001
Disclaimer/Publisher’s Note: The statements, opinions and data contained in all publications are solely those of the individual author(s) and contributor(s) and not of MDPI and/or the editor(s). MDPI and/or the editor(s) disclaim responsibility for any injury to people or property resulting from any ideas, methods, instructions or products referred to in the content.

