Article

Discrimination of Fungicide-Contaminated Lettuces Based on Maximum Residue Limits Using Spectroscopy and Chemometrics

by
Antonio José Steidle Neto
1,*,
João L. M. P. de Lima
2,*,
Alexandre Maniçoba da Rosa Ferraz Jardim
3,
Daniela de Carvalho Lopes
1 and
Thieres George Freire da Silva
4
1
Department of Agrarian Sciences, Federal University of São João del-Rei—UFSJ, Campus Sete Lagoas, Sete Lagoas 35701-970, MG, Brazil
2
Marine and Environmental Sciences Centre—MARE, Aquatic Research Network—ARNET, Department of Civil Engineering, Faculty of Sciences and Technology, University of Coimbra, 3030-788 Coimbra, Portugal
3
Department of Biodiversity, Institute of Biosciences, São Paulo State University—UNESP, Rio Claro 13506-900, SP, Brazil
4
Department of Agricultural Engineering, Federal Rural University of Pernambuco—UFRPE, Recife 52171-900, PE, Brazil
*
Authors to whom correspondence should be addressed.
Horticulturae 2024, 10(8), 828; https://doi.org/10.3390/horticulturae10080828 (registering DOI)
Submission received: 25 June 2024 / Revised: 27 July 2024 / Accepted: 30 July 2024 / Published: 5 August 2024

Abstract

:
The fast and effective monitoring of agrochemical residues is essential for assuring food safety, since many agricultural products are sprayed with pesticides and commercialised without waiting for the pre-harvest interval. In this study, we investigated the use of spectral reflectance combined with principal component analysis (PCA) and partial least squares discriminant analysis (PLS-DA) to evaluate the discrimination of fungicide-contaminated lettuces, considering three maximum residue limits (MRLs) [3.5, 5, and 7 mg carbon disulphide (CS2) kg−1]. The non-systemic Mancozeb fungicide (dithiocarbamate) was adopted in this research. Spectral reflectance (Vis/NIR) was measured by a hand-held spectrometer connected to a clip probe with an integrating sphere. The lettuce spectra were pre-treated (centring, standard normal variate, and first derivative) before data processing. Our findings suggest that PCA recognised inherent similarities in the fungicide-contaminated lettuce spectra, categorising them into two distinct groups. The PLS-DA models for all MRLs resulted in high accuracy levels, with correct discriminations ranging from 94.5 to 100% for the external validation dataset. Overall, our study demonstrates that spectroscopy combined with discriminating methods is a promising tool for non-destructive and fast discrimination of fungicide-contaminated lettuces. This methodology can be used in industrial food processing, enabling large-scale individual analysis and real-time decision making.

Graphical Abstract

1. Introduction

Lettuce (Lactuca sativa L.) is an annual plant belonging to the Asteraceae family. Globally, millions of tons of lettuce are cultivated annually to meet the increasing demand for ready-to-eat vegetables. Furthermore, this vegetable is known for its numerous medicinal properties attributed to phytonutrients, vitamins, and metabolites such as terpenoids, flavonoids, and phenolic compounds. These properties include pain alleviation, relief from stomach ailments, inflammation, and urinary tract infections [1]. In its chemical composition, lettuce also contains a variety of macroelements (e.g., Ca2+, Mg2+, K+, and Na+) and trace elements (e.g., Fe2+, Zn2+, Cu2+, and Mn2+) essential for human nutrition [2].
In actual agriculture, pesticides are sprayed to vegetable, fruit, and grain crops for control and protect them against pests and pathogens. People are exposed to pesticides mainly by the consumption of fresh foods, even they are cleaned and sanitised. Unfortunately, many agricultural products sprayed with agrochemicals are commercialised without waiting the pre-harvest interval for safe consumption. The manufacturers affirm that the adequate use of pesticides does not harm the human health and contaminate the soil. However, residues can persist on the agricultural crops after harvest if abusive spraying of pesticides are made disregarding the safety recommendations [3]. This risk is particularly considerable for widely consumed crops susceptible to fungi and pests.
Several scientific studies have reported the presence and persistence of pesticides in vegetables and fruits from Morocco [4], China [5], Algeria [6], Chile [7], Iran [8], and Brazil [9], among others. Dithiocarbamate fungicides are an important group of non-systemic pesticides used in large scale around the world in agricultural crops [10]. They are characterised by a wide spectrum of activity to combat different crop pathogens, low manufacturing costs, and small mammal toxicity [11]. Mancozeb (ethylene-bis-dithiocarbamate) is a fungicide applied to protect vegetable and fruit crops against a broad range of foliar fungal diseases [12]. However, a long-term study has revealed potent carcinogenic activity associated with this pesticide [13]. It is registered for use in many countries on horticultural and agricultural food crops, as well as on ornamentals and forestry species [14].
Maximum residue limits (MRLs) are the upper legal levels of a concentration for residues of pesticides in food, considering good agricultural practices to ensure minimal consumer exposure. The establishment of the MRL values considers dietary risks and patterns, as well as edaphoclimatic conditions. International standardisation of MRL is desirable for facilitating trade and ensuring global food safety controls. However, differences among countries in agricultural practices, risk assessments, regulatory frameworks, and consumer preferences contribute to the variation in MRL adopted worldwide. The Codex Alimentarius Commission, established by the Food and Agriculture Organization (FAO) and the World Health Organization (WHO), develops international food standards, guidelines, and codes of practice, including MRLs. These standards serve as a reference for many countries in setting their own MRL. However, the definition and establishment of MRLs in food (Table 1) are typically the responsibility of national or regional regulatory agencies.
In a bibliometric review based on the Web of Science database, Veiga-del-Baño et al. [25] discussed the global trends of dithiocarbamate residues in food between 1948 and 2021. These authors concluded that the scientific production and the Reference Publication Year Spectroscopy (RPYS) presented a decrease in the years 2020 and 2021, possibly motivated by legislative changes in MRL and/or prohibition of the use of different dithiocarbamates. Indeed, adjustments in MRL and prohibitions for specific crops have been implemented by regulatory agencies in several countries. For instance, spraying Mancozeb on lettuce was permitted by the European Food Safety Authority (EFSA) until 2020, considering a MRL of 5 mg CS2 kg−1 [26]. However, the Commission Implementing Regulation (EU) 2020/2087 decided not to renew the approval of the Mancozeb for use in the European Union countries [27]. Additionally, this pesticide is not authorised for lettuce by the National Sanitary Surveillance Agency of Brazil (ANVISA). Nevertheless, analyses carried out by the Program on Pesticide Residue Analysis in Food, linked to ANVISA, showed Mancozeb residues in lettuce samples grown in several states of Brazil.
The quantification and detection of fungicide residues in agricultural products are of high importance, since they are toxic to humans on various levels and are associated with long-term negative health impacts [28]. Gas chromatography and liquid chromatography combined with tandem mass spectrometry are the most widely used techniques for multi-residue analysis of pesticides in vegetables and fruits, usually combined with the QuEChERS method [4]. However, according to Pu et al. [29], there is pressure for non-contact, non-destructive, rapid, and efficient methods for fast evaluation of agricultural crops in the cultivation areas, processing industry, and markets. Fast and environmentally friendly techniques that use fewer solvents and smaller sample sizes have been studied and applied. Following this trend, the horticultural sector has sought out new technologies to enhance its competitiveness. This includes modern agricultural practices, genetically improved plants, more efficient machines, and the investment on automatic classification tools [30]. The automatic classification and discrimination of plants is increasing in importance, since it is required to optimise the on-line monitoring procedures in the field and industry, improving remote sensing identification and traceability, as well as to assure product credibility.
The great success of spectroscopy as one of the most versatile techniques in analytical chemistry is due its handle easiness and measurement speediness, providing molecular information for samples in different physical states, with minimum or without chemical treatment [31]. Specifically, the spectral reflectance has been successful in classifying different agricultural products, for instance when discriminating different varieties of rice [32], olive [33], grapevine [34], coffee [35], and sugarcane [36]. This technique has been also used to detect maturation stages in lettuces [37], to evaluate spinach quality [38], and to identify bruises on apples [39]. Despite the harmful effects of pesticides, their use has been increasing every year. Li et al. [5] affirmed that the lack of knowledge and training among farmers is one of the major challenges to the correct application of pesticides. Many farmers in several countries use dithiocarbamates to protect vegetable and fruit crops against foliar fungal diseases, sometimes not waiting for the pre-harvest interval and even though these fungicides are not approved by government agencies for specific crops. Thus, regular monitoring of pesticide residue is essential for the protection of human health, international trade, and food safety. For this purpose, is very important to develop and validate a tool that enables fast and effective detection, as well as the discrimination of pesticide residues in crops.
The present study was developed to evaluate two discriminating methods (principal component analysis and partial least squares discriminant analysis) combined with spectral reflectance (Vis/NIR) for discriminating fungicide-contaminated lettuces, considering three MRLs (3.5, 5, and 7 mg CS2 kg−1). Without the objective of accurate quantitation, the proposed method can improve the lettuce traceability for contaminants, contributing to real-time decision making and assuring healthy food for human consumption.

2. Materials and Methods

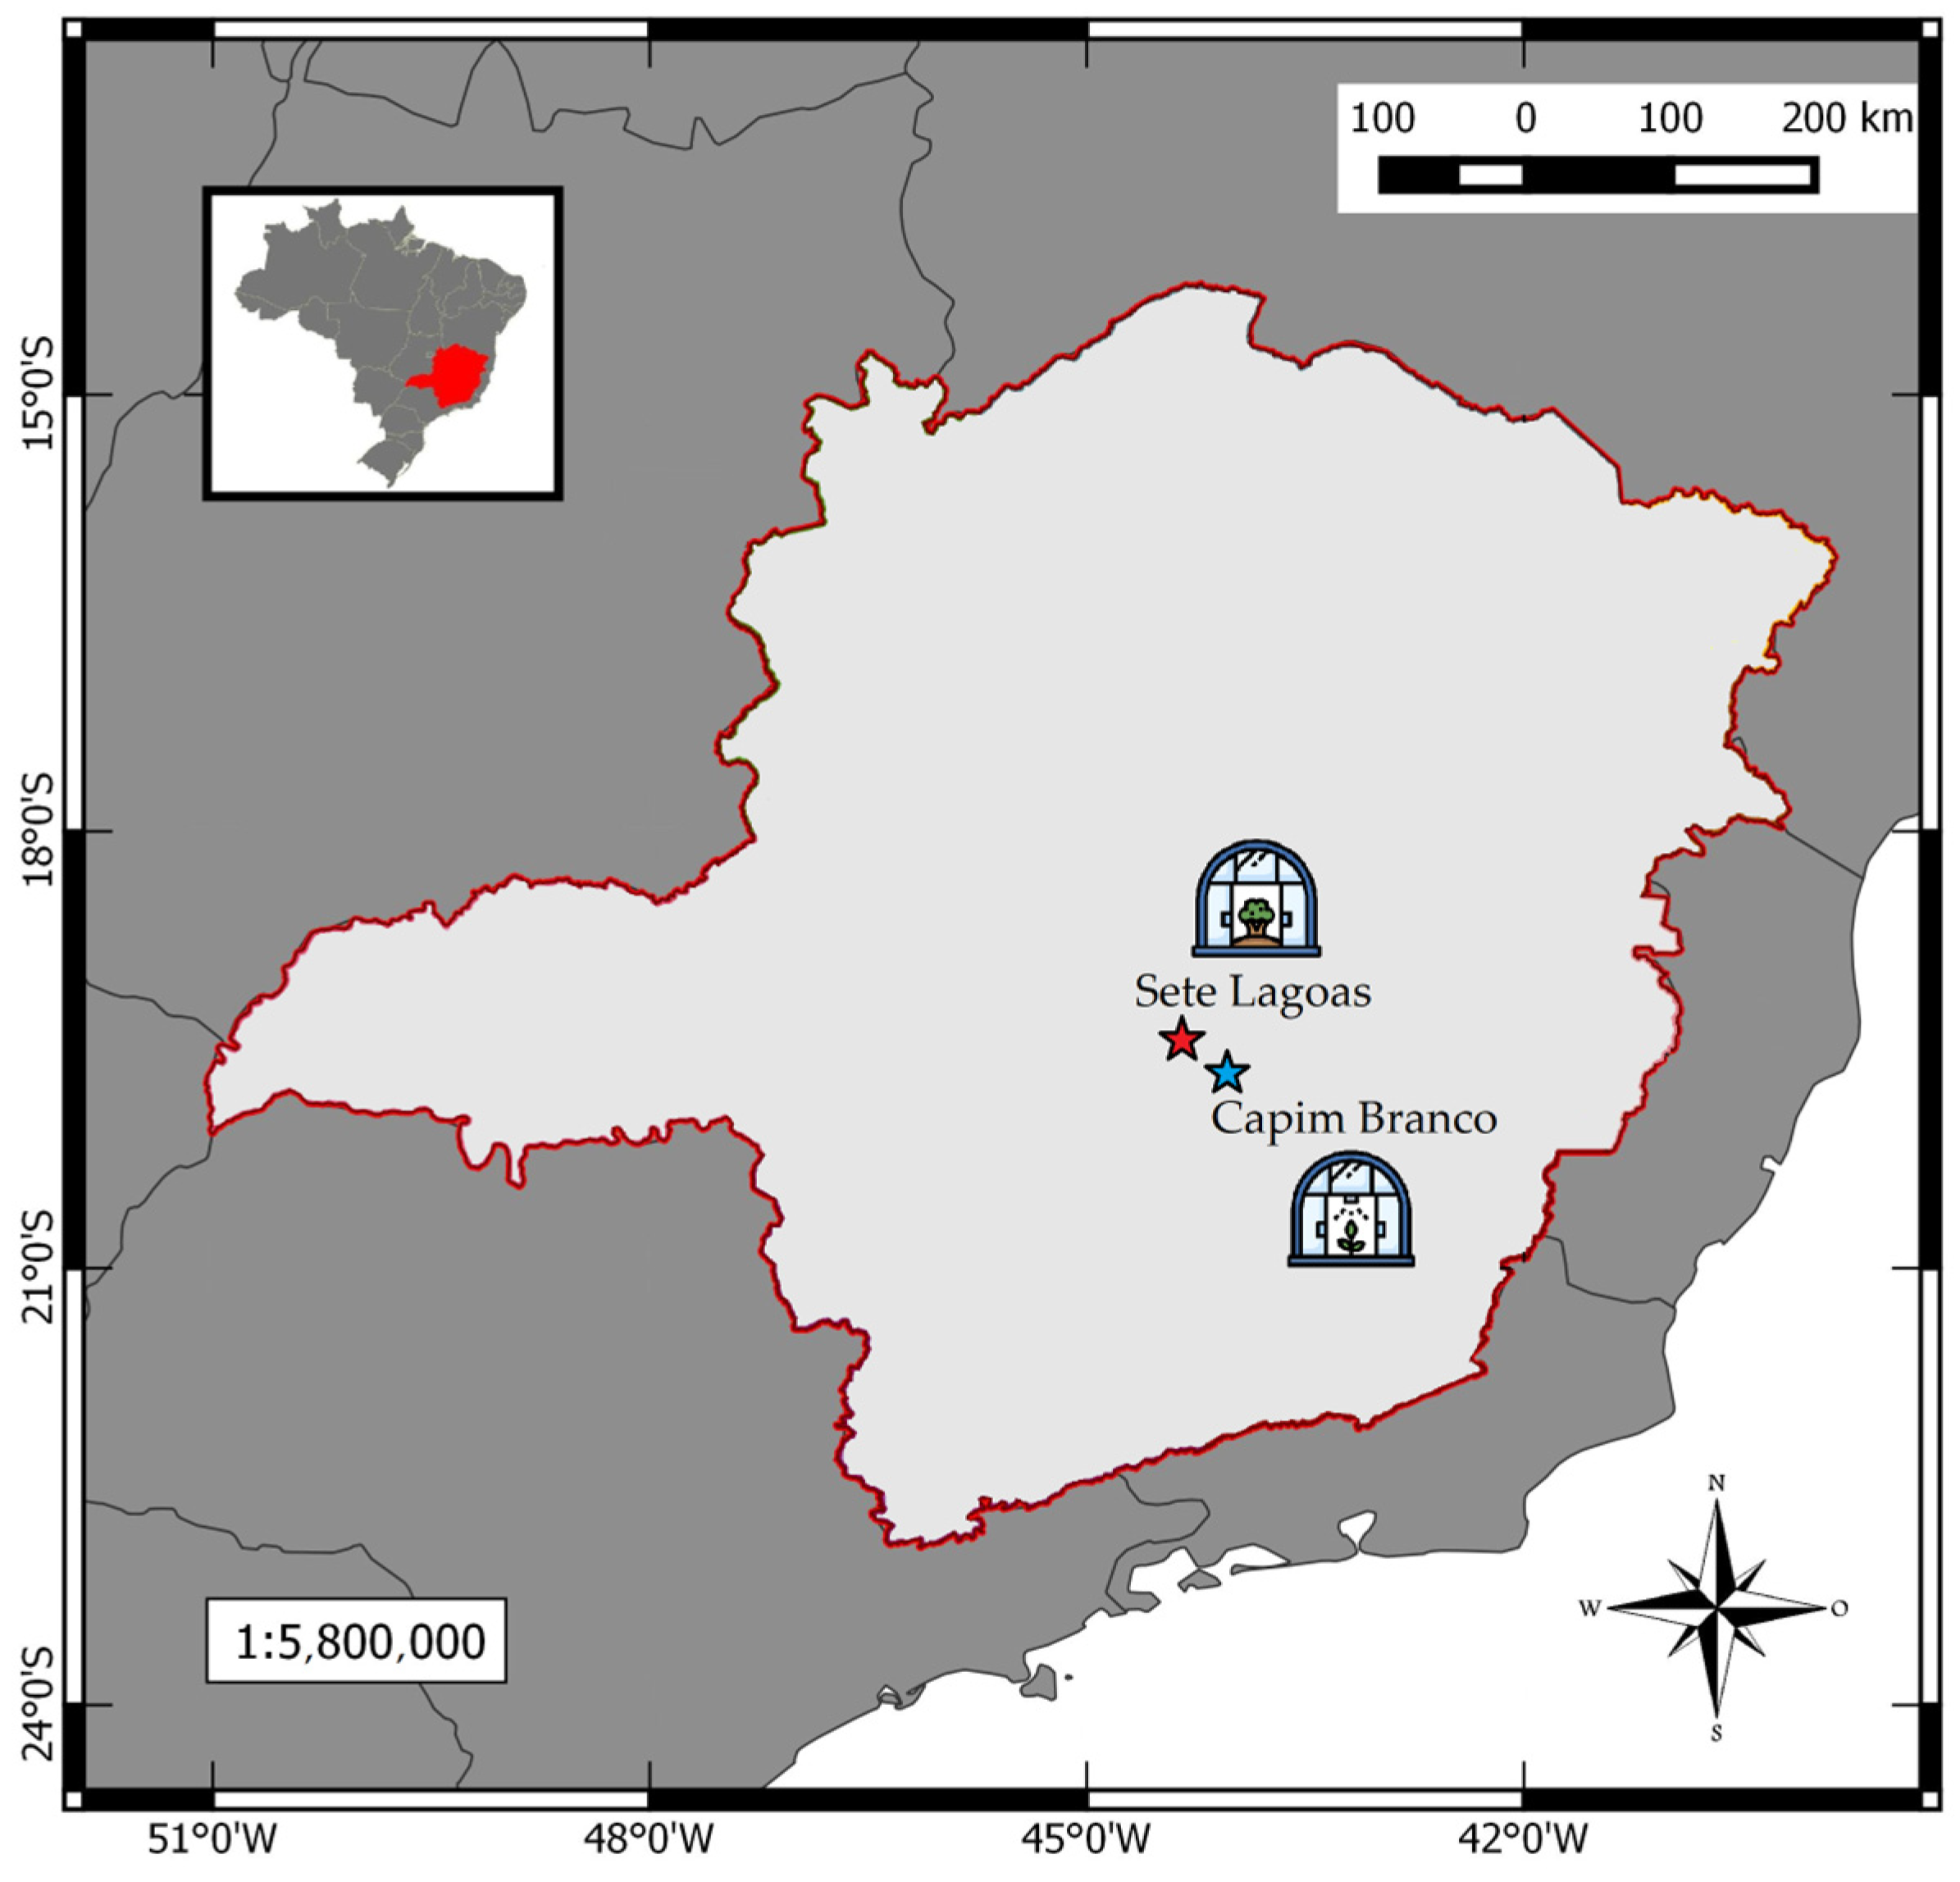
2.1. Plant Material, Experimental Design, and Location

The Regina variety of lettuce, characterised by green plain leaves, was grown organically on a certified farm situated in Capim Branco, Minas Gerais, Brazil. The farm’s coordinates are 19°34′ S latitude, 44°10′ W longitude, with an elevation of 816 m (Figure 1). The climate of this region is classified as Cwa (Köppen system), featuring warm temperate conditions with dry winters and wet summers [40].
The lettuce seeds were sown in polypropylene trays (15 units with 50 cells each) filled with organic soil [soil and humus in the ratio of 1:0.5 (w:w basis)] (Figure 2). Seedling growth took place beneath a low-density polyethylene film (Suncover Av Blue 180 μm, Ginegar, Leme, SP, Brazil), enabling better irrigation management. Inside the greenhouse, a photoselective shading net (ChromatiNet Raschel Red 35%, Ginegar, Leme, SP, Brazil) was used, reducing direct sunlight exposure on the plants and enhancing the crop yield.
The healthy and vigorous seedlings were transferred to polypropylene pots (0.24 m × 0.24 m × 0.22 m) filled with a thin layer of gravel, covered by soil blended with organic materials (vegetable biomass and cow manure) in a ratio of 1:1 (w:w basis) (Figure 2). Fertilising was done by the addition of syrup containing 10% cow urine. Crop watering was managed using a drip system regulated by an automatic controller. The experiment comprised 500 lettuce plants, with 355 designated as experimental units and 145 for boundary effects.
Several days prior to the plants reaching physiological maturity, the lettuce plants were moved to a different greenhouse for fungicide application. This greenhouse is approximately 22 km away from the organic farm, situated at the Federal University of São João del-Rei, located at the Sete Lagoas, Minas Gerais, Brazil (Figure 1 and Figure 2). It also features the same covering as described earlier (photoselective shading net and polyethylene film).

2.2. Fungicide Spraying

In this research, the Mancozeb (dithiocarbamate), which is a non-systemic fungicide, was employed. Its active component is a precursor of carbon disulphide (CS2), which has many useful chemical and physical properties, being characterised by a toxic, highly volatile, flammable, colourless, liquid organosulfur compound. The pesticide was solubilised in water to ensure an adequate volume for application on the lettuce heads (Figure 2). The dosage recommended in the package instructions for green leafy vegetables was followed (2 to 3 kg of pesticide per hectare). Except for five plants designated as control units, selected randomly within the greenhouse, the Mancozeb spraying on lettuce plants was made using an electric equipment, producing droplets with diameters of 29 µm on average. Standardisation was maintained regarding the timing of application and the distance between the sprayer nozzle and the lettuce heads. The uniformity and homogeneity of fungicide application on the plants was verified individually by a magnifying glass equipped with an LED ring light.
In line with the dosage, this study adhered to the pre-harvest interval of 14 days, specified in the package instructions for the consumption with safety of green leafy vegetables. Sampling for laboratory analyses and spectral measurements occurred on alternate days within this interval, commencing one day after pesticide spraying and totalling seven days. Each day, 10 samples were collected, each weighing over 500 g and comprising five randomly selected plants. Fresh mass was obtained by an analytical balance after removing the roots. Thus, 50 lettuce heads were sampled daily, resulting in a total of 350 plants. The experimental design was completely randomised with seven alternate days after pesticide spraying (treatments) and 10 samples (repetitions).

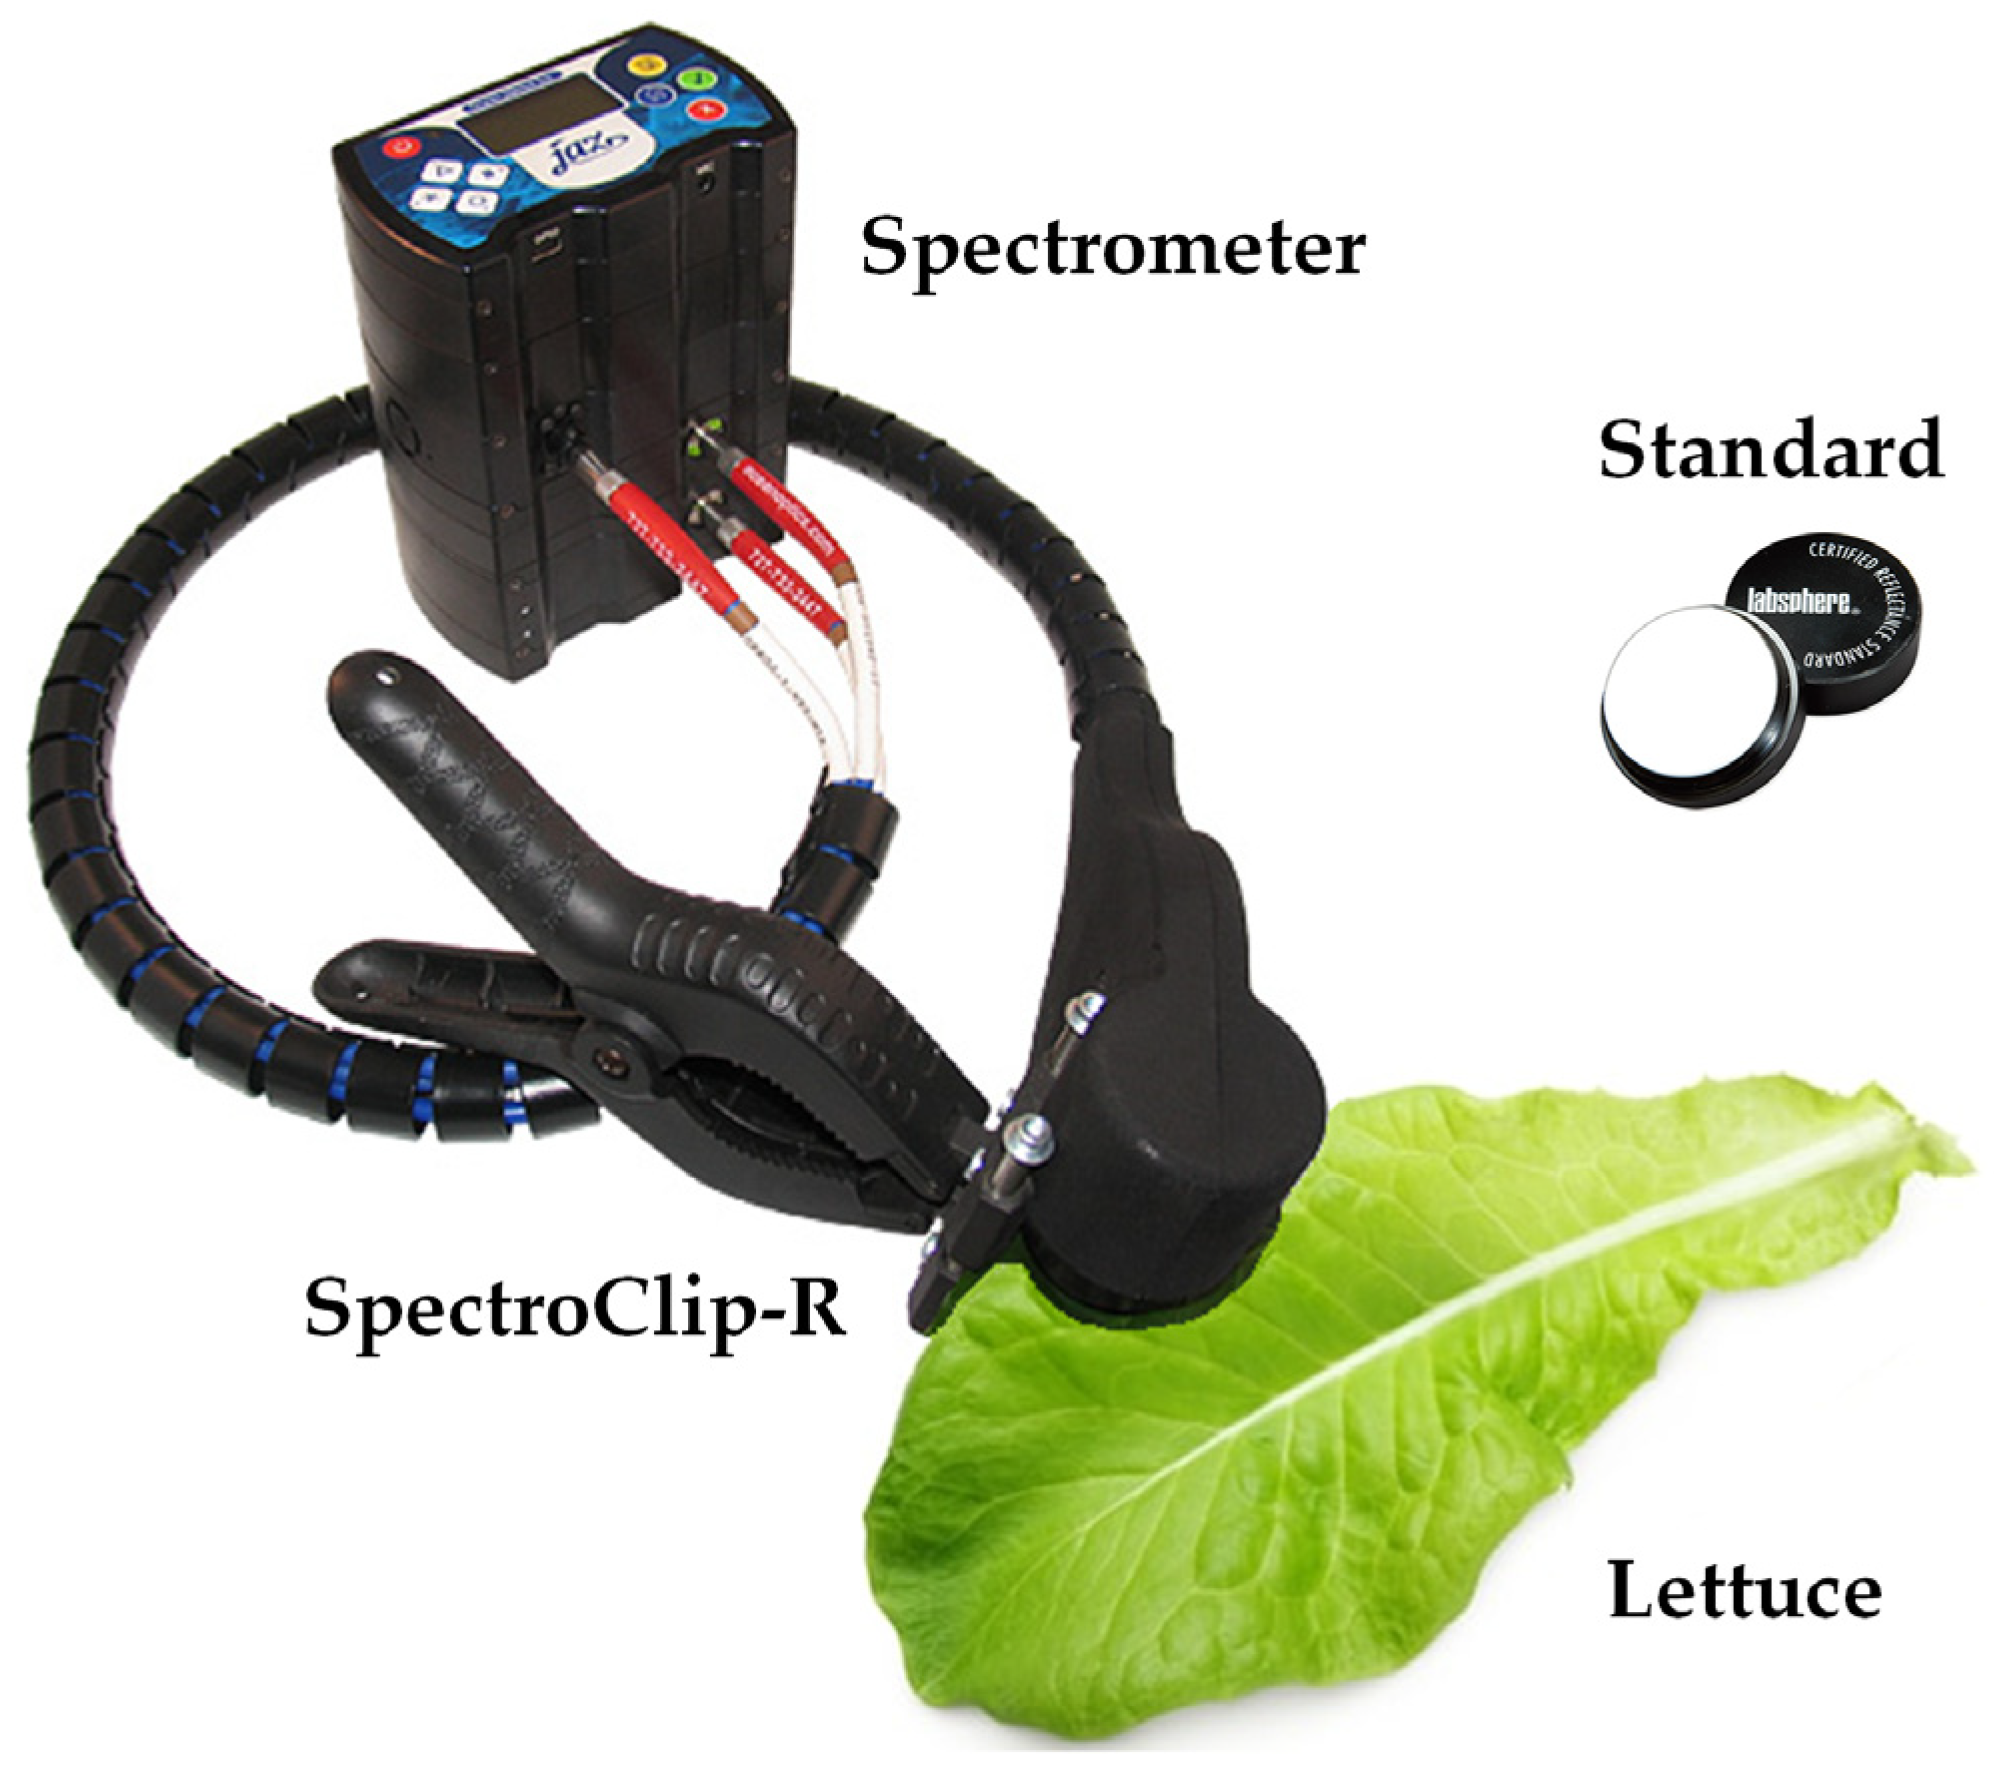
2.3. Reflectance Measurements

Lettuce spectral signatures (Figure 2 and Figure 3) were assessed using a portable spectrometer (JAZ-EL350, Ocean Optics, Orlando, FL, USA), interconnected to a light source and powered by a battery (Table 2). To obtain the reflected light from the leaf, a specialised clip probe (SpectroClip-R, Ocean Optics, Orlando, FL, USA) was employed (Figure 3). This probe incorporates an integrating sphere designed to diffuse the incoming flux, allowing that the spectrometer detector measure the dispersed light for each wavelength. The illuminated sample area within the clip probe measures 5 mm in diameter. Premium fibres of 600 μm (Vis/NIR) coupled the light source and the spectrometer to the probe. A SpectralonTM diffuse reflectance standard was the reference for spectral measurements.
Following the warm-up period of the light source, reference standard measurements were taken before obtaining the spectral signatures of lettuce leaves. The spectral data were calibrated using the software SpectraSuite 2.0 (Ocean Optics, Orlando, FL, USA) and expressed as a relative percentage of the reference standard:
Rλcal = [(RλleafRλdark)/(RλrefRλdark)] × 100
where Rλcal is the calibrated spectral reflectance from the lettuce leaves (%), Rλleaf is the spectral reflectance from the lettuce leaves (dimensionless), Rλref is the spectral reflectance from the diffuse reflectance standard (dimensionless), and Rλdark is the spectral reflectance considering light absence from the overall closure of the light source shutter (dimensionless).
As represented in the diagram (Figure 2), spectral reflectance measurements were carried out inside the greenhouse at the end of the afternoon, under mild ambient temperature conditions (approximately 23 °C) with the purpose of avoiding the overheating of the spectrometer detector and light source. From each plant, three leaves were randomly chosen from the outer, middle, and inner regions of the lettuce head. Three separate measurements were taken at standardised and evenly spaced locations on the adaxial surface of the leaf, avoiding the edges and veins. Consequently, a total of 3195 spectra were measured, accounting for the 350 sprayed lettuce heads and the five plants without dithiocarbamate residues (control units).
The digital files with the spectral signatures were saved on an external hard drive and moved to a portable computer for analysis using electronic spreadsheets. Throughout the analysis process, the average spectral signatures were calculated for each sample of lettuce plants.

2.4. Dithiocarbamate Analytical Determination

The samples were divided into quarters, ground in an automatic blender, stored in airtight packages, and frozen in an ultra-freezer (−30 °C) to minimise metabolisation and degradation of the pesticide. The analytical measurement of dithiocarbamate followed the reference method of Cullen [41], which was later refined by Keppel [42]. Mancozeb concentration was quantified by spectrophotometric analysis, measuring the cupric complex formed with the CS2 released from the acid decomposition of the analyte in the presence of a reducing agent (stannous chloride) [43]. The resulting solution (copper II acetate monohydrate + CS2) was contained in a quartz cuvette. Measurements were performed using a UV–Vis spectrophotometer (Cary 50, Varian, Agilent, Santa Clara, CA, USA) at 435 nm. Following laboratory analyses, 70 reference values were measured, with 10 values corresponding to each treatment.

2.5. Chemometric Analysis

The chemometric and multivariate statistical methods used to assess the potential of spectral reflectance for discriminating fungicide-contaminated lettuces were the principal component analysis (PCA) and partial least squares discriminant analysis (PLS-DA). Three MRLs (3.5, 5, and 7 mg CS2 kg−1) were selected according to the values presented in Table 1, assuming that lower limits are adopted for most countries or organisations and that there is a strong trend of decrease or prohibition of dithiocarbamate use in agricultural products over time. All spectra were pre-treated (centring, standard normal variate, and first derivative) before each data processing. Preliminary tests indicated that these pre-treatments were more appropriate for obtaining smaller discrimination errors, also improving the accuracy and robustness of the models.
According to Lopes and Steidle Neto [44], centring and normalisation are mandatory steps before PCA and PLS-DA. These pre-treatments were computed following the procedures recommended by Moscetti et al. [45], Yuan et al. [46], and Martens and Naes [47]. For centring, an average spectrum was calculated by using all the spectra in the dataset and then it was subtracted from each spectrum (mean-centring). The standard normal variate (SNV) was applied as normalisation technique, in which the spectrum was subtracted at every wavelength by the spectrum average and this result was divided by the spectrum standard deviation. First derivative was calculated by the Savitzky–Golay algorithm [48] with 25 derivative points (window for calculation), optimally fitting the dataset points to a polynomial in the least-squares sense.
A PCA was performed before PLS-DA to derive the principal components (PC) from the spectral data, seeking inherent similarities of data, detecting patterns, and verifying outliers in the dataset [49,50]. Consequently, the original data were transformed into new variables (PCs), which were orthogonal and uncorrelated. The first PC represented the largest amount of variance in the original dataset, and each succeeding component accounted for as much of the remaining variability as possible. The PCA was run with the spectral data following procedures proposed by Saporta [51], where the original data matrix was decomposed into scores, loadings, and residual matrices. The score matrix represented the coordinates of the transformed variables in the PC space. That is, it was related with the original regressors and was applied for data exploration and model predictions. The loading matrix represented the correlation of each PC at the specified wavelengths, while the residual matrix was the portion of the data not explained by the PCs, such as noise and uncertainties.
PLS-DA is a supervised method and uses a training set of samples to define a decision boundary in the space of response patterns. For this, spectral reflectance was associated with the reference method results and data were grouped into predefined classes, which varied according to the different MRLs used in this research. Mathematical models were then built, capable of identifying unknown samples with different MRL thresholds (3.5, 5, and 7 mg CS2 kg−1). When applying the PLS-DA method, the calibration with cross-validation followed by an external validation was used, as it is the most recommended procedure when developing chemometric models [52]. Thus, the dataset was divided into groups, and models from reduced data were developed with one of the groups omitted and used for test purposes. Prediction residuals were calculated for each developed model, and the process was repeated with another subset of the calibration dataset, until every subset was left out once [50]. The final model was that with the lower prediction residual and was used with the external validation dataset in order to perform independent discriminations, evaluating its final performance.
Following Huang et al. [53], 2/3 of the samples (47 spectra) were utilised as the calibration with cross-validation dataset, and 1/3 of the samples (23 spectra) as the external validation dataset. Both datasets contained representative samples of the seven experimental treatments. This method was used for estimating independent data, distinct from the calibration with cross-validation dataset [54].
PLS-DA data reduction was conducted seeking for discriminant factors, which were linear combinations of selected PCs resulting from the PCA analysis, allowing a better separation of the centres of gravity of the MRLs considered as threshold [55]. Models for one to five discriminant factors were tested while building the models. The choice of the optimal number of discriminant factors was determined according to the increment of the calibration with cross-validation errors, as more discriminant factors were used in each model. The number of discriminant factors was incremented until calibration with cross-validation errors did not vary or were greater than the previous analysis.
During this process, two matrices (X and Y) were constructed. The X matrix corresponded to the original data, while the Y matrix consisted of one column associated with the residue level (above or below the maximum allowable value) and as many lines as there were spectra. Each spectrum had the value 1 for the class it belongs to and 0 for the other. A model was developed for each class, and the closer a spectrum of a certain column in Y was to 1, the more likely that sample was classified as a member of a particular MRL. This procedure guaranteed that observations were always classified in one of the available residue levels. It was repeated three times, considering the MRLs of 3.5, 5, and 7 mg CS2 kg−1.
The PCA results were visualised with the score plot of the first two principal components aiming to provide the most efficient two-dimensional representation of the fungicide residue information contained in the dataset. The performances of PLS-DA models were assessed by loading profiles and confusion matrices, which represented the numbers of samples attributed to each MRL compared to the dithiocarbamate analytical values (references). The diagonals of the confusion matrices contained the correct discrimination percentages, with best results approaching 100%. Confusion matrices were processed for both calibration with cross-validation and external validation datasets.
Based on the discrimination percentages presented in confusion matrices, kappa coefficients were calculated to evaluate the accuracies of the discriminant analyses [56]. According to McHugh [57], this correlation statistic is useful for either interrater or intrarater reliability testing. Salkind [58] and Gold et al. [59] reported six benchmarks for interpreting the kappa coefficient results: poor (<0.00), slight (0.00–0.20), fair (0.21–0.40), moderate (0.41–0.60), substantial (0.61–0.80), and almost perfect (0.81–1.00). The software SPECTOX 2.0 was custom-built for this research to facilitate chemometric analysis and spectral data processing tasks. It was developed in Java using the software NetBeans 22 (Apache Software Foundation, Wilmington, DE, USA). The pre-treatment algorithms were integrated into the software SCILAB 6.1.1 (Scilab Enterprises, Versailles, France).

3. Results

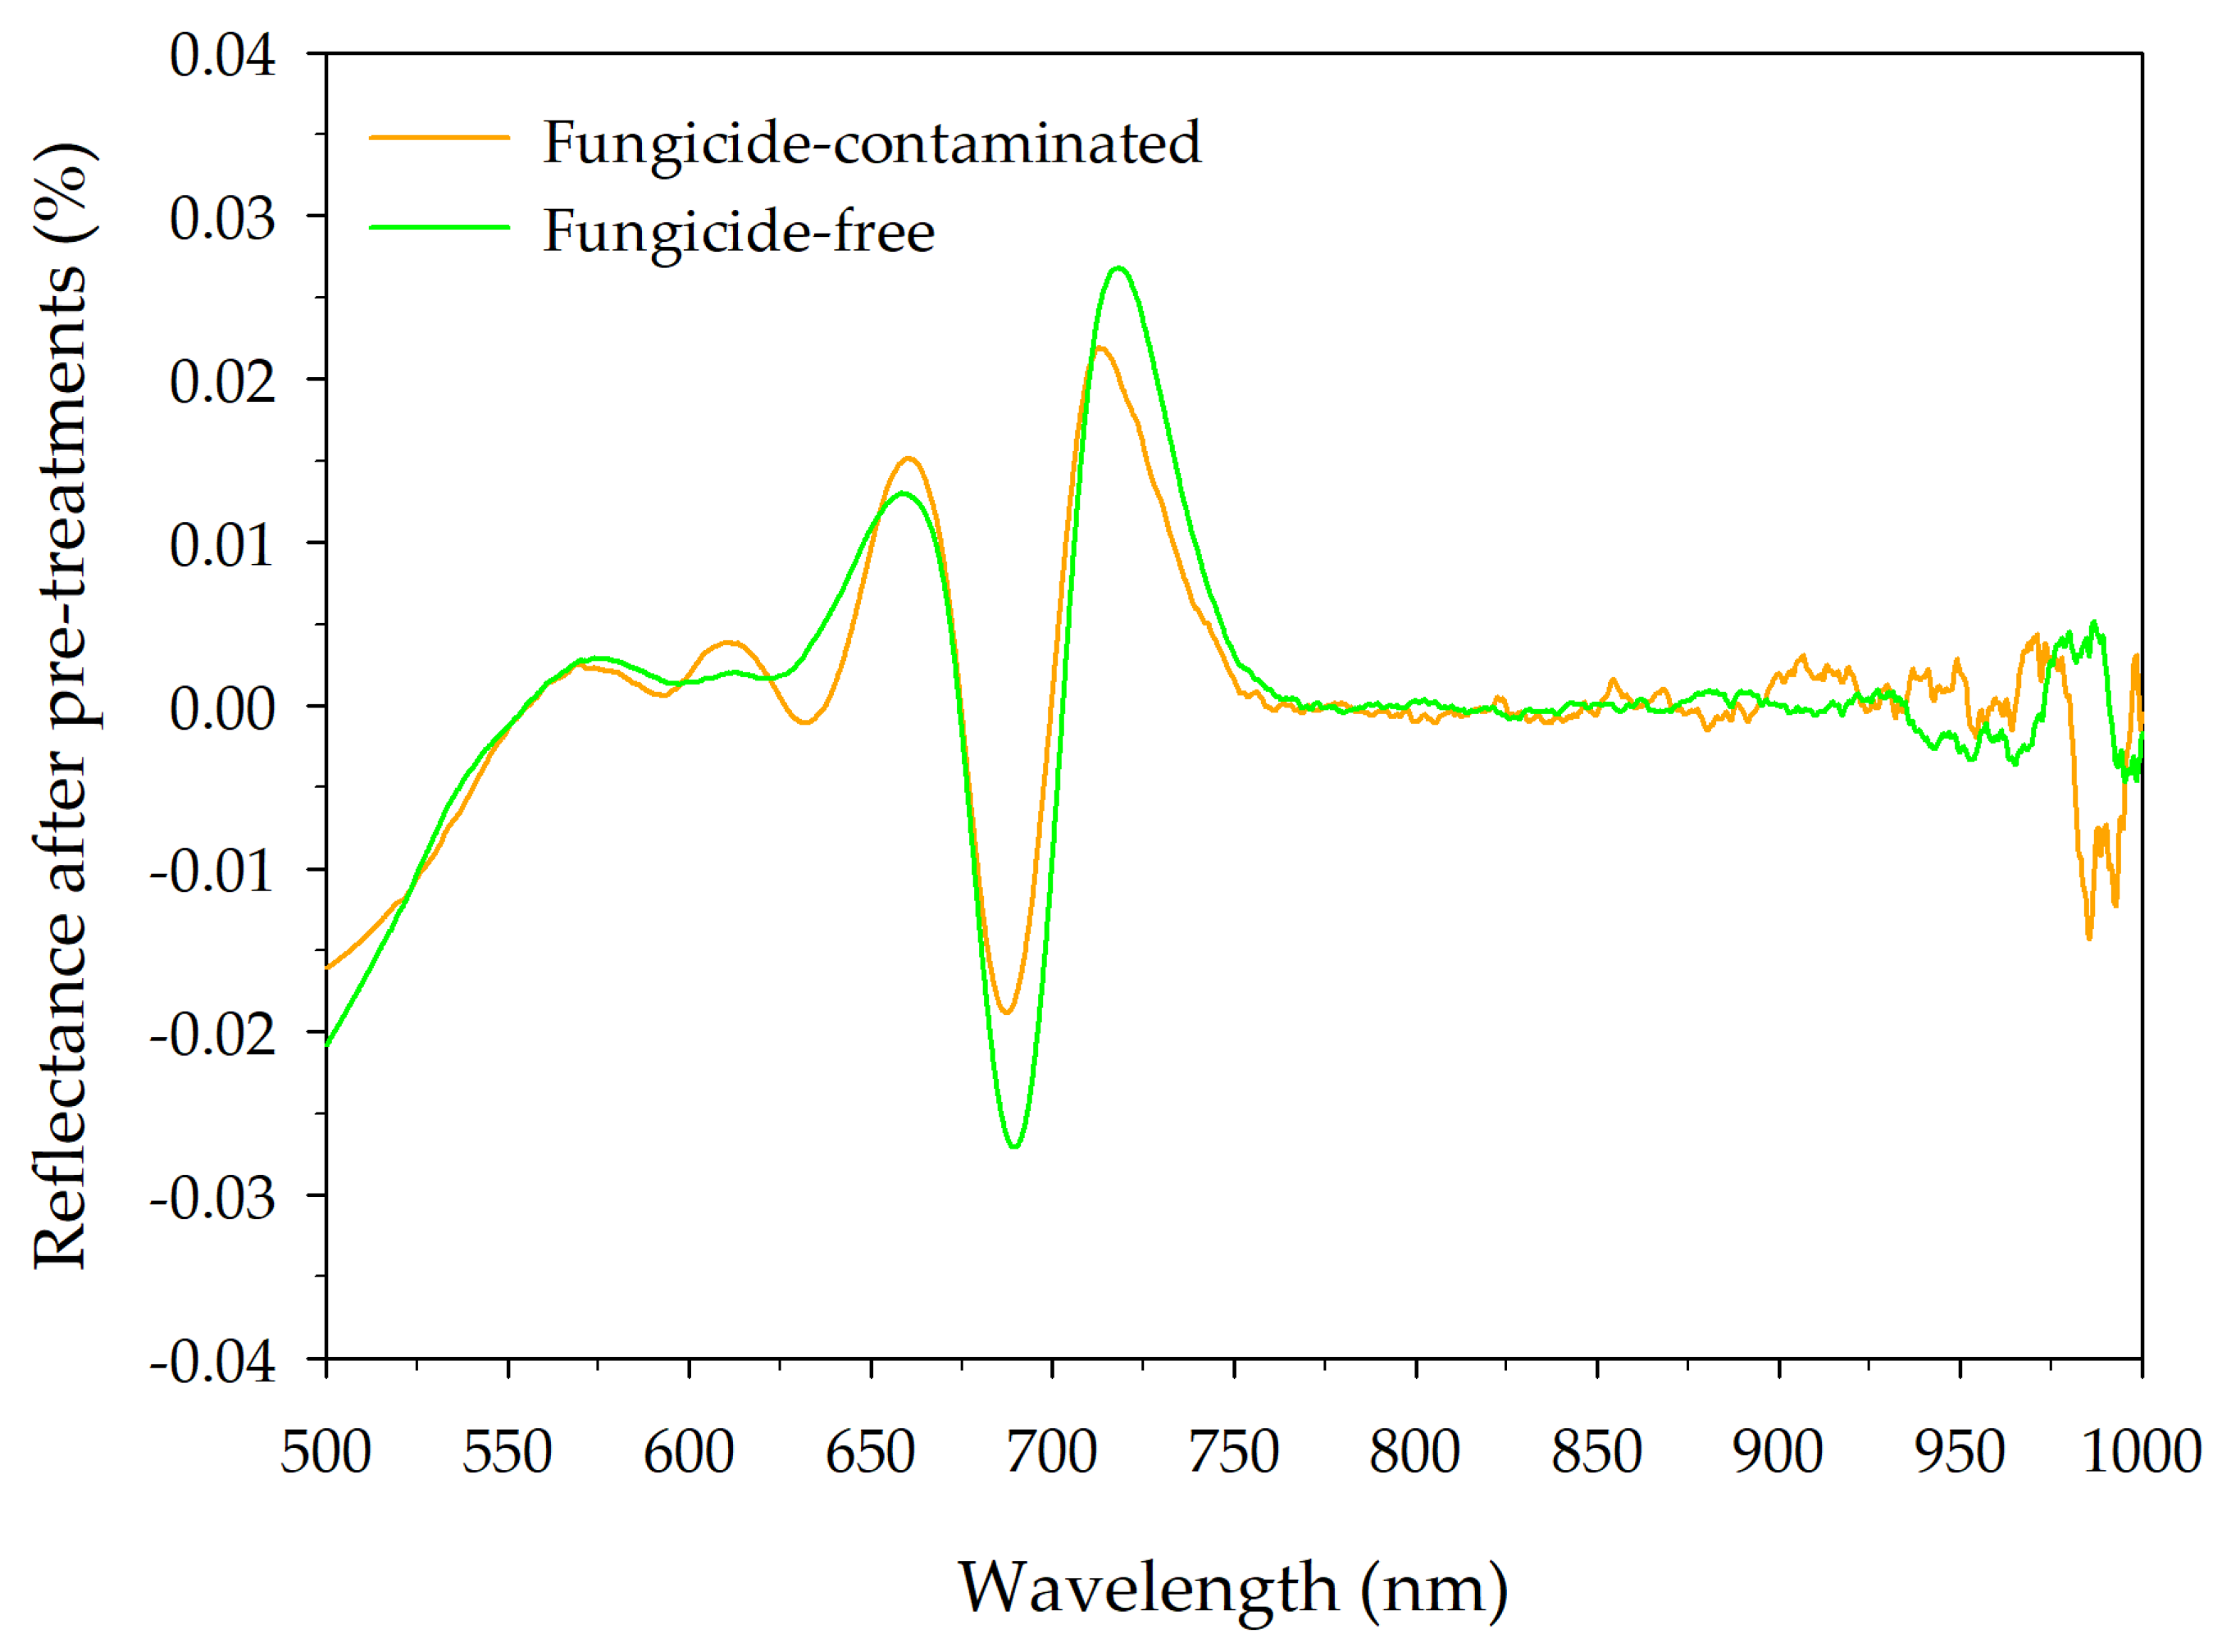
3.1. CS2 Behaviour in Lettuce and NIR Spectral Signatures

Table 3 presents the Mancozeb residue values, expressed as CS2, on head lettuces during the pre-harvest interval, determined from the average dithiocarbamate measurements. The residues of dithiocarbamate were below the maximum limits adopted in this work (3.5, 5, and 7 mg CS2 kg−1) after 3 to 5 days. The average spectral reflectance of the lettuce samples, with presence and absence of dithiocarbamate (Mancozeb), are presented in Figure 4. Due to instrumental and systematic noises, the spectral region used for chemometric analysis was 500–1000 nm. It was found that lettuce reflectance for fungicide-contaminated and fungicide-free leaves after pre-treatments (centring, standard normal variate, and first derivative) exhibited similar patterns. However, more accentuated differences between the spectra were verified at 675 and 725 nm.

3.2. Principal Component Analysis

The PCA score plots of the first two principal components (PC1 and PC2), considering different MRLs (3.5, 5, and 7 mg CS2 kg−1) for fungicide-contaminated lettuce leaves, are presented in Figure 5. It was possible to verify that two classes were well separated along the first principal component (PC1), indicating that the fungicide-contaminated lettuce spectra carry a discriminant information. The score plots differed according to the MRL used to identify the samples. For the MRL of 3.5 mg CS2 kg−1, 80.8 and 97.7% of the samples were correctly associated as greater (PC1 < 3.0) and smaller (PC1 > 3.0) than the threshold, respectively. When considering the MRL of 5 mg CS2 kg−1, 85.7 and 100% of the samples correctly appeared as greater (PC1 < 2.95) and smaller (PC1 > 2.95) than the MRL, respectively. Finally, considering the MRL of 7 mg CS2 kg−1, 87.5 and 91.8% of the samples were correctly identified as greater (PC1 < 2.95) and smaller (PC1 > 2.95) than the threshold, respectively.

3.3. Classification by PLS-DA

The confusion matrices that represent the classification results after applying the PLS-DA method, considering the correct discrimination percentages, for calibration with cross-validation and external validation are presented in Table 4 for the MRL values of 3.5, 5, and 7 mg CS2 kg−1. When considering the calibration with cross-validation dataset, the kappa coefficients of the PLS-DA models reached 0.939, 0.980, and 0.982 for the MRLs of 3.5, 5, and 7 mg CS2 kg−1, respectively. For external validation data, the kappa coefficients for 3.5 and 7 mg CS2 kg−1 were 0.920, while for 5 mg CS2 kg−1 was 0.975.
The loadings of the first discriminant factor for all MRL values used in this research are presented in Figure 6. Loading patterns were very similar, but the slight differences in the intensities of the characteristic peaks and valleys evidenced that the MRL values affected the resultant PLS-DA model, leading to distinct contributions of each wavelength to the fungicide-contaminated lettuce discrimination.

4. Discussion

During the initial seven days post-spraying, the rates at which the concentration of dithiocarbamate decreased were larger and variable, reaching a reduction of 90.3%. Constant rates of decline (0.3 mg CS2 kg−1) were verified from the seventh to the thirteenth day, corresponding to a reduction of 8.7%. These results are close to those reported by Fantke and Juraske [60], who reported that dissipation half-live of dithiocarbamates range from 3 to 5 days. This finding was based on a review of 811 scientific literature sources, encompassing 4513 dissipation half-lives for 346 pesticides measured in 183 plant species.
The more accentuated differences between the spectra at 675 and 725 nm are probably associated with the greater absorbances of fungicide-contaminated samples in relation to those in the fungicide-free ones (Figure 4). Pre-treating the spectra with the first derivative may have contributed to improve the sensitivity of these wavelengths, eliminating the influence of irrelevant information, as well as improving the detectability of subtle spectral features [61,62]. Yu et al. [63] verified a marked peak around 700 nm when applying the first derivative spectra for detecting pyrethroid pesticide residues on Hami melons.
The PCA is an unsupervised and exploratory procedure, allowing the finding of inherent similarities in data. This statistical multivariate method is useful for separating samples according to their common spectral characteristics, determining a smaller dimension hyperplane on which the points will be projected from the higher dimension [50]. It was also the first step in order to detect patterns when applying the supervised method (PLS-DA). In all score plots, data presented the same scatter pattern and PC values, but they differed regarding which samples were correctly grouped and separated between above or below a MRL value (Figure 5). The separation among the categories can be based on the first principal component, since it accounted for a significant portion of the total data variance (96.5%), confirming that spectral pre-treatments were able to effectively filter out a considerable portion of the signal variability not associated with the class belonging (above or below a specific MRL).
Despite the good results obtained with PCA, using the PLS-DA is advantageous, since it allows an automatic and quantitative discrimination. That is, it comprises a statistical method for determining the most discriminative variables regarding a specific category according to a sample spectral signature, assigning an unknown sample to a predefined class based on its spectrum. For this, PLS-DA is pointed as suitable for datasets with a high degree of inter-correlation between the independent variables [36]. In this study, it improved the discrimination procedure of the fungicide-contaminated lettuces based on pre-established MRL values. Another benefit of applying the PLS-DA method is assuring more reliable and robust models. Lopes and Steidle Neto [44] affirmed that calibration with cross-validation guarantees that the same samples have the probability to be used for training and testing the chemometric models based on equal pre-processing and multivariate techniques. Additionally, the external validation procedure allows for the confirming of the predictive capability of each model from new samples, independent of those used for calibrating purposes.
The best results with PLS-DA models were verified with one discriminant factor for all MRL values used in this research. This was expected, since during PCA, the first PC presented a large contribution in explaining the original data variance (96.5%). According to Berrueta [50], models with fewer discriminant factors tend to be less complex, also presenting a faster processing. The loading profiles showed that all wavelengths contributed towards discriminating the fungicide-contaminated lettuces, considering the MRLs of 3.5, 5, and 7 mg CS2 kg−1. However, the sharpest and most consistent peak was observed between 550 and 700 nm, showing a clear difference between the CS2 concentrations in the lettuce leaves. The NIR wavelengths of 750, 790, 840, and 900 nm were also relevant (Figure 6). Specifically, a well-defined valley was observed at 675 nm, consistent with the pre-treated spectra of the studied lettuces (Figure 4) and confirming the sensitivity of this wavelength to carry valuable information about the samples. Wavelengths from 500 to 700 nm are generally associated with lettuce pigment contents (chlorophyll, carotenoid, and anthocyanin) [64], which tend to decrease after Mancozeb spraying, mainly due to oxidative damage [65]. It is important to emphasise that in addition to lettuces being rich in chlorophyll and carotenoids, they also present high anthocyanin concentrations, especially when cultivated in greenhouses [30]. Many NIR wavelengths are also useful for lettuce pigment predictions [64]. Additionally, the NIR wavelengths, especially in the region around 900 nm, tend to be associated with higher absorbances in samples contaminated with fungicide compared to those without fungicide [61].
In this study, both for calibration with cross-validation and external validation procedures, the misclassification rates decreased as compared to the PCA. However, the classification patterns were maintained, with the developed model performing better and reaching 100% of correct discriminations for samples with Mancozeb residues below the limit of 5 mg CS2 kg−1 for both calibration with cross-validation and external validation. When considering the limits of 3.5 and 7 mg CS2 kg−1, the last one performed better for calibration with cross-validation, but both were close when evaluating the external validation results.
The kappa coefficients found in this research confirm the excellent performance of the three proposed models and agree with the classification patterns discussed above. Following interpretation proposed by McHugh [57] and Pérez-Rodríguez et al. [66], the kappa coefficients obtained in this work were within the data reliability range of 82 to 100%, indicating an almost perfect agreement of the classifiers.
The suitable performance of PLS-DA for discriminating the fungicide-contaminated lettuces is probably because this method combines the virtues of other supervised algorithms with noise reduction and variable selection advantages of traditional PLS regression. Other studies also recommended the PLS-DA for classification purposes. For instance, Borràs et al. [67] combined this procedure with near-infrared spectroscopy for discriminating sweet and bitter almonds by measurements of the kernel surfaces without any sample pre-treatment. Manfredi et al. [68] affirmed that PLS-DA was more accurate when discriminating raw hazelnuts from different origins and cultivars based on infrared spectrometry. Steidle Neto et al. [36] confirmed the potential of PLS-DA to be utilised as a basis for the development of automatic sorting systems of sugarcane varieties.
Our results showed that data pre-treatment also affected the discrimination results. Often, spectral signatures do not visibly differ among themselves, containing undesirable components (noises), which can reduce the computing efficiency of the proposed models [44]. Spectral pre-treatments can help to remove unnecessary information, which cannot be properly processed by the chemometric methods, enhancing spectral differences between classes. However, the excessive pre-treatment or the inadequate use of these techniques can lead to loss of spectral information that can be useful for the discriminations [45]. Centring improved the classification accuracy, improving the differences between spectra. The normalisation adjusted the spectral data from the different groups (MRLs) to an identical baseline, facilitating subsequent spectral analysis and comparisons in the discrimination procedure [46]. Spectra first derivative corrected both additive and multiplicative effects, removing baseline shifts and minimising overlapped peaks of spectra.
Our findings suggest that combining spectral reflectance (Vis/NIR) with PCA and PLS-DA enables the differentiation of fungicide-contaminated lettuce. Nevertheless, it is essential to perform spectral measurements using a high-resolution spectrometer, after allowing sufficient time for the light source to warm-up. Established methods in scientific literature outline that dithiocarbamate residues in agricultural crops can be quantified accurately, typically utilising gas or liquid chromatography, often coupled to mass spectrometry [11]. These conventional methods are both time-consuming and labour-intensive, demanding sample preparation (often destructive), skilled personnel, and costly process chemistry. While highly sensitive, these techniques are better suited for spot checks.

5. Directions for Practical Applications and Further Research

This technique can be used in industrial food processing or directly in the field for fast quality control purposes and/or discrimination of head lettuces that are not easy to reach with conventional methods. Additionally, it is important to reduce irregularities and enhance the inspection of agricultural crops by government agencies of different countries. The implementation of this innovative approach can also reduce costs associated with equipment, electrical energy, and chemical analyses.
The proposed methodology should be adapted to other MRLs, pesticides, and agricultural products, namely, lettuce and other vegetables, with large economic potential in future studies. Additional research may also focus on expanding the dataset to account for distinct lettuce growth cycles during different seasons of the year, as well as developing models based on ultraviolet and mid-infrared wavelengths.

6. Conclusions

The success of the proposed method depends on standardised measurements with precise placement of the probe on the sample, as well as correct spectrometer calibration. The results obtained can also be improved, minimising or eliminating the observed discrimination errors by using high-sensitivity equipment and evaluating the thermal influence on measurements. The findings of this study showed that the spectral reflectance over the visible (Vis) and near-infrared (NIR) regions combined with principal component analysis (PCA) and partial least squares discriminant analysis (PLS-DA) is a promising tool for non-destructive and fast discrimination of fungicide-contaminated lettuces, considering three maximum residue limits (MRLs) [3.5, 5, and 7 mg CS2 kg−1]. Without the objective of accurate quantitation, the discrimination method evaluated in this research has potential to improve the lettuce traceability by allowing real-time decision making and assuring healthy food for human consumption.

Author Contributions

Conceptualisation, A.J.S.N. and D.d.C.L.; methodology, A.J.S.N., D.d.C.L., T.G.F.d.S. and A.M.d.R.F.J.; software, A.J.S.N. and D.d.C.L.; validation, A.J.S.N., D.d.C.L. and J.L.M.P.d.L.; formal analysis, A.J.S.N., T.G.F.d.S., D.d.C.L., A.M.d.R.F.J. and J.L.M.P.d.L.; investigation, A.J.S.N. and D.d.C.L.; resources, A.J.S.N., D.d.C.L., A.M.d.R.F.J. and J.L.M.P.d.L.; data curation, A.J.S.N., T.G.F.d.S. and D.d.C.L.; writing—original draft preparation, A.J.S.N. and D.d.C.L.; writing—review and editing, A.J.S.N., D.d.C.L., T.G.F.d.S., A.M.d.R.F.J. and J.L.M.P.d.L.; visualisation, A.J.S.N., T.G.F.d.S., D.d.C.L. and A.M.d.R.F.J.; supervision, A.J.S.N., D.d.C.L. and J.L.M.P.d.L.; project administration, A.J.S.N. and D.d.C.L.; funding acquisition, A.J.S.N. and J.L.M.P.d.L. All authors have read and agreed to the published version of the manuscript.

Funding

This work was supported by the Foundation for Research Support of the Minas Gerais State (FAPEMIG) under grants CAG-APQ-01495-15 and PPM-00412-18.

Data Availability Statement

The data presented in this study are available on request from the corresponding author.

Acknowledgments

We are grateful to the Foundation for Research Support of the Minas Gerais State (FAPEMIG), and the Portuguese funding agency, FCT—Fundação para a Ciência e a Tecnologia, I.P., under the projects UIDB/04292/2020, UIDP/04292/2020, granted to the Marine and Environmental Sciences Centre—MARE, and LA/P/0069/2020, granted to the Associate Laboratory ARNET. A.M.d.R.F.J. thanks the São Paulo Research Foundation—FAPESP (grant number 2023/05323-4) for the research fellowship. We also appreciate the insightful and constructive comments from the three anonymous reviewers, which significantly improved our manuscript.

Conflicts of Interest

The authors declare no conflicts of interest.

References

  1. Yazdi, M.; Kolahi, M.; Mohajel Kazemi, E.; Goldson Barnaby, A. Study of the Contamination Rate and Change in Growth Features of Lettuce (Lactuca sativa Linn.) in Response to Cadmium and a Survey of Its Phytochelatin Synthase Gene. Ecotoxicol. Environ. Saf. 2019, 180, 295–308. [Google Scholar] [CrossRef] [PubMed]
  2. Dehelean, A.; Magdas, D.A.; Feher, I.; Puscas, R.H.; Hategan, A.R.; Mirel, V.; Mirel, S.; Crivii, C. Characterization of the Maximal Nutritional Value of Lactuca sativa (Lettuce) Based upon Elemental Analysis. Anal. Lett. 2023, 56, 331–343. [Google Scholar] [CrossRef]
  3. López-Fernández, O.; Rial-Otero, R.; Simal-Gándara, J. Factors Governing the Removal of Mancozeb Residues from Lettuces with Washing Solutions. Food Control 2013, 34, 530–538. [Google Scholar] [CrossRef]
  4. Choubbane, H.; Ouakhssase, A.; Chahid, A.; Taourirte, M.; Aamouche, A. Pesticides in Fruits and Vegetables from the Souss Massa Region, Morocco. Food Addit. Contam. Part B 2022, 15, 79–88. [Google Scholar] [CrossRef] [PubMed]
  5. Li, J.; Chen, W.; Deng, K.; Liu, S.; Li, B.; Li, Y. Monitoring and Dietary Exposure Assessment of Pesticide Residues in Strawberry in Beijing, China. Food Addit. Contam. Part B 2022, 15, 98–105. [Google Scholar] [CrossRef] [PubMed]
  6. Gaouar, Z.L.; Chefirat, B.; Saadi, R.; Djelad, S.; Rezk-Kallah, H. Pesticide Residues in Tomato Crops in Western Algeria. Food Addit. Contam. Part B 2021, 14, 281–286. [Google Scholar] [CrossRef] [PubMed]
  7. Elgueta, S.; Fuentes, M.; Valenzuela, M.; Zhao, G.; Liu, S.; Lu, H.; Correa, A. Pesticide Residues in Ready-to-Eat Leafy Vegetables from Markets of Santiago, Chile, and Consumer’s Risk. Food Addit. Contam. Part B 2019, 12, 259–267. [Google Scholar] [CrossRef] [PubMed]
  8. Jafari, A.; Shoeibi, S.; Amini, M.; Amirahmadi, M.; Rastegar, H.; Ghaffarian, A.; Ghazi-Khansari, M. Monitoring Dithiocarbamate Fungicide Residues in Greenhouse and Non-Greenhouse Tomatoes in Iran by HPLC-UV. Food Addit. Contam. Part B 2012, 5, 87–92. [Google Scholar] [CrossRef] [PubMed]
  9. De Andrade, J.C.; Galvan, D.; Kato, L.S.; Conte-Junior, C.A. Consumption of Fruits and Vegetables Contaminated with Pesticide Residues in Brazil: A Systematic Review with Health Risk Assessment. Chemosphere 2023, 322, 138244. [Google Scholar] [CrossRef]
  10. Soylak, M.; Ozalp, O.; Uzcan, F. Determination of Trace Ziram in Food by Magnesium Hydroxide Coprecipitation with Indirect Detection by Flame Atomic Absorption Spectrometry (FAAS). Anal. Lett. 2023, 56, 1525–1534. [Google Scholar] [CrossRef]
  11. Crnogorac, G.; Schwack, W. Residue Analysis of Dithiocarbamate Fungicides. Trends Anal. Chem. 2009, 28, 40–50. [Google Scholar] [CrossRef]
  12. Pereira, S.I.; Figueiredo, P.I.; Barros, A.S.; Dias, M.C.; Santos, C.; Duarte, I.F.; Gil, A.M. Changes in the Metabolome of Lettuce Leaves Due to Exposure to Mancozeb Pesticide. Food Chem. 2014, 154, 291–298. [Google Scholar] [CrossRef] [PubMed]
  13. Belpoggi, F.; Soffritti, M.; Guarino, M.; Lambertini, L.; Cevolani, D.; Maltoni, C. Results of Long-Term Experimental Studies on the Carcinogenicity of Ethylene-Bis-Dithiocarbamate (Mancozeb) in Rats. Ann. N. Y. Acad. Sci. 2002, 982, 123–136. [Google Scholar] [CrossRef] [PubMed]
  14. JMPR Joint Meeting on Pesticide Residues—FAO/WHO—Mancozeb. Available online: https://www.fao.org/fileadmin/templates/agphome/documents/Pests_Pesticides/JMPR/Evaluation93/mancoz.pdf (accessed on 1 June 2024).
  15. PMRA Pest Management Regulatory Agency—Proposed Maximum Residue Limit PMRL2018-27, Ethylene Bis-Dithiocarbamate (EBDC) Fungicides: Mancozeb, Metiram, Maneb and Zineb. Available online: https://www.canada.ca/content/dam/hc-sc/documents/services/consumer-product-safety/pesticides-pest-management/public/consultations/proposed-maximum-residue-limit/2018/ethylene_bis_dithiocarbamate/PMRL2018-27-eng.pdf (accessed on 1 June 2024).
  16. JMPR Joint Meeting on Pesticide Residues—FAO/WHO—Pesticides Database: Dithiocarbamates. Available online: https://www.fao.org/fao-who-codexalimentarius/codex-texts/dbs/pestres/pesticide-detail/en/?p_id=105 (accessed on 1 June 2024).
  17. HSE Health & Safety Executive—The Great Britain MRL Statutory Register. Available online: https://secure.pesticides.gov.uk/MRLs/search (accessed on 1 June 2024).
  18. MARD Ministry of Agriculture and Rural Development—Pesticide Residues Databases. Available online: https://data.gov.il/dataset/mrl/resource/3ee1cd66-6176-4c1f-8d38-8f36a1461426 (accessed on 1 June 2024).
  19. APVMA Federal Register of Legislation—Australia New Zealand Food Standards Code—Schedule 20—Maximum Residue Limits. Available online: https://www.legislation.gov.au/F2015L00468/2023-02-21/text (accessed on 31 May 2024).
  20. MPI Ministry for Primary Industries—Maximum Residue Levels for Agricultural Compounds. Available online: https://www.mpi.govt.nz/agriculture/agricultural-compounds-vet-medicines/maximum-residue-levels-agricultural-compounds/ (accessed on 1 June 2024).
  21. JFCRF Japan Food Chemical Research Foundation—Table of MRLs for Agricultural Chemicals: Dithiocarbamates. Available online: http://db.ffcr.or.jp/front/ (accessed on 1 June 2024).
  22. CFS Centre for Food Safety—Hong Kong Pesticide MRL Database. Pesticide Residues in Food Regulation (Cap. 132CM). Available online: https://www.cfs.gov.hk/english/mrl/index.php (accessed on 1 June 2024).
  23. EPA Environmental Protection Agency—Mancozeb, Maneb, Metiram, and Thiram; Tolerance Actions. Available online: https://www.federalregister.gov/documents/2014/05/14/2014-10955/mancozeb-maneb-metiram-and-thiram-tolerance-actions (accessed on 1 June 2024).
  24. MFDS Ministry of Food and Drug Safety—Pesticides and Veterinary Drugs Information. Available online: http://www.foodsafetykorea.go.kr/residue/prd/mrls/list.do?menuKey=1&subMenuKey=161 (accessed on 1 June 2024).
  25. Veiga-del-Baño, J.M.; Martínez-López, S.; Pérez-Lucas, G.; Cuenca-Martínez, J.J.; Andreo-Martínez, P. Trends in Dithiocarbamates Food Research: A Bibliometric Vision. Chemosphere 2023, 313, 137342. [Google Scholar] [CrossRef] [PubMed]
  26. EFSA. The 2010 European Union Report on Pesticide Residues in Food. EFSA J. 2013, 11, 3130. [Google Scholar] [CrossRef]
  27. OJEU Official Journal of the European Union—Commission Implementing Regulation (EU) 2020/2087. Document 32020R2087. Available online: https://eur-lex.europa.eu/eli/reg_impl/2020/2087/oj (accessed on 1 June 2024).
  28. Al-Nidawi, M.; Özalp, Ö.; Alshana, U.; Soylak, M. Cloud Point Microextraction Prior to Flame-Atomic Absorption Spectrometry for the Determination of Zinc Ethylene-1,2-Bisdithiocarbamate (Zineb) in Food and Environmental Samples. Anal. Lett. 2024, 57, 1313–1324. [Google Scholar] [CrossRef]
  29. Pu, H.; Xie, A.; Sun, D.W.; Kamruzzaman, M.; Ma, J. Application of Wavelet Analysis to Spectral Data for Categorization of Lamb Muscles. Food Bioprocess Technol. 2015, 8, 1–16. [Google Scholar] [CrossRef]
  30. Moura, L.d.O.; Lopes, D.C.; Steidle Neto, A.J.; de Castro Louback Ferraz, L.; de Almeida Carlos, L.; Martins, L.M. Evaluation of Techniques for Automatic Classification of Lettuce Based on Spectral Reflectance. Food Anal. Methods 2016, 9, 1799–1806. [Google Scholar] [CrossRef]
  31. Gonzálvez, A.; Garrigues, S.; Armenta, S.; de la Guardia, M. Determination at Low Ppm Levels of Dithiocarbamate Residues in Foodstuff by Vapour Phase-Liquid Phase Microextraction-Infrared Spectroscopy. Anal. Chim. Acta 2011, 688, 191–196. [Google Scholar] [CrossRef]
  32. Wang, L.; Liu, D.; Pu, H.; Sun, D.W.; Gao, W.; Xiong, Z. Use of Hyperspectral Imaging to Discriminate the Variety and Quality of Rice. Food Anal. Methods 2015, 8, 515–523. [Google Scholar] [CrossRef]
  33. Aouidi, F.; Dupuy, N.; Artaud, J.; Roussos, S.; Msallem, M.; Perraud-Gaime, I.; Hamdi, M. Discrimination of Five Tunisian Cultivars by Mid InfraRed Spectroscopy Combined with Chemometric Analyses of Olive Olea Europaea Leaves. Food Chem. 2012, 131, 360–366. [Google Scholar] [CrossRef]
  34. Diago, M.P.; Fernandes, A.M.; Millan, B.; Tardaguila, J.; Melo-Pinto, P. Identification of Grapevine Varieties Using Leaf Spectroscopy and Partial Least Squares. Comput. Electron. Agric. 2013, 99, 7–13. [Google Scholar] [CrossRef]
  35. Garrett, R.; Schmidt, E.M.; Pereira, L.F.P.; Kitzberger, C.S.G.; Scholz, M.B.S.; Eberlin, M.N.; Rezende, C.M. Discrimination of Arabica Coffee Cultivars by Electrospray Ionization Fourier Transform Ion Cyclotron Resonance Mass Spectrometry and Chemometrics. LWT—Food Sci. Technol. 2013, 50, 496–502. [Google Scholar] [CrossRef]
  36. Steidle Neto, A.J.; Lopes, D.C.; Toledo, J.V.; Zolnier, S.; Silva, T.G.F. Classification of Sugarcane Varieties Using Visible/near Infrared Spectral Reflectance of Stalks and Multivariate Methods. J. Agric. Sci. 2018, 156, 537–546. [Google Scholar] [CrossRef]
  37. Simko, I.; Jimenez-Berni, J.A.; Furbank, R.T. Detection of Decay in Fresh-Cut Lettuce Using Hyperspectral Imaging and Chlorophyll Fluorescence Imaging. Postharvest Biol. Technol. 2015, 106, 44–52. [Google Scholar] [CrossRef]
  38. Diezma, B.; Lleó, L.; Roger, J.M.; Herrero-Langreo, A.; Lunadei, L.; Ruiz-Altisent, M. Examination of the Quality of Spinach Leaves Using Hyperspectral Imaging. Postharvest Biol. Technol. 2013, 85, 8–17. [Google Scholar] [CrossRef]
  39. Huang, W.; Li, J.; Wang, Q.; Chen, L. Development of a Multispectral Imaging System for Online Detection of Bruises on Apples. J. Food Eng. 2015, 146, 62–71. [Google Scholar] [CrossRef]
  40. Alvares, C.A.; Stape, J.L.; Sentelhas, P.C.; Gonçalves, J.L.d.M.; Sparovek, G. Köppen’s Climate Classification Map for Brazil. Meteorol. Zeitschrift 2013, 22, 711–728. [Google Scholar] [CrossRef] [PubMed]
  41. Cullen, T.E. Spectrophotometric Determination of Dithiocarbamate Residues on Food Crops. Anal. Chem. 1964, 36, 221–224. [Google Scholar] [CrossRef]
  42. Keppel, G.E. Collaborative Study of the Determination of the Dithiocarbamate Residues by a Modified Carbon Disulfide Evolution Method. J. Assoc. Off. Anal. Chem. 1971, 54, 528–532. [Google Scholar] [CrossRef]
  43. Caldas, E.D.; Miranda, M.C.C.; Conceição, M.H.; De Souza, L.C.K.R. Dithiocarbamates Residues in Brazilian Food and the Potential Risk for Consumers. Food Chem. Toxicol. 2004, 42, 1877–1883. [Google Scholar] [CrossRef] [PubMed]
  44. Lopes, D.C.; Steidle Neto, A.J. Classification and Authentication of Plants by Chemometric Analysis of Spectral Data. Compr. Anal. Chem. 2018, 80, 105–125. [Google Scholar]
  45. Moscetti, R.; Haff, R.P.; Stella, E.; Contini, M.; Monarca, D.; Cecchini, M.; Massantini, R. Feasibility of NIR Spectroscopy to Detect Olive Fruit Infested by Bactrocera Oleae. Postharvest Biol. Technol. 2015, 99, 58–62. [Google Scholar] [CrossRef]
  46. Yuan, L.; Huang, Y.; Loraamm, R.W.; Nie, C.; Wang, J.; Zhang, J. Spectral Analysis of Winter Wheat Leaves for Detection and Differentiation of Diseases and Insects. F. Crop. Res. 2014, 156, 199–207. [Google Scholar] [CrossRef]
  47. Martens, H.; Næs, T. Multivariate Calibration; John Wiley & Sons: Hoboken, NJ, USA, 1992; Volume 1, ISBN 0471930474. [Google Scholar]
  48. Savitzky, A.; Golay, M.J.E. Smoothing and Differentiation of Data by Simplified Least Squares Procedures. Anal. Chem. 1964, 36, 1627–1639. [Google Scholar] [CrossRef]
  49. Wang, L.; Mizaikoff, B. Application of Multivariate Data-Analysis Techniques to Biomedical Diagnostics Based on Mid-Infrared Spectroscopy. Anal. Bioanal. Chem. 2008, 391, 1641–1654. [Google Scholar] [CrossRef]
  50. Berrueta, L.A.; Alonso-Salces, R.M.; Héberger, K. Supervised Pattern Recognition in Food Analysis. J. Chromatogr. A 2007, 1158, 196–214. [Google Scholar] [CrossRef] [PubMed]
  51. Saporta, G. Probabilités, Analyse Des Données et Statistique, 3rd ed.; TECHNIP: Paris, France, 2011; ISBN 978-2710809807. [Google Scholar]
  52. Westad, F.; Marini, F. Validation of Chemometric Models—A Tutorial. Anal. Chim. Acta 2015, 893, 14–24. [Google Scholar] [CrossRef] [PubMed]
  53. Huang, H.; Yu, H.; Xu, H.; Ying, Y. Near Infrared Spectroscopy for on/in-Line Monitoring of Quality in Foods and Beverages: A Review. J. Food Eng. 2008, 87, 303–313. [Google Scholar] [CrossRef]
  54. Agelet, L.E.; Hurburgh, C.R. Limitations and Current Applications of Near Infrared Spectroscopy for Single Seed Analysis. Talanta 2014, 121, 288–299. [Google Scholar] [CrossRef]
  55. Devaux, M.F.; Bertrand, D.; Robert, P.; Qannari, M. Application of Multidimensional Analyses to the Extraction of Discriminant Spectral Patterns from NIR Spectra. Appl. Spectrosc. 1988, 42, 1015–1019. [Google Scholar] [CrossRef]
  56. Congalton, R.G. A Review of Assessing the Accuracy of Classifications of Remotely Sensed Data. Remote Sens. Environ. 1991, 37, 35–46. [Google Scholar] [CrossRef]
  57. McHugh, M.L. Interrater Reliability: The Kappa Statistic. Biochem. Medica 2012, 22, 276–282. [Google Scholar] [CrossRef]
  58. Salkind, N.J. Encyclopedia of Measurement and Statistics, 1st ed.; Salkind, N.J., Ed.; SAGE Publications: Newcastle upon Tyne, UK, 2007; ISBN 1412916119. [Google Scholar]
  59. Gold, K.M.; Townsend, P.A.; Herrmann, I.; Gevens, A.J. Investigating Potato Late Blight Physiological Differences across Potato Cultivars with Spectroscopy and Machine Learning. Plant Sci. 2020, 295, 110316. [Google Scholar] [CrossRef] [PubMed]
  60. Fantke, P.; Juraske, R. Variability of Pesticide Dissipation Half-Lives in Plants. Environ. Sci. Technol. 2013, 47, 3548–3562. [Google Scholar] [CrossRef] [PubMed]
  61. Jamshidi, B.; Mohajerani, E.; Jamshidi, J.; Minaei, S.; Sharifi, A. Non-Destructive Detection of Pesticide Residues in Cucumber Using Visible/near-Infrared Spectroscopy. Food Addit. Contam. Part A 2015, 32, 857–863. [Google Scholar] [CrossRef]
  62. Rojas, F.S.; Ojeda, C.B. Recent Development in Derivative Ultraviolet/Visible Absorption Spectrophotometry: 2004–2008: A Review. Anal. Chim. Acta 2009, 635, 22–44. [Google Scholar] [CrossRef]
  63. Yu, G.; Li, H.; Li, Y.; Hu, Y.; Wang, G.; Ma, B.; Wang, H. Multiscale Deepspectra Network: Detection of Pyrethroid Pesticide Residues on the Hami Melon. Foods 2023, 12, 1742. [Google Scholar] [CrossRef]
  64. Steidle Neto, A.J.; Moura, L.d.O.; Lopes, D.C.; Carlos, L.A.; Martins, L.M.; De Castro Louback Ferraz, L. Non-Destructive Prediction of Pigment Content in Lettuce Based on Visible–NIR Spectroscopy. J. Sci. Food Agric. 2017, 97, 2015–2022. [Google Scholar] [CrossRef]
  65. Dias, M.C.; Figueiredo, P.; Duarte, I.F.; Gil, A.M.; Santos, C. Different Responses of Young and Expanded Lettuce Leaves to Fungicide Mancozeb: Chlorophyll Fluorescence, Lipid Peroxidation, Pigments and Proline Content. Photosynthetica 2014, 52, 148–151. [Google Scholar] [CrossRef]
  66. Pérez-Rodríguez, M.; Gaiad, J.E.; Hidalgo, M.J.; Avanza, M.V.; Pellerano, R.G. Classification of Cowpea Beans Using Multielemental Fingerprinting Combined with Supervised Learning. Food Control 2019, 95, 232–241. [Google Scholar] [CrossRef]
  67. Borràs, E.; Amigo, J.M.; Van Den Berg, F.; Boqué, R.; Busto, O. Fast and Robust Discrimination of Almonds (Prunus Amygdalus) with Respect to Their Bitterness by Using near Infrared and Partial Least Squares-Discriminant Analysis. Food Chem. 2014, 153, 15–19. [Google Scholar] [CrossRef] [PubMed]
  68. Manfredi, M.; Robotti, E.; Quasso, F.; Mazzucco, E.; Calabrese, G.; Marengo, E. Fast Classification of Hazelnut Cultivars through Portable Infrared Spectroscopy and Chemometrics. Spectrochim. Acta—Part A Mol. Biomol. Spectrosc. 2018, 189, 427–435. [Google Scholar] [CrossRef] [PubMed]
Figure 1. Location of the study areas in the Minas Gerais State, Brazil: greenhouse lettuce production in Capim Branco and lettuce measurements (spectral and analytical) in Sete Lagoas.
Horticulturae 10 00828 g001
Figure 2. Diagram schematic of the experimental design with details of the conduction phases (seeding to spectral measurements). DAS—days after sowing.
Horticulturae 10 00828 g002
Figure 3. Hand-held spectrometer coupled to a clip probe for measuring spectral reflectance of the lettuce leaves.
Horticulturae 10 00828 g003
Figure 4. Average spectral reflectance of the intact lettuce fungicide-contaminated and fungicide-free leaves after pre-treatments (centring, standard normal variate, and first derivative).
Horticulturae 10 00828 g004
Figure 5. Score plot of the first two principal components of PCA considering the spectral signatures of the fungicide-contaminated lettuces and considering three MRL values (3.5, 5, and 7 mg CS2 kg−1).
Horticulturae 10 00828 g005
Figure 6. Loadings of the discrimination models for the fungicide-contaminated lettuces, considering three MRL values (3.5, 5, and 7 mg CS2 kg−1).
Horticulturae 10 00828 g006
Table 1. Maximum residue limits (MRLs) for the dithiocarbamate (including Mancozeb) concentration in lettuce, established by government agencies of several countries or organisations.
Country/OrganisationCrop MRLs (mg CS2 kg−1)Reference
CanadaLettuce0.1[15]
Codex Alimentarius (FAO/WHO)Lettuce (head)0.5[16]
Great BritainLettuce5.0[17]
IsraelLettuce5.0[18]
AustraliaLeafy vegetables5.0[19]
New ZealandVegetables7.0[20]
JapanLettuce (leaf)10.0[21]
Hong KongLettuce (head/leaf)0.5/18.0[22]
United States of AmericaLettuce (head/leaf)3.5/18.0[23]
South KoreaLettuce (head/leaf)20.0/10.0[24]
Maximum residue limits obtained at the access dates specified in the reference section. Carbon disulphide (CS2).
Table 2. Specifications and operational parameters for portable spectrometer JAZ-EL350, light source, and battery.
Detector: 2048-element linear silicon CCD array sensorSignal-to-noise ratio: 250:1 (full signal)
Wavelength range (grating): 400–1000 nmDisplay: organic light-emitting diode (128 × 64 pixels)
Optical resolution: 1.3 nm (full width at half maximum)Light source (range): 360–1100 nm (tungsten-halogen)
Integration time: 870 μs to 65 sLight source (lifetime): 500–10,000 h
Entrance aperture: 25 μm width slitBattery: rechargeable lithium-ion
Fiber optic connector: type SMA 905Data storage: SD card (2 GB capacity)
Information obtained from Ocean Optics catalogues.
Table 3. Dithiocarbamate concentration and standard error values, obtained from reference measurements, on head lettuces at 7 intervals (from 1 to 13 days) after fungicide (Mancozeb) spraying.
Time
(days)
Dithiocarbamate
(mg CS2 kg−1)
Standard Error
(mg CS2 kg−1)
110.3±1.70
35.6±1.11
52.4±0.87
71.0±0.50
90.7±0.23
110.4±0.17
130.1±0.08
Table 4. Confusion matrices resulting from PLS-DA for the calibration with cross-validation and external validation, considering the maximum residue limits (MRLs) of 3.5, 5, and 7 mg CS2 kg−1.
Calibration with Cross-ValidationExternal Validation
3.5 mg CS2 kg−1
>3.5≤3.5 >3.5≤3.5
>3.597.73%3.85%>3.597.47%5.47%
≤3.52.27%96.15%≤3.52.53%94.53%
5.0 mg CS2 kg−1
>5.0≤5.0 >5.0≤5.0
>5.097.96%0.00%>5.097.51%0.00%
≤5.02.04%100.00%≤5.02.49%100.00%
7.0 mg CS2 kg−1
>7.0≤7.0 >7.0≤7.0
>7.098.15%0.00%>7.096.99%5.03%
≤7.01.85%100.00%≤7.03.01%94.97%
Disclaimer/Publisher’s Note: The statements, opinions and data contained in all publications are solely those of the individual author(s) and contributor(s) and not of MDPI and/or the editor(s). MDPI and/or the editor(s) disclaim responsibility for any injury to people or property resulting from any ideas, methods, instructions or products referred to in the content.

