Article

RNA Sequencing Reveals Transcription Factors and Genes in Phenylpropanoid Biosynthesis That Positively Regulate Size and Weight of Oak Tree Seeds

1
Department of Forest Bioresources, National Institute of Forest Science, Suwon 16631, Republic of Korea
2
3BIGS Company Limited, Hwaseong 18469, Republic of Korea
*
Author to whom correspondence should be addressed.
Horticulturae 2024, 10(8), 829; https://doi.org/10.3390/horticulturae10080829 (registering DOI)
Submission received: 2 July 2024 / Revised: 30 July 2024 / Accepted: 2 August 2024 / Published: 5 August 2024
(This article belongs to the Section Genetics, Genomics, Breeding, and Biotechnology (G2B2))

Abstract

:
Acorn size is of great importance, both ecologically and economically. However, the long lifespan is an obstacle to improvement in breeding. Keumsura1ho is a recently bred cultivar of oak (Quercus acutissima Carruth) selected after eight years of selection due to its larger acorns and higher weight compared to the control. In the present study, we investigated the transcriptional mechanisms underlying the outstanding morphological characteristics of Keumsura1ho. For this purpose, one- and two-year-old acorns from the control and Keumsura1ho groups were used for comparative transcriptome analyses of their seeds. Among morphological characteristics, the Keumsura1ho seeds were 18.3% longer than those of the control. Seed width and depth were 33.9% greater than those of the control. In the transcriptome analysis, genes related to seed size were further enriched, with biennial Keumsura1ho showing higher enrichment in comparison to control genes. Kyoto Encyclopedia of Genes and Genomes (KEGG) analysis revealed that the upregulated genes of the two-year-old Keumsura1ho seeds showed higher enrichment in phenylpropanoid metabolism compared to the control, with OMT1 and PRXs exhibiting high expression levels. This pathway has a significant impact on seed coat lignification and size in Keumsura1ho. The results of this study will benefit the development of breeding techniques by identifying marker genes for seed size.

1. Introduction

The acorn fruit of oak (Quercus L.) is crucial for wild species populations and forest regeneration [1]. More than 700,000 years ago, it was used in various parts of the world for local nutrition and as a folk remedy [2,3,4]. Acorns are rich in vitamins, sterols, minerals, lipids, and carbohydrates [5]. Most of the dry weight of an acorn consists of carbohydrates, with 55% of these carbohydrates being starch [6]. In addition, acorns contain a variety of biologically active substances, such as flavonoids and tannins, which are associated with antibacterial, anti-aging, anti-cancer, and anti-degenerative properties [7]. Therefore, acorns have become popular as functional food ingredients in products such as bread, cakes, drinks, and cookies [8].
In the life cycle of plants, seed size has been extensively studied because it affects seed dispersal, seed survival, and seedling establishment. Oaks (Quercus spp.) are the dominant species in forests and agroforestry systems throughout large areas of temperate, subtropical, and Mediterranean regions and propagate through direct seeding. Numerous studies have reported the use of acorn size and weight as a predictor for seeding growth and germination rate. Large acorn seeds are assumed to be extremely germinative and have large reserves of nutrients and energy, which can be quickly released to form competitive and robust seedlings [9,10]. Large acorns exhibit both positive and negative effects on the germination process. The negative aspect is that large acorns may be carried by animal predators and subjected to severe damage of cotyledons [11]. Previous studies have shown that larger acorns are more resistant to insect damage than smaller acorns [12]. In addition, acorn seed size varies considerably among different oak species (Quercus), individual trees, age classes, clones, and geographic features of southern Appalachian oak acorn production, which is an easy way to estimate crop size within a year [13]. To achieve high productivity and survival rates, clonal selection techniques are crucial for wildlife plant species with significant phenotypic variability [14]. Numerous studies have reported the use of acorn size and weight as predictors of seedling growth and germination rates; however, not much is known about the genetics of these traits. This limited information necessitates a more comprehensive genetic analysis to effectively leverage these traits in a breeding program.
Keumsura1ho is an oak (Quercus acutissima Carruth.) cultivar developed through a selection process aimed at producing large seeds [15]. The length and weight of the Keumsura1ho acorn were 22.8 mm and 6.7 g, respectively, representing a 9% and 63% increase compared to the control (20.9 mm and 4.1 g, respectively). The seed production per tree of Keumsura1ho was 1.96 kg/tree, which was also 2.3 times higher than that of the control (0.82 kg/tree). For this breeding program, 59 candidate trees were identified as superior based on their large seed size, productivity, biotic tolerance, and growth during the first selection process. The 59 superior trees were propagated by grafting and planted between 1998 and 1999. Over a span of three years, from 2003, when seeds were first produced, various parameters, including seed weight, seed size (length and width), width of each head position, leaf characteristics (shape, length, width, size, petiole), and flowering traits (female and male flowers), were meticulously examined. Five outstanding clones were selected in 2005. Starting in 2006, one clone (Yeongam 1ho) was identified as a superior cultivar by examining its differentiation and stability characteristics. Subsequently, an application for the right to protect the cultivar was filed in 2011 under the name ’Keumsura1ho’.
p-Hydroxycinnamyl alcohol, a monolignol, and related chemicals undergo oxidative coupling to form lignin, which is an aromatic biopolymer. One essential biological trait that early terrestrial plants acquired for land colonization was the lignification or deposition of lignin in apoplastic cell wall domains. Lignin, which is embedded with polysaccharides and provides cells with the necessary mechanical properties for water transport and structural support, is especially important for maintaining the integrity of the thick secondary cell walls produced in xylem vascular tissues, such as tracheids, vessels, and fibers. Furthermore, plants perform lignification in other specialized cell types in response to pathogen attacks, as well as in seedcoats, endodermal cells, linings of anther lumens, and secession cells for organ removal [16].
Vascular plants possess a special capacity to reroute significant amounts of carbon from the metabolism of aromatic amino acids to the production of compounds with a phenylpropane skeleton. Phenylpropanoids, including lignin, flavonoids, coumarins, and several small phenolic molecules, serve a variety of purposes in signaling, defense, color pigments, and structural support. Phenylpropanoid compounds are linked to a variety of plant traits related to agriculture and forestry. Lignin is an aromatic heteropolymer synthesized via complex phenylpropanoid metabolism. The production of secondary metabolites is aided by the phenylpropanoid pathway genes such as chalcone synthase, chalcone isomerase, flavanone 3-hydroxylase, flavonoid 3′-hydroxylase, and flavonol synthase1. In contrast, the production of colored anthocyanidins is facilitated by dihydroflavonol 4-reductase and leucoanthocyanidin dioxygenase. Higher lignin accumulation has been observed in comparison to the control due to lignin pathway genes (hydroxycinnamoyl transferase, caffeoyl-CoA O-methyl transferase, cinnamoyl alcohol dehydrogenase, cinnamoyl-CoA reductase, secondary wall-associated NAC domain protein1, MYB58, and MYB63) [17].
This study aimed to identify the transcriptional mechanisms underlying the superior morphological features of Keumsura1ho. To achieve this, comparative transcriptome analysis of seeds, at different time points, were performed using one- and two-year-old acorns from Keumsura1ho and control plants. These results will aid the development of breeding and selection strategies by improving our understanding of the mechanisms that determine seed size and the marker genes associated with seed size.

2. Materials and Methods

2.1. Plant Materials and Sample Collection

In 2022, wild-type (control) and Keumsura1ho seeds of Quercus acutissima were obtained from the experimental forest of the National Institute of Forest Science in Korea (37°15′04′′ N, 136°57′59′′ E). The seeds were separated and immediately frozen in liquid nitrogen and stored at −80 °C for future use.

2.2. Sample Validation

A Taq-Man assay that can identify ‘Keumsura1ho’ among chloroplast genomes in four Quercus species (Q. mongolica, Q. acutissima, Q. serrata, and Q. variabilis) was carried out to confirm Q. acutissima ‘Keumsura1ho’ among plant materials, because clones of Q. acutissima ‘Keumsura1ho’ were located in seed orchards of four Quercus. Genomic DNAs of four Quercus were extracted and purified from leaves using Exgene™ Plant SV mini kits (GeneAll, Seoul, Republic of Korea), according to the manufacturer’s protocol. The real-time quantitative PCR (qPCR) reactions were performed using Prime Time® Gene Expression Master Mix (Integrated DNA Technologies, Coralville, IA, USA) (1×) in a total reaction volume of 20 μL containing two probes (5′-/56-FAM/CGATAAAGA/ZEN /GAAATAGGGCCAAC/3IABkFQ/-3′ and 5′/5SUN /CGATAAAGA/ZEN /GAAATAGGACCAAC/3IABkFQ/-3′), a primer set (F: 5′-CACAACCCTTGGATAGCT TCT-3′ and R: 5′-TTCTTTGTACATACATTCGAACCAC-3′), and 20 ng of DNA sample. The conditions were 95 °C for 3 min, followed by 40 cycles of 95 °C for 15 s, and 60 °C for 30 s. Subsequently, allelic discrimination for ‘Keumsura1ho’ was performed in a CFX96 Real-Time System Thermocycler (Bio-Rad Laboratories, Hercules, CA, USA).

2.3. Measurement of Seed Weight and Size

To examine the differences in seed weight and size, seeds were collected from five ramets of Keumsura1ho and three plots of control trees, in 2022. Seed weight, height, width, and length of 562 seeds from Keumsura1ho and 300 seeds from control were measured.

2.4. Measurement of Soluble Sugar and Starch

For biochemical examinations, approximately 0.1 g of the seed samples were coarsely pulverized in liquid nitrogen. The method described by Lu and Sharkey [18] was used to extract and analyze glucose, fructose, and sucrose. Sugar content was determined enzymatically using a biospectrometer (Eppendorf, Hamburg, Germany) and the technique described by Stitt et al. [19]. The unit of measurement for the soluble sugar content was mmol g-1 fresh weight. Sediments obtained from the aqueous ethanol extraction were washed with distilled water and autoclaved in distilled water for 3 h to determine starch concentration. The supernatant was enzymatically digested to recover glucose according to the method described by Walters et al. [20].

2.5. RNA Extraction, cDNA Library Construction, and Sequencing

Total RNA was extracted from the seeds of three biological replicates using a Beniprep® Super Plant RNA extraction kit (InVirusTech Co., Gwangju, Republic of Korea). Around 2 μg of RNA from each sample was utilized to construct cDNA libraries. The integrity of isolated RNAs was assessed using a Bioanalyzer 2100 system (Agilent Technologies, Inc., Santa Clara, CA, USA). The TruSeq Stranded mRNA Prep Kit (Illumina Technologies, San Diego, CA, USA) was used for the subsequent step of cDNA library creation, when RNA integrity number (RIN) > 7. The constructed cDNA libraries were sequenced on an Illumina NovaSeq 6000 platform to generate 101 bp paired-end reads.

2.6. Assembly Normalization and Quality Assessment

Before assembly, raw reads from the four samples each with three biological replicates were trimmed and cleaned using Trimmomatic software (version 0.39) with default parameters to eliminate low-quality reads and reads containing adapter sequences [21]. Trinity software (version 2.14.0) was used to produce high-quality reads for de novo transcriptome assembly using the default parameters [22]. In summary, Trinity assembled longer segments that produced transcripts and unigenes, which were analyzed for annotations by combining particular lengths of overlapping reads with paired-end data. In CD-Hit EST (version 4.6.3), the contigs were combined based on a 95% similarity criterion [23]. Once the longest open reading frames were found, the contigs were translated into coding protein sequences using Transdecoder (version 2.0.1). Using BUSCO (v5) on the gVolante web server, the assembled transcriptome completeness was examined [24]. A summary of the RNA-seq statistics of Q. acutissima seeds is provided in Supplementary Table S1.

2.7. Differentially Expressed Genes (DEGs) Analysis

After the reads were processed according to the standard procedure described above, clean reads were aligned to de novo assemblies for counting. To evaluate the assembly quality the transcriptome of Q. acutissima was mapped back against the raw reads and the mapping percentage (alignment percentage) is provided in Supplementary Table S1. The DEGs of one-year-old Q. acutissima Keumsura1ho seeds were compared with one-year-old control seeds (1Y_K vs. 1Y_C), and the DEGs of two-year-old Q. acutissima Keumsura1ho seeds were compared with their two-year-old Q. acutissima controls (2Y_K vs. 2Y_C). Upregulated and downregulated DEGs were selected if their log2FC ≥ 2 and log2FC ≤ −2, respectively, with an adjusted p-value ≤ 0.05. DEGs related to the expression of transcription factors in Quercus seeds, particularly those involved in the phenylpropanoid biosynthesis pathway, were identified. Differentially expressed transcription factors in the phenylpropanoid biosynthesis pathway were identified and marked in the Kyoto Encyclopedia of Genes and Genomes (KEGG) pathway map (qsu00960) in red, and their differential intensities indicated their expression levels.

2.8. Gene Ontology (GO) and Kyoto Encyclopedia of Genes and Genomes Pathway Analysis

The PANTHER GO biological process categorization was analyzed using GO words and Fisher’s exact test, with a false discovery rate (FDR) < 0.05 (http://go.pantherdb.org/webservices/go/overrep.jsp, accessed on 20 April 2024). Pathway mapping was performed using the Pathview web application [25] and the KEGG database [26].

2.9. Gene Expression Analysis by qPCR

Eight genes were selected for validation of the RNA-seq results. RNA from three biological replicate plants for each treatment, was extracted separately for cDNA synthesis. cDNAs for qPCR was synthesized from all samples. Total RNA was isolated using RibospinTM Plant (Geneall, Seoul, Republic of Korea). For qPCR analysis, first-strand cDNA was synthesized from 1 μg of DNase-treated total RNA using RNA to cDNA EcoDryTM Premix (Takara, Shiga, Japan). All reactions were performed using IQtm SYBR Green Supermix (Bio-Rad, Hercules, CA, USA) in a CFX96 Touch Real-Time PCR Detection System (Bio-Rad) according to the manufacturer’s instructions. The reaction consisted of 40 cycles, each lasting 15 s at 95 °C and 30 s at 58 °C. The first cycle lasted 3 min. For each biological replicate, three technical replicates were used. Using the 2−ΔΔCt method, relative quantification was used to determine the target gene expression levels in various treatments. The qPCR findings were normalized using the expression levels of α-tub and 18S rRNA [27,28]. The gene-specific primers used for qPCR are listed in Supplementary Table S2.

2.10. Statistical Analysis

Differences were analyzed using a one-way ANOVA with multiple comparisons using Tukey’s HSD. Statistical significance was set at p < 0.05. Values are presented as the mean ± standard deviation (SD).

3. Results

3.1. Morphological and Biochemical Analysis of Oak Variety

We observed the phenotypes and performed biochemical analysis of one-year-old and two-year-old oak seeds. First, the authenticity of Keumsura1ho and control samples of Quercus acutissima used in this study was verified using a TaqMan assay (Figure 1a).
In the morphological analysis, seed weight, length, width, and depth were greater for Keumsura1ho than for the control (Table 1 and Figure 1b). Specifically, the average seed weight of Keumsura1ho was 7.8 g, indicating a 219.8% increase over that of the control, 3.5 g. The average seed dimensions for Keumsura1ho were measured at 23.93 mm in height, 22.05 mm in width, and 22.08 mm in length. These dimensions represented enhancements of 118.7%, 133.4%, and 133.9%, respectively, in contrast to the control oak, which measured 20.16 mm in height, 16.53 mm in width, and 16.50 mm in length.
The soluble sugar and starch contents of the two varieties of Quercus acutissima seeds were analyzed (Figure 1c–f). The contents of glucose, fructose, sucrose, and starch in one-year-old seed samples were lower in Keumsura1ho than in control, by 43.9%, 59.8%, 53.8%, and 52.5%, respectively. However, in the two-year-old seed samples, the differences in contents decreased; glucose and fructose were lower in Keumsura1ho by 12.1% and 12.2%, respectively. The two oak tree species contained similar levels of sucrose and starch in their two-year-old seeds. When comparing one-year-old and two-year-old seeds, glucose content was maintained at a similar level in both control and Keumsura1ho, whereas fructose content decreased in control and remained similar for Keumsura1ho. In contrast, the sucrose and starch contents were statistically significantly increased in both the two-year-old seeds compared to one-year-old seeds.

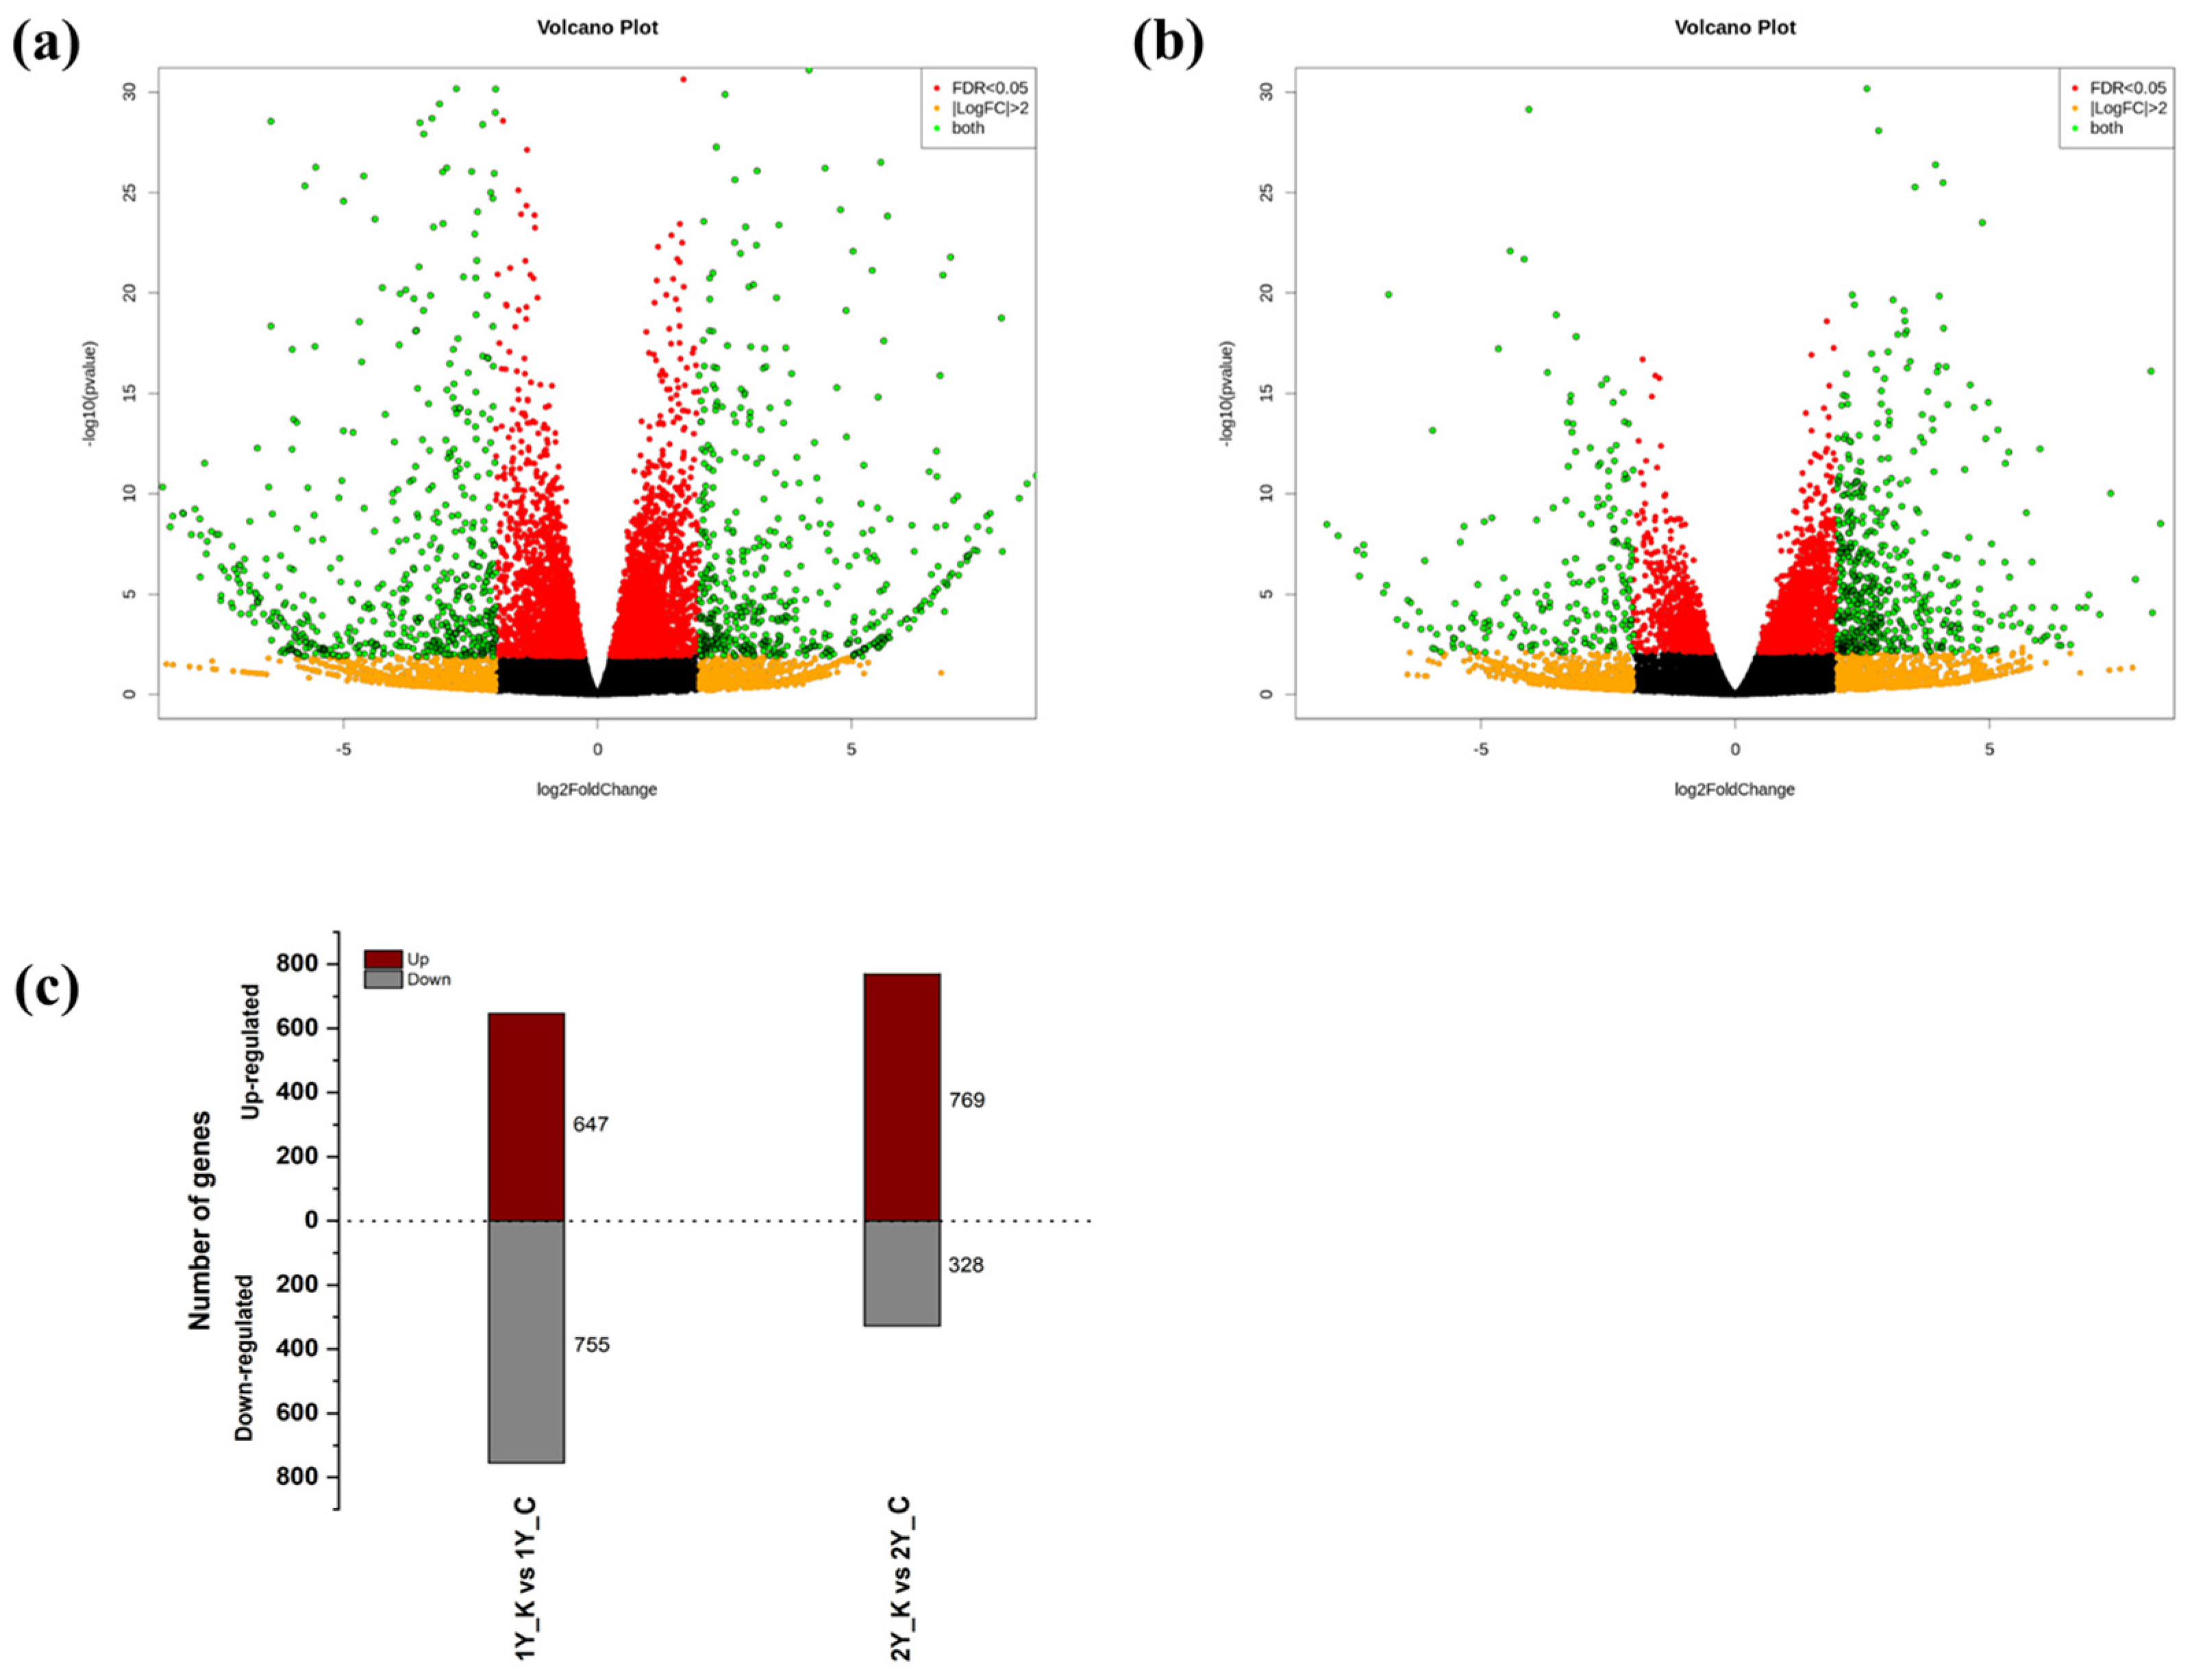
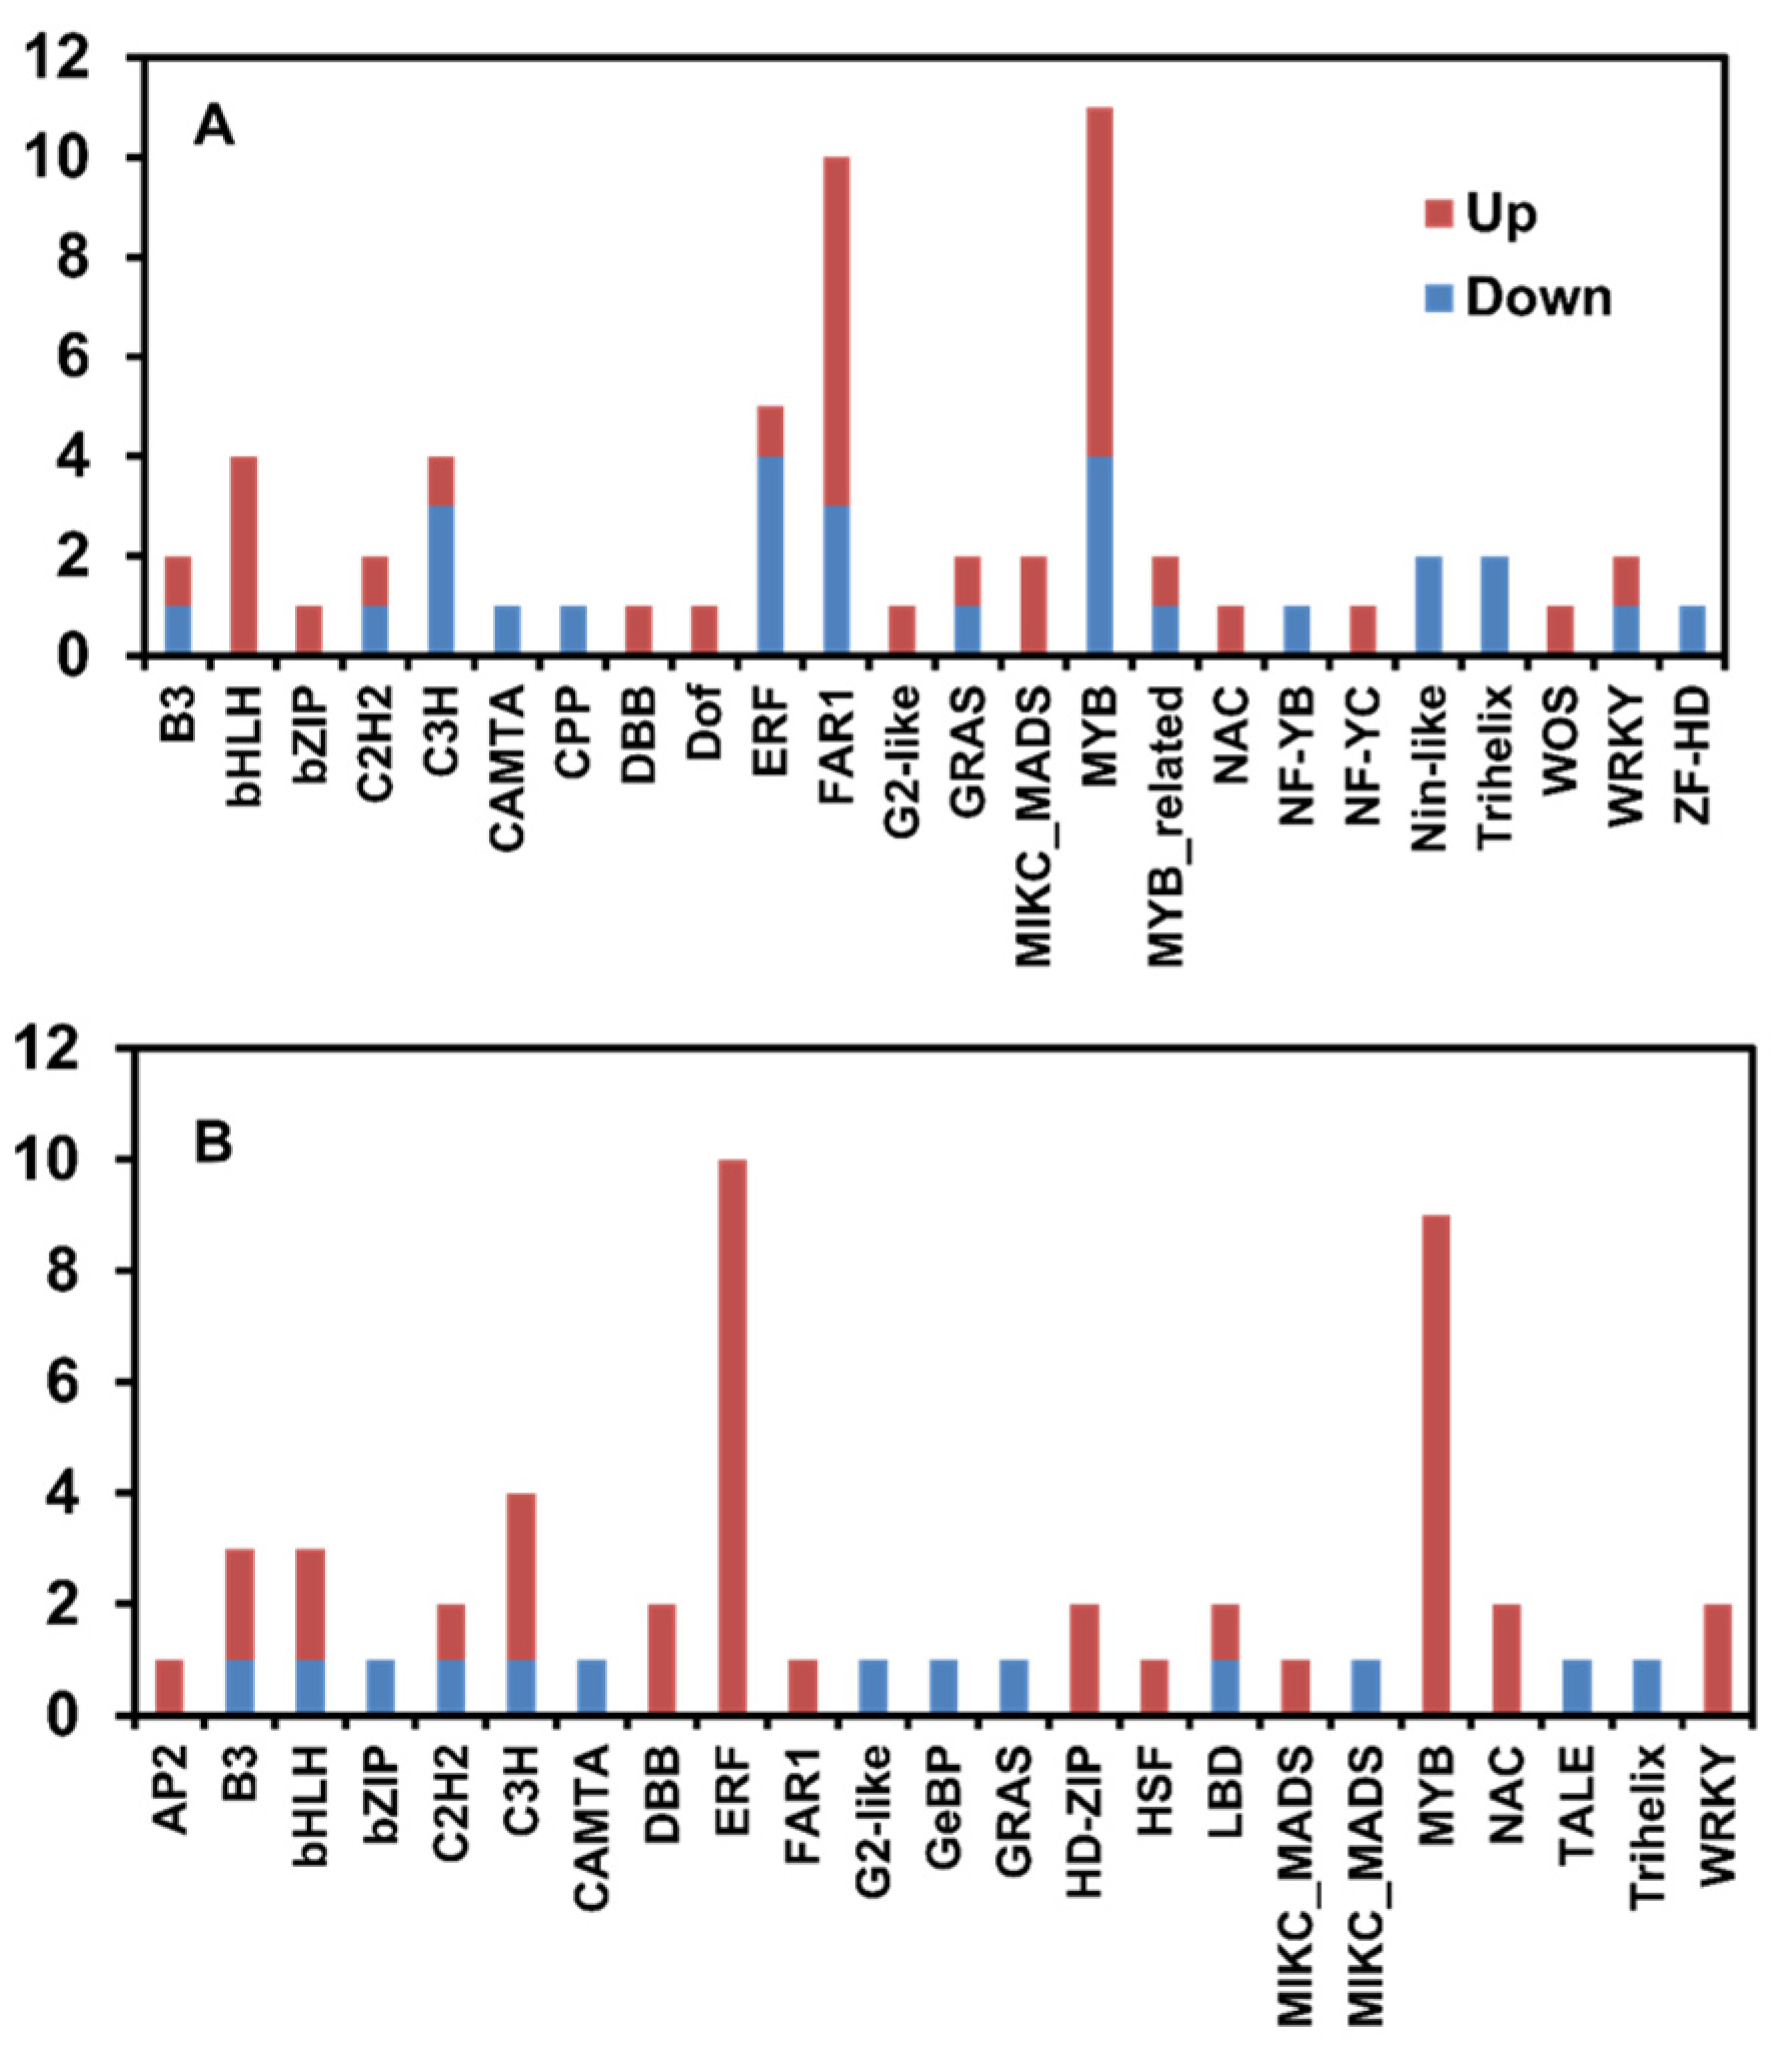
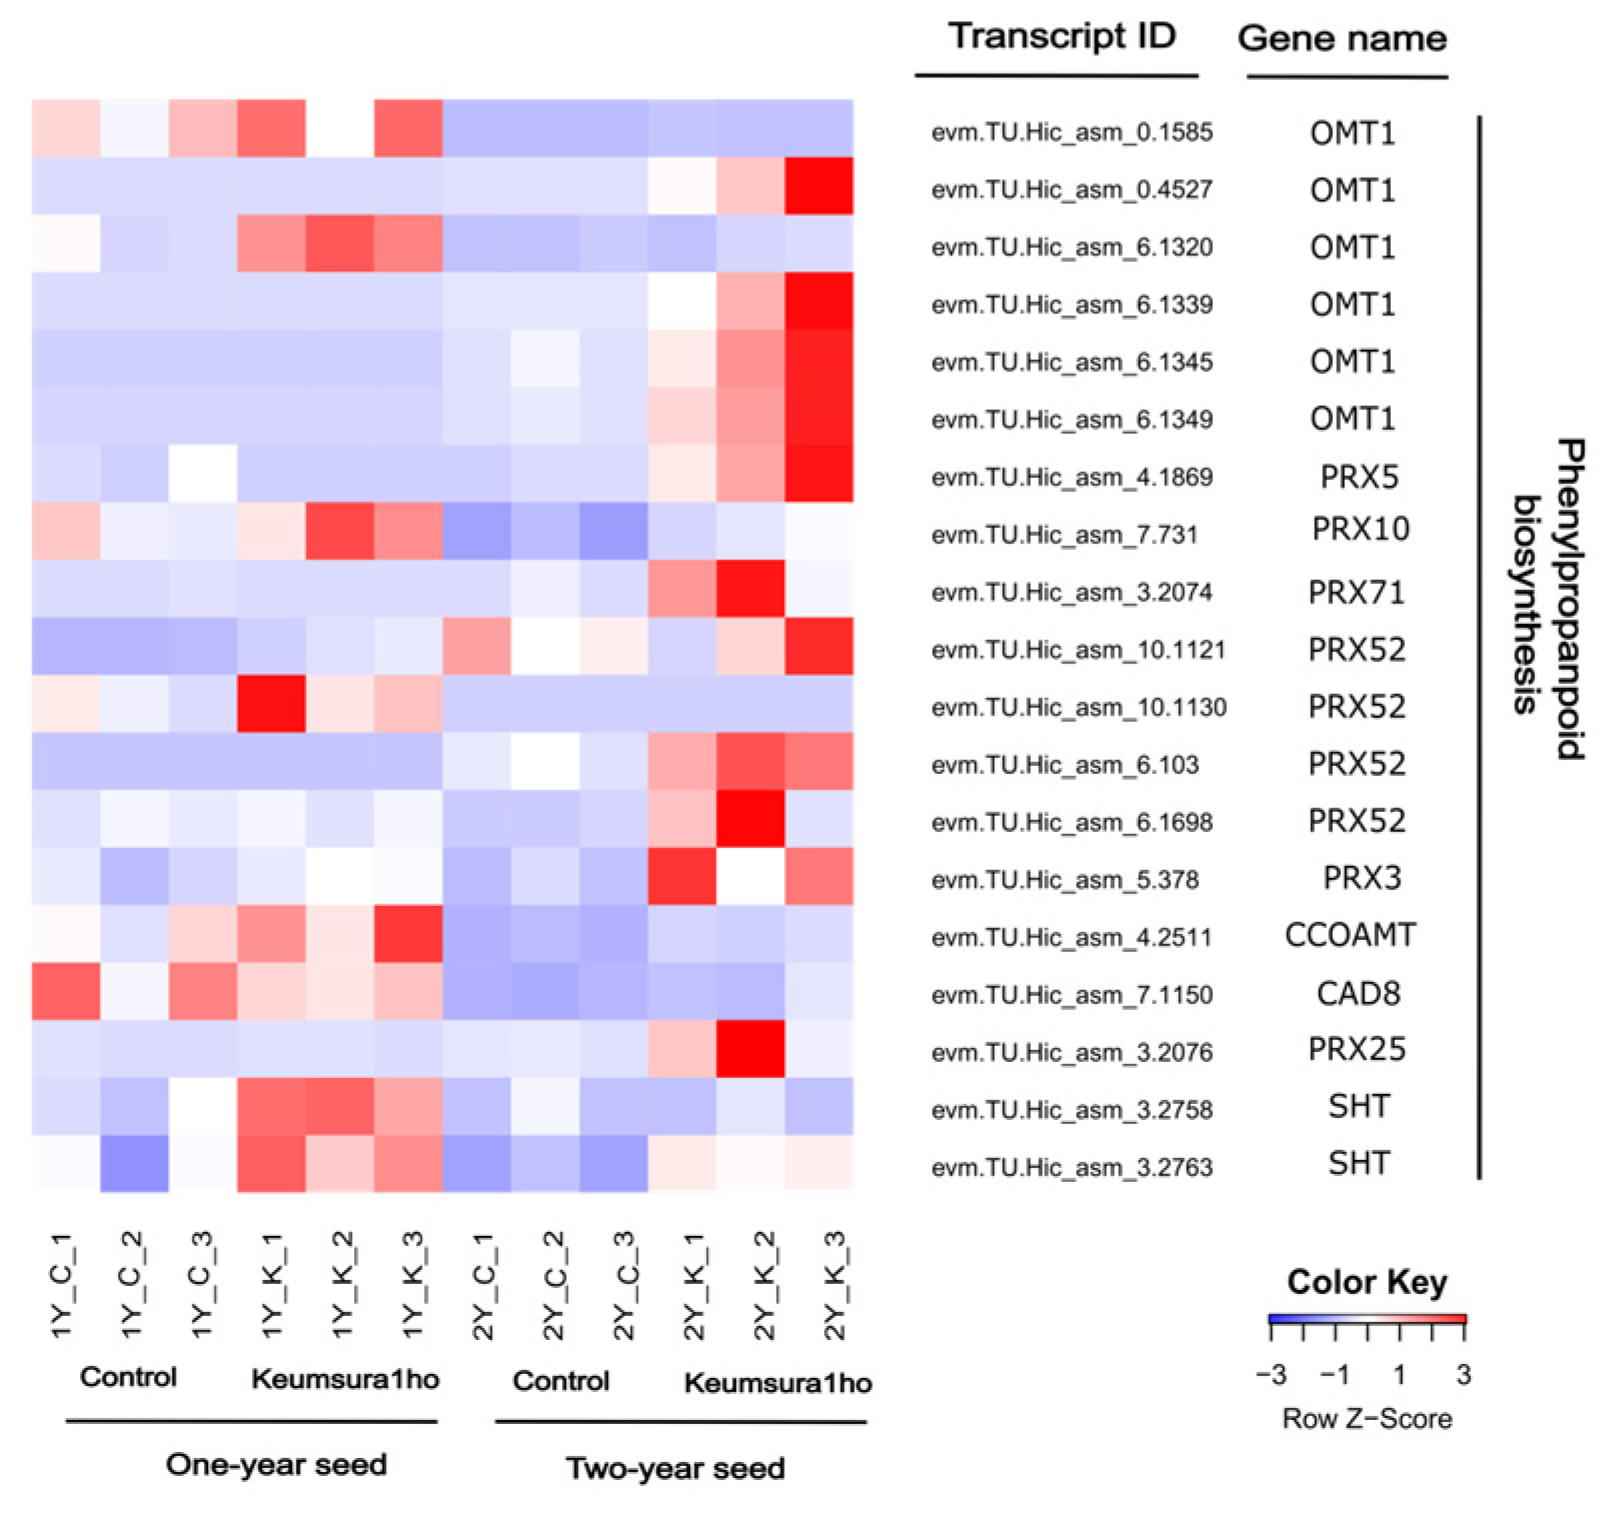
3.2. Identification of DEGs between Control Oak and Keumsura1ho at Different Developmental Stages

A total of three biological isolates of four samples, 1Y and 2Y (control and Keumsura1ho) of Q. acutissima at different growth stages were prepared. A total of 370,130,287 reads were generated, of which the highest had the largest number of reads with 38,505,694 reads while the lowest had 25,868,593 reads. Compared to the control (1Y_K vs. 1Y_C), in the one-year-old Keumsura1ho seed, 647 DEGs were upregulated and 755 DEGs were downregulated (Figure 2). In the two-year-old seed (2Y_K vs. 2Y_C), 769 DEGs were upregulated and 328 DEGs were downregulated. Upregulated DEGs in 1Y_C compared to 1Y were assigned to 42 GO terms, including the biosynthesis of terpenoids and phenylpropanoids, whereas 23 downregulated DEGs comprised a variety of responses (Supplementary Table S3). Comparing 2Y_K to 2Y_C, DEGs associated with seed development and biosynthesis of secondary metabolites were further enriched in 101 categories, including biogenesis of seed oil bodies, plant organ development, biosynthesis of lignin and phenylpropanoids, and system development (Supplementary Table S3).
In the same comparison, there were six different responses to the downregulated DEGs. Four different KEGG metabolic pathways were associated with increased DEGs in the 1Y_K vs. 1Y_C and 2Y_K vs. 2Y_C groups (Table 2). Most of these metabolic pathways involved secondary metabolites. When comparing 1Y_K and 1Y_C, the biosynthesis of monoterpenoids and secondary metabolites was predominant, whereas when comparing 2Y_K and 2Y_C, the biosynthetic pathway of phenylpropanoids was predominant.
Transcription factors (TFs) of 18 and 15 families were associated with 1Y_K and 1Y_C, respectively (Figure 3A). Among the TFs with increased expression, the major TF groups were FAR1 (seven genes) and MYB (seven genes), followed by bHLH (four genes) and other TF families. The two largest categories of downregulated TFs were those of MYB (four genes) and ERF (four genes). Fifteen and 13 TF families were upregulated in 2Y_K and 2Y_C, respectively (Figure 3B). The largest group of upregulated DEGs consisted of ERF families (10 genes), followed by MYB (nine genes) and other families. One TF from each family of the downregulated TFs was identified (Figure 3B).
Cinnamoyl alcohol dehydrogenase 8 (CAD8), Caffeoyl CoA O-methyltransferase (CCOAMT), spermidine hydroxycinnamoyl transferase (SHT), flavone 3′-O-methyltransferase 1 (OMT1), and peroxidase (PRX) genes (PRX5, PRX10, PRX71, PRX52, and PRX3) were enhanced for Keumsura1ho compared to control (Figure 4).
In particular, two-year-old Keumsura1ho showed statistically significant expression of OMT1 and PRX. The key genes identified in phenylpropanoid biosynthesis were OMT1, SHT, CAD8, and PRX (Figure 5). The end-products of these genes are syringyl lignin, guaiacyl lignin, 5-hydroxyguaiacyl lignin, and p-hydroxyphenyl lignin. Thus, genes involved in phenylpropanoid biosynthesis can be used as reliable seed size markers.

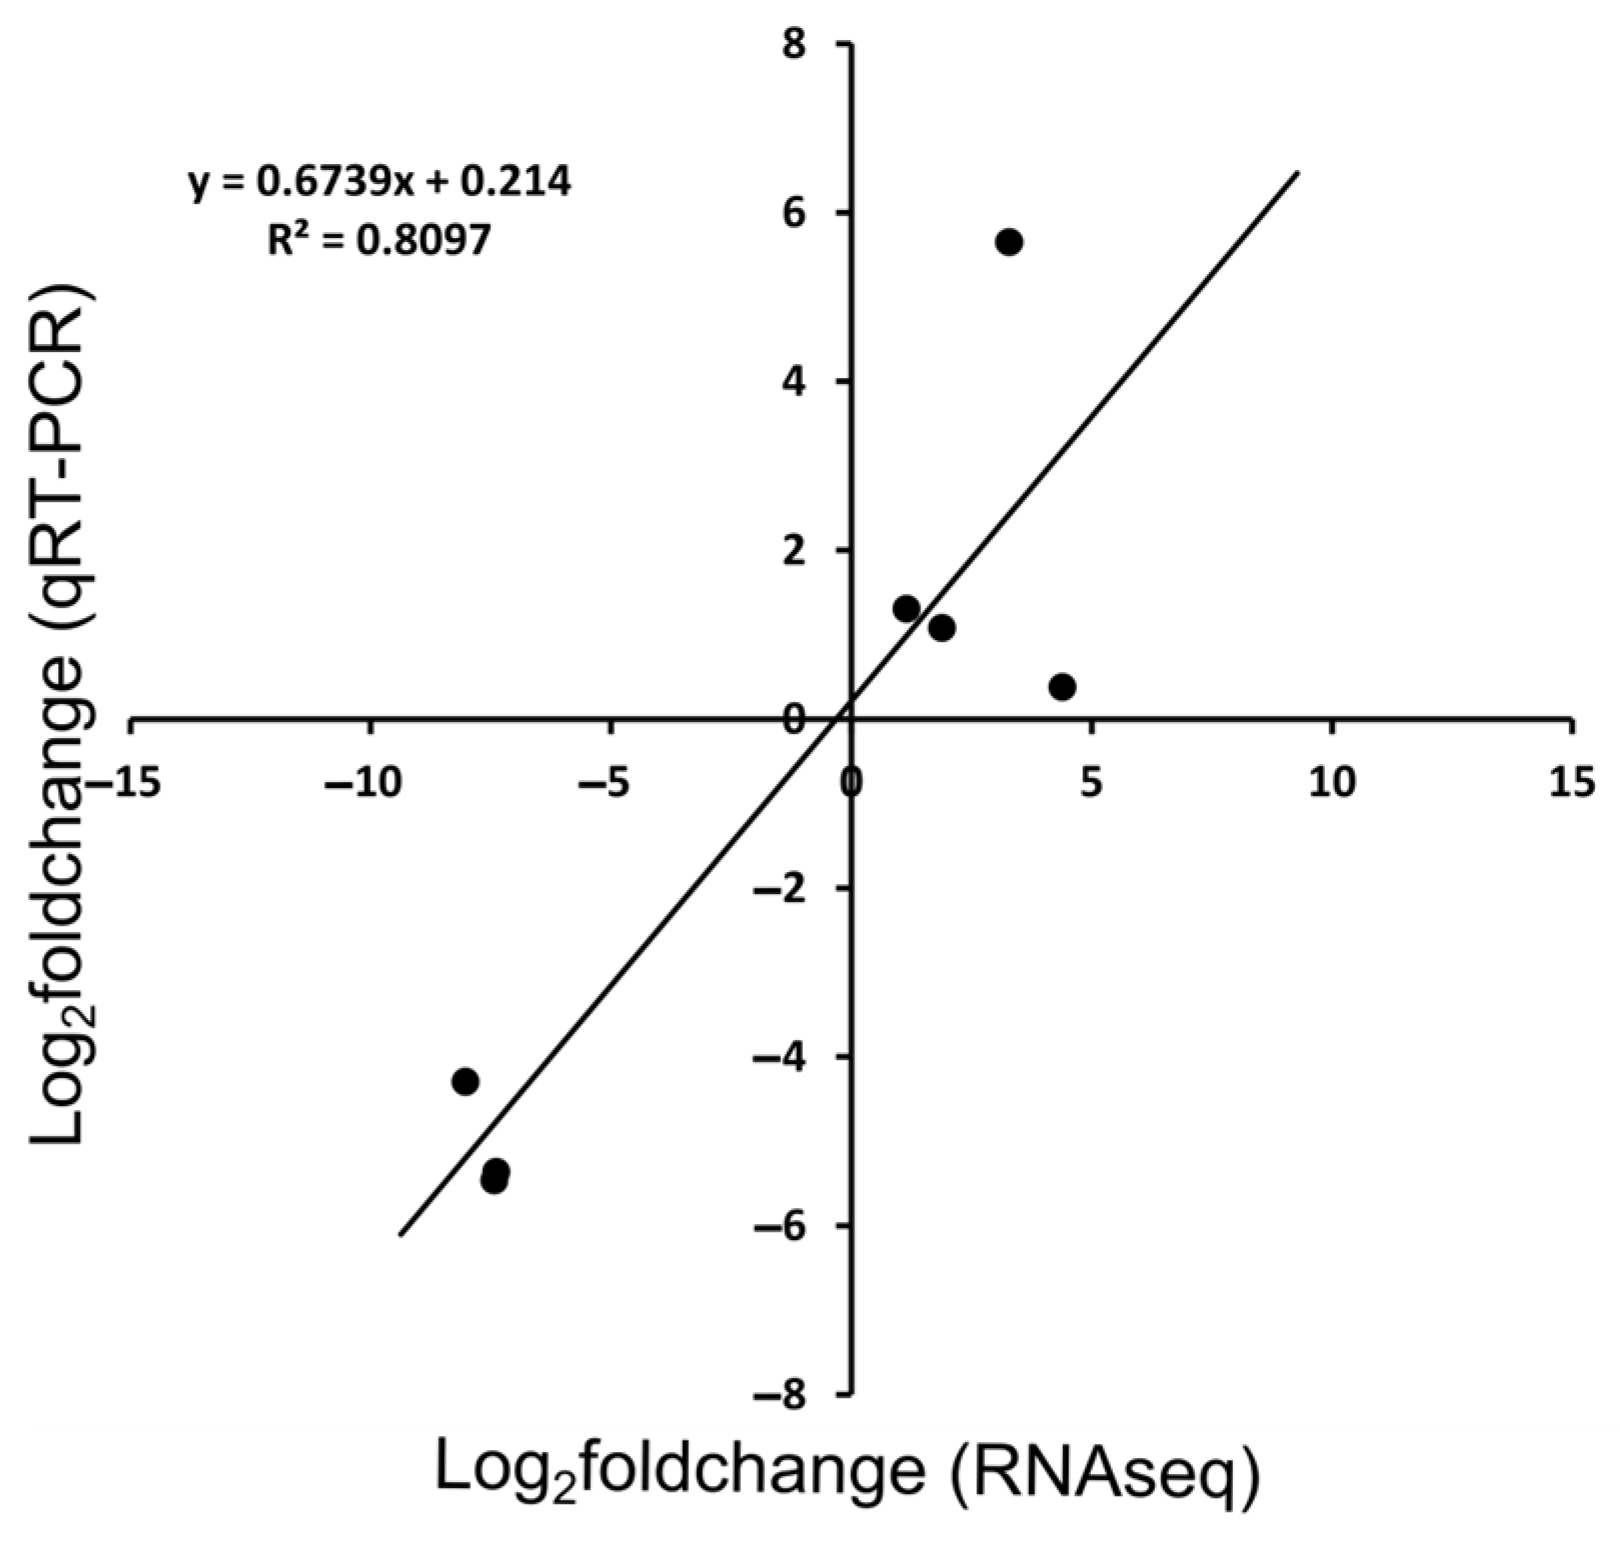
3.3. Validation of RNA-Seq Results

To confirm the reliability of the RNA-seq findings, qPCR was performed on the eight genes (Figure 6). When comparing Keumsura1ho and the control, there was a statistically significant correlation between the RNA-seq and qPCR results (p = 0.005, R2 = 0.810).

4. Discussion

Seed size is a crucial agronomic characteristic that significantly influences crop and fruit yields, and is a key breeding trait [29,30,31,32,33]. Many QTLs and genes that regulate grain size and weight have been identified and are being used in breeding programs, such as marker-assisted selection, transgenic breeding, and genome editing [34,35,36,37,38,39]. In the case of Quercus, biotechnology has been applied to specific oak species, such as molecular markers and genetic transformation [40,41]. Substantial progress has been made in micropropagation through induction of somatic embryogenesis. However, owing to the difficulty in large-scale propagation [40], oak improvement breeding programs primarily rely on plus tree selection methods. In this study, Keumsura1ho, which was also improved using the plus tree selection method, exhibited superior seed size and weight compared to the control (Table 1). The acorn mass is strongly correlated with its size, survival rate, and growth rate [12,42,43,44,45,46,47]. The relative size or mass can differ based on family, population, or provenance. Previous studies report that family effects can influence acorn size and seedling quality, even in mother trees within the same provenance [44,45,48]. Family selection can enhance the quality of nursery seedlings and improve the field performance of artificially regenerated seedlings [49]. Oak tree improvement primarily focuses on growth, and there is no research available on improving acorn size [50,51]. This study demonstrated significant improvements in terms of seed size and weight using plus tree selection and clonal propagation.
In this study, we found that lignin, a phenylpropanoid metabolite, plays a crucial role in determining seed size. Recent studies have indicated a relationship between plant seed size and their lignin content. It has been observed that when a tomato is overexpressed, there is a statistically significant increase in lignin content, resulting in larger seeds [52]. In contrast, lines with iRNA showed remarkably reduced lignin content compared to the wild type, leading to notably malformed seeds without a seed coat [53]. Similarly, the overexpression of lignin biosynthesis genes increases seed size in A. thaliana and rice [54,55,56,57]. These findings suggest that lignification has a positive effect on seed size. However, camelina (Camelina sativa) showed an increase in seed size, but downregulated genes associated with lignin biosynthesis, which is crucial for seed coat development [58]. These exceptions observations indicate that the correlation between lignin content and seed size varies across different tissues and species.
Sugar and hormonal signaling, transcription factors, and metabolic pathways have been documented as playing a crucial role in the seed development of Arabidopsis [59,60,61,62,63]. In the case of tree species, similar to our study, genes involved in stress response, lignin biosynthesis, and secondary cell wall biogenesis regulate seed size. MYB transcription factors are essential regulators in seed abortion [64]. In the case of almonds, the almond cultivar ‘Mamaee’ (large seeds) exhibited upregulated genes associated with sucrose synthase, phenylpropanoid biosynthesis, and gibberellin compared to the small seed cultivar genes [65]. In two-year-old Keumsura1ho seeds, genes related to lignin and phenylpropanoid biosynthetic processes and seed oil body biogenesis were upregulated compared with those in the control (Table S2). In addition, in the two-year-old Keumsura1ho seeds, phenylpropanoid biosynthesis pathways were significantly upregulated (Table 2). In plants, the phenylpropanoid pathway acts as a substantial reservoir of metabolites, including flavonoids, coumarins, and lignans [66]. Lignin is essential for plant mechanical support, reproductive development, growth, and resistance to biotic and abiotic stressors [67,68]. Flavonoids, including flavonols, flavones, proanthocyanidins, and anthocyanins act as antioxidants and scavenge reactive oxygen species (ROS) in plants. Flavones, flavonols, and anthocyanins are required for defense against pathogens and herbivores [69]. In the phenylpropanoid pathway, MYB TFs were mainly involved [70], and MYB TFs were upregulated in Keumsura1ho compared to the control (Figure 3). In particular, increased expression of ERF transcription factors involved in lignin biosynthesis [71,72] and many genes involved in phenylpropanoid biosynthesis were upregulated in one-year-old and two-year-old Keumsura1ho seeds compared to the control (Figure 4). Among them, OMT1 and PRX genes, including PRX5, PRX10, PRX71, PRX52, and PRX3 were highly expressed in two-year-old Keumsura1ho seeds. In the phenylpropanoid biosynthesis pathway, lignin polymer products were observed in two-year-old Keumsura1ho (Figure 5). In the phenylpropanoid biosynthesis pathway, OMT1 plays a key role in the biosynthesis of lignin products such as syringyl and guaiacyl lignin subunits. In field-grown perennial ryegrass plants, OMT1 expression is correlated with increased lignification and S-lignin biosynthesis [73]. PRX isoforms also play a crucial role in cell-wall metabolism by binding to a variety of substrates [74,75] and promoting fruit growth [76,77]. They are involved in polymerization processes, including lignification, which strengthens the cell wall, suberization, and utilization of hydrogen peroxide. Studies on Arabidopsis mutants have revealed that the absence of AtPRX2 or AtPRX25 leads to decreased lignin levels [74]. Furthermore, the AtPRX72 mutation is associated with decreased lignin deposition and a reduction in stem height [78]. Consequently, the activation of genes in the phenylpropanoid pathway initiates lignin production. This activation accelerates the lignification of seed coat tissues and influences the increase in the size of Keumsura1ho seeds.

5. Conclusions

Acorn size serves as a critical factor in nursery management and is economically valuable as a functional food source. However, challenges persist regarding vegetative propagation and significant variations in acorn seed sizes among individual trees. Keumsura1ho exhibited larger acorn size and weight than that of the control oak, which was selected through the plus tree method. In two-year-old Keumsura1ho seeds, the production of lignin generated in the phenylpropanoid biosynthesis pathway contributed to the increase in seed size. The results are consistent with other previously reported findings and demonstrate that lignin metabolism and MYB transcription factors play a significant role in seed size. These findings will aid in understanding the mechanisms underlying acorn seed size and in identifying seed size marker genes to help establish selection and breeding strategies.

Supplementary Materials

The following supporting information can be downloaded at: https://www.mdpi.com/article/10.3390/horticulturae10080829/s1, Table S1: Summary statistics of RNA-seq data and mapping results of Quercus acutissima; Table S2: Primer sequences used to validate RNA-Sequencing results of Keumsura1ho and control in one-year and two-year seed; Table S3: Gene ontology (GO) analysis of Keumsura1ho and control in one-year and two-year seed.

Author Contributions

Writing—original draft preparation, visualization, and formal analysis, S.B.; data curation, writing—review and editing and validation, K.L., K.-S.C., T.-L.K. and D.P.; data curation, validation, and visualization, M.I.J.D.; supervision, conceptualization, writing—review and editing and funding acquisition, H.L. All authors have read and agreed to the published version of the manuscript.

Funding

This research was supported by the National Institute of Forest Science of the Republic of Korea, grant number FG0402-2022-01-2024.

Data Availability Statement

The original data presented in this study are available on the NCBI SRA database (PRJNA1125139, accessed on 18 June 2024).

Conflicts of Interest

Author Michael Immanuel Jesse Denison was employed by the company 3BIGS Company Limited. The remaining authors declare that the research was conducted in the absence of any commercial or financial relationships that could be construed as a potential conflict of interest.

References

  1. Bobiec, A.; Reif, A.; Öllerer, K. Seeing the oakscape beyond the forest: A landscape approach to the oak regeneration in Europe. Landsc. Ecol. 2018, 33, 513–528. [Google Scholar] [CrossRef]
  2. Hill, A.F. Economic Botany. A Textbook of Useful Plants and Plant Products; McGraw-Hill: New York, NY, USA, 1952. [Google Scholar]
  3. Mason, S.L.R. Acorns in Human Subsistence; University of London: London, UK; University College London (United Kingdom): London, UK, 1992. [Google Scholar]
  4. Melamed, Y.; Kislev, M.E.; Geffen, E.; Lev-Yadun, S.; Goren-Inbar, N. The plant component of an Acheulian diet at Gesher Benot Ya ‘aqov, Israel. Proc. Natl. Acad. Sci. USA 2016, 113, 14674–14679. [Google Scholar] [CrossRef]
  5. Xu, J.; Cao, J.; Yue, J.; Zhang, X.; Zhao, Y. New triterpenoids from acorns of Quercus liaotungensis and their inhibitory activity against α-glucosidase, α-amylase and protein-tyrosine phosphatase 1B. J. Funct. Foods 2018, 41, 232–239. [Google Scholar] [CrossRef]
  6. Taib, M.; Bouyazza, L.; Lyoussi, B. Acorn oil: Chemistry and functionality. J. Food Qual. 2020, 2020, 8898370. [Google Scholar] [CrossRef]
  7. Monteiro, V.; Soares, C.; Grosso, C.; Delerue-Matos, C.; Ramalhosa, M.J. From Forest to Table: Optimizing the Nutritional Value of Acorns through Effective Tannin Extraction. Biol. Life Sci. Forum 2023, 26, 16. [Google Scholar] [CrossRef]
  8. Szabłowska, E.; Tańska, M. Acorn flour properties depending on the production method and laboratory baking test results: A review. Compr. Rev. Food Sci. Food Saf. 2021, 20, 980–1008. [Google Scholar] [CrossRef]
  9. Ceccon, E.; González, E.J.; Martorell, C. Is direct seeding a biologically viable strategy for restoring forest ecosystems? Evidences from a Meta-analysis. Land Degrad. Dev. 2016, 27, 511–520. [Google Scholar] [CrossRef]
  10. Löf, M.; Madsen, P.; Metslaid, M.; Witzell, J.; Jacobs, D.F. Restoring forests: Regeneration and ecosystem function for the future. New For. 2019, 50, 139–151. [Google Scholar] [CrossRef]
  11. Hou, X.; Yi, X.; Yang, Y.; Liu, W. Acorn germination and seedling survival of Q. variabilis: Effects of cotyledon excision. Ann. For. Sci. 2010, 67, 711. [Google Scholar] [CrossRef]
  12. Yi, X.; Zhang, J.; Wang, Z. Large and small acorns contribute equally to early-stage oak seedlings: A multiple species study. Eur. J. For. Res. 2015, 134, 1019–1026. [Google Scholar] [CrossRef]
  13. Greenberg, C.H. Oak growth and acorn production in southern Appalachian mature forests and shelterwood with reserves regeneration harvests. For. Ecol. Manag. 2021, 481, 118691. [Google Scholar] [CrossRef]
  14. Valero Galván, J.; Jorrin Novo, J.J.; Cabrera, A.G.; Ariza, D.; García-Olmo, J.; Cerrillo, R.M.N. Population variability based on the morphometry and chemical composition of the acorn in Holm oak (Quercus ilex subsp. ballota [Desf.] Samp.). Eur. J. For. Res. 2012, 131, 893–904. [Google Scholar] [CrossRef]
  15. National Institute of Forest Science. The characteristics and cultivation of the new cultivar “Keumsuro1ho” of the Quercus Acutissima. For. Sci. News 2017, 17–26. [Google Scholar]
  16. Tobimatsu, Y.; Schuetz, M. Lignin polymerization: How do plants manage the chemistry so well? Curr. Opin. Biotechnol. 2019, 56, 75–81. [Google Scholar] [CrossRef]
  17. Ali, M.B.; McNear, D.H. Induced transcriptional profiling of phenylpropanoid pathway genes increased flavonoid and lignin content in Arabidopsis leaves in response to microbial products. BMC Plant Biol. 2014, 14, 84. [Google Scholar] [CrossRef]
  18. Lu, Y.; Sharkey, T.D. The role of amylomaltase in maltose metabolism in the cytosol of photosynthetic cells. Planta 2004, 218, 466–473. [Google Scholar] [CrossRef]
  19. Stitt, M.; Lilley, R.M.; Gerhardt, R.; Heldt, H.W. [32] Metabolite levels in specific cells and subcellular compartments of plant leaves. In Methods in Enzymology; Elsevier: Amsterdam, The Netherlands, 1989; Volume 174, pp. 518–552. [Google Scholar]
  20. Walters, R.G.; Ibrahim, D.G.; Horton, P.; Kruger, N.J. A mutant of Arabidopsis lacking the triose-phosphate/phosphate translocator reveals metabolic regulation of starch breakdown in the light. Plant Physiol. 2004, 135, 891–906. [Google Scholar] [CrossRef]
  21. Bolger, A.; Giorgi, F. Trimmomatic: A flexible read trimming tool for Illumina NGS data. Bioinformatics 2014, 30, 2114–2120. [Google Scholar] [CrossRef]
  22. Haas, B.J.; Papanicolaou, A.; Yassour, M.; Grabherr, M.; Blood, P.D.; Bowden, J.; Couger, M.B.; Eccles, D.; Li, B.; Lieber, M. De novo transcript sequence reconstruction from RNA-seq using the Trinity platform for reference generation and analysis. Nat. Protoc. 2013, 8, 1494–1512. [Google Scholar] [CrossRef] [PubMed]
  23. Fu, L.; Niu, B.; Zhu, Z.; Wu, S.; Li, W. CD-HIT: Accelerated for clustering the next-generation sequencing data. Bioinformatics 2012, 28, 3150–3152. [Google Scholar] [CrossRef] [PubMed]
  24. Simão, F.A.; Waterhouse, R.M.; Ioannidis, P.; Kriventseva, E.V.; Zdobnov, E.M. BUSCO: Assessing genome assembly and annotation completeness with single-copy orthologs. Bioinformatics 2015, 31, 3210–3212. [Google Scholar] [CrossRef] [PubMed]
  25. Luo, W.; Pant, G.; Bhavnasi, Y.K.; Blanchard Jr, S.G.; Brouwer, C. Pathview Web: User friendly pathway visualization and data integration. Nucleic Acids Res. 2017, 45, W501–W508. [Google Scholar] [CrossRef] [PubMed]
  26. Natarajan, P.; Ahn, E.; Reddy, U.K.; Perumal, R.; Prom, L.K.; Magill, C. RNA-Sequencing in resistant (QL3) and susceptible (Theis) sorghum cultivars inoculated with Johnsongrass isolates of Colletotrichum sublineola. Front. Genet. 2021, 12, 722519. [Google Scholar] [CrossRef] [PubMed]
  27. Makela, A.V.; Murrell, D.H.; Parkins, K.M.; Kara, J.; Gaudet, J.M.; Foster, P.J. Cellular imaging with MRI. Top. Magn. Reson. Imaging 2016, 25, 177–186. [Google Scholar] [CrossRef] [PubMed]
  28. Migueal, P.; Nkongolo, K.; Michael, P.; Djeukam, C. Differential gene transcription in red oak (Quercus rubra) genotypes resistant to copper toxicity. Am. J. Biochem. Biotechnol. 2017, 13, 215–255. [Google Scholar] [CrossRef]
  29. Simon, P.W.; Jenderek, M.M. Flowering, seed production, and the genesis of garlic breeding. Plant Breed. Rev. 2004, 23, 211–244. [Google Scholar]
  30. Khush, G.S. Rice breeding: Past, present and future. J. Genet. 1987, 66, 195–216. [Google Scholar] [CrossRef]
  31. Takeda, K. Inheritance of grain size and its implications for rice breeding. In Rice Genetics II: (In 2 Parts); World Scientific: Singapore, 1991; pp. 181–189. [Google Scholar]
  32. Sestras, R.E.; Sestras, A.F. Quantitative traits of interest in apple breeding and their implications for selection. Plants 2023, 12, 903. [Google Scholar] [CrossRef] [PubMed]
  33. Fresnedo-Ramírez, J.; Frett, T.J.; Sandefur, P.J.; Salgado-Rojas, A.; Clark, J.R.; Gasic, K.; Peace, C.P.; Anderson, N.; Hartmann, T.P.; Byrne, D.H. QTL mapping and breeding value estimation through pedigree-based analysis of fruit size and weight in four diverse peach breeding programs. Tree Genet. Genomes 2016, 12, 25. [Google Scholar] [CrossRef]
  34. Li, Y.-Y.; Tao, H.-J.; Zhao, X.-Q.; Jie, X.; Li, G.-M.; Hu, S.-K.; Dong, G.-J.; Shi, Z.-Y.; Wu, L.-W.; Jiang, H. Molecular improvement of grain weight and yield in rice by using GW6 gene. Rice Sci. 2014, 21, 127–132. [Google Scholar] [CrossRef]
  35. Wang, P.; Xing, Y.; Li, Z.; Yu, S. Improving rice yield and quality by QTL pyramiding. Mol. Breed. 2012, 29, 903–913. [Google Scholar] [CrossRef]
  36. Wang, W.; Simmonds, J.; Pan, Q.; Davidson, D.; He, F.; Battal, A.; Akhunova, A.; Trick, H.N.; Uauy, C.; Akhunov, E. Gene editing and mutagenesis reveal inter-cultivar differences and additivity in the contribution of TaGW2 homoeologues to grain size and weight in wheat. Theor. Appl. Genet. 2018, 131, 2463–2475. [Google Scholar] [CrossRef] [PubMed]
  37. Gautam, T.; Amardeep; Saripalli, G.; Rakhi; Kumar, A.; Gahlaut, V.; Gadekar, D.; Oak, M.; Sharma, P.; Balyan, H. Introgression of a drought insensitive grain yield QTL for improvement of four Indian bread wheat cultivars using marker assisted breeding without background selection. J. Plant Biochem. Biotechnol. 2021, 30, 172–183. [Google Scholar] [CrossRef]
  38. Li, S.; Zhou, Y.; Liu, M.; Zhang, Y.; Cao, S. Nutrient composition and starch characteristics of Quercus glandulifera Bl. seeds from China. Food Chem. 2015, 185, 371–376. [Google Scholar] [CrossRef] [PubMed]
  39. Zhang, Y.; Liang, Z.; Zong, Y.; Wang, Y.; Liu, J.; Chen, K.; Qiu, J.-L.; Gao, C. Efficient and transgene-free genome editing in wheat through transient expression of CRISPR/Cas9 DNA or RNA. Nat. Commun. 2016, 7, 12617. [Google Scholar] [CrossRef] [PubMed]
  40. Vieitez, A.M.; Corredoira, E.; Martínez, M.T.; San-José, M.C.; Sánchez, C.; Valladares, S.; Vidal, N.; Ballester, A. Application of biotechnological tools to Quercus improvement. Eur. J. For. Res. 2012, 131, 519–539. [Google Scholar] [CrossRef]
  41. Pijut, P.M.; Woeste, K.E.; Vengadesan, G.; Michler, C.H. Technological advances in temperate hardwood tree improvement including breeding and molecular marker applications. In Vitro Cell. Dev. Biol. Plant 2007, 43, 283–303. [Google Scholar] [CrossRef]
  42. Ramírez-Valiente, J.A.; Valladares, F.; Gil, L.; Aranda, I. Population differences in juvenile survival under increasing drought are mediated by seed size in cork oak (Quercus suber L.). For. Ecol. Manag. 2009, 257, 1676–1683. [Google Scholar] [CrossRef]
  43. González-Rodríguez, V.; Villar, R.; Navarro-Cerrillo, R.M. Maternal influences on seed mass effect and initial seedling growth in four Quercus species. Acta Oecologica 2011, 37, 1–9. [Google Scholar] [CrossRef]
  44. Landergott, U.; Gugerli, F.; Hoebee, S.E.; Finkeldey, R.; Holderegger, R. Effects of seed mass on seedling height and competition in European white oaks. Flora-Morphol. Distrib. Funct. Ecol. Plants 2012, 207, 721–725. [Google Scholar] [CrossRef]
  45. Kormanik, P.P.; Sung, S.; Kormanik, T.; Schlarbaum, S.; Zarnoch, S.J. Effect of acorn size on development of northern red oak 1-0 seedlings. Can. J. For. Res. 1998, 28, 1805–1813. [Google Scholar] [CrossRef]
  46. Navarro, F.B.; Jiménez, M.N.; Ripoll, M.Á.; Fernández-Ondoño, E.; Gallego, E.; De Simón, E. Direct sowing of holm oak acorns: Effects of acorn size and soil treatment. Ann. For. Sci. 2006, 63, 961–967. [Google Scholar] [CrossRef]
  47. Tilki, F. Influence of acorn size and storage duration on moisture content, germination and survival of Quercus petraea (Mattuschka). J. Environ. Biol. 2010, 31, 325. [Google Scholar]
  48. Kriebel, C.H. Team decision models of an inventory supply organization. Nav. Res. Logist. Q. 1965, 12, 139–154. [Google Scholar] [CrossRef]
  49. Davis, A.; Jacobs, D. Afforestation in the central hardwood forest region of the USA. In Forest Research Information Paper; Ontario Forest Research Institute: Sault Ste. Marie, ON, Canada, 2005. [Google Scholar]
  50. Son, S.-G.; Kim, H.-J.; Kang, Y.-J.; Oh, C.-J.; Kim, C.-S.; Byun, K.-O. Establishment of breeding population for Quercus glauca and climatic factors. Korean J. Agric. For. Meteorol. 2011, 13, 109–114. [Google Scholar] [CrossRef]
  51. Woeste, K.E.; Pike, C.C.; Warren, J.C.; Coggeshall, M.V. Characterization of stem volume and form tradeoffs in a northern red oak (Quercus rubra) breeding population in early stages of selection. Ann. For. Sci. 2021, 78, 72. [Google Scholar] [CrossRef]
  52. Li, M.; Cheng, C.; Zhang, X.; Zhou, S.; Li, L.; Yang, S. Overexpression of pear (Pyrus pyrifolia) CAD2 in tomato affects lignin content. Molecules 2019, 24, 2595. [Google Scholar] [CrossRef] [PubMed]
  53. Zhang, Y.; Zhang, H.; Zhao, H.; Xia, Y.; Zheng, X.; Fan, R.; Tan, Z.; Duan, C.; Fu, Y.; Li, L. Multi-omics analysis dissects the genetic architecture of seed coat content in Brassica napus. Genome Biol. 2022, 23, 86. [Google Scholar] [CrossRef]
  54. Noda, S.; Koshiba, T.; Hattori, T.; Yamaguchi, M.; Suzuki, S.; Umezawa, T. The expression of a rice secondary wall-specific cellulose synthase gene, OsCesA7, is directly regulated by a rice transcription factor, OsMYB58/63. Planta 2015, 242, 589–600. [Google Scholar] [CrossRef]
  55. Zhang, Y.-C.; Yu, Y.; Wang, C.-Y.; Li, Z.-Y.; Liu, Q.; Xu, J.; Liao, J.-Y.; Wang, X.-J.; Qu, L.-H.; Chen, F. Overexpression of microRNA OsmiR397 improves rice yield by increasing grain size and promoting panicle branching. Nat. Biotechnol. 2013, 31, 848. [Google Scholar] [CrossRef]
  56. Wang, C.Y.; Zhang, S.; Yu, Y.; Luo, Y.C.; Liu, Q.; Ju, C.; Zhang, Y.C.; Qu, L.H.; Lucas, W.J.; Wang, X. MiR397b regulates both lignin content and seed number in Arabidopsis via modulating a laccase involved in lignin biosynthesis. Plant Biotechnol. J. 2014, 12, 1132–1142. [Google Scholar] [CrossRef] [PubMed]
  57. Dong, N.-Q.; Sun, Y.; Guo, T.; Shi, C.-L.; Zhang, Y.-M.; Kan, Y.; Xiang, Y.-H.; Zhang, H.; Yang, Y.-B.; Li, Y.-C. UDP-glucosyltransferase regulates grain size and abiotic stress tolerance associated with metabolic flux redirection in rice. Nat. Commun. 2020, 11, 2629. [Google Scholar] [CrossRef] [PubMed]
  58. Na, G.; Mu, X.; Grabowski, P.; Schmutz, J.; Lu, C. Enhancing micro RNA 167A expression in seed decreases the α-linolenic acid content and increases seed size in Camelina sativa. Plant J. 2019, 98, 346–358. [Google Scholar] [CrossRef] [PubMed]
  59. Le, B.H.; Cheng, C.; Bui, A.Q.; Wagmaister, J.A.; Henry, K.F.; Pelletier, J.; Kwong, L.; Belmonte, M.; Kirkbride, R.; Horvath, S. Global analysis of gene activity during Arabidopsis seed development and identification of seed-specific transcription factors. Proc. Natl. Acad. Sci. USA 2010, 107, 8063–8070. [Google Scholar] [CrossRef] [PubMed]
  60. Orozco-Arroyo, G.; Paolo, D.; Ezquer, I.; Colombo, L. Networks controlling seed size in Arabidopsis. Plant Reprod. 2015, 28, 17–32. [Google Scholar] [CrossRef] [PubMed]
  61. Ruan, Y.-L. Sucrose metabolism: Gateway to diverse carbon use and sugar signaling. Annu. Rev. Plant Biol. 2014, 65, 33–67. [Google Scholar] [CrossRef] [PubMed]
  62. Ruan, Y.-L.; Patrick, J.W.; Bouzayen, M.; Osorio, S.; Fernie, A.R. Molecular regulation of seed and fruit set. Trends Plant Sci. 2012, 17, 656–665. [Google Scholar] [CrossRef] [PubMed]
  63. Jiang, H.; Guo, D.; Liu, Y.; Zhu, L.; Xie, F.; Xie, L. RNA-Seq combined with population-level analysis reveals important candidate genes related to seed size in flax (Linum usitatissimum L.). Front. Plant Sci. 2022, 13, 1015399. [Google Scholar] [CrossRef]
  64. Li, M.; Dong, X.; Peng, J.; Xu, W.; Ren, R.; Liu, J.; Cao, F.; Liu, Z. De novo transcriptome sequencing and gene expression analysis reveal potential mechanisms of seed abortion in dove tree (Davidia involucrata Baill.). BMC Plant Biol. 2016, 16, 82. [Google Scholar] [CrossRef]
  65. Jafari, M.; Shiran, B.; Rabiei, G.; Ravash, R.; Sayed Tabatabaei, B.E.; Martínez-García, P.J.; Martínez-Gómez, P. Identification of genes associated with kernel size in almond [Prunus dulcis (Mill.) DA Webb] using RNA-Seq. Plant Growth Regul. 2022, 97, 357–373. [Google Scholar] [CrossRef]
  66. Gray, J.; Caparrós-Ruiz, D.; Grotewold, E. Grass phenylpropanoids: Regulate before using! Plant Sci. 2012, 184, 112–120. [Google Scholar] [CrossRef] [PubMed]
  67. Le Roy, J.; Huss, B.; Creach, A.; Hawkins, S.; Neutelings, G. Glycosylation is a major regulator of phenylpropanoid availability and biological activity in plants. Front. Plant Sci. 2016, 7, 202190. [Google Scholar] [CrossRef] [PubMed]
  68. Zhao, Q. Lignification: Flexibility, biosynthesis and regulation. Trends Plant Sci. 2016, 21, 713–721. [Google Scholar] [CrossRef] [PubMed]
  69. Treutter, D. Significance of flavonoids in plant resistance: A review. Environ. Chem. Lett. 2006, 4, 147–157. [Google Scholar] [CrossRef]
  70. Cao, Y.; Li, K.; Li, Y.; Zhao, X.; Wang, L. MYB transcription factors as regulators of secondary metabolism in plants. Biology 2020, 9, 61. [Google Scholar] [CrossRef] [PubMed]
  71. Ma, R.; Xiao, Y.; Lv, Z.; Tan, H.; Chen, R.; Li, Q.; Chen, J.; Wang, Y.; Yin, J.; Zhang, L. AP2/ERF transcription factor, Ii049, positively regulates lignan biosynthesis in Isatis indigotica through activating salicylic acid signaling and lignan/lignin pathway genes. Front. Plant Sci. 2017, 8, 1361. [Google Scholar] [CrossRef] [PubMed]
  72. Zeng, J.k.; Li, X.; Xu, Q.; Chen, J.y.; Yin, X.r.; Ferguson, I.B.; Chen, K.s. Ej AP 2-1, an AP 2/ERF gene, is a novel regulator of fruit lignification induced by chilling injury, via interaction with Ej MYB transcription factors. Plant Biotechnol. J. 2015, 13, 1325–1334. [Google Scholar] [CrossRef] [PubMed]
  73. Tu, Y.; Rochfort, S.; Liu, Z.; Ran, Y.; Griffith, M.; Badenhorst, P.; Louie, G.V.; Bowman, M.E.; Smith, K.F.; Noel, J.P. Functional analyses of caffeic acid O-methyltransferase and cinnamoyl-CoA-reductase genes from perennial ryegrass (Lolium perenne). Plant Cell 2010, 22, 3357–3373. [Google Scholar] [CrossRef]
  74. Shigeto, J.; Tsutsumi, Y. Diverse functions and reactions of class III peroxidases. New Phytol. 2016, 209, 1395–1402. [Google Scholar] [CrossRef]
  75. Francoz, E.; Ranocha, P.; Nguyen-Kim, H.; Jamet, E.; Burlat, V.; Dunand, C. Roles of cell wall peroxidases in plant development. Phytochemistry 2015, 112, 15–21. [Google Scholar] [CrossRef]
  76. Andrews, J.; Malone, M.; Thompson, D.S.; Ho, L.; Burton, K. Peroxidase isozyme patterns in the skin of maturing tomato fruit. Plant Cell Environ. 2000, 23, 415–422. [Google Scholar] [CrossRef]
  77. Aydin, N.; Kadioglu, A. Changes in the chemical composition, polyphenol oxidase and peroxidase activities during development and ripening of medlar fruits (Mespilus germanica L.). Bulg. J. Plant Physiol 2001, 27, 85–92. [Google Scholar]
  78. Lee, Y.; Rubio, M.C.; Alassimone, J.; Geldner, N. A mechanism for localized lignin deposition in the endodermis. Cell 2013, 153, 402–412. [Google Scholar] [CrossRef] [PubMed]
Figure 1. Comparison of wild-type and Keumsura1ho seeds. (a) Allelic discrimination plots in Keumsura1ho and control analyzed by TaqMan using the single nucleotide polymorphism genotyping method. Blue and orange indicate control and Keumsura1ho, respectively (b) The seed phenotype of wild-type (control) and Keumsura1ho of Quercus acutissima. Bar = 1 cm. (c) Glucose content. (d) Fructose content. (e) Sucrose content. (f) Starch content. Different lowercase letters indicate statistically significant differences (one-way ANOVA with Duncan, p < 0.05).
Horticulturae 10 00829 g001
Figure 2. Differential gene expression analysis between Keumsura1ho and control. Volcano plots showing the gene expression differences among experiment and controls. The FPKM-normalized transcript count data sets were analyzed. The x-axis shows the log-ratio (gene expression fold change after challenge) and the y-axis shows the probability for each gene of being differentially expressed. (a) Sample comparison (1Y_K vs. 1Y_C). Black color indicates the genes with p-value less than 0.05 and log2foldchange between 1 and −1. (b) Sample comparison (2Y_K vs 2Y_C). (c) The number of differentially expressed genes (DEGs) in Keumsura1ho compared to control at different development stages. The symbols 1Y and 2Y represent one-year-old and two-year-old seeds, respectively. K and C indicate Keumsura1ho and control.
Horticulturae 10 00829 g002
Figure 3. The number of differentially expressed transcription factors. (A) Keumsura1ho compared to control in one-year-old seed and (B) Keumsura1ho compared to control in two-year-old seed. Red and blue colors represent up- and downregulated transcription factors, respectively.
Horticulturae 10 00829 g003
Figure 4. Heatmap of upregulated genes related to phenylpropanoid biosynthesis in Keumsura1ho seeds compared to control. The symbols 1Y and 2Y represent one-year-old and two-year-old seed, respectively. K and C indicate Keumsura1ho and control, respectively. Heatmap colors indicate the Z-scores of TMM-normalized TPM values. Red and blue colors indicate a higher and lower expression of the gene, respectively.
Horticulturae 10 00829 g004
Figure 5. Pathway view of phenylpropanoid biosynthesis. Keumsura1ho compared to control two-year-old seeds. Red and blue colors indicate a higher and lower expression of the gene, respectively. Arrow and circle indicate the pathway flow.
Horticulturae 10 00829 g005
Figure 6. Validation of RNA-seq results by comparing qPCR results in one-year-old and two-year-old seeds of Keumsura1ho compared to control. Black dot indicate the log2foldchagne value.
Horticulturae 10 00829 g006
Table 1. Comparison of seed weight and size (height, width, and length) between Control and Keumsura1ho varieties of Quercus acutissima.
SampleNumber of Measured SeedsAverage Seed Weight (g)Seed Height (mm)Seed Width
(mm)
Seed Length (mm)
Control Oak3003.5 ± 0.0420.16 ± 0.0916.53 ± 0.0716.50 ± 0.75
Keumsura1ho5627.8 ± 0.0423.93 ± 0.0522.05 ± 0.4222.08 ± 0.04
Table 2. Kyoto Encyclopedia of Genes and Genomes pathway analysis of upregulated differentially expressed genes in Keumsura1ho compared to control at different development stages.
ComparisonGO-TermGene NumberRich Factor (%)False Discovery Rate
1Y_K vs 1Y_CMonoterpenoid biosynthesis40.920.014
1Y_K vs 1Y_CBiosynthesis of secondary metabolites388.780.022
1Y_K vs 1Y_CBiosynthesis of various plant secondary metabolites71.620.035
2Y_K vs 2Y_CPhenylpropanoid biosynthesis101.920.011
1Y and 2Y represent one-year-old and two-year-old seeds, respectively. K and C indicate Keumsura1ho and control.
Disclaimer/Publisher’s Note: The statements, opinions and data contained in all publications are solely those of the individual author(s) and contributor(s) and not of MDPI and/or the editor(s). MDPI and/or the editor(s) disclaim responsibility for any injury to people or property resulting from any ideas, methods, instructions or products referred to in the content.

