Abstract
The importance of implementing recirculating drainage for greenhouse strawberries is often overlooked because of the low electrical conductivity (EC) of drainage and transpiration despite the large area of cultivation in Korea. In this study, we analyzed the growth of strawberry crops and their water and individual nutrient use efficiency when using closed-loop hydroponics in greenhouses. The study consisted of two parts: Experiment (Exp) 1 and Exp 2, each of which employed a different closed-loop hydroponic control method. In Exp 1, the system was controlled solely based on the EC of the drainage mixed with raw water. In Exp 2, the nutrient solution (NS) was corrected according to the ion concentrations in the drainage, with correction intervals of 2 weeks, 4 weeks, and no correction, while the control treatment was open-loop. In Exp 1, a prolonged increase in drainage EC resulted in an imbalance in NS ion composition and reduced fruit yield. In Exp 2, the NS composition was stabilized through periodic nutrient correction, and the fruit yield of the closed-loop treatments did not differ from the open-loop treatment. However, the closed-loop with 2- and 4-week correction in Exp 2 showed 94% and 88% higher nutrient use efficiency (NUE), respectively, than an open-loop system. Among the closed-loop treatments, the 2- and 4-week correction intervals had 36% and 32% higher NUE than the no-correction treatment. Furthermore, the 2-week correction interval showed a 3% improvement in NUE compared to the 4-week interval. These findings highlight the importance of considering a shorter ion correction interval for optimal NUE and normal plant growth in recirculating hydroponic systems of strawberry cultivation.
1. Introduction
In greenhouse horticulture, nutrient recirculation is crucial in addressing the growing global demand for freshwater and resource conservation by reducing fertilizer use. The introduction of soilless media in greenhouse cultivation provided an opportunity to transition to a closed-loop hydroponic system, as it allows for precise nutrient control and mitigates microbial risks by reducing the use cycle to one year. These systems could potentially increase water and fertilizer efficiencies by 20–30% compared to open-loop hydroponic systems that recycle drainage water [1]. Despite these advantages, most small-scale greenhouses continue to use open-loop hydroponic systems. This is mainly due to the instability of ion concentrations in the root zone, the risk of microbial contamination from recycled drainage nutrients, and the high cost of disinfection systems.
In Korea, open-loop hydroponic systems are commonly used for strawberry production, with most growers opting for drip irrigation on a mixed substrate of coir and perlite. The smaller greenhouse size of individual strawberry growers compared to tomatoes and peppers has contributed to low adoption of closed-loop hydroponics due to nutrient imbalances, microbial risks, as well as the cost of disinfection systems. The prevalence of closed-loop hydroponics in strawberry production remains scarce, although strawberries account for 15.3% of the proportion in greenhouse fruit vegetable production (5692 ha out of a total of 37,236 ha) [2]. Even if all greenhouse vegetables are included, closed-loop hydroponics currently account for only 5% of hydroponics in the Republic of Korea.
The main commercial strawberry variety in Korea is Seolhyang, a one-season flowering variety that requires low-temperature acclimatization to grow. Thus, strawberries have a relatively short cultivation period of approximately 8–9 months, from September to May [3]. This short cultivation period leads to fewer fluctuations in nutrient levels and a relatively low risk of microbial contamination in the substrate. This can be an advantage for strawberries in managing the risk of recirculation, but it can also be a disadvantage in terms of economics, as the disinfection system is not used all year round. Another feature is that strawberry nutrient solution (NS) has a low electrical conductivity (EC) range of approximately 1.0–1.3 dS m−1. Thus, the fertilizer savings from the recirculation are relatively small compared to tomatoes and sweet peppers. On the other hand, the low EC and nutrient requirement result in a gradual change in the EC of the substrate or drainage solution [4]. Thus, while the low EC dosage can be an advantage, poor source water quality can make it more difficult to provide a balanced supply of essential nutrients in a recirculating hydroponic system. Another problem with raw water quality is that strawberries are a salt-sensitive crop. Therefore, salt (Na+, Cl−) accumulation in closed-loop hydroponics could be linked to reduced strawberry growth and deficiencies in essential nutrients. The specificity of these locally grown varieties and crops demonstrates the need for empirical studies of closed-loop hydroponics.
In general, most growers perform periodic analyses of substrate and drainage EC or individual ions to maintain a consistent nutrient composition in the root zone by correcting individual ion concentrations in closed-loop systems [5]. EC-based control is a simple method used in semi-closed systems, where drainage solutions are discharged when they reach pre-set minimum or maximum thresholds for EC and saline ions (such as Na and Cl) [6]. However, EC-based control has shown a tendency to decrease root-zone ions, such as NO3−, P, and K, as cultivation progresses [7] due to increased crop water and fertilizer requirements [8]. Conversely, polyvalent ions, including Ca2+ and SO42−, tend to accumulate in the substrate [9]. Therefore, it is plausible that progressive changes in crop nutrient requirements during cultivation may lead to an accumulation of root-zone nutrient imbalances, potentially increasing the physiological disorders of fruits [10]. Therefore, it is crucial to periodically analyze the drainage ions for “zero-emission” closed-loop hydroponic systems to adjust the NS composition and prevent imbalances of individual ions in the growing substrate.
Several studies have been conducted to determine the optimal nutrient balance or ion uptake characteristics of strawberry [11,12,13], but recirculating hydroponics have drawn less attention. In both semi-closed and closed-loop hydroponic systems, the implementation of recirculation methods may necessitate minor alterations contingent on the properties of the plant type, cultivar, growth stage, and growing media. Coir-mixed substrate consists of a certain degree of NO3− and Na, which may result in differences in the initial root-zone nutrient composition. Therefore, this study was conducted to establish management practices for closed-loop hydroponics for strawberries in Korea. By conducting two different drainage recirculation methods, we analyzed nutrient balance in the root zone, crop growth, yield, and nutrient use efficiency according to each method. Based on these results, we aimed to determine management variables (drainage mixing EC, individual ion correction interval, etc.) for closed-loop hydroponics.
2. Materials and Methods
2.1. Closed-Loop Hydroponics Treatment of Experiments 1 and 2
In this study, two independent experiments, Experiment (Exp) 1 and Exp 2, were conducted to examine the changes in root-zone ion concentrations resulting from the implementation of closed-loop systems for strawberry cultivation. In Exp 1, the variations in ion concentrations within the root zone were evaluated under distinct drainage mixing EC levels without any initial correction in the initial nutrient solution (NS). While recirculating the drainage solution, we analyzed the composition of the nutrient and drainage solution in comparison to the initial NS and the resulting strawberry growth and fruit yield. The nutrient recirculation amount was, therefore, controlled solely based on the drain supply EC (set value of EC mixing raw water to the drainage solution) (Figure 1). The drain was once again mixed with NS from A and B tanks using a three-way valve and supplied with the pre-set EC value. The drainage was discharged if the capacity of the drainage tank was exceeded. The objective of the Exp 1 approach was to observe the long-term growth of plants and changes in underground ion composition without individually correcting for ion levels. Four treatments were performed, each with different drainage mixing EC levels (0.6, 0.9, and 1.2 dS m−1) and a total reuse treatment (All use). The first drainage mixing occurred on 3 November 2021, and the first ion analyses were conducted on 6 December 2021.
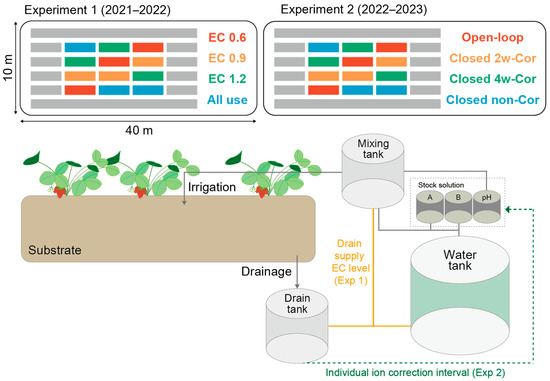
Figure 1.
Schematic diagram of closed-loop hydroponics system and experimental set-up. Closed 2w, 4w, no cor indicate closed-loop with 2-week, 4-week interval ion correction, and no correction treatments, respectively.
Exp 2 was conducted to explore an appropriate nutrient correction period by analyzing the root-zone ion balance based on different ion-correction intervals. Four treatments were performed in Exp 2: open-loop, closed-loop with 2-week correction, closed-loop with 4-week correction, and closed-loop without correction. The NS was replenished with any lacking standard nutrients in the mixed drain and raw water. The corrected NS was prepared using Savvas’s nutrient replenishment method [14]. Different correction periods of 2 weeks and 4 weeks were applied to analyze the effect of the ion correction period. To maintain nutrient stability in the substrate, in the 2-week correction treatment, when a new NS prescription was implemented after ion analysis, the first week was fed with the calibrated NS and the second week with the standard NS. Similarly, for the 4-week correction treatment, the first half used the corrected NS, and the second half used the standard NS (Figure 1). Yamazaki and PBG solutions were used as NSs in Exp 1 and 2, respectively (Table 1).

Table 1.
Ion composition of the nutrient solution in experiments 1 and 2 (Exp 1, 2).
The micronutrients were 30.00 Fe, 20.00 B, 15.00 Mn, 7.00 Zn, 0.75 Cu, and 0.50 Mo (μmol L−1) for both experiments. In Exp 2, ion correction (ICor) was performed using the following function:
where ICor = corrected ion composition, INS = ion composition of the NS; IDr = ion composition of the drainage solution; and IRW = ion composition of the raw water.
Corrected NS was applied to the 3 days after ion analysis. In all experiments, the drainage solutions were filtered through sand, and 50 mg L−1 of hydrogen peroxide was applied to the drainage tank for disinfection.
2.2. Preparation of Water Source
In Exp 1, groundwater was used as the source water without purification (Table 1). The results of Exp 1 showed that the salt concentration of groundwater was too high in the substrate. In Exp 2, to exclude the influence of raw water in the recirculation system and purify the groundwater, we used a membrane filter (WRO-T10, Waternix Inc., Busan, Republic of Korea) with an EC of 0.01 dS m−1 (Table 1). In Exp 1, the raw water quality of the groundwater was measured twice at three-month intervals. The results showed that the EC was 0.5 and 0.43 dS m−1, respectively, and contained several ions. Although the nutrient concentrations were not higher than those in the NS composition, the Na concentration was found to be 1.30 and 1.23 mmol L−1 in the two measurements (Table 1).
2.3. Plant Materials and Growth Conditions
Strawberry plants (Fragaria × ananassa, cv. Seolhyang) were transplanted on 14 September 2021 and 16 September 2022 for Exp 1 and 2, respectively. The experiments were conducted in a plastic-covered greenhouse at the Protected Horticulture Research Institute, Haman, Republic of Korea (35.2° N 128.4° E). The greenhouse had a floor area of 400 m2 (40 × 10 m (L, W)) and a planting density of 23 plant/m2 (Figure S1A). A total of 1920 plants were grown, with 12 sectors utilized for growth analysis and ion sampling with the exclusion of the outside position in the greenhouse to consider the non-uniformity of light distribution (Figure 1). The substrate comprised a mixed substrate with a volume of 49.9% coconut coir, 35% perlite, 10% peat moss, 5% zeolite, 0.1% nutrients, pH buffer, and humectant (Greenfarm, Nongwoo Bio Co., Ltd., Suwon, Gyeonggi-do, Republic of Korea). The temperature in the greenhouse was set to 25 °C during the day and 8 °C during the night; however, due to seasonal weather changes, the minimum and maximum temperatures fluctuated between 5 °C and 37 °C. Exp 1 and 2 ended on 15 April 2022 and 29 March 2023, respectively.
Environmental data were recorded every 10 min using a CR1000 data logger (Campbell Scientific, Logan, UT, USA). The substrate was mulched with black plastic, and an irrigation pipe was placed in the center of the growing bed (Figure S1B). The nutrient solution (NS) was supplied to the plants six times per day at a rate of 33 mL/plant using a drip irrigation system. As growth progressed, the leaf area increased, and the amount of irrigation per unit time was set to 50 mL/plant. The first irrigation was conducted 1 h after sunrise, and the last irrigation was conducted 2 h before sunset. The supply EC and pH of the NS were 1.2 dS m−1 and 6.0, respectively. The irrigation amount was adjusted to maintain drainage at 30%–40% of the water supply. The hydroponic cultivation system included supply, drainage, water, and NS tanks. Solutions A and B were mixed with raw water and supplied using a three-way valve control system with an EC meter. To collect the drainage solution, we installed a hanging gutter hydroponic system. A plastic sheet was installed on the bottom of the gutter to collect the drainage solution, and the collected drainage was designed to be moved to the back side of the greenhouse due to the difference in height of the drainage pipe (Figure S1C). Three plastic beakers were installed for each treatment for sampling drainage EC, pH analysis, and ion sampling, and the beakers were emptied daily after measuring the drainage level. EC and pH were measured with a portable EC and pH meter (HI9814N, Hanna Instruments, Smithfield, RI, USA) after the last drainage was collected at 4 pm for uniformity of the measurement.
2.4. Root-Zone Ion Component Analysis and Solution Sampling
All ion analyses were performed in the same manner as in Exp 1 and 2. Supply and drainage ion concentrations were measured weekly. Measurements were conducted for EC, pH, and all individual root-zone ions: NH4+-N, NO3−-N, P, K, Ca, Mg, S, Cl, Na, HCO3, Fe, Mn, B, Zn, Cu, and Mo. As the concentration of the supplied NS was stable, only one repetition was conducted for the supplied NS per treatment. The anions NO3−-N, S, P, and Cl were analyzed using standard ion chromatography (IC) curves with 0, 5, 10, 20, and 40 ppm solutions. The sample and regeneration solutions were subjected to IC–mass spectrometry (MS) (ICS-5000, Dionex, Sunnyvale, CA, USA), and the baseline was stabilized (ICS-5000, Dionex) at a flow rate of 0.7 mL min−1. The drainage solution was collected thrice per treatment at different locations on each treatment. The concentrations of metallic cations and microelements were quantified using inductively coupled plasma MS (ICP-MS; NexION 5000 Multi-Quadrupole, PerkinElmer, Waltham, MA, USA). For NH4+-N, 50 mL of a 2% boric acid solution was taken from the sample solution and connected to a collecting device. Subsequently, 25–50 mL of the blank solution was added to a Kjeldahl flask, and distilled water was added to achieve a total volume of 250~300 mL. After adding three to four drops of phenolphthalein solution, 50% NaOH or MgO was added until the colorless solution turned red. The solution was then transferred to a nitrogen evaporator and distilled. The quantification of NO3−-N was conducted via Kjeldahl (T-N) analysis, whereby a specific quantity was extracted from the blank solution to be decomposed in the NH4+-N analysis in a Kjeldahl flask and distilled into a Devarda alloy (1–2 g) [15]. All the reagents required for ion analysis were ordered from Sigma-Aldrich (St. Louis, MO, USA).
2.5. Analyses of Plant Growth, Yield, and Fruit Quality
Monthly analyses were conducted to assess the growth of the crops, including stem length, petiole length, leaf length, leaf width, and leaf number. Fruit yields were recorded during each harvest, and fruits were classified as marketable if they weighed ≥ 12 g and non-marketable if they weighed < 12 g or were deformed. Ten plants were selected from each treatment plot to examine fruit quality. Fruit quality analysis was conducted to determine fruit weight, length, width, firmness, and total soluble sugar (TSS) within eight hours of harvest. The quality analysis was performed once per week, but sometimes twice if the fruit ripened quickly and had to be harvested. Twenty plants were selected per treatment and examined in three replicates. Fruit weight and length/width were measured using weighing scales and Vernier calipers, respectively, and the TSS content was determined using a portable reflectometer (PAL-1, ATAGO Co., Ltd., Tokyo, Japan).
2.6. Calculation of Water and Nutrient Use Efficiency
Irrigation and drainage amounts were monitored daily via beakers placed under the cultivation bed, and water use efficiency (WUEyield) was calculated as kg fruit yield/L by dividing the total water use by the fruit yield per treatment. Nutrient use was recorded each time by supplying the fertilizer in the NS tank, and nutrient use efficiency (NUEyield) was calculated as kg fruit yield/kg nutrient by dividing the amount (kg) of nutrients used by the fruit yield per treatment.
2.7. Statistical Analyses
In the experimental setting, each treatment area was placed in the north–south direction without dividing the blocks to minimize light variation between treatments (Figure 1). Mean comparisons were performed using one-way ANOVA, and post-hoc testing was conducted using Tukey’s method. All statistical analyses were conducted using the Scipy Python package (1.10.1). The pandas (1.5.3) and matplotlib (3.6.0) packages were used for data handling and visualization.
3. Results
3.1. Quality of Raw Water in Exp 1 and 2
As Na and Cl are not taken up by plants, to exclude the accumulation of Na and Cl in the substrate and the resulting nutrient imbalance, raw water was purified and used in Exp 2. As a result, most ions were not detected except for S and Cl (Table 1).
3.2. EC and pH Changes during Cultivation in Exp 1 and 2
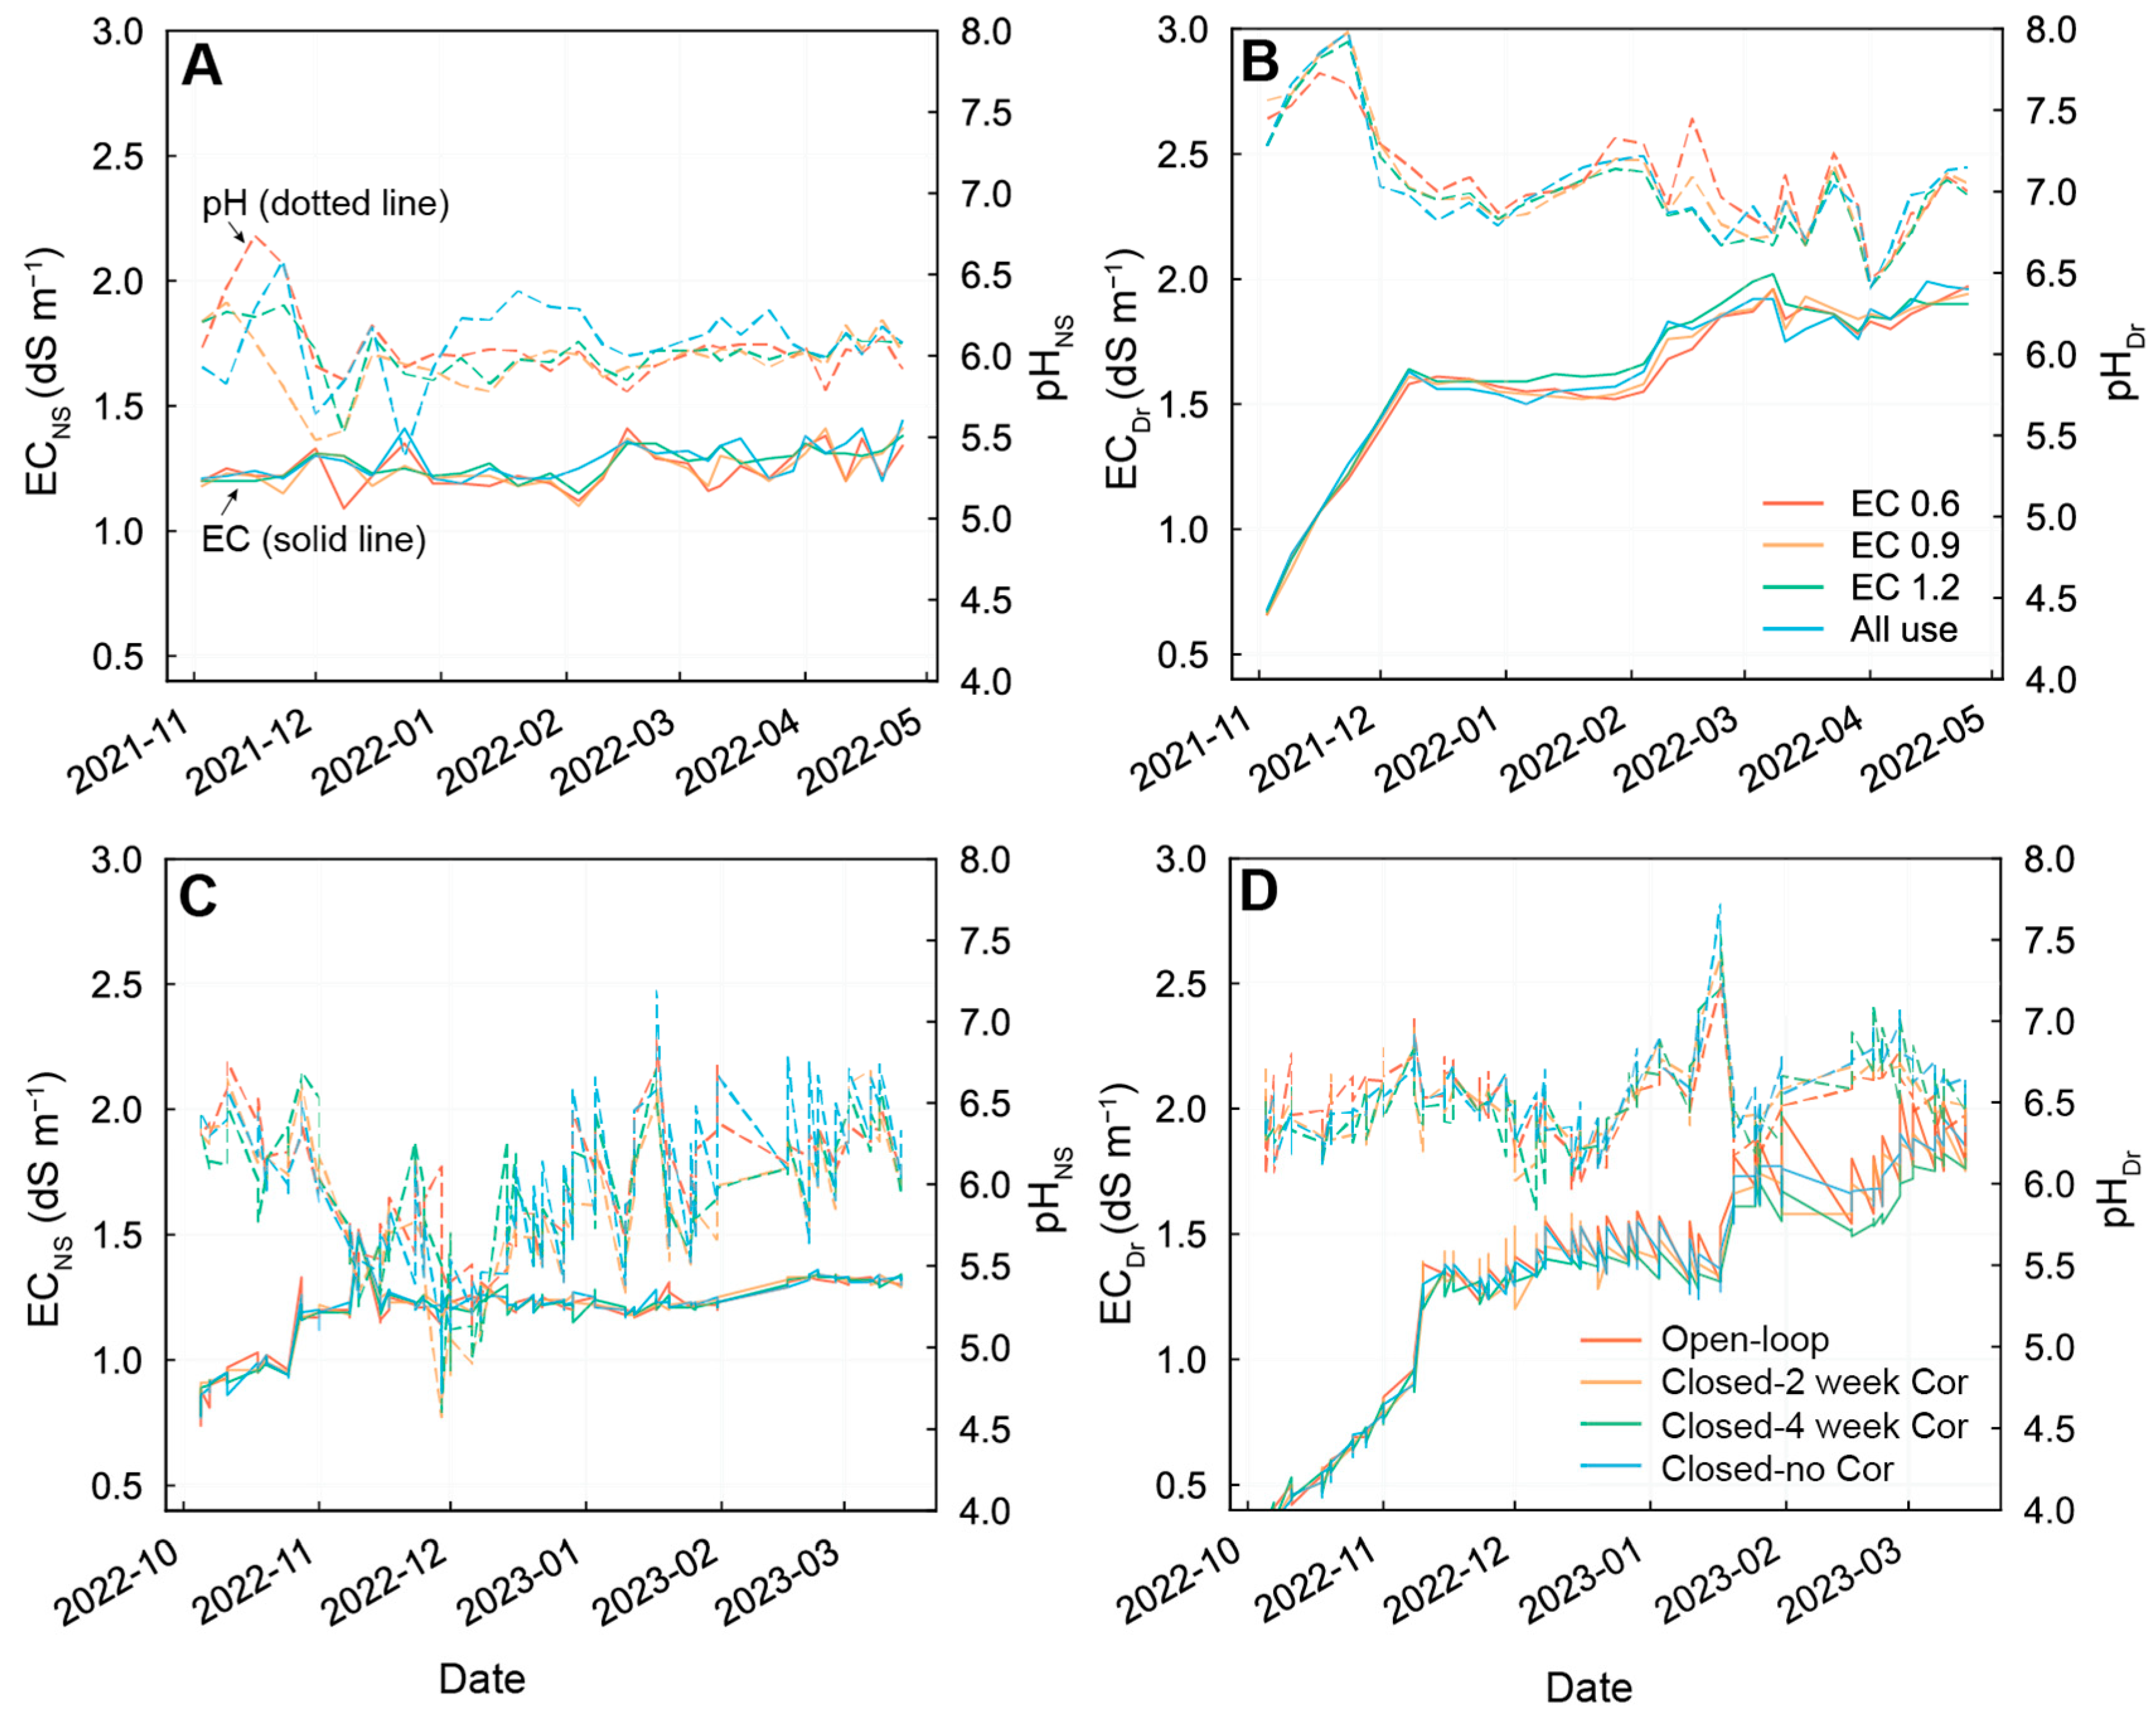
Overall, EC and pH patterns were similar in all treatments in Exp 1 and 2. The EC of NS in both Exp 1 and 2 was consistently controlled (1.0–1.3 dS cm−1) (Figure 2A,C). The drainage EC in Exp 1 started at 0.6 and remained around 1.5 until February, and finally, the drainage EC peaked at approximately 2.0 dS cm−1 (Figure 2B). In Exp 2, the drainage EC was initially 0.4, with values of about 1.25 in the middle of January and finally 1.7 ds cm−1 (Figure 2D). The initial pH of the NS, starting at approximately 6.5, showed a gradual decline and stabilized around 6.0. In Exp 1, the NS pH in the all-use treatment exhibited a marginally elevated value compared with the other treatments (Figure 2A). The mean pH values of the DS were 7.0 in Exp 1 and 6.6 in Exp 2 (Figure 2B,D). EC and pH were discharged from the nutrient supply system at the set values, so there were slight but not significant differences between treatments.
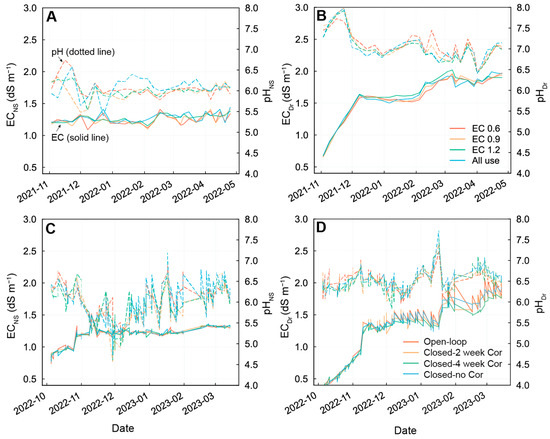
Figure 2.
EC, pH changes of nutrient solution (NS), and drainage (Dr) during the cultivation for experiment 1 (A,B) and experiment 2 (C,D). Left and right axes indicate EC and pH and share the same ticks in all figures. Solid and dotted lines indicate EC and pH, respectively.
3.3. Ion Balance of NSs in Exp 1 and 2
The equilibrium of cations and anions in the NS was analyzed by dividing the cultivation period into initial, intermediate, and final periods.
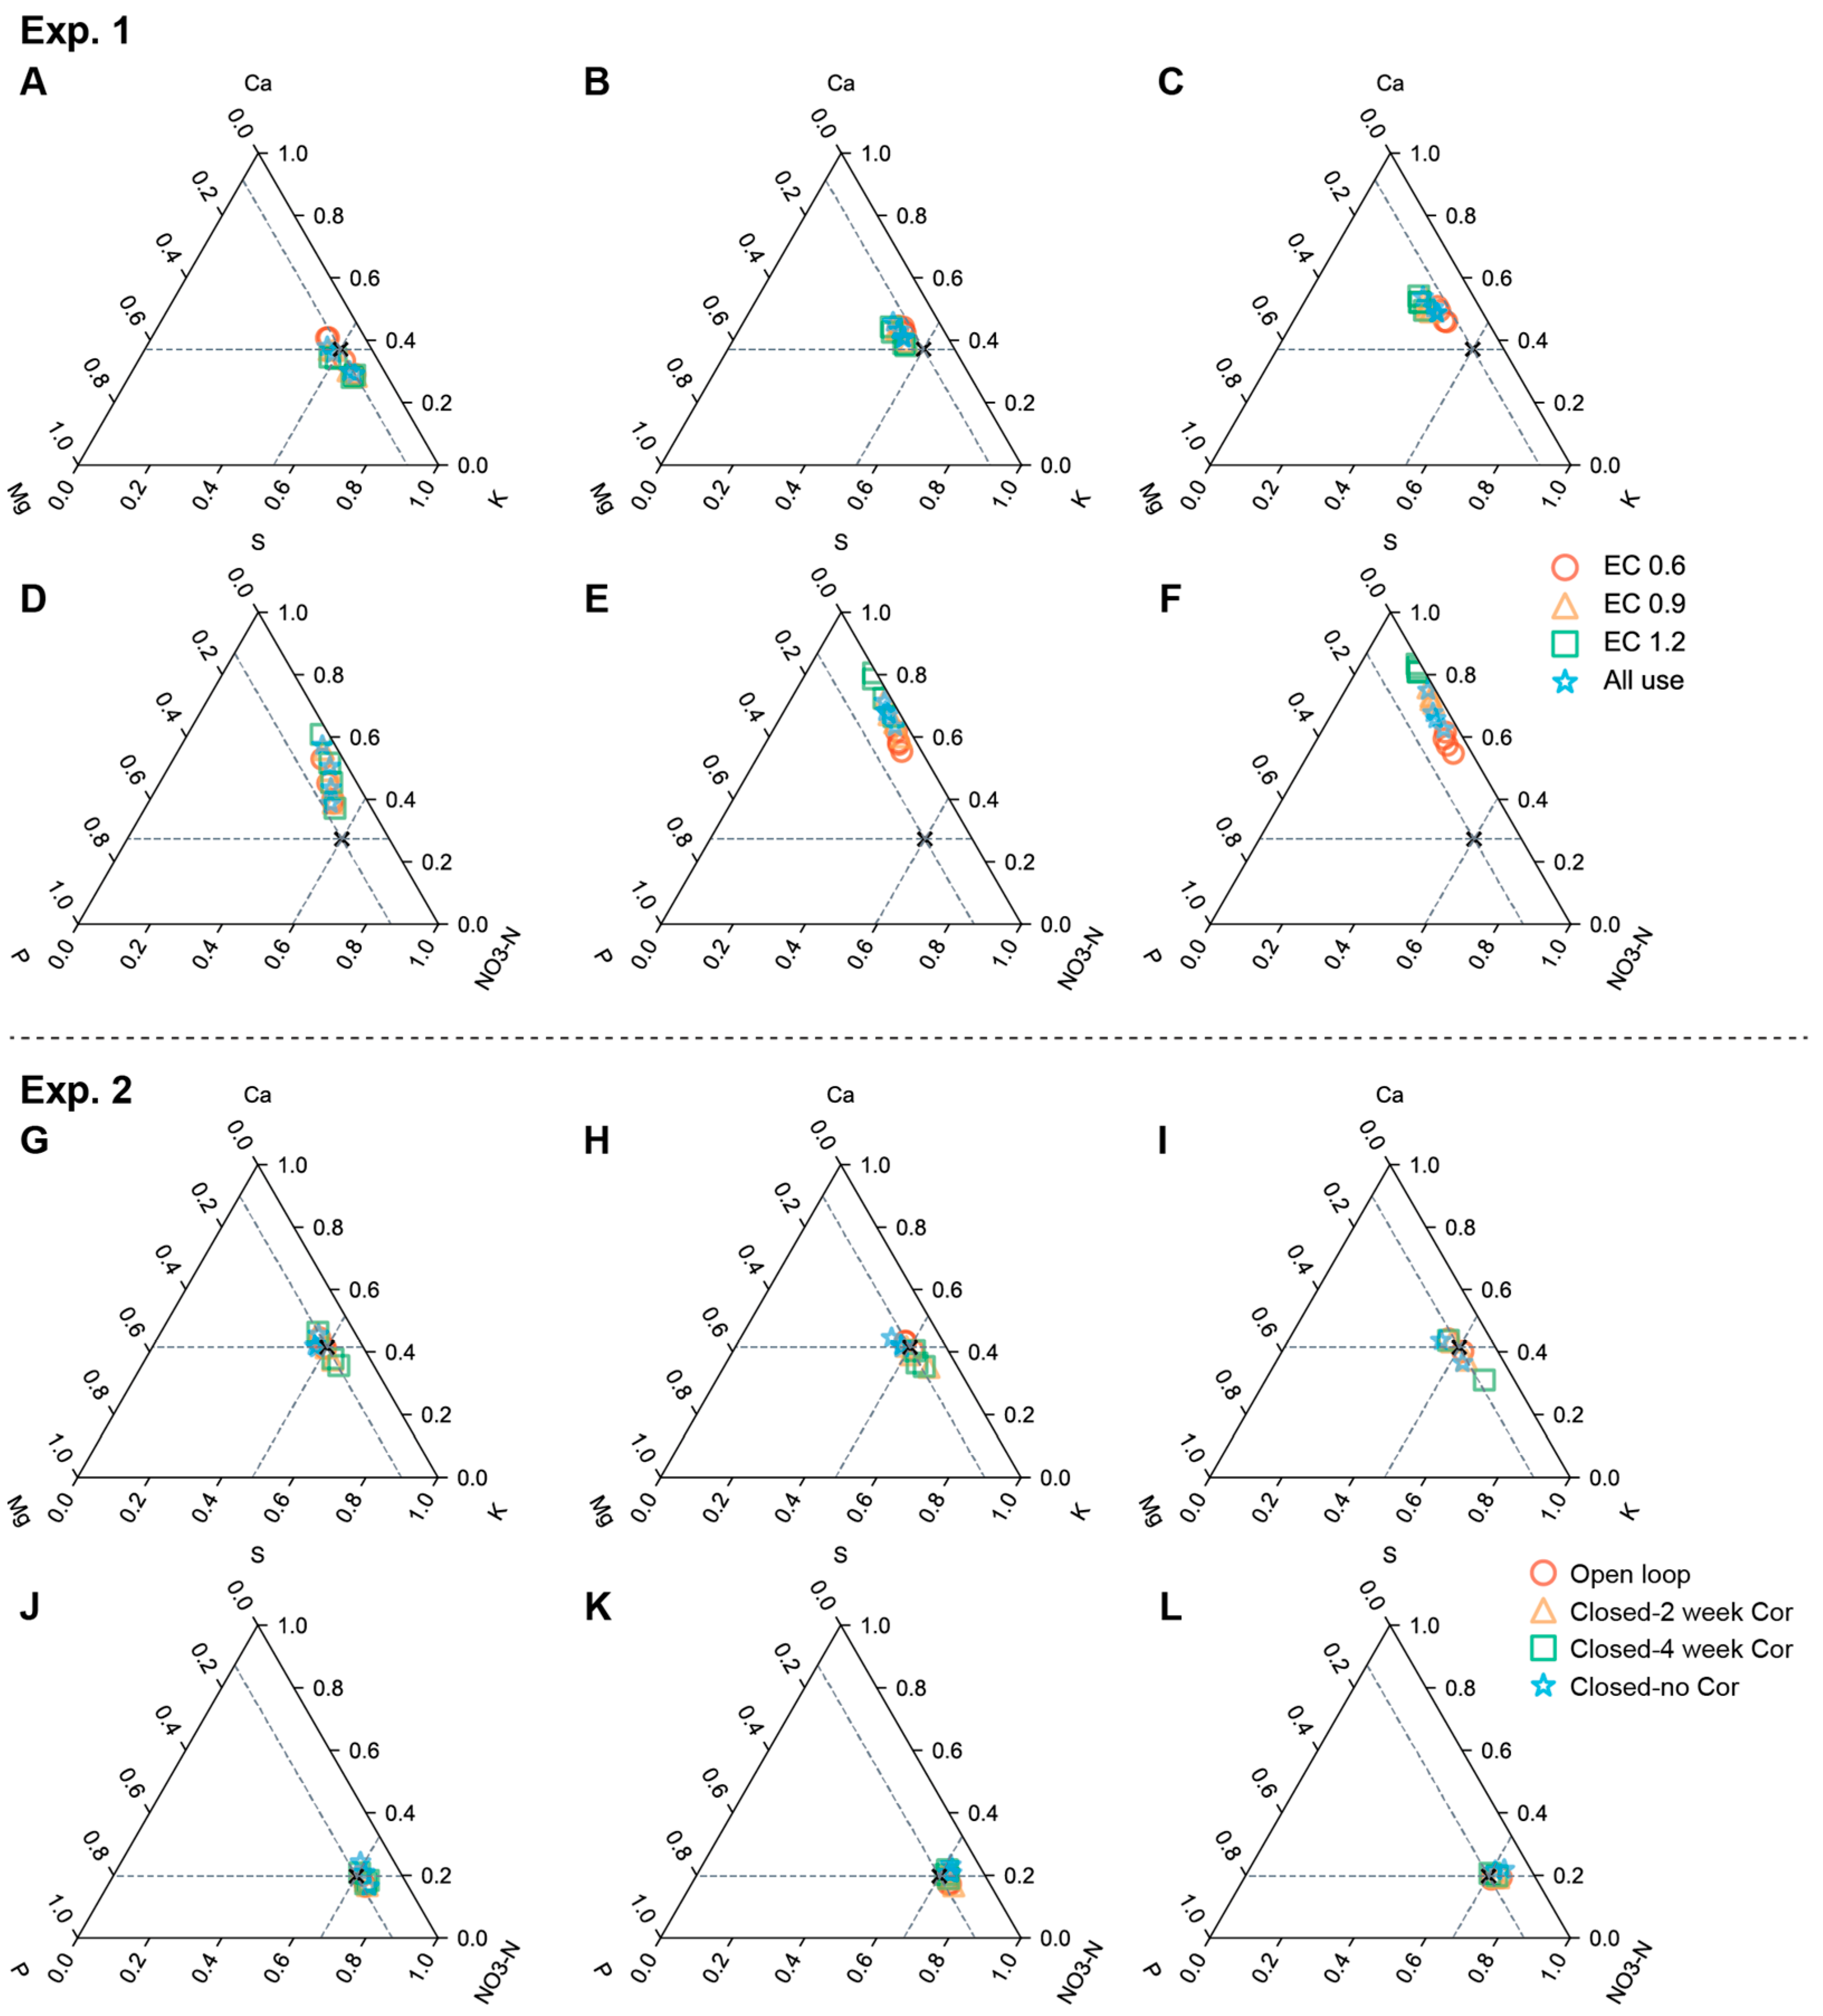
In Exp 1, the cation composition of the NS shifted towards a deficiency of K as the cultivation progressed (Figure 3A–C). Changes in Ca, Mg, and K over time (Figure S2) suggested that the K deficiency was due to an increase in Na in the NS. The anion composition of the NS rapidly shifted towards an accumulation of S and Cl and a deficiency of NO3−-N and P (Figure 3D–F). NH4+-N was found to be depleted more rapidly from the recirculation than NO3−-N (Figure S2). In the early stage, discrepancies to the initial NS were approximately 12% in NO3−-N for the EC 0.6 treatment and 15% for the other treatments. In other words, the nutrient imbalance was not as great in the initial period. However, during the middle and late stages, the EC 0.9, 1.2, and all-use treatment groups displayed depletion ranging from 31% to a maximum of 50% to the initial NS. In contrast, the EC 0.6 treatment group consistently maintained a deficiency of approximately 24% throughout the middle and late stages. Among the cations, only K exhibited a larger depletion of 14% in the EC 0.6 treatment, whereas a deficit of 18%–22% was observed in the other treatments in the late stage. The ion analysis of Exp 1 showed that monovalent ions of N, P, and K develop deficiencies in strawberries more rapidly than Ca, Mg, and S. S could accumulate in the NS because of the low uptake from the plant. In contrast to Exp 1, we continued to perform nutrient calibration in Exp 2, which resulted in all cations and anions maintaining a difference of <7% between target NS compositions, indicating a relatively balanced equilibrium in Exp 2 (Figure 3G–L).
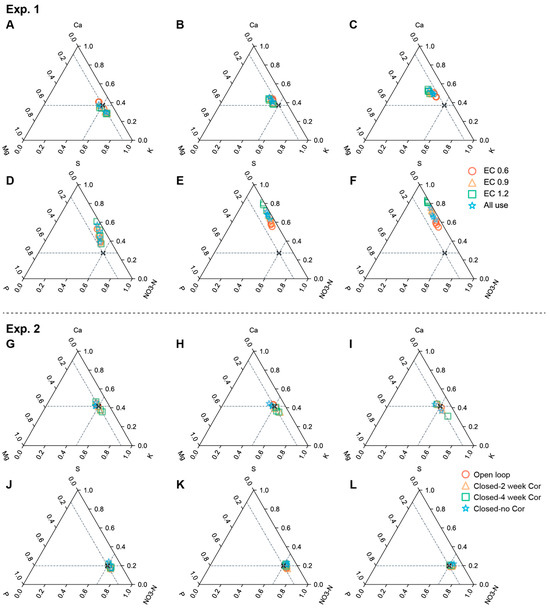
Figure 3.
Ion balance of the nutrient solution for cations (A–C,G–I) and anions (D–F,J–L) during Experiment 1 and 2 (Exp. 1, 2). x symbol and dotted line indicate ion composition of reference nutrient solution. Panels (A,D,G,J) show the ion balance for the initial period, while panels (B,E,H,K), and (C,F,I,L) show the ion balance for intermediate and final period, respectively. Each dot represents the ion analysis results every 2 weeks.
Interestingly, even the closed-loop non-Adj processing, which does not handle correction, maintained a nearly constant nutrient equilibrium with few deficiencies in P and K (Figure 3 and Figure S1). This suggests that there is no appreciable variation in nutrient solution and plant uptake. Therefore, the nutrient imbalance in Exp 1 suggests that the nutrient composition imbalance caused by the quality of Na and Cl in the raw water would have had a greater impact on the ion balance in the root zone.
3.4. Drainage Ion Changes during Cultivation in Exp 1 and 2
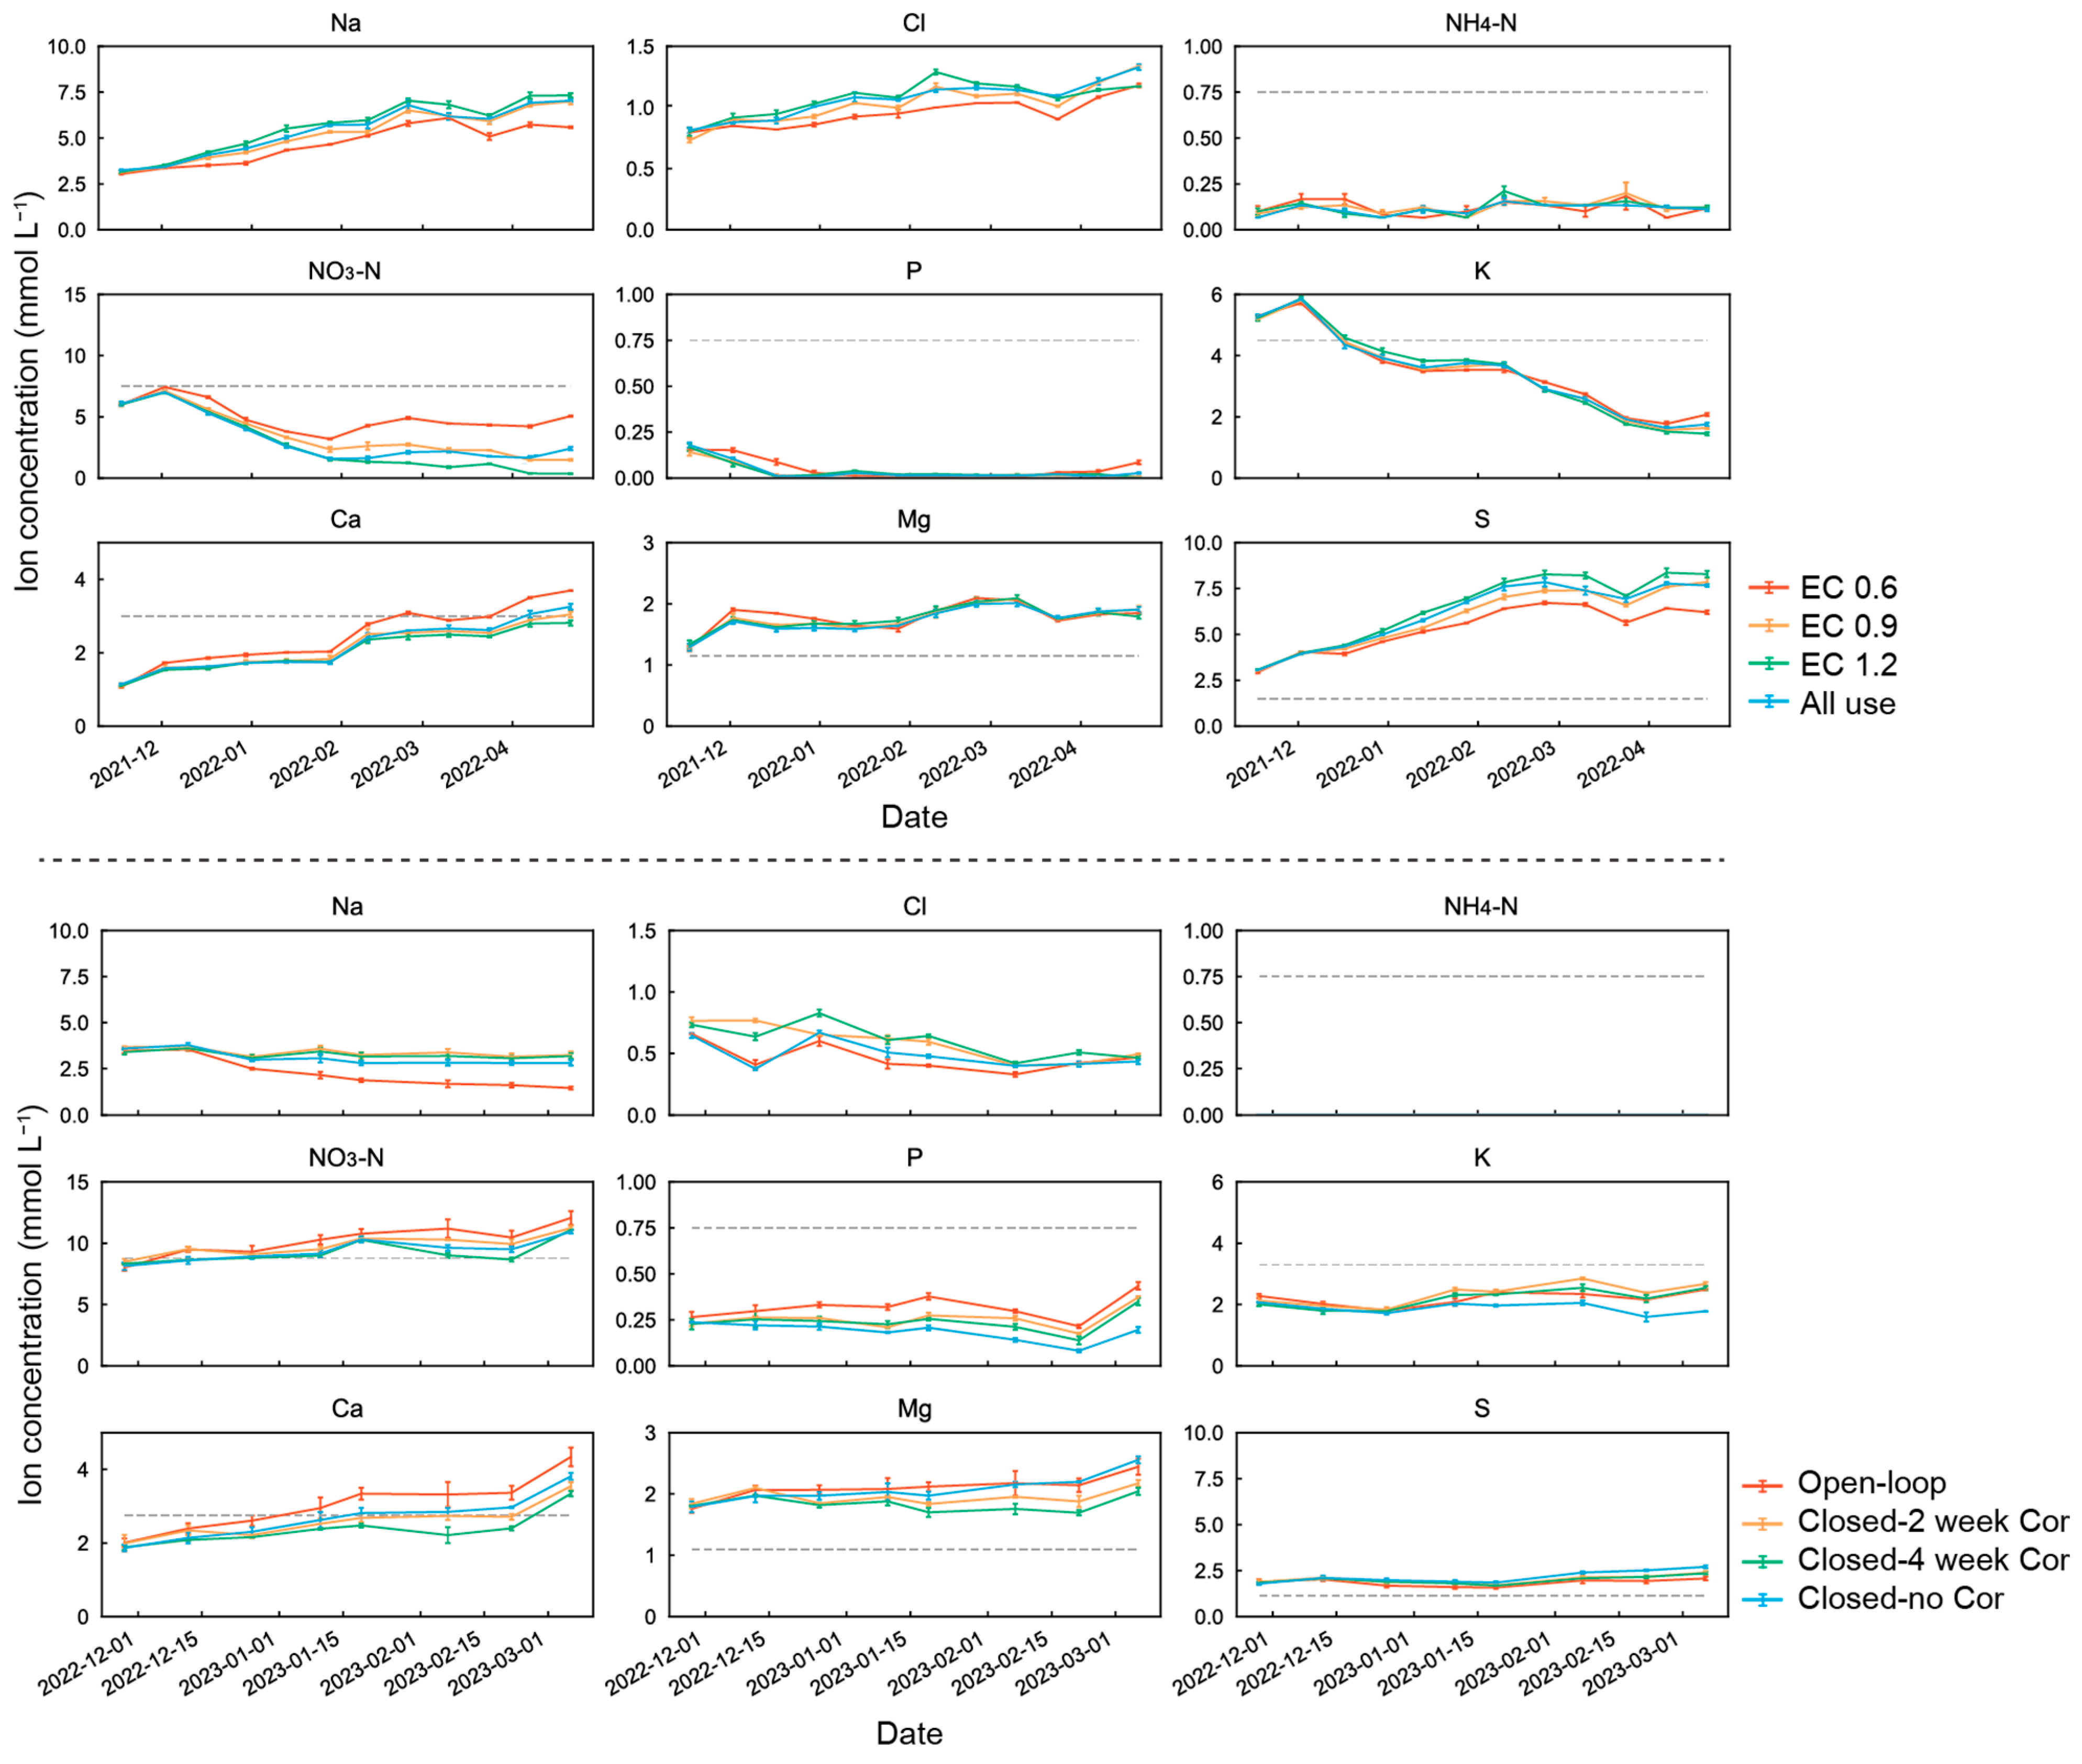
Since the drainage was mixed with the NS for recirculation, the NS had a similar trend, and the ion composition of the drainage changed almost identically (Figure 4 and Figure S1). However, since the drainage is the NS after passing through the substrate, the pattern of ions taken up by the plant was clearly visible.
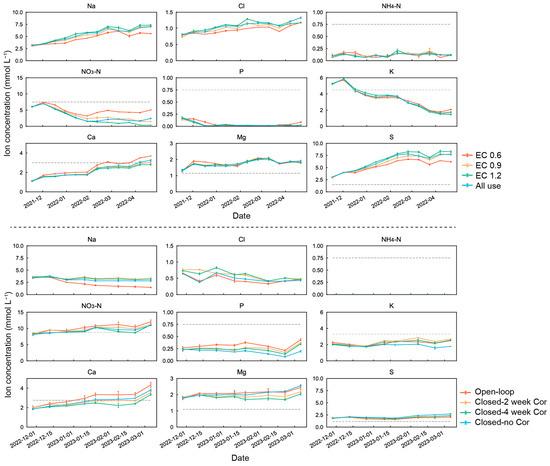
Figure 4.
All major ion concentrations of drainage solution during cultivation period. The nine figures above and below indicate experiments 1 and 2, respectively. Vertical bars denote ± standard deviation of means (n = 3). The gray dotted lines in each figure box indicate the initial target concentration of the nutrient solution.
In Exp 1, there was a gradual accumulation of Na and Cl over the cultivation period (Figure 4). In Exp 2, because of the raw water used after reverse osmosis filtering, the levels of Na and Cl remained constant (Figure 4). Moreover, the open-loop in Exp 2 showed a lower accumulation of Na than the three closed-loop treatments, with consistent Na ion levels between 2.5 and 3.5 mmol L−1 in the remaining treatments. This may be due to the decrease in Na eluting from the surface of the coir substrate used in the experiment, as it is increasingly replaced by Ca. In Exp 1, the imbalance of NO3−-N, P, K, and S ions was amplified with drainage reuse. NO3−-N, Ca, S, and EC 0.6 treatment, which used lower mixed EC drainage, diverged relatively less from the ion composition of the NS compared to the EC 0.9, 1.2, and all-use treatments (Figure 4). Notably, the accumulation of S showed a significant disparity, starting from 2.5 mmol L−1 initially and escalating to 7.5 mmol L−1 by the end of the cultivation. In Exp 2, no specific accumulation of macronutrient ions was observed in all three closed-loop treatments, including the collection treatments of 2 and 4 weeks and the non-correction treatment. Throughout the growing season, the drainage consistently had lower levels of NH4+-N, P, and K compared to the NS, whereas S and Mg levels were higher in the drainage. Moreover, NO3−-N, P, and K were higher in the drainage compared to the 2-week and 4-week correction treatments in the closed-loop treatment (Figure 4). There are no differences between the correction and non-correction treatments, maybe because the strawberries had a suitable initial NS composition and were well grown with no noticeable physiological disorder during cultivation.
3.5. Strawberry Fruit Yield and Quality
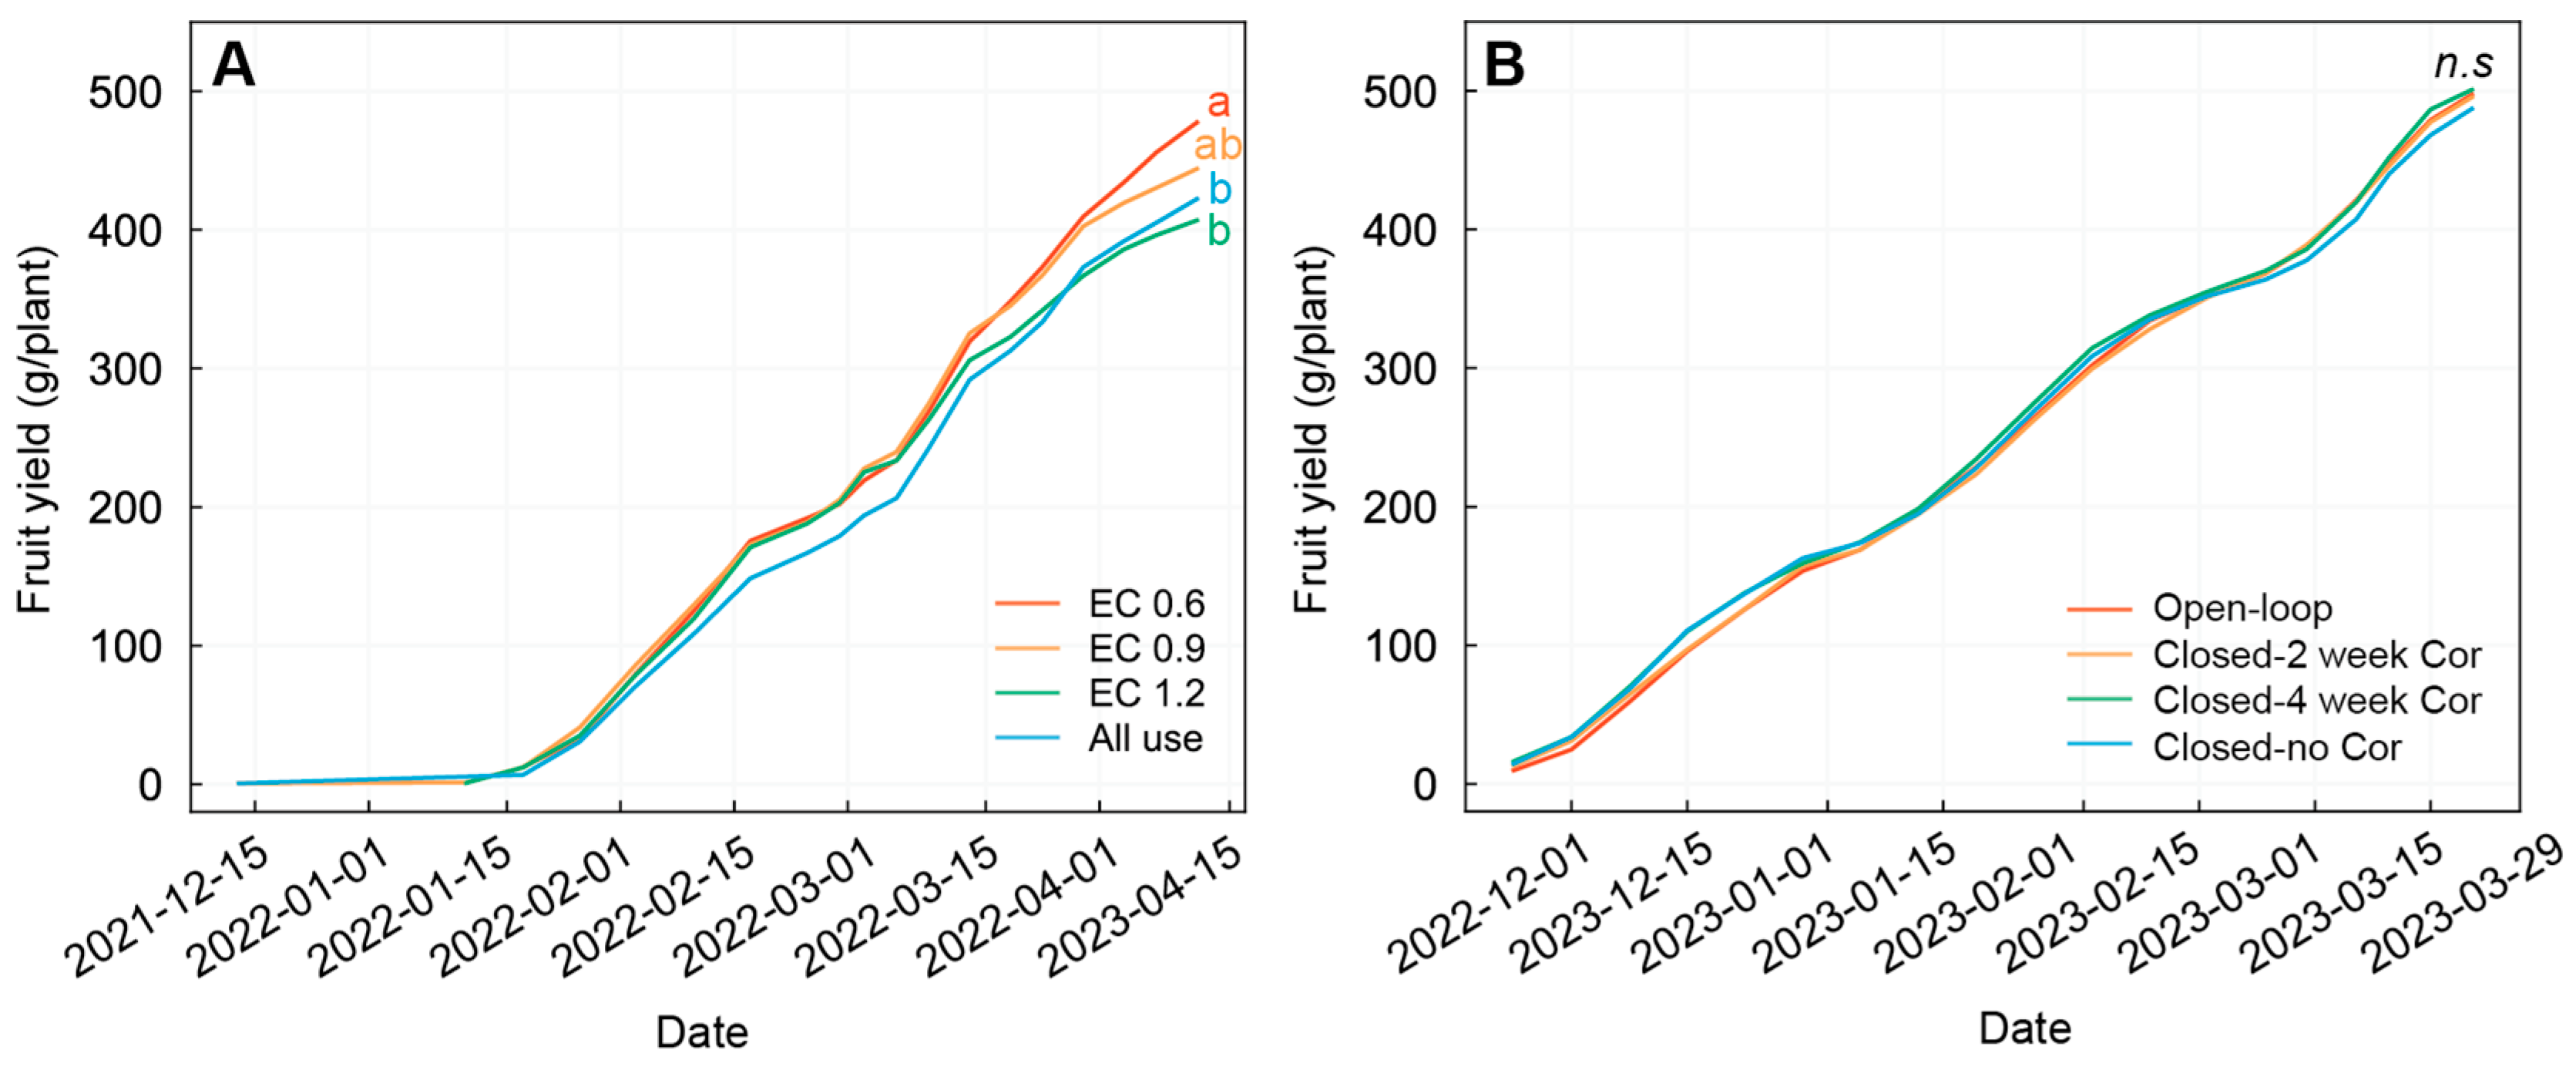
A higher fruit yield was observed in the EC 0.6 treatment than in the EC 1.2 and all-use treatments in Exp 1 (Figure 5A and Table 2). These results show that there may be a slight reduction in crop yield due to nutrient imbalance when All NS was reused without correction to individual ions. There is no significant difference in yield in Exp 2 (Figure 5B). In both Exp 1 and 2, fruit quality indices, including individual fruit weight, length, width, firmness, and TSS content, were not significantly different among treatments.
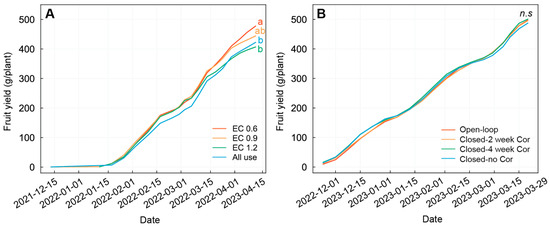
Figure 5.
Accumulated fruit yield during cultivation period in experiment 1 (A) and 2 (B). Different letters a and b in Figure A indicate significant difference between the treatments, “n.s” indicates not significant (p > 0.05). Different letters in the figure indicate significant differences between treatments according to Tukey’s HSD test (p < 0.05, n = 30).
Table 2.
Fruit yield and quality of strawberries grown under different hydroponic treatments.
3.6. Accumulated Water and Nutrient Use Based on Closed-Loop Hydroponics
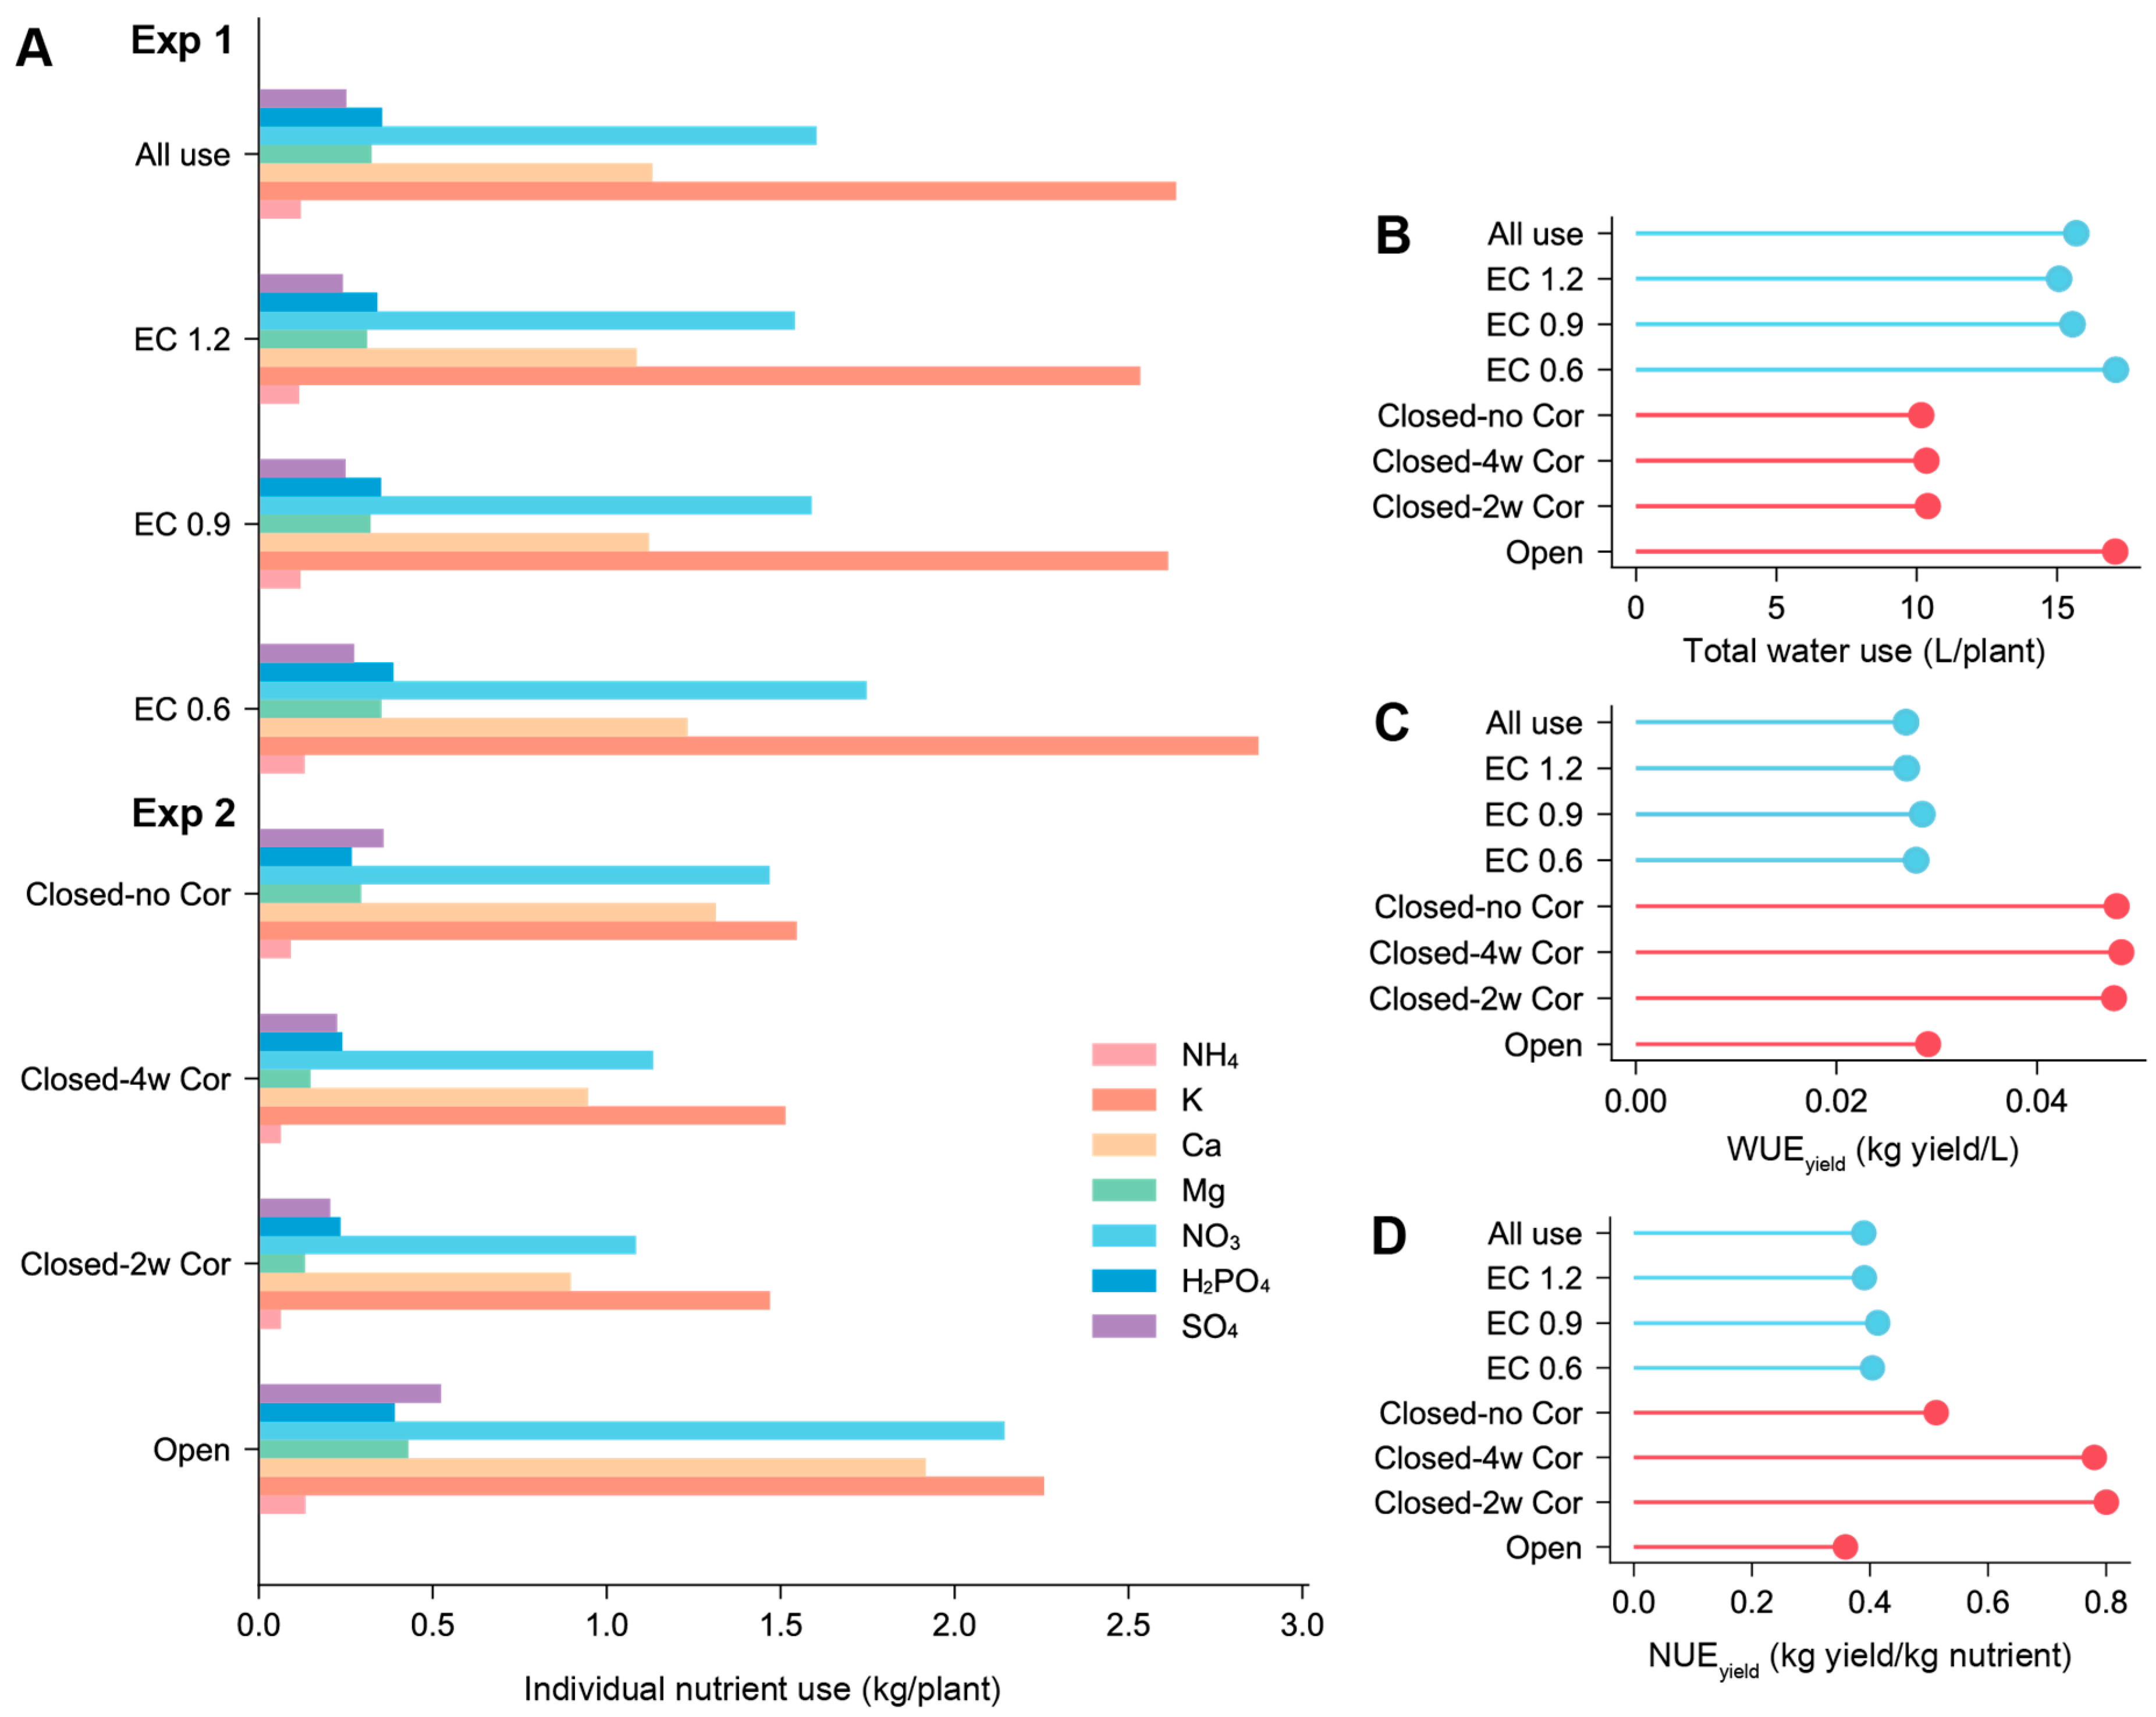
On analyzing the water and nutrient usage in Exp 1, we observed that the volume of discharged water varied according to the drain EC level. The discharge ratios of EC 0.6, 0.9, 1.2, and all-use treatments were 14.6, 1.6, 0.7, and 0%, respectively, which resulted in different uses of total water between treatments in Exp 1 (Figure 6B). Both water-use efficiency (WUEyield) and nutrient-use efficiency (NUEyield) were approximately 4–6% higher in the EC 0.6 and 0.9 treatments than in the EC 1.2 and all-use treatments.
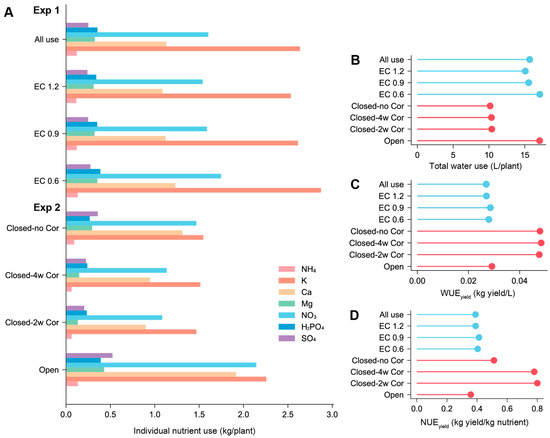
Figure 6.
Resource use during cultivation period according to the recirculation methods in experiments 1 and 2 (Exp 1, 2). Individual nutrient use (A), total water use (B), water use efficiency (WUEyield) (C), and nutrient use efficiency (NUEyield) (D). The blue and red lines in (B–D) separate resource use of Exp 1 and 2, respectively. The weight of each nutrient ion was calculated based on the molar mass of the nutrient fertilizer when dissolved in water.
Thus, in Exp 1, the high nutrient reuse rates of EC 0.9, 1.2, and All use treatments were counteracted by the reduced yield. In Exp 2, the NUEyield was 3% greater in the 2-week correction treatment than in the 4-week correction treatment. However, the closed-loop 2-week and 4-week correction treatments exhibited markedly higher NUEyield (94% and 88%, respectively) than the open-loop treatment and showed 36% and 32% higher NUEyield corresponding to closed–no correction, respectively. Regarding the individual ions, Mg, SO4, Ca, NH4+, NO3−, PO4, and K displayed high reusability in this sequence (Figure 6A). Reusability may be achieved by decreasing the nutrient absorbency of plants within the substrate.
Accumulated nutrient use of microelements was generally higher in open-loop hydroponics but did not show a constant tendency depending on the closed-loop control method (Figure S3).
4. Discussion
In this study, we analyzed two strategies for NS management commonly used in strawberry cultivation for closed-loop hydroponics.
In Exp 1, we controlled the drainage mixing ratio, which involved adding fresh water to the drainage solution to achieve a predetermined EC [14]. This method is widely used but can lead to long-term ion depletion or accumulation in the growing substrate, causing issues for plants when there are discrepancies between nutrient uptake and the NS. The second method involved readjusting the NS composition based on the measured drainage solution’s composition. This is the most used method globally [5], especially in larger greenhouses, to stabilize the nutrient composition in the root zone. The volume of nutrient modification in this method depends on various factors such as crop type, substrate type, size, and crop transpiration influenced by the greenhouse environment. As most strawberry cultivators in Asia use open-loop control, this research provides valuable data for implementing circular hydroponics specifically for strawberries. We designed Exp 1 and 2 to assess the efficacy of water and nutrient use along with evaluating the advantages of implementing closed-loop hydroponics.
4.1. Plant Growth According to Hydroponic Treatments
This study examined the water and NUE of strawberry crops subjected to varying water supply and drainage ion composition management methods in hydroponic cultivation. We quantitatively assessed the implications of the traditionally employed recirculation hydroponic method for crop growth and its efficacy in nutrient conservation by examining growth, yield, and fruit quality following each nutrient control regime. In Exp 1, the drainage reuse rate determined by the EC of the mixing solution was compared with that of a closed-loop system. Most agricultural practices manage the NS supply via EC due to the convenience of the EC sensor [16].
Without ion correction, the nutrient of the mixed solution can change because of the reuse of drainage water. A high set point of mixing EC could increase the mixing rate of the drainage, whereas a low drainage-mixing EC uses the solution in the drainage tank slowly. At the end of the experiment, only 14.6% of the EC 0.6 treatment had drainage discharged, so the other treatments reused almost all of the drainage solution in the tank. Thus, a higher mixing EC set point (EC 1.2, All-use treatments) encouraged most of the drainage to be used immediately as soon as it was stored in the drainage tank.
The treatments of EC 0.6, 0.9, and 1.2 were initially set up because the raw water EC was as high as 0.4~0.5 dS m−1 (Table 1), but it seems that the venturi type of fluid supply system with a single valve opening between the tank and the 3-way-valve is not an accurate method to use on an experimental scale. As Exp 1 did not show a clear difference between EC 0.9, 1.2, and All use, the drainage dilution and NS supply method using a diaphragm pump may be considerable for more precise nutrient calibration at the experimental greenhouse scale.
The extensive use of drainage led to a decrease in strawberry yield at EC 1.2 and the All use treatment compared to EC 0.6 (Figure 5). Hence, the ion imbalance resulting from the utilization of the entire amount of drainage significantly influences crop growth. Elevated salinity levels in the drainage could contribute to the overall EC level, resulting in ion imbalance or a reduction in fruit yield (Figure 4) [17,18]. In Exp 2, there were no discernible differences in NS ion concentrations among the treatment groups (Figure 3), indicating that normal crop growth was achievable through closed-loop hydroponic cultivation by correcting the root zone nutrient composition.
Surprisingly, even the uncorrected treatment showed no difference in yield compared to the open-loop treatment. Unlike in Exp 1, where underground raw water was used, Exp 2 involved the purification process of raw water. This suggests that the quality of raw water significantly influences ion imbalance more than the initial nutrient composition. The high levels of Na, Cl, and HCO3 ions in the raw water during Experiment 1 (Table 1) could have accumulated in the growing substrate, as indicated by the higher Na level in the drainage solution (Figure 4). As non-essential ions such as Na accumulate during crop growth [19], these findings emphasize the importance of drainage flushing for crop growth in EC-based hydroponic cultivation [6,20]. Additionally, purifying raw water can help alleviate the occurrence of physiological disorders or yield fluctuations in closed-loop hydroponics.
4.2. Root-Zone Ion Variations and Ion-Correction Intervals
In Exp 2, we expected to observe variations in the drainage ion composition patterns depending on the nutrient correction interval of 2 or 4 weeks. However, the actual drainage ion composition showed similar trends across all treatment groups (Figure 4). Crop root nutrient absorption is known to be described by transpiration, root catalytic function, or the flow-force model [21]. However, if the overall growth levels of crops are analogous, other cultivation treatments (e.g., water supply and drainage) might function as larger stochastic variables than crop absorption variables [22]. If there are no specific physiological disorders, the need for ion correction may not arise, and practical methods used by farmers, such as adjusting ion levels based on crop growth stages or weather conditions, can be considered viable alternatives.
The uptake concentrations of macronutrients such as Ca, K, and NO3 in closed-loop hydroponics vary with crop type and growth stage [23,24]. Without correction, the levels of P and K slightly decreased compared to other ions (Figure 4), indicating an increased demand for these ions due to leaf area growth and fruit development. On the other hand, the relatively high levels of Mg in the drainage suggest that the initially set NS ion concentration was adequate and might have accumulated in the substrate. This trend varied slightly for each ion according to the developmental stages [25,26], highlighting the benefit of ion correction in preventing nutrient imbalances in the root zone and reducing fertilizer consumption [27]. In this study, there was no significant variability between the 2-week and 4-week calibrations, which could be attributed to the relatively low nutrient EC and low water demand of strawberry crops with small leaf areas. These findings suggest that extended ion correction periods (4 weeks or longer) may be sufficient for circular hydroponic strawberry farming, unlike taller greenhouse crops such as tomatoes and bell peppers that require increased nutrient quantities and evaporation.
4.3. Water and Nutrient Use Efficiency According to Each Closed-Loop Hydroponics Regime
In Exp 1, all treatments were conducted with closed-loop hydroponics, but the EC 0.6 treatment had drainage discharge when the capacity of the drainage container was exceeded, resulting in approximately 15% higher water consumption compared to the other treatment groups (Figure 6B). However, despite the higher water consumption, the EC 0.6 treatment had a relatively high yield, and there was no significant difference in WUEyield or NUEyield compared to other treatments. This indicates that for implementing a closed-loop system, crop production should not be affected by root-zone ion imbalance. However, the results of this study showed that temporary or long-term nutrient imbalance occurs when drainage solutions are simply reused, highlighting the necessity of nutrient correction during cultivation. While a system based on EC alone is simple and easy to implement, it can impact crop growth without nutrient composition correction, thus requiring correction of the drainage mixing ratio and intermittent discharge of drainage [6]. In Exp 2, the open-loop treatment discharged All drainage during the growing period, resulting in a 30–40% difference in total water use compared to the closed-loop treatments. A considerable decrease in NUEyield was observed in the open-loop treatment, corresponding to the amount of wasted water. Existing studies have reported NUE improvements of 35–54% in closed-loop hydroponics compared to open-loop [28], but no specific comparison between closed-loop methodologies has been conducted.
Interestingly, although water reuse was consistent across treatments, NUEyield was significantly better in the corrected treatments compared to the non-corrected ones, with a 30% higher efficiency observed in the corrected treatments (Figure 6). The frequency of nutrient correction through drainage composition analysis, represented by the correction interval, showed a minor 3% difference in NUEyield between the 2-week and 4-week correction cycles. This suggests that frequent nutrient correction based on plant absorption optimization through drainage composition analysis can enhance nutrient utilization efficiency. While the difference may seem minor, it can be effective for nutrient savings on a large scale in extensive greenhouses. In practice, crop-specific nutrient compositions are estimates based on typical fertilizer uptake, so in greenhouse cultivation, it is effective to perform chemical analysis of individual ions every fortnight to ensure that actual root zone nutrient levels are uniform [29]. Among the different nutrient types, the most frequently used ions showed a smaller nutrient-saving effect through calibration, while accumulated ions, such as Mg, SO4, and Ca, yielded considerable nutrient savings through ion correction. On the other hand, NH4+, NO3−, PO4, and K showed relatively less nutrient-saving effects. These findings indicate that simple reuse without nutrient correction is not sufficient for water and nutrient reuse, and nutrient correction through ion analysis enables accurate nutrient supply and approximately 30% higher nutrient use efficiency in the 2- or 4-week correction cycles compared to the non-corrected treatment. Moreover, the 2-week correction cycle demonstrated an additional nutrient-saving effect of approximately 3% compared to the 4-week cycle. This nutrient reduction effect through periodic correction is expected to have a greater impact on large-scale growers. However, this study was conducted on strawberries, which are a relatively sensitive crop to root-zone salinity (maximum root area EC to 2.0 dS m−1), so these savings effects may be reduced if reverse osmosis purification of raw water is not conducted. This is because drainage should be discharged regularly if the raw water has a high salt concentration [30]. This study emphasizes the importance of reclaiming below-ground nutrients frequently, not only for crop growth but also for enhancing the reuse efficiency of agricultural resources through circular hydroponics. As nitrate and phosphate runoff globally reaches biologically risky levels, the study underscores the need for frequent reclamation of these nutrients [31]. When implementing a decision support system for underground ion management in commercial greenhouse horticulture, it is crucial to consider the nutrient utilization efficiency based on the root-zone ion correction cycle for each crop.
5. Conclusions
This study examined the growth of strawberry and the water and nutrient use efficiency when implementing the commonly used methods for greenhouse circular hydroponics systems. In the EC-based control method, the accumulation of salt affects crop production under the higher set-point of drainage mixing EC. Therefore, it was necessary to discharge drainage solutions or make nutrient corrections to ensure the normal growth of strawberries. By scrutinizing the nutrient content in the drainage every 2 weeks and correcting the nutrient solution based on these analyzed results, it was possible to maintain an equilibrium of nutrient solution. This resulted in an enhancement in nutrient use efficiency by 32–36% as opposed to cases where no nutrient corrections were implemented. Moreover, correcting the nutrient solution every two weeks showed a 3% improvement in efficiency relative to a four-week interval, suggesting that matching nutrient composition with plant absorption can lead to additional nutrient conservation. These outcomes underscore the importance of improving the decision-making processes around nutrient management in greenhouse hydroponics. Thus, we could achieve more sustainable crop production by persistently collecting data on plant nutrient consumption profiles.
Supplementary Materials
The following supporting information can be downloaded at: https://www.mdpi.com/article/10.3390/horticulturae10080851/s1, Figure S1: View of the greenhouse and setup for closed-loop hydroponics. Front view of the greenhouse (A), mulching plastic and irrigation lines (B), bottles for drain sampling and a return line for drainage recirculating (C); Figure S2: Biweekly measured major ion concentrations of nutrient solution during cultivation period in experiment 1 and 2 (Exp 1, 2). The gray dotted lines in each figure box indicate the target concentration of the nutrient solution; Figure S3: Accumulated micronutrients (Fe, Mn, Zn, B, Cu, Mo) consumption during cultivation period in experiment 2 (Exp 2).
Author Contributions
Conceptualization, M.Y.L., M.Y.R., G.L.C., S.H.K. and D.K.; methodology, D.K.; software, D.K.; validation, D.K.; formal analysis, D.K.; investigation, M.Y.L. and S.H.K.; resources, G.L.C.; data curation, D.K.; writing—original draft preparation, M.Y.L. and D.K.; writing—review and editing, D.K.; visualization, D.K.; supervision, M.Y.R.; project administration, M.Y.R.; funding acquisition, M.Y.R. All authors have read and agreed to the published version of the manuscript.
Funding
This work was carried out with the support of “Cooperative Research Program for Agriculture Science and Technology Development (Project No. PJ01604803)” Rural Development Administration, Republic of Korea.
Data Availability Statement
The original contributions presented in the study are included in the article/Supplementary Materials, further inquiries can be directed to the corresponding author.
Conflicts of Interest
The authors declare that they have no known competing financial interests or personal relationships that could have appeared to influence the work reported in this paper.
References
- Massa, D.; Magán, J.J.; Montesano, F.F.; Tzortzakis, N. Minimizing water and nutrient losses from soilless cropping in southern Europe. Agric. Water Manag. 2020, 241, 106395. [Google Scholar] [CrossRef]
- MAFRA (Ministry of Agriculture, Food and Rural Affairs). 2022 Greenhouse Vegetable Status and Vegetable Production. 2023. Available online: https://www.mafra.go.kr/bbs/home/789/568302/artclView.do (accessed on 24 April 2024).
- Hong, S.J.; Eum, H.L. Determination of the harvest date and ripening phase of ‘Seolhyang’strawberry. J. Bio-Environ. Control. 2020, 29, 62–72. [Google Scholar] [CrossRef]
- Lee, Y.H.; Yoon, C.S.; Park, N.I.; Yeoung, Y.R. Influence of various nutrient concentrations on the growth and yield of summer strawberry cultivars cultivated in a hydroponic system. Hortic. Environ. Biotechnol. 2015, 56, 421–426. [Google Scholar] [CrossRef]
- Blok, C.; Voogt, W.; Barbagli, T. Reducing nutrient imbalance in recirculating drainage solution of stone wool grown tomato. Agric. Water Manag. 2023, 285, 108360. [Google Scholar] [CrossRef]
- Massa, D.; Incrocci, L.; Maggini, R.; Bibbiani, C.; Carmassi, G.; Malorgio, F.; Pardossi, A. Simulation of crop water and mineral relations in greenhouse soilless culture. Environ. Model. Softw. 2011, 26, 711–722. [Google Scholar] [CrossRef]
- Massa, D.; Incrocci, L.; Maggini, R.; Carmassi, G.; Campiotti, C.A.; Pardossi, A. Strategies to decrease water drainage and nitrate emission from soilless cultures of greenhouse tomato. Agric. Water Manag. 2010, 97, 971–980. [Google Scholar] [CrossRef]
- Incrocci, L.; Massa, D.; Pardossi, A. New Trends in the Fertigation Management of Irrigated Vegetable Crops. Horticulturae 2017, 3, 37. [Google Scholar] [CrossRef]
- Zekki, H.; Gauthier, L.; Gosselin, A. Growth, Productivity, and Mineral Composition of Hydroponically Cultivated Greenhouse Tomatoes, with or without Nutrient Solution Recycling. J. Am. Soc. Hortic. Sci. 1996, 121, 1082–1088. [Google Scholar] [CrossRef]
- Savvas, D.; Ntatsi, G.; Passam, H.C. Plant nutrition and physiological disorders in greenhouse grown tomato, pepper and eggplant. Eur. J. Plant Sci. Biotechnol. 2008, 2, 45–61. [Google Scholar]
- Roosta, H.R.; Afsharipoor, S. Effects of different cultivation media on vegetative growth, ecophysiological traits and nutrients concentration in strawberry under hydroponic and aquaponic cultivation systems. Adv. Environ. Biol. 2012, 6, 543–555. [Google Scholar]
- Neocleous, D.; Savvas, D. Assessment of different strategies to balance high Mg levels in the irrigation water when preparing nutrient solution for soilless strawberry crops. Eur. J. Hortic. Sci. 2013, 78, 267–274. [Google Scholar]
- Neocleous, D.; Savvas, D. Response of hydroponically-grown strawberry (Fragaria × ananassa Duch.) plants to different ratios of K: Ca: Mg in the nutrient solution. J. Hortic. Sci. Biotechnol. 2013, 88, 293–300. [Google Scholar] [CrossRef]
- Savvas, D. SW—Soil and Water: Automated replenishment of recycled greenhouse effluents with individual nutrients in hydroponics by means of two alternative models. Biosyst. Eng. 2002, 83, 225–236. [Google Scholar] [CrossRef]
- Liao, C.F.H. Devarda’s Alloy Method for Total Nitrogen Determination. Soil Sci. Soc. Am. J. 1981, 45, 852–855. [Google Scholar] [CrossRef]
- Ahn, T.I.; Son, J.E. Application of an Alternative Nutrient Replenishment Method to Electrical Conductivity-Based Closed-Loop Soilless Cultures of Sweet Peppers. Horticulturae 2022, 8, 295. [Google Scholar] [CrossRef]
- Ehret, D.; Ho, L. The effects of salinity on dry matter partitioning and fruit growth in tomatoes grown in nutrient film culture. J. Hortic. Sci. 1986, 61, 361–367. [Google Scholar] [CrossRef]
- Trajkova, F.; Papadantonakis, N.; Savvas, D. Comparative Effects of NaCl and CaCl2 Salinity on Cucumber Grown in a Closed Hydroponic System. HortSci 2006, 41, 437–441. [Google Scholar] [CrossRef]
- Carmassi, G.; Incrocci, L.; Maggini, R.; Malorgio, F.; Tognoni, F.; Pardossi, A. Modeling Salinity Build-Up in Recirculating Nutrient Solution Culture. J. Plant Nut. 2005, 28, 431–445. [Google Scholar] [CrossRef]
- Giannothanasis, E.; Spanoudaki, E.; Kinnas, S.; Ntatsi, G.; Voogt, W.; Savvas, D. Development and validation of an innovative algorithm for sodium accumulation management in closed-loop soilless culture systems. Agric. Water Manag. 2024, 301, 108968. [Google Scholar] [CrossRef]
- Le Deunff, E.; Tournier, P.H.; Malagoli, P. The Thermodynamic Flow-Force Interpretation of Root Nutrient Uptake Kinetics: A Powerful Formalism for Agronomic and Phytoplanktonic Models. Front. Physiol. 2016, 7, 243. [Google Scholar] [CrossRef]
- Ahn, T.I.; Shin, J.H.; Son, J.E. Theoretical and Experimental Analyses of Nutrient Control in Electrical Conductivity-Based Nutrient Recycling Soilless Culture System. Front. Plant Sci. 2021, 12, 656403. [Google Scholar] [CrossRef]
- Lee, J.Y.; Rahman, A.; Azam, H.; Kim, H.S.; Kwon, M.J. Characterizing nutrient uptake kinetics for efficient crop production during Solanum lycopersicum var. cerasiforme Alef. growth in a closed indoor hydroponic system. PLoS ONE 2017, 12, 0177041. [Google Scholar] [CrossRef] [PubMed]
- Vardar, G.; Altıkatoğlu, M.; Ortaç, D.; Cemek, M.; Işıldak, İ. Measuring calcium, potassium, and nitrate in plant nutrient solutions using ion-selective electrodes in hydroponic greenhouse of some vegetables. Biotechnol. Appl. Bioc. 2015, 62, 663–668. [Google Scholar] [CrossRef]
- Tan, X.W.; Ikeda, H.; Oda, M. The absorption, translocation, and assimilation of urea, nitrate or ammonium in tomato plants at different plant growth stages in hydroponic culture. Sci. Hortic. 2000, 84, 275–283. [Google Scholar] [CrossRef]
- Xu, X.; Du, X.; Wang, F.; Sha, J.; Chen, Q.; Tian, G.; Zhu, Z.; Ge, S.; Jiang, Y. Effects of potassium levels on plant growth, accumulation and distribution of carbon, and nitrate metabolism in apple dwarf rootstock seedlings. Front. Plant Sci. 2020, 11, 904. [Google Scholar] [CrossRef]
- Rufí-Salís, M.; Calvo, M.J.; Petit-Boix, A.; Villalba, G.; Gabarrell, X. Exploring nutrient recovery from hydroponics in urban agriculture: An environmental assessment. Resour. Conserv. Recycl. 2020, 155, 104683. [Google Scholar] [CrossRef]
- Rufí-Salís, M.; Petit-Boix, A.; Villalba, G.; Sanjuan-Delmás, D.; Parada, F.; Ercilla-Montserrat, M.; Arcas-Pilz, V.; Muñoz-Liesa, J.; Rieradevall, J.; Gabarrell, X. Recirculating water and nutrients in urban agriculture: An opportunity towards environmental sustainability and water use efficiency? J. Clean. Prod. 2020, 261, 121213. [Google Scholar] [CrossRef]
- Savvas, D.; Giannothanasis, E.; Ntanasi, T.; Karavidas, I.; Ntatsi, G. State of the Art and New Technologies to Recycle the Fertigation Effluents in Closed Soilless Cropping Systems Aiming to Maximise Water and Nutrient Use Efficiency in Greenhouse Crops. Agronomy 2023, 14, 61. [Google Scholar] [CrossRef]
- Katsoulas, N.; Voogt, W. Recent trends in salinity control for soilless growing systems management. In Proceedings of the International Symposium on Growing Media and Soilless Cultivation, Leiden, The Netherlands, 17–21 June 2013; Volume 1034, pp. 433–442. [Google Scholar]
- Steffen, W.; Richardson, K.; Rockström, J.; Cornell, S.E.; Fetzer, I.; Bennett, E.M.; Biggs, R.; Carpenter, S.R.; de Vries, W.; de Wit, C.A.; et al. Planetary boundaries: Guiding human development on a changing planet. Science 2015, 347, 1259855. [Google Scholar] [CrossRef]

Disclaimer/Publisher’s Note: The statements, opinions and data contained in all publications are solely those of the individual author(s) and contributor(s) and not of MDPI and/or the editor(s). MDPI and/or the editor(s) disclaim responsibility for any injury to people or property resulting from any ideas, methods, instructions or products referred to in the content. |
© 2024 by the authors. Licensee MDPI, Basel, Switzerland. This article is an open access article distributed under the terms and conditions of the Creative Commons Attribution (CC BY) license (https://creativecommons.org/licenses/by/4.0/).