Article

Optimizing Sweet Cherry Attributes through Magnesium and Potassium Fertilization

1
Centre for the Research and Technology of Agro-Environmental and Biological Sciences (CITAB), University of Trás-os-Montes e Alto Douro, 5000-801 Vila Real, Portugal
2
Institute for Innovation, Capacity Building and Sustainability of Agri-Food Production (Inov4Agro), University of Trás-os-Montes e Alto Douro, 5000-801 Vila Real, Portugal
3
Department of Biology and Environment (DeBA), University of Trás-os-Montes e Alto Douro, 5000-801 Vila Real, Portugal
4
Chemistry Centre (CQ-VR), University of Trás-os-Montes e Alto Douro, UTAD, Quinta de Prados, 5000-801 Vila Real, Portugal
5
Department of Agronomy, University of Trás-os-Montes e Alto Douro, UTAD, Quinta de Prados, 5000-801 Vila Real, Portugal
6
Instituto de Biotecnología Vegetal, Universidad Politécnica de Cartagena Campus Muralla del Mar, 30202 Cartagena, Spain
7
Department of Genetics and Biotechnology (DGB), University of Trás-os-Montes e Alto Douro (UTAD), 5000-801 Vila Real, Portugal
*
Author to whom correspondence should be addressed.
Horticulturae 2024, 10(8), 881; https://doi.org/10.3390/horticulturae10080881
Submission received: 10 July 2024 / Revised: 14 August 2024 / Accepted: 17 August 2024 / Published: 20 August 2024
(This article belongs to the Section Fruit Production Systems)

Abstract

:
Plant nutrition through fertilizer application plays a crucial role in enhancing crop quality and yield, necessitating a balanced fertilization approach. Sweet cherry, esteemed as one of the most prized crops worldwide, was the focus of this three-year study spanning from 2019 to 2021, involving the sweet cherry cultivar Burlat. This study investigated the foliar application of magnesium (Mg) and potassium (K) to enhance fruit quality parameters. Different doses of Mg (250 g hL−1 and 125 g hL−1) and K (100 g hL−1 and 50 g hL−1) and a control treatment were administered to sweet cherry trees to assess their impact on fruit quality. At the commercial ripening stage, fruits from each treatment were harvested for comprehensive evaluation, including biometric and chromatic parameters, fruit firmness, routine parameters, sensory profile, and nutrient content analysis. Results from the study revealed notable enhancements in fruit weight and dimensions, particularly in the control treatment in 2020. Furthermore, Mg125 and Mg250 treatments exhibited improved color development and accelerated maturity by increasing the total soluble solids content while decreasing titratable acidity. Sensorial profiling indicated that Mg125 and Mg250 treatments intensified color intensity and sweet taste while mitigating sour taste perceptions. Conversely, potassium fertilization, especially the K50 treatment, led to increased fruit firmness and nutrient content. These findings offer valuable insights into optimizing sweet cherry production practices globally.

1. Introduction

Portugal is known for its high-quality fruit products, especially fresh fruit crops, crucial in the country’s socio-economic context. The fruit sector in Portugal has experienced significant growth over the past decades, both at the national level and through international exports [1]. Crop growth and productivity are highly affected by climate changes, namely, droughts, variations in rainfall, floods, extreme temperatures, high light intensity, heat, frost, and cold [2,3]. Among them, air temperature has an important role in the growth cycle of fruit trees, with a considerable impact on dormancy and active plant development. It is critical to analyze the effects of climate change on fruit trees [1].
Shifts in climate patterns significantly affect crop yield and quality, particularly in fruit trees, which are less resilient to temperature fluctuations and water scarcity [4]. Consequently, the effects of climate change manifest in various physiological disorders, such as fruit cracking, leading to diminished fruit crop yield and quality [4,5].
Sweet cherry tree (Prunus avium L.) is one of the most important crops worldwide and one of the most popular spring–summer fruits in temperate regions of Europe [6,7,8]. In Portugal, FAOSTAT [9] reported a production of 22,000 t, 9240 t, and 23,930 t in 2019, 2020, and 2021, respectively.
Sweet cherry is one of the most appreciated fruits by consumers around the world due to its precocity, attractive appearance, and organoleptic qualities, such as its pleasant taste, bright color, and lovely aroma [6,10,11]. The current market demands are highly challenging, needing that producers prioritize market requirements and select commercial varieties that align with consumer preferences [12]. Among them, important quality characteristics such as season availability, fruit size, taste, color, sweetness, sourness, and firmness can influence consumer preference [12,13,14]. Sweet cherries are a natural source of bioactive compounds and several nutrients with numerous benefits to human health, including chemical substances that are essential to the correct human body function and that cannot be synthetized or are synthesized in small amounts, like macronutrients and micronutrients such as nitrogen (N), phosphorus (P), potassium (K), calcium (Ca), magnesium (Mg), sulfur (S), boron (B), iron (Fe), zinc (Zn), manganese (Mn), and cooper (Cu) [6,10]. Since sweet cherries are mainly consumed as fresh fruits, it is essential to satisfy the market requirements and produce fruits with good-quality parameters to satisfy consumers’ preferences [15].
Nutrient deficiencies have emerged as a consequence of climate change, so nutritional research in fruit crops has tried to develop precision horticulture with more targeted nutrient management [16]. Plant nutrients are crucial chemical elements that facilitate plant growth and metabolism, regulating several physiological processes. Foliar application allows quicker and more efficient absorption than soil application [17]. Thus, plant growth and development depend on the uptake and availability of essential nutrients [18]. Fertilization through nutrient application represents a common practice to improve orchard yield and quality [19]. In sweet cherry trees, a balanced nutrient quantity and variety and suitable soil fertility are essential to achieve high yields [20]. Beyond the increase in yield and fruit quality, adequate fertilization will improve sweet cherry trees’ resistance to many diseases and physiological disorders [18,21]. In fruit trees, the nutritional status of plants plays a vital role in determining their fruiting capacity [22], namely, macronutrients such as Mg and K [18]. Mg has an important role in several physiological and biochemical processes in higher plants [23] since Mg deficiency is a limiting factor in crop production, and thus, its application has been associated with an improvement in crop yields and agronomic efficiency [24]. Mg has a crucial role as an enzyme cofactor for several biochemical processes, such as chlorophyll biosynthesis, and as a component of chlorophyll [18,25]. Moreover, Mg is involved in photosynthesis-related processes, like transpiration rate, stomatal conductance or CO2 fixation, and improvement in phloem loading and sucrose transport as well as in root growth and development [26]. Mg also plays a vital role in protecting plants against various environmental stresses, such as heat, soil acidity, aluminum toxicity, and high light radiation [27]. On the other hand, K is an essential nutrient for plant growth, and it is important to obtain a high yield in agriculture [28]. K also has a significant impact on fruit quality, with influence on quality traits, like fruit size, appearance, color, soluble solids, acidity, and vitamin contents, being considered an essential nutrient in fruit quality regulation [21,28]. K is a vital plant nutrient used in enzyme activation, protein formation, photosynthesis, and sugar transport [18]. Additionally, K increases tolerance to several abiotic stresses linked to physiological disorders, such as drought, extreme temperatures, and salinity [28,29,30,31,32]. In sweet cherries, the success of orchard management includes water and nutrient availability in a specific period, namely, in blossom, fruit growth, and harvest and also during the postharvest period [33]. Thus, understanding plant requirements in terms of nutrient availability results in an improvement in application efficiencies with timing and synchronized fertilization and, consequently, in an improvement in fruit yield and quality [16]. Mg is essential in several physiological processes involved in plant growth and development [26]. Mg fertilization enhances crop performance, being associated with higher crop yield and quality [24]. Despite this, Mg deficiency emerges as a result of the non-use of Mg in fertilization management strategies and, consequently, leads to severe reductions in crop yield and quality [26,34]. On the other hand, K has been described as a vital nutrient in plants [18], especially by improving quality parameters, such as fruit size, total soluble solids, fruit color, advance in the fruit’s maturity, and yield [17]. Moreover, foliar nutrition is a quick and efficient tool to compensate for nutrient deficiencies in soil, simultaneously effective in the biofortification of food crops even under environmental stresses, in order to improve the growth, yield, and quality of crop plants [17,35].
This study aimed to investigate the impact of preharvest magnesium and potassium foliar application on several quality parameters of sweet cherries. These parameters include biometric and chromatic measures, fruit firmness, and other standard quality indicators. Moreover, the sensory profile of sweet cherries, alongside the assessment of macronutrient and micronutrient content in cherry fruits, was also analyzed in this study.

2. Materials and Methods

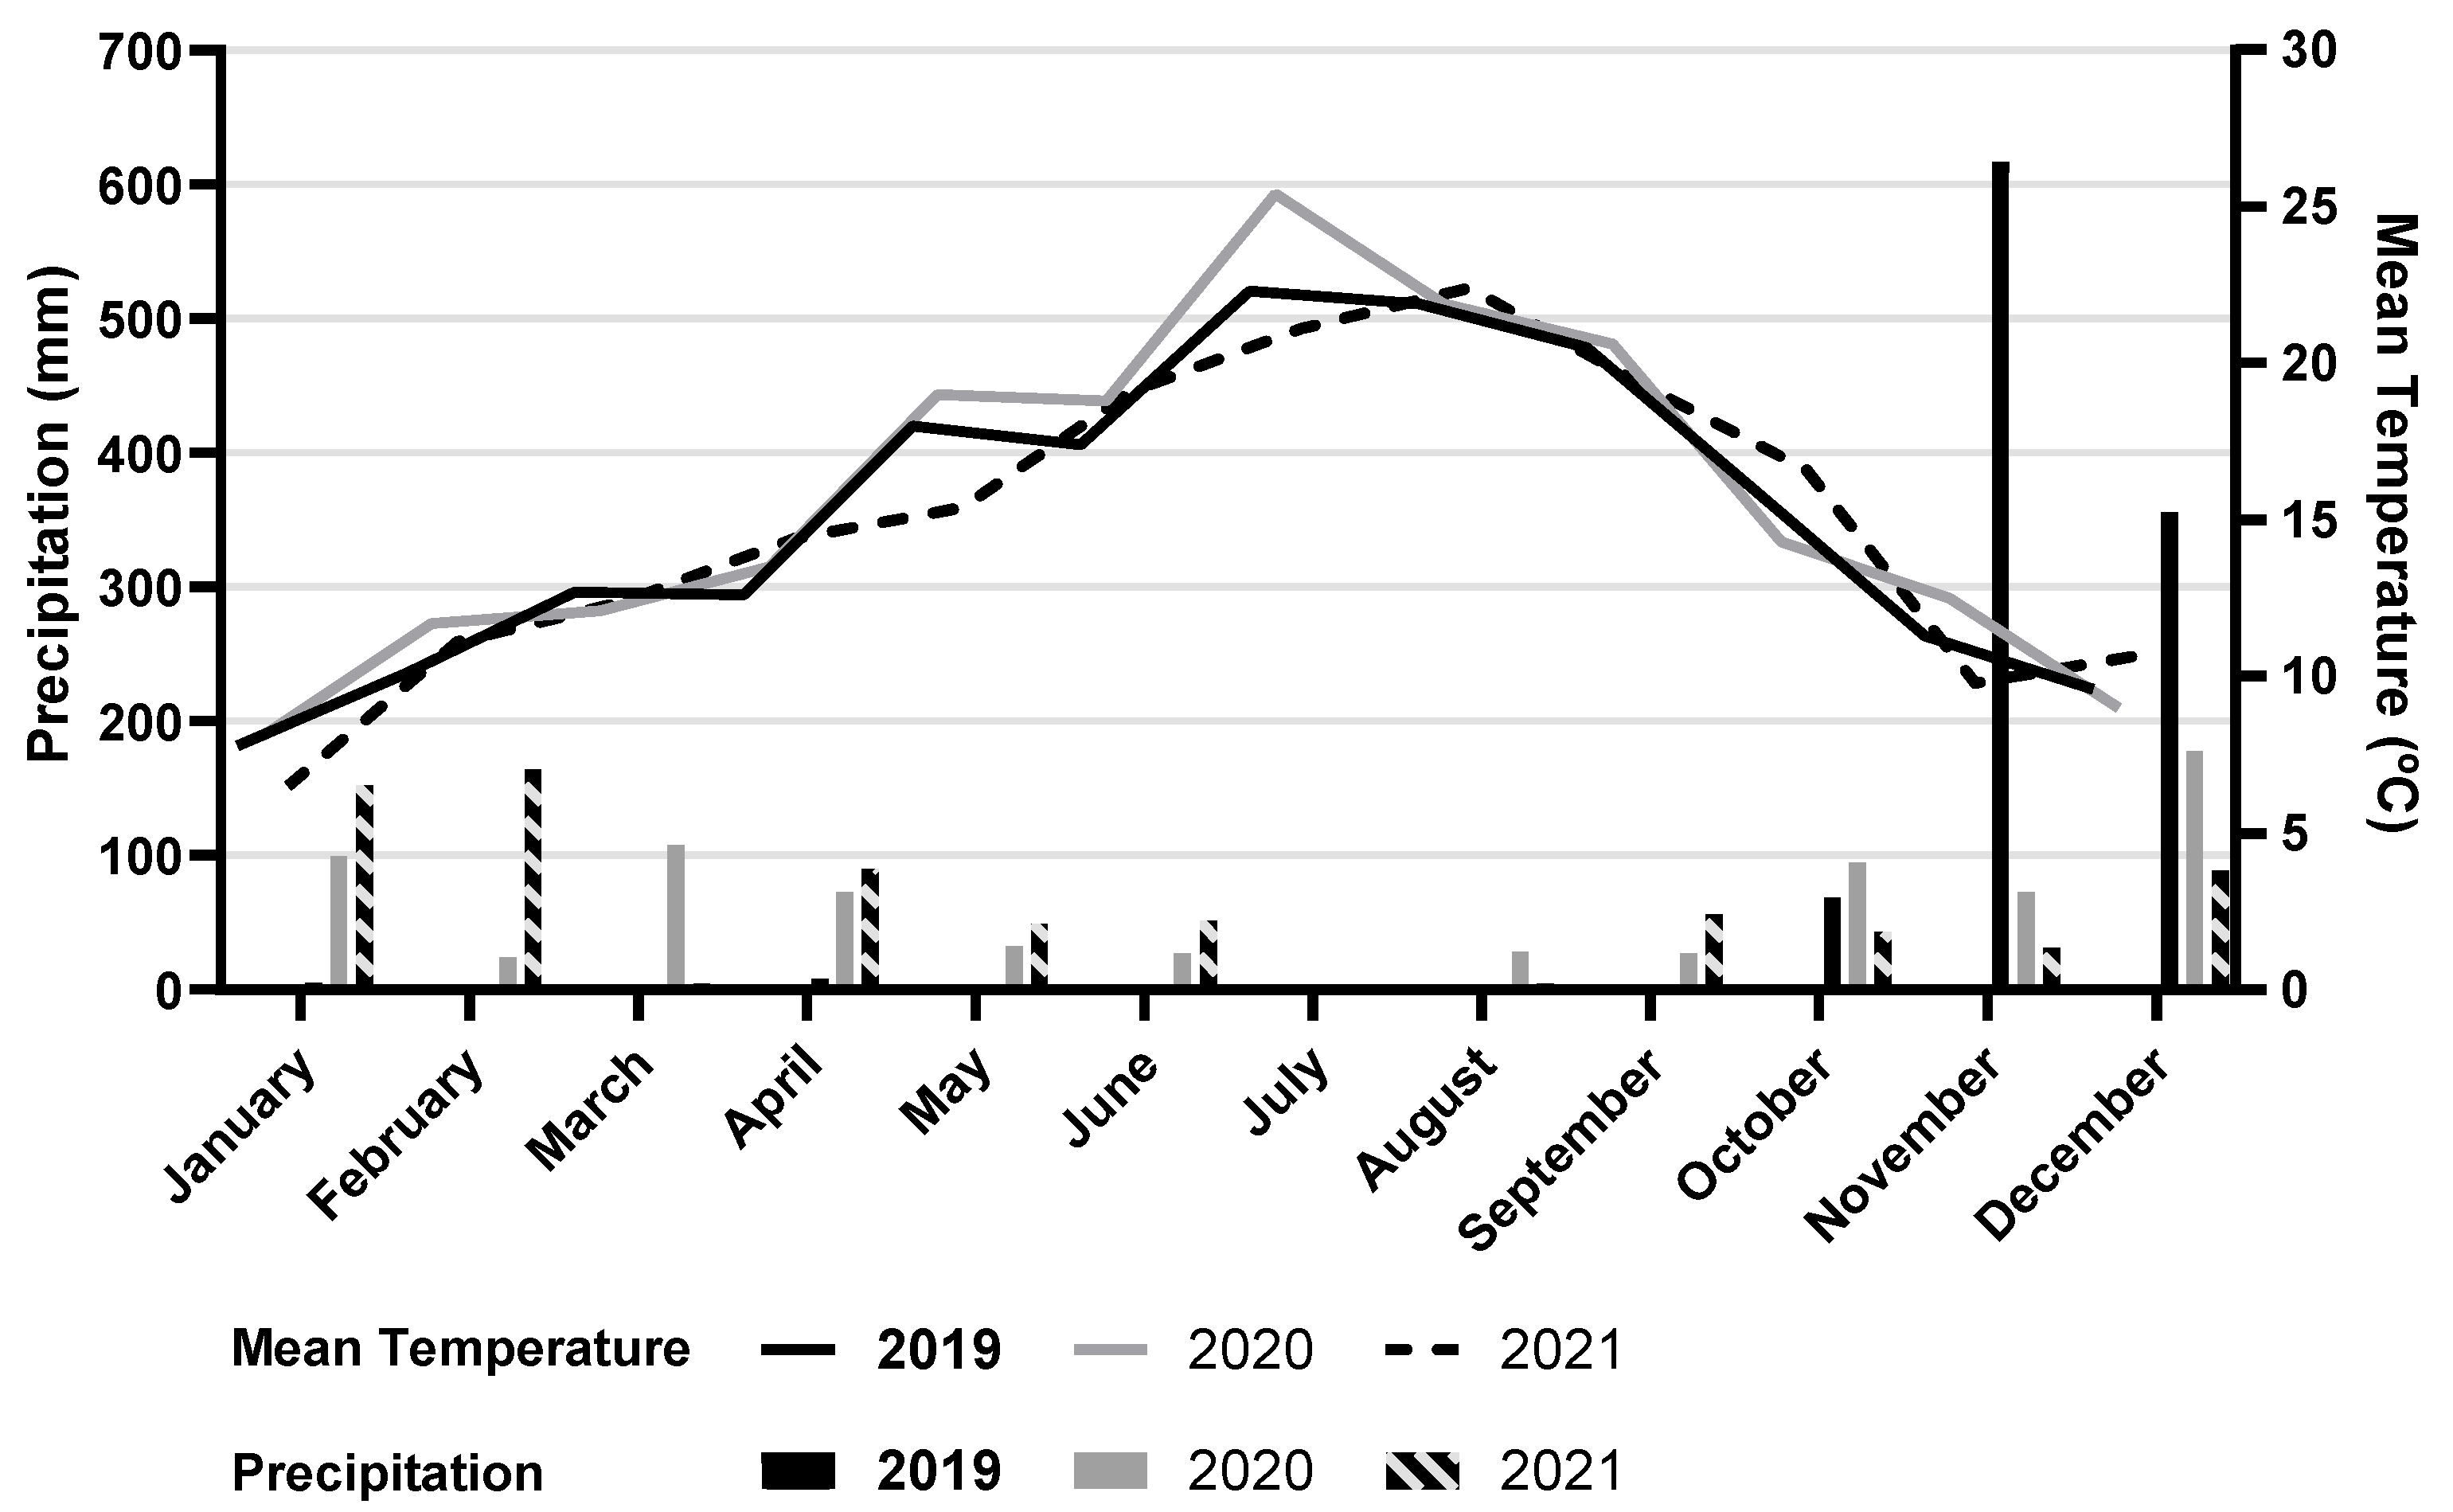
2.1. Experimental Trial

Experiments were carried out in an orchard located in the Resende region in Portugal (41°05′51.5″ N 8°00′15.7″ W, altitude 156 m) in 2019, 2020, and 2021. Trees were planted with a spacing of 5 m × 3 m (about 667 trees/ha). Weather parameters during the experiments were monitored using a weather station located near the study site in São João de Fontoura (Figure 1). The mean temperature remained consistent throughout the three years of the experiments. The minimum temperatures were recorded in January (7.8 °C in 2019, 8.1 °C in 2020, and 6.5 °C in 2021), while the maximum temperatures were registered in July 2019 (22.3 °C) and 2020 (25.4 °C) and in August 2021 (22.4 °C). The precipitation levels exhibited variations across the three years. In 2019, the precipitation remained notably low throughout the year, with a peak in the last three months (a maximum of 616.4 mm recorded in November). The precipitation levels in 2020 and 2021 were similar, with July registering the lowest amounts (3.0 mm in 2020 and 3.2 in 2021). In both years, the first months (up until the harvest in May) experienced some rainfall, except March 2021.
The soil of the experimental assay was also analyzed. The edaphic matrix, classified as an arenosol [36], presents a sandy texture, with a pH (H2O) of 5.6, organic matter of 11.5 g kg−1, extractable P (Egner–Riehm) of 6.1 mg kg−1, exchange Ca2+ of 1.8 cmolc kg−1, exchange Mg2+ of 1.9 cmolc kg−1, exchange K+ of 0.3 cmolc kg−1, and CEC (ammonium acetate) of 4.4 cmolc kg−1. Based on the soil analysis results, corrections for organic matter and phosphorus content were made by applying 20 tons of commercial compost and 150 kg of P in the form of a single superphosphate (18% P2O5) per hectare, respectively. The soil corrections were carried out during the crop’s vegetative dormancy period, between September and November of the first year of the trial.
For this study, five treatments were considered, involving two magnesium concentrations (Kit Plant Mg), 250 g (Mg250) and 125 g (Mg125), and two potassium concentrations (Enermax, with 34% of potassium expressed in K2O form), 100 g (K100) and 50 g (K50) per 100 L of water, according to the technical recommendation of the commercial company. A control treatment with 250 g of magnesium and 100 g of potassium per 100 L of water was also used. The control treatment served as a positive control, providing a known and expected response that helps validate the experimental setup, assess sensitivity, ensure quality assurance, standardize comparisons, identify variability, and enhance scientific rigor. Each treatment was tested in three replicates, with a total of 15 cherry trees of the cv. Burlat per treatment. The treatments were applied individually, via foliar spray, during the fruit development and ripening stages, with a total of three applications. The application was defined according to the concentrations described by the manufacturer, with the spray volume adjusted to the total number of trees per treatment.
A composite sample of fruits from the 15 trees, corresponding to the three replicates tested per treatment, was randomly collected at the commercial ripening stage, indicating the optimal time for consumption, on 7 May 2019; 5 May 2020; and 6 May 2021, for subsequent analysis of sweet cherry quality parameters.

2.2. Mineral Composition

Approximately 250 g of fruit (without pit and peduncle) was randomly divided into three replicates. For each replicate, fruit pulps and fruit skins were separated and lyophilized using a freeze dryer (ScanVac CoolSafe 4-15L, LaboGene, Lillerød, Denmark) for 10 days until complete water removal. A powdered extract was obtained from the lyophilized cherry pulps and cherry skins following this process. To understand the cumulative effect of compound application, both macronutrients (N, P, K, Ca, Mg, and S) and micronutrients (B, Fe, Zn, Mn, and Cu) were determined in the final trial year (2021). Nitrogen content was determined by molecular absorption spectrophotometry, in a segmented flow autoanalyzer (SKALAR®, Breda, The Netherlands), through the Berthelot reaction, after the sulfuric digestion, catalyzed by selenium, at controlled temperatures. For the remaining nutrients, the extracts were prepared according a microwave radiation-assisted digestion, carried out in a microwave oven [37]. Shortly, the samples were weighed (500 mg) and placed in the vials. Then 6 mL of aqua regia (HCl:HNO3) (3:1) (v/v) was added to the bottles, waiting for 15 min to aim for pre-digestion. After, all samples were subjected to a temperature cycle digestion in microwave. An additional of 10 mL of double-distilled water was added to the obtained extract, which was filtered and determined their respective nutrient levels using the ICP (Inductively Coupled Plasma) technique, by the ICP-OES iCAP 7000 model. Results were expressed as the average of three replicates and the standard deviation (SD).

2.3. Sweet Cherry Quality Parameters

2.3.1. Biometric Parameters

From each treatment, 30 fruits were randomly selected to determine the biometric parameters. Fruit weight (g) was determined using an electronic balance (EW2200-2NM, Kern, Germany). The fruit dimensions (mm), including the larger diameter, smaller diameter, and height, were measured with a digital caliper (Mitutoyo, Hampshire, UK). The results were expressed as the average of 30 fruits and their SD.

2.3.2. Chromatic Parameters

Using the same 30 fruits from each treatment, fruit color was measured on two opposite sides using a colorimeter (CM-2300D, Konica Minolta, Tokyo, Japan), previously calibrated using a standard white plate and according to the CIE (Commission International de l’Eclairage) system of 1976, based on a three-dimensional space (CIELAB). The colorimetric coordinates L*, a*, and b* were measured, with L* representing lightness, a* indicating green (−a) to red (+a) colors, and b* signifying blue (−b) to yellow (+b) colors. Using the individual colorimetric values, the chroma (C*) value was calculated by the formula C* = (a*2 + b*2)1/2, and the hue angle (h) was determined as h = arctangent(b*/a*) [38]. Results were presented as the average of 60 values obtained for 30 fruits and their SD.

2.3.3. Texture Parameters

Texture parameters included the measurement of epidermis rupture force (N) and fruit firmness (N/mm). These parameters were determined in the same 30 fruits from each treatment using a Texture Analyzer (TA.XT.plus, Stable Micro Systems, Godalming, UK). The maximum force required to penetrate and compress 5 mm of pulp was measured at a speed of 1 mm s−1, using a 30 N load cell and a 2.0 mm diameter cylindrical probe. Results were expressed as the average of 30 fruits and their SD. Due to the constraints imposed by the COVID-19 pandemic, it was not feasible to determine the texture parameters in 2020. Consequently, the results only encompass epidermis rupture force and fruit firmness measurements in 2019 and 2021.

2.3.4. Total Soluble Solids, pH, Titratable Acidity, and Maturity Index

The 30 fruits used for determining the previous parameters were divided into three groups of 10 fruits each. After removing the pit and the peduncle, the pulp from each group of 10 fruits was used to extract fruit juice. The total soluble solids content (TSS, in Brix) was determined using a digital refractometer (PAL-1, Atago, Tokyo, Japan), followed by pH measurement with a pH meter (3505, Jenway, UK). Then, 10 mL of juice was diluted in 10 mL of distilled water, and titration with a 0.1 mol L−1 sodium hydroxide (NaOH) was carried out until reaching pH 8.2 to determine titratable acidity (TA, in % of malic acid). Additionally, the maturity index was calculated as the ratio of TSS to TA [39]. Results were expressed as the average of three replicates and their SD.

2.4. Sensorial Analysis

Fifteen cherry attributes (appearance, epidermis softness, color intensity, color uniformity, peduncle color, odor intensity, sweet taste, sour taste, bitter taste, astringency, strange taste, cherry flavor, strange flavor, firmness, and succulence), adapted from Chauvin et al. [40], were evaluated by a trained panel from the Department of Biology and Environment, School of Life and Environment Sciences, University of Trás-os-Montes and Alto Douro (DeBA/ECVA-UTAD). Two cherries per treatment, at room temperature, were randomly distributed to each participant. After tasting, each participant assigned scores to each cherry attribute on a scale of 1 (lowest intensity) to 5 (highest intensity) within each treatment. Results were presented as the score mean obtained for each cherry attribute. Due to the constraints imposed by the COVID-19 pandemic, access to the cherries’ sensorial profile was impossible in 2020. Consequently, the results only encompass the sensorial profile in 2019 and 2021.

2.5. Statistical Analysis

The statistical analysis was conducted using the Software SPSS V.27 (SPSS-IBM, Corp., Armonk, NY, USA). Statistical differences were determined using one-way and two-way analysis of variance (ANOVA), followed by Tukey’s post hoc multiple range test (p < 0.05). One-way ANOVA allowed us to evaluate the effects of treatments within each year and the effect of the year within each treatment. Two-way ANOVA (two factors) allowed us to establish the impact of treatment and year in the cherry quality parameters along the three years of trial. Pearson’s correlations were also performed to determine the relation among the analyzed cherry quality parameters.

3. Results

3.1. Mineral Composition

Concerning the macronutrients (Table 1), N, P, K, and S were affected by the treatment. The cherry tissue (skin or pulp) affected the N, Ca, Mg, and S contents. Consequently, a higher content of N and S was found in the cherry pulp, while a higher content of Ca and Mg was found in the cherry skin. In the cherry skin, only N and P presented significant differences among treatments. K50-treated cherries had the highest content of N (9.85 g kg−1) and P (1.36 g kg−1) in the cherry skin, while Mg250-treated cherries presented the lowest content of N (7.09 g kg−1), and control cherries had the lowest content of P (0.94 g kg−1). In the cherry pulp, significant differences among treatments were found for N, K, and S. Cherry pulps under the K50 treatment presented the highest contents of N (13.75 g kg−1), K (21.73 g kg−1), and S (0.73 g kg−1). In contrast, Mg250-treated cherries had the lowest contents of N (8.81 g kg−1) and K (17.64 g kg−1), while Mg125-treated cherries had the lowest content of S (0.45 g kg−1).
Within the micronutrient content (Table 2), B, Fe, Mn, and Cu were affected by treatment and by cherry tissue (skin or pulp). Therefore, B, Mn, and Cu contents were higher in cherry skin, while Fe content was higher in cherry pulp. Fe was the only micronutrient affected by treatment and tissue interaction. Significant differences among treatments were found in the cherry skin in B and Fe. Thus, control cherries had the highest content of B (16.48 mg kg−1), while K50-treated cherries presented the highest content of Fe (37.07 mg kg−1). The lowest contents of these micronutrients in the cherry skin were found in K100 (12.08 mg kg−1 of B) and Mg250 (23.75 mg kg−1 of Fe) fruits. In the cherry pulp, significant differences among treatments were found for B, Fe, Mn, and Cu. The highest contents of Fe (52.16 mg kg−1) and Cu (6.53 mg kg−1) were found in K50-treated cherries, whereas the highest contents of B (13.91 mg kg−1) and Mn (3.90 mg kg−1) were found in control cherries. In contrast, Mg125 cherries presented the lowest content of B (8.63 mg kg−1), K100 fruits had the lowest content of Fe (19.86 mg kg−1), Mg250 cherries presented the lowest content of Cu (4.18 mg kg−1), and K50 fruits had the lowest content of Mn (2.20 mg kg−1).

3.2. Effect of Magnesium and Potassium on Sweet Cherry Quality Parameters

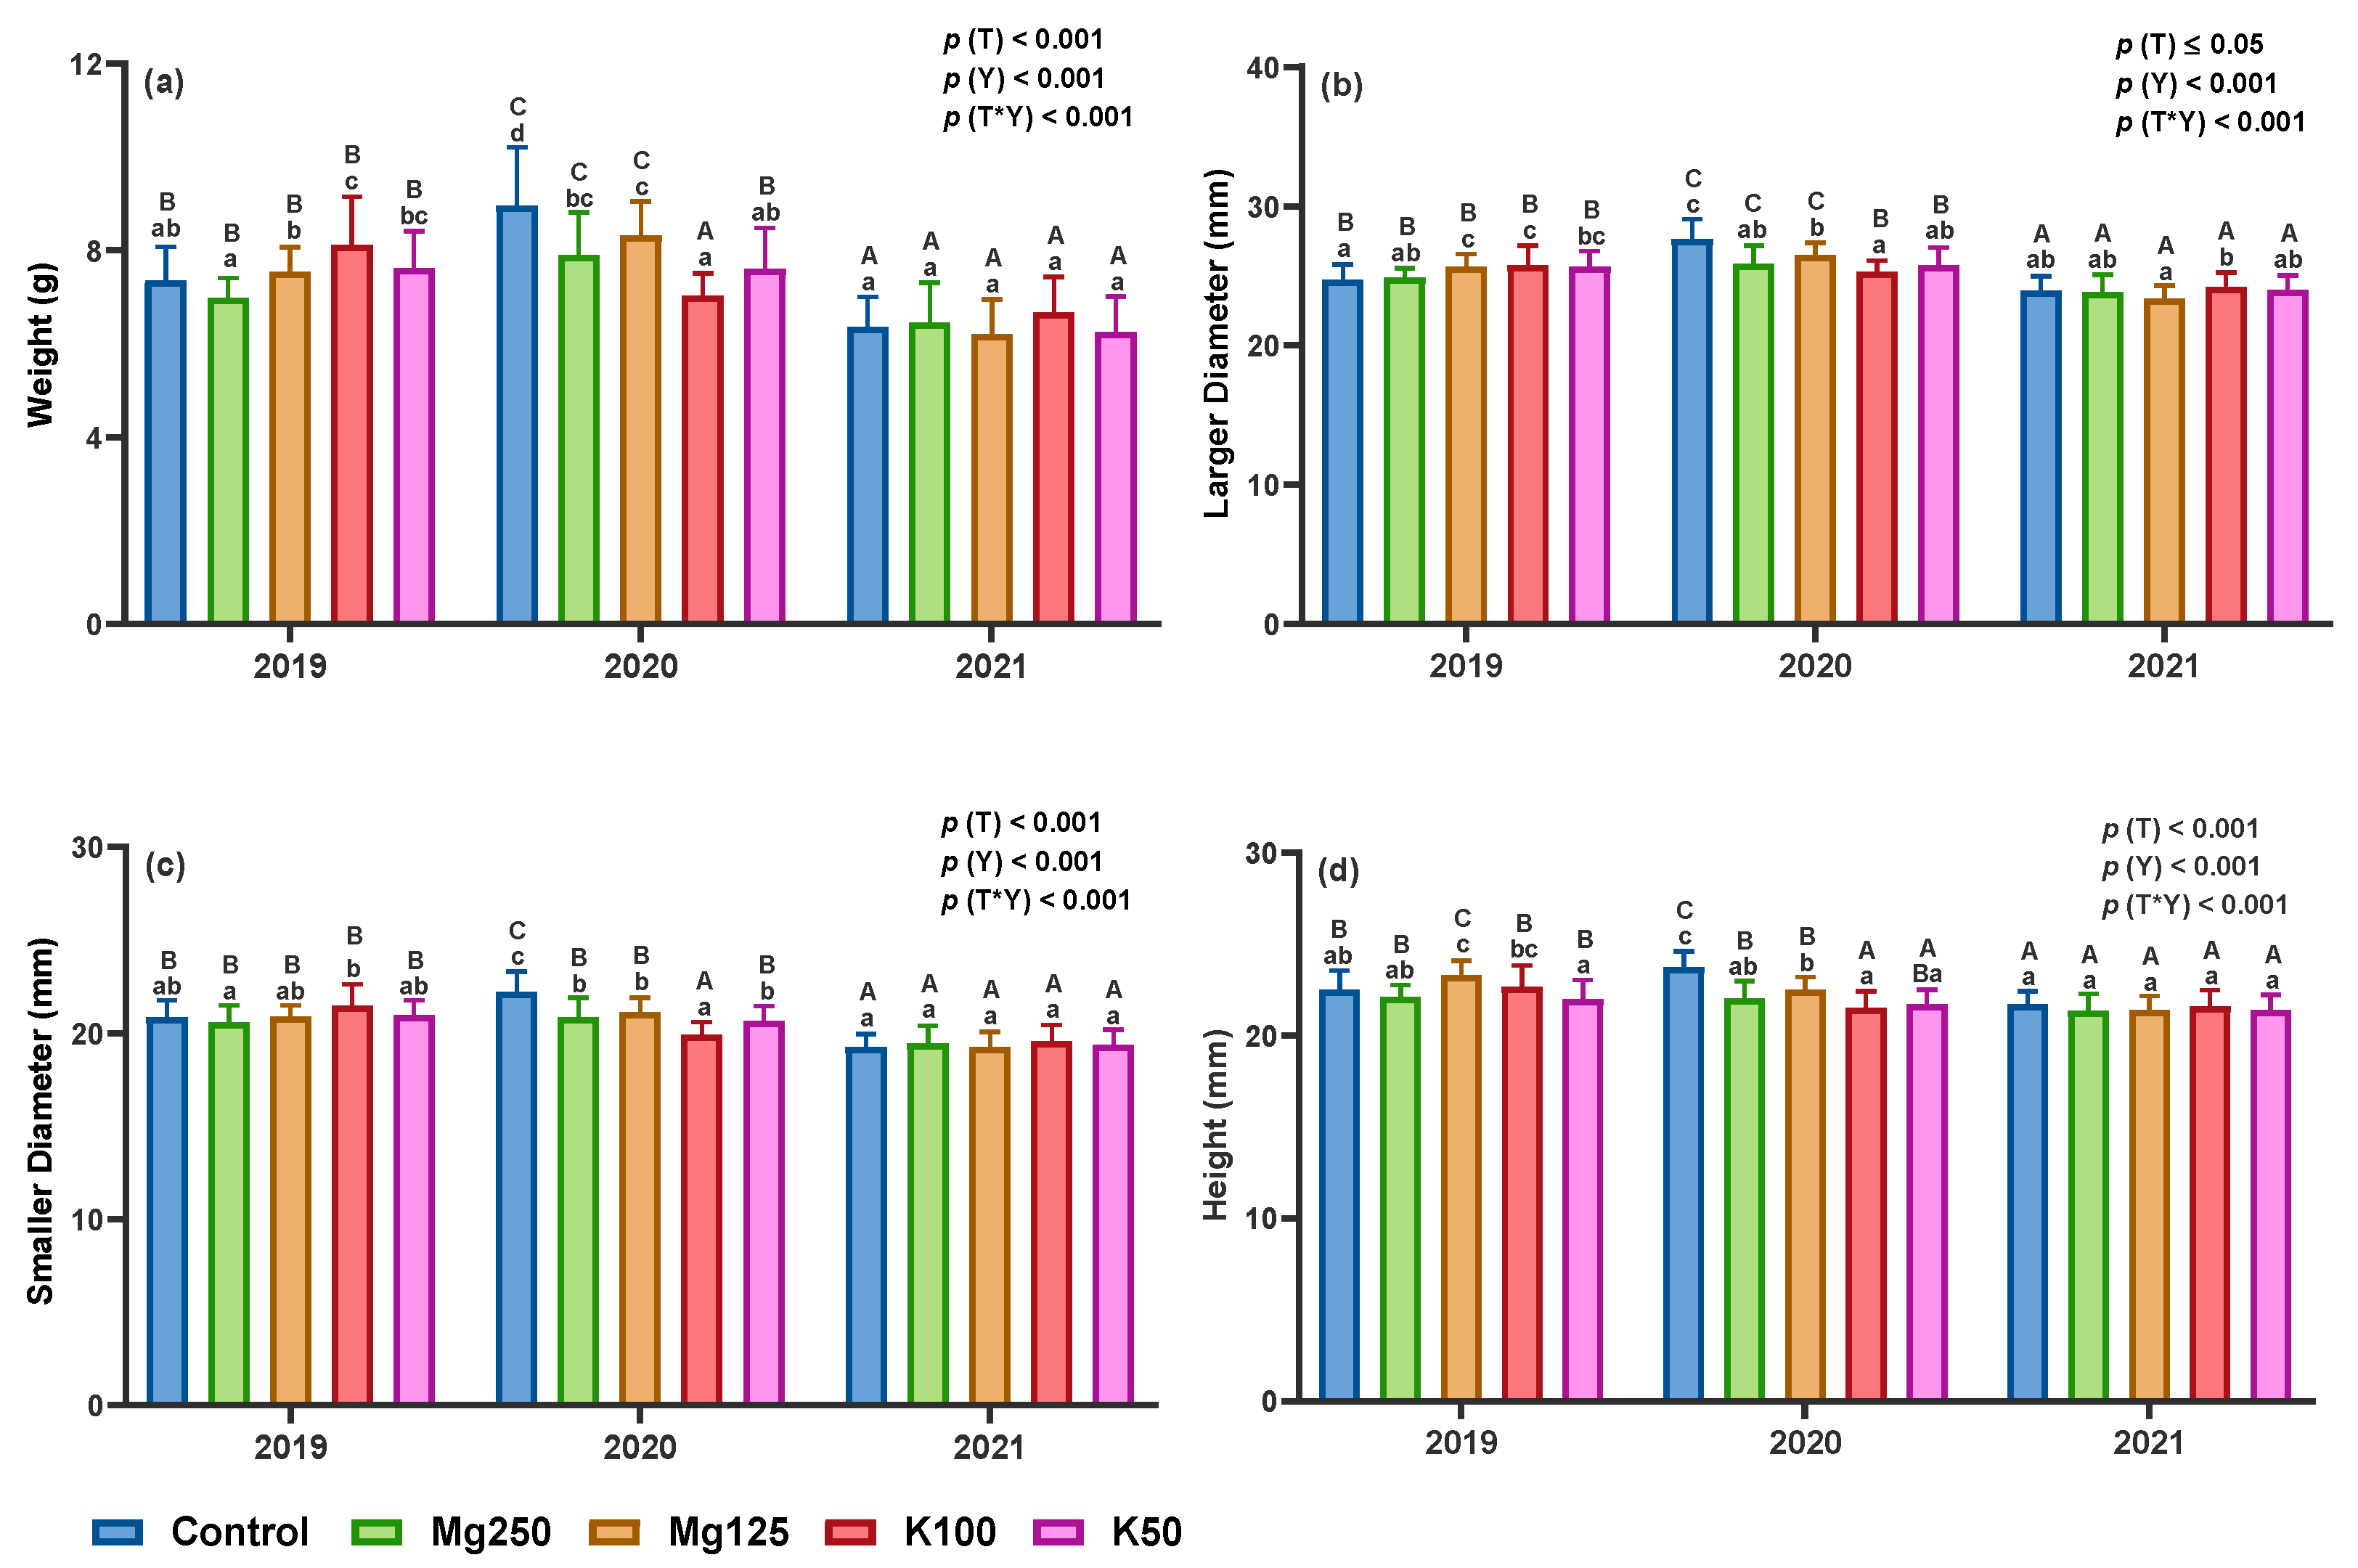
3.2.1. Biometric Parameters

In general, biometric parameters (Figure 2) were affected by treatment, by year, and by the interaction between treatment and year. In 2019, all biometric parameters were affected by treatment. The K100-treated cherries presented the highest values for weight (8.12 g), larger diameter (25.76 mm), and smaller diameter (21.48 mm), while Mg125-treated cherries had the highest height (23.30 mm). In contrast, Mg250-treated cherries presented the lowest weight (6.99 g) and smaller diameter (20.57 mm), control cherries had the lowest larger diameter (24.71 mm), and K50 fruits presented the lowest height (21.97 mm). In 2020, all biometric parameters were affected by treatment. Control cherries presented bigger and heavier fruits (8.97 g for weight, 27.66 mm for larger diameter, 22.25 mm for smaller diameter, and 23.76 mm for height), while K100-treated cherries produced smaller and lighter fruits (7.03 g for weight, 25.31 mm for larger diameter, 19.92 mm for smaller diameter, and 21.51 mm for height). Conversely, in 2021, only larger diameter evidenced statistical differences among treatments, varying from 23.33 mm in Mg125-treated cherries to 24.19 mm in K100 fruits. The effect of the year within each treatment also presented significant differences for all biometric parameters. Overall, in 2020, all treatments produced bigger cherries, characterized by increased fruit weight and dimensions, except for K100, which presented higher fruits in 2019, and K50, whose fruit size remained consistent in both 2019 and 2020. Conversely, all treatments resulted in smaller cherries in 2021.

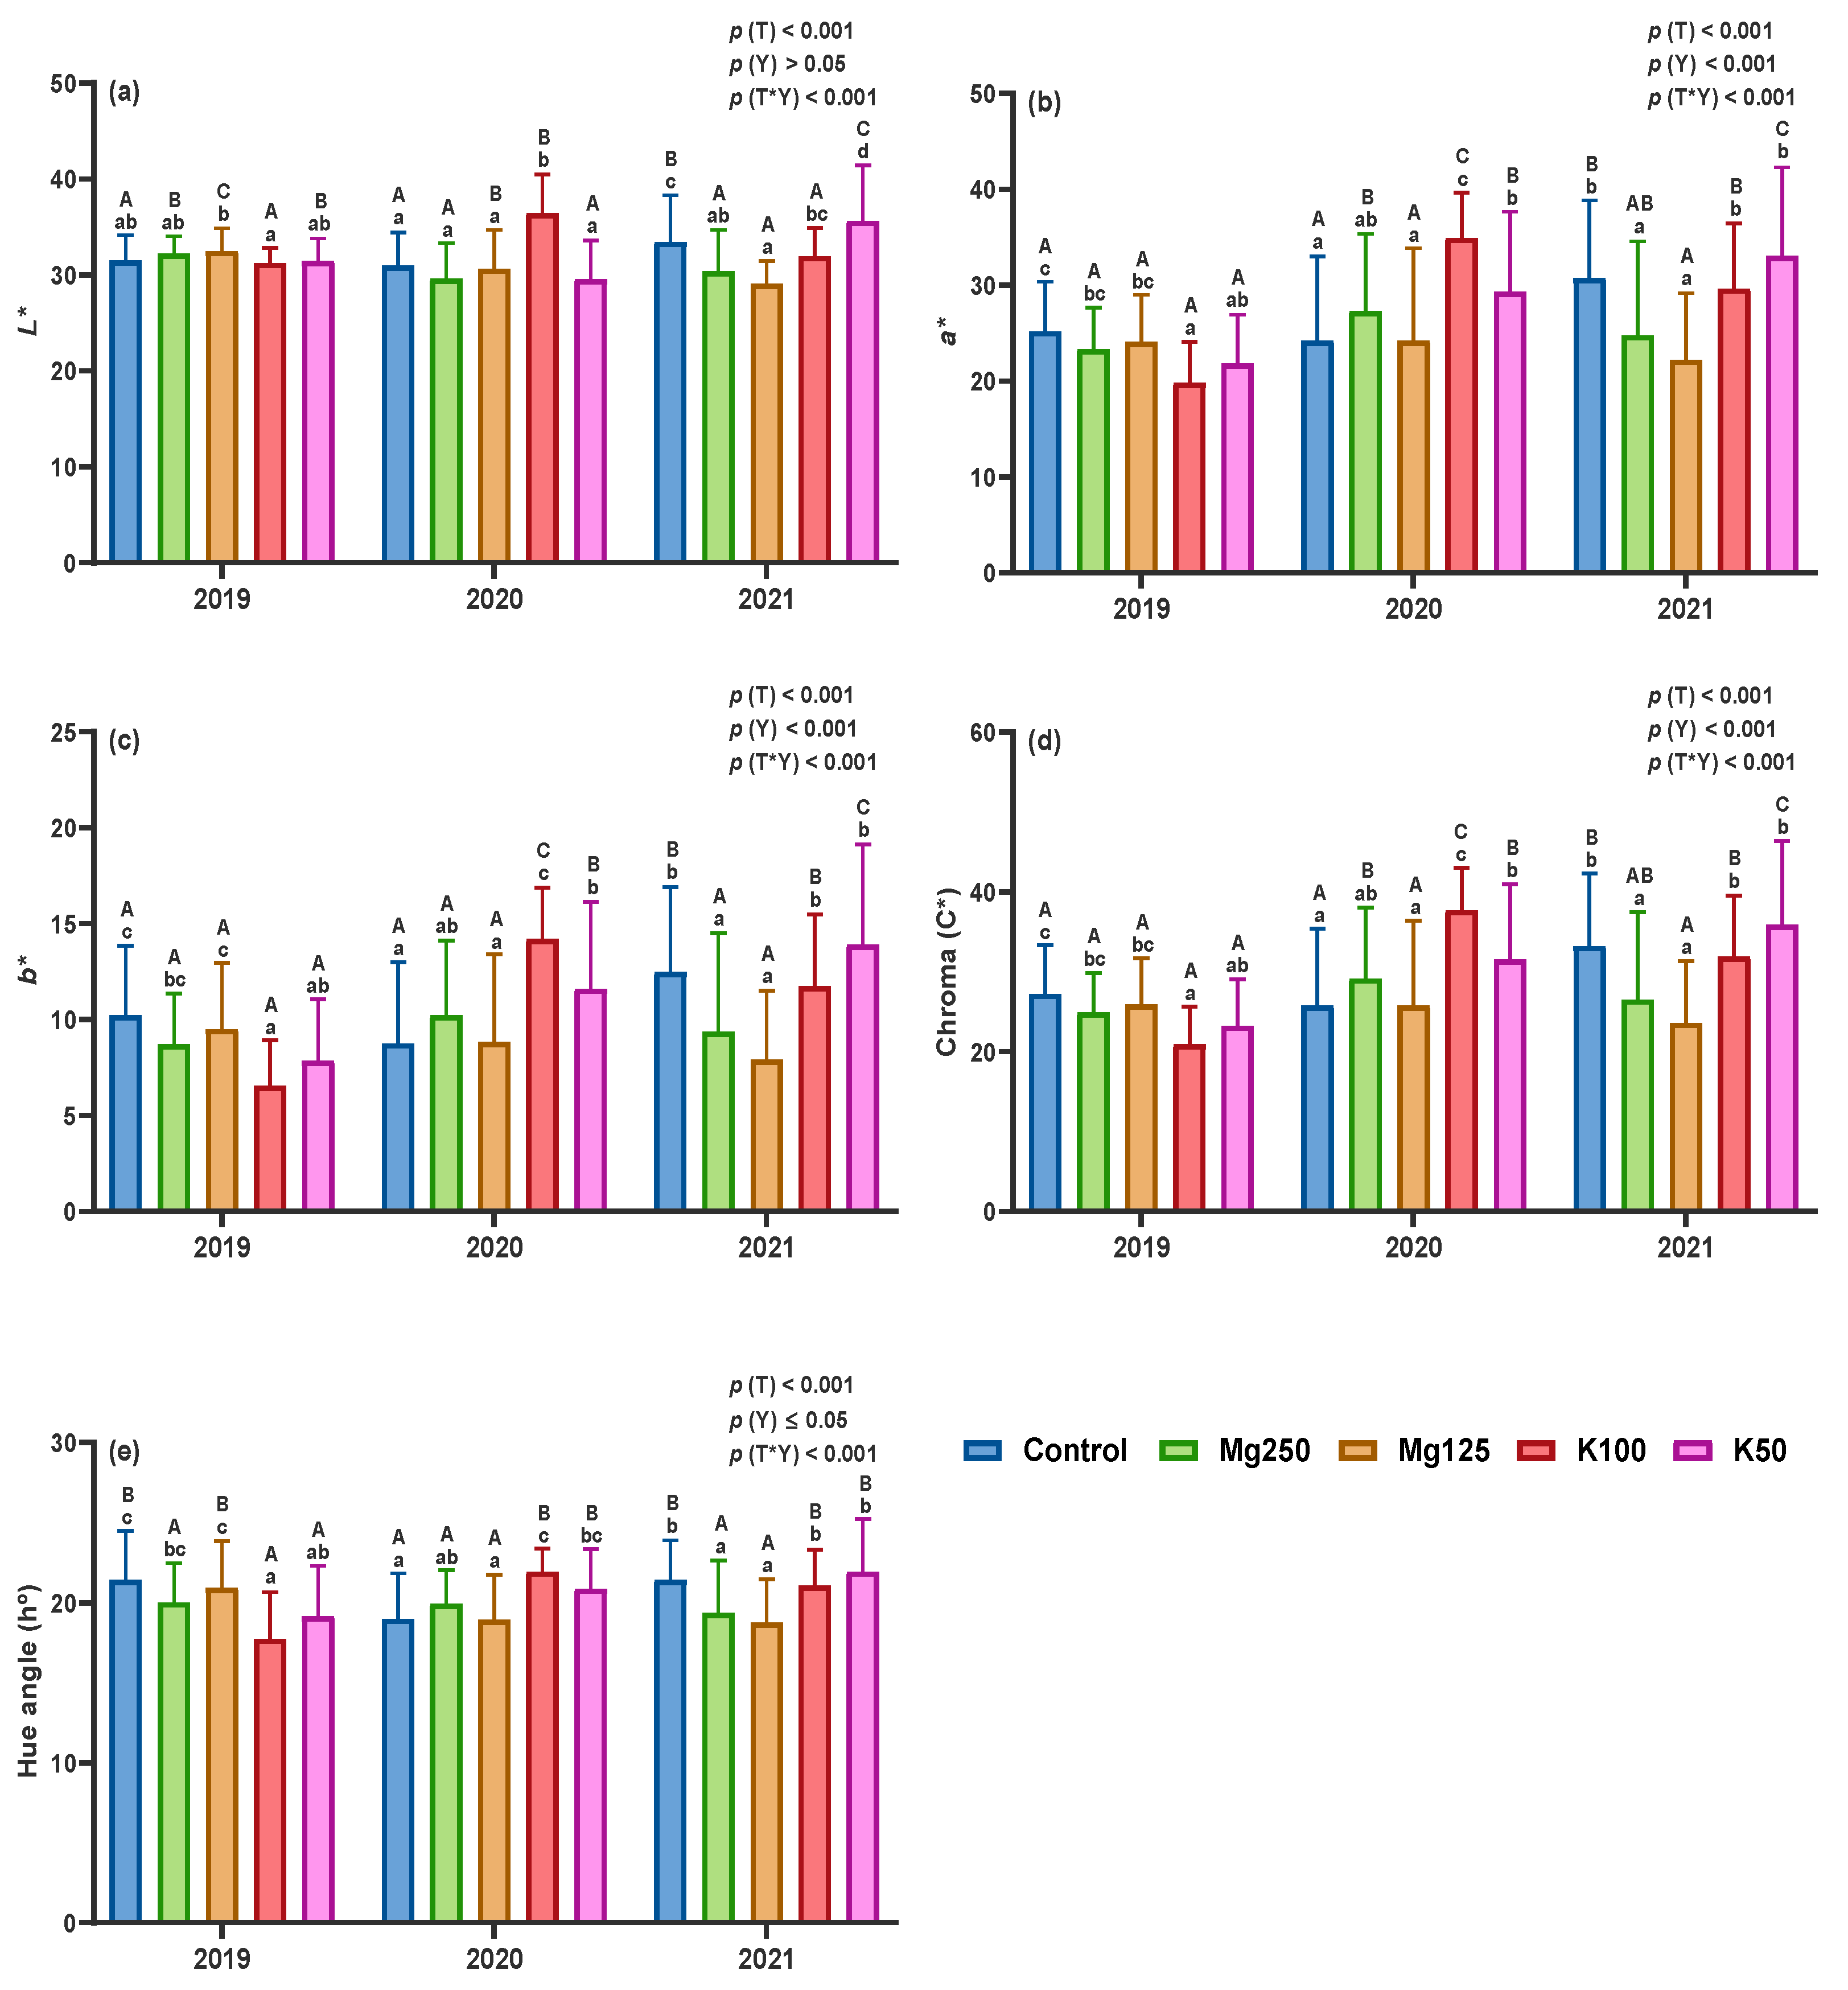
3.2.2. Chromatic Parameters

Chromatic parameters (Figure 3) were affected by treatment, by year, and by the interaction between treatment and year. The coordinates a*, b*, and C* and the hue angle were also affected by the year. In 2019, significant differences were found among the treatments for all chromatic parameters. Control cherries presented the highest values of a* (25.22), b* (10.23), C* (27.25), and h (21.44), while Mg125-treated cherries had the highest L* (32.51). The lowest values for all chromatic parameters were found in K100-treated cherries (31.26 for L*, 19.84 for a*, 6.55 for b*, 20.92 for C*, and 17.76 for h), meaning redder and darker cherries. In 2020, all chromatic parameters were affected by treatment. The K100-treated cherries were lighter and probably less mature, presenting the highest L* (36.44), a* (34.96), b* (14.21), C* (37.74), and h (21.96). In contrast, fruits from the control and Mg125 treatments presented the lowest values for all chromatic parameters, with striking similarities observed between the two treatments. In 2021, statistical differences were found among the treatments for all chromatic parameters. Lighter cherries were found in K50 fruits, presenting the highest values of L*, a*, b*, C*, and h (35.63, 33.07, 13.91, 35.91, and 21.97, respectively). On the other side, redder and darker cherries were found in Mg125 fruits, with the lowest values of L* (29.09), a* (22.21), b* (7.92), C* (23.60), and h (18.78). Significant differences were found among years within each treatment for all parameters when potassium was applied (K100- and K50-treated cherries) and in control cherries. L*, a*, and C* were also affected by the year in Mg250-treated cherries. Likewise, significant differences were found between years in L* and h in Mg125 fruits. Throughout the three trial years, this led to substantial variability in all chromatic parameters within each treatment.

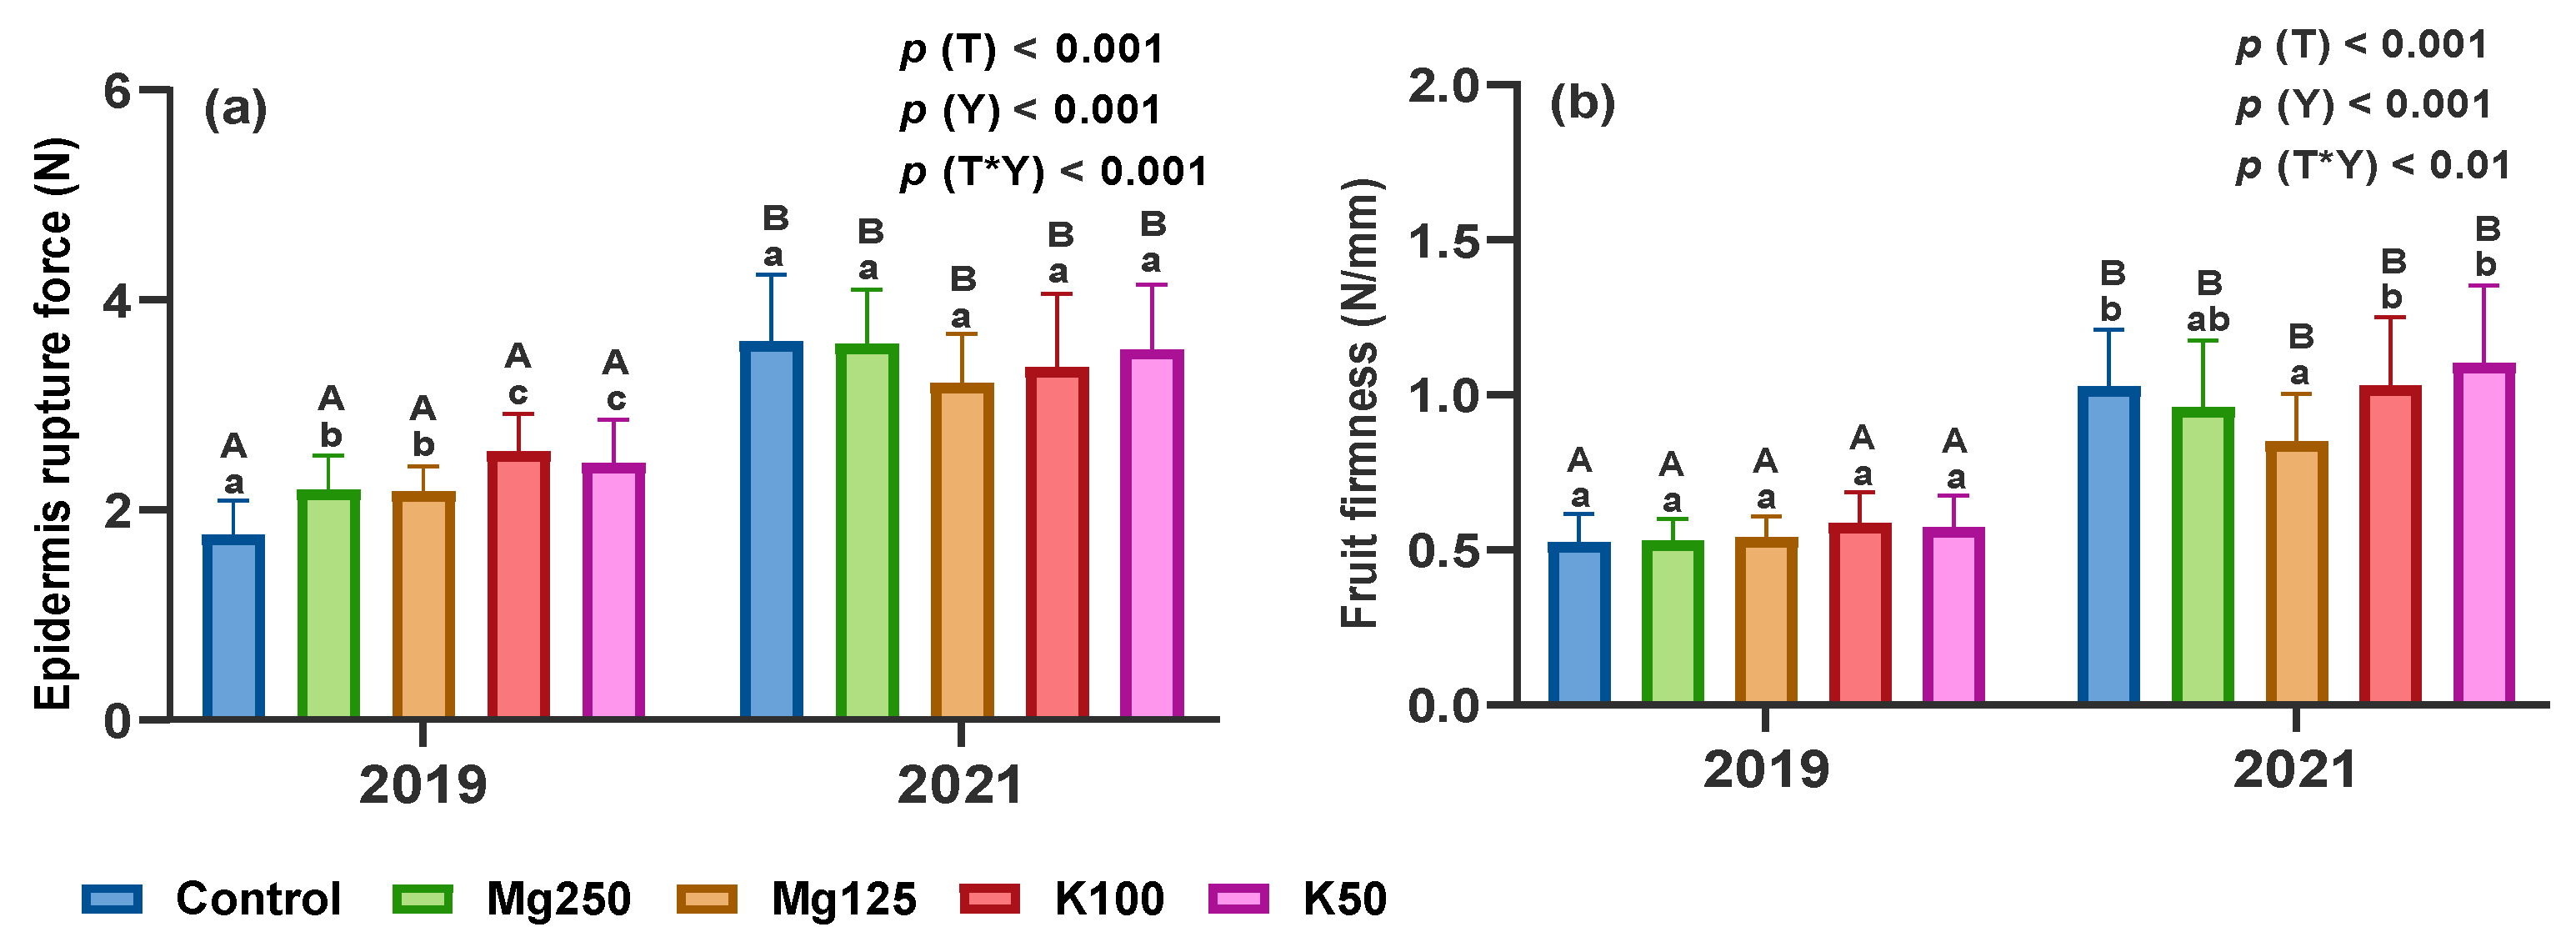
3.2.3. Texture Parameters

ERF and FF (Figure 4) were affected by treatment, by year, and by the interaction between treatment and year. In 2019, significant differences were found among treatments only in ERF, being higher in K100-treated cherries (2.55 N), followed by K50 (2.45 N), Mg250 (2.19 N), Mg125 (2.17 N), and control (1.76 N) fruits. Conversely, in 2021, only FF presented significant differences among treatments, with the highest FF observed in K50 fruits (1.10 N/mm) and the lowest FF in Mg125 cherries (0.85 N/mm). ERF and FF were affected by the year within each treatment, with an increase in both parameters in all treatments in 2021. Potassium treatments showed more consistent cherries and a tougher epidermis, which is considered positive in the analysis by consumers.

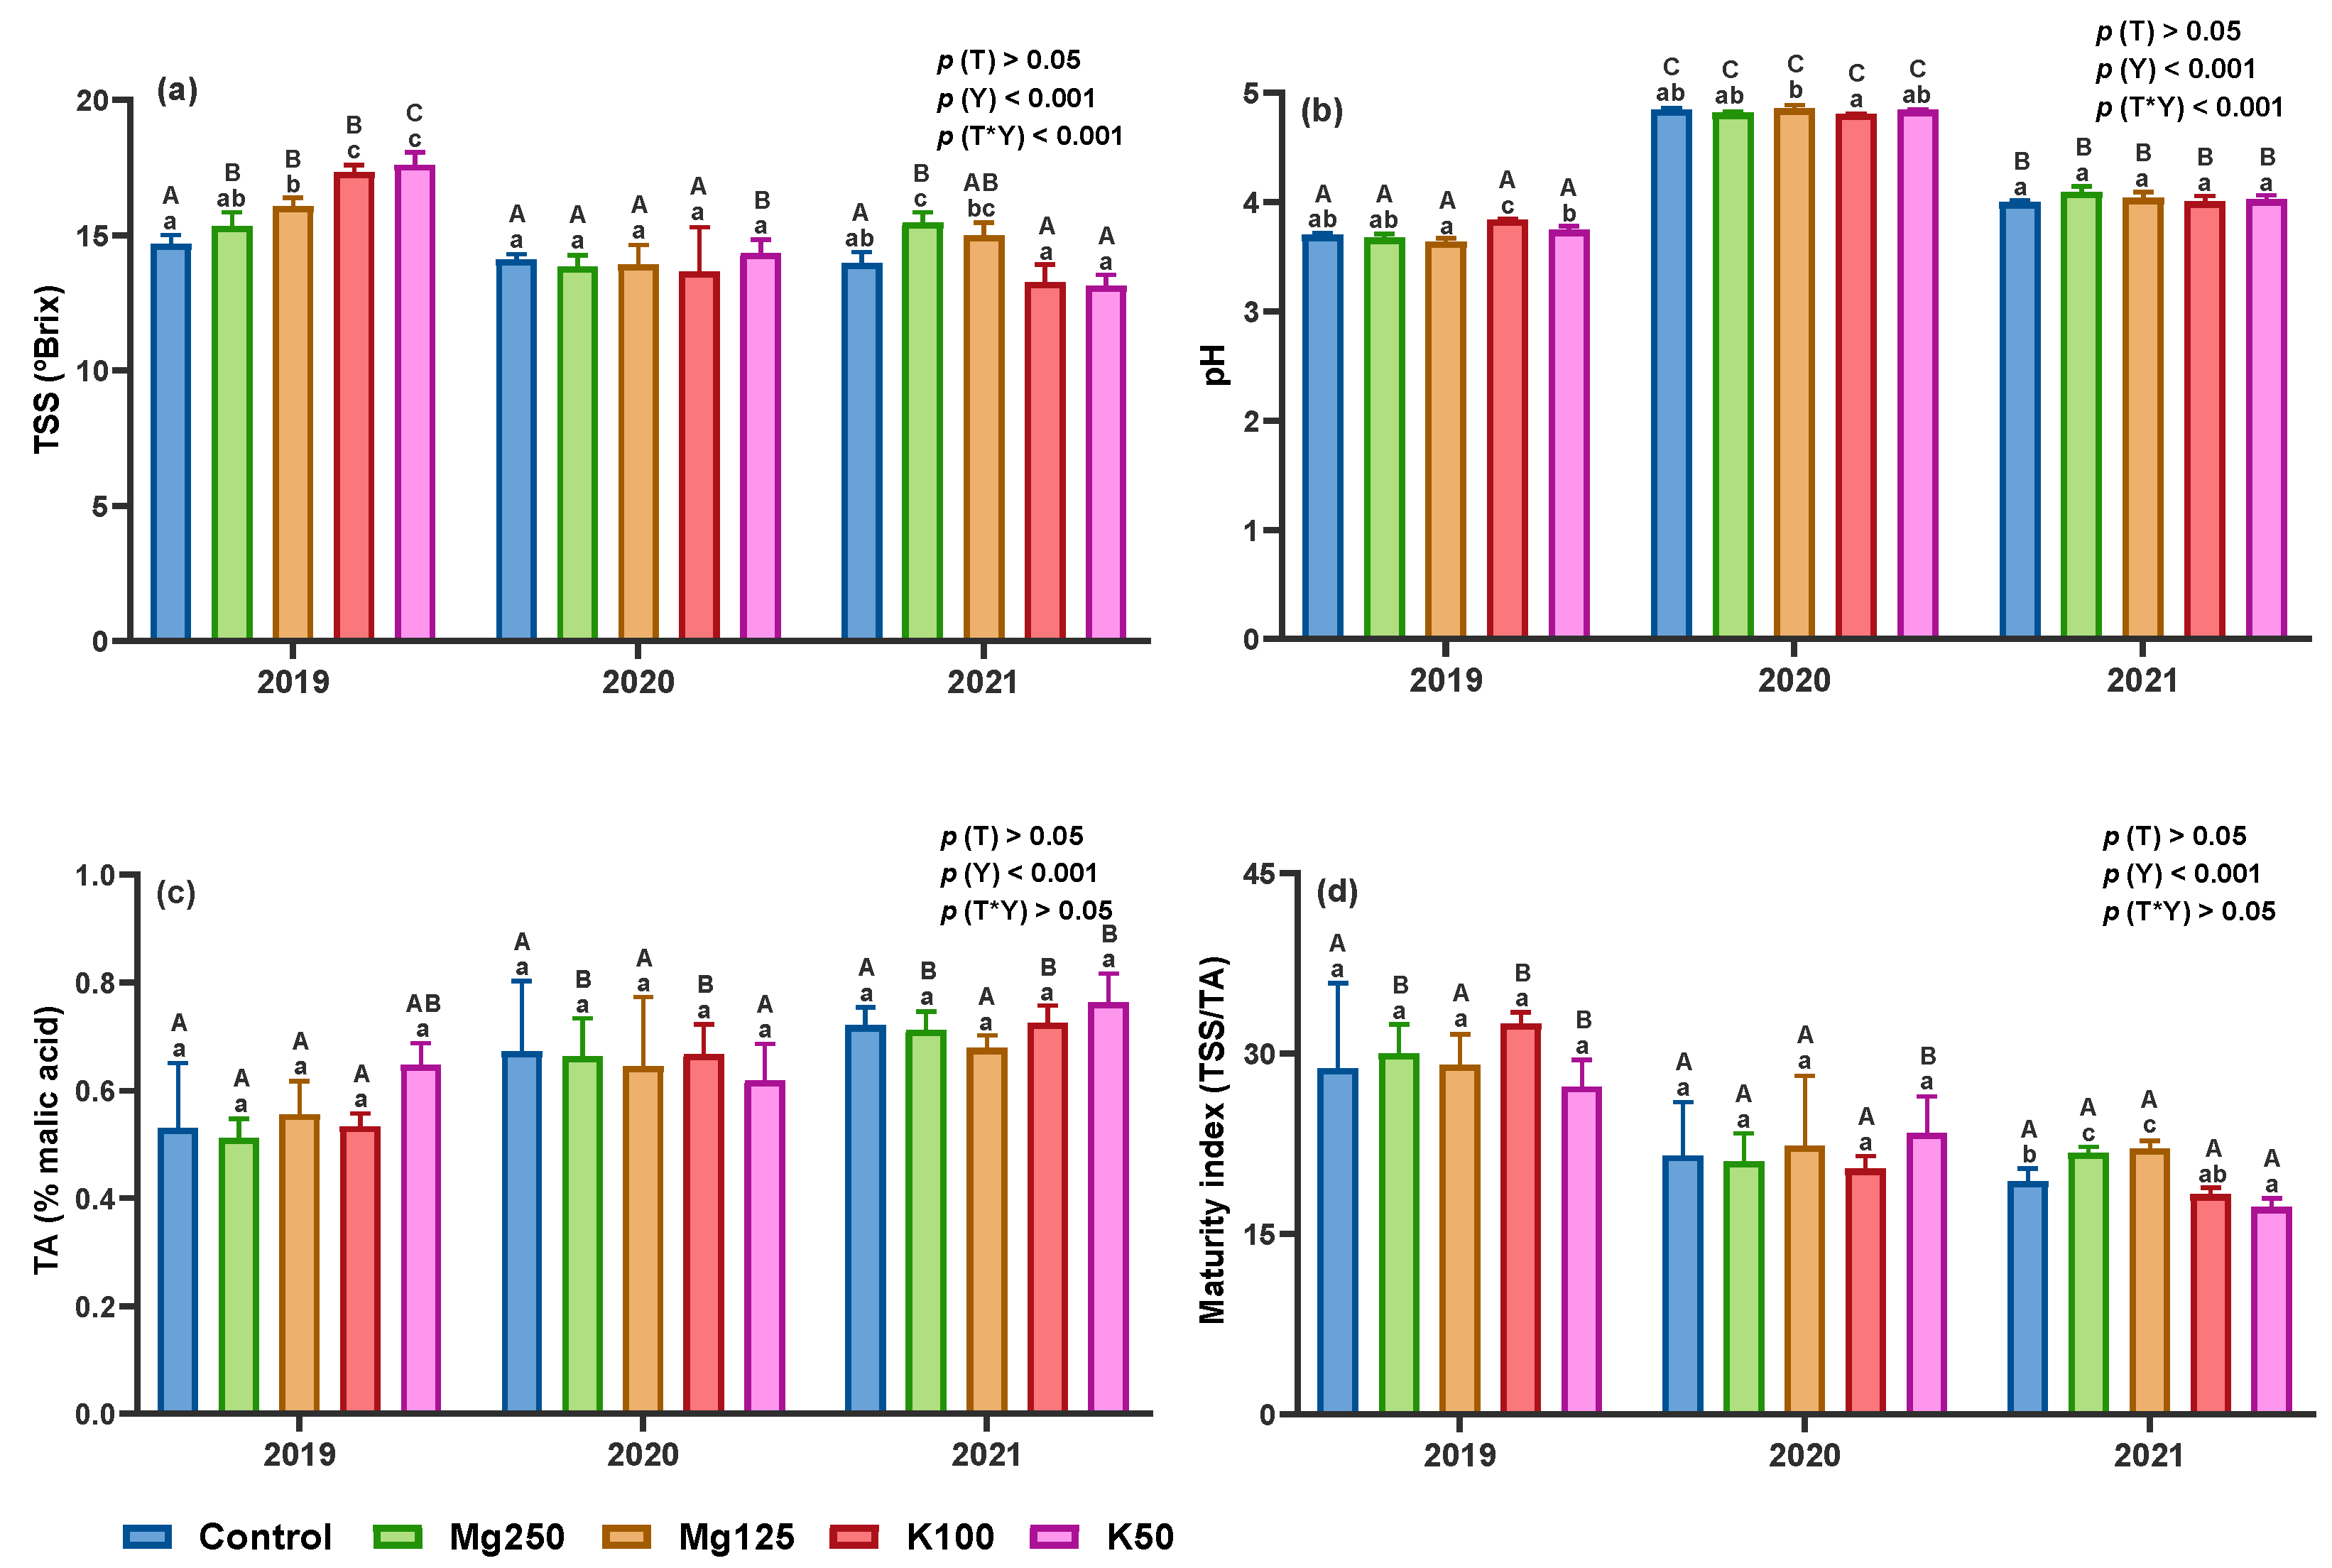
3.2.4. Total Soluble Solids, pH, Titratable Acidity, and Maturity Index

The total soluble solids content (TSS), pH, titratable acidity (TA), and maturity index (MI) (Figure 5) were affected by year. TSS and pH were also affected by the interaction between treatment and year. In 2019, TSS and pH evidenced significant differences among treatments. The highest value of TSS (17.60 Brix) was found in K50-treated cherries, whereas the control cherries presented the lowest TSS (14.70 Brix). pH varied from 3.64 in Mg125 cherries to 3.84 in K100 cherries. In 2020, only pH presented significant differences among treatments, varying from 4.81 in K100 cherries to 4.86 in Mg125 cherries. In 2021, significant differences were observed in TSS and MI. The highest TSS (15.47 Brix) and the highest MI (22.10) were found in Mg250- and Mg125-treated cherries, respectively. K50 treatment produced less mature cherries (17.23) with the lowest TSS content (13.13 Brix). The effect of the year within each treatment evidenced statistical differences in TSS for Mg250, Mg125, K100, and K50 treatments and in pH for all treatments. TA and MI presented differences among years in Mg250, K100, and K50. Overall, TA increased in all treatments throughout the three trial years, while MI decreased with lower values in 2021. TSS content decreased in 2020 in all treatments, presenting similar values in 2020 and 2021, except treatments with magnesium (Mg250 and Mg125 fruits) that increased again in 2021. pH was higher in 2020 in all treatments.

3.2.5. Correlations (between Cherry Quality Parameters)

Pearson’s correlations were performed among the analyzed cherry quality parameters (Table 3). Biometric parameters were negatively correlated with ERF (R = −0.416, p < 0.001; R = −0.354, p < 0.001; R = −0.467, p < 0.001; and R = −0.333, p < 0.001 for weight, larger diameter, smaller diameter, and height, respectively) and FF (R = −0.455, p < 0.001; R = −0.398, p < 0.001; R = −0.507, p < 0.001; and R = −0.317, p < 0.001 for weight, larger diameter, smaller diameter, and height, respectively), meaning that bigger fruits are less firm and require lower epidermis rupture force. Fruit weight was also positively correlated with pH (R = 0.460, p = 0.001) and negatively correlated with TA (R = −0.348, p = 0.019). Concerning the routine parameters, a negative correlation was observed between TSS and a* coordinate (R = −0.433, p = 0.003), between TSS and b* coordinate (R = −0.382, p = 0.010), and between TSS and C* coordinate (R = −0.425, p = 0.004). The same occurred between MI and a* coordinate (R = −0.420, p = 0.004), between MI and b* coordinate (R = −0.349, p = 0.019), and between MI and C* coordinate (R = −0.409, p = 0.005). On the other hand, positive correlations were found between TA and a* coordinate (R = 0.317, p = 0.034) and between TA and C* coordinate (R = 0.308, p = 0.040). Regarding the relation between texture and routine parameters, a negative correlation was found between ERF and TSS (R = −0.372, p = 0.043) and between ERF and MI (R = −0.667, p < 0.001), as well as between FF and TSS (R = −0.601, p < 0.001) and between FF and MI (R = −0.793, p < 0.001). In contrast, a positive correlation was observed among ERF and pH (R = 0.793, p < 0.001), ERF and TA (R = 0.705, p < 0.001), FF and pH (R = 0.736, p < 0.001), and FF and TA (R = 0.774, p < 0.001).

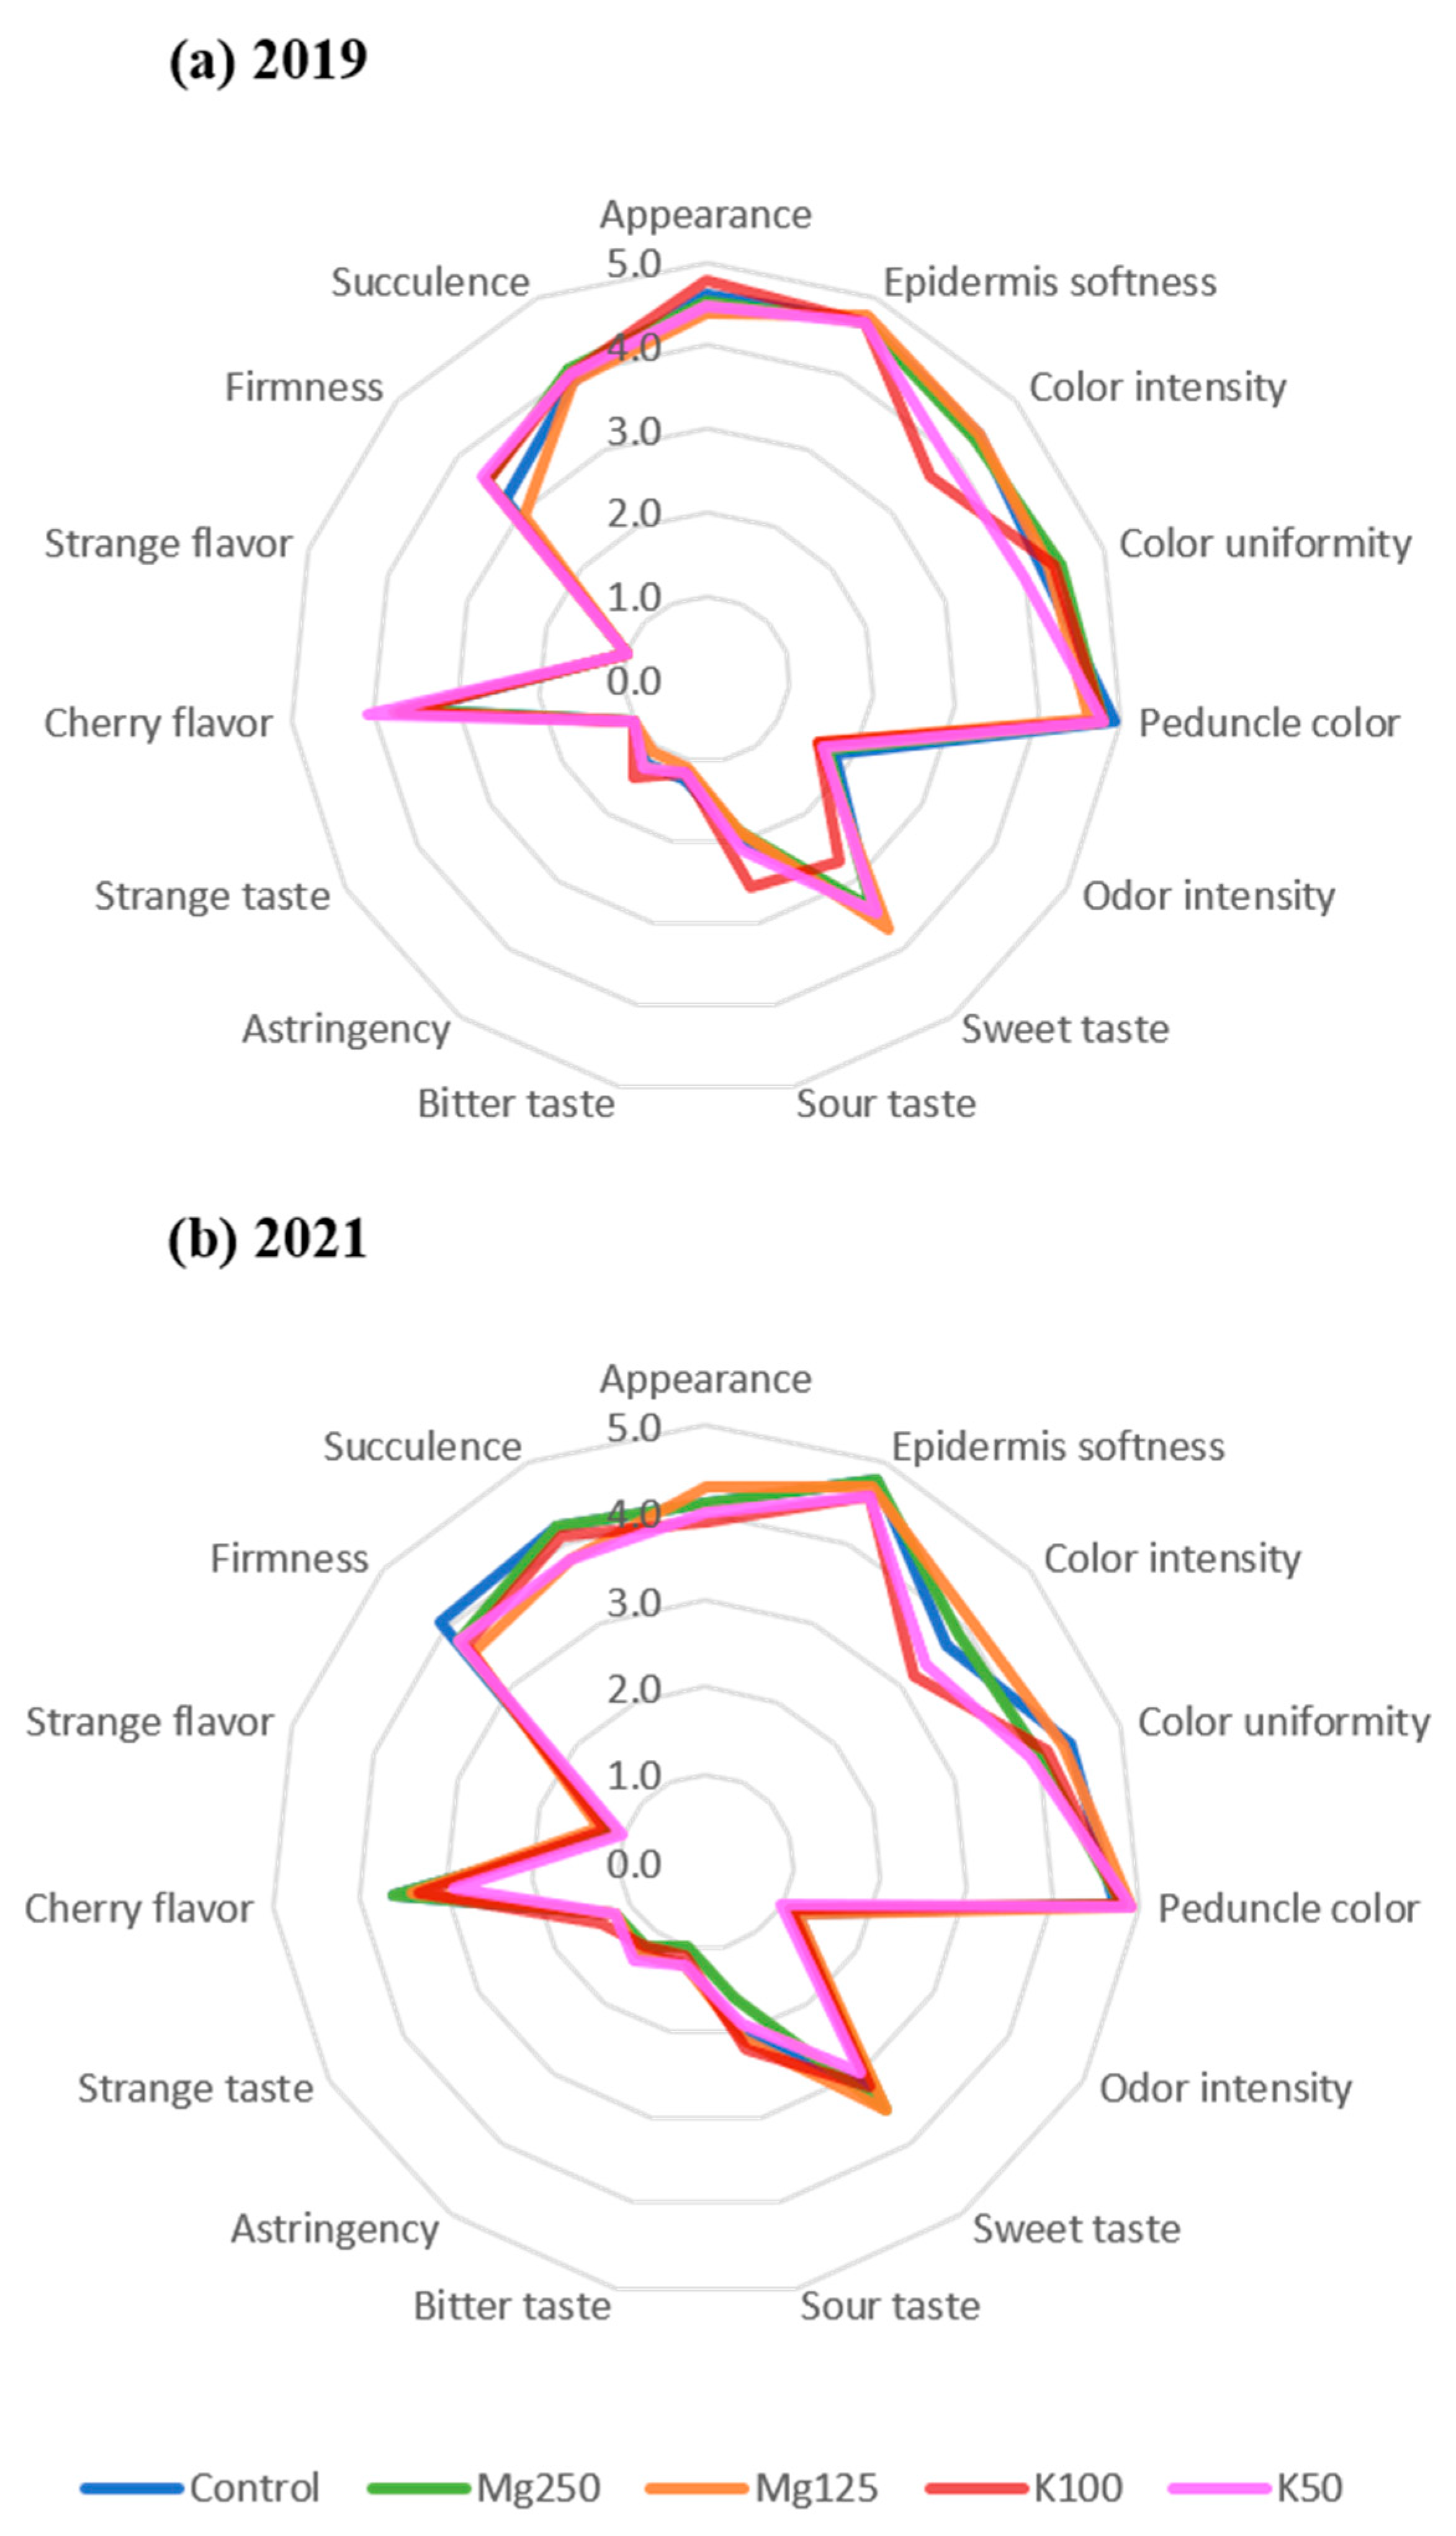
3.3. Sensorial Analysis

The effect of magnesium and potassium on sensory attributes was also assessed (Figure 6). All sensory attributes were not affected by treatment (p > 0.05 for all), nor by the interaction between treatment and year (p > 0.05 for all), but most of them were affected by year (p < 0.001). Only appearance, astringency, and succulence were not affected by year (p >0.05). Color intensity and color uniformity were the most variable sensory attributes among treatments in both years. A considerable increase in firmness was also observed in 2021, confirming the results of the instrumental texture (3.1.3).

4. Discussion

Nutritional value is an indicator of consumer preference and is defined as a postharvest quality parameter [41]. Fruits are considered an essential source of macronutrients and micronutrients with significant benefits for human health due to their interesting nutritional profile [42]. The nutritional analysis evidenced a higher amount of the macronutrients N and K and the micronutrients B and Fe in sweet cherries. Within the macronutrients, N and S were in higher amounts in the cherry pulp, while Ca and Mg had higher quantities in the cherry skin. Concerning the micronutrients, cherry skin had higher B, Mn, and Cu, whereas cherry pulp was richer in Fe. Despite this difference, assuming that consumers eat pulp and skin cherries, they will consume each nutrient in each cherry. The K50 treatment increased the amounts of almost all macronutrients and micronutrients in the pulp and skin, allowing a major nutritional value of the fruit, compared with the other fertilization strategies under study. Sweet cherry has been considered a fruit rich in macronutrients and micronutrients, contributing to the maintenance of human health with antimicrobial, anticancer, anti-inflammatory, antidiabetic, antioxidant, anti-neurodegeneration, and cardiovascular benefits [6,10,43]. Our findings allow us to enhance the sweet cherry as a fruit with high nutritional value and prove it as one of the most appreciated fruits worldwide.
In our study, the magnesium and potassium nutrients were applied at a foliar level to understand their effect on cherry quality parameters. Sweet cherry trees treated with potassium (K100 and K50) produced bigger fruits in 2019 and 2021, while the control treatment increased the fruit size in 2020. Similar results were obtained by Erdal and Saraçoğlu [44] and Yener and Altuntaş [19], where the foliar application of potassium in sweet cherry increased fruit size. Foliar application of potassium also increased tomato fruit size [45,46]. To our knowledge, there are no studies about the effects of an individual foliar application of magnesium on sweet cherry quality. However, magnesium application increased fruit size in tomatoes [47]. An enhancement of color development, as evidenced by the lowest values of colorimetric coordinates, occurred in K100-treated cherries in 2019, in control and Mg125-treated cherries in 2020, and again in Mg125 cherries in 2021. This suggests the presence of cherries with a redder and darker hue, likely indicating a higher level of maturity. In a study carried out on oranges, Mg application promoted color development and fruit ripening [48]. In contrast, a delay in color development, indicated by the highest values of colorimetric coordinates, was observed in control cherries in 2019, K100 fruits in 2020, and K50 cherries in 2021. This suggests lighter cherries, likely indicating less maturity. In sweet cherry, potassium application has negatively affected fruit coloring [44], with an increase in C* and h values and a delay in cherry maturity [19]. Concerning the firmness parameters, fertilization with potassium (mainly K100) produced firmer cherries in 2019, requiring a higher rupture force. In contrast, control and K50 treatments generated firmer cherries in 2021. Previous studies have also reported improved fruit firmness in sweet cherries following potassium application [19,44]. However, in general, quality parameters were not affected by the treatment. Despite this, potassium treatments (both K100 and K50) produced sweeter cherries in 2019, and an enhancement in maturity was observed with the K100 treatment, aligning with the description of redder and darker cherries above. Conversely, the K100 treatment resulted in more sour cherries (lower TSS and higher TA). It induced a delay in maturity in 2020, consistent with the description of lighter cherries based on chromatic parameters. The same trend was observed in potassium treatments (K100 and K50) in 2021, resulting in more sour cherries (lower TSS and higher TA) and a delay in maturity, corresponding to lighter cherries in K50 fruits. A study carried out by Yener and Altuntaş [19] reported an increase in TSS and TA in sweet cherries promoted by potassium application. Similarly, higher TSS content was described by Erdal and Saraçoğlu [44] when potassium was applied to sweet cherries. Instead, in 2021, magnesium treatments (Mg250 and Mg125) produced sweeter cherries (higher TSS and lower TA) with an improvement in maturity (corresponding to redder and darker cherries in Mg125 as described above). Although no studies were found with magnesium application in sweet cherries, magnesium application in tomatoes produced fruits with higher TSS and lower TA as the Mg concentration increased [47].
Simultaneous fertilization with potassium and magnesium could have a synergistic or antagonist relation, where K/Mg ratios highly affect the quality parameters in horticultural crops, like TSS or TA [23]. If more potassium is present, the magnesium absorption will be reduced; in contrast, if more magnesium is available, the potassium absorption will be inhibited [25]. Thus, although it is challenging, it is essential to determine K/Mg ratios to obtain a balanced nutrition with K and Mg and to increase crop yield and quality [23]. A previous work on grapes reported that the individual applications of Mg and K positively affected grape yield more than a combination of both nutrients [49]. Nevertheless, more recently, in grapes, the combination of Mg and K improved the strength and fruit firmness [50]. In our study, the combination of Mg and K positively affected cherry quality, mainly in fruit size and firmness.
Beyond plant nutrition, environmental conditions highly affect the quality of the crop. In temperate climates, most crop trees require a cool accumulation during the winter, followed by a subsequent heat during their dormant phase to restart the growth and initiate blossoming in the following spring [51]. Blossoming is a critical stage for fruit development and significantly impacts crop fruiting, production, and yield [52]. Cherry is one of the fruit crops with the highest number of cool hours needed [53], being very sensitive to a reduced winter chill accumulation and to a late spring frost that can lead to flower damage (if occurring in an advancement of flower blossom time) [54]. If these requirements are compromised, in the following growing season, an irregular, delayed, and asynchronous growth, blossoming, and fruit set will be observed [51]. On the other hand, the crop’s physiological responses to climate changes impact growth and development, as well as the quality and yield of crops [5]. In our work, the effects of environmental conditions were considerable in cherry quality parameters. Biometric parameters were affected by year and interaction between treatment and year, producing, in general, bigger cherries in 2020 and smaller cherries in 2021. According to Whiting et al. [55] and Whiting et al. [56], there is a negative correlation between fruit size and yield; that is, when the yield is low, the fruit size increases (as well the opposite, high yield is associated with smaller fruits). Indeed, according to FAOSTAT [9], in 2020, the yield was lower (9 240 t), and in 2021, it was higher (23 930 t). Chromatic parameters were affected by the interaction between treatment and year, and most of them (a*, b*, C*, and h) were also affected by the year, resulting in considerable variability in color along the three trial years. In the firmness parameters, ERF and FF increased in all treatments in 2021, affected by year and the interaction between treatment and year. Similarly, all quality parameters were affected by the year; TSS and pH were also affected by the interaction between treatment and year. This results in an increase in TA, a decrease in TSS and MI during the three trial years, and a higher pH in 2020. As reported in Figure 1, 2019 was extremely hot and dry. In the following years, 2020 and 2021, the blossom and fruit development periods were a bit rainy, especially in March 2020 (107.8 mm), which probably negatively affected the flowering and fruit development. Rain can interfere with pollination [57]. On the other hand, in April, the mean temperature increased in 2020 (13.5 °C) and in 2021 (14.4 °C), and simultaneously was coincident with a rain period in the same month (73.2 mm in 2020 and 90.4 mm in 2021). A rise in temperature from January to May was reported, mainly in March and April, which can interfere with pollination and, if it coincides with late frost, will damage the flowers, affecting the blossom and fruit development [57]. In cv. Burlat (the same used in this study), an advance of 14.1 days in flowering was described, coinciding with late spring frost in temperate climates [54]. Climate change has been associated with poor fruit quality, reduced fruit size, low color development, and low juice content [52]. A reduction in color development and a delay in fruit maturity have been linked to high temperatures [4].
In challenging markets, high-quality parameters are ensured to achieve a lucrative price in the export market [52]. The appearance, texture, and flavor of fruits are included in the postharvest quality parameters within the consumer’s acceptance [41]. Fruit size is an important quality attribute that significantly impacts fruits’ economic value and is a crucial parameter for cherry consumers’ preference [19]. According to Kappel et al. [58], the optimal cherry size should be 11 to 12 g and 29 to 30 mm in diameter, since consumers prefer larger fruit sizes [15,59]. In our results, the fruit weight and diameter values were lower than these. Nevertheless, we used an early Burlat cultivar that generally produces smaller fruits. A study carried out by Gonçalves et al. [60] in cv. Burlat obtained a lower fruit weight (5.24 g) and a lower fruit diameter (18.9 mm) than that observed in our study. This suggests that magnesium and potassium application can improve fruit size. Moreover, another survey carried out by Paunović et al. [12] shows that about 43% of consumers prefer medium cherries (21.4 to 25.4 mm), and about 45% prefer large cherries (25.4 to 29.8 mm). According to these values, the nutrients used in our study produced cherries of acceptable size for consumers. Fruit color is the leading maturity indicator [61] and an essential visual quality parameter, contributing to consumers’ preferences and acceptability [62], who prefer dark red sweet cherries [15,59]. In our results, darker and redder cherries were mainly found in treatments with magnesium. Fruit removal force and fruit firmness are essential quality parameters in cherry marketing [19], associated with deterioration and mechanical damage resistance, increasing storage life [63], contributing to consumers preferences, who prefer firmer cherries [15,59]. Magnesium and potassium application in our study increased firmness from the first trial year (2019) to the last trial year (2021) in all treatments, mainly in control cherries. TSS, TA, pH, and MI (ratio TSS/TA) are important ripeness and sweetness parameters contributing to the cherry taste development and are considered in consumers’ preference [19]. Ideally, TSS should vary between 17 and 19, with a minimum of 15 in sweet cherry [19,58]. In our study, we achieved these values in the first year of the trial, 2019, in all treatments, and in the last year, 2021, in cherries treated with magnesium (Mg250 and Mg125). pH reaches an optimal value of around 3.8 [58], but a pH between 3.7 and 4.2 makes cherry slightly acidic [19]. Our results agree with these values in all treatments in 2019 and 2021, whereas in 2020, the pH values were higher. According to Yener and Altuntaş [19], TA reaches an optimal value of 0.7 to 1.2 g of malic acid in cherry. The Mg and K fertilization in our study allowed us to obtain similar values in cherries from all treatments in the three trial years. However, in fruits, physiological and yield attributes are sensitive to climate change, like temperature and rainfall [52]. As described before, the environmental conditions had considerable effects on cherry quality parameters in our study, which can interfere with consumers’ preferences.
Analyzing all quality parameters over the three years of the trial, the positive correlations within biometric parameters and chromatic parameters suggested consistency/uniformity in fruit growth and fruit color development, respectively. Nevertheless, the negative correlations between all biometric parameters and all chromatic parameters suggested that smaller fruits presented a lighter color. This means that cherries may have been still developing and were probably less mature. This suggestion was also supported by a positive correlation between chromatic parameters and TA and a negative correlation between chromatic parameters and TSS as well as between chromatic parameters and MI, meaning that lighter cherries also presented a sourer taste and a less sweet taste and probably corresponded to less mature cherries. Likewise, a positive correlation between chromatic parameters and firmness parameters (ERF and FF) was also indicative of less mature cherries since lighter cherries were also firmer. Similarly, firmness parameters (ERF and FF) were negatively correlated with TSS and MI, corroborating the idea that firmer cherries were less sweet and less mature. According to these correlations, the use of magnesium and potassium resulted in a notable consistency and uniformity of fruit growth and color development. However, foliar fertilization with these nutrients provoked a delay in cherry maturity and, thus, a delay in harvest time, mainly when potassium was applied.
Fruit taste is a cherry quality related to sweetness, flavor, and firmness [61]. To satisfy consumers’ preferences, sensory techniques have been used to measure their subjective acceptance according to the evaluated quality attributes [64]. In our study, although the analyzed attributes were not affected by the treatment or by the interaction between treatment and year, most of them were affected by the year, attesting to the effects of environmental conditions one more time in our results. According to the sensory analysis, there was a notable increase in fruit firmness in 2021 relative to 2019, corroborating the results of ERF and FF. The evaluator panel referred to color intensity and color uniformity as the most variable sensory attributes in both years. Despite this, in both years, they highlighted K100 as the treatment with lower color intensity, lower sweet taste, and higher sour taste. In contrast, Mg treatments (both Mg250 and Mg125) were referred to by the evaluators as the ones that produced cherries with higher color intensity, higher sweet taste, and lower sour taste. For consumers, flavor and sweetness are the most critical quality attributes [15,59]. Considering these preferences and sensory analysis results, the magnesium treatments seem to be the most acceptable to consumers.

5. Conclusions

In conclusion, our study sheds light on the crucial role of magnesium and potassium foliar applications in enhancing the quality parameters of sweet cherries. The results indicate that potassium treatments, particularly K100, resulted in larger fruits and improved firmness, while magnesium treatments, especially Mg250 and Mg125, led to sweeter cherries with enhanced color development. Control treatment demonstrated the synergistic effects of magnesium and potassium fertilization on fruit size and firmness. However, environmental conditions, particularly temperature and rainfall patterns, significantly influenced cherry quality parameters, emphasizing the importance of considering climatic factors in orchard management practices. Despite the variations in environmental conditions, the magnesium and potassium treatments consistently improved fruit quality attributes, highlighting their potential for enhancing sweet cherry production. Moreover, the nutritional analysis revealed that potassium treatments, notably K50, significantly increased the levels of macronutrients and micronutrients in cherry pulp and skin, thereby enhancing the fruit’s nutritional value. Overall, our findings underscore the importance of precision horticulture practices, including targeted nutrient management, to optimize sweet cherry quality and nutritional content, thereby meeting consumer preferences and contributing to the fruit’s economic value and global appreciation.

Author Contributions

Conceptualization: M.S. and B.G.; methodology: M.S., S.P. and H.F.; field work monitoring: M.S., S.P., J.R.S. and F.R.; sensorial analysis organization: A.V.; texture analysis: M.S. and C.R.; data analysis: M.S.; writing—original draft preparation: M.S.; writing—review and editing: S.P., H.F., J.R.S., A.V., C.R., F.R., M.E.-C., M.M. and B.G.; supervision: M.E.-C., M.M. and B.G.; funding acquisition: B.G. All authors have read and agreed to the published version of the manuscript.

Funding

This study was supported by the European Agricultural Fund for Rural Development (EAFRD) and by the Portuguese State in the context of action 1.1. Grupos Operacionais integrado na medida 1. Inovação do PDR 2020–Programa de Desenvolvimento Rural do Continente–Grupo Operacional para a valorização da produção da Cereja de Resende e posicionamento da sub-fileira nos mercados (iniciativa nº 362).

Data Availability Statement

All data generated or analyzed during this study are included in this published article.

Acknowledgments

Marlene Santos acknowledges the financial support provided by national funds through FCT (Portuguese Foundation for Science and Technology) (PD/BD/150257/2019) under the Doctoral Program ‘Agricultural Production Chains—from fork to farm’ (PD/00122/2012) and the European Social Funds and the Regional Operational Programme Norte 2020. This study was also supported by the CITAB research unit (https://doi.org/10.54499/UIDB/04033/2020) and the Inov4Agro research unit (https://doi.org/10.54499/LA/P/0126/2020).

Conflicts of Interest

The authors declare no conflicts of interest.

References

  1. Fraga, H.; Santos, J.A. Assessment of climate change impacts on chilling and forcing for the main fresh fruit regions in Portugal. Front. Plant Sci. 2021, 12, 689121. [Google Scholar] [CrossRef]
  2. Roussos, P.A. Climate change impacts on fruit trees and mitigation strategies of adverse effects. AgroLife Sci. J. 2020, 9, 269–276. [Google Scholar]
  3. Haokip, S.W.; Shankar, K.; Lalrinngheta, J. Climate change and its impact on fruit crops. J. Pharmacogn. Phytochem. 2020, 9, 435–438. [Google Scholar]
  4. Roy, A.; Viswanath, M.; Chatarjee, S.; Biswas, A. Climate change crash on fruit crops and management approaches. Pharma Innov. J. 2021, 10, 315–319. [Google Scholar]
  5. Hirpo, F.H.; Gebeyehu, M.N. Review on the effects of climate change variability on horticultural productivity. Int. J. Environ. Sci. Nat. Resour. 2019, 17, 555969. [Google Scholar] [CrossRef]
  6. Blando, F.; Oomah, B.D. Sweet and sour cherries: Origin, distribution, nutritional composition and health benefits. Trends Food Sci. Technol. 2019, 86, 517–529. [Google Scholar] [CrossRef]
  7. Di Matteo, A.; Russo, R.; Graziani, G.; Ritieni, A.; Di Vaio, C. Characterization of autochthonous sweet cherry cultivars (Prunus avium L.) of southern Italy for fruit quality, bioactive compounds and antioxidant activity. J. Sci. Food Agric. 2017, 97, 2782–2794. [Google Scholar] [CrossRef]
  8. Mirto, A.; Iannuzzi, F.; Carillo, P.; Ciarmiello, L.F.; Woodrow, P.; Fuggi, A. Metabolic characterization and antioxidant activity in sweet cherry (Prunus avium L.) Campania accessions: Metabolic characterization of sweet cherry accessions. Food Chem. 2018, 240, 559–566. [Google Scholar] [CrossRef]
  9. FAOSTAT. Crops and Livestock Products. Available online: https://www.fao.org/faostat/en/#data/QCL/visualize2023 (accessed on 20 September 2023).
  10. Gonçalves, A.C.; Bento, C.; Silva, B.; Simões, M.; Silva, R.L. Nutrients, bioactive compounds and bioactivity: The health benefits of sweet cherries (Prunus avium L.). Curr. Nutr. Food Sci. 2019, 15, 208–227. [Google Scholar] [CrossRef]
  11. Correia, S.; Schouten, R.; Silva, A.P.; Gonçalves, B. Factors affecting quality and health promoting compounds during growth and postharvest life of sweet cherry (Prunus avium L.). Front. Plant Sci. 2017, 8, 2166. [Google Scholar] [CrossRef]
  12. Paunović, G.; Hajder, Đ.; Korićanac, A.; Pašalić, B.; Glišić, I.; Cvetkovic, M.; Cvetković, M. Preferences in sweet cherry fruits among consumers in Serbia and Bosnia and Herzegovina. Hortic. Sci. 2022, 49, 189–196. [Google Scholar] [CrossRef]
  13. Acero, N.; Gradillas, A.; Beltran, M.; García, A.; Muñoz Mingarro, D. Comparison of phenolic compounds profile and antioxidant properties of different sweet cherry (Prunus avium L.) varieties. Food Chem. 2019, 279, 260–271. [Google Scholar] [CrossRef] [PubMed]
  14. Nawirska-Olszańska, A.; Kolniak-Ostek, J.; Oziembłowski, M.; Ticha, A.; Hyšpler, R.; Zadak, Z.; Židová, P.; Paprstein, F. Comparison of old cherry cultivars grown in Czech Republic by chemical composition and bioactive compounds. Food Chem. 2017, 228, 136–142. [Google Scholar] [CrossRef]
  15. Bujdosó, G.; Hrotko, K.; Feldmane, D.; Giovannini, D.; Demirsoy, H.; Tao, R.; Ercisli, S.; Ertek, N.; Malchev, S. What kind of sweet cherries do the final consumers prefer? S. West. J. Hortic. Biol. Environ. 2020, 11, 37–48. [Google Scholar]
  16. Neilsen, G.H.; Neilsen, D.; Peryea, F.J.; Fallahi, E. Tomorrow’s challenges in fruit nutrition research: Quo vadis? Acta Hortic. 2010, 868, 27–40. [Google Scholar] [CrossRef]
  17. Bons, H.K.; Sharma, A. Impact of foliar sprays of potassium, calcium, and boron on fruit setting behavior, yield, and quality attributes in fruit crops: A review. J. Plant Nutr. 2023, 46, 3232–3246. [Google Scholar] [CrossRef]
  18. Toor, M.D.; Adnan, M.; Ur Rehman, F.; Tahir, R.; Saeed, M.; Khan, A.; Pareek, V. Nutrients and their importance in agriculture crop production: A review. Indian J. Pure Appl. Biosci. 2021, 9, 1–6. [Google Scholar] [CrossRef]
  19. Yener, H.; Altuntaş, Ö. Effects of potassium fertilization on leaf nutrient content and quality attributes of sweet cherry fruits (Prunus Avium L.). J. Plant Nutr. 2021, 44, 946–957. [Google Scholar] [CrossRef]
  20. Uçgun, K.; Altindal, M. Effects of increasing doses of nitrogen, phosphorus, and potassium on the uptake of other nutrients in sweet cherry trees. Commun. Soil Sci. Plant Anal. 2021, 52, 1249–1256. [Google Scholar] [CrossRef]
  21. Ateş, Ö.; Alveroğlu, V.; Turhan, E.; Yalçin, G.; Taşpinar, K.; Kizilaslan, F. Effects of potassium fertilization on sweet cherry fruit (Prunus avium L.) quality and mineral content. Commun. Soil Sci. Plant Anal. 2022, 53, 1777–1782. [Google Scholar] [CrossRef]
  22. Csihon, A.; Gonda, I.; Orosz-Tóth, M.; Kincses, S.n.; Holb, I. Effect of N, P, K and Mg fertilizers on some vegetative and generative parameters of a sweet cherry cultivar. Int. J. Hortic. Sci. 2020, 26, 27–30. [Google Scholar] [CrossRef]
  23. Xie, K.; Cakmak, I.; Wang, S.; Zhang, F.; Guo, S. Synergistic and antagonistic interactions between potassium and magnesium in higher plants. Crop J. 2021, 9, 249–256. [Google Scholar] [CrossRef]
  24. Wang, Z.; Hassan, M.U.; Nadeem, F.; Wu, L.; Zhang, F.; Li, X. Magnesium fertilization improves crop yield in most production systems: A meta-analysis. Front. Plant Sci. 2020, 10, 1727. [Google Scholar] [CrossRef] [PubMed]
  25. Yan, B.; Hou, Y. Effect of soil magnesium on plants: A review. IOP Conf. Ser. Earth Environ. Sci. 2018, 170, 022168. [Google Scholar] [CrossRef]
  26. Chaudhry, A.H.; Nayab, S.; Hussain, S.B.; Ali, M.; Pan, Z. Current understandings on magnesium deficiency and future outlooks for sustainable agriculture. Int. J. Mol. Sci. 2021, 22, 1819. [Google Scholar] [CrossRef]
  27. Cakmak, I.; White, P.J. Magnesium in crop production and food quality. Plant Soil 2020, 457, 1–3. [Google Scholar] [CrossRef]
  28. Kumar, A.; Kumar, N.; Kavino, M. Role of potassium in fruit crops—A review. Agric. Rev. 2006, 27, 284–291. [Google Scholar]
  29. Imtiaz, H.; Mir, A.R.; Corpas, F.J.; Hayat, S. Impact of potassium starvation on the uptake, transportation, photosynthesis, and abiotic stress tolerance. Plant Growth Regul. 2023, 99, 429–448. [Google Scholar] [CrossRef]
  30. Mostofa, M.G.; Rahman, M.M.; Ghosh, T.K.; Kabir, A.H.; Abdelrahman, M.; Rahman Khan, M.A.; Mochida, K.; Tran, L.-S.P. Potassium in plant physiological adaptation to abiotic stresses. Plant Physiol. Biochem. 2022, 186, 279–289. [Google Scholar] [CrossRef]
  31. Kumari, V.V.; Banerjee, P.; Verma, V.C.; Sukumaran, S.; Chandran, M.A.; Gopinath, K.A.; Venkatesh, G.; Yadav, S.K.; Singh, V.K.; Awasthi, N.K. Plant nutrition: An effective way to alleviate abiotic stress in agricultural crops. Int. J. Mol. Sci. 2022, 23, 8519. [Google Scholar] [CrossRef]
  32. Johnson, R.; Vishwakarma, K.; Hossen, M.S.; Kumar, V.; Shackira, A.M.; Puthur, J.T.; Abdi, G.; Sarraf, M.; Hasanuzzaman, M. Potassium in plants: Growth regulation, signaling, and environmental stress tolerance. Plant Physiol. Biochem. 2022, 172, 56–69. [Google Scholar] [CrossRef] [PubMed]
  33. Predieri, S.; Dris, R.; Sekse, L.; Rapparini, F. Influence of environmental factors and orchard management on yield and quality of sweet cherry. Food Agric. Environ. 2003, 1, 263–266. [Google Scholar]
  34. Wang, Y.-H.; Li, Y.-J.; He, X.-H.; Karim, R.; Shi, X.-J.; Xie, D.-T.; Zhang, Y.-Q. Response of crop yields to magnesium fertilization: A meta-analysis in China. Int. J. Agric. Sci. 2016, 6, 1011–1015. [Google Scholar]
  35. Ishfaq, M.; Kiran, A.; ur Rehman, H.; Farooq, M.; Ijaz, N.H.; Nadeem, F.; Azeem, I.; Li, X.; Wakeel, A. Foliar nutrition: Potential and challenges under multifaceted agriculture. Environ. Exp. Bot. 2022, 200, 104909. [Google Scholar] [CrossRef]
  36. Micheli, E.; Schád, P.; Spaargaren, O.; Dent, D.; Nachtergaele, F.; Wrb, I. World Reference Base for Soil Resources 2006: A Framework for International Classification, Correlation and Communication: FAO; World Soil Resources Reports No. 103; FAO: Rome, Italy, 2006. [Google Scholar]
  37. Melo, L.C.A.; Silva, C.A. Influência de métodos de digestão e massa de amostra na recuperação de nutrientes em resíduos orgânicos. Química Nova 2008, 31, 556–561. [Google Scholar] [CrossRef]
  38. McGuire, R.G. Reporting of objective color measurements. HortScience 1992, 27, 1254–1255. [Google Scholar] [CrossRef]
  39. Ricardo-Rodrigues, S.; Laranjo, M.; Agulheiro-Santos, A.C. Methods for quality evaluation of sweet cherry. J. Sci. Food Agric. 2023, 103, 463–478. [Google Scholar] [CrossRef]
  40. Chauvin, M.A.; Whiting, M.; Ross, C.F. The influence of harvest time on sensory properties and consumer acceptance of sweet cherries. HortTechnology 2009, 19, 748–754. [Google Scholar] [CrossRef]
  41. Ucgun, K. Effects of nitrogen and potassium fertilization on nutrient content and quality attributes of sweet cherry fruits. Not. Bot. Horti Agrobot. Cluj-Napoca 2018, 47, 114–118. [Google Scholar] [CrossRef]
  42. Pinto, T.; Vilela, A.; Cosme, F. Fruit juices and fruit fermented beverages: Consumer acceptance, chemical and sensory characteristics. In Prime Archives in Applied Sciences, 2nd ed.; Seongwoo, W.F., Ed.; Vide Leaf: Hyderabad, India, 2023. [Google Scholar]
  43. Cosme, F.; Pinto, T.; Aires, A.; Morais, M.C.; Bacelar, E.; Anjos, R.; Ferreira-Cardoso, J.; Oliveira, I.; Vilela, A.; Gonçalves, B. Red fruits composition and their health benefits—A review. Foods 2022, 11, 644. [Google Scholar] [CrossRef]
  44. Erdal, A.; Saraçoğlu, O. Role of the foliar fertilization treatments on quality attributes of sweet cherry fruits (Prunus avium). Akad. Ziraat Derg. 2018, 7, 131–136. [Google Scholar] [CrossRef]
  45. Woldemariam, S.; Lal, S.; Zelelew, D.; Solomon, M. Effect of potassium levels on productivity and fruit quality of tomato (Lycopersicon esculentum L.). J. Agric. Stud. 2018, 6, 104. [Google Scholar] [CrossRef]
  46. Afzal, I.; Hussain, B.; Maqsood, S.; Basra, A.; Ullah, S.; Shakeel, Q.; Kamran, M. Foliar application of potassium improves fruit quality and yield of tomato plants. Acta Sci. Pol. Hortorum Cultus 2015, 14, 3–13. [Google Scholar]
  47. Quddus, M.A.; Siddiky, M.A.; Hussain, M.J.; Rahman, M.A.; Ali, M.R.; Masud, M.A.T. Magnesium influences growth, yield, nutrient uptake, and fruit quality of tomato. Int. J. Veg. Sci. 2022, 28, 441–464. [Google Scholar] [CrossRef]
  48. Liu, X.; Hu, C.; Liu, X.; Riaz, M.; Liu, Y.; Dong, Z.; Tan, Q.; Sun, X.; Wu, S.; Tan, Z. Effect of magnesium application on the fruit coloration and sugar accumulation of navel orange (Citrus sinensis Osb.). Sci. Hortic. 2022, 304, 111282. [Google Scholar] [CrossRef]
  49. Zlamalova, T.; Elbl, J.; Baron, M.; Belikova, H.; Lampir, L.; Hlusek, J.; Losak, T. Using foliar applications of magnesium and potassium to improve yields and some qualitative parameters of vine grapes (Vitis vinifera L.). Plant Soil Environ. 2015, 61, 451–457. [Google Scholar] [CrossRef]
  50. Zhang, W.; Song, P.; Li, G.; Wang, E.; Lv, Z.; Zhang, Y.; Zhang, Q.; Liang, F.; Yang, J. Exogenous application of nutrient elements effectively reduces grape cracking and improves fruit quality. Sci. Hortic. 2023, 319, 112157. [Google Scholar] [CrossRef]
  51. Luedeling, E.; Kunz, A.; Blanke, M.M. Identification of chilling and heat requirements of cherry trees—A statistical approach. Int. J. Biometeorol. 2013, 57, 679–689. [Google Scholar] [CrossRef]
  52. Bhattacharjee, P.; Warang, O.; Das, S. Impact of climate change on fruit crops—A review. Curr. World Environ. 2022, 17, 319–330. [Google Scholar] [CrossRef]
  53. Kaufmann, H.; Blanke, M. Chilling in cherry—principles and projection—a brief introduction. Acta Hortic. 2017, 1162, 39–44. [Google Scholar] [CrossRef]
  54. Drogoudi, P.; Kazantzis, K.; Kunz, A.; Blanke, M.M. Effects of climate change on cherry production in Naoussa, Greece and Bonn, Germany: Adaptation strategies. Euro-Mediterr. J. Environ. Integr. 2020, 5, 12. [Google Scholar] [CrossRef]
  55. Whiting, M.D.; Lang, G.; Ophardt, D. Rootstock and training system affect sweet cherry growth, yield, and fruit quality. HortScience 2005, 40, 582–586. [Google Scholar] [CrossRef]
  56. Whiting, M.D.; Ophardt, D.; McFerson, J.R. Chemical blossom thinners vary in their effect on sweet cherry fruit set, yield, fruit quality, and crop value. HortTechnology 2006, 16, 66–70. [Google Scholar] [CrossRef]
  57. Paltineanu, C.; Chitu, E. Climate change impact on phenological stages of sweet and sour cherry trees in a continental climate environment. Sci. Hortic. 2020, 261, 109011. [Google Scholar] [CrossRef]
  58. Kappel, F.; Fisher-Fleming, B.; Hogue, E. Fruit characteristics and sensory attributes of an ideal sweet cherry. HortScience 1996, 31, 443–446. [Google Scholar] [CrossRef]
  59. Zheng, X.; Yue, C.; Gallardo, K.; McCracken, V.; Luby, J.; McFerson, J. What attributes are consumers looking for in sweet cherries? evidence from choice experiments. Agric. Resour. Econ. Rev. 2016, 45, 124–142. [Google Scholar] [CrossRef]
  60. Gonçalves, A.C.; Campos, G.; Alves, G.; Garcia-Viguera, C.; Moreno, D.A.; Silva, L.R. Physical and phytochemical composition of 23 Portuguese sweet cherries as conditioned by variety (or genotype). Food Chem. 2021, 335, 127637. [Google Scholar] [CrossRef]
  61. Romano, G.S.; Cittadini, E.D.; Pugh, B.; Schouten, R. Sweet cherry quality in the horticultural production chain. Stewart Postharvest Rev. 2006, 6, 1–9. [Google Scholar] [CrossRef]
  62. Crisosto, C.H.; Crisosto, G.M.; Metheney, P. Consumer acceptance of ‘Brooks’ and ‘Bing’ cherries is mainly dependent on fruit SSC and visual skin color. Postharvest Biol. Technol. 2003, 28, 159–167. [Google Scholar] [CrossRef]
  63. Martins, V.; Silva, V.; Pereira, S.; Afonso, S.; Oliveira, I.; Santos, M.; Ribeiro, C.; Vilela, A.; Bacelar, E.; Silva, A.P.; et al. Rootstock affects the fruit quality of ‘Early Bigi’ sweet cherries. Foods 2021, 10, 2317. [Google Scholar] [CrossRef]
  64. Vilela, A.; Bacelar, E.A.; Pinto, T.; Anjos, R.; Correia, E.; Gonçalves, B.; Cosme, F. Novel applications, sensory and sensor techniques in beverage and food fragrance biotechnology. In Advances in Food Science; Hien, P.P., Ed.; Vide Leaf: Hyderabad, India, 2020. [Google Scholar]
Figure 1. Weather conditions in Resende during the study years (2019, 2020, and 2021) included data on precipitation (in mm; bars) and mean temperature (in °C; lines).
Horticulturae 10 00881 g001
Figure 2. Biometric parameters for the harvest years 2019, 2020, and 2021: (a) weight (g), (b) larger diameter (mm), (c) smaller diameter (mm), and (d) height (mm) across treatments: control, Mg250, Mg125, K100, and K50. Data are presented as mean ± SD (n = 30). For the same parameter, treatments followed by the same capital or lowercase letter do not differ significantly from each other according to the Tukey test at a 5% probability level, between years and within the same year, respectively.
Horticulturae 10 00881 g002
Figure 3. Chromatic parameters for the harvest years 2019, 2020, and 2021: (a) luminosity (L*), (b) coordinate (a*), (c) coordinate (b*), (d) chroma (C*), and (e) hue angle (h) across treatments: control, Mg250, Mg125, K100, and K50. Data are presented as mean ± SD (n = 60). For the same parameter, treatments followed by the same capital or lowercase letter do not differ significantly from each other according to the Tukey test at a 5% probability level, between years and within the same year, respectively.
Horticulturae 10 00881 g003
Figure 4. Fruit firmness parameters for the harvest years 2019 and 2021: (a) epidermis rupture force (N) and (b) fruit firmness (N/mm) across treatments: control, Mg250, Mg125, K100, and K50. Data are presented as mean ± SD (n = 30). For the same parameter, treatments followed by the same capital or lowercase letter do not differ significantly from each other according to the Tukey test at a 5% probability level, between years and within the same year, respectively.
Horticulturae 10 00881 g004
Figure 5. Routine parameters for the harvest years 2019, 2020, and 2021: (a) total soluble solids (°Brix), (b) pH, (c) titratable acidity (% of malic acid), and (d) maturity index (SST/TA) across treatments: control, Mg250, Mg125, K100, and K50. Data are presented as mean ± SD (n = 30). For the same parameter, treatments followed by the same capital or lowercase letter do not differ significantly from each other according to the Tukey test at a 5% probability level, between years and within the same year, respectively.
Horticulturae 10 00881 g005
Figure 6. Spider plot of sensory profile for the harvest years (a) 2019 and (b) 2021 after compound application in the treatments control, Mg250, Mg125, K100, and K50.
Horticulturae 10 00881 g006
Table 1. Mean values for macronutrients (g kg−1) in cherry skin and cherry pulp for the harvest year 2021 in the treatments control, Mg250, Mg125, K100, and K50: N, P, K, Ca, Mg, and S.
TreatmentNPKCaMgS
Cherry SkinControl7.60 ± 0.58 a0.94 ± 0.15 a17.17 ± 4.14 a0.87 ± 0.16 a0.92 ± 0.10 a0.39 ± 0.04 a
Mg2507.09 ± 0.81 a0.99 ± 0.14 a18.79 ± 0.96 a0.88 ± 0.14 a0.95 ± 0.04 a0.40 ± 0.05 a
Mg1257.46 ± 0.63 a1.08 ± 0.08 ab19.68 ± 2.62 a0.95 ± 0.08 a0.87 ± 0.06 a0.38 ± 0.05 a
K1007.50 ± 0.75 a1.03 ± 0.10 ab18.36 ± 0.82 a0.82 ± 0.04 a0.86 ± 0.05 a0.41 ± 0.03 a
K509.85 ± 0.56 b1.36 ± 0.16 b21.93 ± 0.42 a0.98 ± 0.19 a0.91 ± 0.06 a0.47 ± 0.09 a
p-Value (T)0.0040.0190.1980.5940.5040.360
Cherry PulpControl9.68 ± 0.91 a0.96 ± 0.07 a17.76 ± 1.99 a0.36 ± 0.15 a0.79 ± 0.11 a0.49 ± 0.05 a
Mg2508.81 ± 1.07 a1.02 ± 0.13 a17.64 ± 1.27 a0.30 ± 0.05 a0.75 ± 0.10 a0.46 ± 0.09 a
Mg1259.39 ± 0.34 a0.97 ± 0.08 a18.38 ± 1.67 ab0.47 ± 0.01 a0.82 ± 0.06 a0.45 ± 0.08 a
K1008.85 ± 0.83 a1.08 ± 0.19 a17.86 ± 0.57 ab0.44 ± 0.03 a0.76 ± 0.05 a0.54 ± 0.09 ab
K5013.75 ± 2.11 b1.27 ± 0.13 a21.73 ± 1.42 b0.48 ± 0.23 a0.88 ± 0.14 a0.73 ± 0.11 b
p-Value (T)0.0020.0710.0300.4030.5230.014
p-Value (T)0.0000.0010.0070.2720.5550.002
p-Value (Tissue)0.0000.6740.4720.0000.0030.000
p-Value (T*Tissue)0.2280.7730.9120.7860.4510.168
Data are expressed as the mean ± SD (n = 3). For the same element, in the case of either the skin or the pulp, treatments followed by the same letter do not differ significantly from each other according to the Tukey test at a 5% probability level.
Table 2. Mean values for micronutrients (mg kg−1) in cherry skin and cherry pulp for the harvest year 2021 in the treatment control, Mg250, Mg125, K100, and K50: B, Fe, Zn, Mn, and Cu.
TreatmentBFeZnMnCu
Cherry SkinControl16.48 ± 0.25 c25.28 ± 2.27 a4.12 ± 0.58 a8.21 ± 0.77 a5.78 ± 0.94 a
Mg25012.99 ± 0.23 ab23.75 ± 1.66 a5.11 ± 1.04 a5.90 ± 1.65 a6.25 ± 0.84 a
Mg12512.48 ± 0.61 ab25.36 ± 1.84 a4.53 ± 0.97 a8.02 ± 1.57 a7.40 ± 0.86 a
K10012.08 ± 1.09 a33.25 ± 0.33 b6.51 ± 2.88 a6.24 ± 0.12 a6.56 ± 0.88 a
K5014.74 ± 1.49 bc37.07 ± 5.09 b7.00 ± 3.85 a7.62 ± 1.47 a8.08 ± 2.07 a
p-Value (T)0.0010.0000.4900.1530.220
Cherry PulpControl13.91 ± 1.80 c44.88 ± 4.14 bc4.93 ± 1.32 a3.90 ± 0.64 b4.78 ± 0.23 ab
Mg25012.06 ± 0.39 bc22.47 ± 3.02 a4.01 ± 1.31 a2.28 ± 0.43 a4.18 ± 0.57 a
Mg1258.63 ± 1.38 a38.86 ± 1.44 b4.88 ± 0.67 a3.74 ± 0.37 b5.80 ± 0.54 ab
K10010.80 ± 0.40 ab19.86 ± 0.51 a4.84 ± 1.74 a3.07 ± 0.20 ab5.37 ± 0.87 ab
K5012.96 ± 0.25 bc52.16 ± 6.58 c5.28 ± 1.77 a2.20 ± 0.50 a6.53 ± 1.50 b
p-Value (T)0.0010.0000.8530.0020.050
p-Value (T)0.0000.0000.4710.0080.011
p-Value (Tissue)0.0000.0000.3440.0000.001
p-Value (T*Tissue)0.1110.0000.6810.3380.917
Data are expressed as the mean ± SD (n = 3). For the same element, in the case of either the skin or the pulp, treatments followed by the same letter do not differ significantly from each other according to the Tukey test at a 5% probability level.
Table 3. Pearson’s correlations among the analyzed cherry quality parameters. Significant correlations were represented as ** p ≤ 0.01 and * p ≤ 0.05.
WeightLarger DiameterSmaller DiameterHeightL*a*b*C*hERFFFTSSpHTAMI
Weight10.918 **0.886 **0.762 **−0.174 **−0.158 **−0.170 **−0.161 **−0.150 **−0.416 **−0.455 **0.0710.460 **−0.348 *0.269
Larger Diameter 10.811 **0.667 **−0.126 **−0.111 *−0.128 **−0.115 *−0.128 **−0.354 **−0.398 **0.0700.519 **−0.2170.151
Smaller Diameter 10.716 **−0.200 **−0.229 **−0.225 **−0.229 **−0.174 **−0.467 **−0.507 **0.2050.382 **−0.362 *0.331 *
Height 1−0.108 *−0.201 **−0.192 **−0.200 **−0.129 **−0.333 **−0.317 **0.0540.094−0.2030.179
L* 10.811 **0.824 **0.816 **0.715 **0.199 **0.256 **−0.1540.0600.255−0.274
a* 10.980 **0.999 **0.858 **0.335 **0.404 **−0.433 **0.2870.317 *−0.420 **
b* 10.987 **0.923 **0.294 **0.368 **−0.382 **0.1830.263−0.349 *
C* 10.872 **0.329 **0.399 **−0.425 **0.2710.308 *−0.409 **
h 10.120 *0.190 **−0.257−0.0790.084−0.140
ERF 10.877 **−0.372 *0.793 **0.705 **−0.667 **
FF 1−0.601 **0.736 **0.774 **−0.793 **
TSS 1−0.509 **−0.380 *0.696 **
pH 10.257−0.440 **
TA 1−0.914 **
MI 1
Disclaimer/Publisher’s Note: The statements, opinions and data contained in all publications are solely those of the individual author(s) and contributor(s) and not of MDPI and/or the editor(s). MDPI and/or the editor(s) disclaim responsibility for any injury to people or property resulting from any ideas, methods, instructions or products referred to in the content.

