Abstract
Strawberry aroma, crucial for determining quality, involves complex volatile compounds which are challenging to identify. This study explores strawberry aroma analysis using Gas Chromatography-Mass Spectrometry (GC-MS) and the Automated Mass Spectral Deconvolution and Identification System (AMDIS). Central to our research is the creation of a bespoke strawberry Volatile Organic Compounds (VOCs) user library using AMDIS, specifically for analyzing strawberry aromas. The library contains VOCs from 61 strawberry cultivars, integrating information on 104 VOCs, including mass spectra, retention index, chemical class, CAS number, formula, odor threshold, and odor description. This custom library significantly outperformed a commercial library by reducing potential false hits by 200, decreasing the size of report files by over 96%, and, most importantly, shortening AMDIS analysis processing time from 31 s to 9 s, representing an approximate 71% reduction. Further, the study demonstrates the library’s practical application by contrasting the aroma profiles of strawberries harvested in winter and spring. This comparison revealed significant VOC variations depending on seasonal temperature changes, offering insights into environmental influences on strawberry aroma. In conclusion, this research marks a significant advance in strawberry aroma quality analysis. The strawberry VOC library developed in this study is expected to greatly aid targeted metabolomics and flavor research in strawberry breeding.
1. Introduction
Strawberry aroma has recently been recognized as a crucial element in determining strawberry quality and prediction of freshness [1], challenging the traditional focus on increasing sugar content and disease resistance. This new perspective becomes especially relevant when considering the limitations of sugar-rich cultivars. For instance, Japanese strawberry cultivars with high sugar content often suffer from lower storability and disease resistance compared to Euramerican cultivars [2,3]. Hence, efforts are in progress to enhance the aromatic properties of strawberries, aiming to improve their taste while guaranteeing mass production and high efficiency of cultivation [4]. Notably, the University of Florida, renowned for its expertise in strawberry breeding, is conducting research to improve strawberry aroma by targeting substances that are both genetically modifiable and closely associated with flavor [5,6]. Similar research initiatives are also underway in China and Japan, to develop novel cultivars possessing distinctive and rich aromatic profiles [7,8,9].
In the analysis of Volatile Organic Compounds (VOCs), Gas Chromatography Mass-Spectrometry (GC-MS) is commonly regarded as the most powerful tool. GC-MS has a long-standing history in metabolite analysis, accumulating a wealth of data [10]. In addition, GC-MS offers advantages such as higher reproducibility and the ability to obtain precise spectra compared to other mass spectrometry analysis methods (e.g., liquid chromatography mass spectrometry, etc.) [11]. Furthermore, it is worth noting that there are several commercially available spectral libraries for GC-MS, underscoring its established value in the field.
However, mass spectral data sometimes require deconvolution. For instance, fragrance samples typically exhibit significant complexity, resulting in MS spectra that rarely represent single compound spectra [12]. In the context of mass chromatography, deconvolution involves correcting peak coelution caused by insufficient separation. Deconvolution allows the identification of components within peak clusters with relatively small errors. Automated Mass Spectral Deconvolution and Identification System (AMDIS) is the most widely used software for this purpose. Compared to other programs, AMDIS is recognized for its user-friendly interface, and its deconvolution results are similar to manual integration [13]. For instance, reports have highlighted the successful resolution of matrix interference issues and identification of low-concentration aroma components in complex tobacco samples through the use of AMDIS [14]. This software has proven to be valuable not only in the investigation of essential oils but also in the analysis of food aromas [14,15,16]. AMDIS serves as a useful resource, provided as user-friendly freeware, facilitating straightforward and cost-free deconvolution for identifying components within raw GC-MS chromatograms.
However, it is worth noting that compared to other deconvolution software, AMDIS tends to identify false positives more frequently [17]. Therefore, it is essential to include a target library containing the substances under investigation when utilizing AMDIS. The use of a target library not only reduces the occurrence of false positives but also significantly enhances the accuracy and reliability of compound identification, especially in complex matrices. The increased accessibility afforded by the AMDIS library for research into strawberry aroma holds promise for its versatile application. This includes the potential for early disease prediction in plants through VOC analysis [18] and the facilitation of high-quality breeding practices.
In this study, we investigate the utility of the AMDIS private library in the context of strawberry aroma analysis, adopting a review-style approach, and introduce our self-developed strawberry VOC user library. The library, developed by screening the aroma profiles of 61 different strawberry cultivars, is specifically designed for strawberry VOCs. Formatted for compatibility with deconvolution software, it enhances usability and includes details on odor thresholds and descriptions of various aromatic compounds based on the extensive literature. By offering this library as open access, it will reduce barriers to strawberry aroma research and facilitate rapid data processing.
2. Advanced Analytical Techniques in Flavor Research: The Role and Utility of GC-MS
2.1. GC-MS as a Tool for Aroma Analysis
GC-MS utilizes sophisticated and sequential analytical techniques such as sample evaporation, column injection, and ionization for profiling volatile substances. In the field of aroma analysis, an alternative method involves directly transferring volatile compounds, which have been adsorbed onto an adsorbent, to the GC-MS through a thermal desorption unit instead of using liquid injection.
Due to its inherent characteristics, GC-MS finds extensive use in flavor research, including the study of food aroma compounds and essential oils [19]. In the analysis of food aromas and essential oil fragrances, it is common to focus on the overall picture of multiple compounds rather than concentrating on one or two specific substances. Therefore, the utilization of commercially available mass spectrum libraries is often favored to facilitate analysis. The most prevalent library utilized is the NIST library; however, for flavor research specifically, researchers can utilize the Adams library, a subset of the NIST library, and derivatives of the Wiley library (Table 1). Numerous researchers acquire and employ these libraries despite their substantial expense, primarily driven by their convenience and utility. These well-established libraries offer advantages for targeted analysis of overall fragrance constituents.

Table 1.
List of favorable mass spectra libraries for flavor research. Prices may vary depending on the distributor.
Nevertheless, aromatic compounds often result in confused chromatograms exhibiting numerous peaks, causing a peak co-elution problem. Additionally, due to the nature of thermal desorption analysis, sample reuse is almost impossible, making it challenging to reanalyze samples with different method. Even with adjustments to columns and GC-MS analysis methods, a complete separation of volatile compound peaks remains challenging, while attempting to reduce analysis time by shortening method duration or employing shorter columns exacerbates these issues. The compounds that were not fully separated introduce errors in both qualitative and quantitative analyses.
2.2. Necessity of Peak Deconvolution Technique in GC-MS Analysis of Volatile Compounds
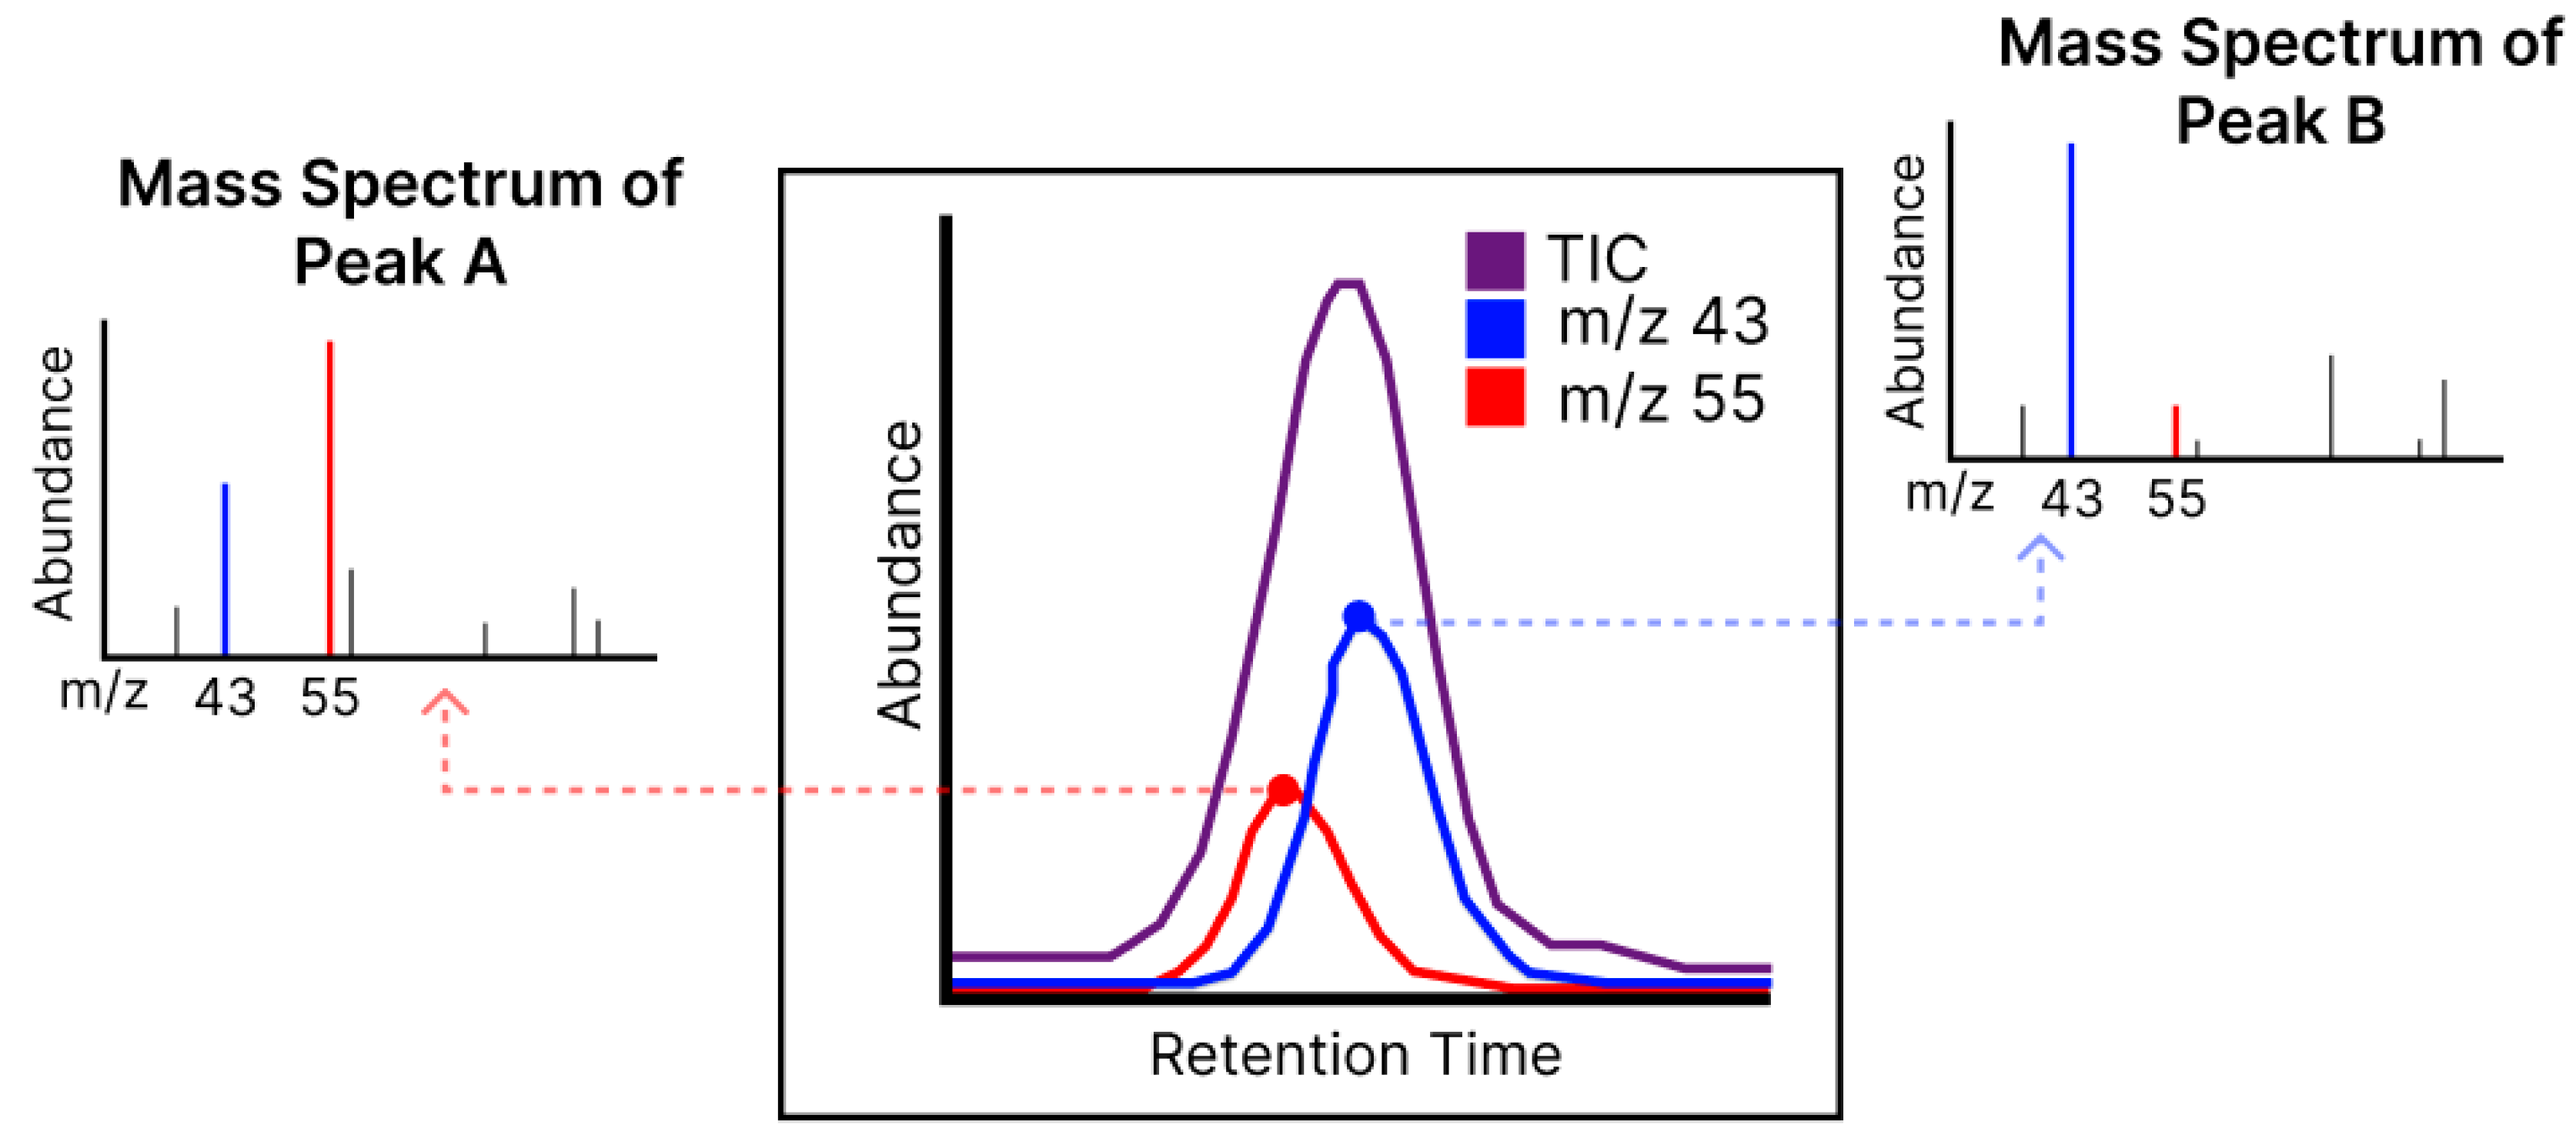
Peak deconvolution technology is used to overcome the co-eluting mass peaks issues. The technology includes the process of decomposing overlapped peaks to extract concealed peak information called “deconvolution” in spectral data processing (Figure 1) [20]. This deconvolution technology not only enables more accurate compound analysis but also allows the analysis of a greater number of samples within the same time, which means researchers are able to compromise on column length and oven temperature methods, which are critical for analysis time, by allowing a certain degree of co-elution. This applies even to VOCs with complex compositions.
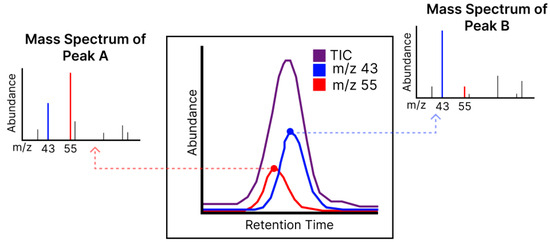
Figure 1.
A representative image of peak deconvolution. The figure shows the deconvolution of a total ion chromatogram (TIC) where two different peaks are coeluted.
Several well-known brands offer basic mass spectrometry analysis software, such as Agilent ChemStation/MassHunter (LTS 01.11), Thermo Xcalibur/Chromeleon 4.3, Shimadzu GCMS Solutions 6.81, Waters MassLynx 4.1, and PE TurboMass 6.1. Accessing the deconvolution feature option in these programs can pose difficulties, often necessitating the application of external software solutions through additional funding. Popular deconvolution software includes AnalyzerPro 6.0, OriginLab 10.1, and AMDIS 2.73. While AnalyzerPro and OriginLab offer more features, they require licensing fees. Therefore, the free software AMDIS is widely used.
2.3. The Role of AMDIS in Peak Deconvolution and Detection
AMDIS boasts remarkable identification skills, showcasing the ability to discern between interfering peaks even when their intensities differ by more than fivefold [21]. Moreover, AMDIS has a long-standing track record and offers strong compatibility, supporting file extensions provided by the majority of instrument manufacturers. However, due to its excellent deconvolution and peak detection capabilities, AMDIS tends to produce a higher number of false positives. AMDIS does not provide a method to adjust the detection threshold for library target detection, aside from modifying the match factor value. This makes spectrum noise control challenging. For example, an excessively high setting of the match factor leads to the missing of important peaks, whereas too low a setting cannot guarantee the reliability of analysis because AMDIS would capture any resembling compounds which are included in the library. Therefore, it was found that AMDIS has the highest number of false positives, compared to other programs [17]. Nevertheless, when the substance under investigation is well-defined, high sensitivity can be an advantage. This is the reason why a target library containing only the desired compounds is necessary when using AMDIS.
3. Materials and Methods
3.1. Methods for Library Data Collection
As described in the paper published by Jee et al., VOC screening was conducted on 55 strawberry cultivars originating from South Korea, 8 from Japan, 7 from the United States, and 1 from France. Briefly, all strawberries were harvested from Nonsan Strawberry Research Institute and the Rural Development Administration in South Korea from winter 2022 through early spring 2023 [4]. The strawberries were harvested during the morning between 9 a.m. and 11 a.m. when fruit ripeness exhibited 90% of red color. Subsequently, non-defective fruit samples were selected without disease infection and physical damage, ensuring their commercial quality. The strawberry fruits were weighed to 100 ± 5 g and crushed. Then, the crushed samples were placed in a Magenta box (75 mm × 75 mm × 100 mm). They were incubated at 30 °C for 20 min to saturate volatiles. The VOCs were then adsorbed into resin using a Tenax TA thermal desorption (TD) tube and an air pump with 0.15 L min−1 of flow rate for 2 min. Samples were thermally desorbed using the TD-100-xr thermal desorption unit (Markes International, CA, USA) and analyzed using GC-MS (GCMS-QP 2020 NX, Shimadzu, Japan) with a DB-5MS capillary column (Agilent Technologies (Santa Clara, CA, USA), 30 m × 0.25 mm, 0.25 μm). The desorption process for the samples was conducted with the following parameters: Pre-desorption involved a pre-purge time of 1 min with a split flow rate of 20 mL/min. For primary tube desorption, the temperature was set to 240 °C for 5 min, with a trap flow rate of 40 mL/min. The entire sample tube was desorbed in a splitless mode onto a cold trap (U-T11GPC-2S, Markes International, Sacramento, CA, USA) maintained at 25 °C. Subsequently, the cold trap was heated at a rate of 25 °C per second up to 270 °C and held at this temperature for 5 min. During this desorption phase, the samples were split using a 6:1 outlet split ratio. The temperature program for the GC oven began at 35 °C for 3 min, then increased to 170 °C at a rate of 6 °C/min, followed by a rise to 280 °C at 12 °C/min. The total duration of the run was 34 min. The ion source and interface temperatures for the mass spectrometer were set to 250 °C, and the mass spectra were recorded within the m/z range of 40–400 [4]. Qualitative analysis was initially conducted using GCMS Solution, AMDIS, and the NIST17 library. Reasonable compounds—important for flavor and breeding research, representative of each chemical class, or requiring verification due to low detection levels or coeluting peaks—were confirmed using standard compounds through mass spectra and retention time analysis.
Key components were confirmed by matching with standard substances.
3.2. Methods for the Library Performance Test
Six identical strawberry VOC chromatogram datasets (Supplementary File S1) were analyzed using both AMDIS 2.73 and LabSolutions 4.50 GCMS Solution software (Shimadzu, Japan). For AMDIS analysis, the following settings were applied: a ‘Minimum Match Factor’ of 75, ‘Deconvolution settings of Adjacent Peak Subtraction’ set to none, ‘Resolution set’ to high, ‘Sensitivity’ set to low, and ‘Shape Requirements’ set to medium. The NIST 17 mass spectral library was utilized as the reference library for compound identification. Statistical calculations were performed using IBM SPSS Statistics 27 software.
3.3. Materials and Methods for Seasonal Strawberry Comparison
Strawberry fruit samples were cultivated and harvested at the Rural Development Administration (Jeonju, Republic of Korea). The cultivars ‘Arihyang’, ‘Kuemsil’, and ‘Seolhyang’ were utilized for both winter and spring strawberries. Strawberries harvested between December and January were classified as winter strawberries, while those harvested in May were considered spring strawberries. Winter strawberries were cultivated under average conditions of a maximum temperature of 13.6 °C, a minimum temperature of 8.1 °C, and a humidity level of 61.7%. In contrast, spring strawberries were grown in an environment with average conditions of a maximum temperature of 19.8 °C, a minimum temperature of 12.2 °C, and a humidity level of 80.4%. For winter, ‘Arihyang’, ‘Kuemsil’, and ‘Seolhyang’ were sampled three times each. In the case of spring, ‘Arihyang’ was sampled three times, and ‘Kuemsil’ and ‘Seolhyang’ were subsampled six and nine times, respectively, to minimize variation between repetitions. Data collection followed the same methods used for library construction. For seasonal comparisons, each cultivar was treated as a single repetition, ensuring the acquisition of more generalized data for comprehensive analysis.
The data underwent normalization through internal standards and was subsequently standardized. Statistical analysis was conducted utilizing the functionalities of MetaboAnalyst 6.0 [22]. 3-Octanone (Sigma-Aldrich Co., St. Louis, MO, USA), a compound not detected in strawberries, was used as an internal standard to correct for machine sensitivity errors. It was prepared at a concentration of 25 μg/mL in methanol and injected into the sample TD tubes using a 4 μL injection syringe.
4. Results
4.1. Performance Comparison Using AMDIS User Library in Chromatogram Analysis
To quantitatively assess the advantages of using AMDIS with a private library, this section focuses on a comparative analysis between the NIST library and our user library when utilizing AMDIS for chromatogram analysis. The investigation includes an examination of hit counts, data file sizes, and processing times in the analysis reports. Following this, a comparison is drawn between using AMDIS and GCMS Solution for chromatogram analysis, concentrating on the average match factor of hits. Additionally, potential identification issues arising from identical match factors when using GCMS Solution are addressed, and the concealed coeluting peaks are visualized through an accompanying figure.
The utilization of AMDIS requires the recurrent construction of a private library despite the availability of purchased mass spectral libraries. Indeed, AMDIS provides a feature for filtering components, but it solely manages the untargeted components that AMDIS reports. The process of library component identification remains unchanged, and the filtering does not influence the targets detected by AMDIS. It is possible to adjust the match factor and deconvolution parameters, essentially decreasing sensitivity to reduce the quantity of identified peaks. However, this adjustment carries the potential risk of omitting certain target compounds.
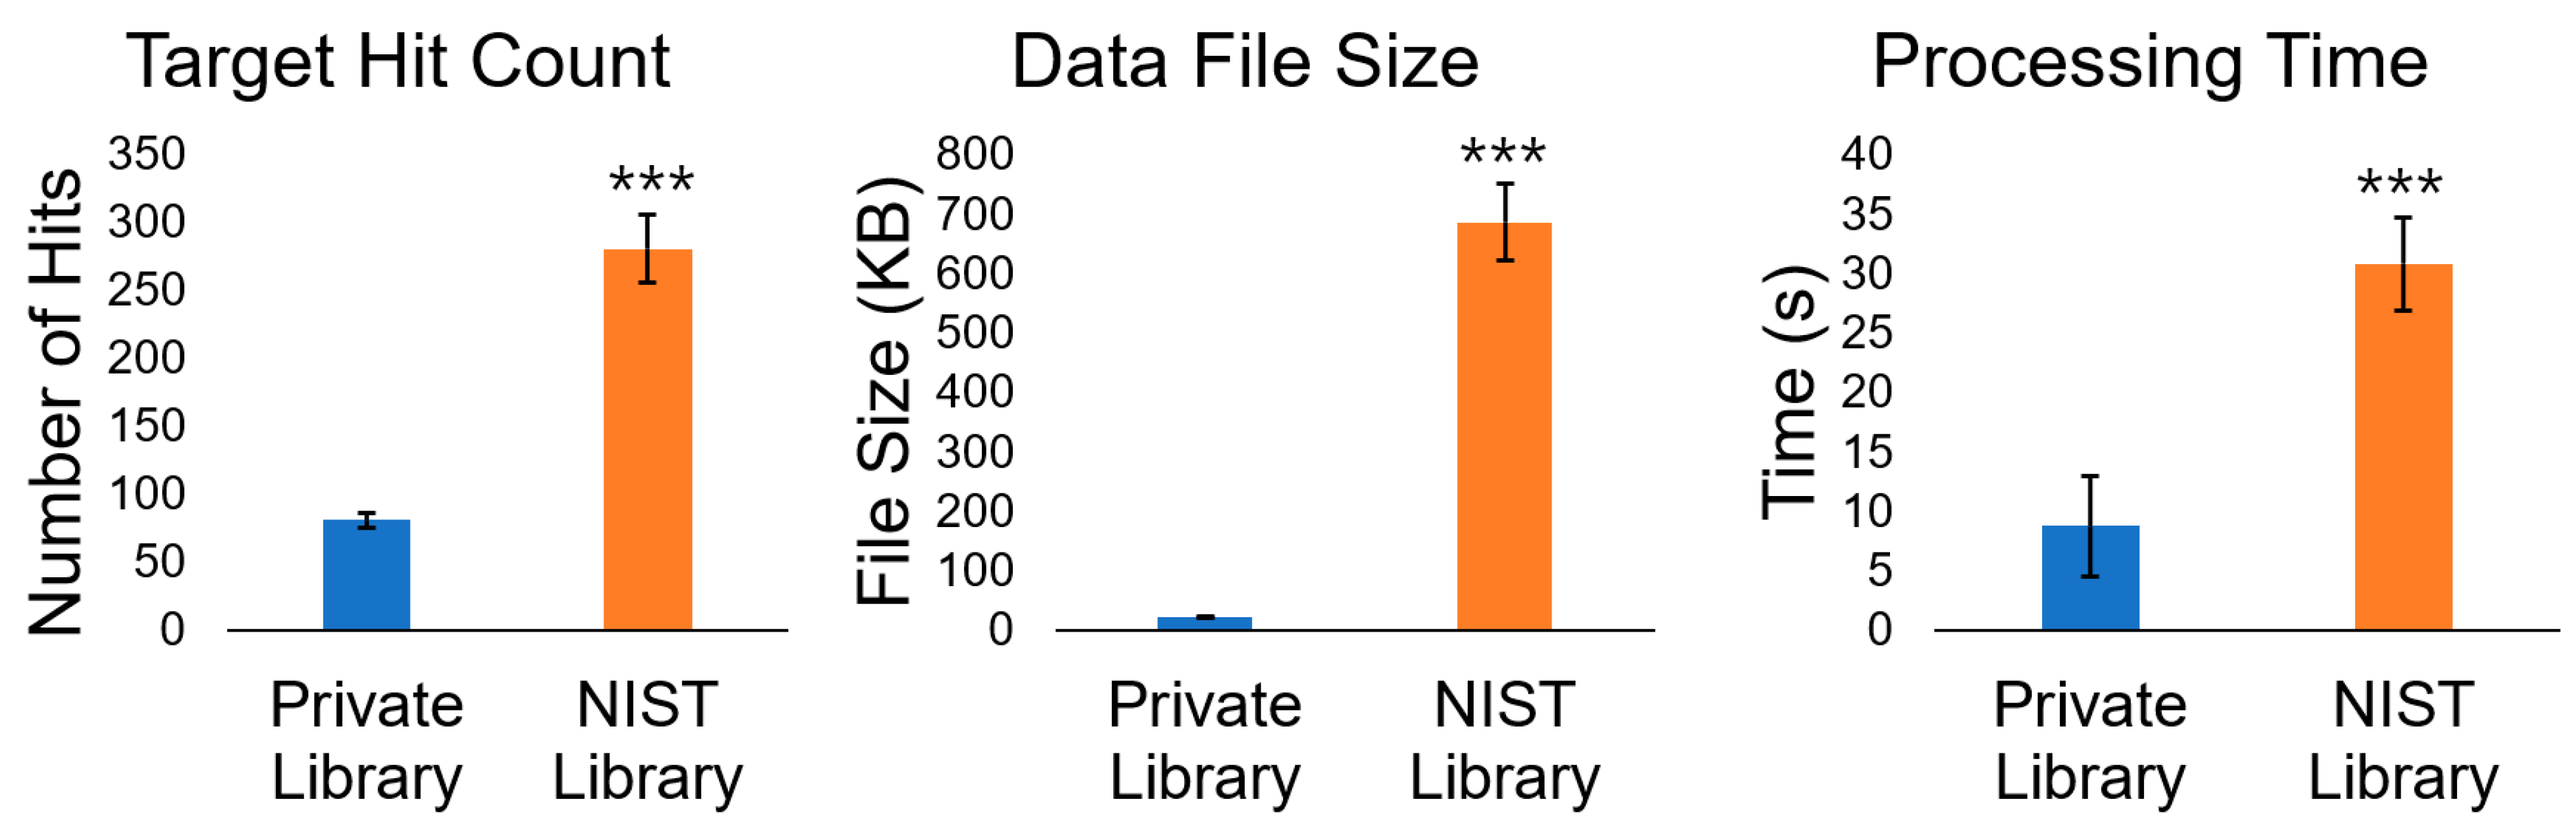
In our study, AMDIS indeed captured any signal exceeding the set minimum match factor. Due to the extensive registration of tens of thousands of compounds in the NIST library, this led to the introduction of an excessive amount of noise, and data analysis. Consequently, it resulted in larger report file sizes and extended processing times. Utilizing the private library, an average of 81 matches were observed, whereas the NIST library yielded an average of 281 matches. Consequently, report files produced with the NIST library were significantly larger, around 686 KB, in contrast to the more modest 22 KB files generated with the private library. Processing time also extended, with the private library taking roughly 9 s per chromatogram, while the NIST library required approximately 31 s (Figure 2).

Figure 2.
Private library vs. NIST library: detection, file size, and speed. Comparison of library performance between the private library and NIST library. The average number of identified targets, report file size, and processing time were measured in equal running conditions. Each value is exhibited by a mean value and standard deviation (n = 6). Triple asterisks (***) indicate a highly significant difference based on Student’s t-test (p < 0.001).
To sum up, the comparison between our custom-built library, which specifically contains strawberry volatile compounds, and the NIST library apparently showed that using the NIST library results in a target count that is more than triple, a data file size approximately thirty times larger, and, most importantly, processing times exceeding triple the duration.
4.2. AMDIS vs. GCMS Solution: Confusion Caused in Detection
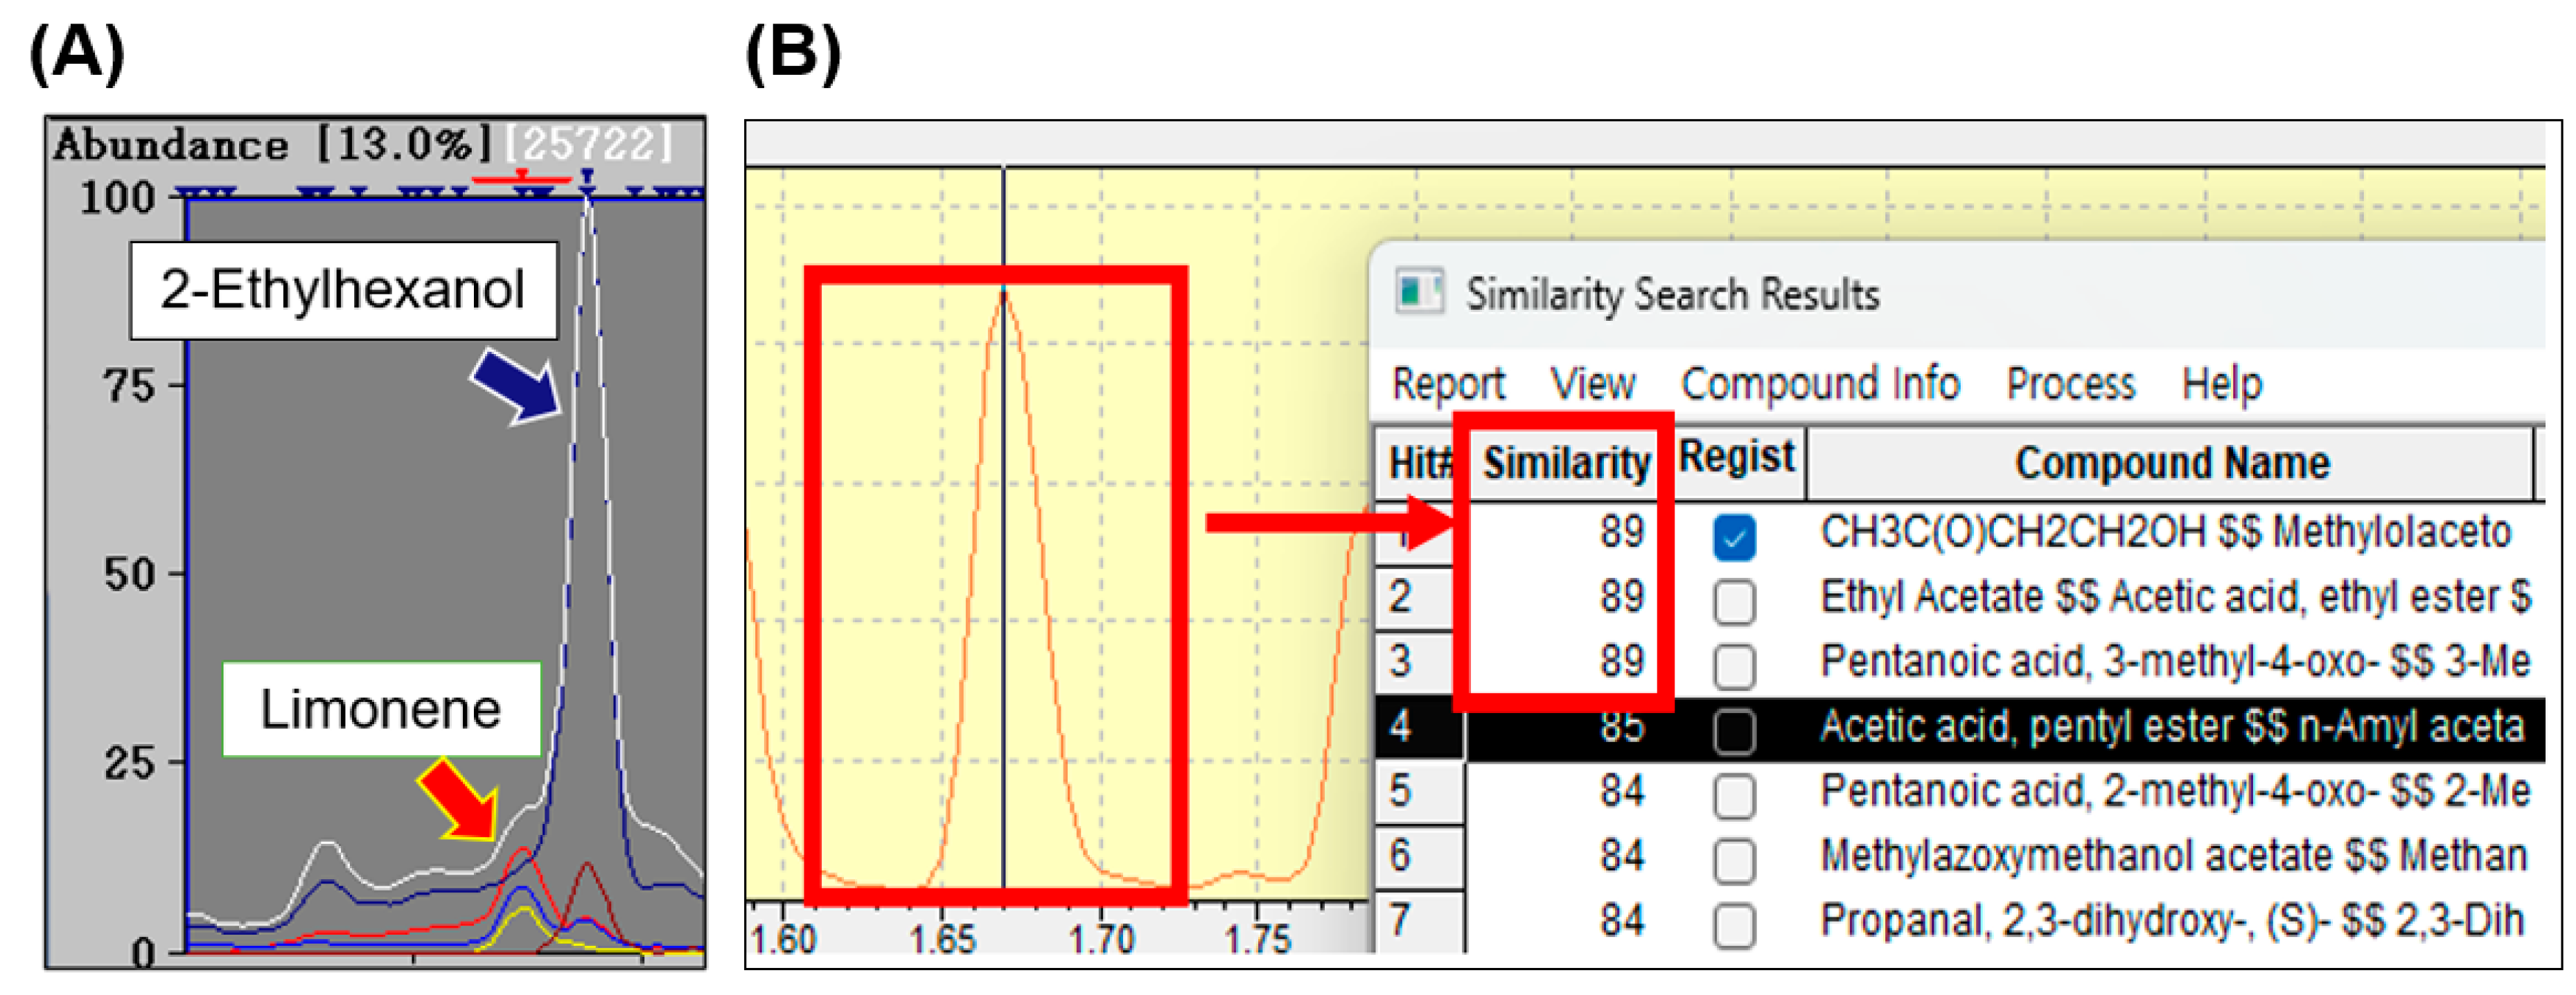
Even though the process of creating and maintaining a private library may be labor-intensive, AMDIS nonetheless presents unique advantages compared to other commercial chromatogram analysis software. While comparing results with and without peak deconvolution, we found that peak deconvolution enabled the identification of substances that were otherwise undetectable. On average, each sample revealed approximately 4.3 such substances (standard deviation = 2.34). Specifically, compounds with similar molecular weights or structures, such as ethyl butyrate and hexanal, were so heavily overlapped they produced a single peak. Similarly, limonene with low concentration was intertwined with the peaks of 2-ethylhexanol and could only be detected with deconvolution (Figure 3A).

Figure 3.
Demonstration of the necessity of AMDIS. The figure displays a screenshot of AMDIS and GCMS Solution software during the analysis of actual strawberry VOC data. (A): Limonene remains obscured by 2-ethylhexanol if deconvolution is not performed. The white line represents the total ion chromatogram, while the colored solid lines represent various individual ion chromatograms. (B): The similarity search results for a single peak showing three compounds with identical similarity values, causing confusion in the identification. The red boxes display the target peak along with the mass library similarity scores for that peak.
In addition to effectively separating the overlapped peaks, AMDIS also exhibits the capability to distinguish between similar ion spectra with greater precision. In contrast to alternative programs, such as GCMS Solution, which rely solely on comparing library mass spectra for similarity, AMDIS calculates its match factor by optimizing mass spectra through weighting and scaling, considering compound purity, and incorporating reverse search results. This approach enables AMDIS to achieve more precise compound identification.
Upon individually confirming the identification of each peak, the average net match factor for each substance measured in AMDIS was 94.52, while GCMS Solution recorded a similarity of 91.91 on average (Table 2). Therefore, it can be inferred that AMDIS exhibits greater confidence in classifying substances. This is of significance, as illustrated in Figure 3B, as simple similarity comparison methods can lead to complications when multiple compounds share the same similarity value. While using GCMS Solution, on average, this issue occurred with approximately two peaks per chromatogram. However, AMDIS, which dedicates more computational effort to the match factor, did not encounter any instances of identical match factor values among candidate compounds.
Table 2.
Comparison of component identification and peak confusion. The first row compares the similarity (net match factor in AMDIS and similarity in GCMS Solution) between identified compounds and library spectra for each software. The second row displays the number of peaks where multiple compounds exhibit the same similarity at one peak. The data are presented as mean ± standard deviation. An asterisk (*) denotes statistical significance according to Student’s t-test (p < 0.05).
4.3. Custom-Made Strawberry VOC Library Construction and Profile
Compounds found from our strawberry data are compiled. Additionally, VOCs documented for strawberries in the existing literature were incorporated, irrespective of our direct observation. To mitigate false positives, a rigorous selection process ensued, excluding substances not previously reported in plant contexts. Instances of substantial retention time variation, indicative of potential noise, were systematically omitted. Compounds exhibiting boiling points significantly deviating from the designated GC-MS method and those not conforming to VOC classification were systematically excluded. Standard compound confirmation was implemented for substances of particular significance. The resulting library can be downloaded from Supplementary Materials (DataZip S2).
The dataset includes a total of 104 compound data discovered during the screening and selection processes. The compounds are classified by functional group, including chemical name synonyms, CAS numbers, and molecular formulas. When available in the existing literature, odor thresholds (in µg L−1) and odor descriptions are also provided. However, it is important to acknowledge the limitations of the methods used to measure odor thresholds, as they may involve subjective judgments by the experimenters. Furthermore, variations in the solvent used, the temperature during detection, and the testing methodology can lead to significant differences in the recorded values. Therefore, caution is advised when utilizing odor threshold data from the library, as it may be subject to such experimental nuances.
The Retention Index (RI) is a normalized value for the retention time of a compound, using the retention times of n-alkanes as a reference point [23]. While the contemporaneous analysis of an n-alkane solution is necessary, RI values demonstrate less dependence on experimental conditions compared to retention time [24]. AMDIS also incorporates a feature to adjust identifications using the RI. The RI values recorded in our library have been either calculated directly by us or obtained from the existing literature. However, caution is warranted due to factors such as the sample size effect caused by the concentration of the analyzed substance and n-alkane. Variations in column film thickness and deviations in retention data based on the programmed temperature rate or carrier gas velocity should also be considered [25]. Consequently, it is essential to be mindful that these values may not be unequivocally reliable.
Compounds reported as key volatile compounds (KVCs) which are strongly associated with strawberry fragrance are mentioned in the description as well [26].
The library files are provided with extensions MSL, CID, and MSP. The list of substances included in the library and their detailed features can also be comprehensively reviewed in Table S1.
4.4. An Application Example of the Library Utilization
To illustrate the practical value of our strawberry VOC library, we conducted a comparative analysis of the aroma profiles of strawberries harvested in winter versus those harvested in spring. This analysis highlights the importance of understanding seasonal variations in strawberry aroma and its implications for the industry.
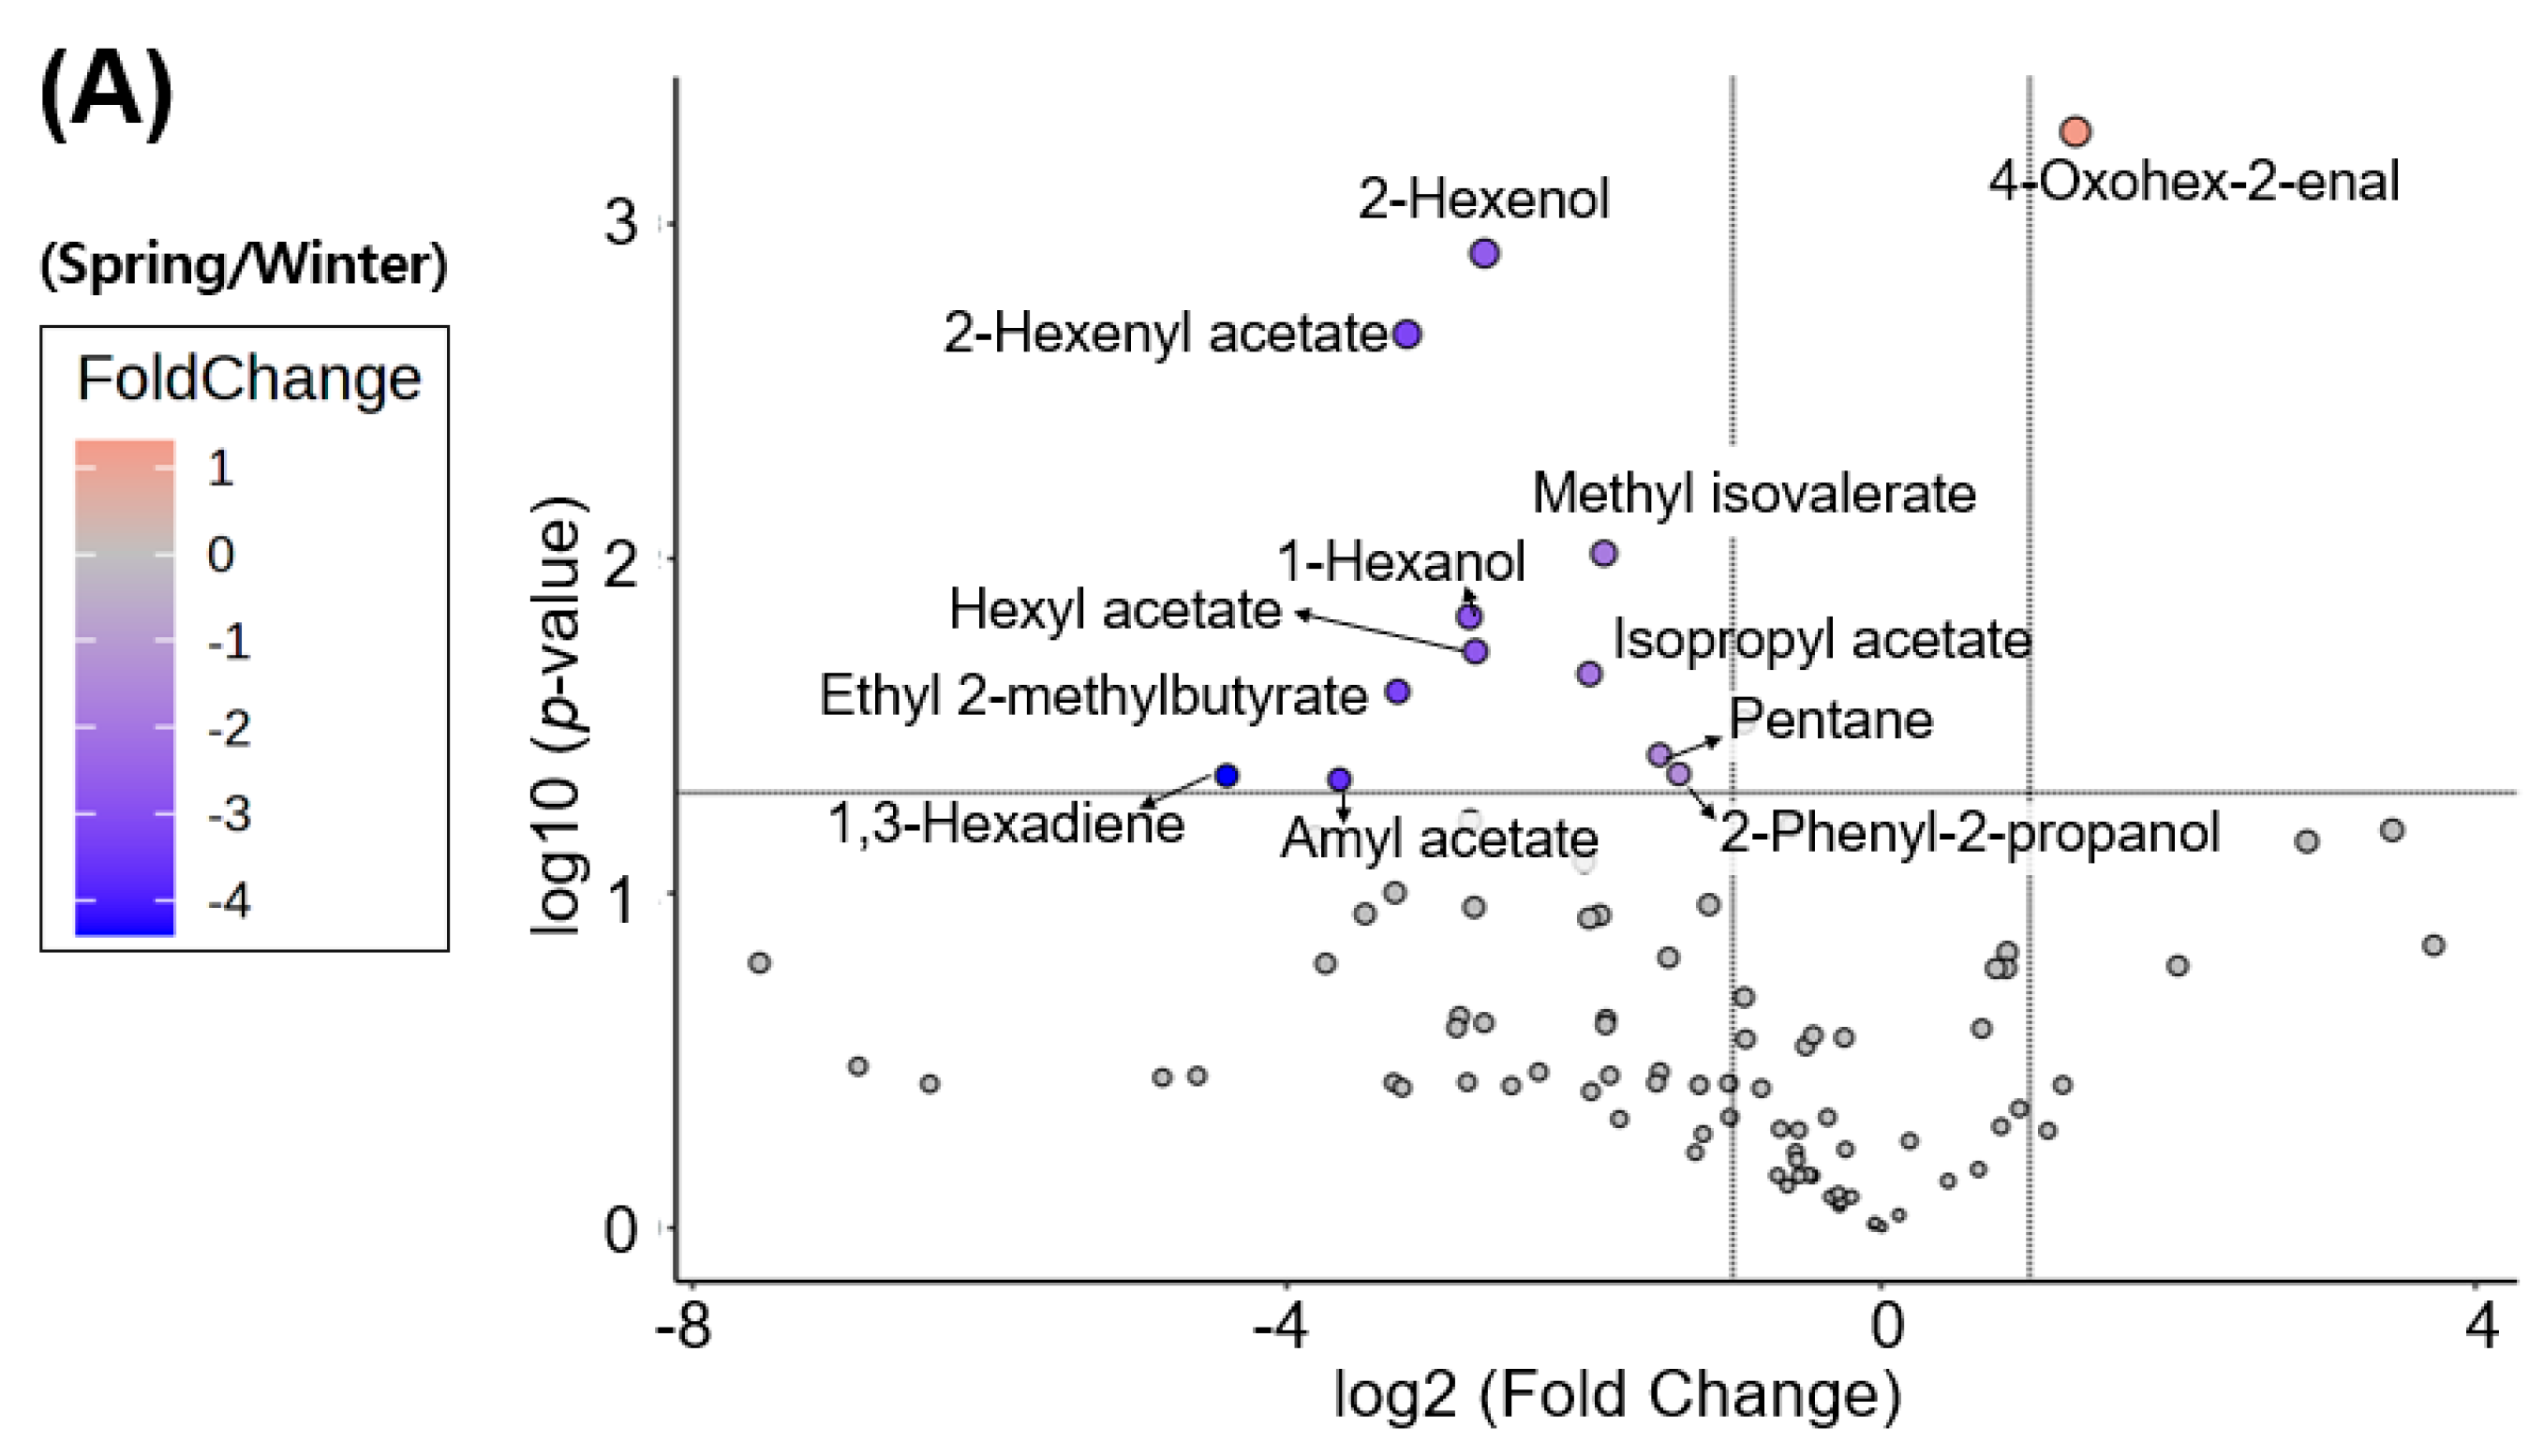
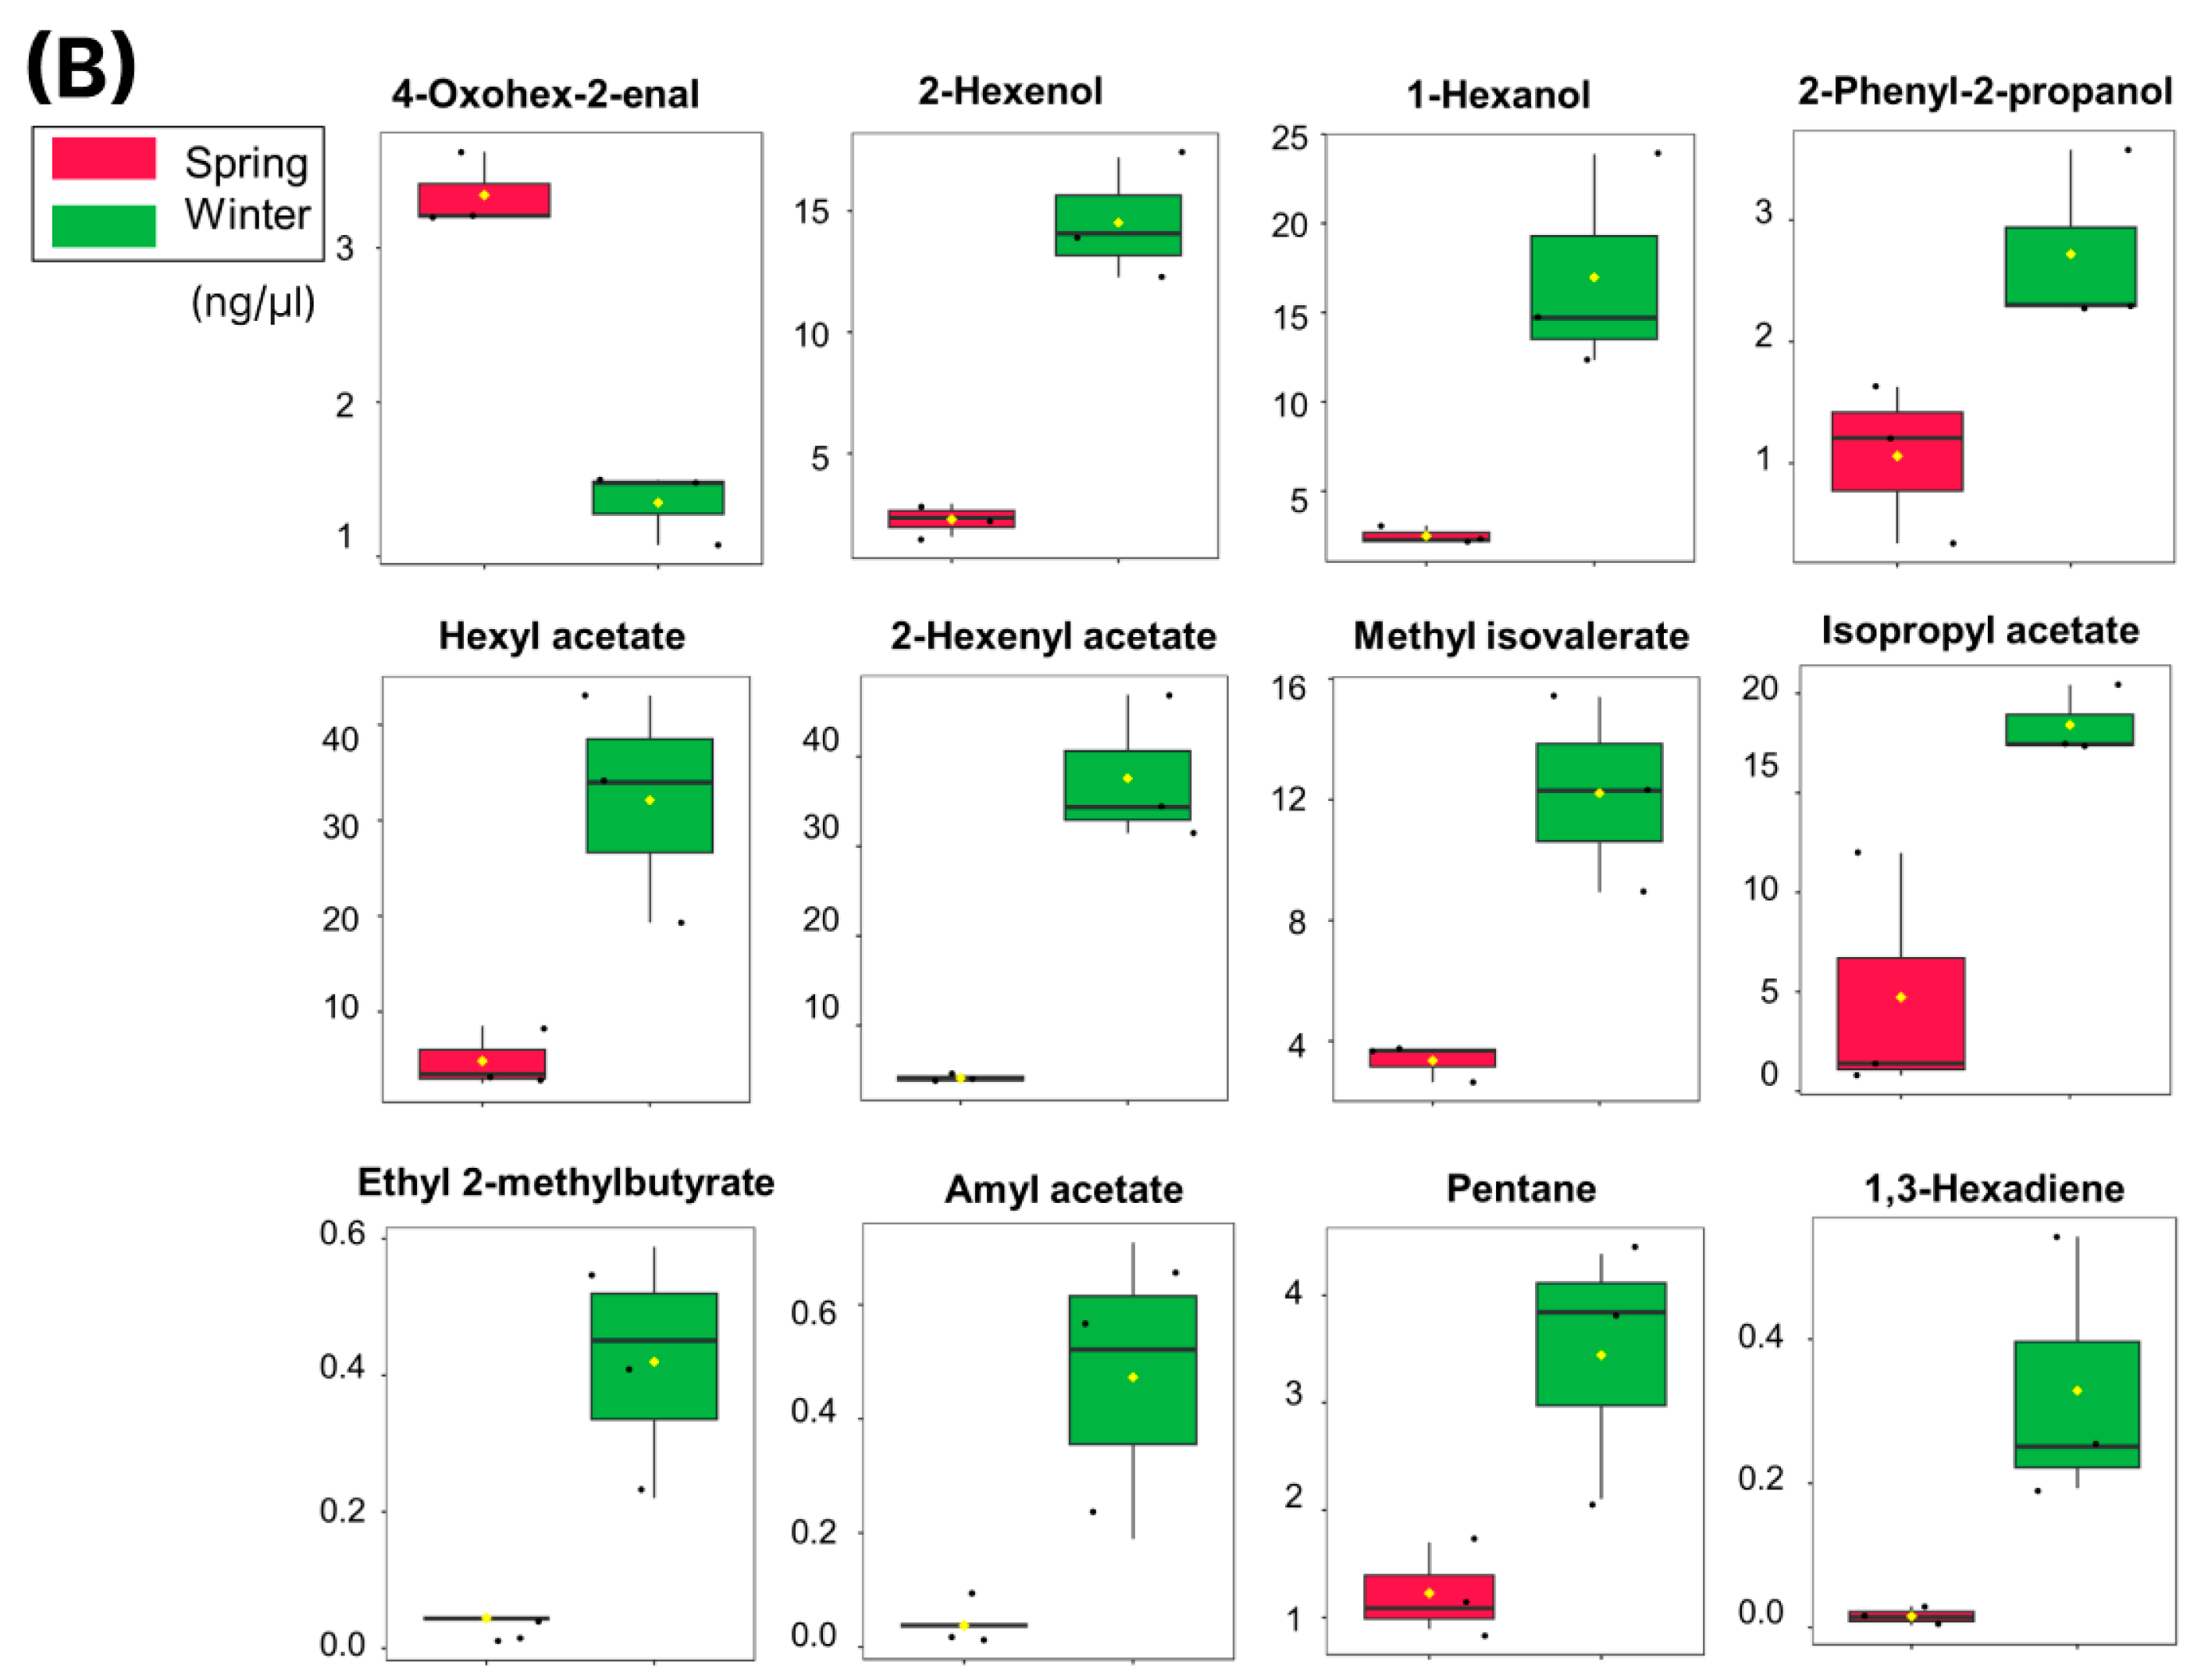
It is well-documented that strawberries grown in warmer temperatures often exhibit lower fruit quality compared to those grown in cooler conditions [27]. While much research has focused on sugar content and its impact on fruit quality, there is a significant lack of studies examining the role of aroma in this context. To address this research gap, we collected and compared the volatile organic compound (VOC) profiles of strawberries from various cultivars, harvested in both winter and spring. This study aims to offer practical insights into how seasonal variations affect strawberry aroma and, consequently, fruit quality, which could be valuable for optimizing cultivation practices and improving marketable quality in the strawberry industry. Volatile organic compounds (VOCs) that exhibited significant changes between seasons (p-value < 0.05 and fold change > 2.0) were identified (Figure 4). Overall, a reduction in volatile compounds was observed in spring strawberries compared to winter strawberries. Notably, only 4-oxohex-2-enal, the aldehyde, showed a significantly higher concentration in spring strawberries compared to winter strawberries. The following compounds decreased in spring strawberries: three alcohols (2-hexenol, 1-hexanol, and 2-phenyl-2-propanol), six esters (hexyl acetate, 2-hexenyl acetate, methyl isovalerate, isopropyl acetate, ethyl 2-methylbutyrate, amyl acetate), one alkane (pentane), and one alkene (1,3-hexadiene).
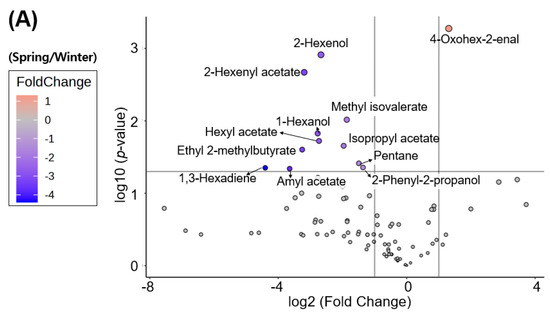

Figure 4.
Volcano plot of seasonal strawberries (A) and box plot of significant compounds (B). In Figure 4A, blue dots represent compounds significantly reduced in concentration in spring strawberries, while an orange dot indicates compound significantly higher in spring strawberries compared to winter strawberries (p-value < 0.05 and fold change > 2.0). (B) depicts box plots where the y-axis represents the internal standard normalized concentration (ng/µL). The red boxes correspond to the data from spring strawberries, and the green boxes represent winter strawberry data. Black dots show the concentrations of the compound from all samples. A yellow diamond indicates the mean concentration. The notch represents the 95% confidence interval around the median.
2-Hexenol and 1-hexanol are believed to contribute to a grassy odor, potentially associated with earthy undertones. However, concurrently, each of them emits floral and fruity aromas, making them favorable in aroma compositions [28,29]. Although 2-Phenyl-2-propanol is considered an odorless compound, being a hydride of cumene suggests its potential association with the phenol synthesis pathway. The esters selected as significantly lower in spring strawberries are generally associated with fruity or sweet aromas. These compounds may undergo temperature-dependent variations, potentially contributing to the decline in quality observed in strawberries cultivated in warmer conditions.
Given this application, our strawberry VOC library can conveniently assist strawberry VOC research.
5. Discussion
The strawberry VOC library is expected to have the following useful applications. Recent studies have identified compounds that influence sensory characteristics such as taste and aroma [30], explored the relationship between strawberry VOCs and gray mold infection [31], investigated attempts to use strawberry VOCs as markers for determining ripeness [32], and examined how soilborne pathogens affect strawberry VOC profiles [33]. Additionally, research efforts have focused on discovering genetic markers related to aroma for use in breeding programs [7,34,35]. Given the active research in strawberry aroma, the development of a specialized strawberry VOC library is highly valuable.
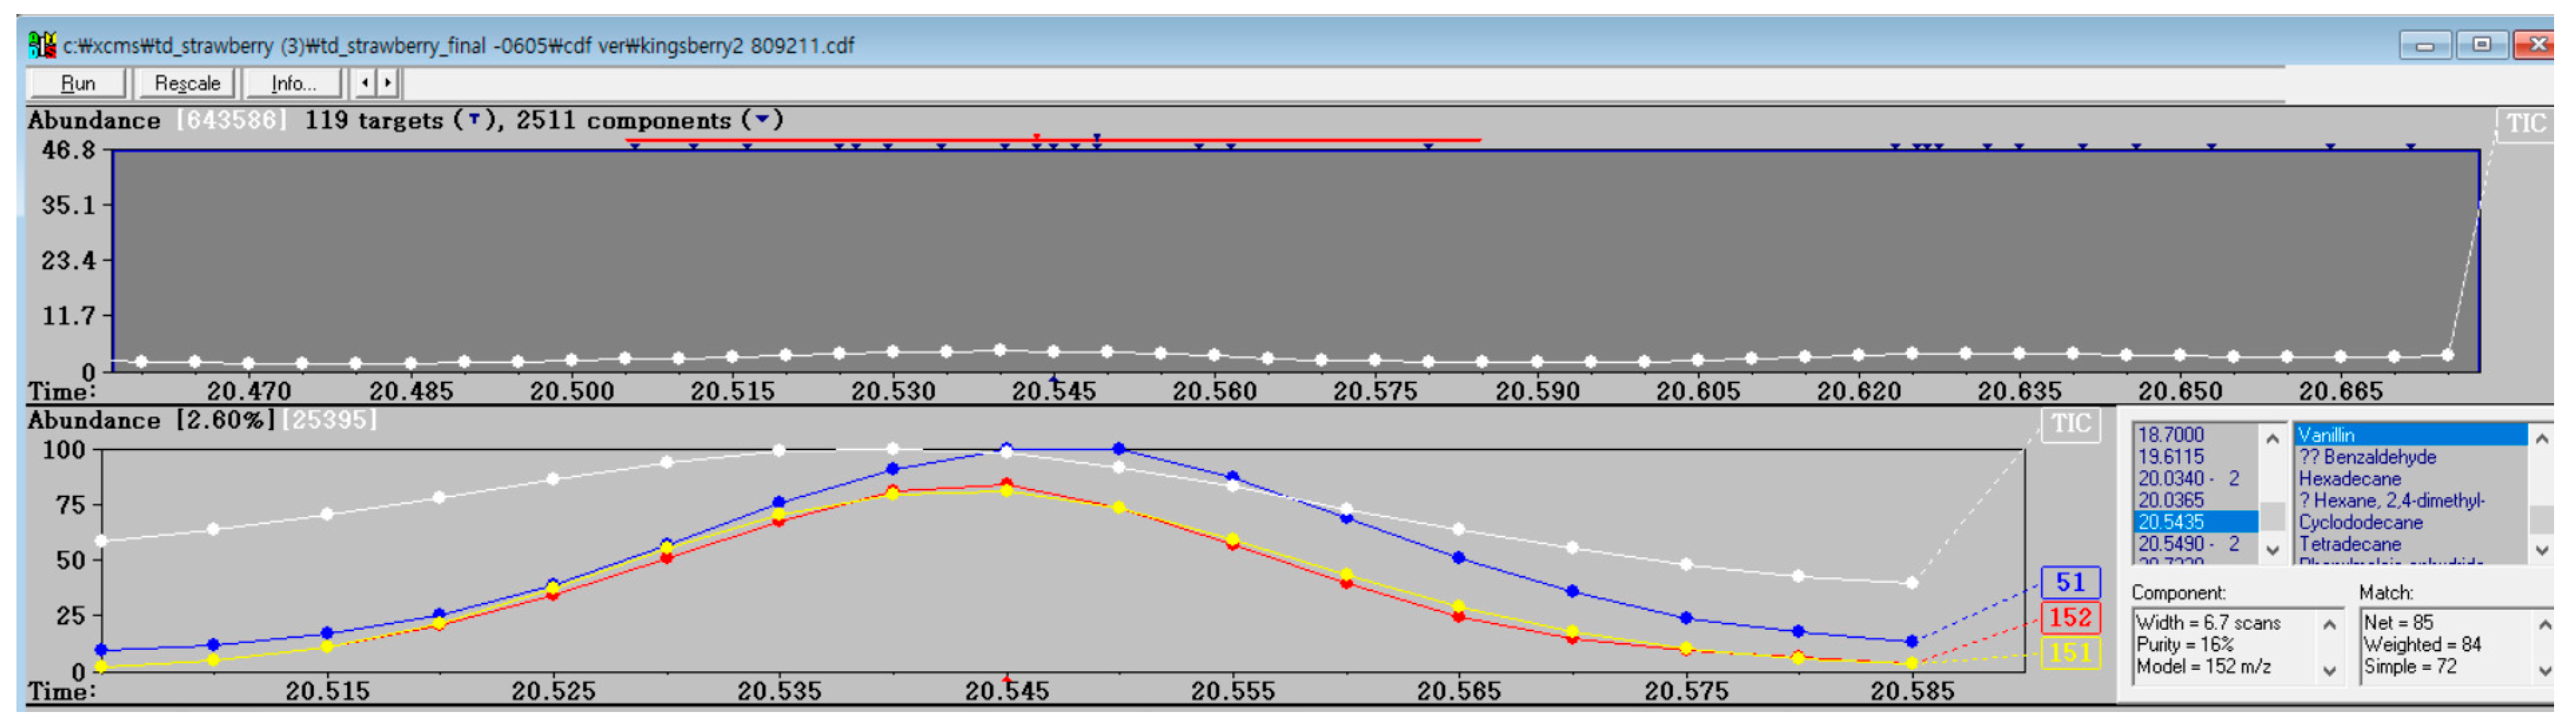
One of the primary benefits of having a library dedicated to strawberry VOCs is the improved accuracy in detecting specific compounds. A specialized library allows for lower detection thresholds, leading to more precise identification even in the presence of noise or complex matrices. For instance, trace amounts of vanillin were successfully detected using AMDIS and this library (Figure 5).
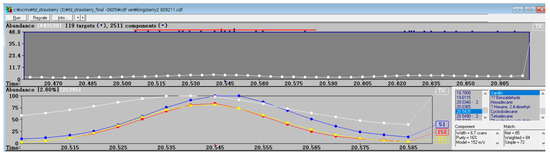
Figure 5.
Detection of vanillin using AMDIS. The white line represents the total ion chromatogram (TIC), while the blue, red, and yellow lines correspond to m/z values of 51, 152, and 151, respectively. Vanillin was detected with a net match score of 85.
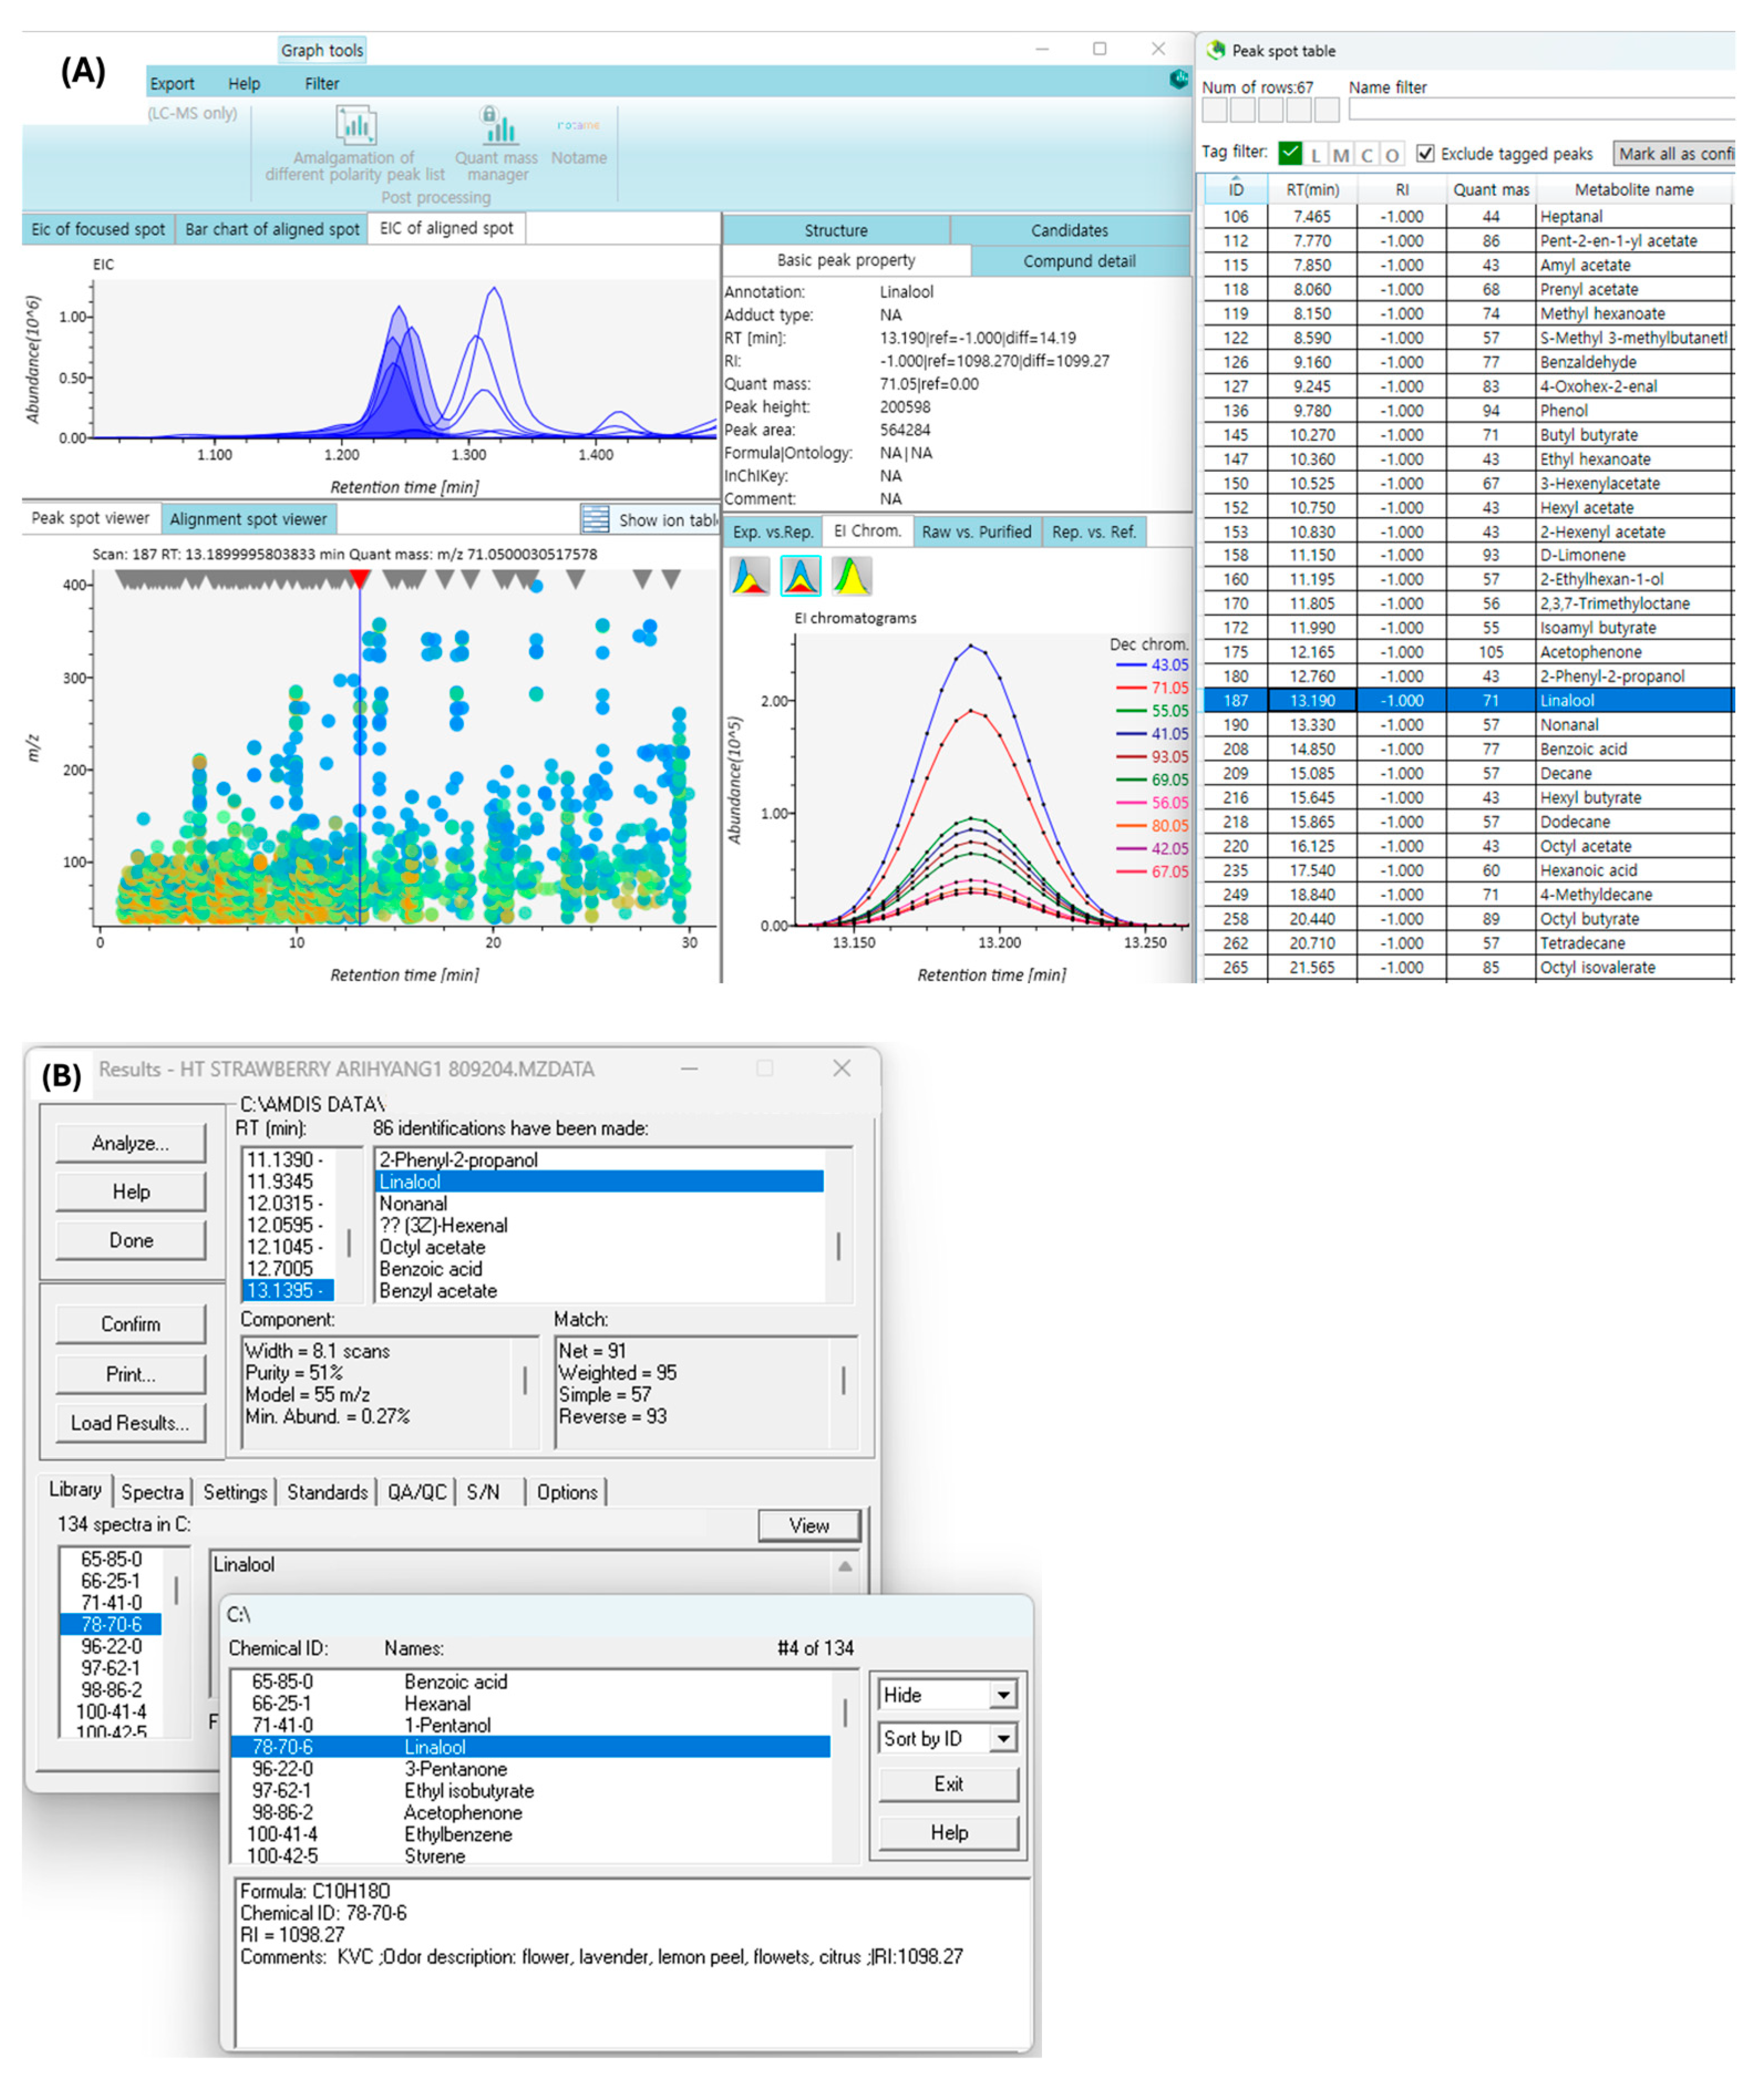
Many research labs use unpublished in-house libraries [34]. Even when they are published or commercially available, they often suffer from low compatibility, being usable only on specific instruments [35]. Additionally, many journal articles only report m/z values, making it extremely difficult to obtain comprehensive mass spectral libraries from these sources [36]. In contrast, our library is open access, allowing anyone to view and download it. Furthermore, it is distributed in the MSP format, which is widely used by chromatogram analysis programs such as AMDIS 2.73 and MSDial 5 (Figure 6). However, this library records only retention indices without retention times for versatility. Therefore, when opting to use the retention time tolerance option, caution should be exercised as it may not function correctly in this context. Alternatively, please consider adding retention time data to the library itself.
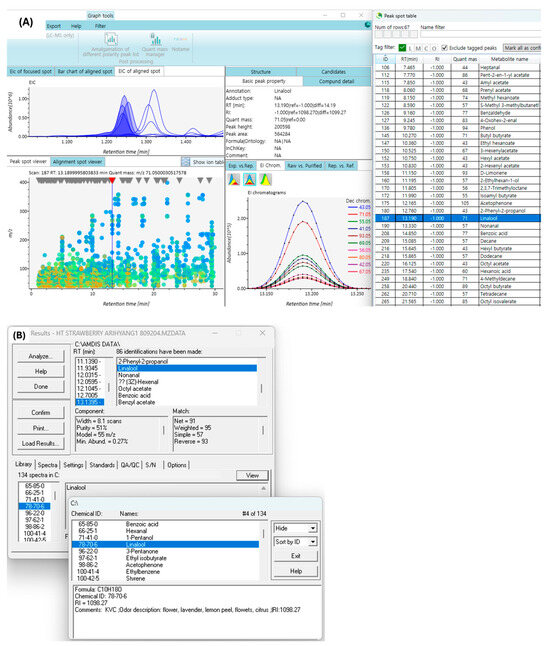
Figure 6.
Practical application of the library. (A) shows the annotation using our MSP library in aligned data within the MSDial 5.3 software. (B) displays the results window after conducting analysis with AMDIS 2.73.
Looking ahead, a global VOC database for strawberry cultivars worldwide, enhanced by advanced equipment like MS/MS, would greatly improve the quality and comprehensiveness of the research.
6. Conclusions
This paper presents the publication of a strawberry VOC AMDIS library utilizing Tenax TA TD tubes. Emphasizing the significance and research value of this library, the importance of deconvolution feature of AMDIS is highlighted. To underscore the uniqueness of our approach, we conducted comparisons with existing libraries and introduced various commercially available GC-MS libraries. Subsequently, the practical application of the library was demonstrated through a comparison of the aromas of spring and winter strawberries, identifying compounds exhibiting significant changes according to temperature conditions. The research aims to contribute to future endeavors in strawberry studies. However, it is essential to acknowledge a limitation of Tenax TA regarding its reduced adsorption for lactone compounds. Future investigations, employing alternative adsorbents such as Hisorb or SPME with Divinylbenzene or Carboxen material, may yield valuable insights into compounds undetected by Tenax TA and Twister®, offering a more comprehensive dataset.
Supplementary Materials
The following supporting information can be downloaded at: https://www.mdpi.com/article/10.3390/horticulturae10080882/s1, Table S1: Library content, Data S1. Chromatogram data file used for performance test, Data S2. Library files in MSL CID MSP.
Author Contributions
Data curation, E.D. and E.J.; Formal analysis, E.D.; Investigation, E.J., C.S.G. and S.K.; Project administration, S.K., S.Y.L. and K.-M.K.; Resources, S.K. and S.Y.L.; Supervision, K.-M.K.; Visualization, E.D.; Writing—original draft, E.D.; Writing—review and editing, C.S.G. and K.-M.K. All authors have read and agreed to the published version of the manuscript.
Funding
This research was funded by the support of “Cooperative Research Program for Agriculture Science and Technology Development (Project No. RS-2023-00222739)” Rural Development Administration, Republic of Korea and by the Korea University Grant.
Data Availability Statement
The original contributions presented in the study are included in the article and Supplementary Material; further inquiries can be directed to the corresponding author.
Conflicts of Interest
The authors declare no conflicts of interest.
References
- Do, E.; Kim, M.; Ko, D.-Y.; Lee, M.; Lee, C.; Ku, K.-M. Machine learning for storage duration based on volatile organic compounds emitted from ‘Jukhyang’ and ‘Merry Queen’ strawberries during post-harvest storage. Postharvest Biol. Technol. 2024, 211, 112808. [Google Scholar] [CrossRef]
- Wang, G.X.; Chang, L.L.; Zhang, L.X.; Dong, J.; Zhong, C.F.; Wang, L.N.; Zhang, Y.T. Preliminary study on the inheritance of volatile organic compounds in 40 F1 hybrid strawberry (Fragaria × ananassa Duch.) progeny from a ‘Camarosa’(♀) בBenihoppe’(♂) cross. J. Hortic. Sci. Biotechnol. 2014, 89, 307–311. [Google Scholar] [CrossRef]
- Zhang, Y.-T.; Wang, G.-X.; Dong, J.; Zhong, C.-F.; Kong, J.; Li, T.-Z.; Han, Z.-H. Analysis of Volatile Components in Strawberry Cultivars Xingdu 1 and Xingdu 2 and Their Parents. Agric. Sci. China 2009, 8, 441–446. [Google Scholar] [CrossRef]
- Jee, E.; Do, E.; Gil, C.S.; Kim, S.; Lee, S.Y.; Lee, S.; Ku, K.-M. Analysis of volatile organic compounds in Korean-bred strawberries: Insights for improving fruit flavor. Front. Plant Sci. 2024, 15, 1360050. [Google Scholar] [CrossRef]
- Barbey, C.R.; Hogshead, M.H.; Harrison, B.; Schwartz, A.E.; Verma, S.; Oh, Y.; Lee, S.; Folta, K.M.; Whitaker, V.M. Genetic analysis of methyl anthranilate, mesifurane, linalool, and other flavor compounds in cultivated strawberry (Fragaria × ananassa). Front. Plant Sci. 2021, 12, 615–749. [Google Scholar] [CrossRef]
- Chambers, A.H.; Pillet, J.; Plotto, A.; Bai, J.; Whitaker, V.M.; Folta, K.M. Identification of a strawberry flavor gene candidate using an integrated genetic-genomic-analytical chemistry approach. BMC Genom. 2014, 15, 217. [Google Scholar] [CrossRef] [PubMed]
- Noguchi, Y.; Morishita, M.; Muro, T.; Kojima, A.; Sakata, Y.; Yamada, T.; Sugiyama, K. ‘Tokun’: A new aromatic decaploid interspecific hybrid strawberry. Bull. Natl. Inst. Veg. Tea Sci. 2011, 59–67. [Google Scholar] [CrossRef]
- Noguchi, Y.; Mochizuki, T.; Sone, K. Breeding of a new aromatic strawberry by interspecific hybridization Fragaria x ananassa×F. nilgerrensis. J. Jpn. Soc. Hortic. Sci. 2002, 71, 208–213. [Google Scholar] [CrossRef]
- Zhang, Y.; Wang, G.; Dong, J.; Zhong, C.; Chang, L.; Zhang, H. The current progress in strawberry breeding in China. In VIII International Strawberry Symposium 1156. Acta Hortic. 2016, 1156, 7–12. [Google Scholar]
- Horning, E.C.; Horning, M.-G. Metabolic profiles: Gas-phase methods for analysis of metabolites. Clin. Chem. 1971, 17, 802–809. [Google Scholar] [CrossRef]
- Halket, J.M.; Waterman, D.; Przyborowska, A.M.; Patel, R.K.P.; Fraser, P.D.; Bramley, P.M. Chemical derivatization and mass spectral libraries in metabolic profiling by GC/MS and LC/MS/MS. J. Exp. Bot. 2004, 56, 219–243. [Google Scholar] [CrossRef]
- van Asten, A. The importance of GC and GC-MS in perfume analysis. Trends Anal. Chem. 2002, 21, 698–708. [Google Scholar] [CrossRef]
- Morales, M.; Callejón, R.; Ordóñez, J.; Troncoso, A.; García-Parrilla, M. Comparative assessment of software for non-targeted data analysis in the study of volatile fingerprint changes during storage of a strawberry beverage. J. Chromatogr. A 2017, 1522, 70–77. [Google Scholar] [CrossRef]
- Wu, L.; Liu, W.; Cao, J.; Li, Q.; Huang, Y.; Min, S. Analysis of the aroma components in tobacco using combined GC-MS and AMDIS. Anal. Methods 2013, 5, 1259–1263. [Google Scholar] [CrossRef]
- Zhang, P.; Li, R.; Long, C.; Lin, S.; Zhang, F. Anslysis of volatile compounds from Colla Corii Asini by HS-SPME-GC-MS combined with AMDIS. Food Mach. 2019, 35, 52–57. [Google Scholar]
- Zhao, C.; Quan, W.; Ding, G. SPME-GCMS combined AMDIS and KOVÁTS retention index to analyze the volatile organic compounds in Russula rubra (Krombh.) Bres. essential oil. BioResources 2022, 17, 1680. [Google Scholar] [CrossRef]
- Behrends, V.; Tredwell, G.D.; Bundy, J.G. A software complement to AMDIS for processing GC-MS metabolomic data. Anal. Biochem. 2011, 415, 206–208. [Google Scholar] [CrossRef]
- Pan, L.; Zhang, W.; Zhu, N.; Mao, S.; Tu, K. Early detection and classification of pathogenic fungal disease in post-harvest strawberry fruit by electronic nose and gas chromatography–mass spectrometry. Food Res. Int. 2014, 62, 162–168. [Google Scholar] [CrossRef]
- Careri, M.; Mangia, A. Gas Chromatography–Mass Spectrometry Analysis of Flavors and Fragrances. East. Hemisph. Distrib. 2001, 86, 409. [Google Scholar]
- Burke, W.J., IV. A Robust and Automated Deconvolution Algorithm of Peaks in Spectroscopic Data; Rowan University: Glassboro, NJ, USA, 2019; ISBN 1392147182. [Google Scholar]
- Zhang, W.; Wu, P.; Li, C. Study of automated mass spectral deconvolution and identification system (AMDIS) in pesticide residue analysis. Rapid Commun. Mass Spectrom. 2006, 20, 1563–1568. [Google Scholar] [CrossRef]
- Pang, Z.; Chong, J.; Zhou, G.; de Lima Morais, D.A.; Chang, L.; Barrette, M.; Gauthier, C.; Jacques, P.-É.; Li, S.; Xia, J. MetaboAnalyst 5.0: Narrowing the gap between raw spectra and functional insights. Nucleic Acids Res. 2021, 49, W388–W396. [Google Scholar] [CrossRef]
- Kováts, E.S.; Weisz, P. Über den Retentionsindex und seine Verwendung zur Aufstellung einer Polaritätsskala für Lösungsmittel. Berichte Bunsenges. Phys. Chem. 1965, 69, 812–820. [Google Scholar] [CrossRef]
- Kelly, K.; Bell, S. Evaluation of the reproducibility and repeatability of GCMS retention indices and mass spectra of novel psychoactive substances. Forensic Chem. 2018, 7, 10–18. [Google Scholar] [CrossRef]
- Zellner, B.d.A.; Bicchi, C.; Dugo, P.; Rubiolo, P.; Dugo, G.; Mondello, L. Linear retention indices in gas chromatographic analysis: A review. Flavour Fragr. J. 2008, 23, 297–314. [Google Scholar] [CrossRef]
- Urrutia, M.; Rambla, J.L.; Alexiou, K.G.; Granell, A.; Monfort, A. Genetic analysis of the wild strawberry (Fragaria vesca) volatile composition. Plant Physiol. Biochem. 2017, 121, 99–117. [Google Scholar] [CrossRef]
- Heechul Lee, H.K.; Jang, W.; Nam, M.; Lee, I.; Lee, H. Changes of Firmness, Soluble Solids Contents, Acidity, Mineral Nutrients Contents about in Various Strawberry Cultivars according to Harvest Time. In Horticulture Abstracts; Korean Society For Horticultural Science: Wanju County, Republic of Korea, 2011; p. 73. [Google Scholar]
- Acree, T.; Arn, H. Flavornet and Human Odor Space. 25 June 2004. Available online: https://www.flavornet.org/index.html (accessed on 22 January 2024).
- Fahlbusch, K.G.; Hammerschmidt, F.-J.; Panten, J.; Pickenhagen, W.; Schatkowski, D.; Bauer, K.; Garbe, D.; Surburg, H. Flavors and fragrances. In Ullmann’s Encyclopedia of Industrial Chemistry; Wiley-VCH: Weinheim, Germany, 2000; ISSN 1435-6007. [Google Scholar]
- Fan, Z.; Plotto, A.; Bai, J.; Whitaker, V.M. Volatiles Influencing sensory attributes and bayesian modeling of the soluble solids–sweetness relationship in strawberry. Front. Plant Sci. 2021, 12, 640704. [Google Scholar] [CrossRef] [PubMed]
- Rey-Serra, P.; Mnejja, M.; Monfort, A. Inheritance of esters and other volatile compounds responsible for the fruity aroma in strawberry. Front. Plant Sci. 2022, 13, 959155. [Google Scholar] [CrossRef] [PubMed]
- Padilla-Jiménez, S.M.; Angoa-Pérez, M.V.; Mena-Violante, H.G.; Oyoque-Salcedo, G.; Montañez-Soto, J.L.; Oregel-Zamudio, E. Identification of Organic Volatile Markers Associated with Aroma during Maturation of Strawberry Fruits. Molecules 2021, 26, 504. [Google Scholar] [CrossRef]
- Xu, Y.; Tong, Z.; Zhang, X.; Zhang, X.; Luo, Z.; Shao, W.; Li, L.; Ma, Q.; Zheng, X.; Fang, W. Plant volatile organic compound (E)-2-hexenal facilitates Botrytis cinerea infection of fruits by inducing sulfate assimilation. New Phytol. 2021, 231, 432–446. [Google Scholar] [CrossRef]
- Kind, T.; Tsugawa, H.; Cajka, T.; Ma, Y.; Lai, Z.; Mehta, S.S.; Wohlgemuth, G.; Barupal, D.K.; Showalter, M.R.; Arita, M.; et al. Identification of small molecules using accurate mass MS/MS search. Mass Spectrom. Rev. 2018, 37, 513–532. [Google Scholar] [CrossRef]
- Thielen, B.; Heinen, S.; Schomburg, D. mSpecs: A software tool for the administration and editing of mass spectral libraries in the field of metabolomics. BMC Bioinform. 2009, 10, 229. [Google Scholar] [CrossRef] [PubMed]
- Horai, H.; Arita, M.; Kanaya, S.; Nihei, Y.; Ikeda, T.; Suwa, K.; Ojima, Y.; Tanaka, K.; Tanaka, S.; Aoshima, K.; et al. MassBank: A public repository for sharing mass spectral data for life sciences. J. Mass Spectrom. 2010, 45, 703–714. [Google Scholar] [CrossRef] [PubMed]
Disclaimer/Publisher’s Note: The statements, opinions and data contained in all publications are solely those of the individual author(s) and contributor(s) and not of MDPI and/or the editor(s). MDPI and/or the editor(s) disclaim responsibility for any injury to people or property resulting from any ideas, methods, instructions or products referred to in the content. |
© 2024 by the authors. Licensee MDPI, Basel, Switzerland. This article is an open access article distributed under the terms and conditions of the Creative Commons Attribution (CC BY) license (https://creativecommons.org/licenses/by/4.0/).