Abstract
This study assessed eleven elements in 24 edible-podded peas, including sugar snap pea and snow pea genotypes aiming to identify promising parents for nutraceutical breeding. Elemental concentrations of pods (dry weight basis) were estimated through inductively coupled plasma-optical emission spectroscopy (ICP-OES). The ranges for these elements varied significantly, highlighting the diverse elemental profiles within the edible-podded pea genotypes. All the elements exhibited a high genotypic and phenotypic coefficient of variation along with considerable heritability and hereditary progress. Positive and significant correlations were recorded among all elements, suggesting the potential for simultaneous selection for these traits. Principal component analysis (PCA) revealed that the first two components accounted for 80.56% of the variation. Further, cluster analysis, based on Euclidean distance, grouped the 24 cultivars into two major clusters. Cluster I exhibited higher means for all estimated concentrations compared to Cluster II. Notably, Dwarf Grey Sugar and Arka Sampoorna from the snap pea group and PED-21-5 and Sugar Snappy from the sugar snap pea in Cluster II demonstrated superior elemental concentration in whole pods. The selected edible-podded pea genotypes serve as valuable genetic resources for new cultivar development, particularly in biofortification efforts targeting whole pod nutrient composition.
1. Introduction
The garden pea boasts a rich history of classical genetic research and stands as the second most extensively cultivated legume globally. It is a self-pollinating, cool-season leguminous crop with a diploid chromosome number of 14 [1]. It encompasses three diverse botanical varieties: shelled or English pea (Pisum sativum L. var. sativum), snow pea (Pisum sativum L. var. macrocarpon), and sugar snap or snap pea (Pisum sativum L. var. saccharatum) [2]. In the case of shelled peas, a parchment layer or sclerenchymatous membrane is present in the inner pod wall, necessitating shelling before consumption. This pod wall constitutes approximately 35–40% of the peas’ fresh weight and is commonly discarded, resulting in a loss of quality protein, fiber, and vital elements and vitamins [3]. Conversely, snow pea and snap pea lacks the parchment layer, i.e., these pods are consumed without removing the pod wall and called edible-podded peas. These types of pods provide additional nutrient concentration per unit total pod weight as compared to shelled peas and generally overcome the problem of pea waste [4]. Snow peas typically produce large, flat pods with a constricted shape, while snap peas bear round, thick-walled pods with an inflated appearance, distinguishing them from snow peas. These edible-podded peas exhibit distinct characteristics and serve various purposes, including consumption as fresh peas after cooking, processed frozen, and canned and whole pods in salads [2].
Additionally, these edible-podded peas exhibit many nutritional attributes, containing 86.10% more pantothenic acid, 66.66% higher vitamin E, 33.30% increased vitamin C, and 29.60% additional vitamin A as compared to shelled peas [5]. The pod walls that are typically discarded in shelled peas harbor valuable components which include 58.6% dietary fiber, elements such as K and Fe surpassing the 1% threshold, and 10.8% protein concentration [6]. Additionally, it has also been confirmed that within the spectrum of elements, K and Mg take center stage as the principal macro elements in edible-podded peas, while Fe and Zn emerge as the pivotal micro elements [7]. Keeping all these things in mind, we can say that this crop could be a way to ensure nutritional security in India as there is a report of FAO that states 74.1% of Indians are unable to afford a healthy diet [8].
Concerning elemental composition, only a few studies have been conducted on the characterization of elemental concentration variation in edible-podded peas. However, a lot of scientific reports have previously revealed the diversity of micro and macro elements in field pea germplasm to identify element-rich varieties for incorporation into nutraceutical breeding programs [9,10,11]. Likewise, in garden peas, both genetic and environmental factors significantly influence elemental concentration, including various micro and macro elements in pea grains [12]. This situation presents a substantial opportunity to reveal further insights about the variability in the elemental concentration of edible-podded peas as these edible-podded peas are gaining popularity as a crucial component for nourishing the global diet. So, there is a pressing need to thoroughly characterize these genotypes for their elemental composition. This will facilitate the effective utilization of newly identified variations in a variety of breeding endeavors [13].
In the current study, we estimated the variability, correlation coefficients, genetic divergence, cluster analysis, and PCA of 24 genotypes of edible-podded peas, including snow peas and snap peas, across 11 elemental concentrations. These methodologies play a vital role in selecting potential genotypes for future breeding programs. Correlation coefficient analysis is employed to discern associations between two traits, while cluster analysis facilitates the grouping of genotypes into homogeneous clusters, allowing the determination of genetic distances both within and across clusters. PCA contributes by identifying the key characteristics that significantly contribute to nutrient diversity and aids in the identification of desirable edible-podded pea genotypes. The findings of this study have practical implications for developing pea cultivars with enhanced nutrient profiles, making them appealing to pea breeders focusing on the edible-podded pea gene pool.
2. Materials and Methods
2.1. Plant Material
The plant material consisted of edible-podded pea genotypes, with 8 and 16 genotypes of sugar snap peas and snow peas, respectively (Supplementary Table S1). The whole collection was maintained at Punjab Agricultural University, Ludhiana (India).
2.2. Location and Climatic Conditions
This experiment was carried out at a vegetable research farm, Department of Vegetable Science, Punjab Agricultural University, Ludhiana (located at 30°54′26″ N latitude, 75°47′38″ E longitude, and 247 m above sea level) during December–March (2022–2023). The temperature at the vegetable research farm varied from 9.51 °C to 22.12 °C, and the average rainfall was 9.55 mm throughout the cropping period. The soil was sandy loam, and the pH was 8.5.
2.3. Cultural Practices
The genotypes were sown on flat beds having a plot size of 1 × 2 m2 during the second fortnight of November 2022 using a Randomized Block Design having three replications with a row-to-row spacing of 30 cm and plant-to-plant spacing of 7.5 cm at the vegetable research garm, Department of Vegetable Science, Punjab Agricultural University, Ludhiana. The 45 kg Urea and 155 kg Superphosphate per acre were applied before sowing. For weed control, Stomp 30 EC (pendimethalin) at 1.0 L per acre was applied within 1 day of sowing by dissolving in 150–200 L of water. The second and third weeding was performed manually one and two months after sowing.
2.4. Elemental Analysis
The entire pods (including immature seeds) from each genotype were harvested at the edible maturity stage before string development and manually cleaned to remove foreign matter and dust. A quantity of 100 g of pods from each genotype was dried in the hot air oven at 60 ± 1 °C until its weight became constant. The dried pods were subsequently processed into powder using an electrical mixer grinder. Elemental concentrations in the dried powder were quantified at the Central Testing Laboratory, Department of Soil Science, Punjab Agricultural University, Ludhiana, India, employing inductively coupled plasma-optical emission spectroscopy (Model: Agilent 5800 ICP-OES, Agilent Technologies Pvt. Ltd., Mulgrave, Victoria, 3170 Australia). Among the 24 edible-podded pea genotypes examined, concentrations of calcium (Ca), magnesium (Mg), phosphorus (P), potassium (K), and sulfur (S) were computed in g/kg, while copper (Cu), iron (Fe), manganese (Mn), nickel (Ni), zinc (Zn), and sodium (Na) were quantified in mg/kg. To calibrate the ICP-OES, distilled water served as a blank; standards of pure elements were mixed to known concentrations, and two rice reference samples were utilized [8]. For the quantification of elements through ICP-OES, 0.5 g of the dried and ground sample of edible-podded peas was combined with 5 mL of concentrated nitric acid, and incubated at 95 °C for 90 min. Subsequently, 4 mL of 30% hydrogen peroxide was added to each glass tube and incubated at 95 °C for 20 min in an oven. After cooling for 2 min, the final volume was adjusted to 50 mL with distilled water. These samples were then transferred to ICP-OES tubes for the estimation of different elemental concentrations following the manufacturer’s specifications.
2.5. Statistical Analysis
The R (version 3.6.3) statistical program was used to perform a one-way analysis of variance (ANOVA) on the means of the experimental data [14]. The separation of means was executed through the least significance difference (LSD) method. The estimation of various genetic parameters like genotypic variance (σ2g), phenotypic variance (σ2p), genotypic coefficient of variance (GCV), phenotypic coefficient of variance (PCV), heritability (h2), genetic advance, and genetic advance as a percentage of mean (GAPM) was calculated using the variability package in R studio. For categorizing the magnitude of different parameters, researchers suggested the following limits. The high value of PCV and GCV was indicated by a value of >30%. The moderate and low value of PCV and GCV was indicated by a value of 15–30% and <15%, respectively [15]. The high amount of heritability (H) was expressed by >80%, whereas a moderate value was indicated from 50 to 80%. The low level of heritability was expressed for a value of <50% [16]. The highest value of genetic gain was expressed by a value of >50%, moderate value by 25–50%, and low level was indicated by <25% [17]. Pearson correlation analysis was conducted, employing a two-tailed test of significance at a 5% level, using the corrplot package in R. To test the level of significance, the genotypic correlation coefficient was compared by the ‘r’ value given by Fisher and Yates [18] at n−2 degrees of freedom at 1% and 5% level of significance simultaneously. Principal component analysis (PCA) involving the 11 nutrient traits was carried out using the vqv/ggbiplot package in R. For hierarchical cluster analysis, the Euclidean distance method, implemented using the hclust package in R Studio, was used to cluster the edible-podded pea genotypes based on the mean data.
3. Results
3.1. ANOVA and Mean Performance of Genotypes
ANOVA results indicated significant genotypic effects on the mean sum of squares for all micro and macro elements (Table 1). K and P were the predominant macro elements, whereas Fe and Na exhibited the highest concentrations among micro elements across all pea genotypes. The mean values of all the estimated minerals in 24 edible-podded pea genotypes are given in Table 2. The genotype ‘Dwarf Grey Sugar’ exhibited the maximum concentration of several minerals on a dry weight basis which includes Mn (48.12 mg/kg), Zn (71.32 mg/kg), and S (6.64 g/kg), while the minimum values of these elements were observed in genotype ‘HPM-2’, which were 4.57 mg/kg, 5.02 mg/kg, and 0.93 g/kg, respectively. Likewise, genotype ‘PED-21-5’ exhibited the maximum amount of elements like K (25.02 g/kg), Mg (3.28 g/kg), and P (9.28 g/kg); conversely, HPM-2 had the least amount of these elements (K = 5.14 g/kg, Mg = 0.80 g/kg, P = 0.85 g/kg) among all the genotypes. Moreover, HPM-2 possessed less amount of elements like Cu (2.57 mg/kg), Fe (49.82 mg/kg), and Ca (0.41 g/kg), but their abundance was found in genotypes Namdhari-NA (73.57 mg/kg), Arka Sampoorna (921.42 mg/kg), and HPM-1 (10.20 g/kg), respectively. Furthermore, genotype ‘Tarvedo sugar’ had the least quantity of elements like Ni (1.15 mg/kg) and Na (7.77 mg/kg), while the higher value of their concentration was observed in genotype Sugar daddy (8.70 mg/kg) and Airtel (94.12 mg/kg), respectively.

Table 1.
ANOVA of edible-podded pea lines for different elemental concentrations.
Table 2.
Mean ± standard error for eleven pod elemental concentrations in 24 edible-podded pea genotypes evaluated using the replication for each genotype.
3.2. Genetic Components of Variation
The phenotypic and genotypic coefficients of variation are useful in determining the amount of variation present in the available edible-podded pea genotypes. The results of phenotypic and genotypic coefficients of variation are depicted in Table 3.
Table 3.
Variance components, h2b, and GAPM for different elements.
3.2.1. Genotypic Coefficient of Variation (%)
A wide range of genotypic variability was present among the edible-podded pea genotypes for all the elemental concentrations in Table 3. Among the edible-podded pea genotypes, the range of GCV varied from 23.94 to 65.01% (Table 3). The GCV was found to be higher for Fe (65.01%), Cu (53.02%), Ni (45.52%), Na (37.85%), Ca (35.42%), Mn (34.28%), and Zn (31.38%), while P (27.91%), S (27.08%), Mg (24.65%), and K (23.94%) exhibited moderate level of GCV. However, none of the genotypes showed a low level of GCV (Table 3).
3.2.2. Phenotypic Coefficient of Variation (%)
Among the edible-podded pea genotypes, PCV ranged from 24.10 to 65.06% (Table 3). A high level of PCV was observed for Fe concentration (65.06%), Cu (53.10%), Ni (45.58%), Na (37.92%), Ca (37.42%), Mn (34.41%), and Zn (31.49%). A moderate level of PCV was observed for P (27.98%), S (27.21%), Mg (24.86%), and K (24.10%). Like GCV, none of the genotypes displayed a low level of PCV.
3.3. Heritability and Genetic Gain
The plant breeder’s understanding of heritability and genetic gain aids in estimating the behavior of the next generation and making suitable selections for improvement. The results of heritability, genetic advance, and genetic advance as percent of mean are depicted in Table 3.
3.3.1. Heritability
In the present study, all the elemental traits showed a high level of heritability (broad sense), and it varied from 89.57% to 99.70% (Table 3). The highest value of heritability was observed for Fe (99.86%) followed by Ni (99.73%), Cu (99.70%), Na (99.66%), P (99.50%), Zn (99.30%), Mn (99.25%), S (99.06%), K (98.53%), Mg (98.53%), and Ca (89.57%).
3.3.2. Genetic Gain
The results of genetic advance as percent of mean are depicted in Table 3. All the elements show a high level of genetic advance as percent of mean, and it varied from 48.97 to 133.83% (Table 3). All the traits show a high level of genetic advance as percent of mean. The highest value of genetic gain was observed for Fe (133.83%) followed by Cu (109.06%), Ni (93.64), Na (77.84%), Mn (70.35%), Ca (69.05%), Zn (64.41%), P (57.35%), S (55.53%), Mg (50.35%), and K (48.97%).
3.4. Correlation of Nutrient Components
The results of the correlation analysis are illustrated in Figure 1. The strong clustering of points in the scatter plots between K vs. Mg and K vs. P within the correlation matrix suggests various underlying relationships and patterns among the elements analyzed. This study also identified a significant positive correlation among elements, except for certain pairs such as Cu with Na and Cu with Ca which were not significantly correlated. Only the correlation values above 0.59 are discussed here. Calcium concentration showed a positive association with all elements, varying in magnitude: very high (r = 0.80–1.00; p < 0.01) with Mg, K, P, and Mn concentrations, and high (r = 0.60–0.79; p < 0.01) with Na and Zn concentrations. Potassium concentration showed a very high correlation (r = 0.80–1.00; p < 0.01) with Mg, P, S, Mn, and Zn concentrations, and a high magnitude correlation (r = 0.60–0.79; p < 0.01) with Na concentration. Strong correlations were also observed for Na with P, S, and Mn, and similar strengths were found between Ni and Zn concentrations. Moreover, a very high correlation (r = 0.80–1.00; p < 0.01) was observed for P concentration with S, Mn, and Zn concentrations, and a high correlation (r = 0.60–0.79; p < 0.01) was found for S concentration with Mn and Zn concentrations. Notably, Ni and Zn concentrations also exhibited very high to high correlations with K concentration, respectively.
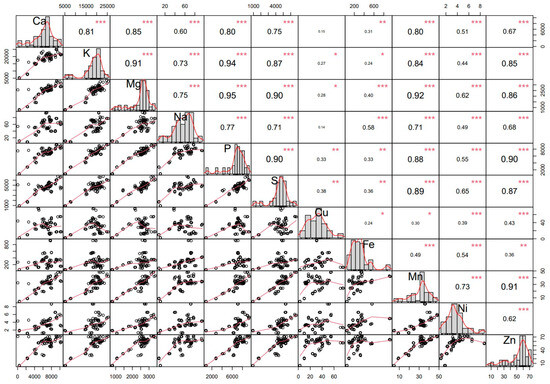
Figure 1.
Correlation coefficient matrix, scatter plot, and phenotypic frequency distribution among element traits. Diagonal representations illustrate the distribution of each variable. Bivariate scatter plots, accompanied by trend lines, are presented below the diagonal. The correlation coefficient, along with its level of significance, is indicated at the top of the diagonal using stars: * for p ≤ 0.05, ** for p ≤ 0.01, and *** for p > 0.001, denoting the respective significance levels.
3.5. Principal Component Analysis
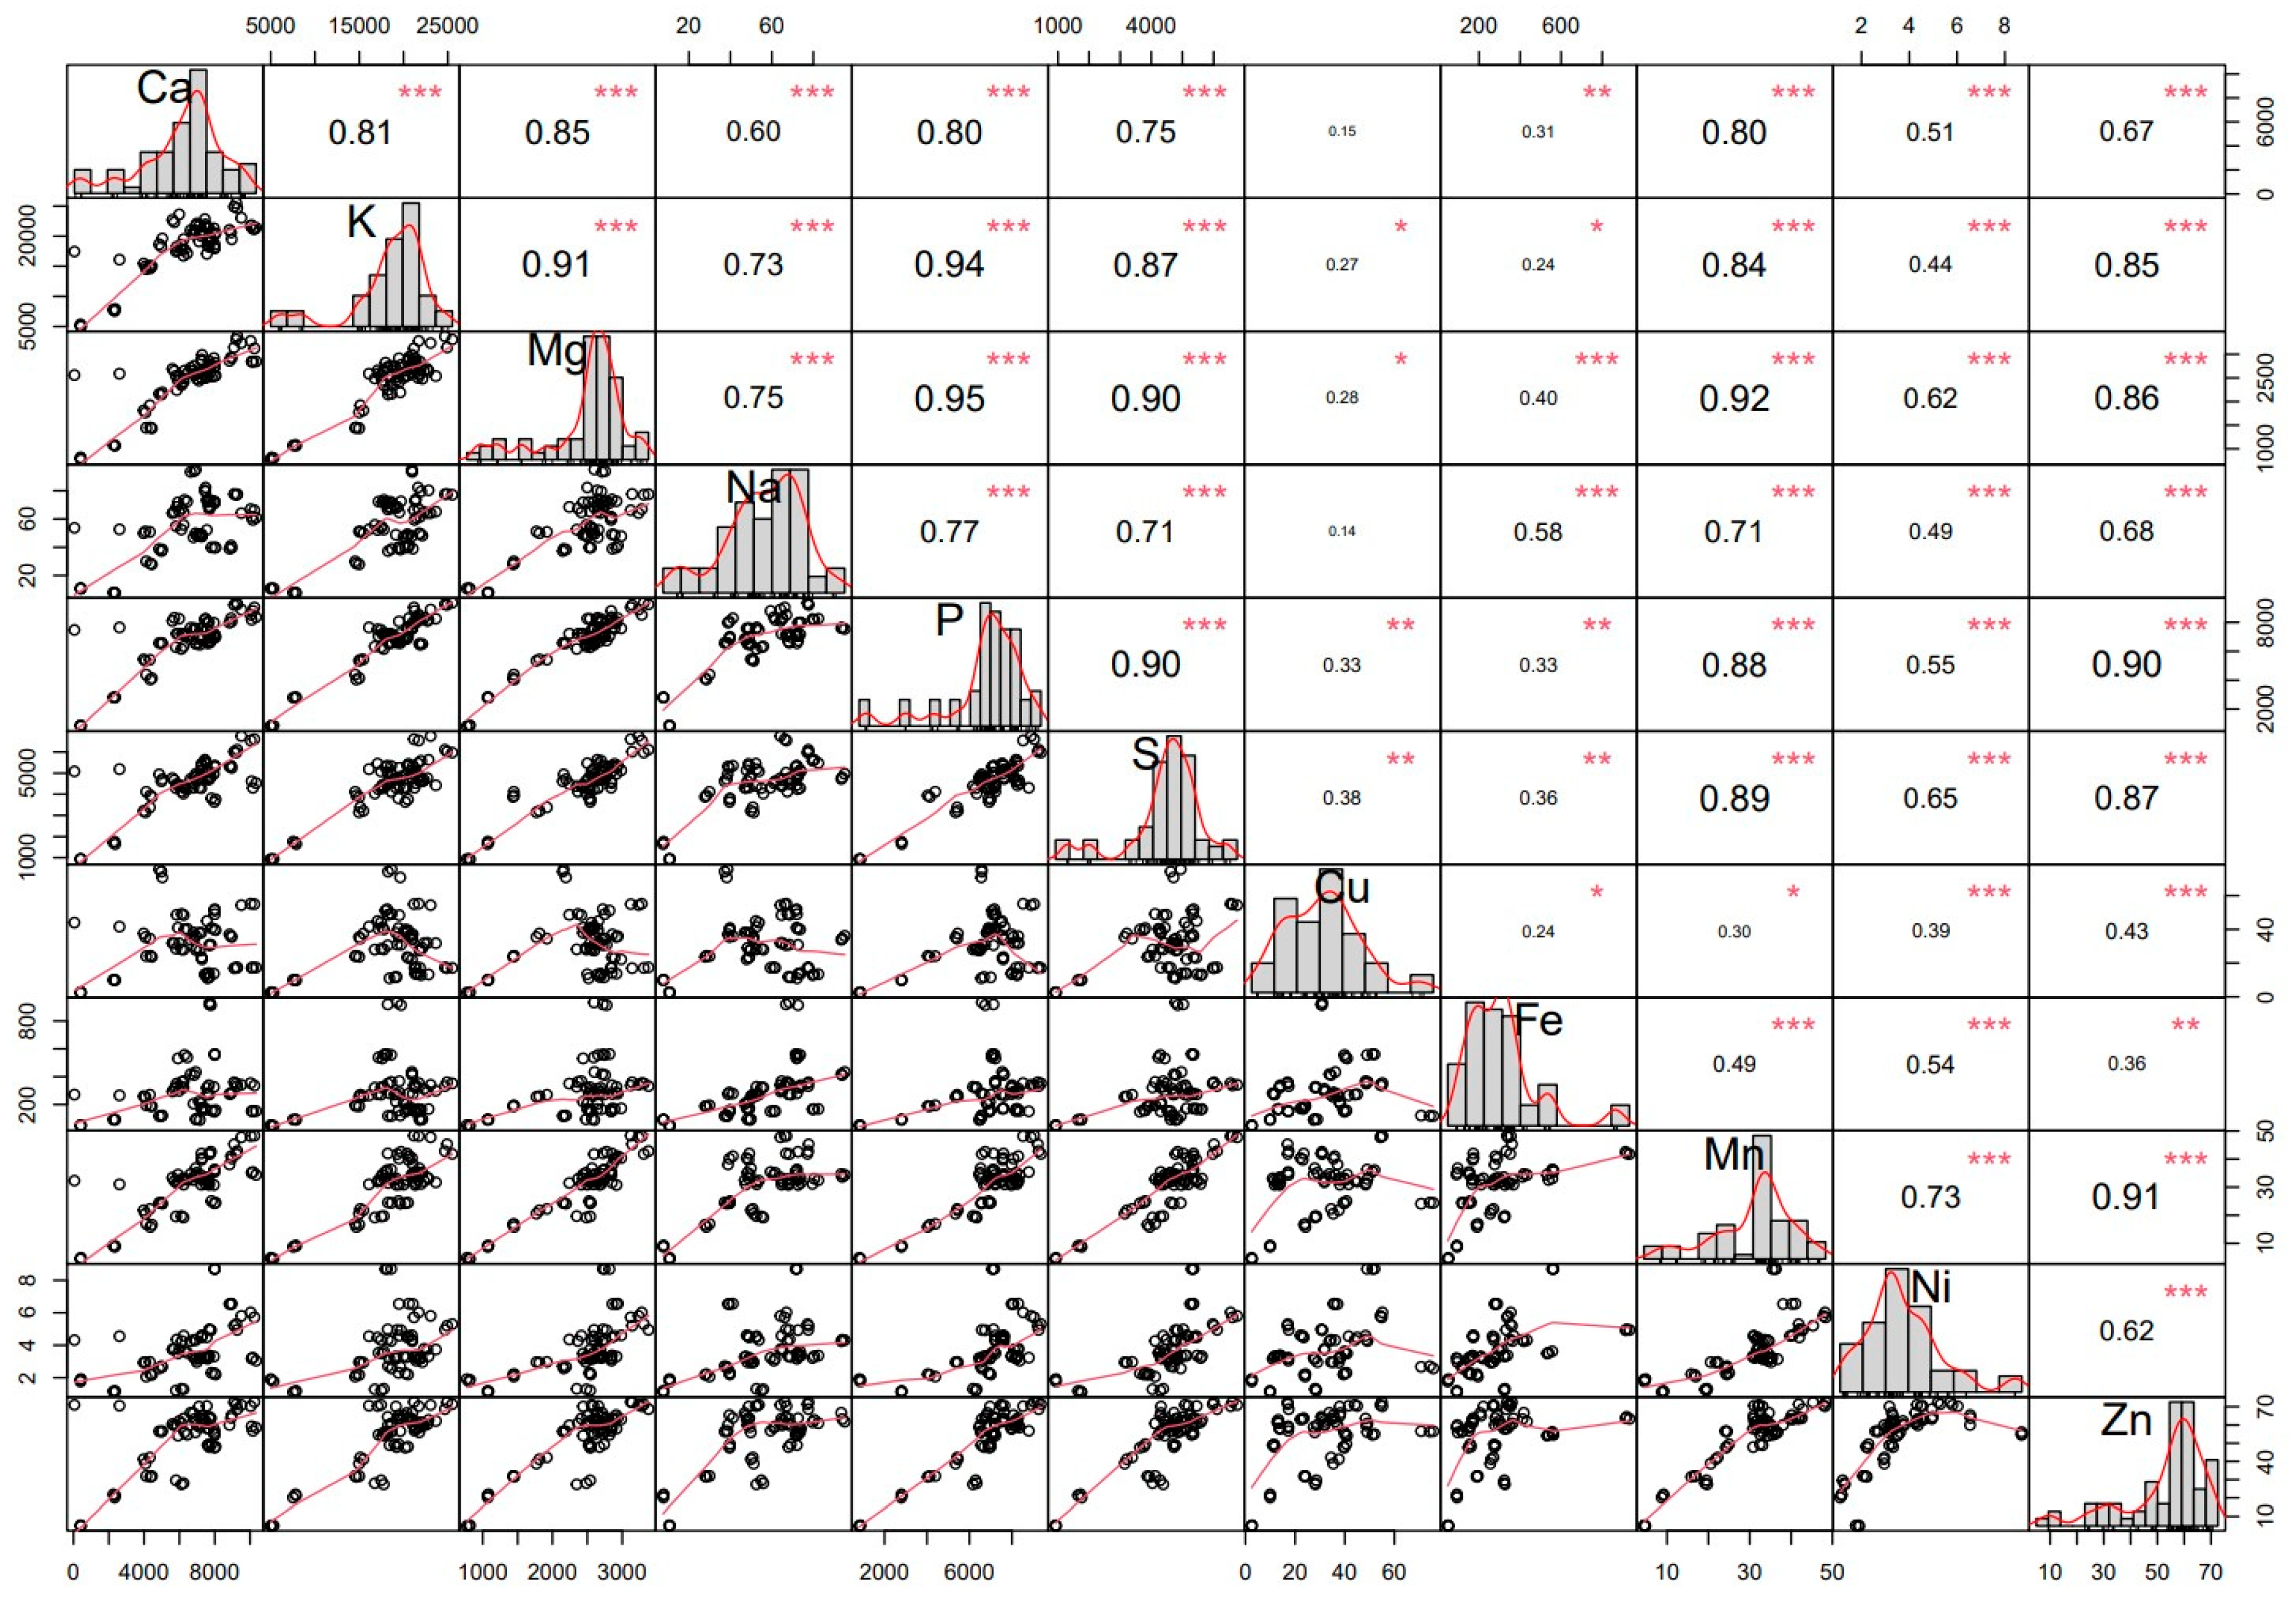
PCA was employed to visually represent the dataset through a two-dimensional biplot (Figure 2). The PCA showed ten principal components or dimensions, and they were able to explain all variations present in the studied material. However, the first two principal components had an eigenvalue of more than one, and they were responsible for more than 80 percent of the variation (Supplementary Table S2). By analyzing Figure 2, it can be said that the PC1 shows the maximum variation (70.14%). This variation was primarily due to traits like Mg, Mn, P, and S along with genotypes like HPM-2 (23), Tarvedo Sugar (11), and Dwarf grey sugar (13). Similarly, PC2 revealed a 10.42% variation, where traits like Fe and Cu coupled with genotypes Sugar snappy (16), Arka Sampoorna (3), and HPM-1 (22) determined its variation.

Figure 2.
Biplot for the 24 edible-podded genotypes and 11 elements along the first two principal components. Note: 1, Airtel; 2, Oregon Sugar pod; 3, Arka Sampoorna; 4, PED-21-4; 5, Tardio; 6, Sugar Bon; 7, PED-18-5; 8, PED-21-2; 9, PED-18-7; 10, Mithiphali; 11, Tarvedo Sugar; 12, PED-21-7; 13, Dwarf grey sugar; 14, Sugar daddy; 15, PED-21-1; 16, Sugar snappy; 17, PED-21-5; 18, PED-21-3; 19, PED-18-6; 20, Namdhari-NA; 21, PED-18-8; 22, HPM-1; 23, HPM-2; 24, Honey snap.
3.6. Hierarchical Cluster Analysis
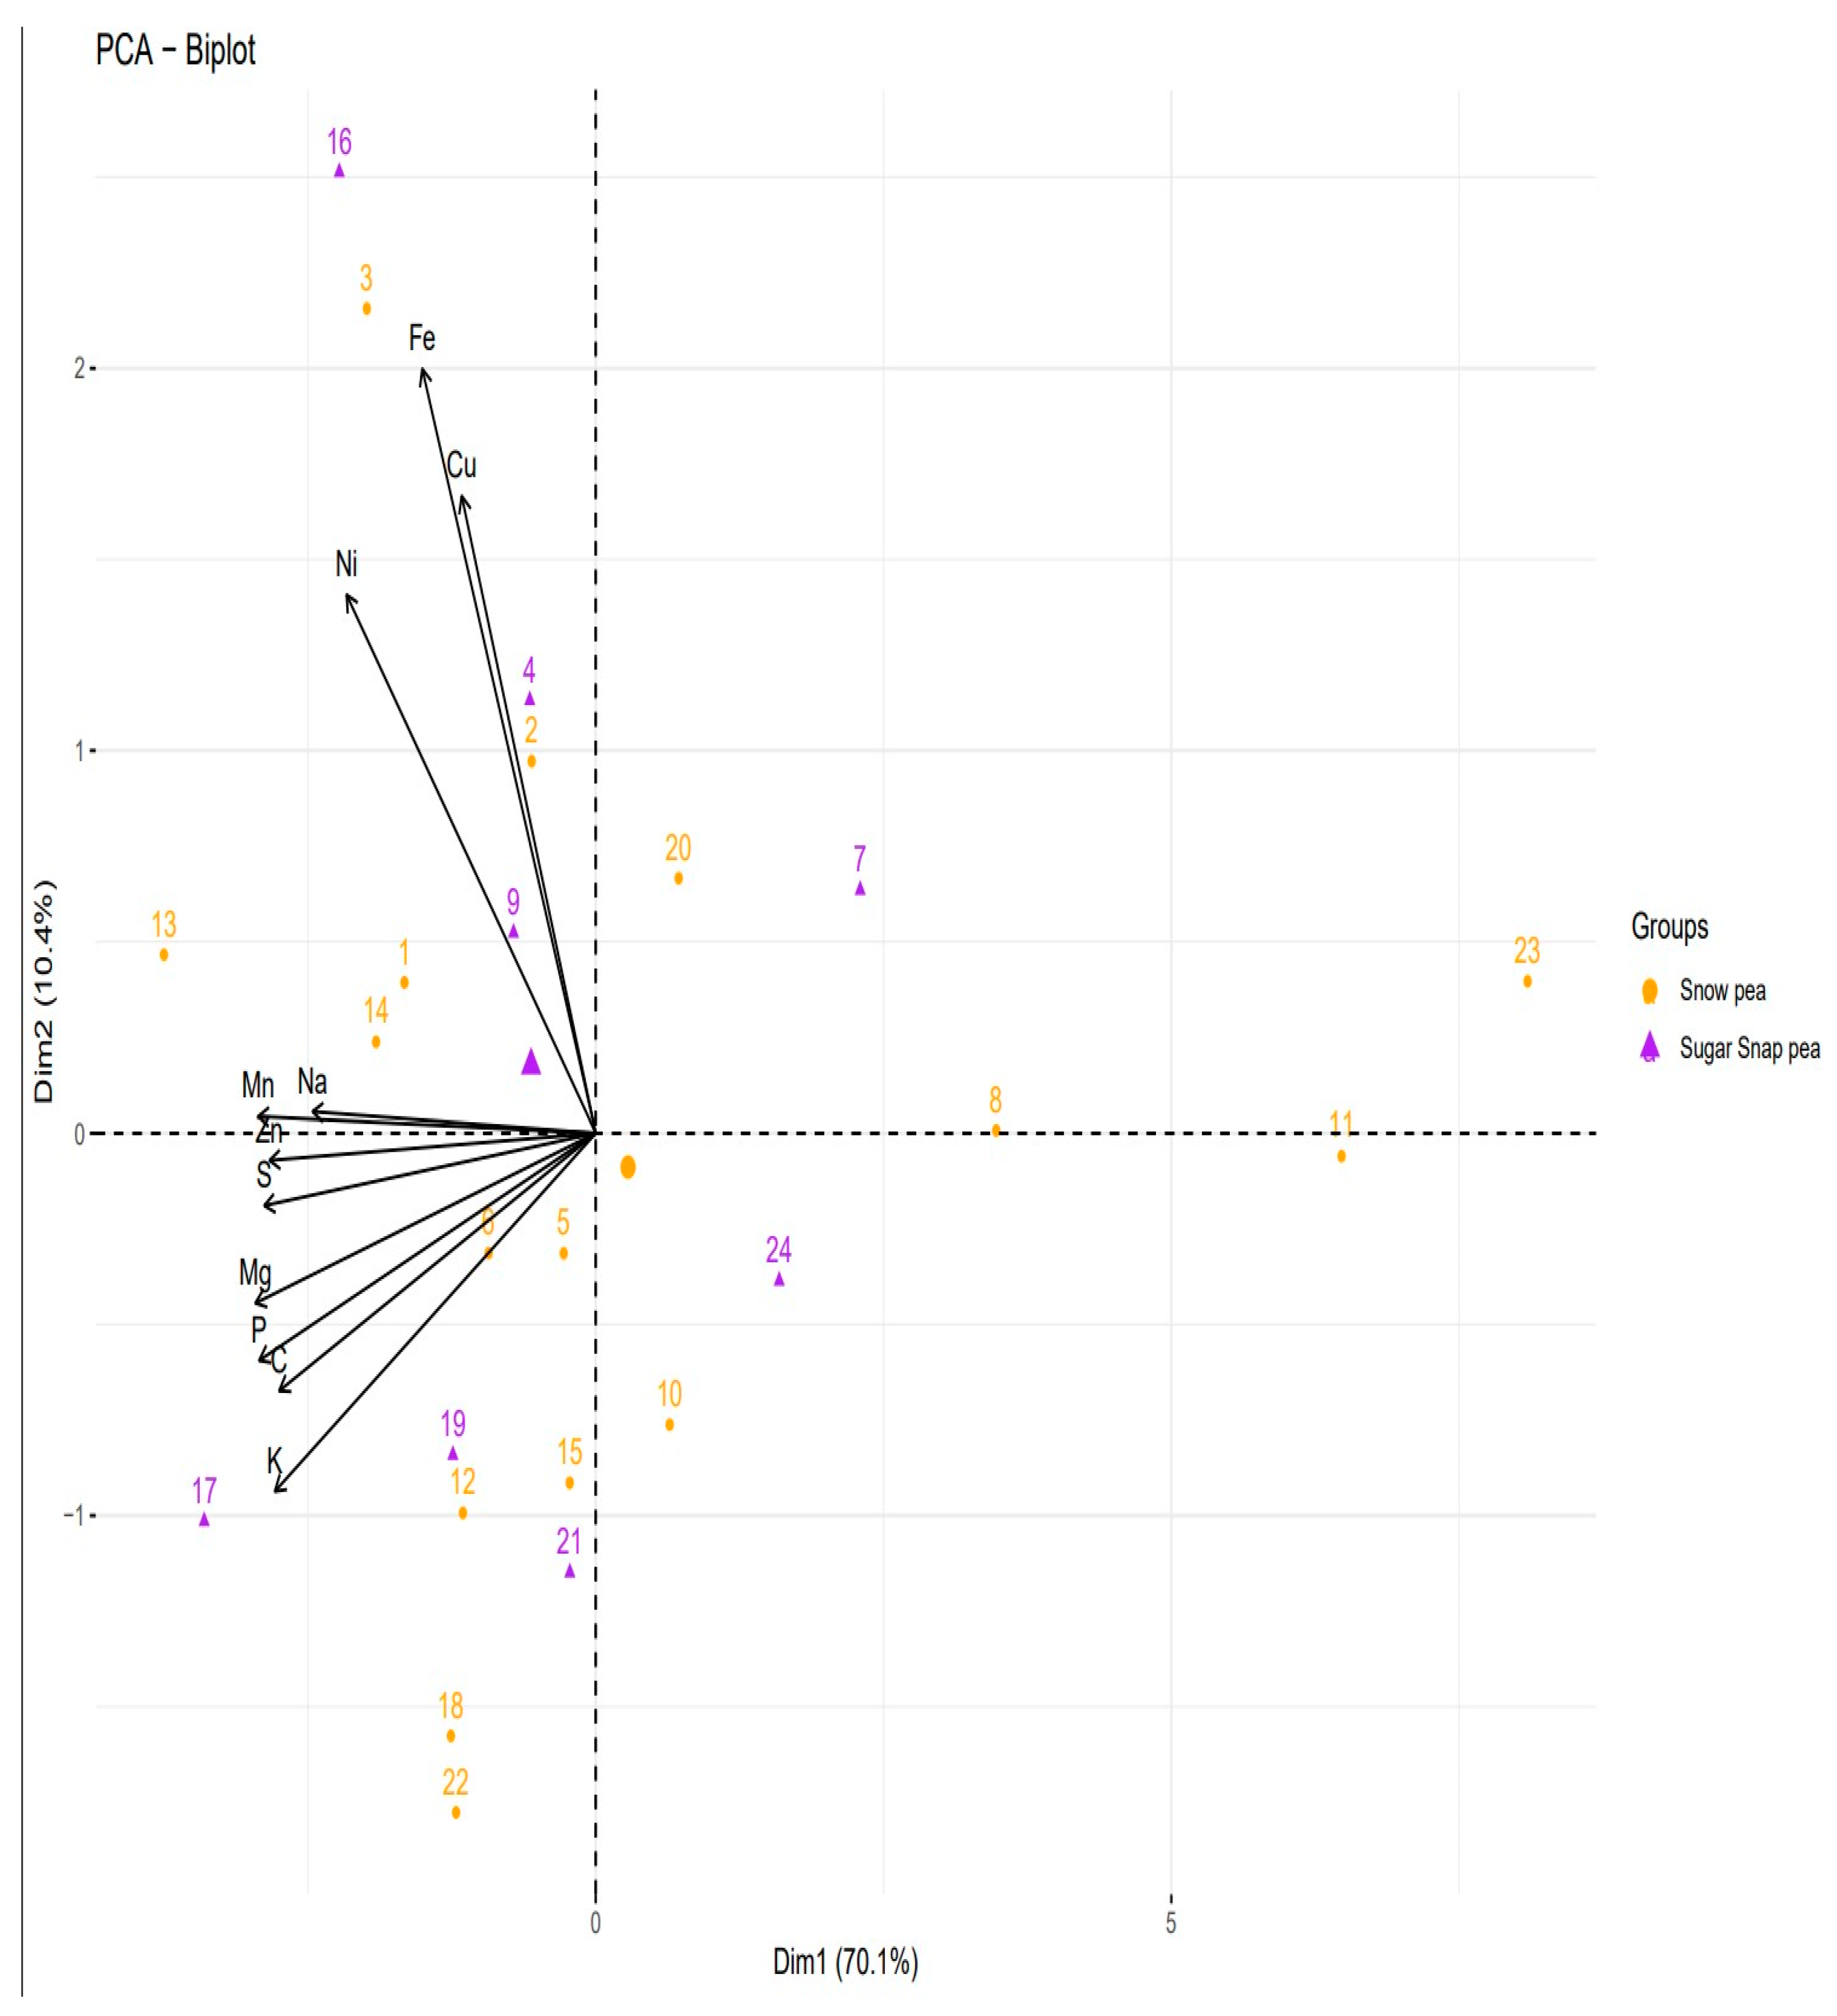
As the dendrogram shows, the cluster analysis grouped 24 snap pea genotypes into two clusters (Figure 3). Cluster I comprised nineteen accessions, while five were grouped in Cluster II. The comparison of population means derived from ANOVA with the mean values of the clusters (Supplementary Table S3) indicates that, across all examined traits, the mean values of Cluster I exceeded those of Cluster II and the population means derived from ANOVA.

Figure 3.
Hierarchical cluster analysis of 24 edible-podded pea genotypes using the Euclidean distance method implemented using the hclust package in R Studio. Here “d” is for distance between the data points; “(*, “ward.D”)” means that the dendogram was constructed using Ward’s method for clustering, with Euclidean distance metric was used to compute the distance between the data points.
4. Discussion
Selection is deemed a crucial stage in all crop improvement initiatives. Nevertheless, for successful selection, a higher degree of genetic variability in the germplasm for the specific trait is essential. Therefore, variability in the edible-podded pea genotypes was studied for different elemental concentrations.
The ANOVA indicated the existence of wide genetic variability among the different genotypes. The observed differences in elemental concentration among pea samples are likely attributed to their genetic origin [19]. This diversity within the edible-podded genotypes serves as a valuable resource for augmenting elemental concentrations in the development of new pea cultivars. Previous studies have underscored substantial variability in elemental concentrations within pea germplasm [7,13,19,20,21]. Prior research reports have indicated that the chemical composition diversity in various crop germplasms provides a promising foundation for improving new cultivars. This pattern has been noted in lentils [22], chickpeas [23], fava beans [24], and cowpeas [6], underscoring the opportunity to leverage nutrient diversity in elemental concentrations for the improvement of cultivars.
The concepts of GCV (genotypic coefficient of variation) and PCV (phenotypic coefficient of variation) play crucial roles in assessing the extent of variation in a trait and understanding the underlying genetic and environmental factors influencing it. Understanding these factors is essential for effective plant breeding and genetic improvement programs aimed at developing new crop varieties with desirable traits. High GCV and PCV values (>20%) were observed for all the nutrient traits, suggesting the effectiveness of phenotypic selection for developing nutrient-rich pea varieties, and at least 38.28% genetic improvement could potentially be achieved for any of the eleven traits through selective breeding. Furthermore, PCV was slightly higher but closely aligned with GCV, affirming minimal environmental influence on trait expression. The difference between PCV and GCV was high (2) for Ca only and low for the remaining traits, implying that Ca was influenced by the environment whereas the others were mainly due to genetic factors. Similar findings were reported in chickpeas [23,25], where PCV exceeded GCV for various elements, highlighting that while the GCV offers insights into genetic variability in quantitative traits, it does not singularly determine the heritable variation.
Previously, it was noted that the effectiveness of improvement is linked to the magnitude of the genotypic coefficient of variation, heritability, and genetic advance [26]. Additionally, the extent to which genotypic variability can be leveraged through selection hinges on the heritability of individual traits [27]. Notably, high heritability estimates (>60%) were evident for all traits (Table 3), suggesting their lesser susceptibility to environmental influence [28]. Researchers in previous studies have also reported similar findings for elemental concentrations in cowpea [29]. This implies potential stability across various pea-growing regions and underscores ample opportunities for selecting superior genotypes based on all the evaluated traits. The substantial heritability observed among the traits in this study aligns with previous findings in garden pea [30]. The selection becomes relatively straightforward when heritability exceeds seventy percent [31]. However, it is vital to emphasize that high heritability alone does not guarantee efficient selection in advanced generations unless it is accompanied by significant genetic advances [32]. In this study, a combination of high heritability and genetic advance was evident for all the traits, indicating that selective breeding efforts based on genetic information are likely to yield substantial improvements within the edible-podded peas population. This also suggests that phenotypes accurately represent their genotypes for these traits, making selection based on phenotypic value reliable. The traits exhibit favorable additive gene action, making them suitable for inclusion in a breeding program.
To examine the relationship among various elements, correlation coefficient analysis emerges as a widely utilized and reliable statistical tool, as the significant association between two traits not only induces variations in the mean of one trait through additive gene effects but similarly reflects indirect effects on their correlated character. The association of multiple traits may arise from genetic linkage or epistatic effects among different genes [33]. As shown in Figure 1, the strong clustering of points in scatter plots involving magnesium (Mg), phosphorus (P), and sulfur (S) across comparisons with other elements was observed. This clustering, particularly prominent in the upper right quadrant of these plots, suggests that there is low variability in the concentrations of Mg, P, and S within the analyzed germplasm. The concentration of these elements was consistently high across the majority of the genotypes, as indicated by their position in the upper right quadrant. This implies that the germplasm under study exhibits a relatively uniform accumulation of Mg, P, and S, which could be attributed to shared genetic or environmental factors influencing the uptake and storage of these essential macro elements. Moreover, the low variation within these clusters indicates that most of the germplasm contains similarly high levels of these elements, suggesting a potential selection for genotypes with enhanced nutrient accumulation or consistent environmental conditions favoring the uptake of Mg, P, and S. This uniformity could have important implications for breeding programs aiming to enhance or stabilize the nutrient content of the edible-podded pea genotype.
Furthermore, a significant positive relationship was also observed between the concentrations of all macro and micro elements except for certain pairs such as Cu with Na and Cu with Ca which were not significantly correlated (Figure 1). Notably, K showed strong correlations with P, Mg, and Na, consistent with findings in cowpea [34]. Additionally, positive correlations were identified between P and Na concentrations, as well as between P and Zn concentrations, further supporting observations reported in cowpea [34]. A strong positive correlation between K and P concentrations was observed, consistent with previous findings in field pea [5,7]. Additionally, the positive relationships between K and Mn, as well as Mn and Fe, are supported by the findings of Dmibras [5] and Nadeem [7], respectively. This may be due to the fact that these elements have similar chemical properties, and they compete for the site of absorption, transport, and function in plant tissues [35,36]. The study’s results also indicated a positive correlation between Zn and Fe concentration, albeit of lower magnitude compared to others. Zn concentration also demonstrated a significantly positive correlation with all other elements, consistent with findings in peas [5,19]. The positive relationship between Zn and P concentrations can be attributed in part to the activity of arbuscular mycorrhizal fungi (AMF). These fungi have been demonstrated to enhance plant biomass and increase the uptake of Zn and P in soils [37]. Moreover, mycorrhizal colonization affects several Zn and P transporter genes that play a role in the uptake of these elements through the mycorrhizal pathway [37]. Moreover, the positive correlation of Zn concentration with other elements implies that selecting for augmented Zn amounts may indirectly lead to more concentrations of other micro and macro elements. Consequently, when conducting breeding and biofortification for peas using the studied germplasm with a focus on improving Zn concentration, automatic enhancements in the concentrations of other linked traits could be attained because of their genetic linkage. In addition to the positive correlations observed among the macro and micro elements, our analysis also revealed several instances where correlations were weak, non-significant, or even negative. These non-positive correlations are particularly noteworthy, as they suggest distinct physiological or biochemical mechanisms that may be at play. Understanding these relationships is crucial for breeding programs, as they might indicate trade-offs or compensatory mechanisms that could impact the selection of these elemental traits. For instance, the weak correlations between copper (Cu) and both sodium (Na) and calcium (Ca) indicate minimal interaction or co-regulation among these elements. This could suggest that these pairs operate independently in terms of uptake or accumulation, potentially requiring separate management strategies in breeding programs.
PCA showed ten principal components, and they were able to explain all variations present in the studied material. Out of these principal components, the first two described 80.56% of variation (Figure 2). The grouping of genotypes in the biplot (Figure 2) was independent of whether they are snow peas or snap peas. Edible-podded pea genotypes Arka Sampoorn (3), Dwarf grey sugar (13), sugar snappy (16), and PED-21-5 (17) had high factor scores of both PC1 and PC2 and were found at extreme distances from the origin of the biplot, which showed that these genotypes were associated with a high concentration of Fe, Mn, Cu, and K concentration, respectively. These genotypes in different quadrants can be exploited for hybridization in varietal improvement programs of peas, especially for the nutritional traits of interest. Additionally, the eigenvectors identified in this study suggest a strong correlation among elements with similar signs, emphasizing their collective influence on enhancing the considered traits. An examination of the first and second dimensions reveals that nearly all traits exhibit discrimination and contribute significantly to the overall variability within the assessed edible-podded pea genotypes. Notably, traits such as Fe, Ni, P, S, Mn, K, and Mg stand out due to the exceptionally high magnitudes of their factor loadings. This underscores that these specific traits account for a substantial portion of the variations present in edible-podded peas, playing a key role in elements enrichment. Consequently, for the genetic improvement of edible-podded peas, selection efforts should be targeted specifically at these highlighted traits.
In the past, some authors have reported results consistent with the traits investigated in the present study. For example, K, P, Mg, and Mn have been identified as the primary contributors to genetic divergence among forty local pea genotypes of pea [13]. Similarly, a highly significant and positive correlation between K and P suggests that enhancing one trait through biofortification positively impacts the concentration of other traits [7]. They proposed that such traits offer a promising avenue for efficient snap pea improvement through direct selection to achieve desirable outcomes. The present study’s findings align with those for common beans [38] and cowpeas [34].
After hierarchical clustering, all 24 genotypes were divided into two clusters (Figure 3). The mean of Cluster I surpassed the overall mean of the population (Supplemental Table S3). This finding suggests that Cluster I significantly demonstrated superior performance in terms of all the studied nutrient concentrations, owing to its high nutrient diversity. Consequently, one can infer that Cluster I manifested the maximum potential for nutrient concentration and was more amenable to selection compared to the other cluster. The organization of edible-podded pea genotypes into clusters did not correspond to their source or geographical distribution; instead, they appeared randomly within the clusters. This apparent randomness implies that accessions with similar source distribution, regardless of origin, falling into different clades, indicate a broad genetic base of the accessions. This phenomenon may be attributed to the genetic materials used in the evaluation, which are not the outcomes of selection but rather a collection of germplasm from diverse sources [39], especially in a self-pollinating crop recognized for its constrained nutrient diversity.
Based on the current investigation, it can be affirmed that cluster analysis serves as an effective tool for categorizing edible-podded pea genotypes according to their performance in the studied traits. This analytical method has found extensive application in improvement studies of pea germplasms, addressing diverse quantitative and qualitative traits across various regions globally [5,7,8,13]. Moreover, in the genetic characterization of tomatoes, Ene et al. [39] also stated that cluster analysis obviously can be considered as an effective tool to assort tomato accessions based on their performance relatedness for the traits studied. It provides a reliable foundation for selecting base materials and shaping future improvement plans for tomatoes [40]. However, they also underscore the importance of addressing genetic barriers and selecting appropriate breeding methods when choosing base materials, ensuring the realization of anticipated genetic improvements for the desired traits.
5. Conclusions
The assessment of elements in the pods of the 24 examined edible-podded genotypes offers a quantitative measure of their concentration of both macro and micro elements. This investigation demonstrates that these edible-podded peas serve as significant sources of macro elements like Ca and K, as well as micro elements like Zn and Fe, contributing to a well-balanced dietary intake that can fulfill a substantial share of daily nutrient requirements.
Notably, the Dwarf Grey Sugar and Arka Sampoorna varieties from the snap pea group, as well as the PED-21-5 and Sugar Snappy from the sugar snap pea group, exhibit superior element concentrations compared to the other genotypes, recommending their utilization in breeding programs to enhance the nutritional quality of edible-podded peas. This study underscores the potential for quality breeding in edible-podded peas.
Supplementary Materials
The following supporting information can be downloaded at: https://www.mdpi.com/article/10.3390/horticulturae10080890/s1, Table S1: List of pea genotypes used in the present study; Table S2: Eigen vectors and total percentage variation in quantitative traits among 24 edible-podded pea genotypes; Table S3: Population and cluster means of elements for characterization of edible-podded pea genotypes.
Author Contributions
Conceptualization, R.K.D.; methodology, R.K.D. and S.Y.; software, S.Y., P.K. (Parteek Kumar) and D.B.; validation, R.K.D. and S.Y.; formal analysis, S.Y.; investigation, R.K.D.; resources, R.K.D.; data curation, S.Y., P.K. (Priyanka Kumari) and N.R.; writing—original draft preparation, S.Y. and P.K. (Parteek Kumar); writing—review and editing, H.S., N.R. and P.K. (Priyanka Kumari); supervision, R.K.D., H.S. and D.B.; project administration, R.K.D.; funding acquisition, H.S. All authors have read and agreed to the published version of the manuscript.
Funding
The work is supported by the Ministry of Science and Technology, Department of Biotechnology, Government of India under the Scheme “Centre of Excellence—Development and Integration of Advanced Genomic Technologies for Targeted Breeding” (No: BT/Ag/CoE/PAU-GSKIG/2020-21) and CSS 52 (PC-6372).
Data Availability Statement
The original contributions presented in the study are included in the article/Supplementary Materials, further inquiries can be directed to the corresponding authors.
Conflicts of Interest
The authors declare no conflicts of interest.
References
- Dhall, R.K.; Kaur, R.; Sharma, P.; Singh, H.; Yadav, S.; Kumari, P. Standardized agronomic practices for mechanical harvesting of the single-harvest garden pea in India. Heliyon 2023, 9, e22616. [Google Scholar] [CrossRef] [PubMed]
- Ram, H.; Hedau, N.K.; Chaudhari, G.V.; Kant, L. Peas with zero shelling edible pods: A review. Sci. Hortic. 2021, 288, 110333. [Google Scholar] [CrossRef]
- Rudra, S.G.; Hanan, E.; Sagar, V.R.; Bhardwaj, R.; Basu, S.; Sharma, V. Manufacturing of mayonnaise with pea pod powder as a functional ingredient. J. Food Meas. Charact. 2020, 14, 2402–2413. [Google Scholar] [CrossRef]
- Sneddon, J.L. Identification of garden pea varieties. (I) Grouping, arrangement, and use of continuous characters. J. Natl. Inst. Agric. Bot. 1970, 12, 1–16. [Google Scholar]
- Lim, T.K. Pisum sativum. In Edible Medicinal and Non-Medicinal Plants; Springer: Dordrecht, The Netherlands, 2012; Volume 2, pp. 849–866. [Google Scholar]
- Mateos-Aparicio, I.; Redondo-Cuenca, A.; Villanueva-Suárez, M.J.; Zapata-Revilla, M.-A.; Tenorio-Sanz, M.-D. Pea pod, broad bean pod and okra, potential sources of functional compounds. LWT-Food Sci. Technol. 2010, 43, 1467–1470. [Google Scholar] [CrossRef]
- Nasir, G.; Zaidi, S.; Tabassum, N.; Asfaq. A review on nutritional composition, health benefits and potential applications of by-products from pea processing. Biomass Convers. Biorefin. 2022, 14, 10829–10842. [Google Scholar] [CrossRef]
- Available online: https://openknowledge.fao.org/handle/20.500.14283/cc8228en (accessed on 5 August 2024).
- Demirbaş, A. Micro and macronutrients diversity in Turkish pea (Pisum sativum) germplasm. Int. J. Agric. Biol. 2018, 20, 701–710. [Google Scholar]
- Harmankaya, M.; Ceyhan, E.; Çelik, A.S.; Sert, H.; Kahraman, A.; Özcan, M.M. Some chemical properties, mineral content and amino acid composition of cowpeas (Vigna sinensis (L.) Savi). Qual. Assur. Saf. Crops Foods 2016, 8, 111–116. [Google Scholar] [CrossRef]
- Nadeem, M.A.; Çilesiz, Y.; Yüce, İ.; Baloch, F.S.; Karaköy, T. Macro and micronutrients diversity in the seeds of field pea germplasm. Pak. J. Bot. 2021, 53, 1655–1664. [Google Scholar] [CrossRef]
- Hacisalihoglu, G.; Beisel, N.S.; Settles, A.M. Characterization of pea seed nutritional value within a diverse population of Pisum sativum. PLoS ONE 2021, 16, e0259565. [Google Scholar] [CrossRef]
- Ton, A.; Mart, D.; Karaköy, T.; Türkeri, M.; Torun, A.A.; Anlarsal, A.E. Characterization of some local pea (Pisum sativum L.) genotypes for agro-morphological traits and mineral concentrations. Turk. J. Agric. For. 2022, 46, 245–256. [Google Scholar] [CrossRef]
- R Core Team. R: A Language and Environment for Statistical Computing. 2018. Available online: https://cran.r-project.org/bin/windows/base/ (accessed on 25 May 2023).
- Sivasubramanian, S.; Menon, M. Heterosis and inbreeding depression in rice Madras. Agric. J. 1973, 60, 1139–1140. [Google Scholar]
- Bello, O.B.; Ige, S.A.; Azeez, M.A.; Afolabi, M.S.; Abdulmaliq, S.Y.; Mahamood, J. Heritability and genetic advance for grain yield and its component characters in maize (Zea mays L.). Int. J. Plant Res. 2012, 2, 138–145. [Google Scholar]
- Falconer, D.S. Introduction to Quantitative Genetics, 3rd ed.; John Wiley & Sons: New York, NY, USA, 1989. [Google Scholar]
- Fisher, R.A.; Yates, F. Statistical Tables for Biological, Agricultural and Medical Research, 6th ed.; Oliver and Boyd: London, UK, 1963. [Google Scholar]
- Harmankaya, M.; Özcan, M.M.; Karadaş, S.; Ceyhan, E. Protein and mineral contents of pea (Pisum sativum L.) genotypes grown in central Anatolian region of Turkey. South-West J. Hort. Biol. Environ. 2010, 1, 159–165. [Google Scholar]
- Karaköy, T.; Demİrbaș, A. Evaluation of Turkey origined local pea (Pisum sativum L.) genotypes grown in Sivas ecological conditions in term of some nutrient contents. Adü Ziraat Derg. 2017, 14, 7–11. [Google Scholar] [CrossRef]
- Ceyhan, E.; Şimşek, D. Inheritance of some quality characters in canned pea population. Türk Tarım Doğa Bilim. Derg. 2021, 8, 188–195. [Google Scholar] [CrossRef]
- Karaköy, T.; Erdem, H.; Baloch, F.S.; Toklu, F.; Eker, S.; Kilian, B.; Özkan, H. Diversity of macro-and micronutrients in the seeds of lentil landraces. Sci. World J. 2012, 1, 710412. [Google Scholar] [CrossRef]
- Jayalakshmi, V.; Reddy, A.T.; Nagamadhuri, K.V. Genetic diversity and variability for protein and micro nutrients in advance breeding lines and chickpea varieties grown in Andhra Pradesh. Legume Res. 2018, 42, 768–772. [Google Scholar] [CrossRef]
- Karaköy, T.; Toklu, F.; Karagöl, E.T.; Uncuer, D.; Çilesiz, Y.; Ali, A.; Nadeem, M.A.; Özkan, H. Genome-wide association studies revealed DArTseq loci associated with agronomic traits in Turkish faba bean germplasm. Genet. Resour. Crop Evol. 2023, 71, 181–198. [Google Scholar] [CrossRef]
- Saha, A.J.; Mehzabin, P.; Reddy, K.S.; Ramachandran, V. Effect of seasonal variation on micronutrient content in chickpea (Cicer arietinum L.) and identification of accessions having high iron and zinc. J. Food Legumes 2017, 31, 1–4. [Google Scholar]
- Bhasker, K.; Shashibhushan, D.; Murali Krishna, K.; Bhave, M. Genetic variability, heritability and genetic advance of grain yield in pearl millet [Pennisetum glaucum (L.) R. Br.]. Int. J. Pure App. Biosci. 2017, 5, 1228–1231. [Google Scholar]
- Bilgin, O.; Korkut, K.Z.; Bașer, I.; Dağlioğlu, O.; Öztürk, I.; Kahraman, T.; Balkan, A. Variation and heritability for some semolina characteristics and grain yield and their relations in durum wheat (Triticum durum Desf.). World J. Agric 2010, 6, 301–308. [Google Scholar]
- Hamidou, F.; Ratnakumar, P.; Halilou, O.; Mponda, O.; Kapewa, T.; Monyo, E.; Faye, I.; Ntare, B.; Nigam, S.; Upadhyaya, H. Selection of intermittent drought tolerant lines across years and locations in the reference collection of groundnut (Arachis hypogaea L.). Field Crop. Res. 2012, 126, 189–199. [Google Scholar] [CrossRef]
- Gerrano, A.S.; van Rensburg, W.S.J.; Adebola, P.O. Nutritional composition of immature pods in selected cowpea [Vigna unguiculata (L.) Walp.] genotypes in South Africa. Aust. J. Crop Sci. 2017, 11, 134–141. [Google Scholar] [CrossRef]
- Bhardwaj, A.; Sharma, A.; Lata, H. Genetic variability for pod yield and related traits in garden pea (Pisum sativum L.). Electron. J. Plant Breed. 2020, 11, 1233–1238. [Google Scholar]
- Singh, B.D. Plant Breeding: Principles and Methods; Kalyani Publishers: New Delhi, India, 2001. [Google Scholar]
- Johnson, H.W.; Robinson, H.F.; Comstock, R.E. Estimates of genetic and environmental variability in Soybeans1. Agron. J. 1955, 47, 314. [Google Scholar] [CrossRef]
- Özer, S.; Karaköy, T.; Toklu, F.; Baloch, F.S.; Kilian, B.; Özkan, H. Nutritional and physicochemical variation in Turkish kabuli chickpea (Cicer arietinum L.) landraces. Euphytica 2010, 175, 237–249. [Google Scholar] [CrossRef]
- Gerrano, A.S.; Jansen-van-Rensburg, W.S.; Venter, S.L.; Shargie, N.G.; Amelework, B.A.; Shimelis, H.A.; Labuschagne, M.T. Selection of cowpea genotypes based on grain mineral and total protein content. Acta Agric. Scand. Sect. B—Soil Plant Sci. 2019, 69, 155–166. [Google Scholar] [CrossRef]
- Walker, W.M.; Miller, J.E.; Hassett, J.J. Effect of lead and cadmium upon the calcium, magnesium, potassium, and phosphorus concentration in young corn plants. Soil Sci. 1977, 124, 145–151. [Google Scholar] [CrossRef]
- Robson, A.D.; Pitman, J.B. Interactions between nutrients in higher plants. In Inorganic Plant Nutrition; Läuchli, A., Bieleski, R.L., Eds.; Springer: New York, NY, USA, 1983; pp. 147–180. [Google Scholar]
- Nguyen, T.D.; Cavagnaro, T.R.; Watts-Williams, S.J. The effects of soil phosphorus and zinc availability on plant responses to mycorrhizal fungi: A physiological and molecular assessment. Sci. Rep. 2019, 9, 14880. [Google Scholar] [CrossRef]
- Murube, E.; Beleggia, R.; Pacetti, D.; Nartea, A.; Frascarelli, G.; Lanzavecchia, G.; Bellucci, E.; Nanni, L.; Gioia, T.; Marciello, U.; et al. Characterization of nutritional quality traits of a common bean germplasm collection. Foods 2021, 10, 1572. [Google Scholar] [CrossRef] [PubMed]
- Ene, C.O.; Abtew, W.G.; Oselebe, H.O.; Ozi, F.U.; Ikeogu, U.N. Genetic characterization and quantitative trait relationship using multivariate techniques reveal diversity among tomato germplasms. Food Sci. Nutr. 2022, 10, 2426–2442. [Google Scholar] [CrossRef] [PubMed]
- Jin, F.M.; Xue, J.; Jia, Y.H.; Liu, Z.Q. The cluster analysis on tomato germplasms. Acta Agric. Bor. Sin. 2006, 21, 49–54. [Google Scholar]
Disclaimer/Publisher’s Note: The statements, opinions and data contained in all publications are solely those of the individual author(s) and contributor(s) and not of MDPI and/or the editor(s). MDPI and/or the editor(s) disclaim responsibility for any injury to people or property resulting from any ideas, methods, instructions or products referred to in the content. |
© 2024 by the authors. Licensee MDPI, Basel, Switzerland. This article is an open access article distributed under the terms and conditions of the Creative Commons Attribution (CC BY) license (https://creativecommons.org/licenses/by/4.0/).