Abstract
Early sprouting is a main cause of onion spoilage during storage. However, limited knowledge is available on which factors trigger sprouting. Here, this was studied in the Hyfive and Exhibition cultivars, which largely differ in sprouting time. Sprouting progress was compared to the fructan and abscisic acid (ABA) profiles in the bulb scales and basal plates. Fructan concentrations decreased in the scales from harvest time onwards in the late-sprouting cultivar Hyfive, while remaining constant in the cultivar Exhibition until internal sprouting. In the basal plates, fructan concentrations increased in both cultivars from approximately one month after harvest, but reached maximum concentrations at moments that could not be related to the difference in internal sprouting. ABA levels generally decreased in the scales of both cultivars, while increasing in their basal plates. Nevertheless, for fructans, the measured variation in ABA concentrations was not consistently associated with differences in internal sprouting. A subsequent perturbation of internal sprouting by Maleic Hydrazide treatment in the cultivar Hyfive confirmed a lack of correlation. Altogether, this indicates that fructan and ABA levels in the scales and basal plate tissue change independent of internal sprouting and cannot be regarded as predictive markers for sprouting and storability.
1. Introduction
Onion (Allium cepa L.) is a biennial crop that forms a bulb as a storage organ during the first year of its life cycle. The bulb stores water-soluble carbohydrates (WSCs) in fleshy scales during its formation and enlargement [1]. The WSCs are the only energy supply for all of the plant’s physiological processes during storage of the bulb. These processes include respiration, root growth, and the initiation of organ primordia from the shoot apical meristem (SAM). The SAM stands above the compressed stem of the onion plant, named the basal plate [1]. The basal plate connects the scales with the SAM, which gives rise to the development of leaves that, together, form the sprout. The newly formed sprout elongates, and the stage when it becomes internally visible is defined as internal sprouting. Internal sprouting is followed by external sprouting, when the leaves appear through the neck of the bulb. Maleic Hydrazide (MH) treatment of the leaves of nearly mature onion plants is commonly used to avoid early sprouting issues during storage. Early sprouting after harvest reduces the quality and shelf life of onion bulbs and is, therefore, one of the main causes of onion spoilage [1].
Fructans are the main reserve WSCs in many plant species, including onion [2]. Fructans are a group of oligo- and poly-saccharides composed of fructose molecules connected in a linear or branched manner with a terminal glucose unit. The total number of simple sugar molecules that form a fructan chain is defined as the degree of polymerization (DP) [2]. In onion, a high fructan content at harvest time correlates with delayed sprouting, whereas, in bulbs of cultivars that are not suitable for long storage, simple sugars are usually more abundant [3,4]. Investigation of WSC content in the whole bulb [5] or the inner scales [3] revealed the hydrolyzation of fructans with a DP larger than 5 into simple sugars during storage. A recent study on bulbs of the cultivar ‘Sherpa’ showed that such a highly polymerized fructan content reduces in the bulb scales after harvest, whereas it steadily increases in the basal plate right before internal sprouting occurs [6]. Based on this result, the authors proposed to regard the increase in highly polymerized fructans in the basal plate as a physiological trigger leading to internal sprouting. Nonetheless, this observation in a single cultivar is not evidence for general occurrence and, therefore, the hypothesis that an increase in fructans in the basal plate serves as a trigger for internal sprouting requires further investigation.
In previous research, depletion of the hormone abscisic acid (ABA) within the onion bulb has also been proposed as a potential trigger of internal sprouting [7,8,9]. ABA is involved in many growth and developmental processes widely associated with abiotic stress response, senescence, and dormancy in various crops [10]. ABA functions after cellular recognition via specific receptors in a tissue-specific manner [11,12]. In onion, ABA gradually accumulates in the bulb during the first year of the life cycle [9]. Measurements using complete bulbs after harvest revealed that ABA is progressively depleted during storage [13], and more specifically in the scales, which represent the most abundant tissue [7,8,9,14]. A recent study described that, in contrast to what occurs in the bulb scales, ABA levels do not decrease proportionally in the basal plate tissue [15]. This finding suggests that, if there is a relationship between sprouting and ABA levels, it is likely complex and probably tissue-specific.
Although early sprouting is the primary problem during onion storage, knowledge on the intrinsic factors that control the process of sprouting is limited. In this study, we investigated whether the increase in highly polymerized fructans in the basal plate can be considered as a trigger for internal sprouting. Additionally, we explored how the tissue-specific concentrations of ABA relate to the sprouting process, and, thus, storability after harvest.
2. Materials and Methods
2.1. Plant Materials
Hyfive and Exhibition seeds were supplied by Bejo Zaden B.V. (Warmenhuizen, Netherlands). These two cultivars were chosen because they have comparable maturation times and, therefore, comparable optimal harvest moments, but strongly differ in storability. Hyfive has a good shelf life compared to Exhibition, which rapidly sprouts and has a short shelf life. In 2020, both cultivars were sown in potting soil on 12 April and transplanted into small rooting pots on 22 April. Seedlings were transplanted on 19 May into plastic boxes (60 × 40 × 20 cm) filled with potting soil, and 16 plants per box were grown in three rows (5-6-5). At the stage of 90% fallen-over leaves, bulbs were hand-harvested, which occurred on 6 August for Hyfive and on 12 August for Exhibition. In 2021, only Hyfive was investigated, sown on 14 April and transplanted on 29 April. On 20 May, seedlings were transplanted into boxes with the same density and distribution per box as the year before. Onion plants were manually harvested on 13 August, at the stage of 90% fallen-over leaves.
2.2. Onion Bulb Curing and Storing
After harvest, the bulbs were cured, starting with 1 day on the soil at ambient temperature, followed by 7 days at 20 °C and 40% relative humidity (RH) in a temperature cabinet, then 5 days at 30 °C and 40% RH, followed by a cooling period to 10 °C by reducing the temperature by 1 degree daily. After that, bulbs were kept in a climate-controlled storage room (10 °C with 60% relative humidity). In 2021, half of the plants were treated before harvest with Maleic Hydrazide (MH) to artificially prevent sprouting. MH treatment at a dosage of 270 g/L water was conducted on 2 August, when leaves were still green and only 5–10% had fallen over. The onion basal plates and scales were sampled at various time points during the curing and storage of the bulbs in both years. Three biological replicates, each composed of material from four individual bulbs, were collected per cultivar at every time point.
2.3. Sprout Assessment
Onion bulbs were cut to assess internal sprout presence and length. Bulbs were first vertically cut in half, and the bulb height was measured (Figure A1). When no internal sprout was detected in the vertical section, sequential horizontal cuttings were performed to determine if an internal sprout was present. A graduate chopping board with 1 cm wide lines was used to measure the longest sprout (Figure A1). The ratio between sprout length and bulb height was used to assess sprout growth.
2.4. WSC Extraction and Measurement
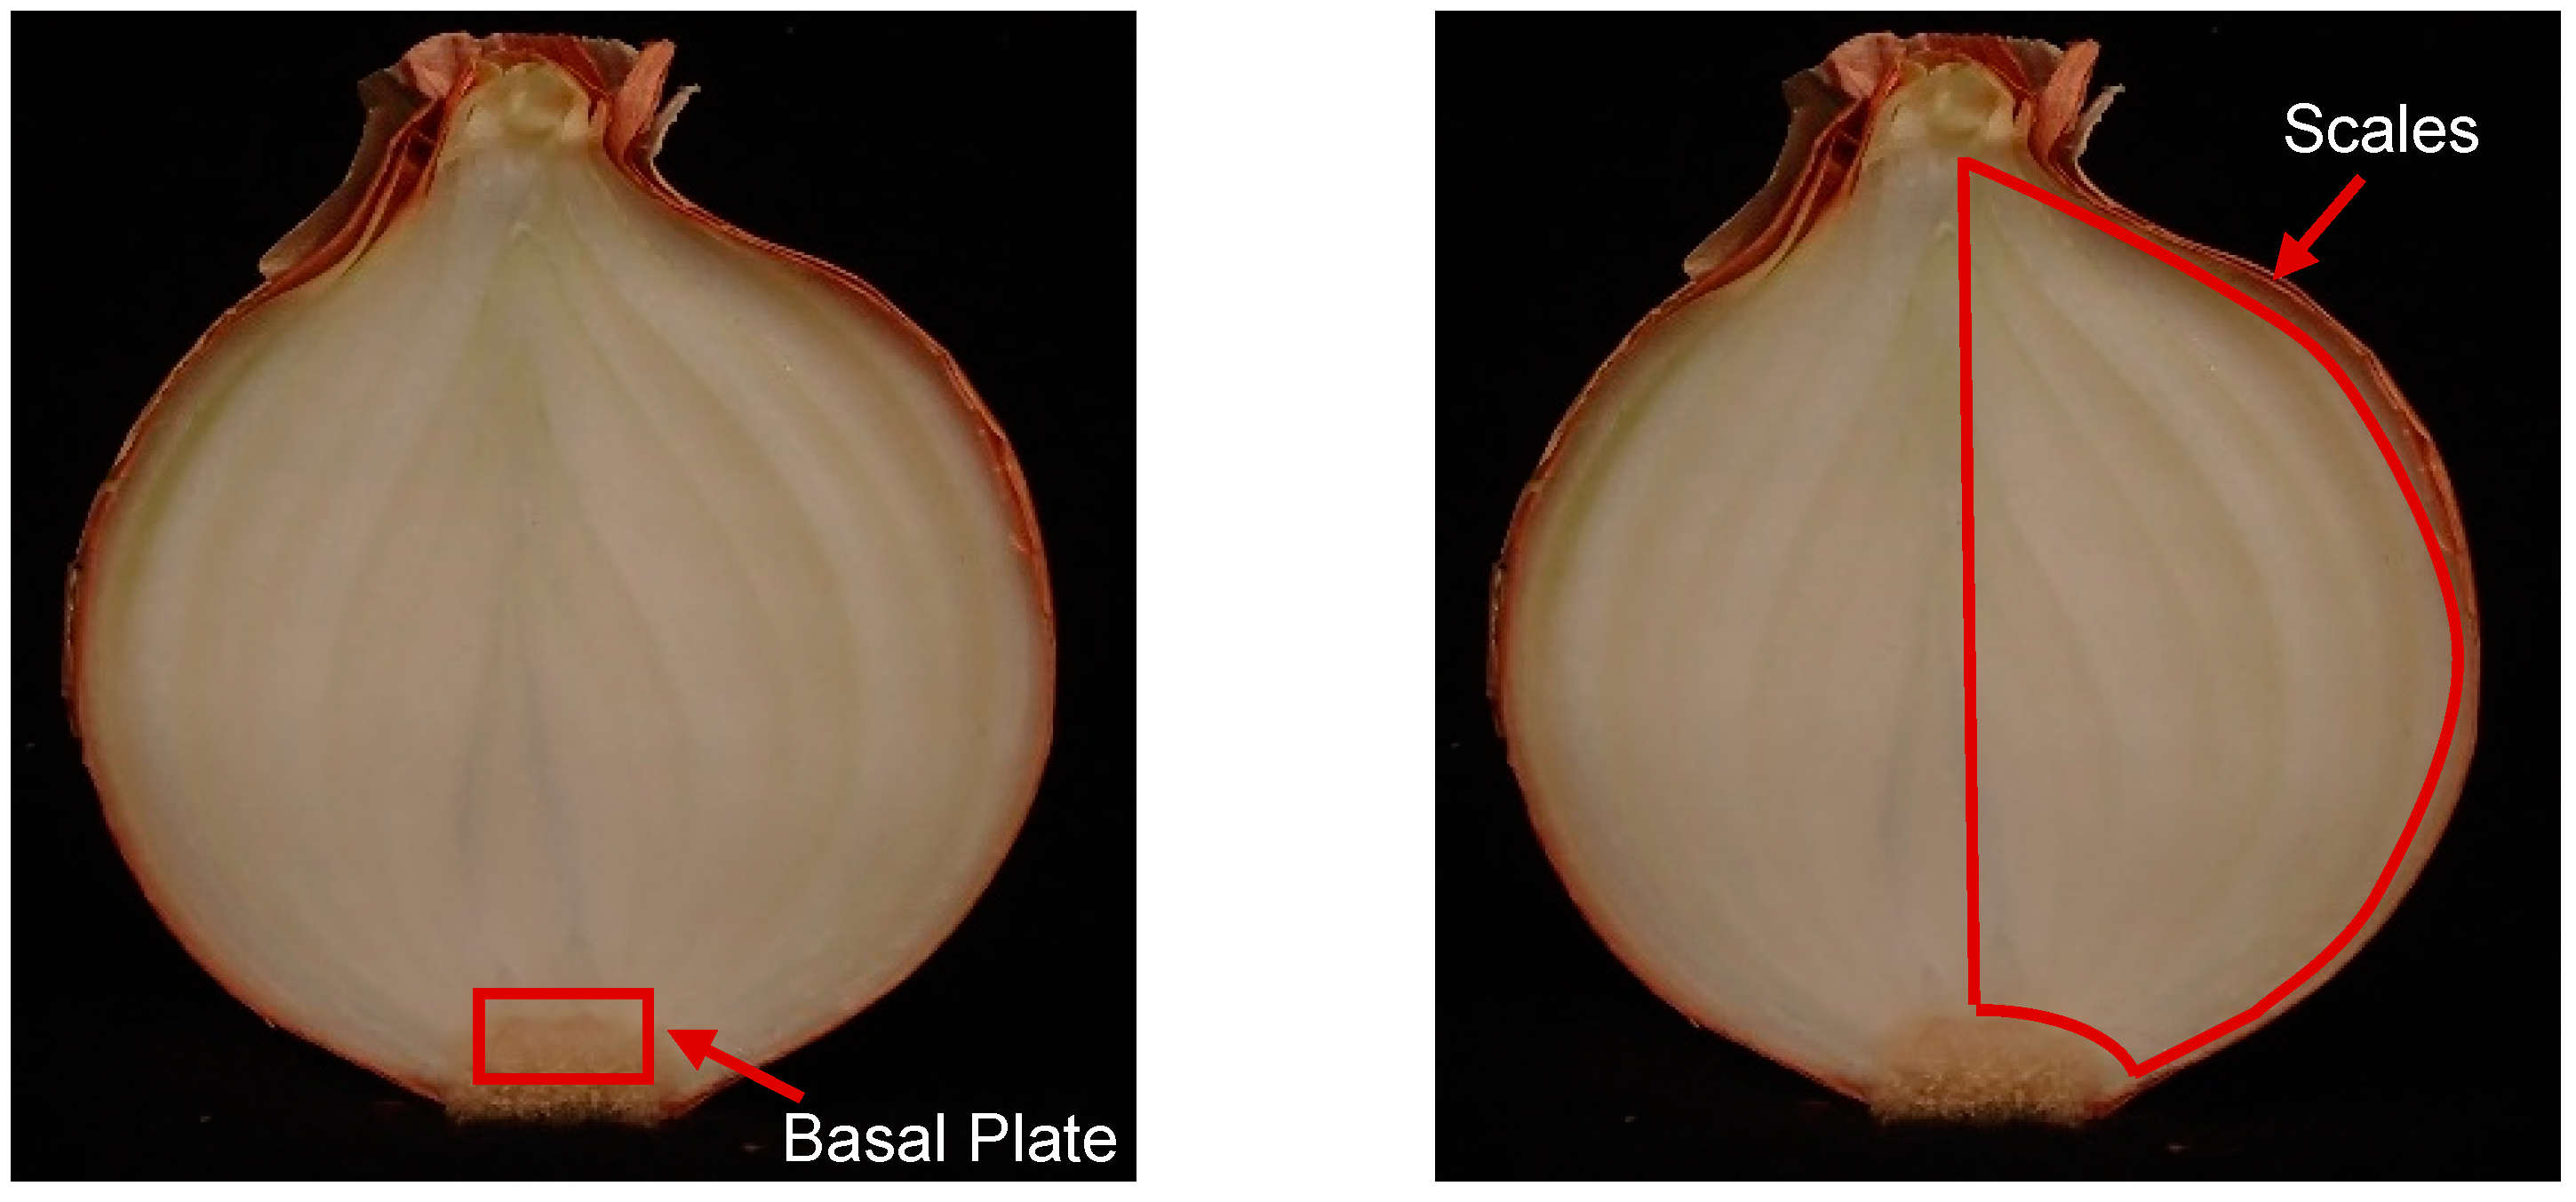
WSC quantity was evaluated in the basal plates, which included the shoot apical meristem, and in the bulb scales. Each basal plate, including shoot apical meristem, was collected after cutting the onion in half and, subsequently, tissue was isolated with a sharp and thin knife (Figure A2). Each onion scale consisted of a wedge that included all layers present in the bulb, excluding the sprout (Figure A2). For each bulb, 10 g of fresh scale tissue was collected and freeze-dried. WSCs were extracted by adding 12.5 mL MQ-filtered water to 100 mg freeze-dried and finely ground onion bulb tissues. The solution was mixed and heated at 103 °C using an HLC thermomixer for 10 min. After cooling to room temperature, the extracts were filtered using a 0.45 µm PTFE syringe filter and 20× diluted with MQ-filtered water before separation using High-performance Anion-exchange Chromatography (HPEAC) and detection using a Pulsed Amperometric Detector (PAD). Internal standards for the quantifications of glucose, fructose, and sucrose were from Merck (Rahway, NJ, USA), and for 1-kestose, 1,1-kestotetraose, 1,1,1-kestopentaose, 1,1,1,1-kestohexaose and 1,1,1,1,1-kestoheptaose, which corresponded to fructan polymers with a degree of polymerization (DP) from 3 to 7, were from Megazyme (Wicklow, Republic of Ireland). Calibration standards were dissolved in MQ-filtered water and diluted to concentrations ranging from 0.0025 to 0.050 mg/mL. The separation and detection of glucose, fructose, sucrose, and fructans were performed using a DionexTM IC-5000+ dual HPEAC–PAD (Thermo Scientific, Waltham, MA, USA) system equipped with a DionexTM CarboPacTM PA100 (Thermo Scientific, Waltham, MA, USA) column (2 × 250 mm) and a similar guard column. The separation of fructans was achieved using a gradient of 0.1 M sodium hydroxide dissolved in MQ-filtered water (eluent A), and 0.1 M sodium hydroxide and 1 M sodium acetate dissolved in MQ-filtered water (eluent B), at a flow of 0.25 mL/min and a column temperature of 30 °C. The gradient was as follows: 100% A linear gradient to 65% A + 35% B (0–30 min); linear gradient to 50% A + 50% B (30–35 min); 50% A + 50% B (35–40 min; isocratic). A 5 µL sample was injected at 0 min.
2.5. ABA Extraction and Measurement
ABA measurements were performed as described in a previous study, with minor modifications [16]. ABA was extracted from 1 mg finely ground freeze-dried basal plate or bulb scale tissue per sample in three biological replicates. ABA levels were quantified using MRM-UPLC–MS/MS (Multi-reaction Monitoring Ultra-performance Liquid Chromatography–Mass Spectrometry), based on a previously published protocol [17].
2.6. Statistical Analysis
Quantification values of fructan and ABA concentrations were statistically analyzed to find significant differences across the time points, cultivars, and treatments by using Student’s t-test. The linear correlation between fructan quantification values in different tissues was calculated using the Pearson coefficient.
3. Results
3.1. Fructans Accumulate in the Basal Plate and Deplete in the Scales during Onion Storage
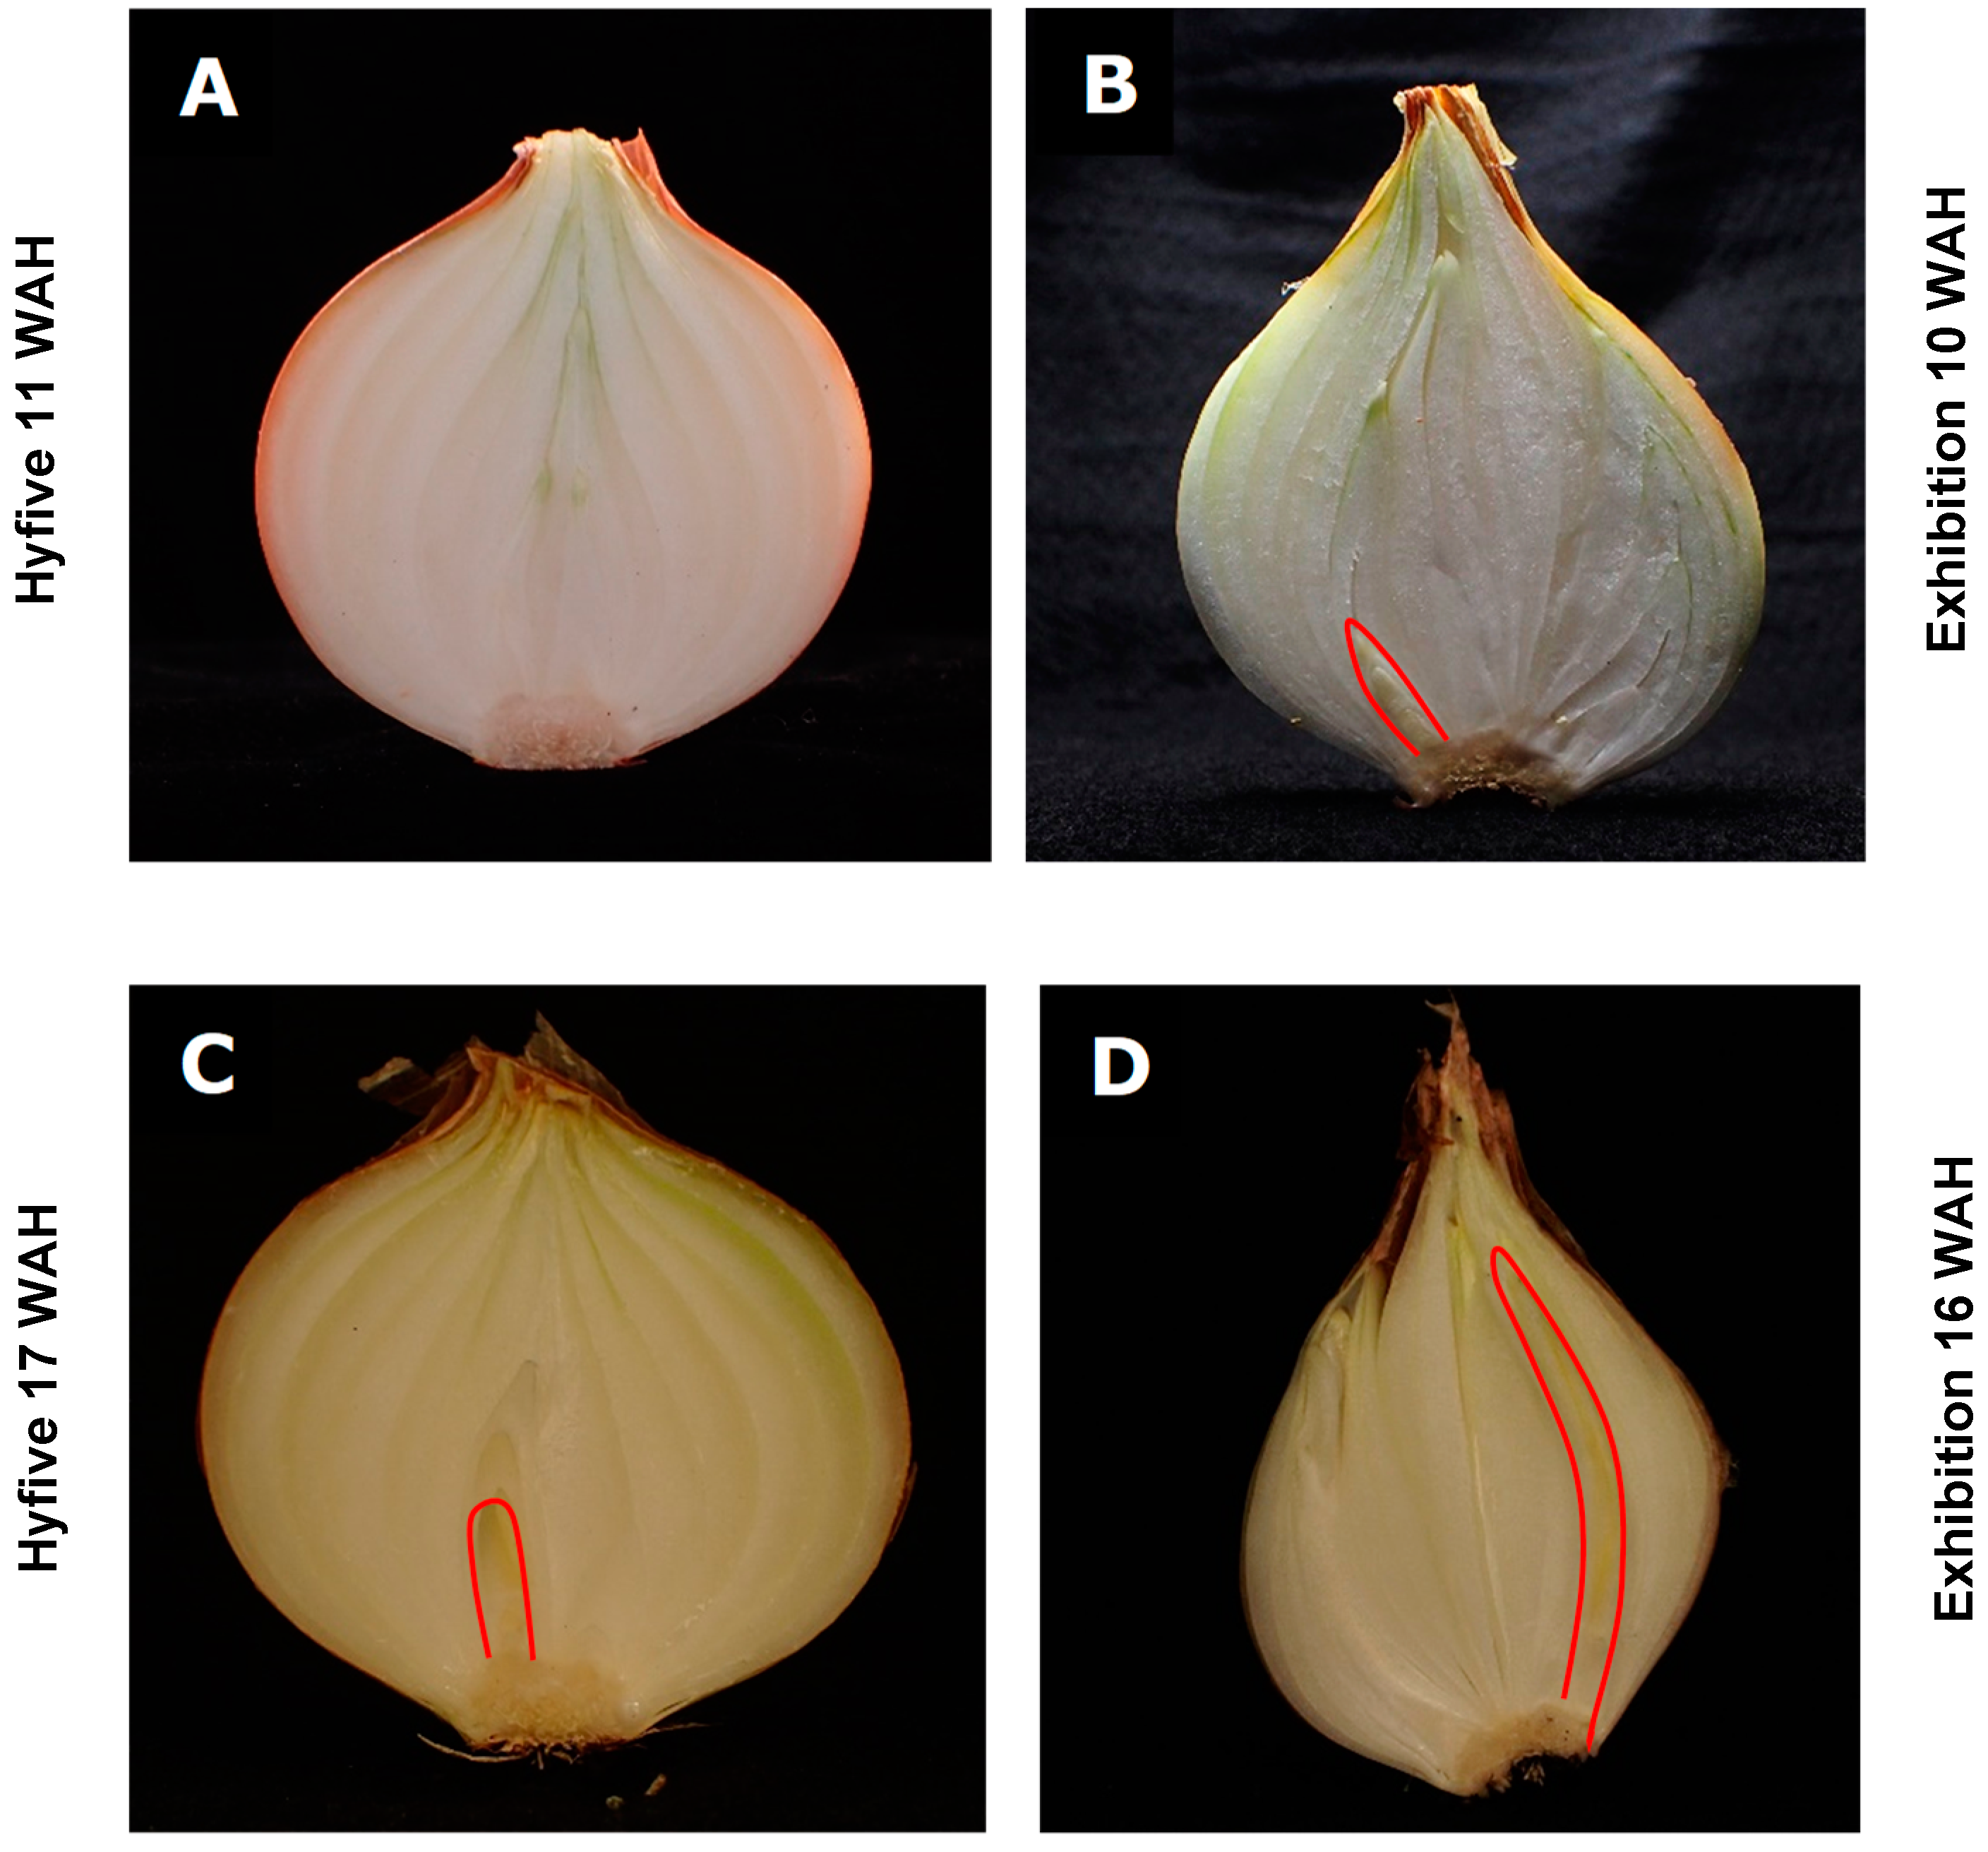
The first aim of our study was to investigate if a change in the concentration of polymerized fructans, in either the bulb scales or basal plate, can be considered an indicator for internal sprouting. Internal sprouting is defined as the stage at which a sprout can be observed inside a dissected bulb (Figure 1).
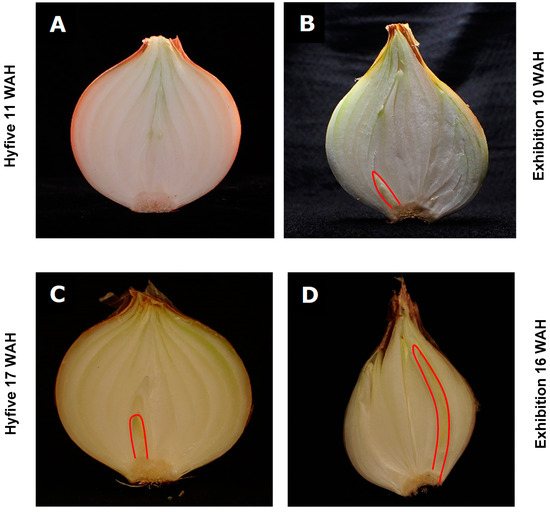
Figure 1.
Longitudinal sections of bulbs from two onion cultivars at two different time points during storage. Pictures show cross-sections of Hyfive (A) and Exhibition (B) bulbs at 11 and 10 weeks after harvest (WAH), and of Hyfive (C) and Exhibition (D) bulbs at 17 and 16 WAH, respectively. The red lines in pictures (B–D) highlight the internal sprouts. No internal sprout was present in picture (A).
The connection between internal sprouting and tissue-specific fructan levels was evaluated at six time points during the storage of cv. Hyfive and Exhibition onion bulbs. In the more storable Hyfive, internal sprouting was observed 17 weeks after harvest (WAH) (Figure 1 and Figure 2A), whereas internal sprouting was already observed 10 WAH in the poorly storable Exhibition (Figure 1 and Figure 2B).
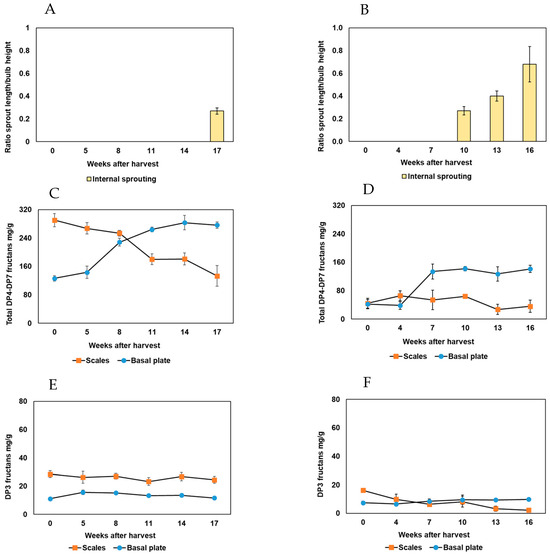
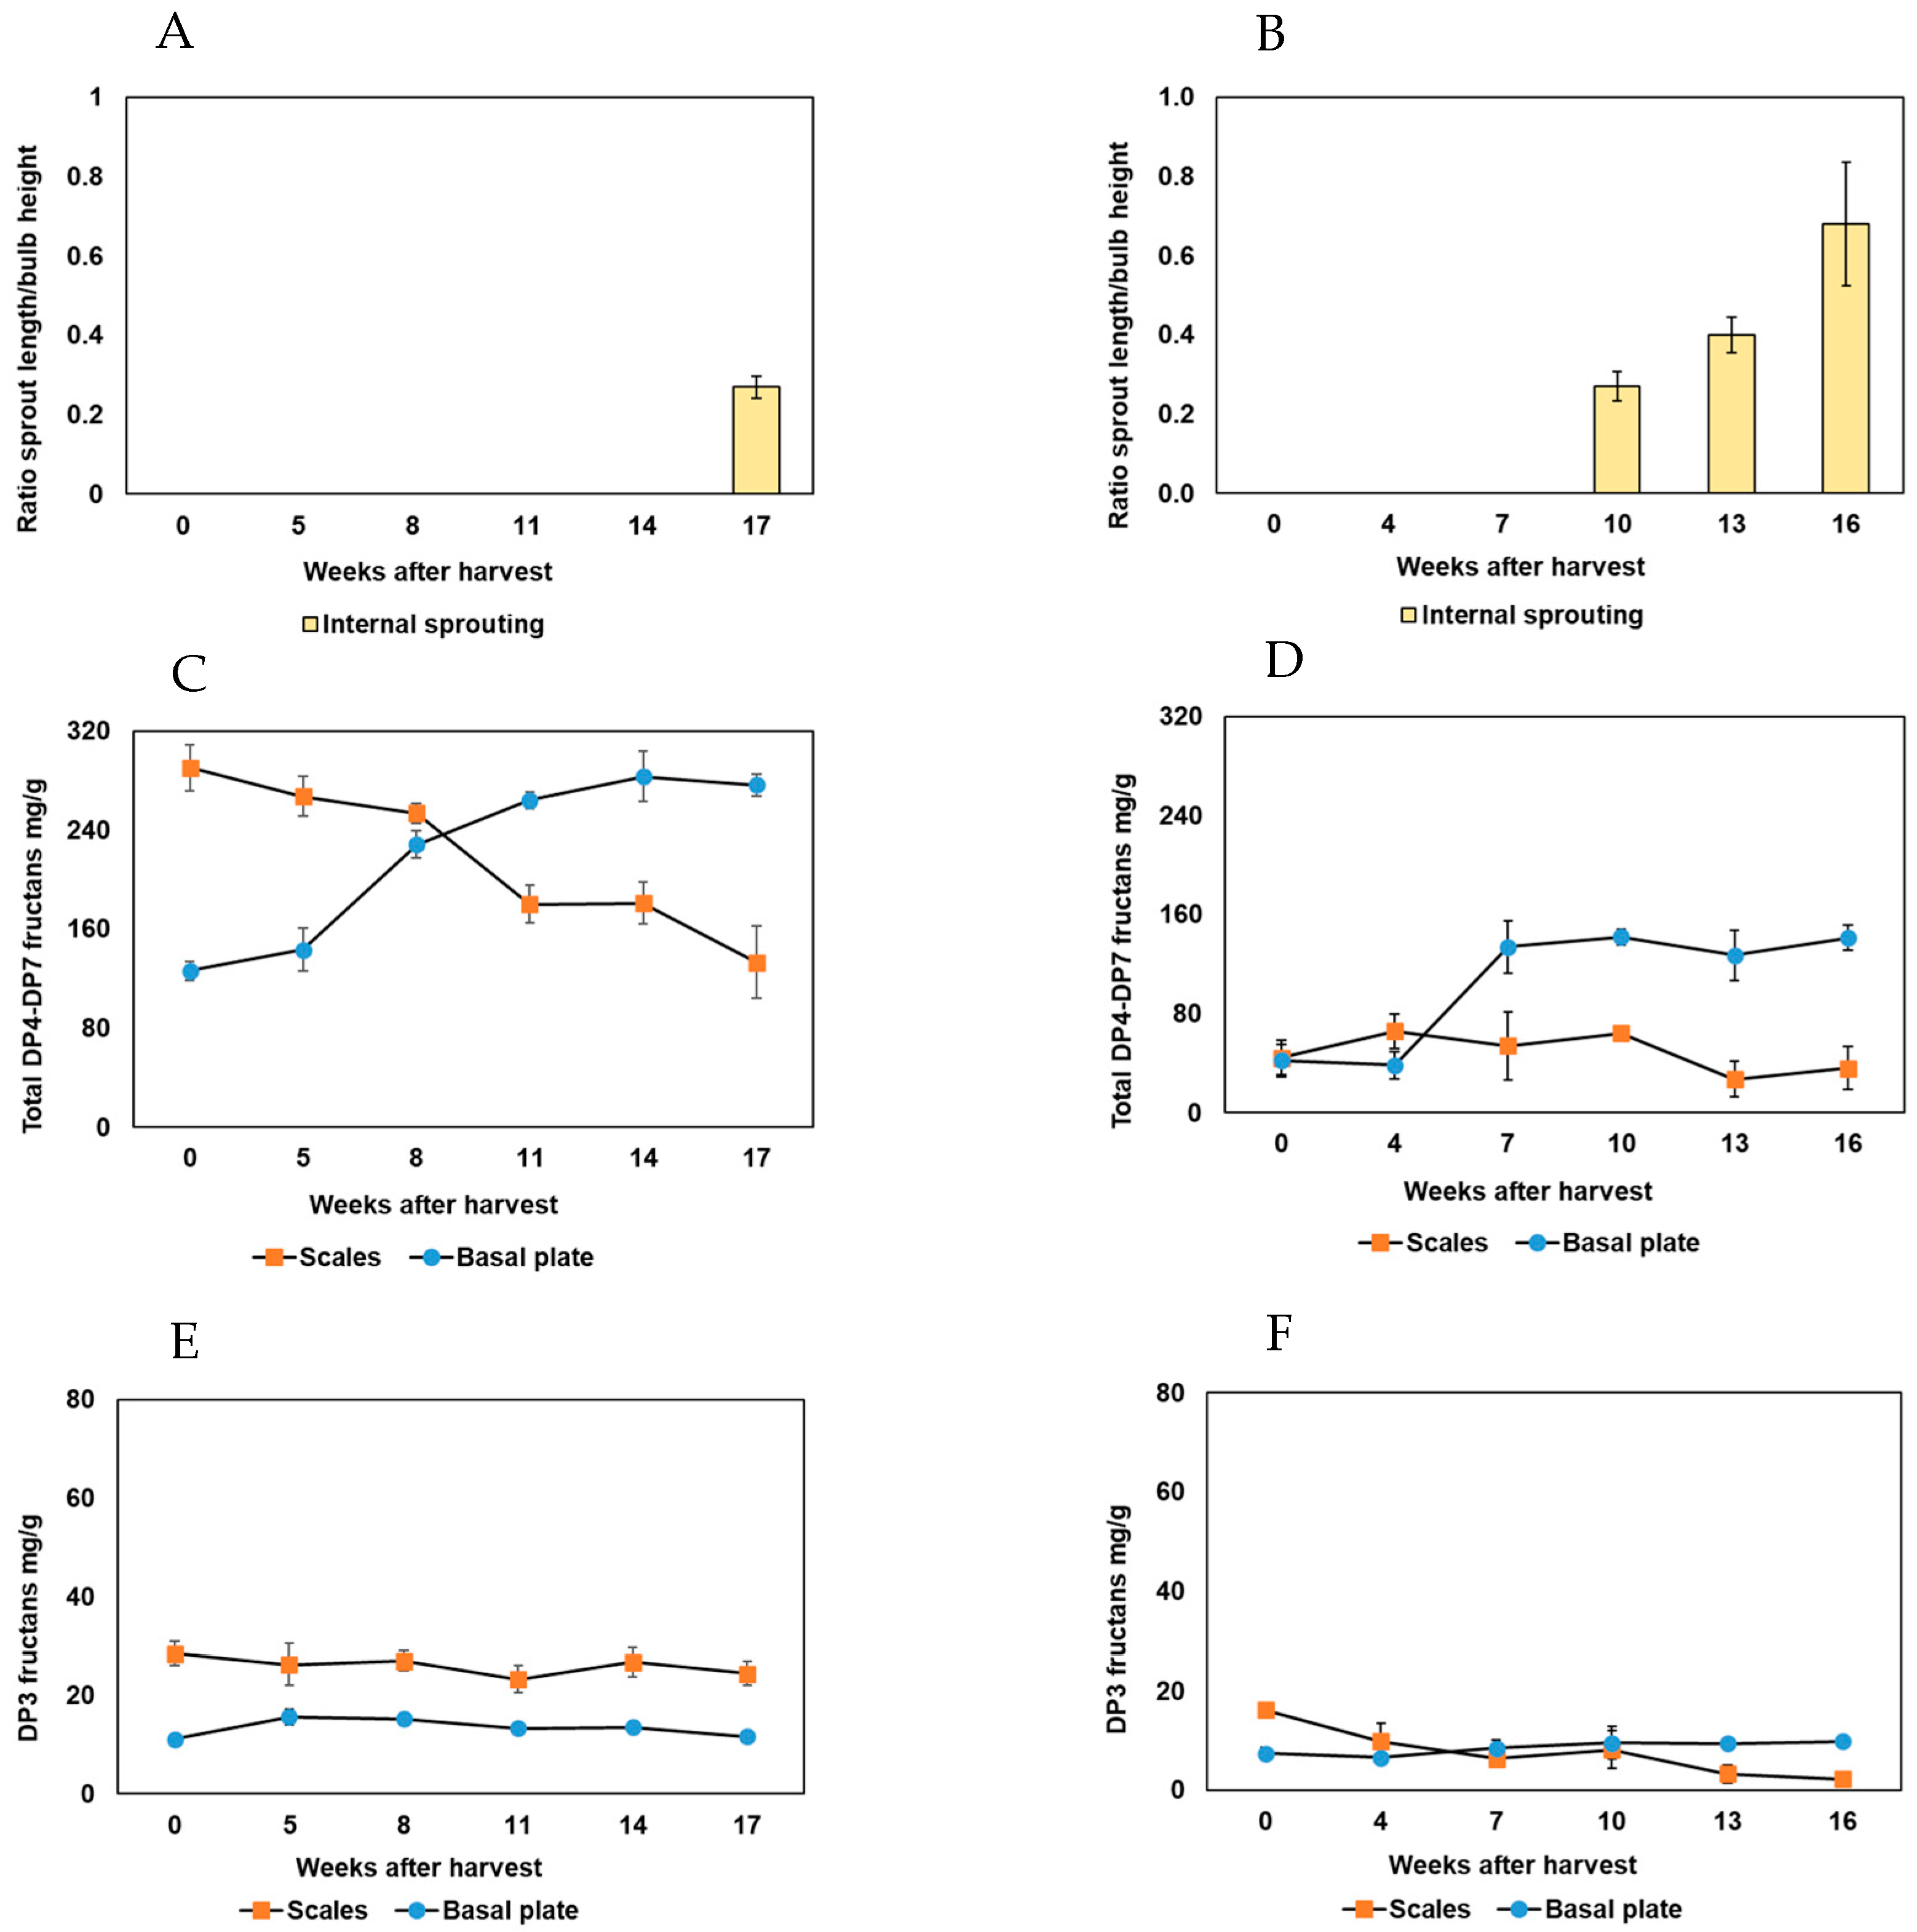
Figure 2.
Internal sprouting and fructan profiles during dry storage of cv. Hyfive and Exhibition onion bulbs. Storage time is indicated as weeks after harvest (WAH). (A,C,E) Measurements for Hyfive. (B,D,F) Measurements for Exhibition. In panels (A,B), the internal sprouting is plotted as the ratio ‘sprout length/bulb height’ (yellow bars); in panel (C,D), the DP4-DP7 fructan concentrations, and in panel (E,F), the DP3 fructan concentrations, are plotted in milligram (mg) fructans per gram (g) of dried scale or basal plate material (dry weight). The internal sprouting ratio and the fructan values are the mean values of three biological replicates. Error bars represent the standard error of the mean values.
Fructans with a degree of polymerization (DP) between 4 and 7 progressively decreased in the fleshy scales from 0 to 17 WAH in Hyfive and reached the lowest concentration when internal sprouting was observed for the first time (Figure 2C). In contrast, DP4-DP7 fructan concentration in Exhibition scales remained constant, at a relatively low level, until the moment of internal sprouting (10 WAH; Figure 2D). In the basal plates of Hyfive bulbs, DP4-DP7 fructans accumulated from 5 to 11 WAH, when internal sprouting was not yet visible, and remained at a constant level afterwards (Figure 2C). In the basal plates of Exhibition bulbs, the DP4-DP7 fructans accumulated from 4 to 7 WAH and, thereafter, remained at a constant level (Figure 2D). So, despite the large difference in the moment of internal sprouting between the two cultivars (Figure 2A,B), the DP4-DP7 fructan levels increased significantly (p < 0.05) in the basal plates of these onion bulbs at more or less the same moment (4 to 5 WAH). Furthermore, the maximum level of DP4-DP7 fructans was reached six weeks before visible sprouting in the Hyfive and three weeks before visible sprouting in the Exhibition cultivars. Hence, no correlation between DP4-DP7 fructan concentrations and internal sprouting was observed, and the only remarkable observation was that, at harvest time, the overall concentrations of DP4-DP7 fructans in the basal plates and bulb scales were significantly lower in Exhibition than in Hyfive (p < 0.05; Figure 2C,D).
In parallel, we investigated DP3 fructan concentrations in Hyfive bulbs and revealed that these remained consistently stable throughout the investigated period in both the scales and basal plate tissue (Figure 2E). The same stable DP3 fructan pattern was observed in the basal plates of Exhibition bulbs (Figure 2F). However, DP3 fructan concentrations decreased over time in the scales of Exhibition (Figure 2F). So, changes in DP3 fructan concentrations, in either the scales or basal plate tissue, could also not be correlated to internal sprouting in dry-stored onion bulbs, as was concluded for the changes in DP4-7 fructan levels.
3.2. Hyfive and Exhibition Simple Sugar Profiles Are Not Related to Internal Sprouting
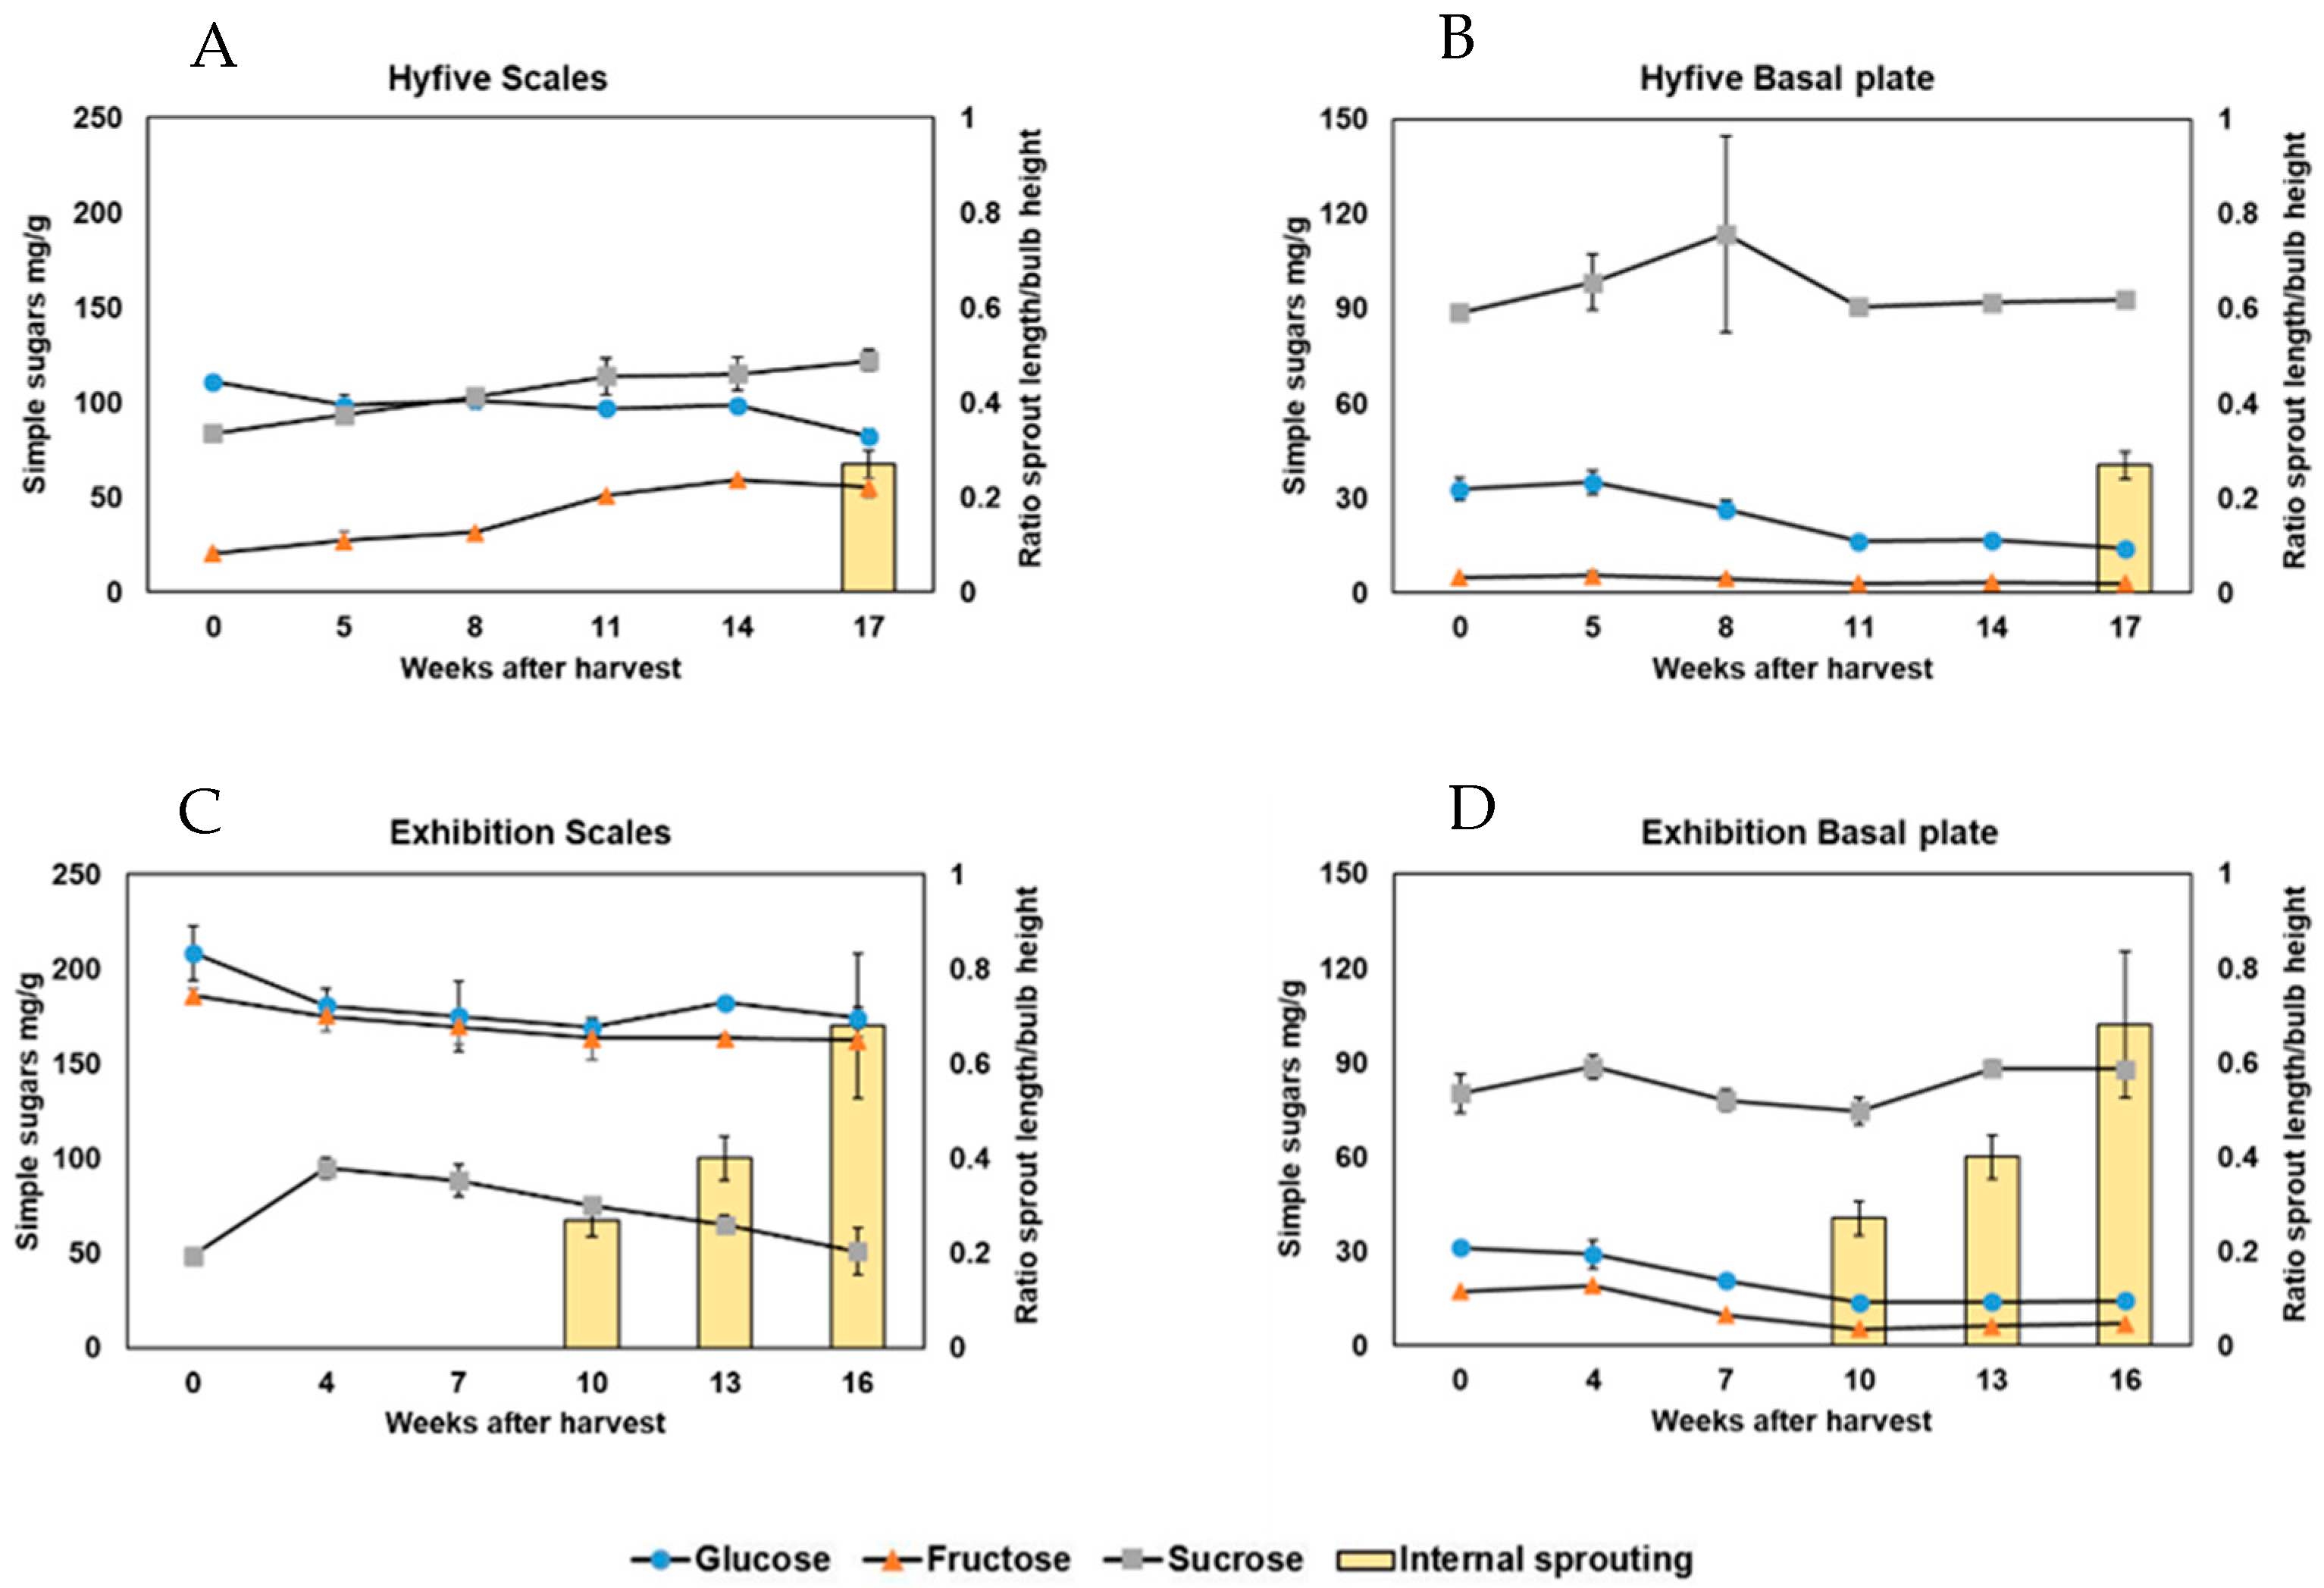
In addition to the levels of fructans, we also measured glucose, fructose, and sucrose levels in the scales and basal plates of Hyfive and Exhibition bulbs to assess whether simple sugars can be associated with internal sprouting. Glucose and fructose concentrations were significantly higher (p < 0.01) in the Exhibition scales than in those of Hyfive at every measured time point during storage (Figure 3A,C). In contrast, sucrose accumulated more (p < 0.05) in Hyfive scales than in Exhibition ones at harvest time (Figure 3A,C). Overall, glucose, fructose, and sucrose profiles all differed between the two cultivars. The most variable carbohydrate in the bulb scales was sucrose, whose profile during storage was contrasting in the investigated cultivars. Sucrose significantly (p < 0.01) decreased from 4 to 16 WAH in Exhibition scales, whereas a significant accumulation of sucrose (p < 0.01) was found in Hyfive from 5 to 17 WAH. Glucose concentration in the basal plate decreases in the same period in both cultivars and hence, is not linked to the difference in internal sprouting (Figure 3B,D). In conclusion, changes in simple sugars cannot be directly associated with the moment of internal sprouting in dry-stored onion bulbs.
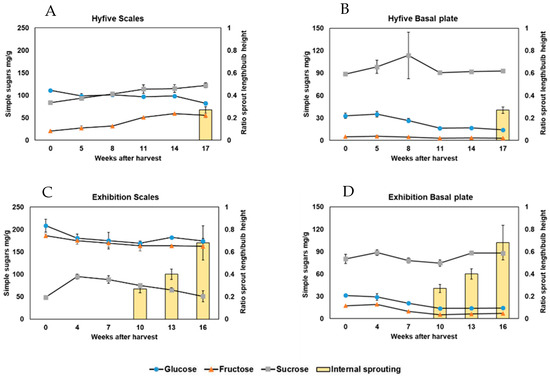
Figure 3.
Simple sugars and internal sprouting profiles in dry-stored bulbs of cv. Hyfive and Exhibition. Storage time is indicated as weeks after harvest (WAH). (A,C) Internal sprouting, glucose, fructose, and sucrose profiles in scales. (B,D) Internal sprouting, glucose, fructose, and sucrose profiles in the basal plates. Sugar values are the mean values of three biological replicates, depicted in mg per g of dry weight. Error bars represent the standard errors of the mean values. Different lines represent levels of glucose (blue circles), fructose (orange triangles), and sucrose (grey squares). The yellow bars refer to internal sprouting, which is expressed as the ratio between ‘sprout length and bulb height’.
3.3. ABA Increases in the Basal Plate of Both Cultivars during Storage
In addition to WSCs, the hormone ABA has been linked to sprout activity in onions [7,8,9]. To assess whether the depletion of the hormone ABA within the onion bulb can be considered a trigger for internal sprouting, total ABA content was measured in bulb scales and basal plate tissues in Hyfive and Exhibition cultivars. Hyfive accumulates significantly (p < 0.05) higher levels of ABA than Exhibition at harvest time in both investigated tissues. Overall, ABA gradually decreased in the scales of both the cultivars from 0 to 10–11 WAH and remained stable, at low concentrations, thereafter (Figure 4). In Exhibition, internal sprouting was observed for the first time at week 10, concurrently with the lowest ABA concentration in the scales (Figure 4B). However, internal sprouting was observed at week 17 in Hyfive, despite ABA reaching its minimum concentration in the scales long before (Figure 4A). In contrast to the decrease in the scales, ABA concentration increased in the basal plates, showing the lowest level of ABA at week 0 in both cultivars (Figure 4). In Hyfive, ABA gradually and significantly (p < 0.05) increased from 0 to 17 WAH, the moment when the internal sprout became visible (Figure 4A). Nevertheless, this steady increase until internal sprouting was not consistent in Exhibition, which showed a discontinuous ABA profile (Figure 4B).
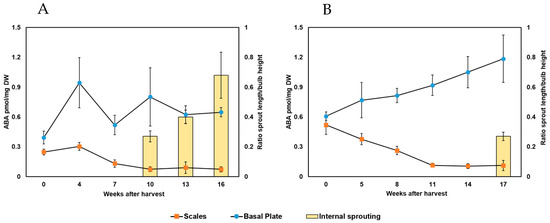
Figure 4.
Bulb ABA and internal sprouting profiles. The comparisons of ABA concentrations in (A) cv. Hyfive and (B) cv. Exhibition bulb scales (orange squares) and basal plates (blue circles) at six time points during dry storage. Timepoint values are the mean ABA concentrations of three biological replicates, depicted in pmol per mg of dry weight. Error bars represent the standard errors of the mean values. The yellow bar refers to internal sprouting, expressed as the ratio between ‘sprout length and bulb height’.
3.4. MH Inhibits Internal Sprouting without Affecting Fructan and ABA Profiles
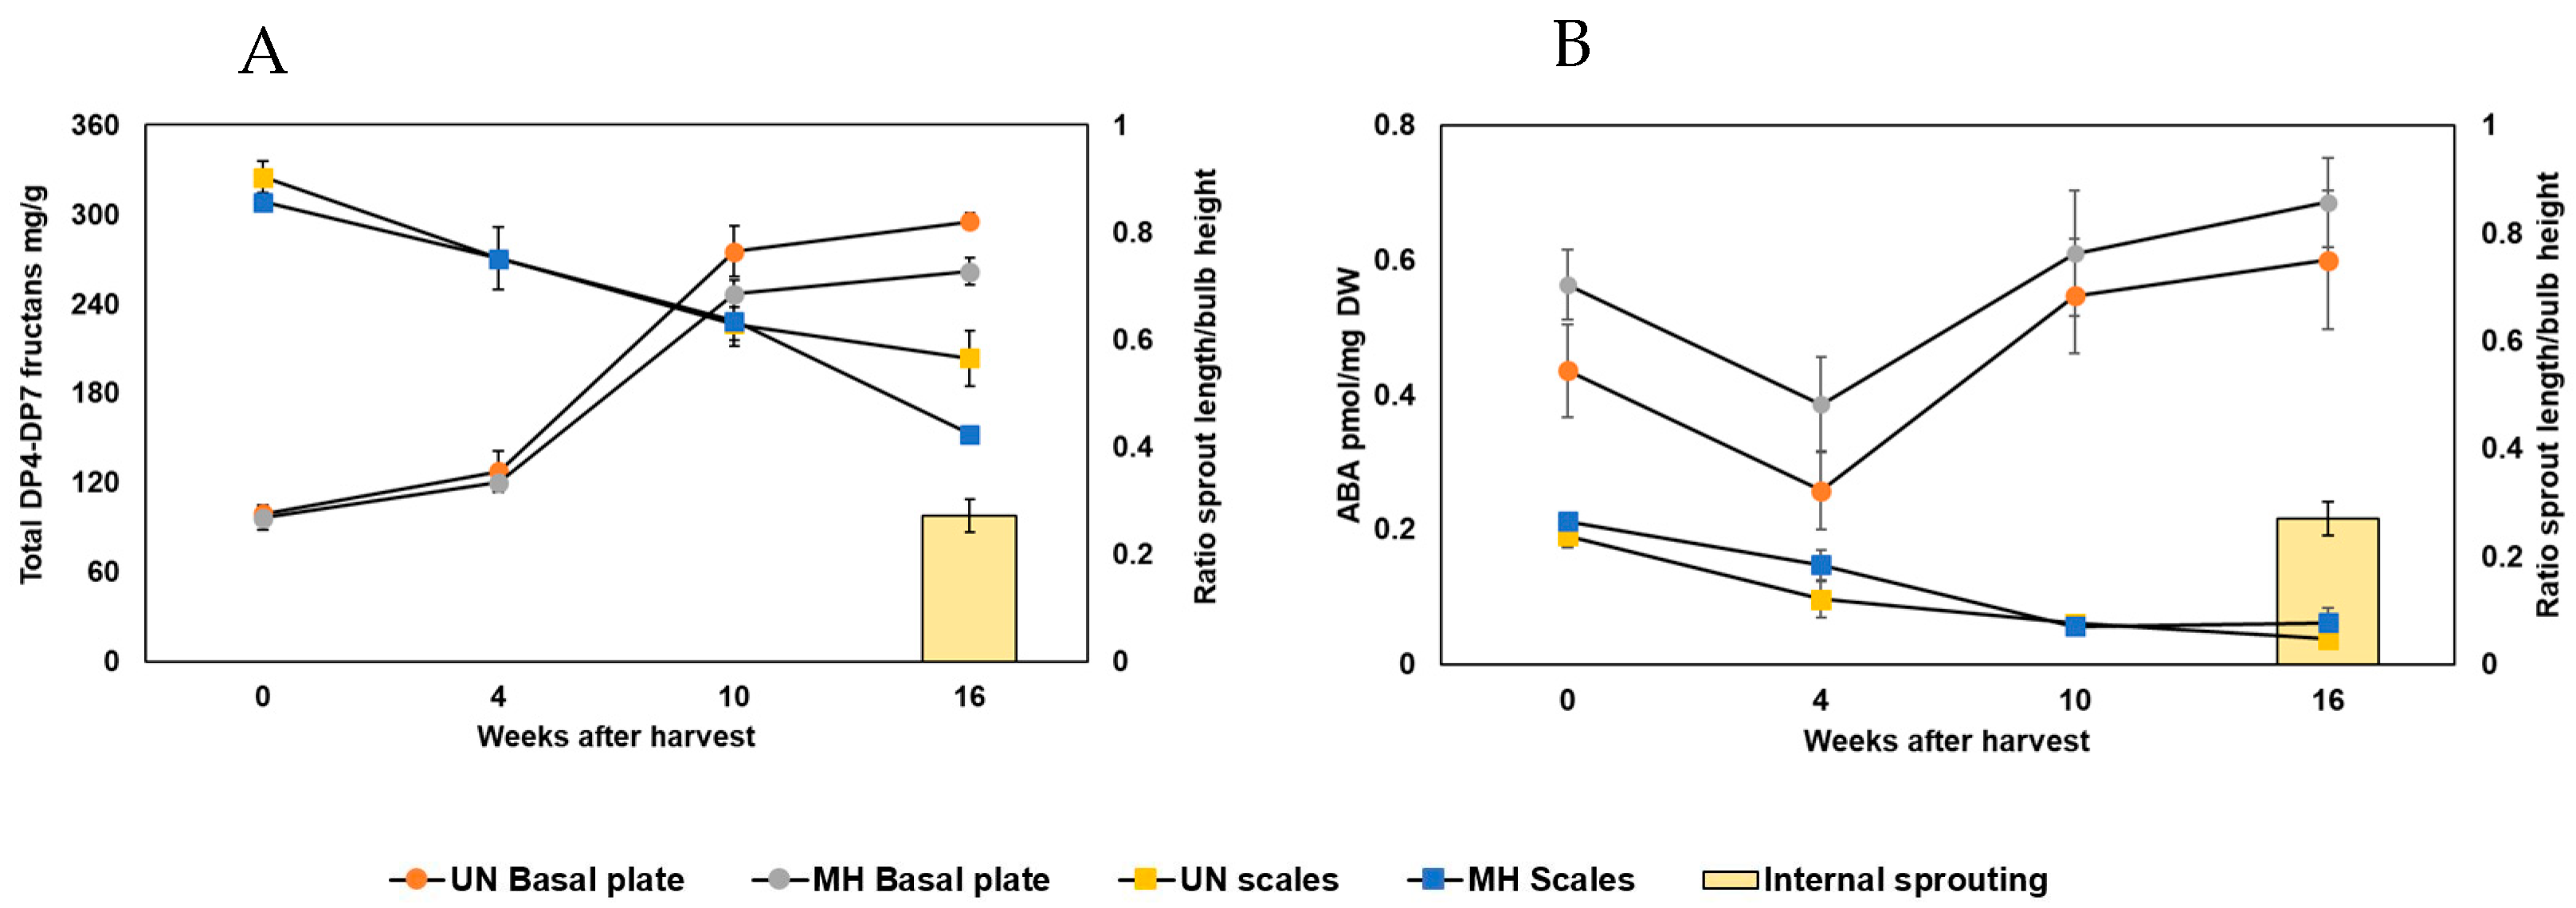
The results observed so far suggest that WSC and ABA tissue-specific concentrations are not directly linked with internal sprouting. Dramatically delayed internal sprouting can be obtained by using Maleic Hydrazide (MH) treatment [18] and, therefore, we measured WSC and ABA concentrations to evaluate a possible perturbation in MH-treated bulbs. Although the treatment strongly altered the phenotype and completely blocked internal sprouting during the investigated period, no substantial differences were found between the WSC contents of MH-treated and untreated onions (Figure 5A; p > 0.05). Furthermore, the compared means of ABA concentrations at the different time points also showed no significant differences between bulbs from control and treated plants (Figure 5B; p > 0.05).
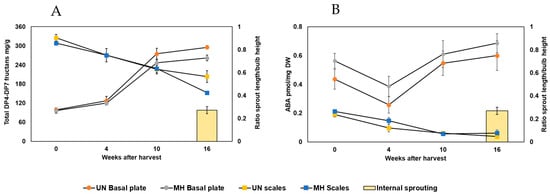
Figure 5.
Effects of Maleic Hydrazide (MH) treatment on internal sprouting, DP4-DP7 fructan profiles, and ABA profiles in scales and basal plates of onion cv. Hyfive bulbs. (A) DP4-DP7 fructan profile and (B) ABA profile in the basal plates of MH-treated (grey circles) and untreated (UN) control bulbs (orange circles), and the bulb scales of MH-treated (blue squares) and UN control bulbs (yellow squares) at four time points during dry storage. DP4-DP7 fructan values are the mean values of three biological replicates, depicted in mg per g of dry weight. ABA concentration values are the mean values of three biological replicates, depicted in pmol per mg of dry weight. Error bars represent the standard errors of the mean values. The yellow bar refers to internal sprouting, expressed as the ratio between ‘sprout length and bulb height’. Internal sprouting was only present in the UN samples, whereas no internal sprouting was observed in the MH-treated bulbs. Independent T-test showed that average fructan (DP4-DP7) and ABA concentrations are not statistically different (p > 0.05) between the UN and MH-treated onion bulbs.
4. Discussion
This study aimed to assess if highly polymerized fructan accumulation in the basal plate and tissue-specific ABA depletion could be considered direct triggers of internal sprouting in onions. Internal sprouting is the stage at which a visible sprout emerges within the onion bulb, representing the phase of a developing leaf blade that will eventually extend from the bulb’s neck [1]. Sprouting time was hypothesized to be associated with decreased total fructan concentration in whole bulbs of cv. Tenshin [5]. We measured fructans in bulb scales and basal plates independently, in the late-sprouting cv. Hyfive and the early sprouting cv. Exhibition. DP4-DP7 fructans progressively decreased in Hyfive bulb scales, reaching the lowest level contemporary with internal sprouting. However, in Exhibition, DP4-DP7 fructans did not decrease in bulb scales before internal sprouting occurred. Other studies revealed a general accumulation of fructans in the onion basal plate before internal sprouting [19,20]. These studies suggested that this accumulation is a prerequisite for sprout growth, but occurs independently of the growth rate of the sprout [19,20]. In line with this observation, DP4-DP7 fructans accumulated in the Hyfive and Exhibition basal plates after the curing stage, despite the large difference in internal sprouting between the cultivars. Therefore, we concluded that internal sprouting and the DP4-DP7 fructan profile in the basal plate are not tightly linked. More recently, it was reported that the concentration of highly polymerized (DP7-DP8) fructans in the basal plate tissue of cv. Sherpa peaked during storage, around two weeks before internal sprouting [6]. After these first signs of internal sprouting, highly polymerized fructans decreased dramatically in the basal plate. Hence, the accumulation of highly polymerized fructans in the basal plate was proposed as a predictive marker for sprouting [6]. In our dataset, DP4-DP7 fructans accumulated from 5 to 11 weeks after harvest (WAH) in Hyfive basal plates, six weeks before internal sprouting. In Exhibition, DP4-DP7 fructans accumulated from 4 to 7 WAH, without decreasing after the start of internal sprouting at 10 WAH. These differences with what was previously observed in cv. Sherpa [6] may be attributed to different genetic backgrounds or storage conditions, with bulbs stored at 10 °C in our study instead of 1 °C [6]. Altogether, these data conclusively show a lack of absolute correlation between the tissue-specific concentration of DP4-DP7 fructans and internal sprouting. This does not mean that fructans are irrelevant to sprouting, but that the fructan concentrations in the scales or basal plate cannot be used as markers to predict when internal sprouting will occur.
ABA was proposed as a primary factor of onion sprouting onset [7,8,9], and it is defined as a repressor of sprouting. ABA levels decline in the complete bulb during storage, and internal sprouting occurs when ABA levels reach the minimum [7,8]. Nevertheless, no specific threshold ABA concentration was defined at which the onset of internal sprouting occurs [21]. In agreement, we also found that ABA progressively decreased in the bulb scales during storage. Both Exhibition and Hyfive showed ABA depletion, but, in contrast to the literature, the depletion was unrelated to internal sprouting. The minimum ABA level coincided with internal sprouting only in the fast-sprouting Exhibition. The minimum level of ABA in the Hyfive scales was already reached six weeks before internal sprouting. Consequently, ABA levels in the scales cannot be used to precisely predict internal sprouting and, hence, onion storability. Nonetheless, early growth characterized primarily by cell division may precede internal sprouting, which is largely driven by cell elongation. The higher growth rate of Exhibition compared to Hyfive could justify the difference observed between the minimum level of ABA and internal spouting in the investigated cultivars. This hypothesis would, rather, confirm that these predictors of internal sprouting remain unreliable. All of the studies mentioned so far have investigated ABA levels in the whole bulb, bulb scales, or leaf tissues. More recently, ABA levels were measured in the basal plates of Sherpa bulbs and, surprisingly, ABA did not decrease during the first 12 WAH [15]. In agreement, we also observed that ABA did not decrease in the basal plate tissue during storage. Actually, ABA increased in both Hyfive and Exhibition, and the lowest concentration was found at harvest time. Considering ABA as a repressor of sprouting, this is unexpected. However, the shoot apical meristem (SAM), from which the sprout is formed, represents only a small portion of the sampled basal plate tissue, and the ABA concentration may have only a very local minimum enabling internal sprouting. Cell-specific analyses will be needed to test this hypothesis in the future.
Although the changes in concentrations of fructans and ABA during storage appeared to be unreliable indicators of internal sprouting, alternative measures can be employed to assess the storability of an onion variety. A positive correlation between late sprouting and high levels of total fructans and ABA in the whole bulb at the moment of harvesting was reported for various cultivars in previous studies [3,4,14], leading to the hypothesis that the concentrations of total fructans and ABA at harvest can serve as a marker for storability. In accordance, we observed that total DP4-DP7 fructan concentration was significantly higher at harvest time in Hyfive than in Exhibition (p < 0.05) in both basal plates and bulb scales. As for fructans, our data revealed that Hyfive ABA levels were significantly higher (p < 0.05) than Exhibition ABA levels at harvest time in both investigated tissues. Therefore, DP4-DP7 fructan and ABA concentrations at harvest time in whole onion bulbs or scales are indicators for which a consistent link with internal sprouting has been observed; hence, they could serve as indicators for internal sprouting and storability.
In conclusion, the findings reported in this study suggest a complex interaction between sprout growth repressors and activators, where ABA and DP4-DP7 fructans are not the only steering signals or limiting factors. Furthermore, our investigations reveal that ABA cannot be seen as a simple sprouting repressor, which raises new questions about ABA’s roles in stored onions.
Author Contributions
Conceptualization, A.C., R.G.H.I., C.W.B.B. and O.E.S.; methodology, A.C., A.D., W.K. and A.v.S.; data analysis, A.C., W.K. and A.D.; writing—original draft preparation, A.C., R.G.H.I. and O.E.S.; writing—review and editing, C.W.B.B., R.G.H.I. and O.E.S.; supervision, O.E.S. and R.G.H.I.; funding acquisition, O.E.S. and R.G.H.I. All authors have read and agreed to the published version of the manuscript.
Funding
This research was financially supported by a grant from Topsector Horticulture and Starting Materials (TU-19072) and the breeding companies Bejo Zaden/De Groot en Slot B.V., BASF Nunhems and Cora Seeds Srl.
Data Availability Statement
The original contributions presented in the study are included in the article, further inquiries can be directed to the corresponding author.
Acknowledgments
The authors thank Karin Burger-Meijer for field assistance in growing the onion plants, Erik de Kam and Marco Utili for their assistance in the lab, and the breeding companies Bejo Zaden/De Groot en Slot B.V., BASF Nunhems and Cora Seeds Srl for their support.
Conflicts of Interest
The authors declare no conflicts of interest.
Appendix A
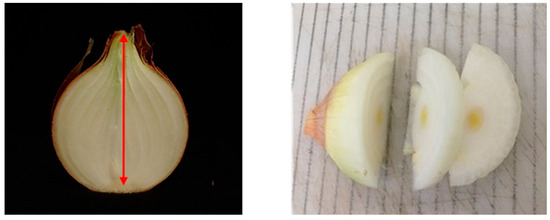
Figure A1.
Measurement of the bulb height and sprout length. Pictures show cross-sections of onion bulbs for bulb height (left) and longest sprout length (right) measurements.
Figure A1.
Measurement of the bulb height and sprout length. Pictures show cross-sections of onion bulbs for bulb height (left) and longest sprout length (right) measurements.
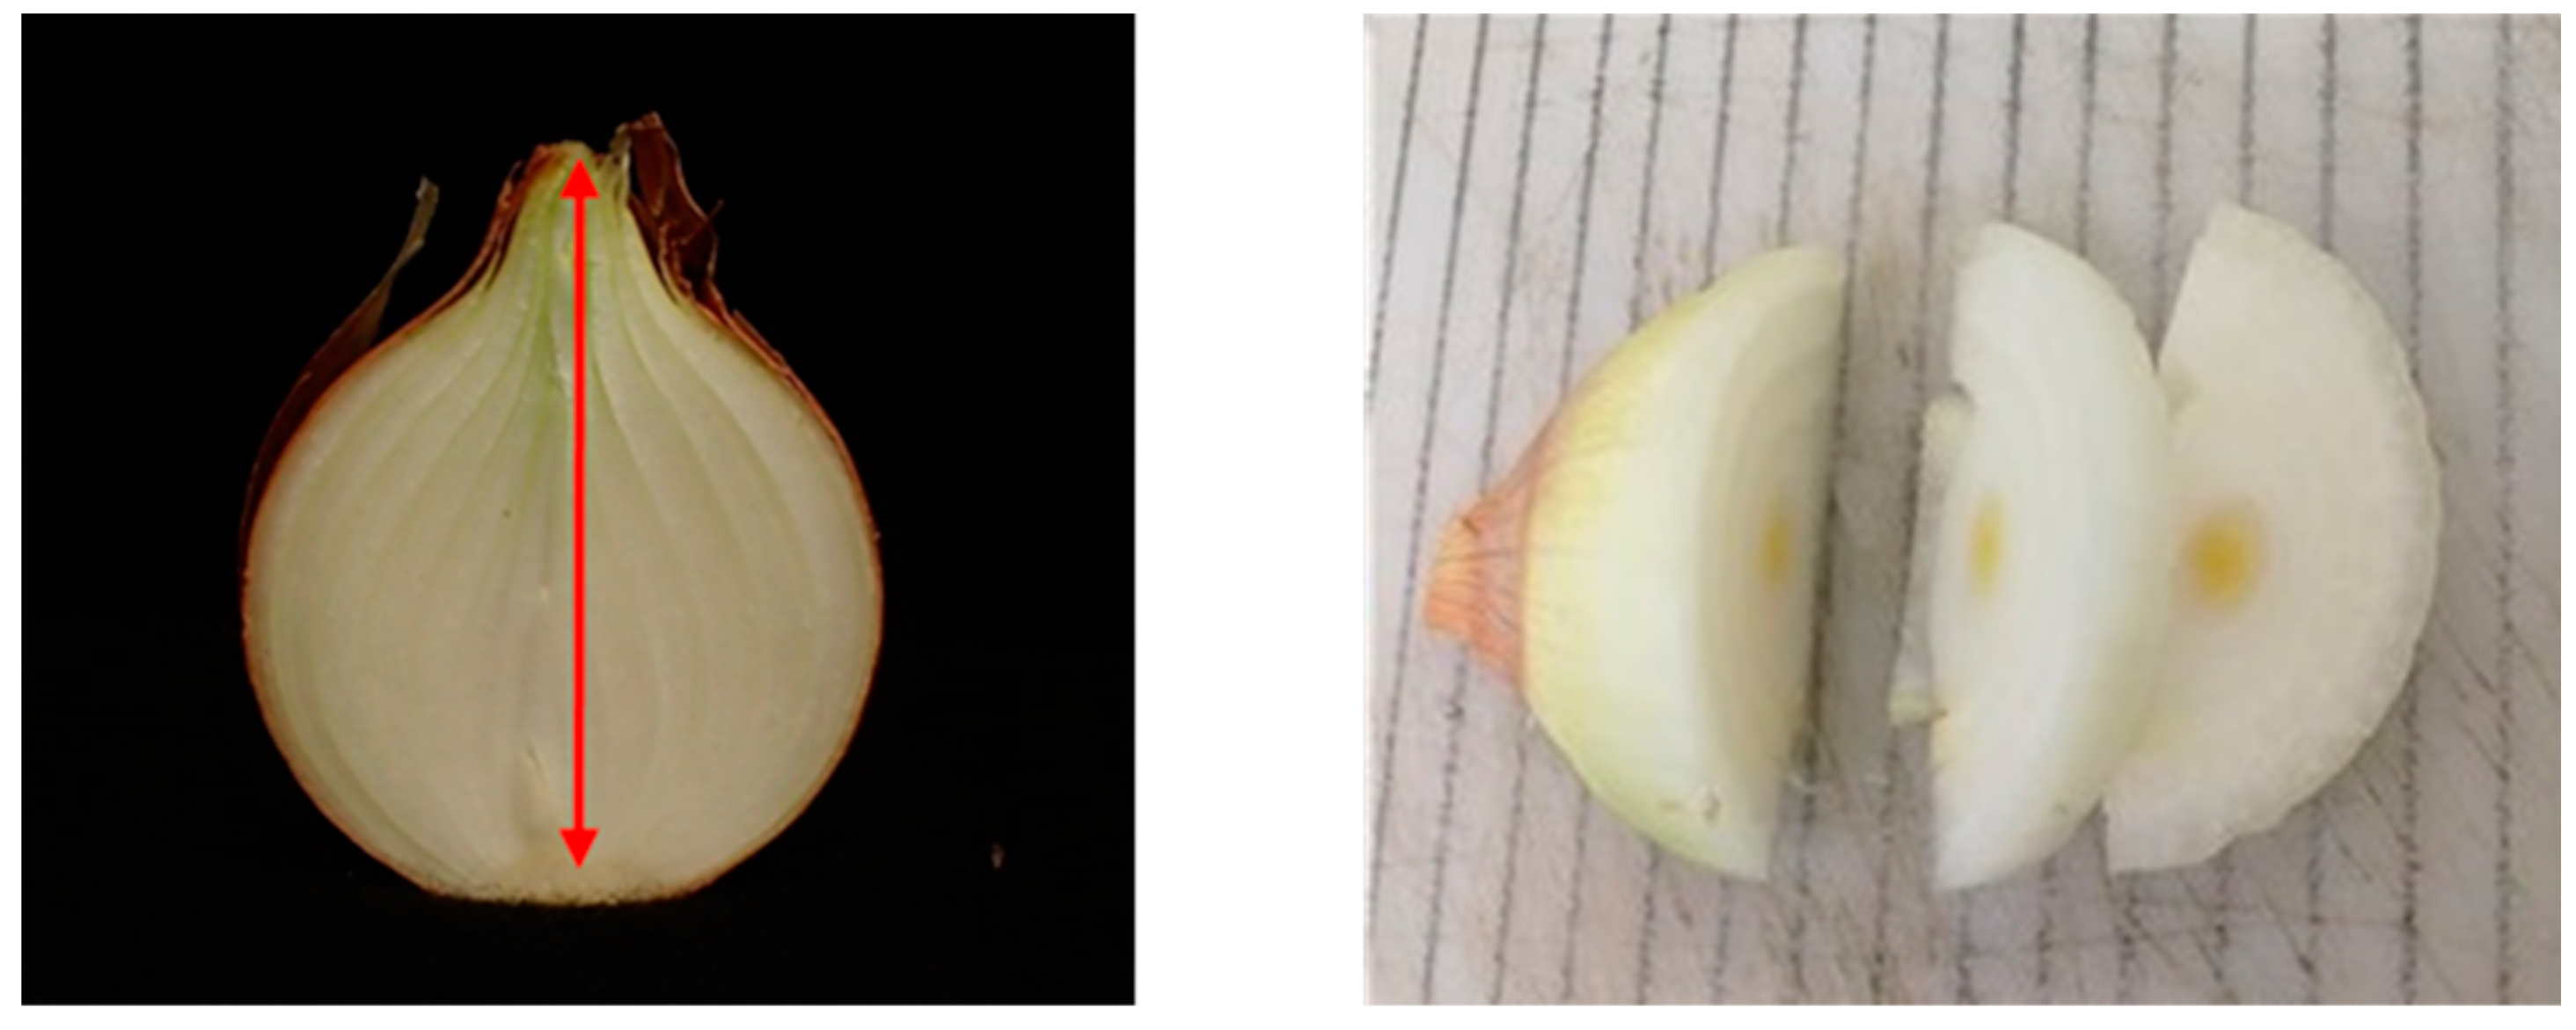

Figure A2.
Schematic representation of the bulb tissues used in this study. The regions outlined in red represent the tissues referred to as the onion basal plate (left) and the scales (right).
Figure A2.
Schematic representation of the bulb tissues used in this study. The regions outlined in red represent the tissues referred to as the onion basal plate (left) and the scales (right).
References
- Brewster, J.L. Onions and Other Vegetable Alliums; CABI: Wallingford, UK, 2008. [Google Scholar]
- Meier, H.; Reid, J.S.G. Reserve Polysaccharides Other than Starch in Higher Plants. In Plant Carbohydrates I: Intracellular Carbohydrates; Loewus, F.A., Tanner, W., Eds.; Springer: Berlin/Heidelberg, Germany, 1982; pp. 418–471. [Google Scholar]
- Jaime, L.; Martín-Cabrejas, M.A.; Mollá, E.; López-Andréu, F.J.; Esteban, R.M. Effect of Storage on Fructan and Fructooligosaccharide of Onion (Allium cepa L.). J. Agric. Food Chem. 2001, 49, 982–988. [Google Scholar] [CrossRef] [PubMed]
- Suzuki, M.; Cutcliffe, J.A. Fructans in onion bulbs in relation to storage life. Can. J. Plant Sci. 1989, 69, 1327–1333. [Google Scholar] [CrossRef]
- Benkeblia, N.; Onodera, S.; Shiomi, N. Variation in 1-fructo-exohydrolase (1-FEH) and 1-kestose-hydrolysing (1-KH) activities and fructo-oligosaccharide (FOS) status in onion bulbs. Influence of temperature and storage time. J. Sci. Food Agric. 2005, 85, 227–234. [Google Scholar] [CrossRef]
- Ohanenye, I.C.; Alamar, M.C.; Thompson, A.J.; Terry, L.A. Fructans redistribution prior to sprouting in stored onion bulbs is a potential marker for dormancy break. Postharvest Biol. Technol. 2019, 149, 221–234. [Google Scholar] [CrossRef] [PubMed]
- Chope, G.A.; Terry, L.A.; White, P.J. Preharvest application of exogenous abscisic acid (ABA) or an ABA analogue does not affect endogenous ABA concentration of onion bulbs. Plant Growth Regul. 2007, 52, 117–129. [Google Scholar] [CrossRef]
- Chope, G.A.; Cools, K.; Hammond, J.P.; Thompson, A.J.; Terry, L.A. Physiological, biochemical and transcriptional analysis of onion bulbs during storage. Ann. Bot. 2012, 109, 819–831. [Google Scholar] [CrossRef] [PubMed]
- Matsubara, S.; Kimura, I. Changes of ABA Content during Bulbing and Dormancy and in vitro Bulbing in Onion Plant. J. Jpn. Soc. Hortic. Sci. 1991, 59, 757–762. [Google Scholar] [CrossRef]
- Chen, K.; Li, G.-J.; Bressan, R.A.; Song, C.-P.; Zhu, J.-K.; Zhao, Y. Abscisic acid dynamics, signaling, and functions in plants. J. Integr. Plant Biol. 2020, 62, 25–54. [Google Scholar] [CrossRef] [PubMed]
- Ma, Y.; Szostkiewicz, I.; Korte, A.; Moes, D.; Yang, Y.; Christmann, A.; Grill, E. Regulators of PP2C Phosphatase Activity Function as Abscisic Acid Sensors. Science 2009, 324, 1064–1068. [Google Scholar] [CrossRef] [PubMed]
- Park, S.-Y.; Fung, P.; Nishimura, N.; Jensen, D.R.; Fujii, H.; Zhao, Y.; Lumba, S.; Santiago, J.; Rodrigues, A.; Chow, T.-F.F.; et al. Abscisic Acid Inhibits Type 2C Protein Phosphatases via the PYR/PYL Family of START Proteins. Science 2009, 324, 1068–1071. [Google Scholar] [CrossRef] [PubMed]
- Puccio, G.; Crucitti, A.; Tiberini, A.; Mauceri, A.; Taglienti, A.; Palumbo Piccionello, A.; Carimi, F.; van Kaauwen, M.; Scholten, O.; Sunseri, F.; et al. WRKY Gene Family Drives Dormancy Release in Onion Bulbs. Cells 2022, 11, 1100. [Google Scholar] [CrossRef] [PubMed]
- Chope, G.A.; Terry, L.A.; White, P.J. Effect of controlled atmosphere storage on abscisic acid concentration and other biochemical attributes of onion bulbs. Postharvest Biol. Technol. 2006, 39, 233–242. [Google Scholar] [CrossRef]
- Alamar, M.C.; Anastasiadi, M.; Lopez-Cobollo, R.; Bennett, M.H.; Thompson, A.J.; Turnbull, C.G.N.; Mohareb, F.; Terry, L.A. Transcriptome and phytohormone changes associated with ethylene-induced onion bulb dormancy. Postharvest Biol. Technol. 2020, 168, 111267. [Google Scholar] [CrossRef] [PubMed]
- López-Ráez, J.A.; Kohlen, W.; Charnikhova, T.; Mulder, P.; Undas, A.K.; Sergeant, M.J.; Verstappen, F.; Bugg, T.D.H.; Thompson, A.J.; Ruyter-Spira, C.; et al. Does abscisic acid affect strigolactone biosynthesis? New Phytol. 2010, 187, 343–354. [Google Scholar] [CrossRef] [PubMed]
- Jansma, S.Y.; Sergeeva, L.I.; Tikunov, Y.M.; Kohlen, W.; Ligterink, W.; Rieu, I. Low Salicylic Acid Level Improves Pollen Development under Long-Term Mild Heat Conditions in Tomato. Front. Plant Sci. 2022, 13, 828743. [Google Scholar] [CrossRef] [PubMed]
- Isenberg, F.M.R.; Jensen, C.O.; Odland, M.L. Effect of Maleic Hydrazide on the Respiration of Mature Onion Bulbs. Science 1954, 120, 464–465. [Google Scholar] [CrossRef] [PubMed]
- Pak, C.; van der Plas, L.H.W.; de Boer, A.D. Importance of dormancy and sink strength in sprouting of onions (Allium cepa) during storage. Physiol. Plant. 1995, 94, 277–283. [Google Scholar] [CrossRef]
- Yasin, H.J.; Bufler, G. Dormancy and sprouting in onion (Allium cepa L.) bulbs. I. Changes in carbohydrate metabolism. J. Hortic. Sci. Biotechnol. 2007, 82, 89–96. [Google Scholar] [CrossRef]
- Chope, G.A.; Terry, L.A. The role of abscisic acid and ethylene in onion bulb dormancy and sprout suppression. Stewart Postharvest Rev. 2008, 4, 1–7. [Google Scholar]

Disclaimer/Publisher’s Note: The statements, opinions and data contained in all publications are solely those of the individual author(s) and contributor(s) and not of MDPI and/or the editor(s). MDPI and/or the editor(s) disclaim responsibility for any injury to people or property resulting from any ideas, methods, instructions or products referred to in the content. |
© 2024 by the authors. Licensee MDPI, Basel, Switzerland. This article is an open access article distributed under the terms and conditions of the Creative Commons Attribution (CC BY) license (https://creativecommons.org/licenses/by/4.0/).