Abstract
Anthocyanins are important secondary metabolites in plants, which contribute to fruit color and nutritional value. Anthocyanins can be regulated by environmental factors such as light, low temperature, water conditions, and nutrition limitations. Nitrogen (N) is an essential macroelement for plant development, its deficiency as a kind of nutrition limitation often induces anthocyanin accumulation in many plants. However, there is a lack of reports regarding the effect of nitrogen deficiency on anthocyanin biosynthesis in pears. In this study, we found that N deficiency resulted in anthocyanin accumulation in pear callus and upregulated the expression of anthocyanin biosynthesis pathway structural genes (PyPAL, PyCHS, PyCHI, PyF3H, PyDFR, PyANS, and PyUFGT) and key regulatory factors (PyMYB10, PyMYB114, and PybHLH3). Through analysis of transcriptome data of treated pear callus and RT-qPCR assay, a differentially expressed gene PyNAC42 was identified as significantly induced by the N deficiency condition. Overexpression of PyNAC42 promoted anthocyanin accumulation in “Zaosu” pear peels. Additionally, dual luciferase assay and yeast one-hybrid assay demonstrated that PyNAC42 could not directly activate the expression of PyDFR, PyANS, and PyUFGT. Furthermore, yeast two-hybrid and pull-down assays confirmed that PyNAC42 interacted with PyMYB10 both in vivo and in vitro. Co-expression of PyNAC42 and PyMYB10 significantly enhanced anthocyanin accumulation in “Zaosu” pear peels. Dual luciferase assay showed that PyNAC42 significantly enhanced the activation of PyDFR, PyANS, and PyUFGT promoters by interacting with PyMYB10, which suggests that PyNAC42 can form the PyNAC42-PyMYB10 complex to regulate anthocyanin biosynthesis in pear. Thus, the molecular mechanism underlying anthocyanin biosynthesis induced by N deficiency is preliminarily elucidated. Our finding has expanded the regulatory network of anthocyanin biosynthesis and enhanced our understanding of the mechanisms underlying nutrient deficiency modulates anthocyanin biosynthesis in pear.
1. Introduction
Pear (Pyrus spp.) is one of the most important temperate fruit trees in the world [1]. In recent years, red pear fruits have attracted more attention due to their bright color and high commercial value. Red pears obtain their color from the accumulation of anthocyanins, which are a subgroup of the flavonoid family of plant secondary metabolites [2,3,4]. Anthocyanins are widely distributed in plants and play a pivotal role in plant growth and reproduction. They confer vibrant colors to plant tissues, serving as attractive signals for pollinators and seed dispersers. Moreover, they possess the ability to mitigate oxidative damage caused by environmental stresses including ultraviolet radiation and low temperatures, thereby providing protection to plants [5,6,7]. Furthermore, anthocyanins have potential health benefits to the human body, which help to prevent oxidative stress-related neurodegenerative and cardiovascular diseases [8,9].
Anthocyanins are flavonoids derived from the phenylpropanoid pathway, and the structures, biosynthetic pathways, and regulatory genes of anthocyanins have been studied in many plant species [2,3,10,11,12,13,14]. The first step of anthocyanin biosynthesis is the conversion of phenylalanine to trans-cinnamic acid, which is catalyzed by phenylalanine ammonia-lyase (PAL) [10,11,15]. During the early steps of anthocyanin biosynthesis, chalcone synthase (CHS), chalcone isomerase (CHI), flavanone 3-hydroxylase (F3H) and flavonoid 3-hydroxylase (F3’H) activities lead to the production of flavonols and other flavonoid compounds, which are called early biosynthesis genes (EBGs) [2,16,17]. Dihydroflavonol 4-reductase (DFR), anthocyanidin synthase (ANS), and UDP-glucose flavonoid 3-O-glucosyltransferase (UFGT) are involved in the formation of anthocyanins in later stages of the biosynthesis pathway, which are called late biosynthesis genes (LBGs) [2,17,18]. Anthocyanin accumulation is regulated by these structural genes and also by regulatory factors, such as those forming the highly conserved MYB-bHLH-WDR (MBW) protein complex, which consists of the R2R3-Myeloblastosis (MYB) transcription factor (TF), basic helix–loop–helix (bHLH) TF, and tryptophan–aspartic acid repeat (WDR) protein [19,20]. It is generally believed that the MBW complex regulates flavonoid biosynthesis by regulating the expression of structural genes of the flavonoid synthesis pathway [21]. In pear, the R2R3-MYB TF, MYB10, has been proven to play a vital role in the regulatory network of anthocyanin biosynthesis [22,23,24]. Other studies have demonstrated that MYB114 and bHLH3 could work together to regulate anthocyanin biosynthesis in pear fruit [25,26]. In addition to MYB TFs and bHLH TFs, other families of TFs are also involved in regulating anthocyanin biosynthesis in pear [13,26,27]. For example, ERF3 could interact with MYB114 and its partner bHLH3 to co-regulate anthocyanin biosynthesis [26]. ERF9 is shown to directly inhibit the expression of MYB114 by binding to its promoter, thereby inhibiting anthocyanin biosynthesis [13]. BBX16/HY5 complex is proven to activate the expression of MYB10 and CHS, thus promoting anthocyanin biosynthesis in red pears [27].
Anthocyanin biosynthesis could be regulated by external environmental factors, including light, temperature, and water conditions, which have a significant impact on anthocyanin accumulation in pear and other plants [28,29,30,31,32,33,34]. In addition, nutrient restriction is a kind of environmental stress that also affects anthocyanin accumulation [29,35]. Nitrogen (N), an important component of amino acids and proteins, is necessary for plant growth and development [36]. Under N-limited conditions, plants modulate nutrient allocation to improve nutrient efficiency, so that response to environmental stresses [37,38]. This redistribution process is related to anthocyanin accumulation [35,39,40,41]. In Arabidopsis, the pap1-1 mutant, which is defective in PAP1, has a significantly decreased survival rate compared with the wild type under low-N stress [39]. In apples, MdBT2 acts as a negative regulator of nitrogen use, which was shown to inhibit anthocyanin biosynthesis by promoting the ubiquitination and degradation of MdMYB1 (a positive regulator of anthocyanin biosynthesis) in response to nitrate [41,42]. Then the MdBT2 is negatively regulated by MdGRF11, which leads to an increasing abundance of MdMYB1 protein and promotes anthocyanin biosynthesis under nitrate deficiency [35]. In addition, the MdMKK9 protein plays a crucial role in regulating nitrogen status and anthocyanin biosynthesis, which contributes to the adaptation of red apples in low-N environments [43].
Several studies have shown that N deficiency induced anthocyanin accumulation in plants [35,36,40,41,42,43]. However, the effect of N deficiency on pear anthocyanin biosynthesis has not been characterized, and the molecular mechanism by which induced anthocyanin accumulation remains unknown. In this study, we used pear callus as material and found that N deficiency treatment promoted anthocyanin biosynthesis in pear callus. To further clarify the mechanism of N deficiency-mediated anthocyanin biosynthesis, we analyzed the transcriptome of treated callus and identified a pivotal differentially expressed gene PyNAC42, which behaved sensitive to N deficiency. Subsequently, we demonstrated that PyNAC42 acted as a positive regulator in pear anthocyanin biosynthesis. Furthermore, PyNAC42 could interact with PyMYB10 to enhance the expression of PyDFR, PyANS, and PyUFGT. Overall, these findings preliminarily revealed the molecular mechanism by which PyNAC42-mediated N deficiency induced anthocyanin biosynthesis in pear.
2. Materials and Methods
2.1. Plant Materials and Growth Conditions
The species we chose was from the genus Pyrus. The pear callus used in this study was induced from the flesh of Pyrus communis cv. “Clapp’s Favorite” and grown at 25 °C. Two-week-old pear callus was used for treatments. Fruits of the Pyrus pyrifolia Nakai cv. “Zaosu” used for the overexpression assays were collected at 105 days after full bloom (DAFB) in 2023 (Tai’an, China). The tobacco (Nicotiana benthamiana) used for subcellular localization and dual luciferase assays were grown in a glasshouse at 18 °C with 16 h of light and 8 h of darkness. All samples were cut into pieces, frozen in liquid nitrogen, and stored at −80 °C until use.
2.2. Media Components
Callus tissue was grown on plates containing 4.43 g/L Murashige and Skoog Basal Medium with Vitamins (PhytoTech LABS, Lenexa, Kansas, USA), 30 g/L sucrose, and 7.5 g/L agar powder as the MS control. The following N-deficient medium used for the N-deficient treatment was prepared according to previous studies with slight modifications: 0.78 g/L Murashige and Skoog Modified Basal Salt Mixture without Nitrogen (PhytoTech LABS, Lenexa, Kansas, USA), 0.1 g/L Murashige and Skoog Vitamin Powder (PhytoTech LABS, Lenexa, Kansas, USA), 0.5 mMol/L KNO3, 4.5 mMol/L KCL, and 7.5 g/L agar powder [5,14,35]. The working concentration of each component was consistent in both media except nitrogen.
2.3. Total Anthocyanin Measurement
For determination of total anthocyanin contents from pear callus and “Zaosu” pear peels, approximately 0.1 g of each sample was weighed for three replicates. The samples were fully ground with liquid nitrogen and put into 2 mL centrifuge tubes. After adding 1–2 mL pre-cooled 0.1% (v/v) HCL-methanol solution, the sample was incubated at 4 °C in darkness for 24 h. The supernatant was transferred into a new tube after centrifugation, then the absorbance was measured by a microplate reader (SpectraMax iD5, Molecular Devices, Shanghai, China) at 530 nm, 620 nm, and 650 nm. The anthocyanin content was calculated according to the formula: total anthocyanin content (nmol/g) = ODλ × V × 106/(ελ × T), where ODλ = (OD530 − OD620) − 0.1(OD650 − OD620), V represents the final constant volume (mL), and T represents the sample weight (g). ελ = 4.62 × 10⁴ stands for the molar extinction coefficient at 530 nm [44]. Results were reported as the mean ± standard deviation (SD) of three independent experiments.
2.4. Genomic DNA and Total RNA Extraction and cDNA Synthesis
Genomic DNA was extracted from the pear callus for cloning promoter regions using the FastPure® Plant DNA Isolation Mini Kit (Vazyme, Nanjing, China). First, the plant samples were cracked to release the genomic DNA. Second, digested the protein attached to the genomic DNA. Finally, the DNA was purified and stored at −20 °C until use. Total RNA was extracted from the pear callus and “Zaosu” pear peels using the FastPure® Plant Total RNA Isolation Kit (Vazyme, Nanjing, China) according to the manufacturer’s instructions. The concentration and purity of DNA/RNA were determined using a NanoDrop 2000 Spectrophotometer (Thermo Fisher Scientific, Waltham, MA, USA). The RNA (at a concentration of 1000 ng/μL) was then reverse transcribed using the HiFiScript ALL-in-one RT MasterMix for qPCR (CWBIO, Beijing, China).
2.5. Library Construction and RNA Sequencing
The integrity of RNA was assessed using an Agilent 2100 Bioanalyzer (Agilent Technologies, Santa Clara, CA, USA). Oligo (dT) magnetic beads (Thermo Fisher Scientific, Waltham, MA, USA) were used to enrich for mRNA with poly-A tails, and then the mRNA was randomly fragmented in the Fragmentation Buffer (Ambion, Austin, TX, USA). The first strand of cDNA was synthesized using fragmented mRNA as a template and random oligonucleotides as primers. The second cDNA strand was synthesized using the DNA polymerase I system and dNTPs, and then Poly-A tails were added and connected to the sequencing connector. AMPure XP beads (Beckman Coulter, Brea, CA, USA) were used to select cDNA 370–420 bp in length for PCR amplification, and the purified PCR products were used to generate the RNA sequencing (RNA-seq) libraries. The library quality was assessed using a Qubit 2.0 Fluorometer (Thermo Fisher Scientific, Waltham, MA, USA) and Agilent 2100 Bioanalyzer (Agilent Technologies, Santa Clara, CA, USA). Finally, the libraries were sequenced on the I llumina HiSeq 2500 platform (Novogene, Beijing, China).
2.6. Analysis of Transcriptome Data
The raw reads from a total of 6 samples (two groups of three biological replicates) were evaluated for quality using fastQC (version: 0.11.9), the adaptor sequences were removed, and high-quality reads were obtained using Trimmomatic software (version: 0.39) [45,46]. The clean reads were mapped to the “Dangshansuli” (Pyrus bretschneideri) genome using HISAT2 software (version: 2.1) [47,48]. SAMtools software (version: 1.9) (https://github.com/samtools/samtools/, accessed on 20 January 2024) was used for converting and sorting the Sequence Alignment/Map file. Gene expression levels were estimated as Fragments Per Kilobase per Million mapped reads (FPKM) using the FeatureCounts software (version: 1.6.3) and an in-house Python script [49]. The EdgeR package (version: 3.30.3) was used to identify differentially expressed genes (DEGs) from N-deficiency treatment vs. MS control comparison [50]. Genes with |log2 Fold Change| > 1 and False Discovery Rate (FDR) < 0.01 were considered as significant DEGs. The volcano plot was drawn by ggplot2 package in R language [51]. Gene Ontology (GO) enrichment and Kyoto Encyclopedia of Genes and Genomes (KEGG) analyses were performed using TBtools software (version: 2.026) [52]. The principal component analysis (PCA) was performed to test the sample repeatability using “prcomp” function in R language. Ggplot2 package was used to visualize the result of PCA analysis [51].
2.7. Real-Time Quantitative PCR Assay
Real-time quantitative polymerase chain reaction (RT-qPCR) assay was performed to analyze the expression levels of anthocyanin biosynthesis-related genes and candidate DEGs. All primers were designed using Primer Premier 5 software, and primer pairs for RT-qPCR are listed in Table S1. Each reaction system for RT-qPCR was 20 μL and had the following components: 10 μL SYBR GREEN I MasterMix (CWBIO, Beijing, China), 200 ng of template cDNA, 0.4 μL forward primer (10 μM), 0.4 μL reverse primer (10 μM), and ddH2O to a final volume of 20 μL. The amplification reaction was performed on a LightCycler 480 II (Roche, Indianapolis, IN, USA) with the following conditions: one cycle of 5 min at 95 °C; 45 cycles of 3 s at 95 °C, 10 s at 60 °C, and 30 s at 72 °C; and a final 5 min extension at 72 °C. The PyGAPDH in pear served as the internal reference [53]. The relative expression levels of genes were analyzed by using the 2−ΔΔCt method, and figures were drawn using GraphPad Prism 6 software [54]. Three biological replicates were performed for each sample, and the expression was reported as the mean ± SD.
2.8. Phylogenetic Analysis and Sequence Alignment
MEGA-X software was used for generating a maximum likelihood (ML) phylogenetic tree with 1000 bootstrap replicates. The following NAC proteins were used: AtNAC19 (Arabidopsis thaliana (L.) Heynh.), AtNAC32 (Arabidopsis thaliana (L.) Heynh.), AtNAC42 (Arabidopsis thaliana (L.) Heynh.), AtNAC72 (Arabidopsis thaliana (L.) Heynh.), AtNAC78 (Arabidopsis thaliana (L.) Heynh.), AtNAM (Arabidopsis thaliana (L.) Heynh.), BoNAC19 (Brassica oleracea L.), FaRIF (Fragaria × ananassa (Weston) Duchesne ex Rozier), FvRIF (Fragaria vesca L.), LcNAC13 (Litchi chinensis Sonn.), MdNAC1 (Malus domestica Borkh.), MdNAC2 (Malus domestica Borkh.), MdNAC33 (Malus domestica Borkh.), MdNAC42 (Malus domestica Borkh.), MdNAC52 (Malus domestica Borkh.), NtNAC56-like (Nicotiana tabacum L.), PpNAC1 (Prunus persica (L.) Batsch), PpBL (Prunus persica (L.) Batsch), PyNAC42 (Pyrus bretschneideri Rehder), PbrNSC (Pyrus bretschneideri Rehder), SlNAC1 (Solanum lycopersicum L.), and VviNAC60 (Vitis vinifera L.). Above NAC protein sequences are listed in Table S2. The sequence alignment was generated using GeneDoc software (version: 2.7).
2.9. Subcellular Localization Analysis
For the subcellular localization assay, we inserted the coding sequence (CDS) of PyNAC42 into the pCAMBIA1301 vector in frame with green fluorescent protein (GFP). After the recombinant vector (PyNAC42-GFP) was confirmed by sequencing, it was transformed into Agrobacterium (GV3101, WEIDI, Shanghai, China). The bacteria harboring the construct were diluted with infiltration buffer (containing 10 mM MgCl2, 10 mM MES, and 150 μM acetosyringone) to an OD600 of about 1.0 [44]. Then bacteria harboring constructs expressing GFP (as a negative control) or PyNAC42-GFP were infiltrated into the leaves of tobacco (3 weeks old) and incubated in the dark for 72 h. The fluorescence signals were detected using an LSM 900 spectral confocal microscope (Carl Zeiss, Leipzig, Germany).
2.10. Transient Transformation Assay of “Zaosu” Pear Peels
The CDSs of PyNAC42 and PyMYB10 were cloned and separately inserted into pSAK277 vectors. After the recombinant vectors were confirmed by sequencing, they were transformed into Agrobacterium using the freeze–thaw method. The bacteria were resuspended with infiltrating buffer, diluted to an OD600 of approximately 1.0, and incubated at 25 °C for 2 h before infiltration into “Zaosu” pear peels. Five days after infiltration, the infiltrated fruits were collected for phenotypic assessment, anthocyanin measurement, and transcript abundance analysis.
2.11. Dual Luciferase and Yeast One-Hybrid (Y1H) Assays
The 2.0 kb promoter sequences upstream of PyDFR, PyANS, and PyUFGT were amplified and inserted into separate pGreen II 0800-LUC vectors to construct the reporter constructs. The recombinant vectors were transformed into Agrobacterium containing the pSoup helper plasmid. The bacteria were resuspended with infiltration buffer to an OD600 of about 1.0. Bacteria solutions harboring constructs expressing TFs (PyMYB10 and PyNAC42) and those harboring reporter constructs were mixed at a ratio of 9:1 (v/v) and then infiltrated into tobacco leaves for transient expression analysis. Firefly luciferase (LUC) and Renilla luciferase (REN) activities were measured using a microplate reader luminometer (SpectraMax Paradigm, Molecular Devices, Shanghai, China), and the ratio of LUC/REN was calculated to represent promoter activity. The LUC and REN reagents were from the Dual-Luciferase® Reporter Assay System (Promega, Madison, WI, USA).
The CDS of PyNAC42 was cloned to the pB42AD vector and the promoter fragments (2.0 kb) of PyDFR, PyANS, and PyUFGT were cloned to the pLacZi vector, respectively. The primers used to construct recombinant vectors are listed in Table S1. The combination of empty pB42AD vector with the corresponding recombinant pLacZi vector was used as the negative control. Each combination of vectors was transformed into yeast cells (EGY48, WEIDI, Shanghai, China), which were grown on the amino acid-deficient medium SD/-Ura/-Trp (Takara, Ohtsu, Japan) for 3 days at 28 °C. Then each combination of yeast strain was stripped onto SD/-Ura/-Trp+X-Gal media for confirmation. 5-Bromo-4-chloro-3-indolyl β-D-galactopyranoside (X-Gal) was used as the chromogenic substrate.
2.12. Yeast Two-Hybrid (Y2H) Assay
To explore the interactions between PyNAC42 and members of the MBW complex, a Y2H assay was performed. The CDSs of PyMYB10, PyMYB114, and PybHLH3 were cloned into pGADT7 to generate the prey constructs, and the CDS of PyNAC42 was cloned into the pGBKT7 vector as the bait. To illustrate the specificity of the interaction, pGBKT7-53 + pGADT7-T, and pGBKT7-lam + pGADT7-T were used as positive and negative controls, respectively [44]. All primers used to construct recombinant vectors are listed in Table S1. Each combination of vectors was transformed into yeast cells (AH109, WEIDI, Shanghai, China), which were grown on the amino acid-deficient medium SD/-Leu/-Trp (Takara, Ohtsu, Japan) for 3 days at 28 °C. Then the yeast cells were transferred to the amino acid-deficient medium SD/-Leu/-Trp/-His/-Ade for 3 days to observe the results of the interaction relationship. Finally, 10 µL of yeast solution of each combination was dropped onto SD/-Leu/-Trp, SD/-Leu/-Trp/-His/-Ade, and SD/-Leu/-Trp/-His/-Ade/+X-α-Gal media for confirmation. 5-Bromo-4-chloro-3-indoxyl-α-D-galactopyranoside (X-α-Gal) was used to directly detect interaction relationships in Y2H system. The plates were photographed to record the results.
2.13. Pull-Down Assay
For the pull-down assay, the CDSs of PyMYB10 and PyNAC42 were used to construct the PyMYB10-pGEX-4T-1 and PyNAC42-pcold TF vectors, respectively. The recombinant plasmids were transformed into the Escherichia coli strain (BL21, WEIDI, Shanghai, China). Production of the PyNAC42-HIS, GST, and PyMYB10-GST proteins was induced by adding isopropyl-β-D-thiogalactoside (IPTG). Collected the GST and PyMYB10-GST proteins and mixed them with the GST-Sefinose (TM) Resin (BBI, Hong Kong, China) for 8 h at 4 °C, respectively. Then the resin was incubated with PyNAC42-HIS protein for 8 h at 4 °C and finally eluted. The eluted proteins were detected by Western blot (CWBIO, Beijing, China) analysis with anti-GST and anti-HIS antibodies (Abmart, Shanghai, China) according to the manufacturer’s instructions.
2.14. Statistical Analysis
Student’s t-test and one-way ANOVA with Tukey’s post hoc test were used in this study. p < 0.05 was considered significant. GraphPad Prism 6 software was used for data analyses and visualization.
3. Results
3.1. N-Deficiency Treatment Induced Anthocyanin Accumulation in Pear Callus
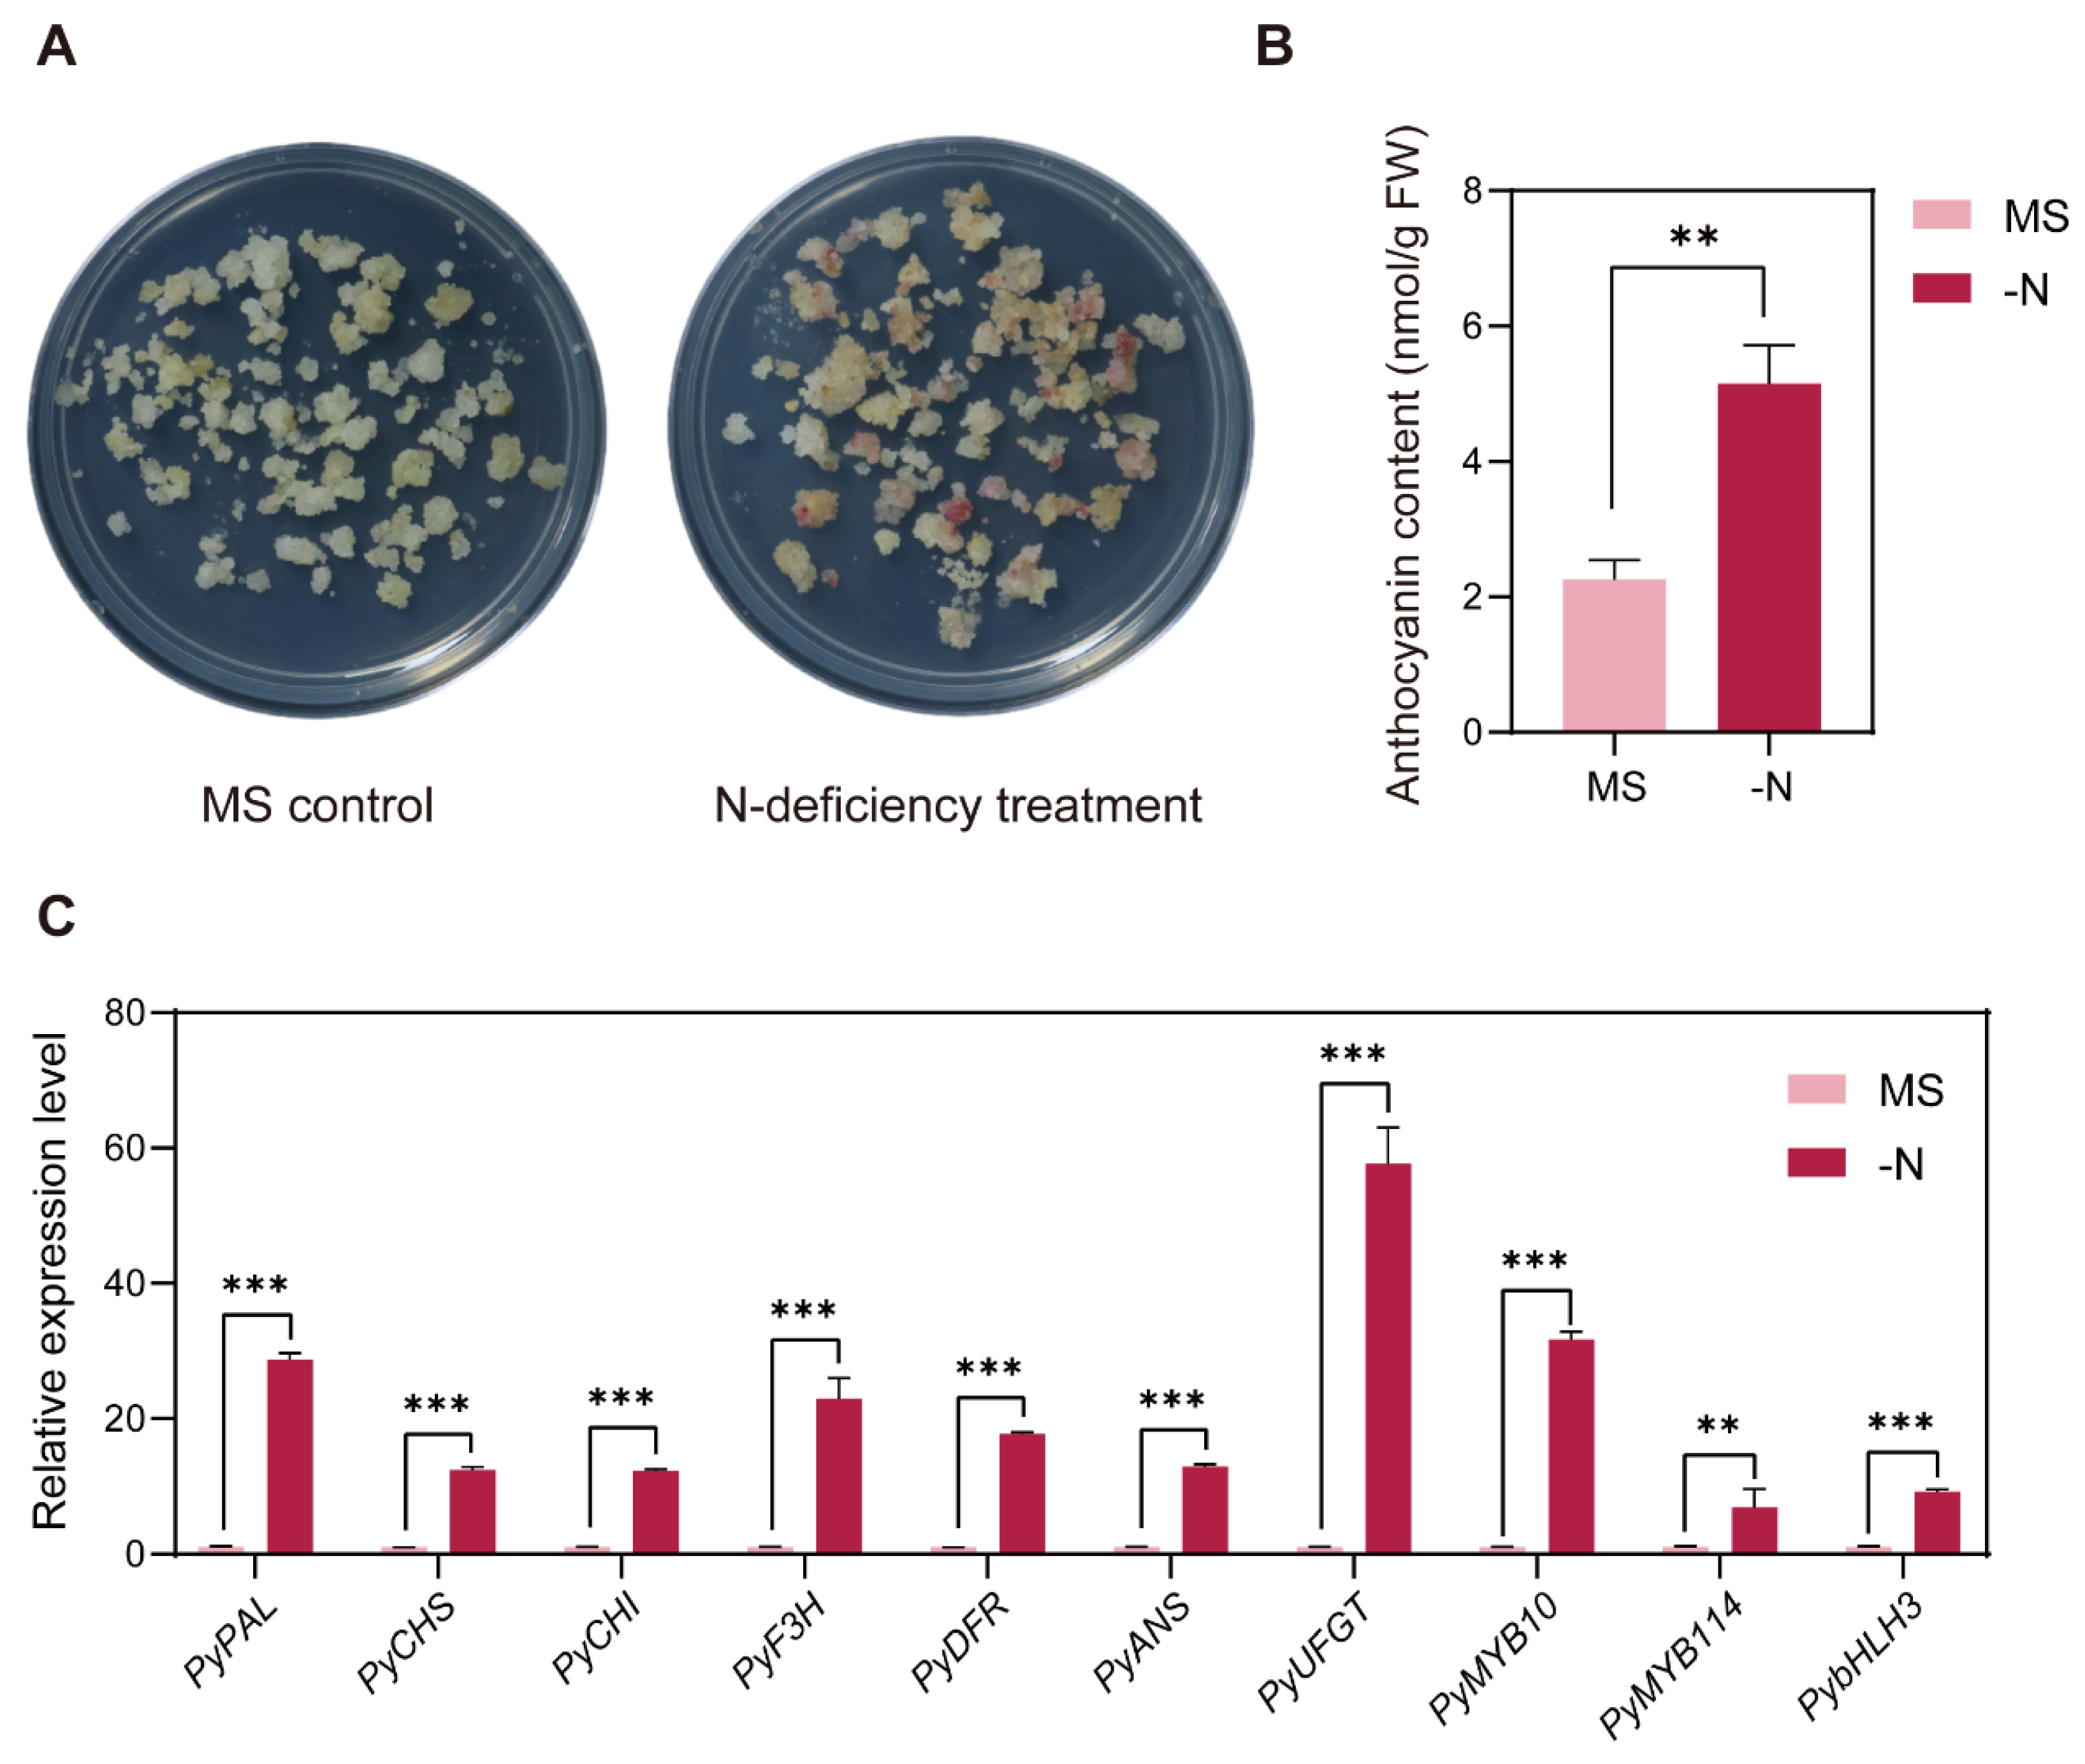
By subjecting pear callus to MS media as the negative control and N-deficient media as the N-deficiency treatment, we observed anthocyanin accumulation in treated pear callus after five days of light (Figure 1A). No color was observed in the MS control callus, while red pigments were observed in the N-deficiency treatment. The anthocyanin contents were consistent with the phenotypic observations. N-deficiency condition significantly induced anthocyanin accumulation in pear callus (Figure 1B). To evaluate the effect of N-deficiency on anthocyanin biosynthesis, we analyzed the expression patterns of anthocyanin biosynthesis pathway structural genes and regulatory factors. Compared to the MS control, N-deficiency treatment significantly upregulated the expression levels of anthocyanin biosynthetic genes PyPAL, PyCHS, PyCHI, PyF3H, PyDFR, PyANS, and PyUFGT, and anthocyanin regulatory factors PyMYB10, PyMYB114, and PybHLH3 (Figure 1C).

Figure 1.
(A) Effects of the MS control (MS) and N-deficiency treatment (-N) on anthocyanin accumulation in pear callus. (B) Total anthocyanin contents of pear callus subjected to two treatments. The X-axis represents (MS) and (-N) treatments. (C) Expression levels of anthocyanin biosynthesis-related genes in pear callus. The data were normalized to the PyGAPDH expression level. The error bars in (B,C) represent the SD (n = 3 independent biological replicates). Student’s t-test was used for statistical analysis (*** p < 0.001; ** p < 0.01.
3.2. Analysis of RNA-seq Data and Identification of DEGs
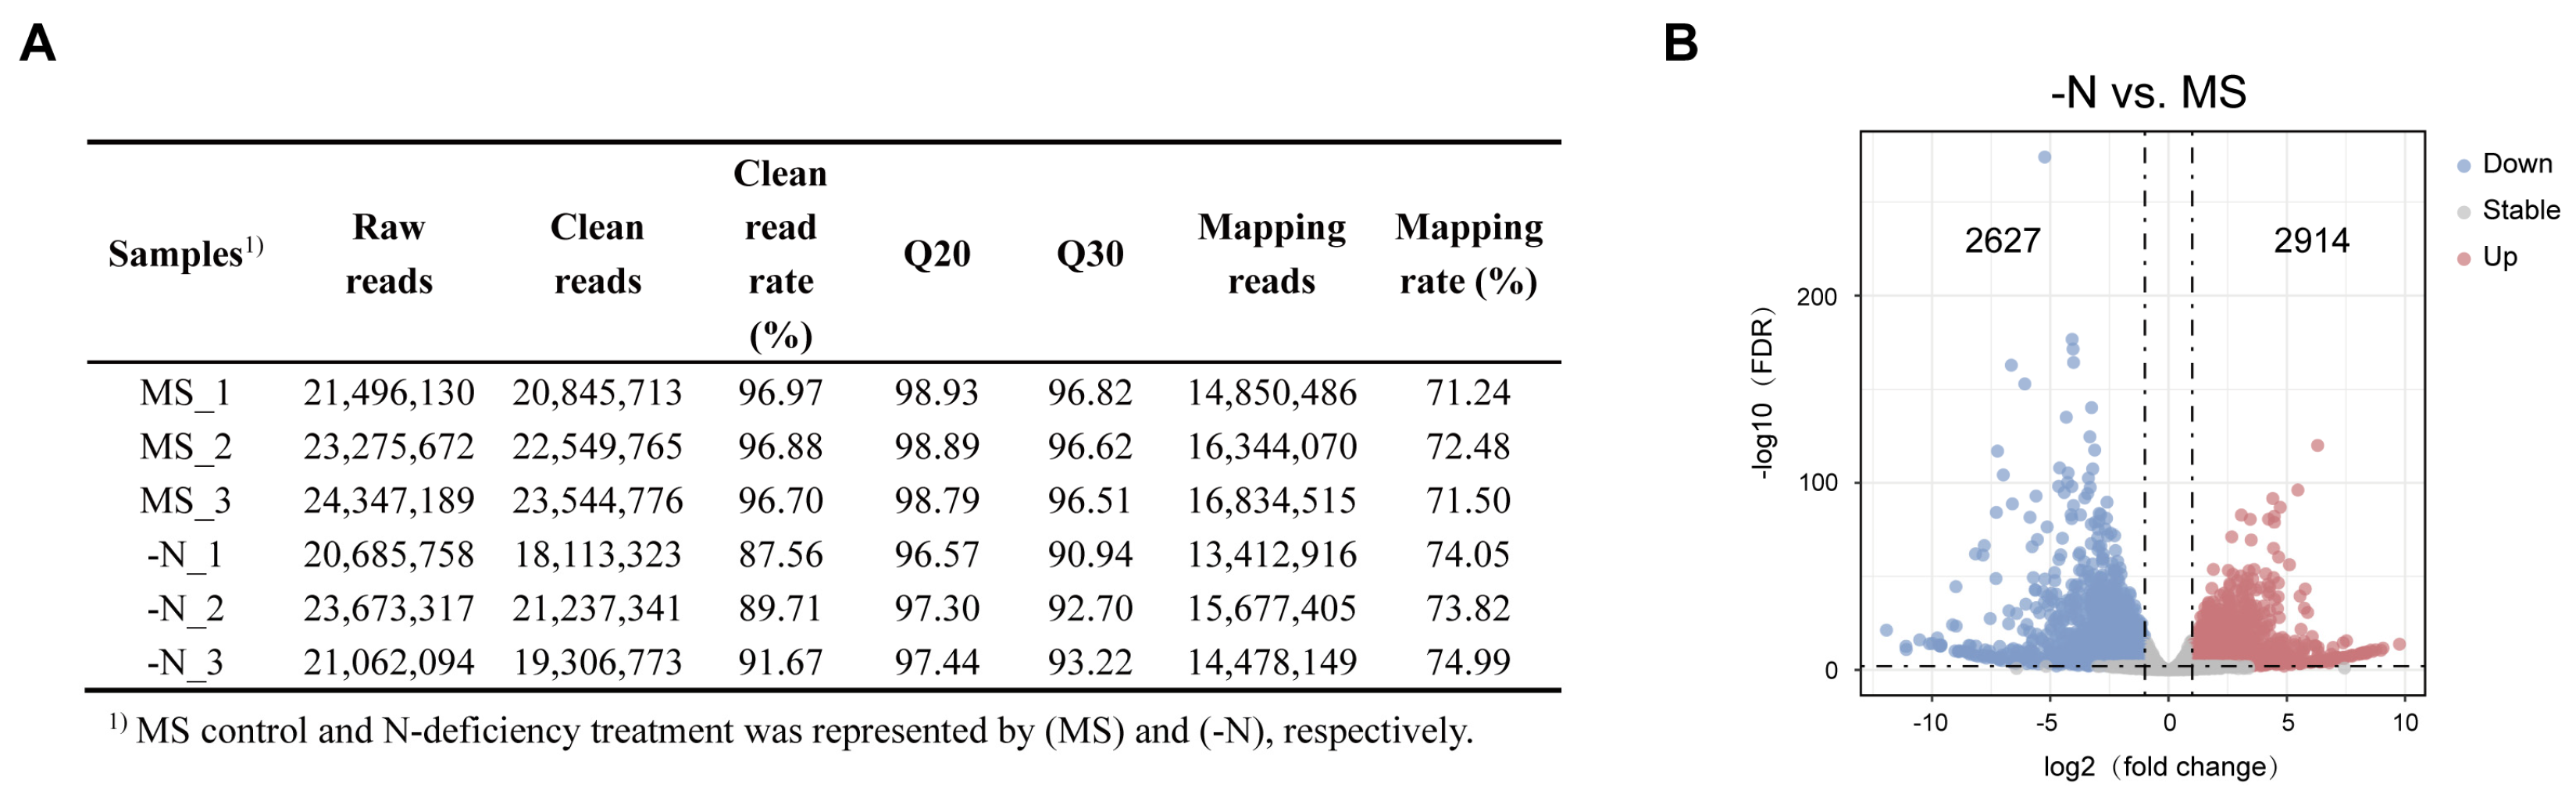
To further study the potential mechanisms of N deficiency-induced anthocyanin biosynthesis in pear callus, we extracted total RNA from two pear callus groups for RNA-seq. We obtained approximately 134.54 million raw reads from six samples (three independent replicates per group) with an average of 22.42 million reads in each sample. After removing adaptor sequences, low-quality reads, and N-containing reads, an average of 20.93 million reads remained for each sample, with an average clean-reads rate of 93.25%. The average Q20 and Q30 values for each library were >97.99% and >94.47%, which confirmed the high quality of the RNA, and the RNA-Seq data could be used for further analyses (Figure 2A). Then we performed the principal component analysis (PCA), and the results showed well separation of the two sample groups (Figure S1).
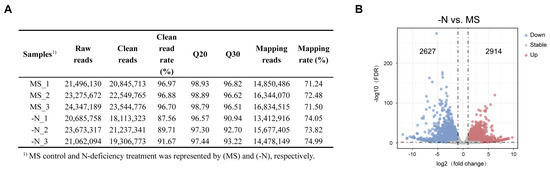
Figure 2.
Analysis of RNA-seq data. (A) Summary of RNA-sequencing data. (B) The volcano plot showed the DEGs in N-deficiency treatment (-N) vs. MS control (MS) comparison. The up- and downregulated genes were represented by red and blue dots, respectively. The dashed lines represent thresholds for differentially expressed genes, with vertical dashed lines indicating |log2 Fold Change| = 1 and the horizontal dashed line indicating -log10 (FDR) = 2.
To estimate the changes in gene expression levels in two groups of pear callus, we identified the DEGs using the following thresholds: |log2 Fold Change| > 1 and FDR < 0.01, and gene expression levels were normalized by FPKM value. We identified a total of 5541 DEGs from the N-deficiency treatment vs. MS control comparison, and the average FPKM value of all genes in all samples was >1, among which 2627 genes were upregulated and 2914 genes were downregulated (Figure 2B).
3.3. Functional Enrichment Analysis of DEGs
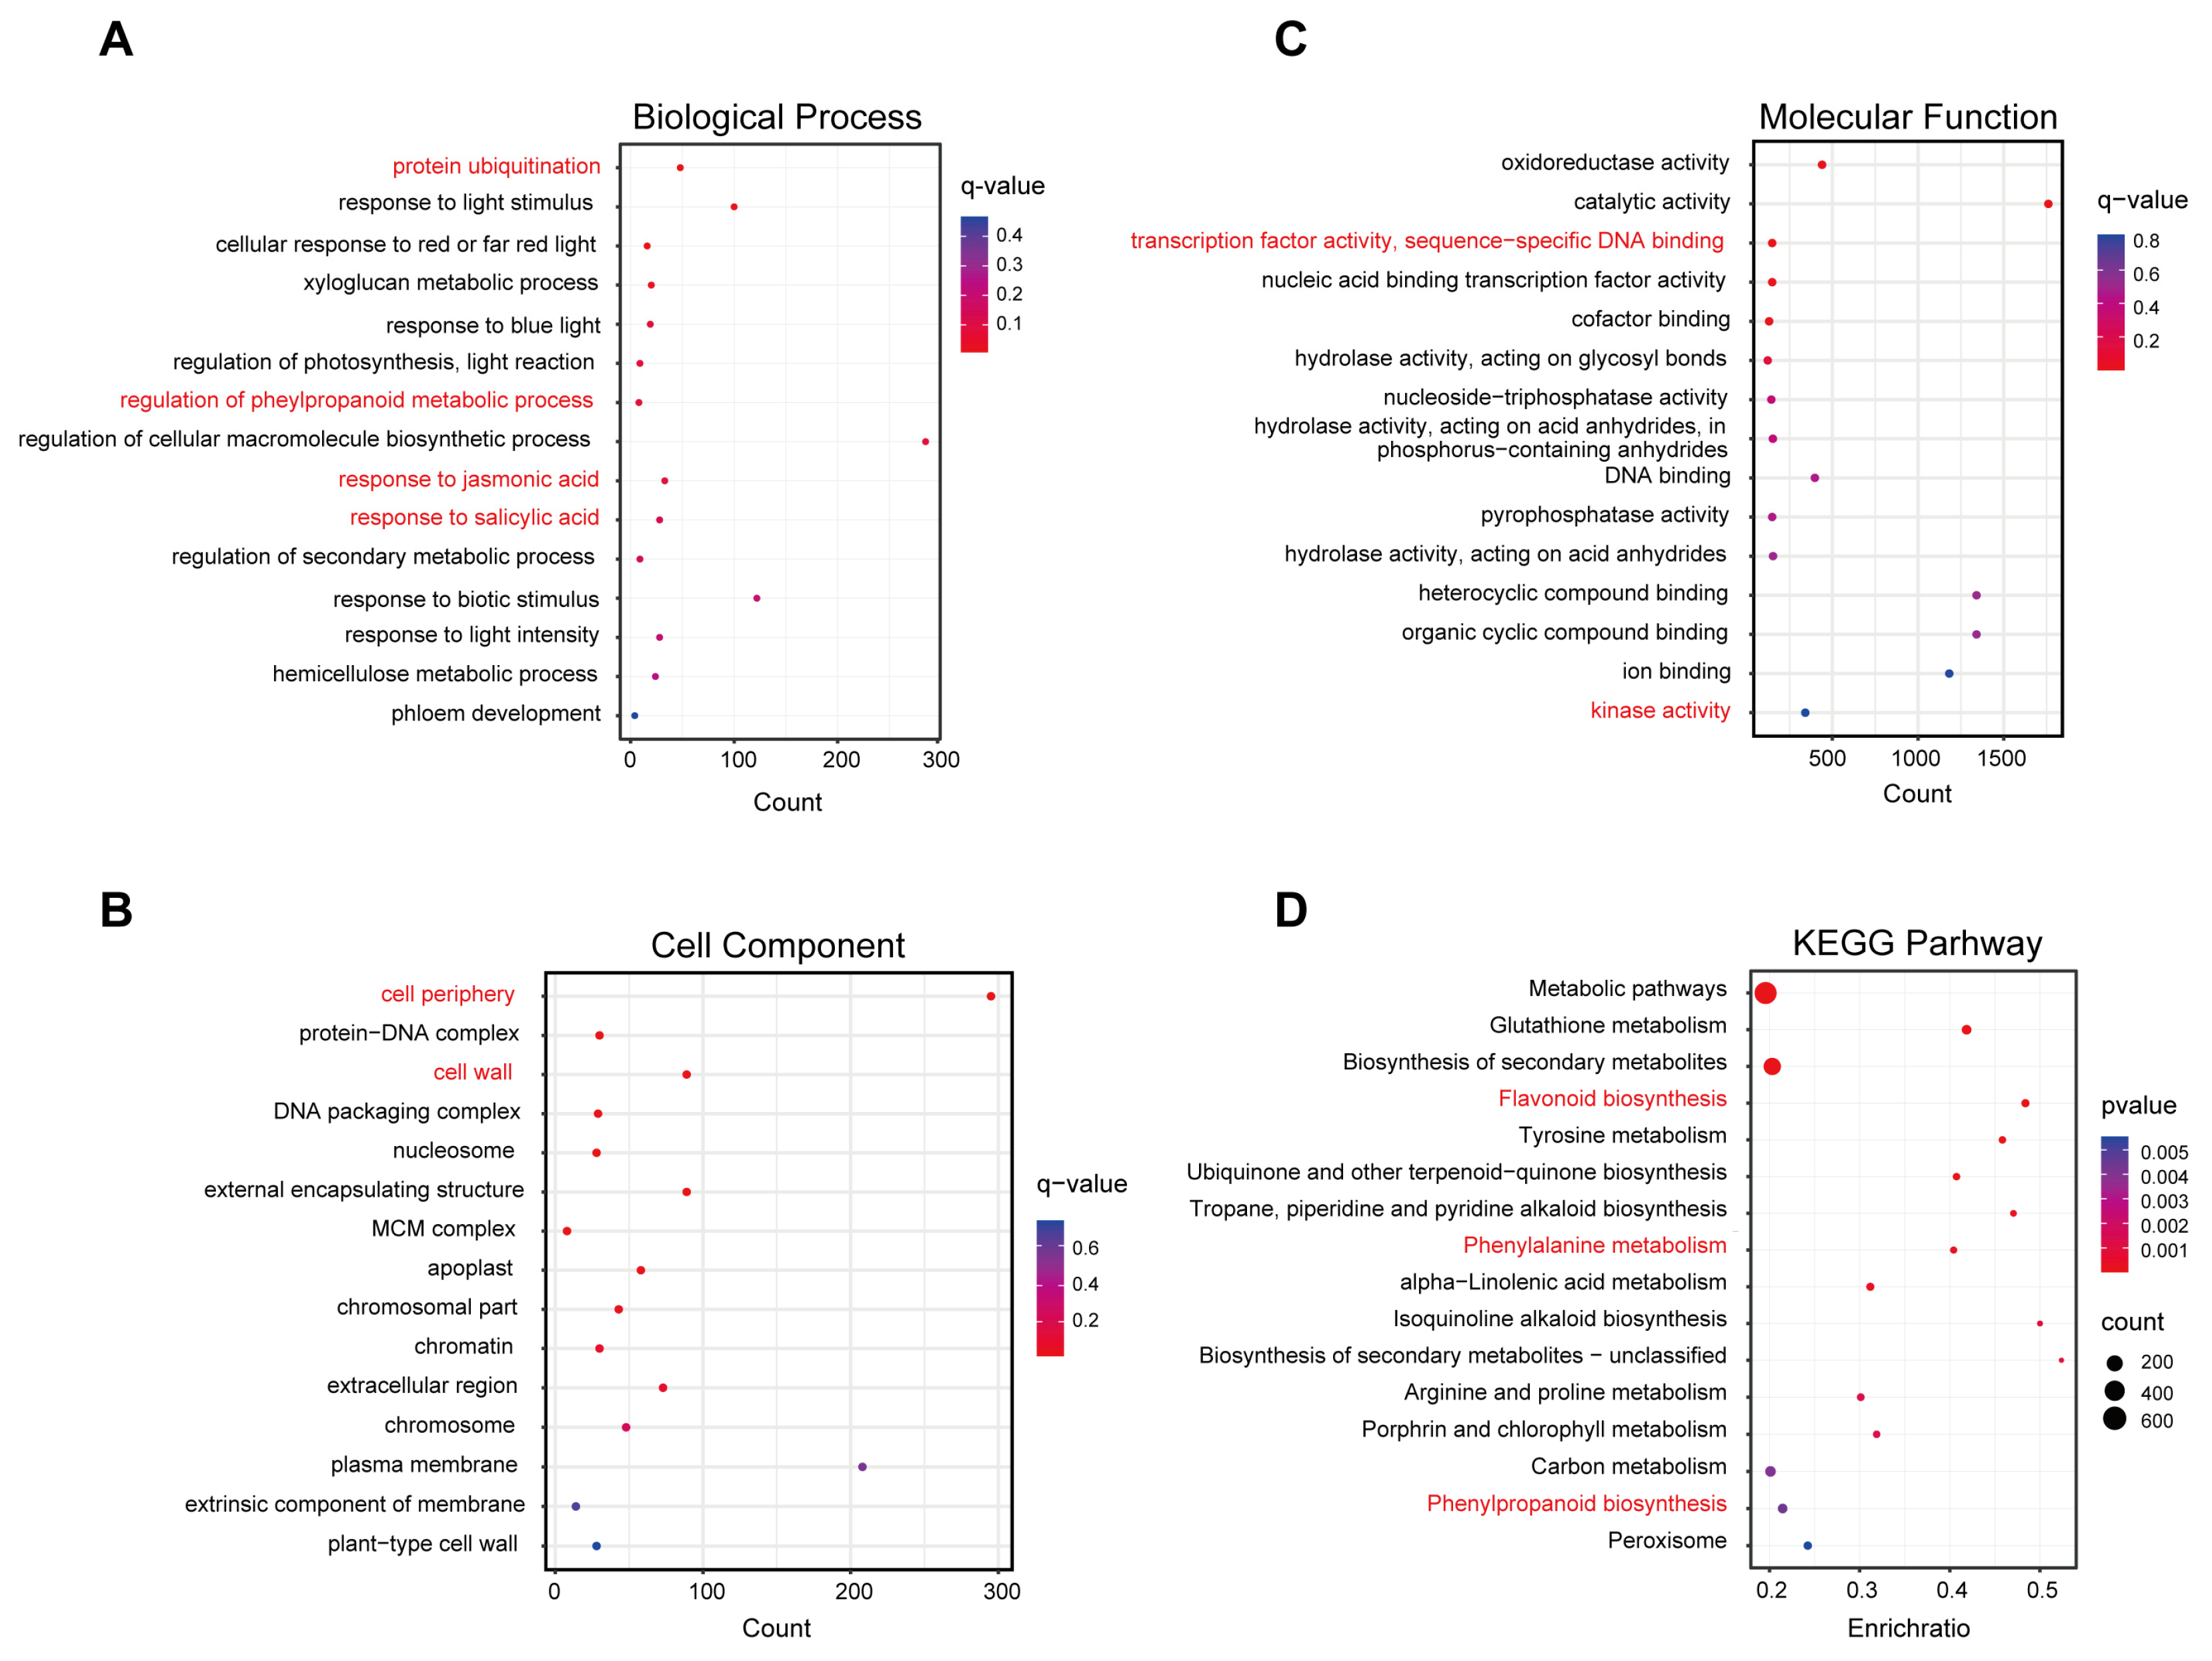
We performed GO enrichment analysis and grouped DEGs into three GO categories: biological process, cellular component, and molecular function to understand their potential functions. For biological process, the results of GO analysis revealed that “protein ubiquitination” “regulation of phenylpropanoid metabolic process” “response to jasmonic acid” and “response to salicylic acid” were significantly enriched terms, suggesting that these processes were significantly affected by N-deficiency treatment. Notably, light-responsive terms were also significantly enriched (Figure 3A). In addition, “cell periphery” and “cell wall” were the important cellular component terms for DEGs and the significantly enriched molecular function terms were “transcription factor activity, sequence-specific DNA binding” and “kinase activity” (Figure 3B,C).
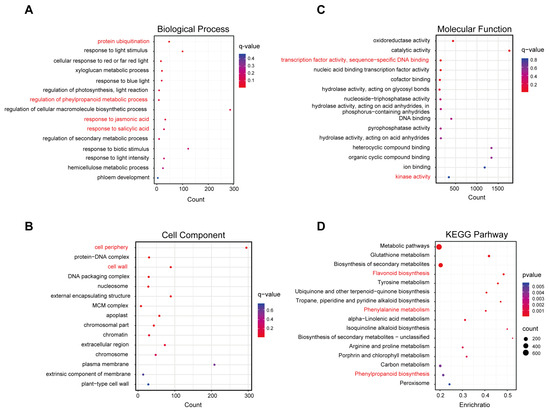
Figure 3.
GO enrichment and KEGG pathway analyses of DEGs from N-deficiency treatment vs. MS control comparison. Bubble diagram showing enriched GO (A) biological process, (B) cellular component, and (C) molecular function terms. (D) Bubble diagram showing enriched KEGG pathways terms. The color represents the significance. The red color corresponds to a higher significance, while the blue color corresponds to a lower significance. The important enriched terms were marked in red.
Furthermore, KEGG analysis was performed for the DEGs to elucidate the biological pathways significantly induced by N-deficiency treatment. The functional analysis showed that N-deficiency significantly enhanced flavonoid biosynthesis, phenylalanine metabolism, and phenylpropanoid biosynthesis pathways (Figure 3D). In addition, biosynthesis of quinones and alkaloids, and several amino acid metabolisms were also significantly correlated with nitrogen deficiency. These results suggested that light and plant hormones responsive genes, secondary metabolites-related genes, and multiple TFs were involved in the regulation of N deficiency-induced anthocyanin biosynthesis in pear callus.
3.4. Validation of RNA-seq Data and Screening of Candidate DEGs
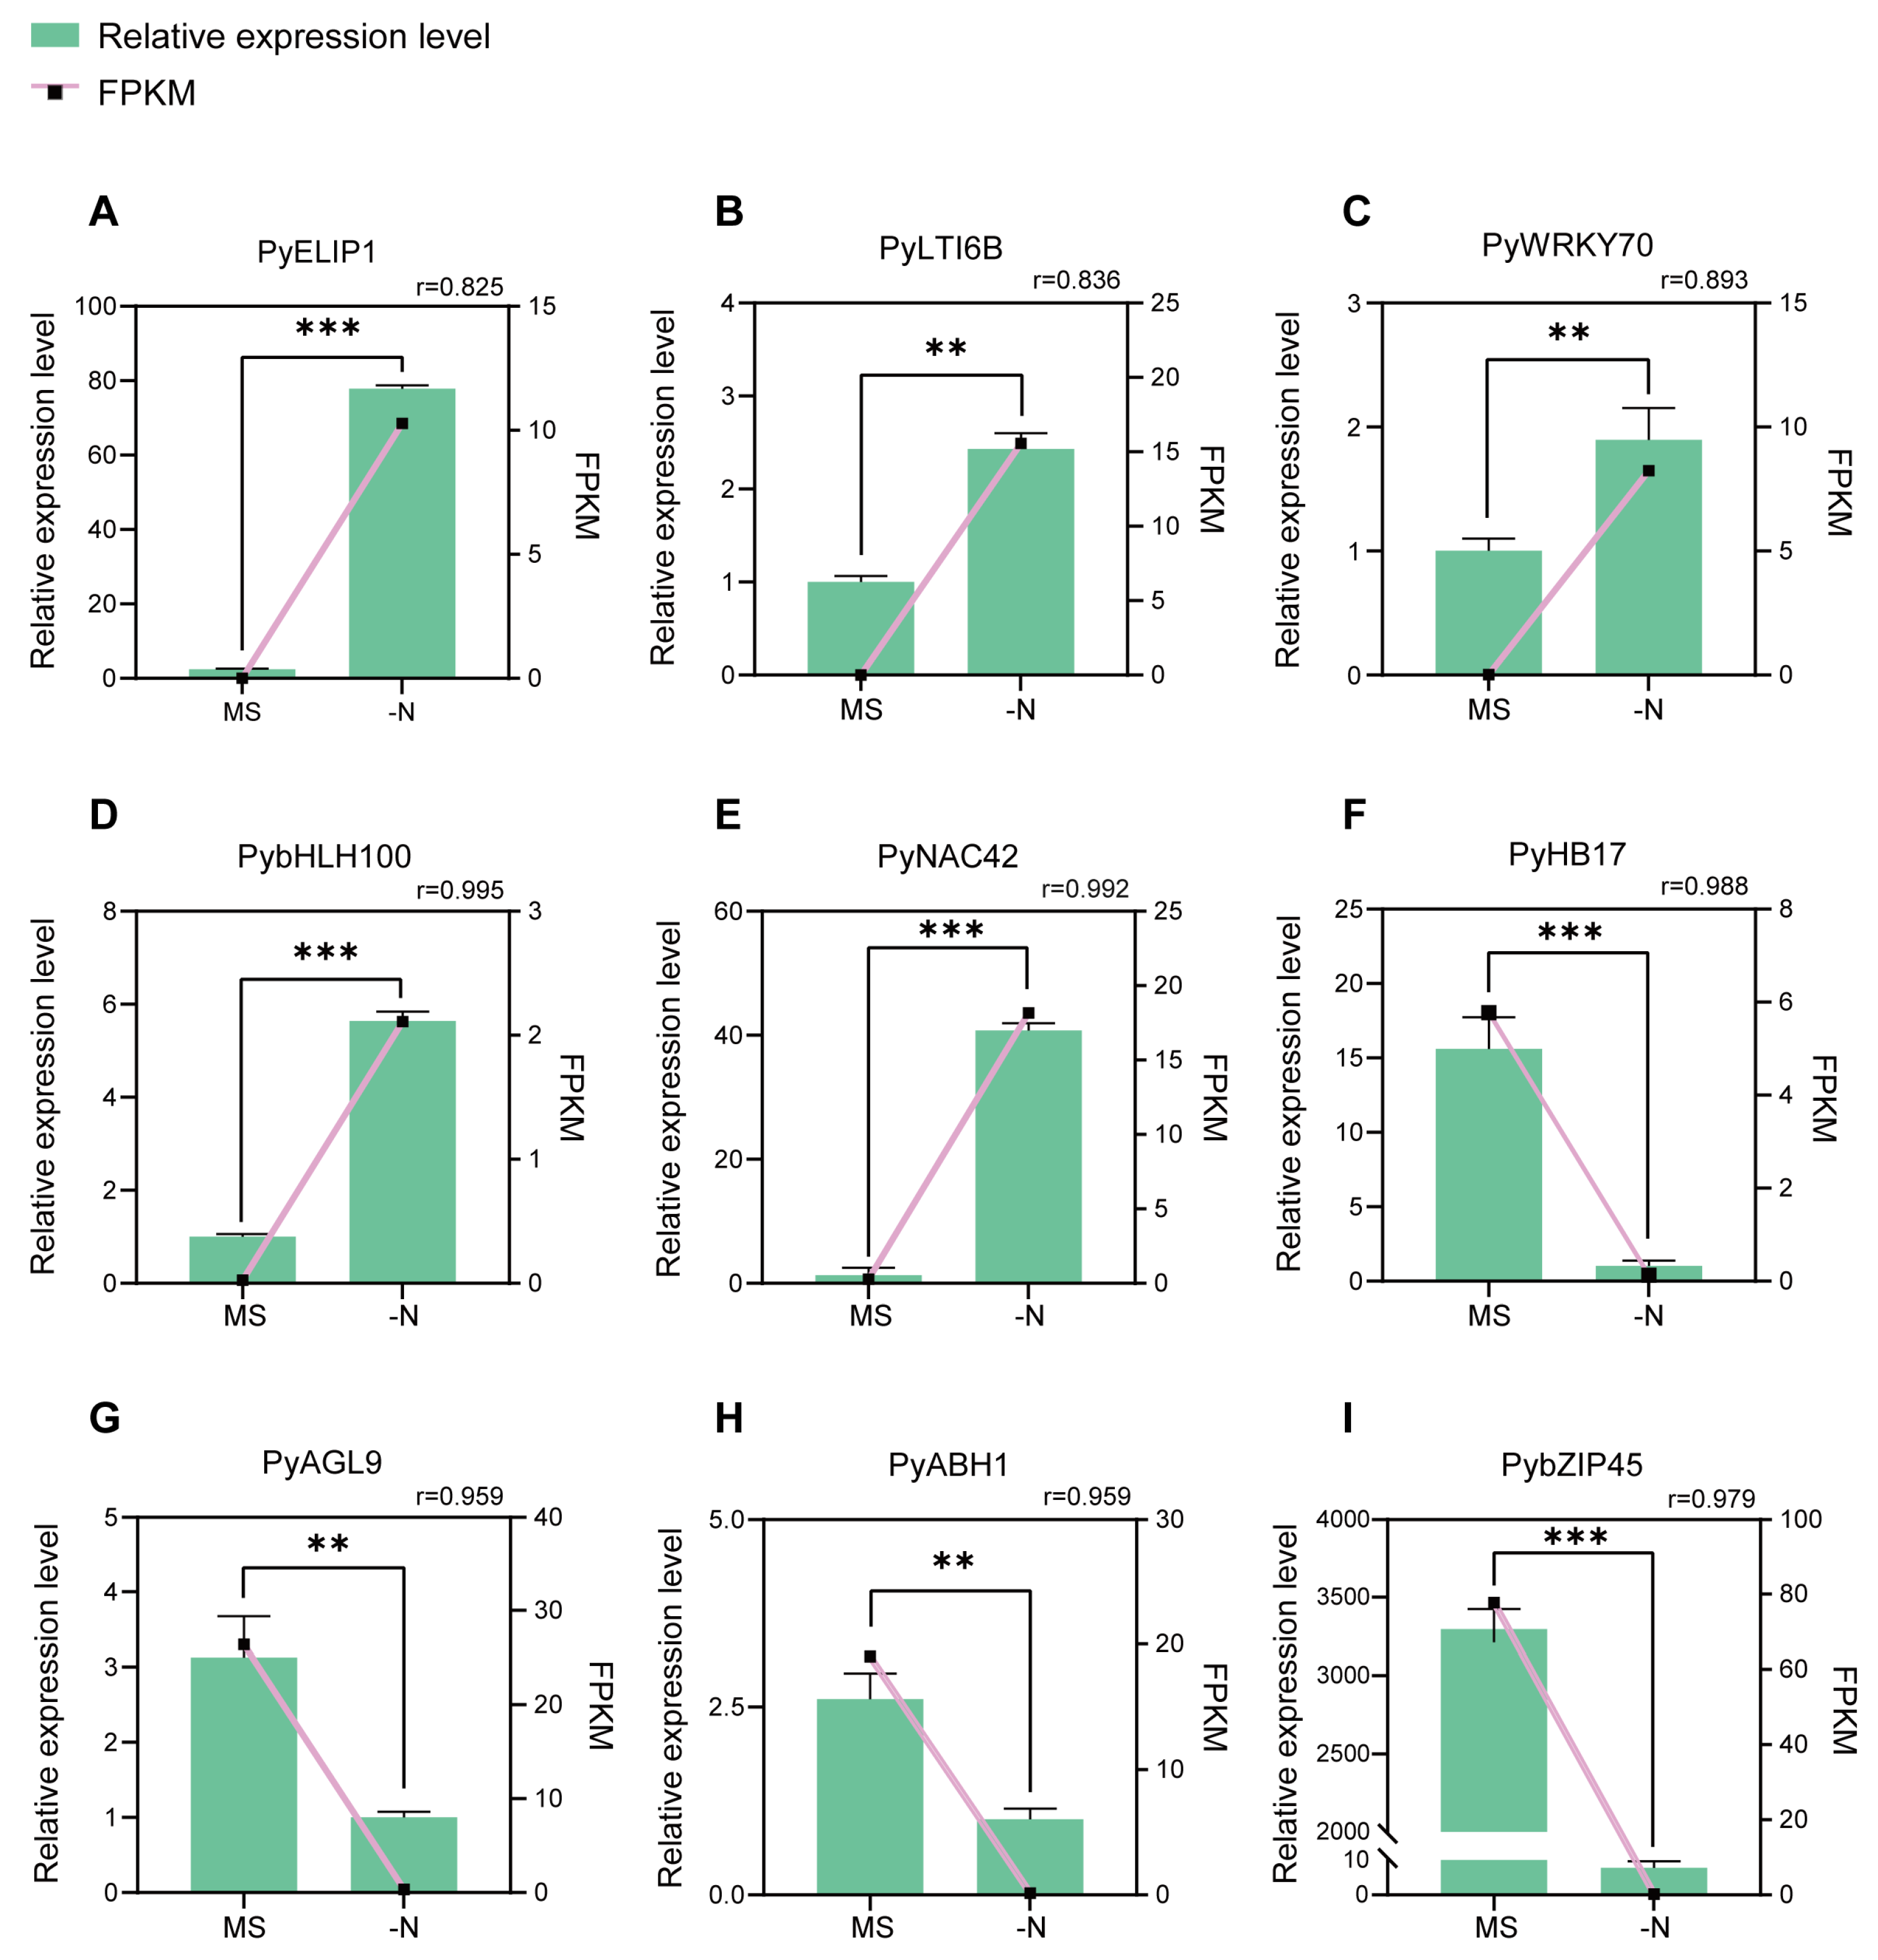
Based on the analysis of RNA-seq data, we selected the following nine top candidate DEGs from the N-deficiency vs. MS control comparison (Table 1). To demonstrate the reliability of the RNA-seq data, we calculated the Pearson correlation coefficients between the expression levels and FPKM values of nine candidate DEGs. There was a high correlation between the relative expression levels from RT-qPCR and the FPKM values from RNA-seq (average Pearson correlation coefficients = 0.94), which indicated the validity of RNA-seq data (Figure 4).

Table 1.
Basic information for nine candidates differentially expressed genes.
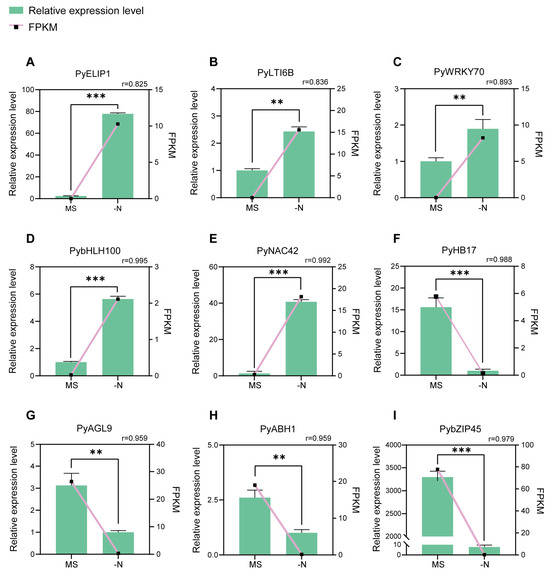
Figure 4.
RT-qPCR validation of nine candidate DEGs from RNA-Seq data analysis. (A–I) The relative expression of nine candidate DEGs in MS control (MS) and N-deficiency treatment (-N). The columns represent the relative expression levels from RT-qPCR (left y axis) The lines represent FPKM values from the RNA-seq data (right y axis). The Pearson correlation coefficient (r) values between FPKM and the relative expression levels are shown. The error bars mean the SD (n = 3). Student’s t-test was used for statistical analysis (*** p < 0.001; ** p < 0.01).
Then we focused on a gene Pbr002372.1, which is annotated as NAC42/JUB1. The results of the RT-qPCR assay revealed that PyNAC42 was hardly expressed in MS control, while significantly upregulated in N-deficiency treatment, suggesting that PyNAC42 was intensively induced by N deficiency (Figure 4). Furthermore, NAC42/JUB1 has been reported to play a significant role in response to drought, heat, and salinity tolerance in Arabidopsis and Solanum lycopersicum [55,56,57]. However, the function of PyNAC42 in pear is still unknown and needs to be characterized. Moreover, the expression pattern of PyNAC42 was positively correlated to anthocyanin content and the Pearson correlation coefficient between the two was 0.97, which suggests that PyNAC42 may act as a positive regulator. These preconditions led us to select a gene such as PyNAC42 with potentially powerful regulatory functions for further investigation.
3.5. Phylogenetic Analysis and Subcellular Localization of PyNAC42
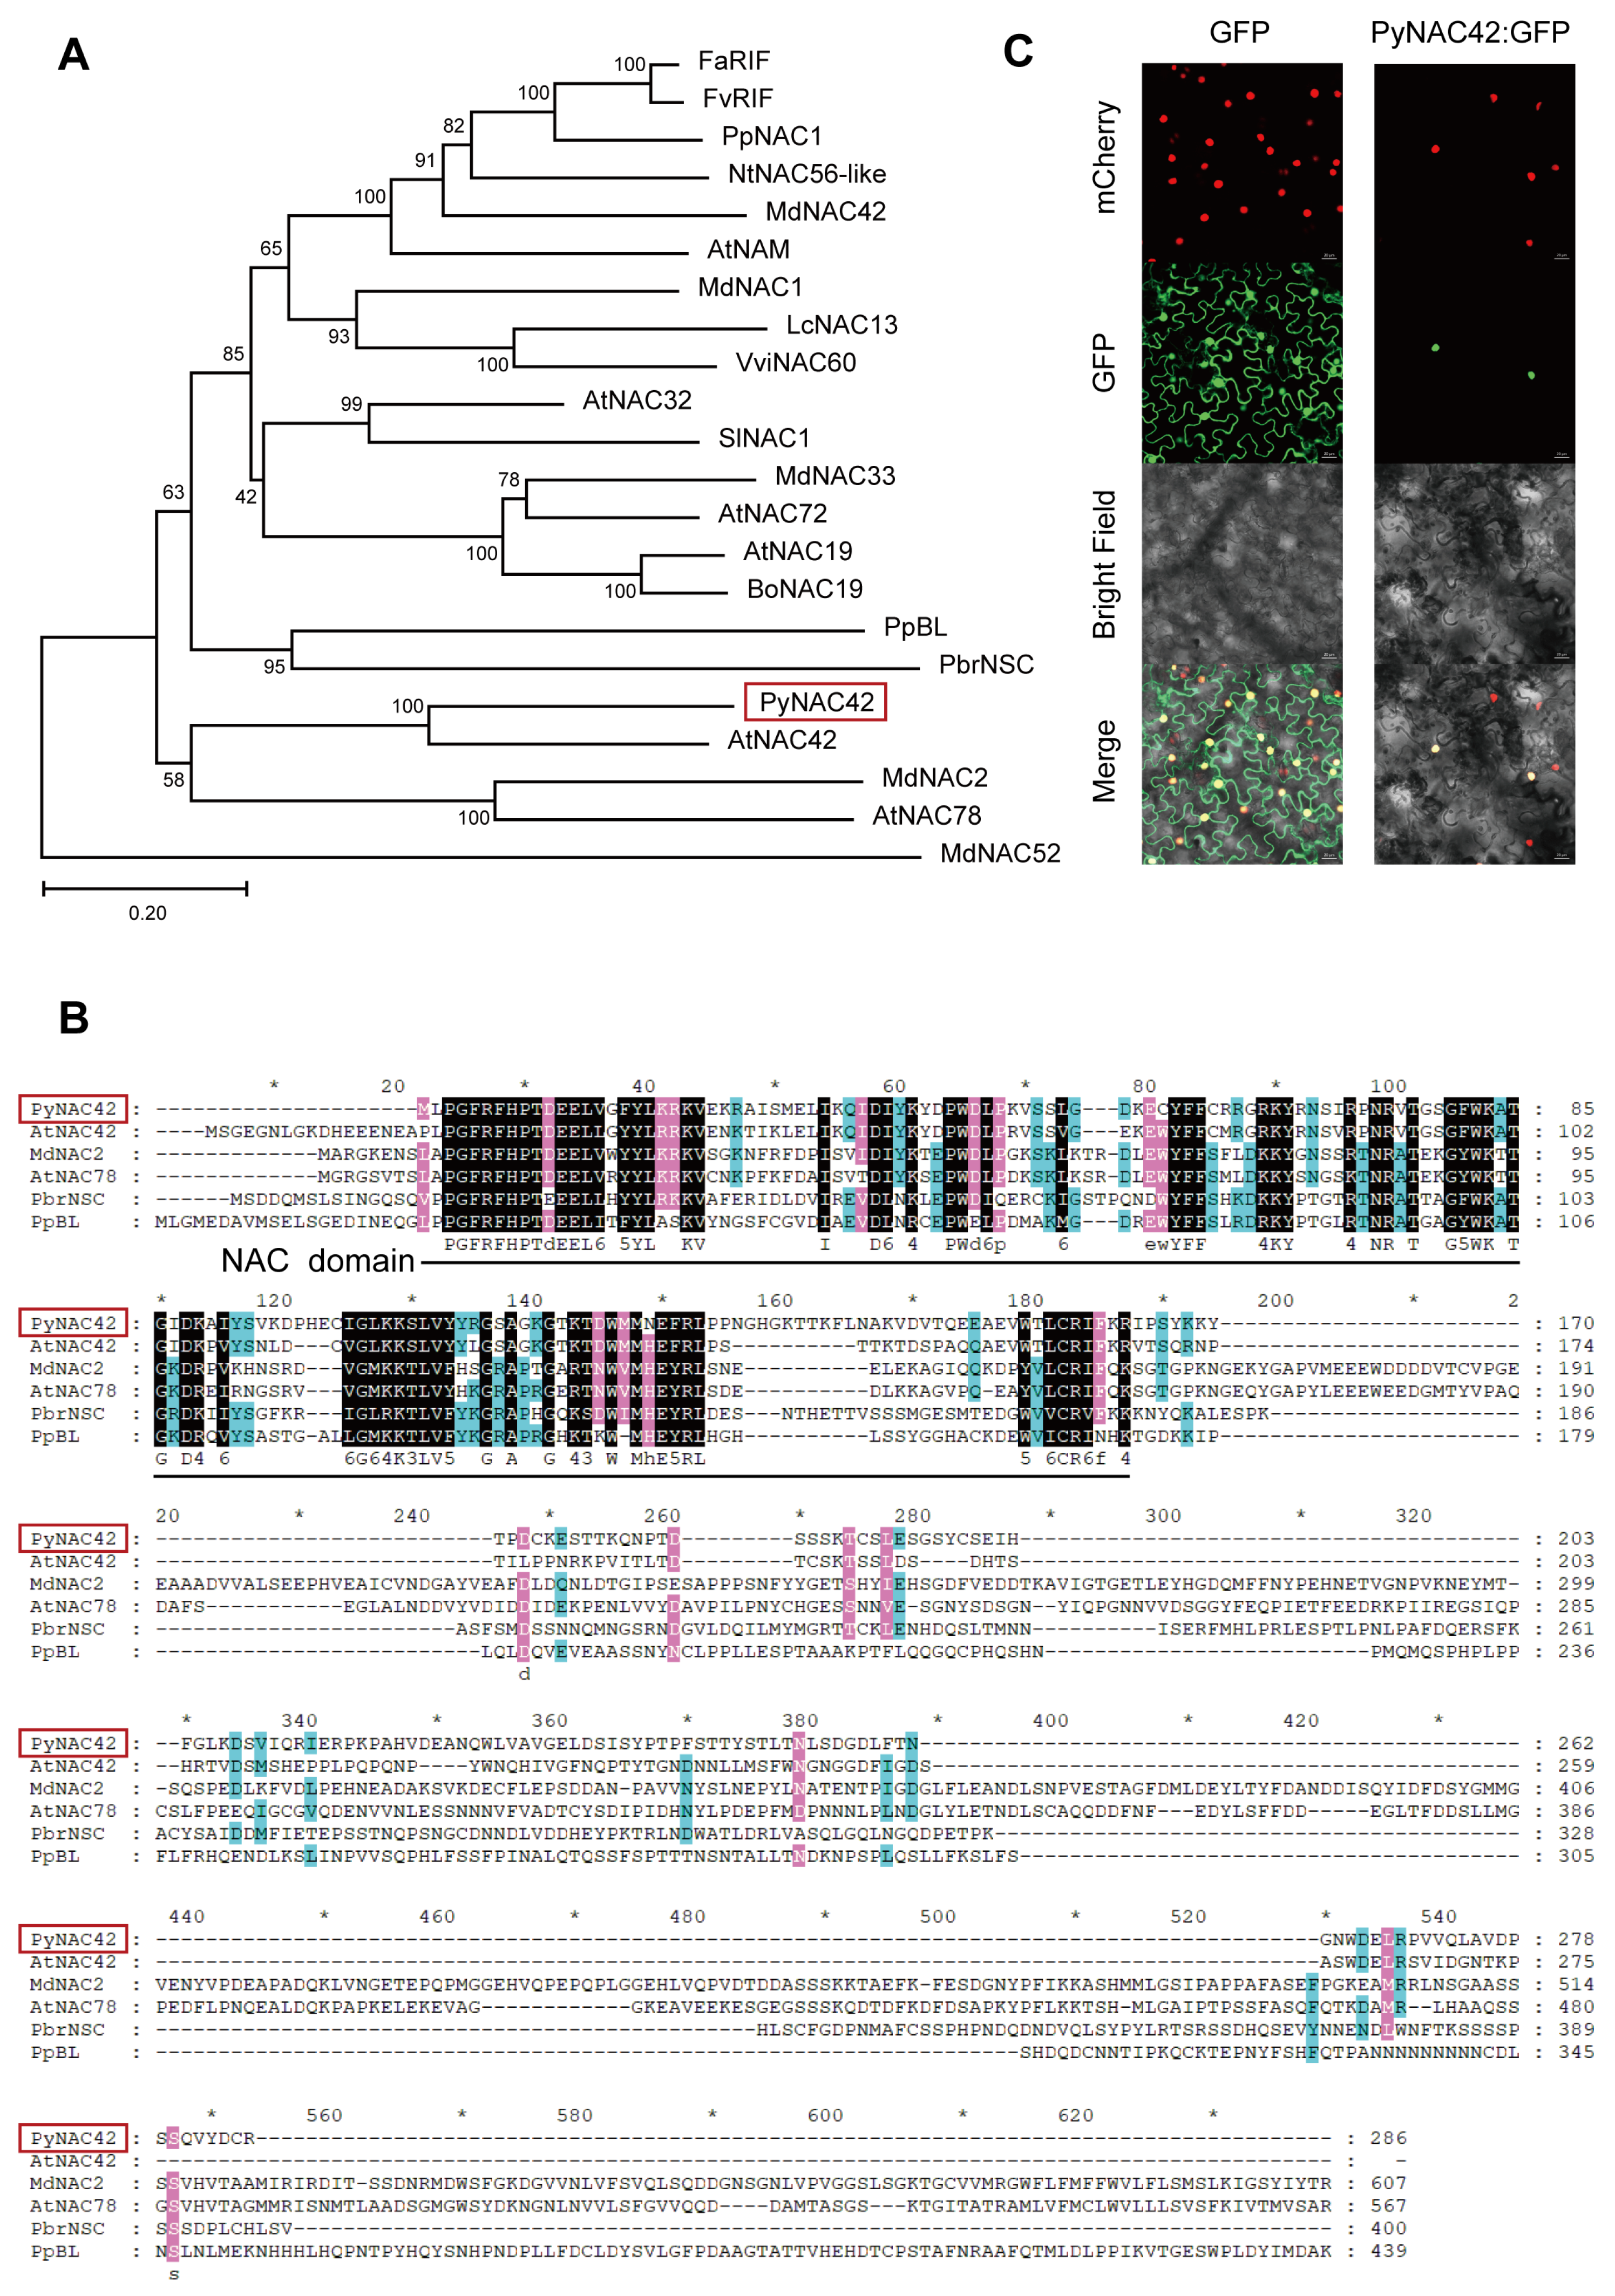
PyNAC42 encodes a NAC transcription factor (NAM, ATAF1/2, and CUC2). By constructing a phylogenetic tree using MEGA-X, we found that PyNAC42 is clustered into the same clade as Arabidopsis thaliana AtNAC42 (JUB1) (Figure 5A), indicating that PyNAC42 shares the highest similarity with AtNAC42. NAC TFs generally share similar structural features, including a NAC domain, which comprises nearly 160 amino acid residues [58,59]. Amino acid sequence alignment showed that PyNAC42 protein contains one conserved NAC domain in the N terminal (Figure 5B).
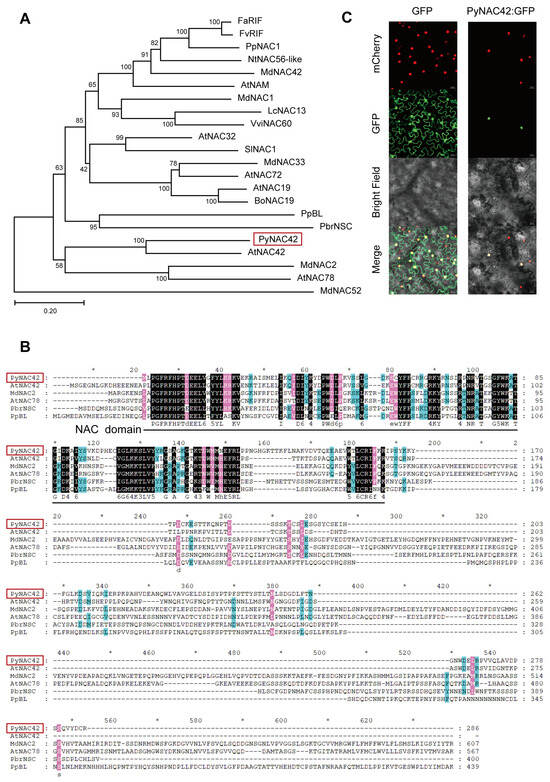
Figure 5.
(A) Phylogenetic relationship between PyNAC42 (marked with a red frame) and other NAC TF from different species (for a complete list of species, see Table S2). (B) Amino acid sequence alignment of NAC TF PyNAC42 (marked with a red frame), AtNAC42, MdNAC2, AtNAC78, PbrNSC, and PpBL. (*) represents the omitted number of amino acids. The shading color indicates the level of conservation in the amino acid sequence, which is categorized into three levels denoted by black, pink, and blue respectively based on their degree of conservatism. (C) Detection of fluorescence signals in tobacco leaf transformed with PyNAC42-GFP. In the detection, mCherry was used to show the nuclear localization. Bars represent 20 μm.
To determine the subcellular localization of PyNAC42, we fused the CDS of PyNAC42 with GFP and transformed PyNAC42-GFP and empty GFP (as the negative control) vectors into tobacco leaves, respectively. After 3 days of darkness, green fluorescence signals from PyNAC42-GFP could be detected specifically in the nucleus, while signals from the empty GFP vector were detected in both the nucleus and cell membrane (Figure 5C). The results suggested that PyNAC42 localizes in the nucleus.
3.6. Overexpression of PyNAC42 Induced Anthocyanin Accumulation in “Zaosu” Pear Peels
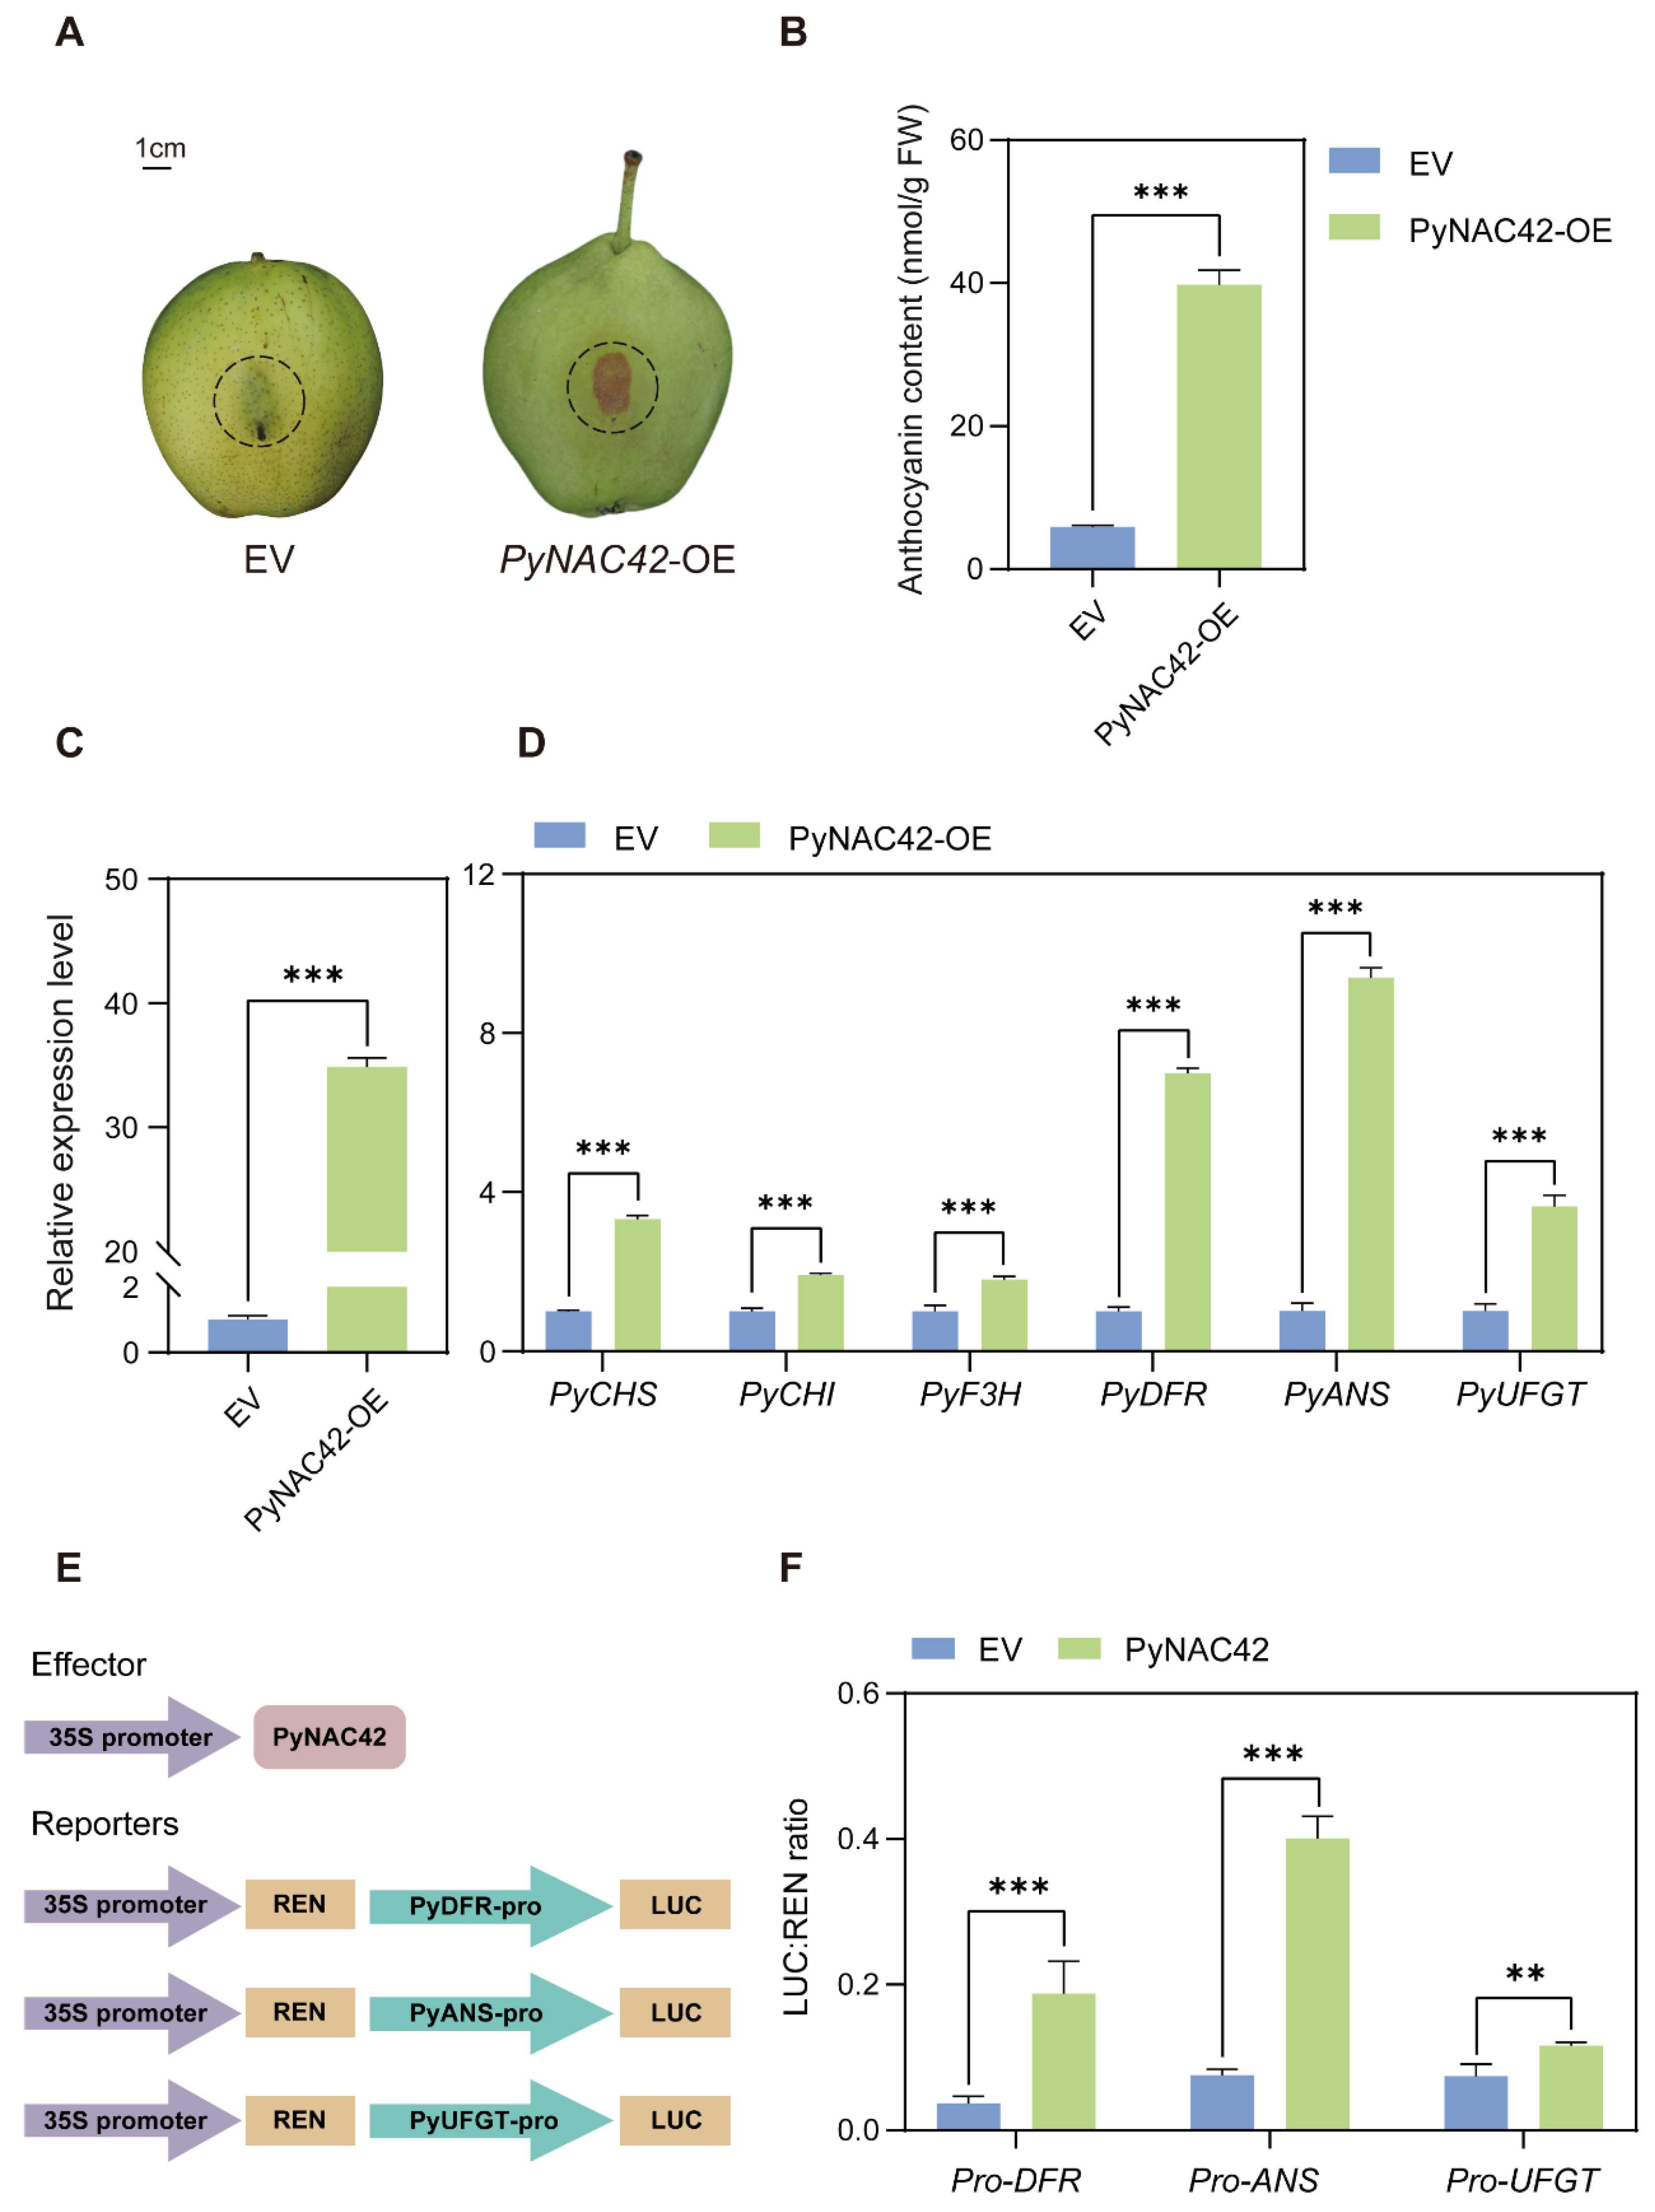
To investigate the role of PyNAC42 in anthocyanin biosynthesis in pears, we performed a transient transformation assay. Overexpressed PyNAC42 and empty vector (as the negative control) into “Zaosu” pear peels, respectively. At 5 days after agroinfiltration, no pigmentation was observed on the peels infiltrated with the empty vector (EV), while red pigmentation was observed at the site infiltrated with PyNAC42 (Figure 6A). Then, the anthocyanin contents in the infiltrated areas were measured. The total anthocyanin content in the area overexpressing PyNAC42 was significantly higher compared with that infiltrated with EV (Figure 6B). To explore the mechanism by which PyNAC42 regulated anthocyanin biosynthesis, we analyzed the expression patterns of anthocyanin structural genes by RT-qPCR. After overexpression of PyNAC42, the expression levels of PyCHS, PyCHI, PyF3H, PyDFR, PyANS, and PyUFGT were significantly increased (Figure 6D). The results indicated that PyNAC42 could promote anthocyanin accumulation in “Zaosu” pear peels and upregulate the expression levels of anthocyanin biosynthesis pathway structural genes.
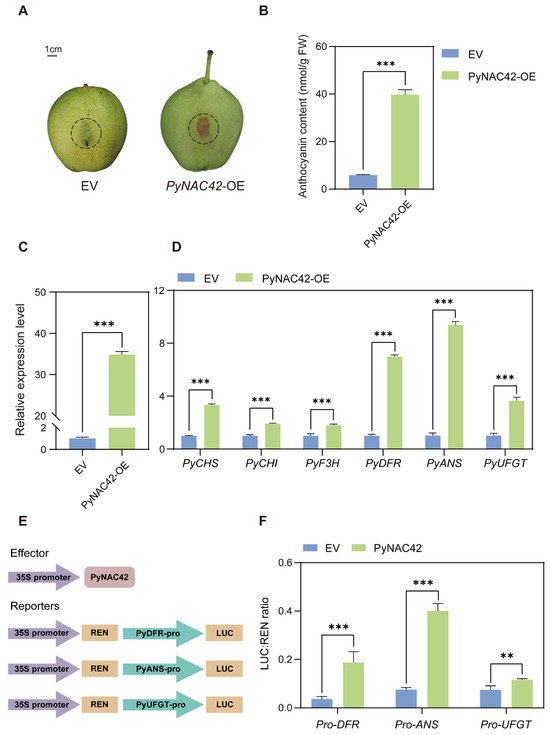
Figure 6.
(A–D) Functional analysis of the role of PyNAC42 in anthocyanin biosynthesis in “Zaosu” pear peels. (A) Phenotypes of “Zaosu” pear peels transiently transformed with the empty vector (EV) and a vector overexpressing PyNAC42 (PyNAC42-OE). The injection areas were outlined in dash circles. (B) Anthocyanin contents of “Zaosu” pear peels. The X-axis represents two treatments. Expression levels of (C) PyNAC42 and (D) anthocyanin biosynthesis structural genes in pear peels. The data were normalized to the PyGAPDH expression level. (E,F) Effect of PyNAC42 on the promoter activity of anthocyanin biosynthesis structural genes. (E) Vector construction for effector and reporters used in dual luciferase assay. (F) Activation effect of PyNAC42 on promoters of PyDFR, PyANS, and PyUFGT. The error bars are SD (n = 3). Student’s t-test was used for statistical analysis (*** p < 0.001; ** p < 0.01).
3.7. PyNAC42 Activated the Expression of PyDFR, PyANS and PyUFGT
Previous studies have shown that three LBGs PyDFR, PyANS, and PyUFGT play critical roles in the regulation of anthocyanin accumulation in pears [2,60,61]. To explore the regulatory relationship of PyNAC42 to the above LBGs, the dual luciferase assay was performed. We constructed the reporter constructs (Figure 6E), and co-transformation of PyNAC42 or EV (as the negative control) with the promoters of PyDFR, PyANS, and PyUFGT, respectively, into tobacco leaves. After three days of infiltration, the activities of LUC and REN were measured, and the ratio of LUC/REN represents the transcriptional activation activities of promoters. The results showed that PyNAC42 activated the expression of PyDFR, PyANS, and PyUFGT (Figure 6F). However, further investigation by Y1H assay revealed that PyNAC42 could not bind to the promoters of these structural genes (Figure S2), indicating that there might be co-factors working with PyNAC42 to induce anthocyanin biosynthesis.
3.8. PyNAC42 Interacts with PyMYB10
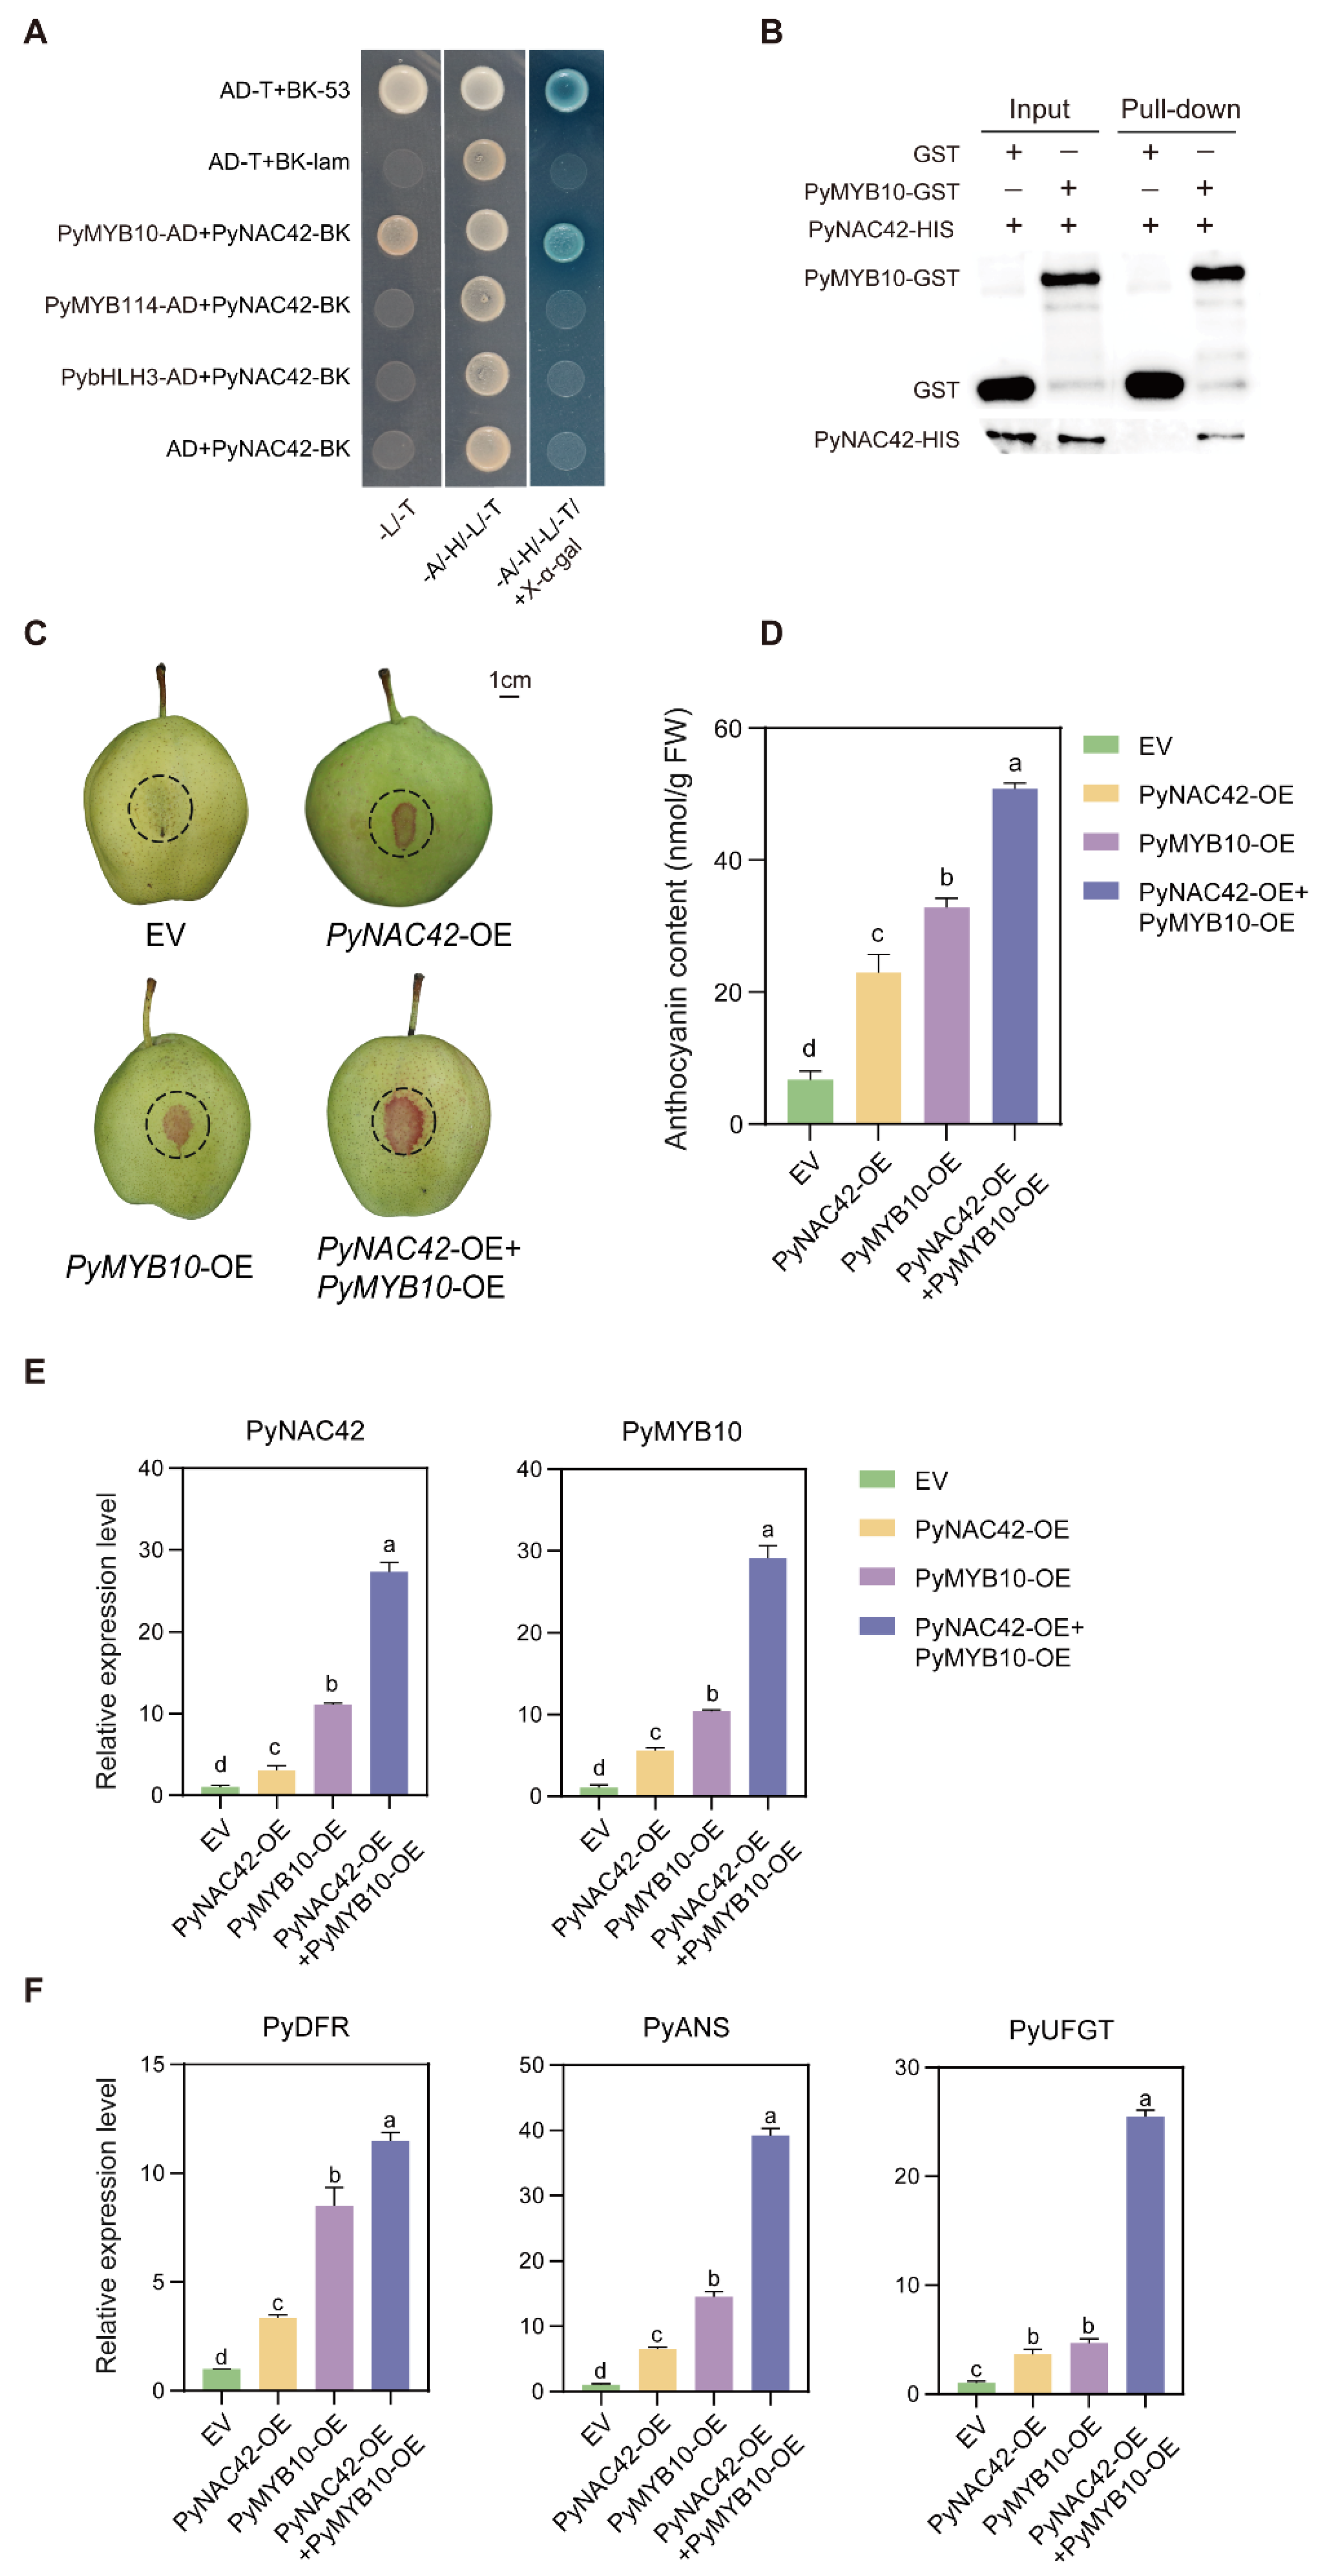
Based on the above results, we found that PyNAC42 could not directly activate the expression of anthocyanin structural genes, which led us to consider that PyNAC42 might act via other TFs. The previous studies revealed that NAC TFs could co-regulate anthocyanin biosynthesis with MYB TFs [62,63,64]. PybHLH3 is a member of the MBW complex in pear, which acts as a partner with MYB TFs to co-regulate anthocyanin biosynthesis [25,26]. To explore the interaction between PyNAC42 and the key MYB TFs PyMYB10 and PyMYB114, and PybHLH3 in pear, the Y2H assay was performed. PyMYB10, PyMYB114, and PybHLH3 were inserted into separate pGADT7 vectors, and PyNAC42 was cloned into the pGBKT7 vector. All transformed yeast cells grew normally on SD/-Leu/-Trp amino acid-deficiency medium, while only the yeast cells transformed with the positive control and the PyMYB10-AD + PyNAC42-BK combination grew normally on SD/-Leu/-Trp/-His/-Ade/±X-α-Gal media, demonstrating that PyNAC42 interacts with PyMYB10, but not with PyMYB114 or PybHLH3 (Figure 7A).

Figure 7.
(A,B) PyNAC42 interacts with PyMYB10 both in vivo and in vitro. (A) Y2H assay of interactions between PyNAC42 and PyMYB10, PybHLH3, and PyMYB114. Yeast cells were plated on SD/-Leu/-Trp, SD/-Leu/-Trp/-His/-Ade, and SD/-Leu/-Trp/-His/-Ade/+X-α-Gal media. Growth trend aligned with that of the positive control indicates an interaction between the two proteins. (B) Pull-down assay. GST and the PyMYB10-GST fusion protein were bound to GST-Sefinose Resin and incubated with the PyNAC42-HIS protein, respectively. The PyMYB10-GST fusion protein could pull down the PyNAC42-HIS fusion protein, which indicated that PyNAC42 interacts with PyMYB10 in vitro. (C–F) Functional analysis of the effects of the interaction between PyNAC42 and PyMYB10 on anthocyanin biosynthesis in “Zaosu” pear peels. (C) Phenotypes, (D) total anthocyanin contents, and (E,F) expression levels of PyNAC42, PyMYB10, PyDFR, PyANS, and PyUFGT in “Zaosu” pear peels. The X-axis represents four treatments. PyGAPDH was used as reference gene for RT-qPCR, and one-way ANOVA with Tukey’s post hoc test was used for statistical analysis. Different letters indicate a significant difference between means.
To validate the results of Y2H, we prepared GST, PyMYB10-GST, and PyNAC42-HIS proteins for pull-down assay. The GST and PyMYB10-GST proteins were mixed with GST-tag Resin, respectively, and the PyNAC42-HIS protein was separately incubated with two resins then eluted. The eluted proteins were detected by Western blot analysis with GST and HIS antibodies. We found that the PyNAC42-HIS fusion protein was pulled down by the PyMYB10-GST fusion protein but not the GST protein, which confirmed the interaction between PyNAC42 and PyMYB10 (Figure 7B). In summary, both in vivo and in vitro experimental results showed that PyNAC42 physically interacts with PyMYB10.
To further demonstrate the effect of the interaction between PyNAC42 and PyMYB10 on anthocyanin biosynthesis in pear, co-transformed PyNAC42 and PyMYB10 into “Zaosu” pear peels for analysis of anthocyanin content and transcriptional expression levels. Consequently, we conducted four groups as follows: (1) “Zaosu” pear peels infiltrated with the empty vector (EV); (2) pear peels infiltrated with PyNAC42; (3) pear peels infiltrated with PyMYB10; and (4) pear peels co-transformed with PyMYB10 and PyNAC42. The injection areas were outlined in dash circles (Figure 7C). Notably, group (2) and (3) were co-transformed with EV to balance the concentration. The results showed that overexpression of PyNAC42 or PyMYB10 promoted anthocyanin accumulation in pear peels. Furthermore, the total anthocyanin content in fruit peels co-transformed of PyMYB10 and PyNAC42 was significantly higher than that in peels only transformed of PyMYB10 or PyNAC42 (Figure 7D). In addition, there was a significant increase in expression levels of PyDFR, PyANS, and PyUFGT when co-transformed of PyMYB10 and PyNAC42 (Figure 7F). Therefore, the interaction between PyNAC42 and PyMYB10 enhanced the anthocyanin accumulation effect.
3.9. PyNAC42 Enhanced the Activation of PyMYB10 to PyDFR, PyANS and PyUFGT
To further explore the effects of interaction between PyNAC42 and PyMYB10 on the three LBG promoter activities, we conducted dual luciferase assays according to the reporter constructs (Figure 8A). Notably, PyNAC42 and PyMYB10 were co-transformed with EV to balance the concentration. The results of assays showed that PyNAC42 or PyMYB10 could activate the expression of PyDFR, PyANS, and PyUFGT. Co-infiltration of PyMYB10 and PyNAC42 significantly enhanced the expression of PyDFR, PyANS, and PyUFGT (Figure 8B). Additionally, previous studies have revealed that PyMYB10 could directly bind to the promoters of LBGs to activate their expression [65]. Therefore, these results indicated that PyNAC42 can work with PyMYB10 and significantly enhance the activation of PyMYB10 to PyDFR, PyANS, and PyUFGT through the formation of the PyNAC42-PyMYB10 complex.
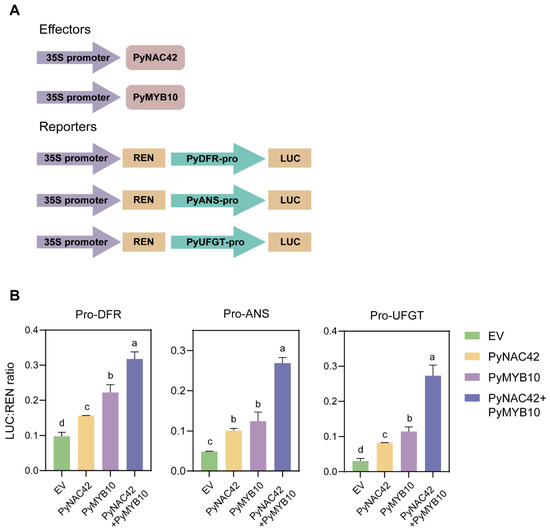
Figure 8.
Effects of PyNAC42-PyMYB10 complex on the promoter activation of LBGs. (A) Vector construction for effectors and reporters used in dual luciferase assays. (B) Activation of the promoters of PyDFR, PyANS, and PyUFGT by four treatments. X-axis represents the group of four treatments. Specifically, EV was added to balance the concentration when PyNAC42/PyMYB10 was co-injected with each promoter. The error bars are SD (n = 3). One-way ANOVA with Tukey’s post hoc test was used for statistical analysis, and different letters indicate p < 0.05. The LUC/REN ratio represents the promoter activity.
4. Discussion
4.1. N Deficiency Promoted Anthocyanin Accumulation in Pear Callus
Anthocyanins are water-soluble plant pigments that are important determinants of the quality and market value of fruits and fruit-derived products [66]. Anthocyanin biosynthesis is controlled by many factors, including environmental conditions [28,29,30,31]. N deficiency is a common environmental stress that induces anthocyanin accumulation in many plants, such as Arabidopsis and Malus domestica [35,40,41]. In this study, we used the pear callus as material to determine the impact of N deficiency on anthocyanin biosynthesis in pears. The results showed that N-deficiency treatment promoted anthocyanin accumulation in pear callus and significantly upregulated the expression levels of anthocyanin biosynthesis pathway structural genes PyPAL, PyCHS, PyCHI, PyF3H, PyDFR, PyANS, and PyUFGT, and key regulatory factors PyMYB10, PyMYB114 and PybHLH3 (Figure 1). Additionally, one interesting finding in “Fuji” apple showed that high N has decreased the expression of anthocyanin biosynthesis structural genes MdPAL, Md4CL, MdF3H, MdANS, and MdUFGT, and regulatory factors MYB TFs and bHLH TFs, which in turn corroborates our findings in pear [67]. Since the apples and pears all belong to the Rosaceae family, the regulatory mechanisms governing anthocyanin biosynthesis in apples can serve as valuable references for pears.
4.2. Effects of N Deficiency on Anthocyanin Biosynthesis and Other Metabolisms Based on the Analysis of Transcriptome Data
To further understand the potential mechanisms of N deficiency-induced anthocyanin biosynthesis in pear callus, we analyzed the transcriptome of treated pear callus and identified a total of 5351 DEGs from N-deficiency treatment vs. MS control comparison (Figure 2). For these DEGs, GO analysis showed that “regulation of phenylpropanoid metabolic process”, “response to jasmonic acid”, and “response to salicylic acid” were significantly enriched biological process terms in N deficiency treatment (Figure 3A). These results revealed that N deficiency activated the regulation of the phenylpropanoid metabolic process, providing a sufficient substrate foundation for anthocyanin metabolism. In addition, enriched terms of “response to jasmonic acid” and “response to salicylic acid” suggest that N deficiency may affect the signaling pathways of jasmonic acid and salicylic acid, thus affecting anthocyanin accumulation. Moreover, multiple light-responsive DEGs were significantly enriched, indicating that light played a crucial role in N deficiency-mediated anthocyanin accumulation (Figure 3A).
The KEGG analysis showed that N-deficiency significantly enhanced flavonoid biosynthesis, phenylalanine metabolism, and phenylpropanoid biosynthesis pathways (Figure 3D). Moreover, anthocyanin could serve a protective role in increasing the plant’s resistance to environmental stress [68]. The analysis also significantly enriched the terms for “Tyrosine metabolism”, “Arginine and proline metabolism”, “Ubiquinone and other terpenoid−quinone biosynthesis”, and “Tropane, piperidine and pyridine alkaloid biosynthesis” (Figure 3D). The alterations in metabolic activities may be attributed to plants’ response to external stress.
In this study, we demonstrated that N deficiency has a positive effect on anthocyanin biosynthesis in pear callus. However, there have been certain differences in physiological status between pear fruit trees and pear callus. At the tree level, whether N deficiency could improve the coloration of pear fruits still needs further field trials to verify. It is worth noting that N deficiency has multifaceted effects on pear fruit trees, potentially resulting in a decline in fruit yield and quality. Therefore, it is imperative to effectively manage the soil nitrogen content and determine an optimal threshold in order to improve the pear appearance quality while simultaneously ensuring fruit quality and quantity. This will serve as the focal point for our future endeavors.
4.3. Regulation of Nutrient Limitation-Mediated Anthocyanin Biosynthesis in Plants
The common nutrient limitations, such as nitrogen (N) deficiency and phosphorus (P) deficiency, both of which could lead to anthocyanin accumulation in plants [29]. In the current study, we proved that N deficiency promoted anthocyanin accumulation and upregulated the expression levels of anthocyanin biosynthesis-related genes in pear (Figure 1). Similarly, in apples, P deficiency strongly induced the expression of McMYB10, thereby affecting anthocyanin accumulation [69]. In Arabidopsis, AtPHR1 is directly bonded to the promoters of AtF3′H and AtLDOX under low P conditions to activate their expression and similar reports have been reported in Solanum lycopersicum [70,71]. Moreover, reports revealed that the overall concept underlying the anthocyanin accumulation induced by nutrient limitation is that plants modulate nutrient allocation and metabolism as a means of adapting to external environmental stress [29].
4.4. PyNAC42 Acted as a Positive Regulator Induced by N-Deficiency
The PyNAC42 investigated in this study belongs to the NAC TF family, which is one of the largest families of plant-specific TFs. These TFs play crucial roles in regulating plant growth and development, as well as responding to environmental stress [72]. The name of the NAC TFs family comes from three class transcription factors: NAM (no apical meristem), ATAF1/2, and CUC2 (cup-shaped cotyledon), all of which have the same DNA-binding domain [73]. In recent years, pivotal roles of NAC TFs in regulating anthocyanin biosynthesis have been extensively demonstrated in various plant species, including Arabidopsis, Malus domestica, Prunus persica, Fragaria vesca, and Litchi chinensis [63,74,75,76,77].
Here, by analysis of transcriptome data and RT-qPCR assay, the PyNAC42 gene was identified as intensively induced by the N deficiency condition (Table 1 and Figure 4). The overexpression assay demonstrated that PyNAC42 could promote anthocyanin accumulation in “Zaosu” pear peels and significantly upregulated the expression levels of anthocyanin structural genes PyCHS, PyCHI, PyF3H, PyDFR, PyANS, and PyUFGT (Figure 6A–D). Additionally, the results of the phylogenetic analysis showed that PyNAC42 has the highest similarity with AtNAC42/JUB1 (Figure 5A,B), suggesting that they may have similar regulatory mechanisms. Furthermore, AtNAC42/JUB1 has been reported to play a significant role in response to drought and heat tolerance in Arabidopsis [55,56]. These findings lead us to consider that NAC42/JUB1 may act as a key regulator in plant response to various environmental stresses. Moreover, in the current study, we initially propose that PyNAC42 could be induced by an N deficiency signal and possessed the capacity to promote anthocyanin biosynthesis in pear.
PyNAC42 Enhanced the Activation of PyDFR, PyANS, and PyUFGT by Interacting with PyMYB10
The dual luciferase showed that PyNAC42 could activate the expression of anthocyanin structural genes PyDFR, PyANS, and PyUFGT, while the Y1H assay revealed that the activation mechanism was not achieved by directly binding to their promoters (Figure 6E,F, and Figure S2). These findings led us to suspect that there may be a co-factor working with PyNAC42 to co-regulate anthocyanin biosynthesis in pear. Extensive studies have demonstrated that the core regulatory network of anthocyanin biosynthesis is governed by a highly conserved MYB-bHLH-WDR (MBW) complex, with R2R3-MYB TFs playing vital roles in this intricate process [53,78,79,80]. Moreover, NAC TFs could co-regulate anthocyanin biosynthesis with R2R3-MYB TFs [62,64]. By Y2H and pull-down assays, we confirmed that PyNAC42 could interact with PyMYB10, and co-expression of them significantly enhanced anthocyanin accumulation in pear (Figure 7). Additionally, MdNAC42 was proved to be involved in controlling anthocyanin accumulation in red-fleshed apples by interacting with MdMYB10, and the regulatory pattern is similar to our findings [62]. However, our phylogenetic analysis revealed that MdNAC42 and PyNAC42 are not closely related (Figure 5A), and these proteins share only 22.19% identity, which indicates that PyNAC42 and MdNAC42 are different NAC proteins while they may have similar regulatory mechanisms.
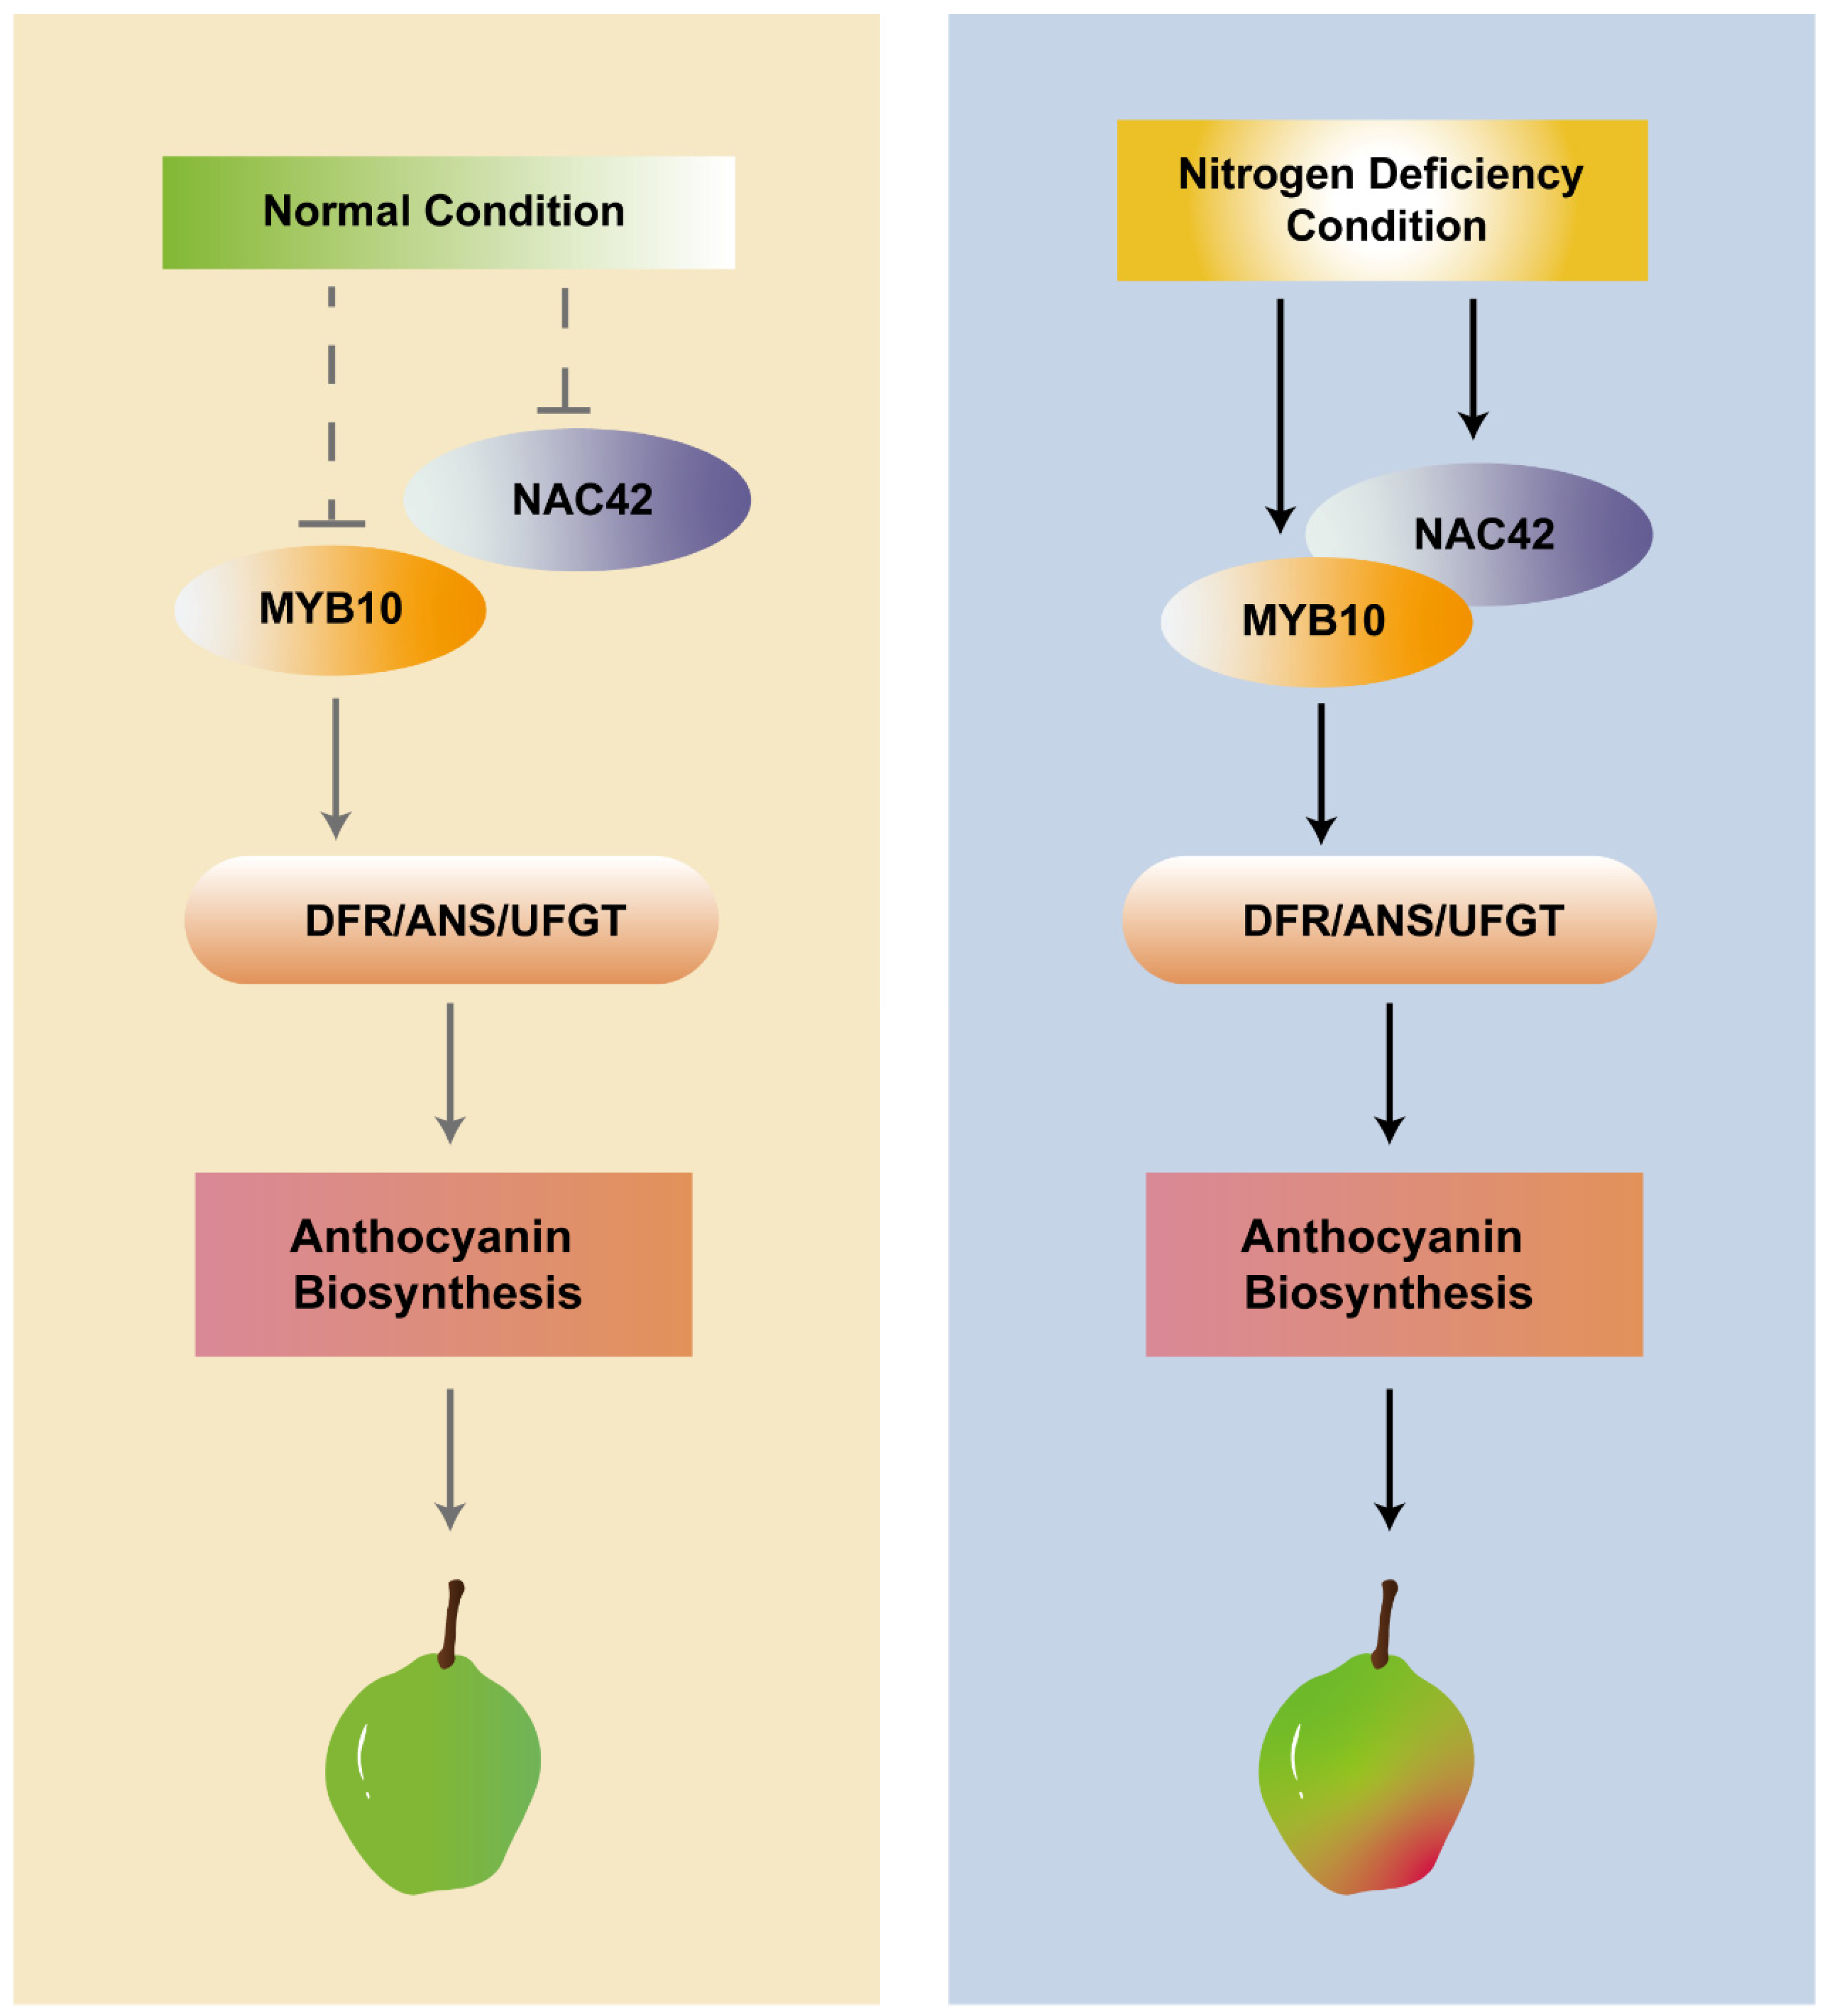
The further results of dual luciferase assays demonstrated that the co-expression of PyNAC42 with PyMYB10 significantly enhanced the activation effects of PyDFR, PyANS, and PyUFGT (Figure 8). Since PyMYB10 could activate the above three structural genes by directly bonding to their promoters, we can draw a conclusion that PyNAC42 could interact with PyMYB10 to form a PyNAC42- PyMYB10 complex, which positively regulates anthocyanin biosynthesis in pear. In blood-fleshed peach, the anthocyanin levels in the flesh of peach were associated with the expression levels of the PpMYB10.1, while the NAC TFs PpBL and PpNAC1 were shown to activate the transcription of PpMYB10.1 [76]. In apple, MdNAC33 physically interacted with MdMYB1 and enhanced the activation of MdMYB1 to its target gene MdUFGT, thereby promoting anthocyanin accumulation [64]. These reports illustrated that NAC TFs could affect key MYB TFs, thereby influencing downstream structural genes. In this study, we have initially revealed the mechanism by which PyNAC42 and PyMYB10 co-regulate pear anthocyanin biosynthesis under N deficiency conditions (Figure 9). However, further investigation is still required to elucidate the molecular mechanisms underlying the response of PyNAC42 to N-deficiency.
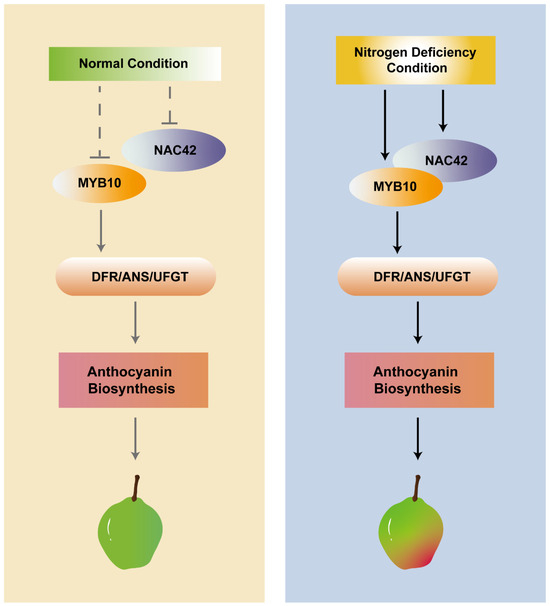
Figure 9.
Proposed model for underlying N deficiency induced anthocyanin biosynthesis mediated by PyNAC42.
5. Conclusions
In this study, we found that N deficiency promoted anthocyanin accumulation in pear callus and upregulated the expression levels of anthocyanin biosynthesis pathway genes PyPAL, PyCHS, PyCHI, PyF3H, PyDFR, PyANS, and PyUFGT, and key regulatory factors PyMYB10, PyMYB114, and PybHLH3. Through analysis of RNA-seq data and RT-qPCR assay, the TF PyNAC42 was identified as being intensively responsive to the N deficiency condition. Overexpression of PyNAC42 promoted anthocyanin accumulation in “Zaosu” pear peels and activated the expression of PyDFR, PyANS, and PyUFGT. Furthermore, PyNAC42 could interact with PyMYB10 and form the PyNAC42-PyMYB10 complex to further enhance the activation effect of PyDFR, PyANS, and PyUFGT, thereby significantly inducing the anthocyanin accumulation. Overall, we revealed a novel mechanism by which PyNAC42-mediated N deficiency induced anthocyanin accumulation in pears, which deepened our understanding of the network of anthocyanin biosynthesis modulated by nutrient elements.
Supplementary Materials
The following supporting information can be downloaded at: https://www.mdpi.com/article/10.3390/horticulturae10090980/s1, Figure S1. PCA analysis of transcriptome samples from MS control group and N-deficiency treatment group. Figure S2. Yeast one-hybrid assay used to detect the interaction between PyNAC42 and PyDFR, PyANS, and PyUFGT promoters. The yeast cells grew on the SD/-Trp/-Ura/+ X-Gal medium. The color of the yeast strains in the experimental groups was the same as that in the control groups, indicating that PyNAC42 could not bind to three promoters. Table S1. Primer sequences were used in this study. Table S2. The amino acid sequences of NAC transcription factors from different species were used for phylogenetic analysis.
Author Contributions
Conceptualization, J.W., J.L. and M.M.; methodology, J.Z., B.S., G.C., G.Y., M.M. and S.Z.; software, J.Z. and B.S.; validation, J.Z. and C.H.; formal analysis, B.S.; investigation, G.C. and Z.X.; data curation, B.S.; writing—original draft preparation, J.Z., B.S. and G.Y.; writing—review and editing, B.S., J.Z. and G.C.; funding acquisition, J.W. All authors have read and agreed to the published version of the manuscript.
Funding
This work was supported by the National Natural Science Foundation of China (31820103012), the earmarked fund for China Agriculture Research System (CARS-28), the earmarked fund for Jiangsu Agricultural Industry Technology System, China (JATS[2023]412), and Jiangsu Province Innovation Capacity Construction Program (BM2022008).
Data Availability Statement
All data generated or analyzed during this study are provided in this published article and its Supplementary Data files or will be provided upon reasonable request.
Acknowledgments
We thank the State Key Laboratory of Crop Genetics and Germplasm Enhancement and Utilization, Zhongshan Biological Breeding Laboratory, and the high-performance computing platforms of the Bioinformatics Center of Nanjing Agricultural University for supporting this project.
Conflicts of Interest
The authors declare that they have no conflicts of interest.
References
- Wang, P.; Wu, X.; Shi, Z.; Tao, S.; Liu, Z.; Qi, K.; Xie, Z.; Qiao, X.; Gu, C.; Yin, H.; et al. A large-scale proteogenomic atlas of pear. Mol. Plant 2023, 16, 599–615. [Google Scholar] [CrossRef] [PubMed]
- Yao, G.; Gou, S.; Zhong, T.; Wei, S.; An, X.; Sun, H.; Sun, C.; Hu, K.; Zhang, H. Persulfidation of transcription factor MYB10 inhibits anthocyanin synthesis in red-skinned pear. Plant Physiol. 2023, 192, 2185–2202. [Google Scholar] [CrossRef] [PubMed]
- Alappat, B.; Alappat, J. Anthocyanin pigments: Beyond aesthetics. Molecules 2020, 25, 5500. [Google Scholar] [CrossRef] [PubMed]
- Zhang, Z.; Tian, C.; Zhang, Y.; Li, C.; Li, X.; Yu, Q.; Wang, S.; Wang, X.; Chen, X.; Feng, S. Transcriptomic and metabolomic analysis provides insights into anthocyanin and procyanidin accumulation in pear. BMC Plant Biol. 2020, 20, 129. [Google Scholar] [CrossRef] [PubMed]
- Meng, J.; Gao, Y.; Han, M.; Liu, P.; Yang, C.; Shen, T.; Li, H. In vitro anthocyanin induction and metabolite analysis in Malus spectabilis leaves under low nitrogen conditions. Hortic. Plant J. 2020, 6, 284–292. [Google Scholar] [CrossRef]
- Steyn, W.J.; Wand, S.J.; Jacobs, G.; Rosecrance, R.C.; Roberts, S.C. Evidence for a photoprotective function of low-temperature-induced anthocyanin accumulation in apple and pear peel. Physiol. Plant 2009, 136, 461–472. [Google Scholar] [CrossRef]
- Jaakola, L. New insights into the regulation of anthocyanin biosynthesis in fruits. Trends Plant Sci. 2013, 18, 477–483. [Google Scholar] [CrossRef]
- Mattioli, R.; Francioso, A.; Mosca, L.; Silva, P. Anthocyanins: A comprehensive review of their chemical properties and health effects on cardiovascular and neurodegenerative diseases. Molecules 2020, 25, 3809. [Google Scholar] [CrossRef]
- Khoo, H.E.; Azlan, A.; Tang, S.T.; Lim, S.M. Anthocyanidins and anthocyanins: Colored pigments as food, pharmaceutical ingredients, and the potential health benefits. Food Nutr. Res. 2017, 61, 1361779. [Google Scholar] [CrossRef]
- Zhao, X.; Zhang, Y.; Long, T.; Wang, S.; Yang, J. Regulation mechanism of plant pigments biosynthesis: Anthocyanins, carotenoids, and betalains. Metabolites 2022, 12, 871. [Google Scholar] [CrossRef]
- Tanaka, Y.; Sasaki, N.; Ohmiya, A. Biosynthesis of plant pigments: Anthocyanins, betalains and carotenoids. Plant J. 2008, 54, 733–749. [Google Scholar] [CrossRef] [PubMed]
- Winkel-Shirley, B. Flavonoid biosynthesis. A colorful model for genetics, biochemistry, cell biology, and biotechnology. Plant Physiol. 2001, 126, 485–493. [Google Scholar] [CrossRef] [PubMed]
- Ni, J.; Wang, S.; Yu, W.; Liao, Y.; Pan, C.; Zhang, M.; Tao, R.; Wei, J.; Gao, Y.; Wang, D.; et al. The ethylene-responsive transcription factor PpERF9 represses PpRAP2.4 and PpMYB114 via histone deacetylation to inhibit anthocyanin biosynthesis in pear. Plant Cell 2023, 35, 2271–2292. [Google Scholar] [CrossRef] [PubMed]
- Sun, X.; Jia, X.; Huo, L.; Che, R.; Gong, X.; Wang, P.; Ma, F. MdATG18a overexpression improves tolerance to nitrogen deficiency and regulates anthocyanin accumulation through increased autophagy in transgenic apple. Plant Cell Environ. 2018, 41, 469–480. [Google Scholar] [CrossRef]
- Yang, L.; Li, W.C.; Fu, F.L.; Qu, J.; Sun, F.; Yu, H.; Zhang, J. Characterization of phenylalanine ammonia-lyase genes facilitating flavonoid biosynthesis from two species of medicinal plant Anoectochilus. PeerJ 2022, 10, e13614. [Google Scholar] [CrossRef]
- Guo, N.; Cheng, F.; Wu, J.; Liu, B.; Zheng, S.; Liang, J.; Wang, X. Anthocyanin biosynthetic genes in Brassica rapa. BMC Genom. 2014, 15, 426. [Google Scholar] [CrossRef]
- Ni, J.; Premathilake, A.T.; Gao, Y.; Yu, W.; Tao, R.; Teng, Y.; Bai, S. Ethylene-activated PpERF105 induces the expression of the repressor-type R2R3-MYB gene PpMYB140 to inhibit anthocyanin biosynthesis in red pear fruit. Plant J. 2021, 105, 167–181. [Google Scholar] [CrossRef]
- Goswami, G.; Nath, U.K.; Park, J.I.; Hossain, M.R.; Biswas, M.K.; Kim, H.T.; Kim, H.R.; Nou, I.S. Transcriptional regulation of anthocyanin biosynthesis in a high-anthocyanin resynthesized Brassica napus cultivar. J. Biol. Res. 2018, 25, 19. [Google Scholar] [CrossRef]
- LaFountain, A.M.; Yuan, Y.W. Repressors of anthocyanin biosynthesis. New Phytol. 2021, 231, 933–949. [Google Scholar] [CrossRef]
- Xu, W.; Dubos, C.; Lepiniec, L. Transcriptional control of flavonoid biosynthesis by MYB-bHLH-WDR complexes. Trends Plant Sci. 2015, 20, 176–185. [Google Scholar] [CrossRef]
- Premathilake, A.T.; Ni, J.; Bai, S.; Tao, R.; Ahmad, M.; Teng, Y. R2R3-MYB transcription factor PpMYB17 positively regulates flavonoid biosynthesis in pear fruit. Planta 2020, 252, 59. [Google Scholar] [CrossRef] [PubMed]
- Feng, S.; Wang, Y.; Yang, S.; Xu, Y.; Chen, X. Anthocyanin biosynthesis in pears is regulated by a R2R3-MYB transcription factor PyMYB10. Planta 2010, 232, 245–255. [Google Scholar] [CrossRef] [PubMed]
- Qian, M.; Sun, Y.; Allan, A.C.; Teng, Y.; Zhang, D. The red sport of ‘Zaosu’ pear and its red-striped pigmentation pattern are associated with demethylation of the PyMYB10 promoter. Phytochemistry 2014, 107, 16–23. [Google Scholar] [CrossRef] [PubMed]
- Li, L.; Ban, Z.J.; Li, X.H.; Wu, M.Y.; Wang, A.L.; Jiang, Y.Q.; Jiang, Y.H. Differential expression of anthocyanin biosynthetic genes and transcription factor PcMYB10 in pears (Pyrus communis L.). PLoS ONE 2012, 7, e46070. [Google Scholar] [CrossRef] [PubMed]
- Ni, J.; Bai, S.; Zhao, Y.; Qian, M.; Tao, R.; Yin, L.; Gao, L.; Teng, Y. Ethylene response factors Pp4ERF24 and Pp12ERF96 regulate blue light-induced anthocyanin biosynthesis in ‘Red Zaosu’ pear fruits by interacting with MYB114. Plant Mol. Biol. 2019, 99, 67–78. [Google Scholar] [CrossRef]
- Yao, G.; Ming, M.; Allan, A.C.; Gu, C.; Li, L.; Wu, X.; Wang, R.; Chang, Y.; Qi, K.; Zhang, S.; et al. Map-based cloning of the pear gene MYB114 identifies an interaction with other transcription factors to coordinately regulate fruit anthocyanin biosynthesis. Plant J. 2017, 92, 437–451. [Google Scholar] [CrossRef]
- Bai, S.; Tao, R.; Tang, Y.; Yin, L.; Ma, Y.; Ni, J.; Yan, X.; Yang, Q.; Wu, Z.; Zeng, Y.; et al. BBX16, a B-box protein, positively regulates light-induced anthocyanin accumulation by activating MYB10 in red pear. Plant Biotechnol. J. 2019, 17, 1985–1997. [Google Scholar] [CrossRef]
- Li, Z.; Ahammed, G.J. Plant stress response and adaptation via anthocyanins: A review. Plant Stress 2023, 10, 100230. [Google Scholar] [CrossRef]
- Shi, L.; Li, X.; Fu, Y.; Li, C. Environmental stimuli and phytohormones in anthocyanin biosynthesis: A comprehensive review. Int. J. Mol. Sci. 2023, 24, 16415. [Google Scholar] [CrossRef]
- An, J.P.; Wang, X.F.; Zhang, X.W.; Xu, H.F.; Bi, S.Q.; You, C.X.; Hao, Y.J. An apple MYB transcription factor regulates cold tolerance and anthocyanin accumulation and undergoes MIEL1-mediated degradation. Plant Biotechnol. J. 2020, 18, 337–353. [Google Scholar] [CrossRef]
- Shin, D.H.; Choi, M.; Kim, K.; Bang, G.; Cho, M.; Choi, S.B.; Choi, G.; Park, Y.I. HY5 regulates anthocyanin biosynthesis by inducing the transcriptional activation of the MYB75/PAP1 transcription factor in Arabidopsis. FEBS Lett. 2013, 587, 1543–1547. [Google Scholar] [CrossRef] [PubMed]
- An, J.P.; Zhang, X.W.; Bi, S.Q.; You, C.X.; Wang, X.F.; Hao, Y.J. The ERF transcription factor MdERF38 promotes drought stress-induced anthocyanin biosynthesis in apple. Plant J. 2020, 101, 573–589. [Google Scholar] [CrossRef] [PubMed]
- Alabd, A.; Ahmad, M.; Zhang, X.; Gao, Y.; Peng, L.; Zhang, L.; Ni, J.; Bai, S.; Teng, Y. Light-responsive transcription factor PpWRKY44 induces anthocyanin accumulation by regulating PpMYB10 expression in pear. Hortic. Res. 2022, 9, uhac199. [Google Scholar] [CrossRef] [PubMed]
- Zhou, X.; Lei, D.; Yao, W.; Li, S.; Wang, H.; Lu, J.; Zhang, Y.; Lin, Y.; Wang, Y.; He, W.; et al. A novel R2R3-MYB transcription factor PbMYB1L of Pyrus bretschneideri regulates cold tolerance and anthocyanin accumulation. Plant Cell Rep. 2024, 43, 34. [Google Scholar] [CrossRef]
- Ren, Y.R.; Zhao, Q.; Yang, Y.Y.; Zhang, T.E.; Wang, X.F.; You, C.X.; Hao, Y.J. The apple 14-3-3 protein MdGRF11 interacts with the BTB protein MdBT2 to regulate nitrate deficiency-induced anthocyanin accumulation. Hortic. Res. 2021, 8, 22. [Google Scholar] [CrossRef]
- Lee, Y.J.; Lee, W.J.; Le, Q.T.; Hong, S.W.; Lee, H. Growth performance can be increased under high nitrate and high salt stress through enhanced nitrate reductase activity in Arabidopsis anthocyanin over-producing mutant plants. Front. Plant Sci. 2021, 12, 644455. [Google Scholar] [CrossRef]
- Liu, K.H.; Liu, M.; Lin, Z.; Wang, Z.F.; Chen, B.; Liu, C.; Guo, A.; Konishi, M.; Yanagisawa, S.; Wagner, G.; et al. NIN-like protein 7 transcription factor is a plant nitrate sensor. Science 2022, 377, 1419–1425. [Google Scholar] [CrossRef]
- Wang, R.; Cresswell, T.; Johansen, M.P.; Harrison, J.J.; Jiang, Y.; Keitel, C.; Cavagnaro, T.R.; Dijkstra, F.A. Reallocation of nitrogen and phosphorus from roots drives regrowth of grasses and sedges after defoliation under deficit irrigation and nitrogen enrichment. J. Ecol. 2021, 109, 4071–4080. [Google Scholar] [CrossRef]
- Liang, J.; He, J. Protective role of anthocyanins in plants under low nitrogen stress. Biochem. Biophys. Res. Commun. 2018, 498, 946–953. [Google Scholar] [CrossRef]
- Peng, M.; Hudson, D.; Schofield, A.; Tsao, R.; Yang, R.; Gu, H.; Bi, Y.M.; Rothstein, S.J. Adaptation of Arabidopsis to nitrogen limitation involves induction of anthocyanin synthesis which is controlled by the NLA gene. J. Exp. Bot. 2008, 59, 2933–2944. [Google Scholar] [CrossRef]
- Wang, X.F.; An, J.P.; Liu, X.; Su, L.; You, C.X.; Hao, Y.J. The nitrate-responsive protein MdBT2 regulates anthocyanin biosynthesis by interacting with the MdMYB1 transcription factor. Plant Physiol. 2018, 178, 890–906. [Google Scholar] [CrossRef] [PubMed]
- Zhang, D.; Yang, K.; Kan, Z.; Dang, H.; Feng, S.; Yang, Y.; Li, L.; Hou, N.; Xu, L.; Wang, X.; et al. The regulatory module MdBT2-MdMYB88/MdMYB124-MdNRTs regulates nitrogen usage in apple. Plant Physiol. 2021, 185, 1924–1942. [Google Scholar] [CrossRef] [PubMed]
- Sun, X.; Li, X.; Wang, Y.; Xu, J.; Jiang, S.; Zhang, Y. MdMKK9-mediated the regulation of anthocyanin synthesis in red-fleshed apple in response to different nitrogen signals. Int. J. Mol. Sci. 2022, 23, 7755. [Google Scholar] [CrossRef] [PubMed]
- Yang, G.; Sun, M.; Brewer, L.; Tang, Z.; Nieuwenhuizen, N.; Cooney, J.; Xu, S.; Sheng, J.; Andre, C.; Xue, C.; et al. Allelic variation of BBX24 is a dominant determinant controlling red coloration and dwarfism in pear. Plant Biotechnol. J. 2024, 22, 1468–1490. [Google Scholar] [CrossRef] [PubMed]
- Bolger, A.M.; Lohse, M.; Usadel, B. Trimmomatic: A flexible trimmer for Illumina sequence data. Bioinformatics 2014, 30, 2114–2120. [Google Scholar] [CrossRef]
- Andrews, S. FastQC a quality control tool for high throughput sequence data. In Babraham Bioinformatics; Babraham Institute: Cambridge, UK, 2010. [Google Scholar]
- Wu, J.; Wang, Z.; Shi, Z.; Zhang, S.; Ming, R.; Zhu, S.; Khan, M.A.; Tao, S.; Korban, S.S.; Wang, H.; et al. The genome of the pear (Pyrus bretschneideri Rehd.). Genome Res. 2013, 23, 396–408. [Google Scholar] [CrossRef]
- Kim, D.; Paggi, J.M.; Park, C.; Bennett, C.; Salzberg, S.L. Graph-based genome alignment and genotyping with HISAT2 and HISAT-genotype. Nat. Biotechnol. 2019, 37, 907–915. [Google Scholar] [CrossRef]
- Liao, Y.; Smyth, G.K.; Shi, W. featureCounts: An efficient general purpose program for assigning sequence reads to genomic features. Bioinformatics 2014, 30, 923–930. [Google Scholar] [CrossRef]
- Robinson, M.D.; McCarthy, D.J.; Smyth, G.K. edgeR: A Bioconductor package for differential expression analysis of digital gene expression data. Bioinformatics 2010, 26, 139–140. [Google Scholar] [CrossRef]
- Wilkinson, L. ggplot2: Elegant graphics for data analysis by WICKHAM, H. Biometrics 2011, 67, 678–679. [Google Scholar] [CrossRef]
- Chen, C.; Chen, H.; Zhang, Y.; Thomas, H.R.; Frank, M.H.; He, Y.; Xia, R. TBtools: An integrative toolkit developed for interactive analyses of big biological data. Mol. Plant 2020, 13, 1194–1202. [Google Scholar] [CrossRef] [PubMed]
- Zhang, L.; Song, B.; Li, B.; Zhang, S.; Liu, Y.; Chen, G.; Zhang, J.; Li, J.; Wu, J. Genome-wide identification and expression analysis of fifteen gene families involved in anthocyanin synthesis in pear. Horticulturae 2024, 10, 335. [Google Scholar] [CrossRef]
- Livak, K.J.; Schmittgen, T.D. Analysis of relative gene expression data using real-time quantitative PCR and the 2(-Delta Delta C(T)) Method. Methods 2001, 25, 402–408. [Google Scholar] [CrossRef] [PubMed]
- Ebrahimian-Motlagh, S.; Ribone, P.A.; Thirumalaikumar, V.P.; Allu, A.D.; Chan, R.L.; Mueller-Roeber, B.; Balazadeh, S. JUNGBRUNNEN1 confers drought tolerance downstream of the HD-Zip I transcription factor AtHB13. Front. Plant Sci. 2017, 8, 2118. [Google Scholar] [CrossRef] [PubMed]
- Shahnejat-Bushehri, S.; Mueller-Roeber, B.; Balazadeh, S. Arabidopsis NAC transcription factor JUNGBRUNNEN1 affects thermomemory-associated genes and enhances heat stress tolerance in primed and unprimed conditions. Plant Signal. Behav. 2012, 7, 1518–1521. [Google Scholar] [CrossRef]
- Alshareef, N.O.; Wang, J.Y.; Ali, S.; Al-Babili, S.; Tester, M.; Schmöckel, S.M. Overexpression of the NAC transcription factor JUNGBRUNNEN1 (JUB1) increases salinity tolerance in tomato. Plant Physiol. Biochem. 2019, 140, 113–121. [Google Scholar] [CrossRef]
- Diao, P.; Chen, C.; Zhang, Y.; Meng, Q.; Lv, W.; Ma, N. The role of NAC transcription factor in plant cold response. Plant Signal Behav. 2020, 15, 1785668. [Google Scholar] [CrossRef]
- Su, H.; Zhang, S.; Yuan, X.; Chen, C.; Wang, X.F.; Hao, Y.J. Genome-wide analysis and identification of stress-responsive genes of the NAM-ATAF1,2-CUC2 transcription factor family in apple. Plant Physiol. Biochem. 2013, 71, 11–21. [Google Scholar] [CrossRef]
- Liu, H.; Su, J.; Zhu, Y.; Yao, G.; Allan, A.C.; Ampomah-Dwamena, C.; Shu, Q.; Lin-Wang, K.; Zhang, S.; Wu, J. The involvement of PybZIPa in light-induced anthocyanin accumulation via the activation of PyUFGT through binding to tandem G-boxes in its promoter. Hortic. Res. 2019, 6, 134. [Google Scholar] [CrossRef]
- Cong, L.; Qu, Y.; Sha, G.; Zhang, S.; Ma, Y.; Chen, M.; Zhai, R.; Yang, C.; Xu, L.; Wang, Z. PbWRKY75 promotes anthocyanin synthesis by activating PbDFR, PbUFGT, and PbMYB10b in pear. Physiol. Plant 2021, 173, 1841–1849. [Google Scholar] [CrossRef]
- Zhang, S.; Chen, Y.; Zhao, L.; Li, C.; Yu, J.; Li, T.; Yang, W.; Zhang, S.; Su, H.; Wang, L. A novel NAC transcription factor, MdNAC42, regulates anthocyanin accumulation in red-fleshed apple by interacting with MdMYB10. Tree Physiol. 2020, 40, 413–423. [Google Scholar] [CrossRef] [PubMed]
- Jiang, G.; Li, Z.; Song, Y.; Zhu, H.; Lin, S.; Huang, R.; Jiang, Y.; Duan, X. LcNAC13 physically interacts with LcR1MYB1 to coregulate anthocyanin biosynthesis-related genes during litchi fruit ripening. Biomolecules 2019, 9, 135. [Google Scholar] [CrossRef] [PubMed]
- Zhang, L.; Zhang, J.; Wei, B.; Li, Y.; Fang, X.; Zhong, Y.; Wang, L. Transcription factor MdNAC33 is involved in ALA-induced anthocyanin accumulation in apples. Plant Sci. 2024, 339, 111949. [Google Scholar] [CrossRef] [PubMed]
- Liu, H.; Shu, Q.; Lin-Wang, K.; Allan, A.C.; Espley, R.V.; Su, J.; Pei, M.; Wu, J. The PyPIF5-PymiR156a-PySPL9-PyMYB114/MYB10 module regulates light-induced anthocyanin biosynthesis in red pear. Mol. Hortic. 2021, 1, 14. [Google Scholar] [CrossRef] [PubMed]
- Jezek, M.; Zörb, C.; Merkt, N.; Geilfus, C.M. Anthocyanin management in fruits by fertilization. J. Agric. Food Chem. 2018, 66, 753–764. [Google Scholar] [CrossRef]
- Xu, X.; Qin, H.; Liu, C.; Liu, J.; Lyu, M.; Wang, F.; Xing, Y.; Tian, G.; Zhu, Z.; Jiang, Y.; et al. Transcriptome and metabolome analysis reveals the effect of nitrogen-potassium on anthocyanin biosynthesis in “Fuji” apple. J. Agric. Food Chem. 2022, 70, 15057–15068. [Google Scholar] [CrossRef]
- Li, Z.; Ahammed, G.J. Hormonal regulation of anthocyanin biosynthesis for improved stress tolerance in plants. Plant Physiol. Biochem. 2023, 201, 107835. [Google Scholar] [CrossRef]
- Peng, Z.; Tian, J.; Luo, R.; Kang, Y.; Lu, Y.; Hu, Y.; Liu, N.; Zhang, J.; Cheng, H.; Niu, S.; et al. MiR399d and epigenetic modification comodulate anthocyanin accumulation in Malus leaves suffering from phosphorus deficiency. Plant Cell Environ. 2020, 43, 1148–1159. [Google Scholar] [CrossRef]
- Liu, Z.; Wu, X.; Wang, E.; Liu, Y.; Wang, Y.; Zheng, Q.; Han, Y.; Chen, Z.; Zhang, Y. PHR1 positively regulates phosphate starvation-induced anthocyanin accumulation through direct upregulation of genes F3′H and LDOX in Arabidopsis. Planta 2022, 256, 42. [Google Scholar] [CrossRef]
- Wu, X.; Liu, Z.; Liu, Y.; Wang, E.; Zhang, D.; Huang, S.; Li, C.; Zhang, Y.; Chen, Z.; Zhang, Y. SlPHL1 is involved in low phosphate stress promoting anthocyanin biosynthesis by directly upregulation of genes SlF3H, SlF3′H, and SlLDOX in tomato. Plant Physiol. Biochem. 2023, 200, 107801. [Google Scholar] [CrossRef]
- Olsen, A.N.; Ernst, H.A.; Leggio, L.L.; Skriver, K. NAC transcription factors: Structurally distinct, functionally diverse. Trends Plant Sci. 2005, 10, 79–87. [Google Scholar] [CrossRef] [PubMed]
- Gong, X.; Zhao, L.; Song, X.; Lin, Z.; Gu, B.; Yan, J.; Zhang, S.; Tao, S.; Huang, X. Genome-wide analyses and expression patterns under abiotic stress of NAC transcription factors in white pear (Pyrus bretschneideri). BMC Plant Biol. 2019, 19, 161. [Google Scholar] [CrossRef] [PubMed]
- Morishita, T.; Kojima, Y.; Maruta, T.; Nishizawa-Yokoi, A.; Yabuta, Y.; Shigeoka, S. Arabidopsis NAC transcription factor, ANAC078, regulates flavonoid biosynthesis under high-light. Plant Cell Physiol. 2009, 50, 2210–2222. [Google Scholar] [CrossRef]
- Liu, W.; Mei, Z.; Yu, L.; Gu, T.; Li, Z.; Zou, Q.; Zhang, S.; Fang, H.; Wang, Y.; Zhang, Z.; et al. The ABA-induced NAC transcription factor MdNAC1 interacts with a bZIP-type transcription factor to promote anthocyanin synthesis in red-fleshed apples. Hortic. Res. 2023, 10, uhad049. [Google Scholar] [CrossRef] [PubMed]
- Zhou, H.; Lin-Wang, K.; Wang, H.; Gu, C.; Dare, A.P.; Espley, R.V.; He, H.; Allan, A.C.; Han, Y. Molecular genetics of blood-fleshed peach reveals activation of anthocyanin biosynthesis by NAC transcription factors. Plant J. 2015, 82, 105–121. [Google Scholar] [CrossRef] [PubMed]
- Li, X.; Martín-Pizarro, C.; Zhou, L.; Hou, B.; Wang, Y.; Shen, Y.; Li, B.; Posé, D.; Qin, G. Deciphering the regulatory network of the NAC transcription factor FvRIF, a key regulator of strawberry (Fragaria vesca) fruit ripening. Plant Cell 2023, 35, 4020–4045. [Google Scholar] [CrossRef]
- Xu, H.; Wang, N.; Liu, J.; Qu, C.; Wang, Y.; Jiang, S.; Lu, N.; Wang, D.; Zhang, Z.; Chen, X. The molecular mechanism underlying anthocyanin metabolism in apple using the MdMYB16 and MdbHLH33 genes. Plant Mol. Biol. 2017, 94, 149–165. [Google Scholar] [CrossRef]
- Gonzalez, A.; Zhao, M.; Leavitt, J.M.; Lloyd, A.M. Regulation of the anthocyanin biosynthetic pathway by the TTG1/bHLH/Myb transcriptional complex in Arabidopsis seedlings. Plant J. 2008, 53, 814–827. [Google Scholar] [CrossRef]
- Zhao, Y.; Sun, J.; Cherono, S.; An, J.P.; Allan, A.C.; Han, Y. Colorful hues: Insight into the mechanisms of anthocyanin pigmentation in fruit. Plant Physiol. 2023, 192, 1718–1732. [Google Scholar] [CrossRef]

Disclaimer/Publisher’s Note: The statements, opinions and data contained in all publications are solely those of the individual author(s) and contributor(s) and not of MDPI and/or the editor(s). MDPI and/or the editor(s) disclaim responsibility for any injury to people or property resulting from any ideas, methods, instructions or products referred to in the content. |
© 2024 by the authors. Licensee MDPI, Basel, Switzerland. This article is an open access article distributed under the terms and conditions of the Creative Commons Attribution (CC BY) license (https://creativecommons.org/licenses/by/4.0/).