Abstract
Flowering cherry is a renowned ornamental woody plant valued for its landscape applications and economic benefits in gardens. However, waterlogging during the rainy season in some areas causes death and heavy losses. Fortunately, we have found that the flowering cherry ‘Gotenba zakura’ (Prunus incisa Thunberg) is capable of generating aerial roots when subjected to heavy rains and prolonged floods. In this study, we conducted an associated analysis to explore the core regulating network of the aerial root growth mechanism in flowering cherry ‘Gotenba zakura’ by combining phenotypic observations, physiological assays, and transcriptome comparisons across five distinct stages. Through the analysis of the heatmap of DEGs (Differentially Expressed Genes) and the gene co-expression network (GCN), we identified genes that may play critical roles under waterlogging stress. The gene network indicates that aerial roots enhance waterlogging tolerance through ROS degradation, endogenous hormone induction, and energy production. This discovery provides a solid foundation for understanding the waterlogging tolerance of flowering cherry and offers molecular evidence for selecting promising rootstocks for breeding, aimed at improving waterlogging tolerance through grafting.
1. Introduction
An aerial root is a kind of adventitious root and was first named by Warming E. in the study of Rhizophora mangle [1], and is widely found in such plant species as Pandanus, Salix, and so on. In most cases, adventitious roots result from the damage of plant organs or hormones, pathogens and microorganisms, and other abiotic factors [2]. Many terrestrial plants produce aerial roots to adapt to waterlogging conditions [3,4].
The different types of aerial roots can be divided into prop/stilt roots, crown roots, brace roots, epiphytic velamen-based, etc. [5]. To adapt to the environment, some plants generate aerial roots to better survive and grow in fast-flowing rivers, high deposition rate soil, and eroded environments [6]. Aerenchyma develops in newly formed aerial roots [7]; voids of aerenchyma facilitate the inward diffusion of O2 in the roots and the diffusion of ethylene produced by waterlogging [8,9]. Plants generate aerial roots to replace the original root system in anoxic environments in order to adapt to the lack of oxygen and to effectively alleviate the damage and toxicity caused by flood and waterlogging [10,11]. The growth of aerial roots also plays a vital role in water absorption, transpiration, and transportation [3]. Some aerial root structures have sponge tissue, which can enhance the absorption of water and nutrients [5]. The aerial roots of some plants contribute to obtaining sufficient nutrition [3,12]. Studies have shown that aerial roots also can absorb minerals and fix nitrogen, and their nitrogen fixation effect is much better than that of roots in soil [13]. Aerial roots are also related to the competitive mechanism of plants. By hindering the access of other large trees and vines to obtain more space above ground for plant growth, this utility model effectively improves the utilization of resources and enhances the competition of plants for sunlight [14], which leads to a higher-height growth of plants. In general, water passes through the canopy, down the branches, and into the soil, leaching out nutrients as it flows, and because of the funneling effect, the concentrations above the ground are much higher than in the soil. Compared with surface roots, aerial roots greatly reduce the competition for the availability of stem flow resources [15].
The flood severity and duration are the most important factors affecting the growth of aerial rooting [16]. Waterlogging can limit plant growth, reduce nutrient uptake, and restrict oxygen, which harms plant growth. Aerial rooting occurs when plants face environmental stress from flooding [17]. Except for the external environment, phytohormones, which are crucial endogenous signals, also play a vital role in the induction of aerial roots. The regulatory mechanism of various hormones, including auxin (IAA), gibberellins (GAs), abscisic acid (ABA), jasmonic acid (JA), Zeatin riboside (ZR), and brassinosteroid (BR), are involved in the regulation of callus formation, root elongation, and lateral root formation [18]. Auxin (IAA) plays a key role in the formation of aerial roots and the elongation and division of root cells, specifically in root primordium induction and callus formation. A high content of auxin (IAA) promotes root growth, while a low content of auxin (IAA) is the limiting factor of rooting [19]. Abscisic acid (ABA) may be involved in the growth and development of plants under stress, and it has been found that a low concentration of ABA can promote the aerial root growth of poplar, while a high concentration of ABA can inhibit it [20]. ABA and IAA are antagonistic to each other; thus, IAA/ABA can be used as a measure of aerial root development and growth [21]. Several studies showed that the ratio of IAA/ABA could change under water stress, and decrease with the tolerance of waterlogging and the extension of stress time, thus affecting the normal development of the root system [22]. On the one hand, GAs inhibit adventitious root primordial cell division, on the other hand, they inhibit the induction of IAA to adventitious roots. Except for these hormones, brassinosteroid (BR) [23], jasmonic acid (JA) [24], and Zeatin riboside (ZR) are also involved in adventitious root formation in response to water tolerance [25].
Prunus subg. Cerasus contains approximately 150 species with edible fruits and economic values as ornamental plants; these species have enormous potential for development and application [26,27]. In northern China, heavy summer rainfall often leads to the death of Prunus subg. Cerasus due to waterlogging. Because of the intolerance and the loss of waterlogging in Prunus, many studies have found rootstocks to improve the tolerance to flooding [28,29,30]. However, aerial roots have barely been found in Prunus subg. Cerasus. Thus, we aim to explore the development mechanism of aerial roots and its relationship with waterlogging tolerance. In this study, we have explained its waterlogging tolerance through molecular research, providing a foundation for stress breeding. Based on our research and analysis, we assume that this cultivar can theoretically be used as a rootstock to improve the waterlogging tolerance of Prunus subg. Cerasus and thus greatly reduce the damage caused by waterlogging.
2. Materials and Methods
2.1. Plant Materials
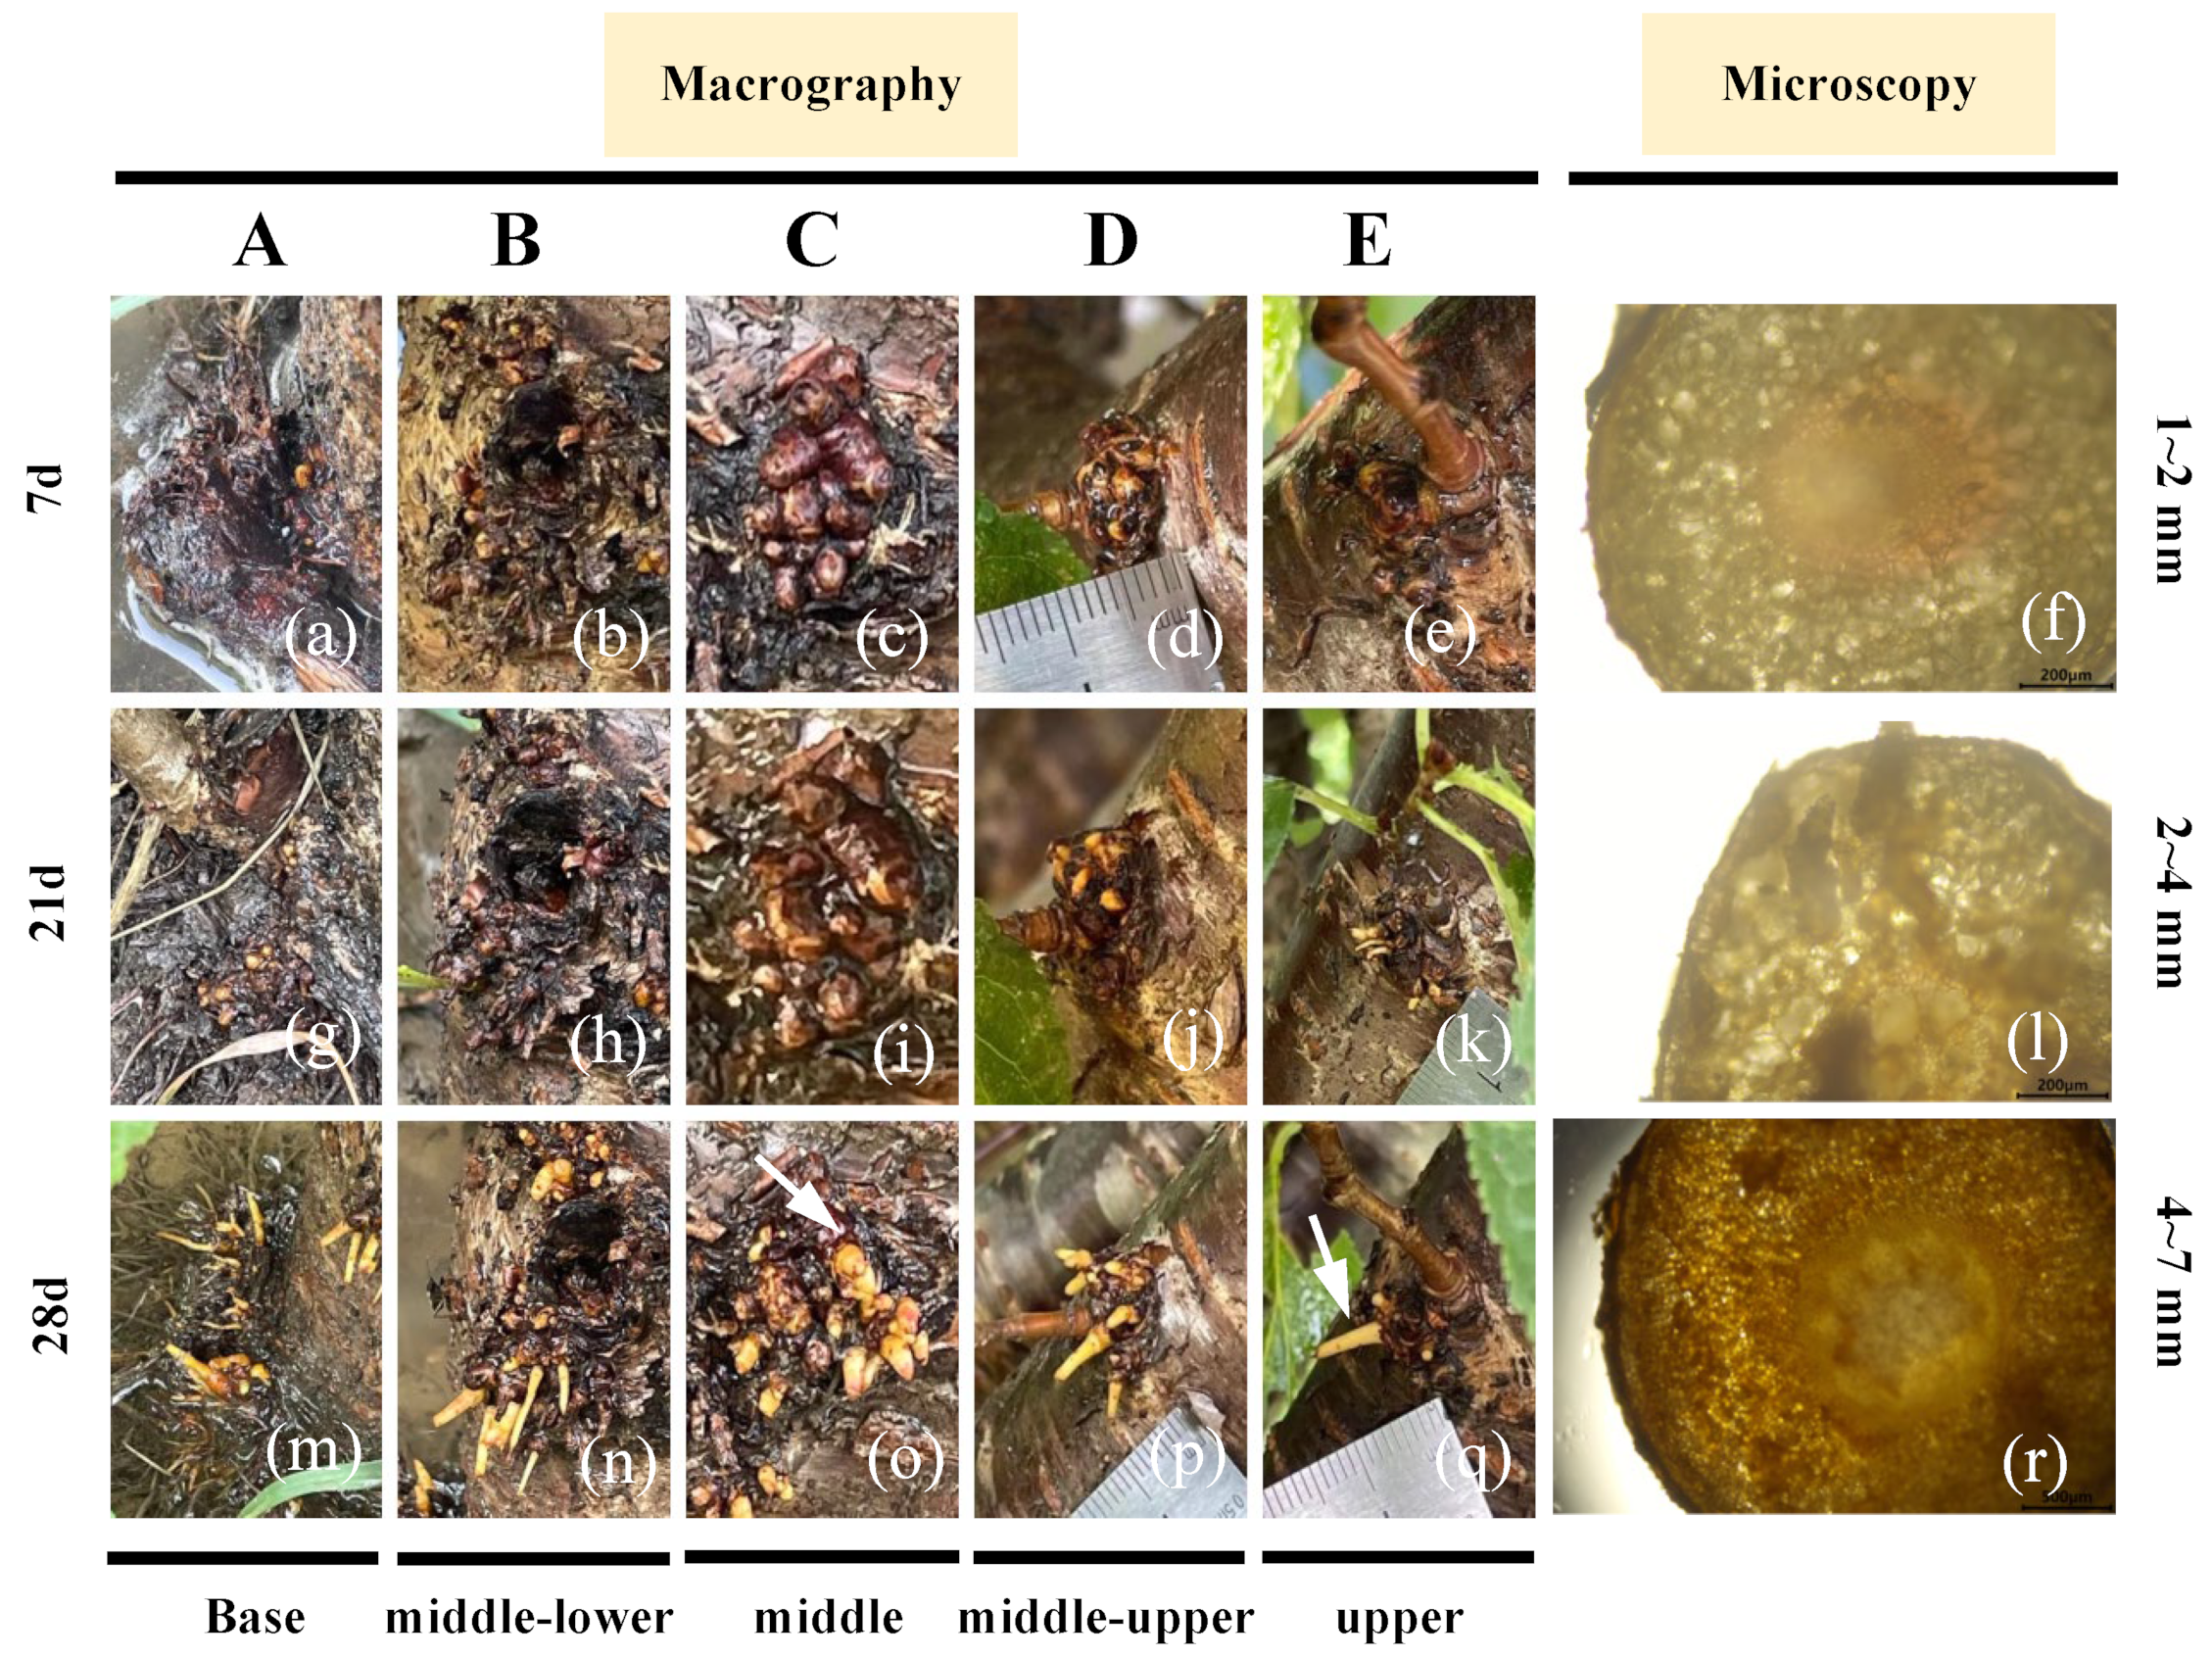
In terms of the research materials, flowering cherry ‘Gotenba zakura’ (Prunus incisa) was provided by Beijing Forestry University (Beijing, China), located at 39°56′ N latitude and 116°20′ E longitude. Five clonals were grown outdoors in healthy condition, free from diseases. Consistent watering from late June to late August in 2023 ensured waterlogging tolerance and promoted the growth of aerial roots. The individual with the best growth and the maximum number of aerial roots was selected as the material for this study. To characterize the development of aerial roots, five different parts of the trunk at various heights were selected and categorized as the base, middle-lower, middle, middle-upper and upper sections (Figure 1, A–E). To further investigate the developmental characteristics, aerial roots of different lengths were examined under a stereomicroscope (LEICA M165). The observations indicated that as the aerial roots grew longer, their anatomical structure changed, progressing from the primary structure to the secondary structure and vertical division. Based on these microscopic distinctions, aerial roots were categorized into three distinct stages. The materials from each stage were divided into two parts: one for phytohormone assays, and the other for transcriptome sequencing. These samples were frozen in liquid nitrogen and stored at −80 °C until further use.

Figure 1.
Development of aerial roots in different parts of flowering cherry ‘Gotenba Sakura’, observed through macrography and microscopy. Group A–E indicate the base, middle-lower, middle, middle-upper and upper sections. (a) Aerial roots growing at the base part of the trunk for 7 d. (b) Aerial roots growing at the middle-lower part of the trunk for 7 d. (c) Aerial roots growing at the middle part of the trunk for 7 d. (d) Aerial roots growing at the middle-upper part of the trunk for 7 d. (e) Aerial roots growing at the upper part of the trunk for 7 d. (f) Cross section of aerial root measured 1–2 mm. (g) Aerial roots growing at the base part of the trunk for 21 d. (h) Aerial roots growing at the middle-lower part of the trunk for 21 d. (i) Aerial roots growing at the middle part of the trunk for 21 d. (j) Aerial roots growing at the middle-upper part of the trunk for 21 d. (k) Aerial roots growing at the upper part of the trunk for 21 d. (l) Cross section of aerial root measured 2–4 mm. (m) Aerial roots growing at the base part of the trunk for 28 d. (n) Aerial roots growing at the middle-lower part of the trunk for 28 d. (o) Aerial roots growing at the middle part of the trunk for 28 d. (p) Aerial roots growing at the middle-upper part of the trunk for 28d. (q) Aerial roots growing at the upper part of the trunk for 28 d. (r) Cross section of aerial root measured 4–6 mm.
2.2. Hormone Content Measurement under Low Temperature
Using an indirect ELISA approach, the endogenous amounts of IAA, ABA, GA3, BR, JA, and ZR were extracted, purified, and measured [31,32]. After being homogenized in liquid nitrogen, samples from the 6 stages (EP01–EP06) were extracted in cold 80% (v/v) methanol with butylated hydroxytoluene (1 mmol/L) for 5 h at 4 °C. The extracts were collected after centrifugation at 3500 rpm/min (4 °C) for 8 min. The supernatant was passed through Chromosep C18 columns (C18 Sep-Park Cartridge, Waters Corp., Milford, MA, USA). The hormone fractions were prewashed with 1 mL of 80% (v/v) methanol and eluted with 5 mL of 100% (v/v) methanol, 5 mL of ether, and 5 mL of 100% (v/v) methanol from the columns. Then, they were dried under N2 and dissolved in 2 mL of phosphate-buffered saline (PBS) containing 0.1% (v/v) Tween 20 and 0.1% (w/v) gelatin for ELISA analysis. The samples were diluted with PBS to 8 concentrations (including 0 ng/mL) using an appropriate amount of the standard sample. The 96-well ELISA plate was filled with this series of standard samples and test samples, followed by the addition of antibodies and a 30 min incubation period at 37 °C. Following four rounds of washing in a PBS + Tween 20 (0.1% (v/v)) solution, 10 mL of the diluted enzyme-linked secondary antibody was added, and the samples were incubated for 30 min at 37 °C before being cleaned once more. After adding the buffered enzyme substrate (orthophenylenediamino), the enzyme reaction was allowed to run for 15 min at 37 °C in the dark. It was then stopped with 50 µL of 2 mol/L H2SO4. After adding the buffered enzyme substrate (orthophenylenediamino), the enzyme reaction was allowed to run for 15 min at 37 °C in the dark. It was then stopped with 50 µL of 2 mol/L H2SO4. The enzyme immunoassay data were calculated, as explained by Weiler et al. [33]. The results were analyzed using a one-way analysis of variance (ANOVA) and the differences were compared using the IBM SPSS Statistics 25 software and LSD test (p < 0.05). The means ± standard error of at least three replicates forms the results.
2.3. Statistic Analysis
Every 7 days, the number and length of aerial roots in five different parts (base, middle-lower, middle, middle-upper and upper part) were counted and recorded. The experimental data were processed using Microsoft Office Excel 2016, and the analysis was performed using SPSS statistics 25. To examine the root development characteristics at different stages, we created a bar chart based on the number and average length of emerging aerial roots. To analyze hormone level trends, we used 3 biological replications to minimize error. A univariate analysis of variance (ANOVA) was conducted, and the least significant difference (LSD) test was performed to compare differences between each group. Significant differences in the experimental results were identified at a significance level of p < 0.05. All indicators, charts, and other data are presented as the mean and standard deviation of 3 replications.
2.4. RNA Extraction and RNA-seq Library Construction
Following the manufacturer’s instructions, TRIzol reagent was used to extract total RNA from the samples of each of the 6 stages. Thermo Scientific, USA’s NanoDrop 2000 (Thermo Scientific, Waltham, MA, USA) spectrophotometer was used to assess the purity and quantity of DNA. The Agilent 2100 Bioanalyzer (Agilent Technologies, Santa Clara, CA, USA) was used to evaluate the integrity of the RNA. RNA samples that passed the quality tests were used for the RNA-seq. The VAHTS Universal V6 RNA-seq Library Prep Kit for Illumina (Agilent Technologies, Santa Clara, CA, USA) was then used to create libraries. Ultimately, the libraries were sequenced on the Illumina Novaseq 6000 system, and paired-end reads of 150 bp were produced. The analysis and sequencing of the transcriptome were carried out by OE Biotech Co., Ltd., located in Shanghai, China.
2.5. De Novo Transcriptome Assembly and Analysis
Raw data (raw reads) of fastq format underwent initial processing with Trimmomatic [34] to remove reads containing ploy-N and the low quality sequences. The clean reads were then put together using the paired-end technique via Trinity [35] (version: 2.4) into expressed sequence tag clusters (contigs) and de novo assembled into transcripts. For additional analysis, the longest transcript was chosen as a unigene based on length and similarity. By aligning the unigenes with the NCBI non-redundant (NR), Swiss-Prot, evolutionary genealogy of genes: Non-supervised Orthologous Groups (eggNOG), and Clusters of orthologous groups for eukaryotic complete genomes (KOG) databases using diamond [36] (threshold e < 1 × 10⁻⁵), the function of the unigenes was annotated. Proteins that exhibited the largest number of hits to the unigenes were designated as functional annotations. In order to identify possible pathways, the unigenes were further mapped to the Kyoto Encyclopedia of Genes and Genomes (KEGG) [37] database. The process of classifying genes ontology (GO) involved mapping Swiss-Prot and GO terms. Following annotation, bowtie2 [38] was used to align reads aligned to Unigenes, and eXpress software (version: 3.0) [39] calculated Unigene expression levels (FPKM [40]). Differentially expressed unigenes (DEGs) were identified between groups using DESeq2 [41], with significance tested using negative binomial distribution (NB) and default filter conditions of q < 0.05 and foldChange > 2 or foldChange < 0.5. A hierarchical cluster analysis of DEGs was conducted using R (v 3.2.0) to illustrate expression patterns across groups and samples. R was used to perform the GO enrichment and KEGG pathway enrichment analysis of DEGs based on the hypergeometric distribution, and R (v 3.2.0) was also used to construct column and bubble diagrams.
2.6. Construction of the DEGs Expression Profile and the Genes Co-Expression Network (GCN)
To explore the expression patterns of DEGs under waterlogging stress, DEGs related to the waterlogging-stress response were selected and displayed in a clustering heatmap. Based on membership functions, DEGs with similar expression profiles were clustered, and divided into 7 clusters using Mfuzz [42,43].
We also calculated the Pearson correlation coefficient of FPKM values between DEGs. Values greater than 0.8 or less than −0.8 were considered highly correlated and selected for further analysis. Then, Cytoscape 3.10.0 with the NAC plugin for was used for network visualization analysis. In the GCN, nodes represent genes, while lines or edges connecting individual nodes represent pairwise relationships between them. The collection of densely connected nodes represents a cluster, and the entire set of nodes, edges, and clusters forms a representation of the gene co-expression network.
2.7. Real-Time Quantitative Polymerase Chain Reaction
For the qRT-PCR study, six DEGs related to cold response were randomly selected to verify the accuracy of the transcriptome data. Using the HiScript III RT SuperMix for qPCR (+gDNA wiper) from Vazyme Biotech, Nanjing, China, RNA was reverse transcribed into cDNA. Specific primers for each candidate gene (Table S1) were designed following the qRT-PCR primer design guidelines by Bioengineering Co., Ltd. (Shanghai, China), using the Primer Premier 5 (Premier Biosoft, San Francisco, CA, USA). According to the manufacturer’s instructions, the reaction system was prepared using TB Green® Premix Ex TaqTM II (Takara, Shiga, Japan), and EF1A was used as the internal reference gene for PCR amplification [44]. Table 1 shows the reaction system and reaction steps. The 2−ΔΔCT method was used to normalize and map the expression levels of the DEGs. GraphPad Prism 8.0 was employed to graphically represent the biochemical activity figures.

Table 1.
The reaction system and program for qRT-PCR.
3. Results
3.1. Phenotypic Observation in the Aerial Roots of Flowering Cherry ‘Gotenba zakura’
To characterize the development of aerial roots, five different trunk sections at various heights were selected and categorized into Group A–E, corresponding to the base, middle-lower, middle, middle-upper, and upper parts. These sections were observed through macrography and microscopy (Figure 1). It was found that there were more bark-wrapped aerial roots (Figure 1c) and clustered tissues (Figure 1d,e) in the middle and upper part of the tree, but the young roots could neither initiate nor elongate without water irrigation. After waterlogging stimulation, white root spots began to sprout (Figure 1g–k), then elongated and thickened to form aerial roots (Figure 1i,j). However, the aerial roots at the base of the trunk developed into slender aerial roots (Figure 1a,g,m).
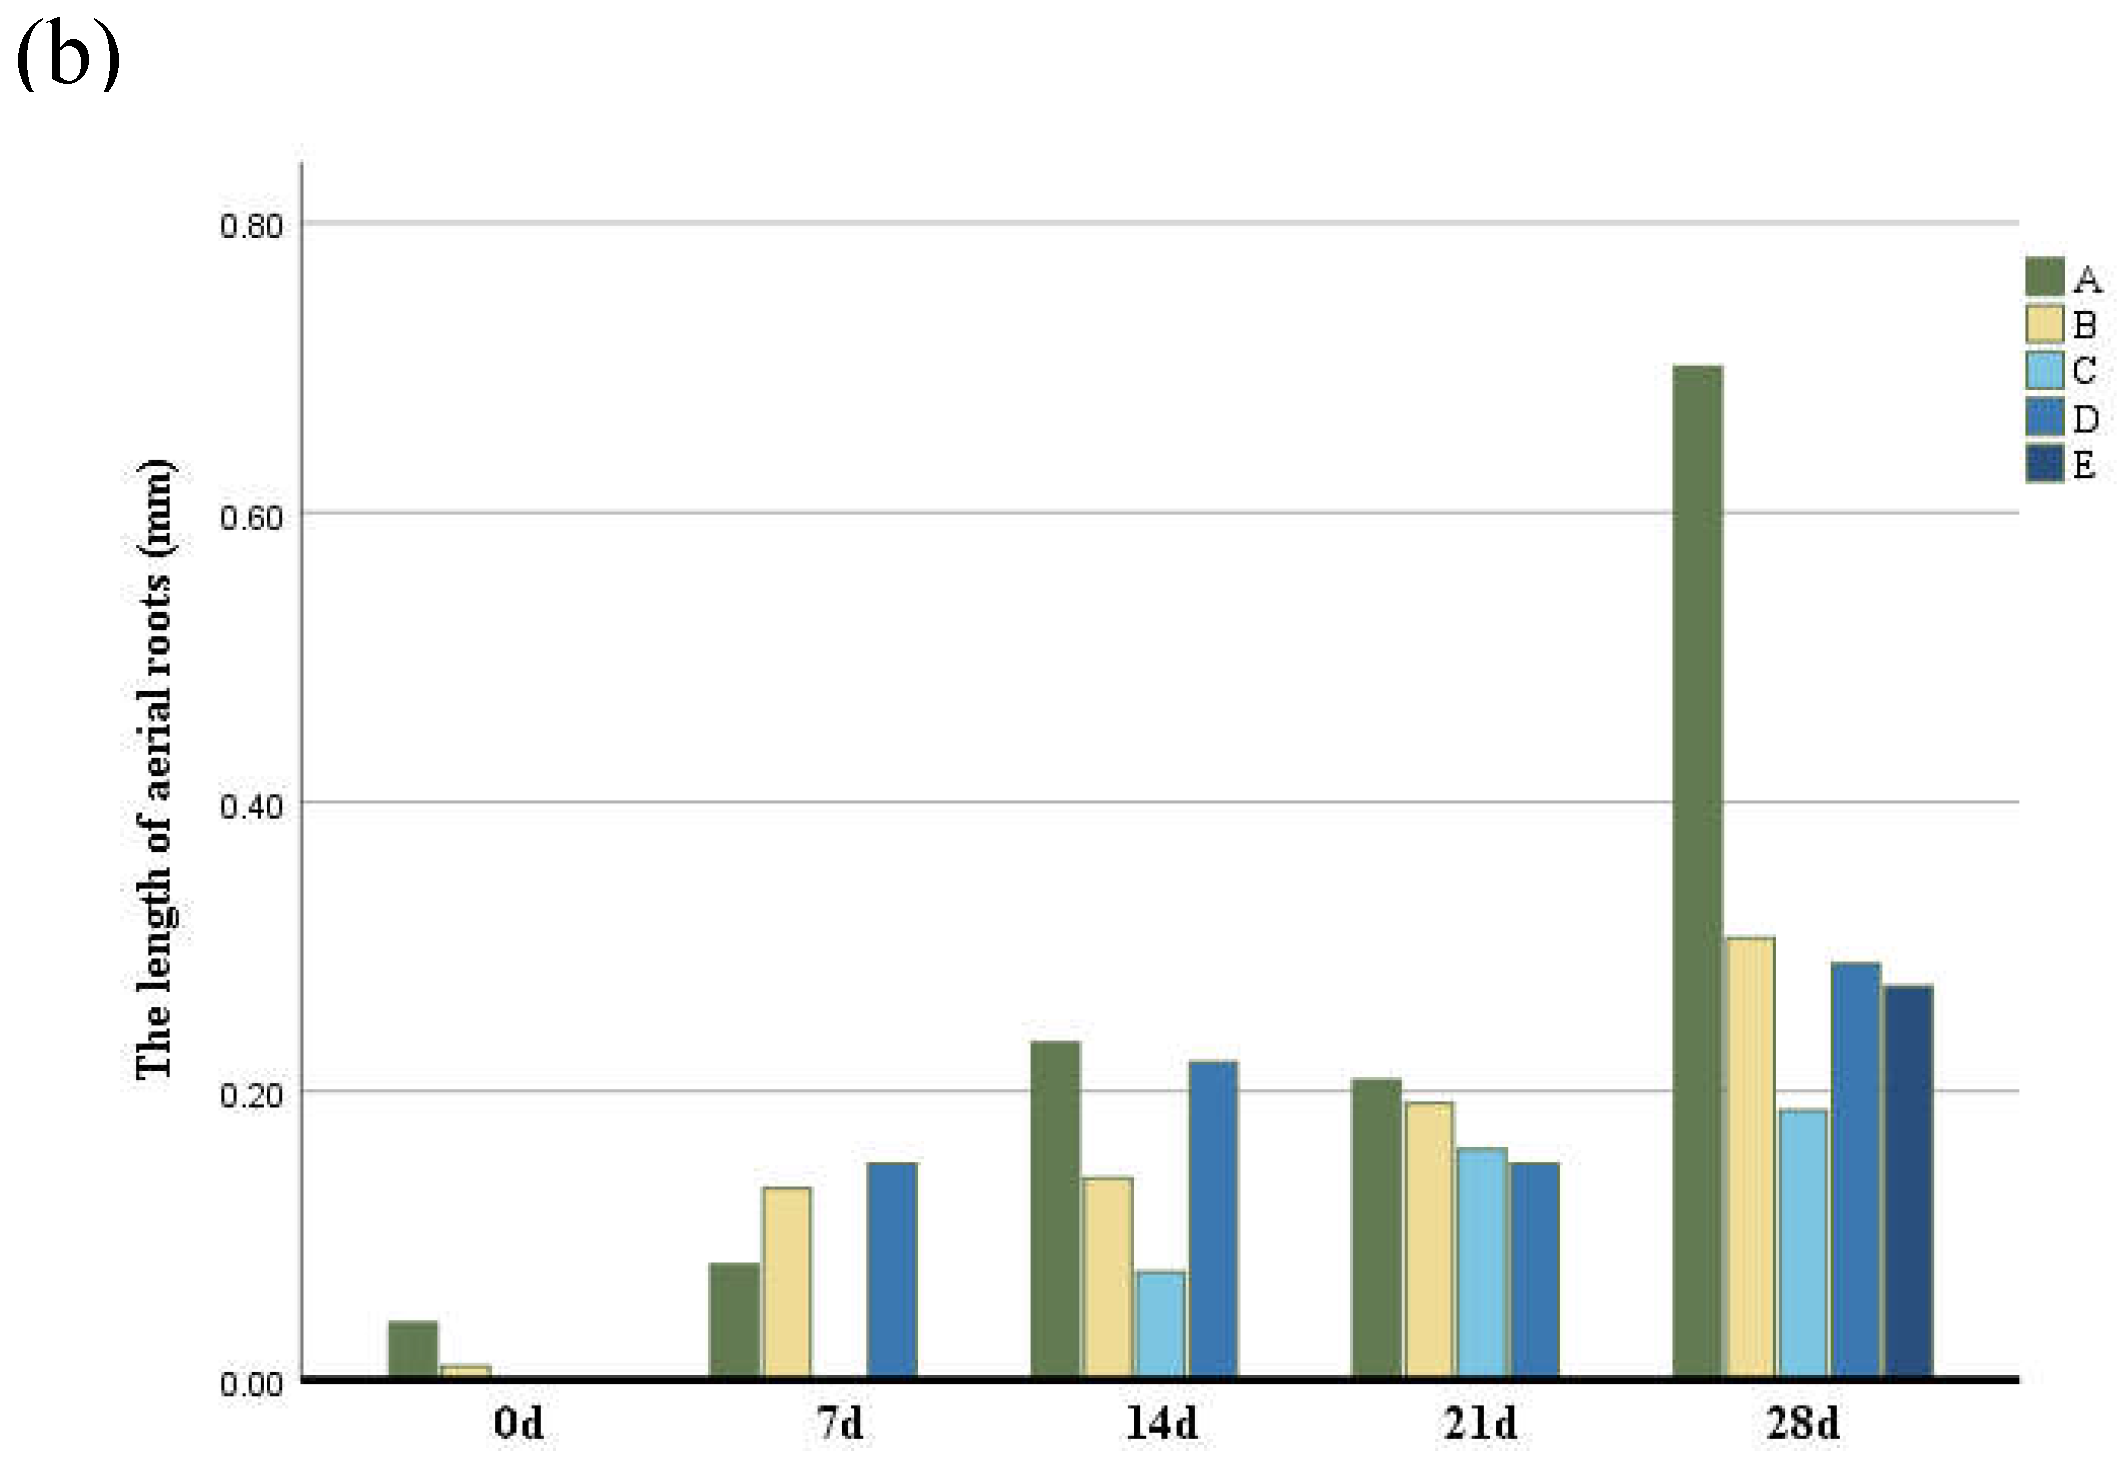
To analyze the characteristics of aerial roots, we separately counted the number and length of aerial roots in different parts. The number of aerial roots in the middle and lower parts was greater than in other parts (Figure 2) followed by the middle part, while the number of aerial roots in the middle and upper parts was the least. The growth rate of aerial roots at the base and middle-lower parts of the trunk was the fastest. In contrast, the middle, middle-upper, and upper parts exhibited slower growth, with aerial root formation occurring last in the upper part. Basal aerial root growth was the most significant, with root length being greater than in other parts (Figure 2b). Although the aerial roots in the middle and lower parts were longer, their growth rates were not as fast as those at the base. Aerial roots in the middle and upper-middle parts grew more slowly.
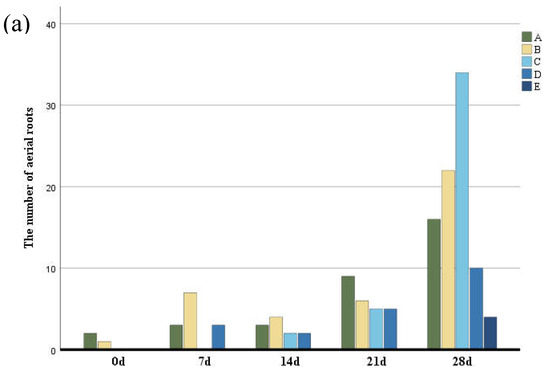
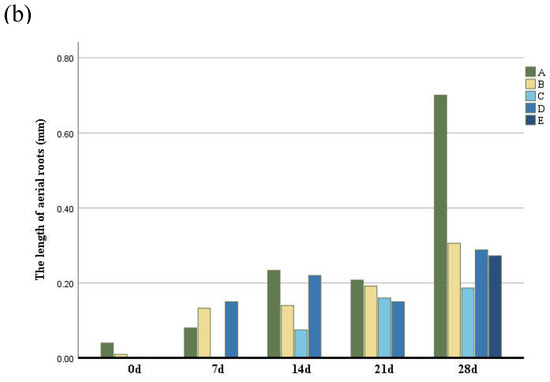
Figure 2.
(a) The number of aerial roots observed in distinctive five parts of the trunk according to six periods. (b) The length of aerial roots observed in distinctive five parts of the trunk according to six periods. Group A–E indicate the base, middle-lower, middle, middle-upper and upper sections.
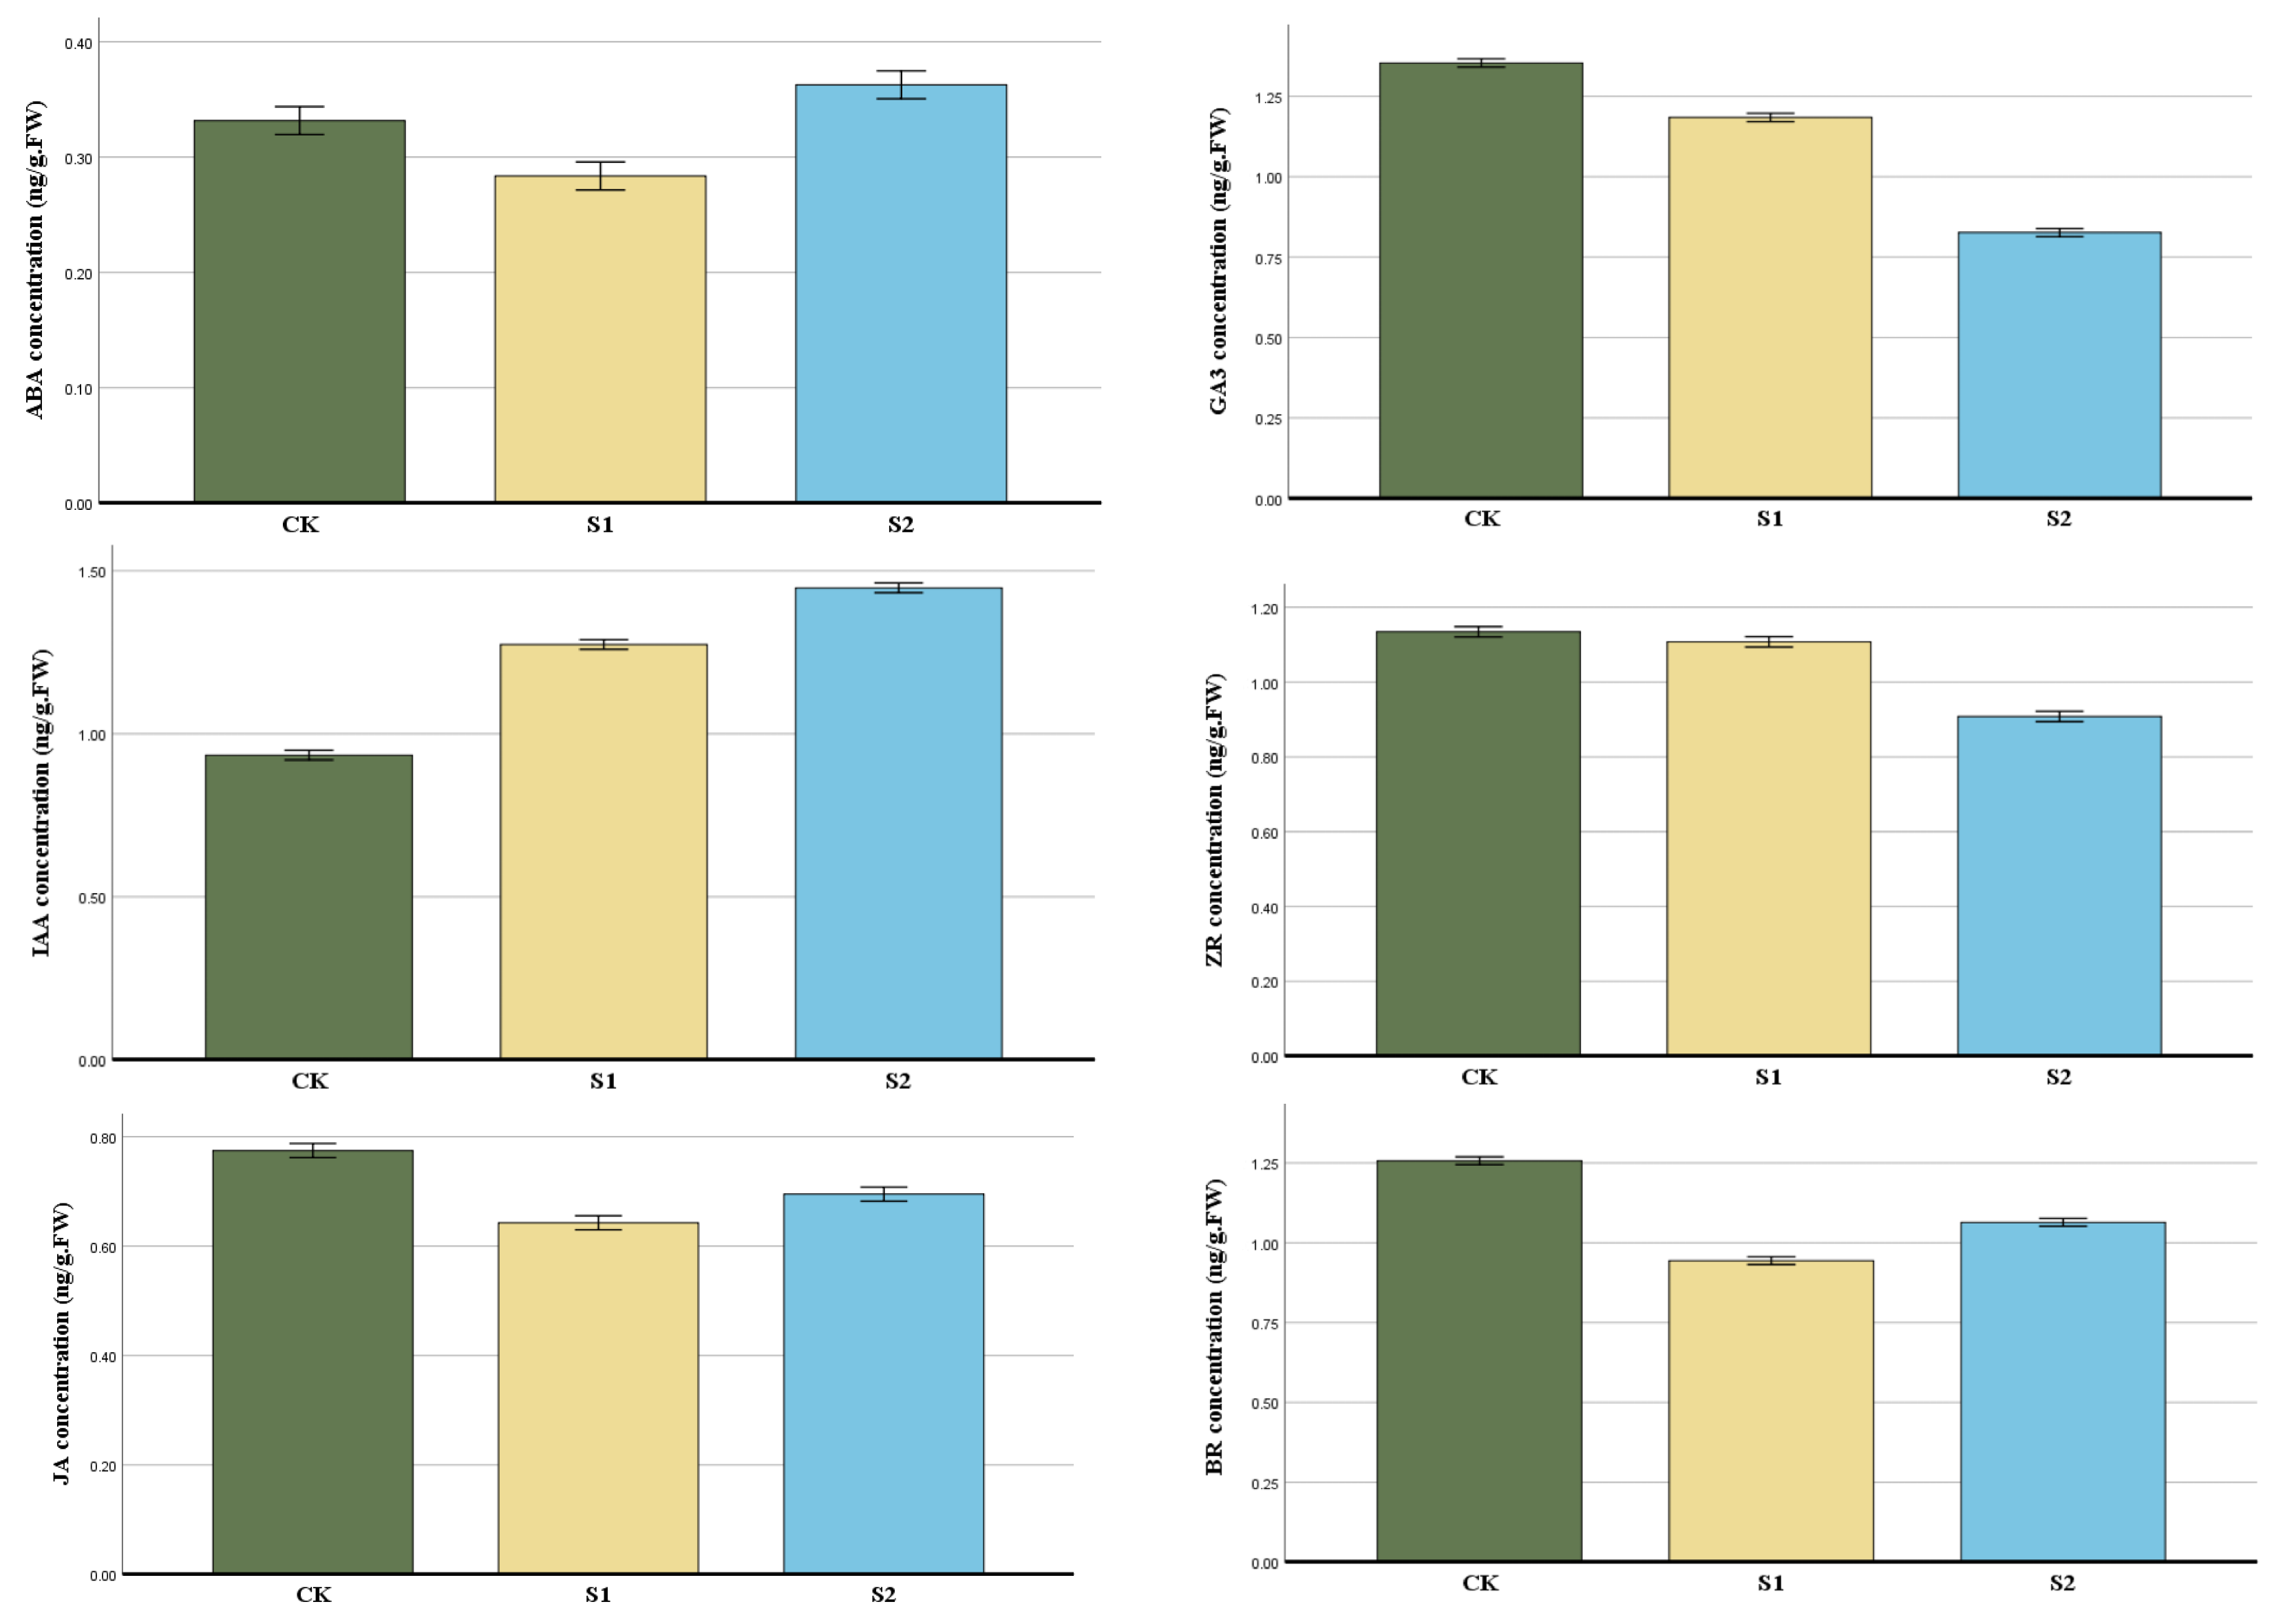
3.2. Endogenous Hormone Response during Aerial Roots Growth
The contents of endogenous hormones such as IAA, ABA, JA, ZR, BR, and GA3 in the two development phases of the root length Stage 1 (S1) 1–4 mm, Stage 2 (S2) more than 4 mm, and the control group (CK) were measured in order to examine the role of endogenous hormones in the growing process of flowering cherry ‘Gotenba zakura’ (Figure 3). The content of IAA and GA3 was at a lower level compared to CK, then reached the highest level in S2. JA and BR were the lowest in the S1 stage, then increased in S2. However, the concentration of S2 is lower than CK. The concentration of IAA presented an increasing trend from S1 to S2, with CK being the lowest, while ZR was completely the opposite.

Figure 3.
Changes in the endogenous hormones of aerial roots in flowering cherry ‘Gotenba zakura’. The horizontal axis in the figure represents the three groups, and the vertical axis represents changes in the hormone content at different periods. Error bars show the standard error of the three biological replicates (n = 3).
3.3. Quality Analysis of Transcriptome Sequencing
To further investigate the transcriptomes of aerial roots growth in flowering cherry ‘Gotenba zakura’, we assessed the morphological changes at different stages and selected five representative stages for transcriptome sequencing based on the length of the aerial roots: AR-1 (0–1 mm), AR-2 (1–2 mm), AR-3 (2–4 mm), AR-4 (4–7 mm), and AR-5 (>7 mm), with bark from the same locations used as the control group (CK).
In total, 41.78 G of clean data were produced in this study. The effective data volume of each sample ranged from 6.91 to 7.05 G, the Q30 base distribution ranged from 97.27% to 97.67%, and the average GC content was 45.76% (Table 2). These results indicate that the transcriptome sequencing was of high quality and met the criteria for further data processing.
Table 2.
The quality measurement of the sequencing data.
The statistical analysis of gene expression across the six samples identified a total of 66,224 unigenes. The total length of the unigenes was 103,395,835 bp, with a maximum length of 14,486 bp, and a minimum length of 301 bp. The N50 length was 1305 bp, while the average length was 913.66 bp (Table S2), This demonstrates that the transcriptome sequencing data had high assembly integrity and met the necessary standards.
3.4. Comparative Transcriptomic Analysis of Five Flowering Cherry Developmental Stages
Differentially expressed genes (DEGs) were compared to the control group and selected as significantly DEGs with a p-value (FDR) < 0.05 and a |log2 Fold Change| > 1. To better understand the functions of the unigenes obtained via transcriptome sequencing during the growth of flowering cherry ‘Gotenba zakura’, and to analyze the roles involved in metabolic pathways, the unigenes were mapped to the KECG database. In total, 23,378 unigenes were involved in 142 metabolic pathways. DEGs are enriched in pathways related to the growth of aerial roots and flood tolerance (Table 3).
Table 3.
KEGG pathways for the growth of aerial roots and flood tolerance of flowering cherry ‘Gotenba zakura’.
GO enrichment analysis resulted in the aerial roots growth and flood tolerance GO terms (Table 4), such as the auxin-activated signaling pathway (GO:0009734), ethanol catabolic process (GO:0006068), and hydrogen peroxide catabolic process (GO:0042744).
Table 4.
GO terms related to the aerial roots growth and flood tolerance of flowering cherry ‘Gotenba zakura’.
3.5. Expression Profiles of Genes Related to the Aerial Roots Growth and Flood Tolerance
Based on the analysis of Gene Ontology (GO) enrichment and KEGG pathways, we selected genes related to aerial root growth and flood tolerance. By constructing the gene co-expression network (GCN) and removing irrelevant clusters, we selected 183 candidate DEGs and created a heatmap to analyze their expression levels. The genes during the five distinct periods were clustered into seven clusters, as shown in Figure 4.
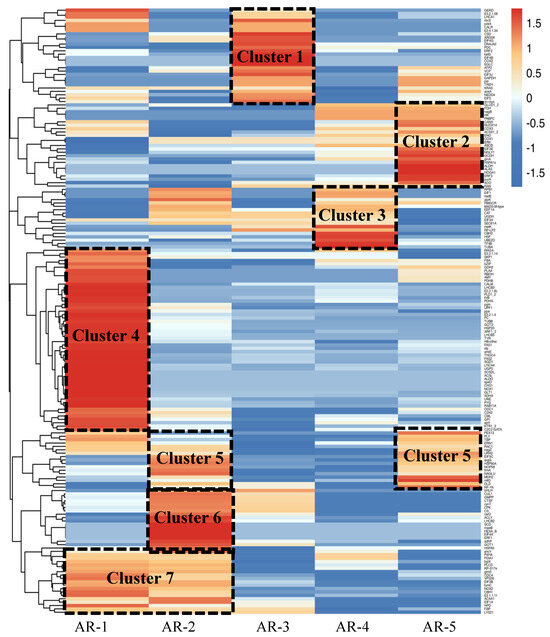
Figure 4.
Expression profiles of genes related to the growth of the aerial roots during five periods (AR1–AR5) in flowering cherry ‘Gotenba zakura’. Hierarchical cluster analysis was performed, and fragments per kilobase of the exon model per million mapped fragments (FPKM) were used for the cluster analysis. According to the different expression profiles, seven modules were framed by a black dashed line.
In Cluster 1 (27 genes), the genes were highly expressed in AR-3, while their expression was not significant in other periods. Cluster 2 included 25 genes that were highly expressed only in AR-5. The expression profiles of 20 genes in Cluster 3 showed a sharp increase in the AR-2. In Cluster 4, 55 genes exhibited high levels of expression in AR-1. Cluster 5 contained 18 genes that were highly expressed in both AR-2 and AR-5. In Cluster 6, 17 genes showed high expression levels in AR-3. The expression levels of genes in Cluster 7 remained constantly high in AR-1 and AR-2.
3.6. Co-Expression Pattern Analysis of Aerial Root Growth Stages
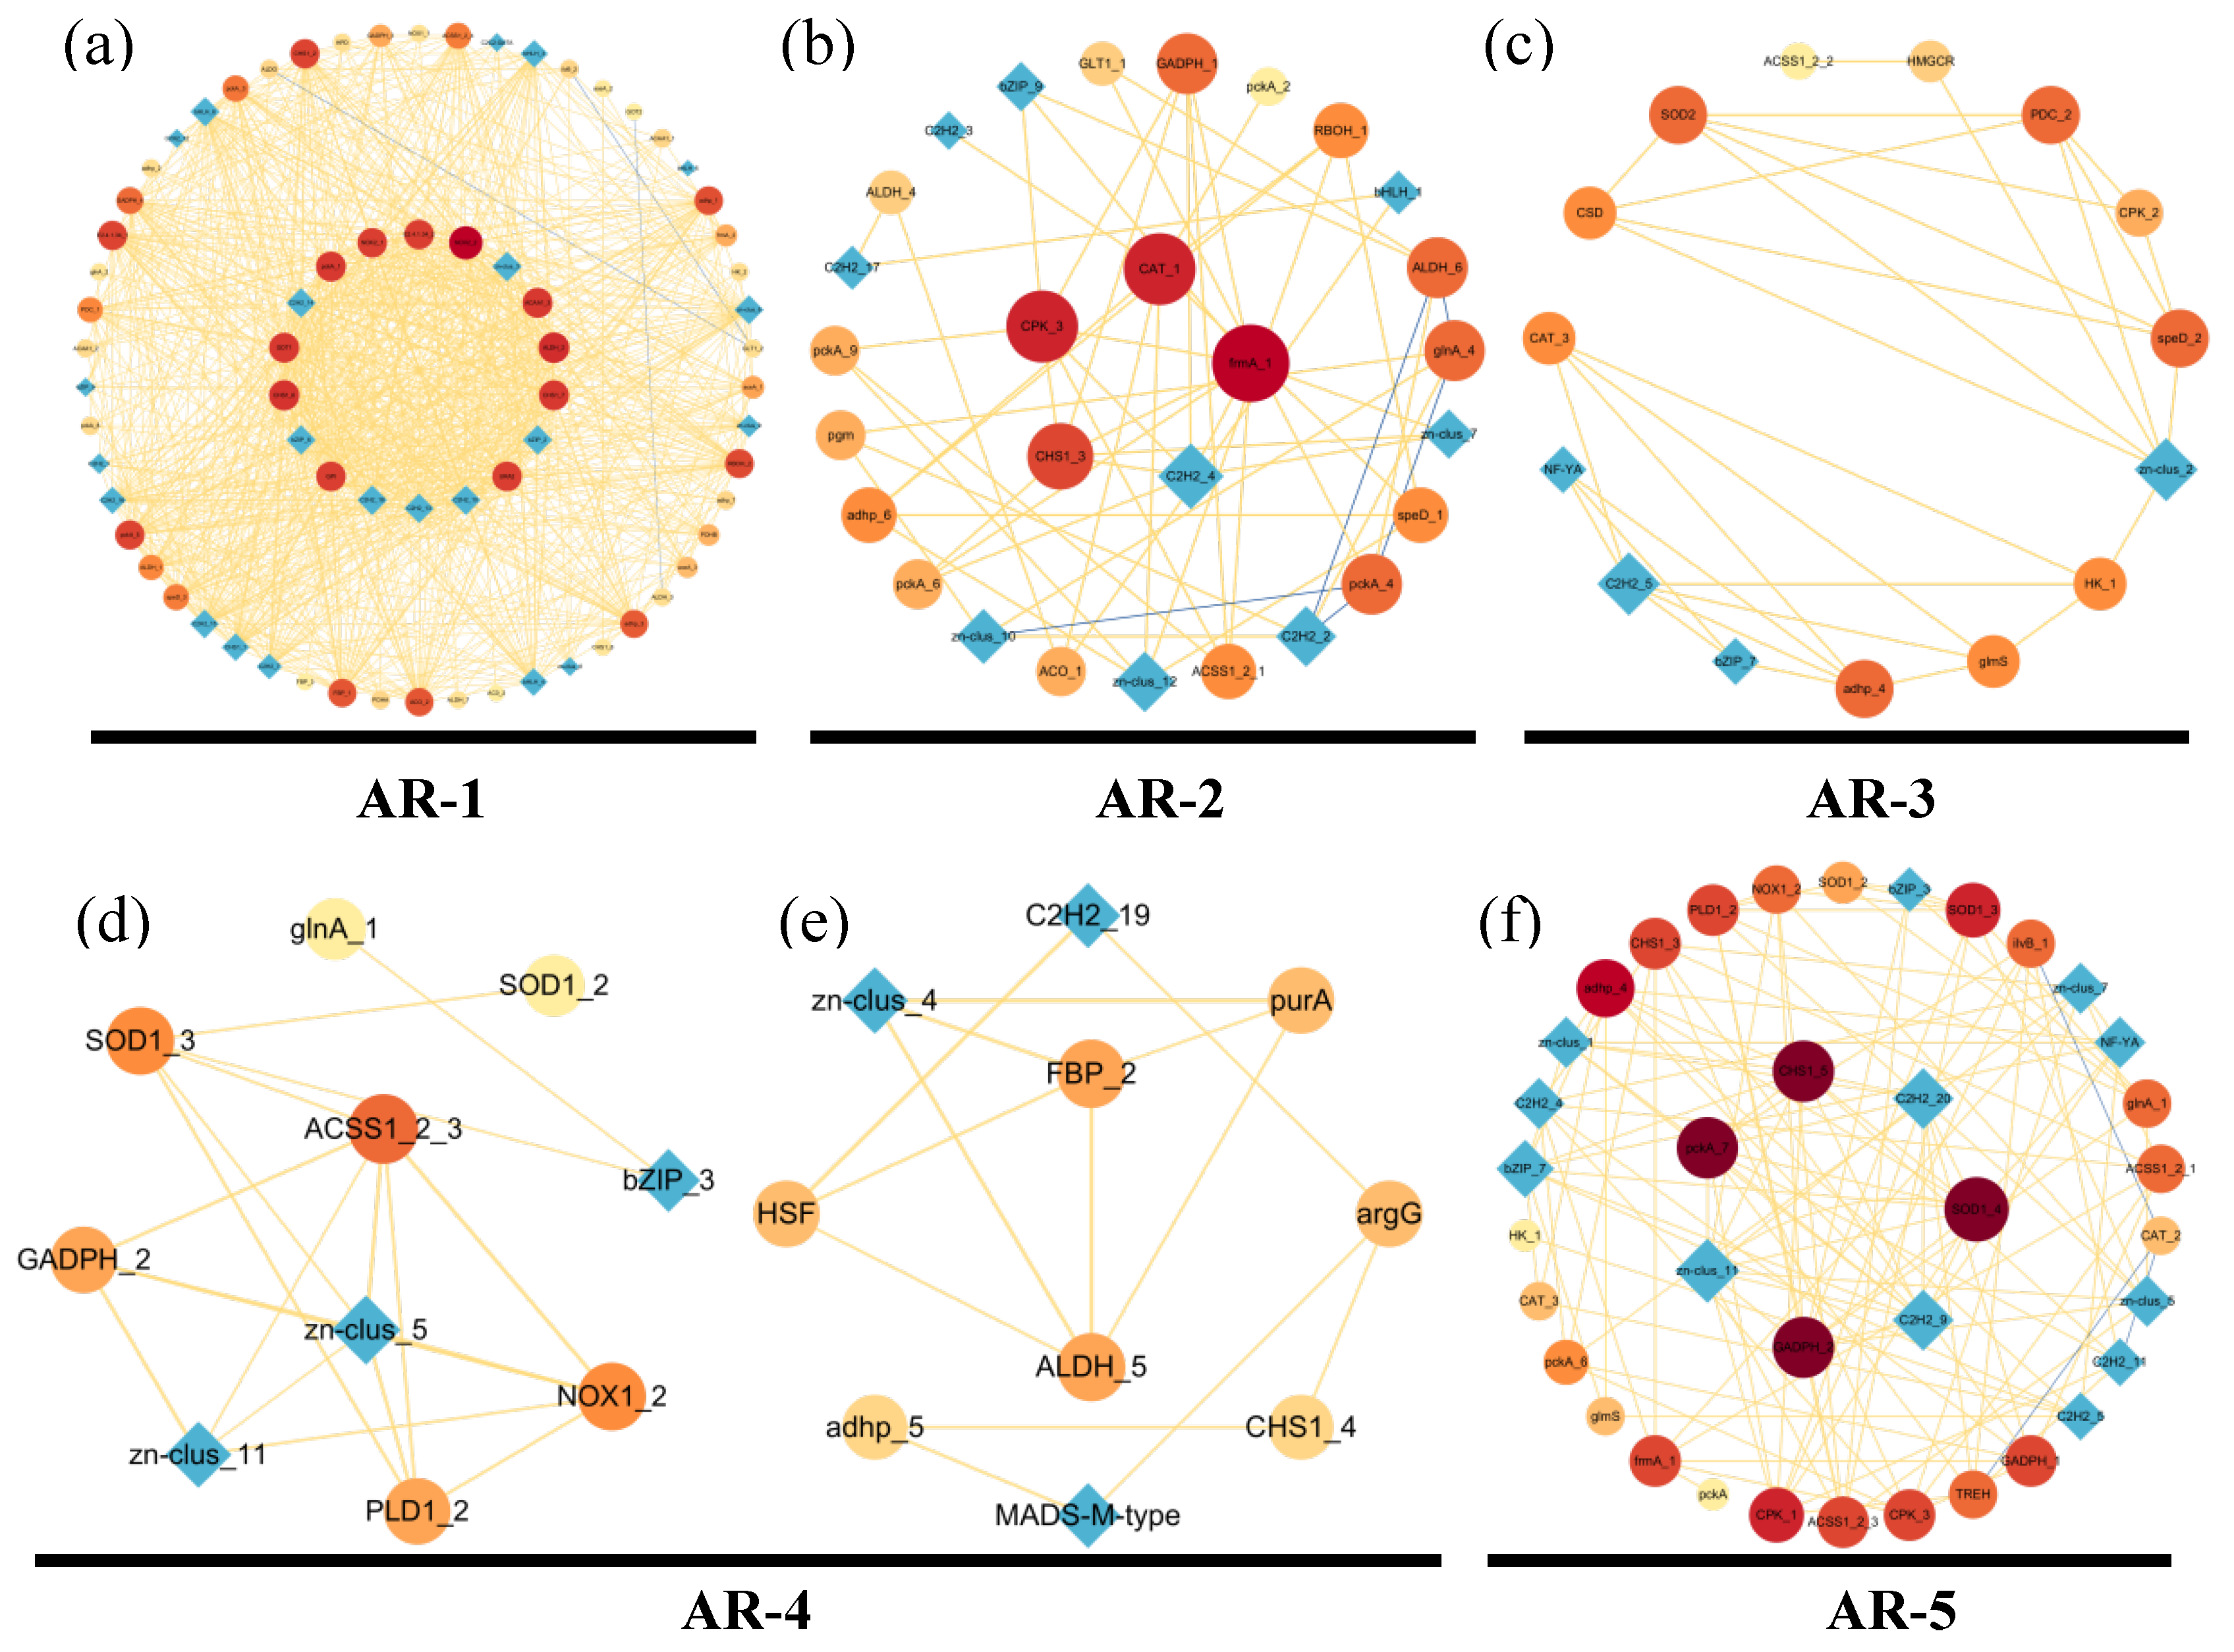
Based on the cluster heatmap shown below, DEGs in the same cluster shared similar expression levels and may play roles in the same period of aerial root development. To further analyze the correlation between genes, we constructed a gene co-expression network (GCN) for each period from AR-1 to AR-5 (Figure 5). Gene ontology (GO) annotations corresponding to each period were added below. The colors of the nodes ran from yellow (lowest degree) to red (highest degree), which represent the level of connectivity; the width of the edges represents the strength of correlation.
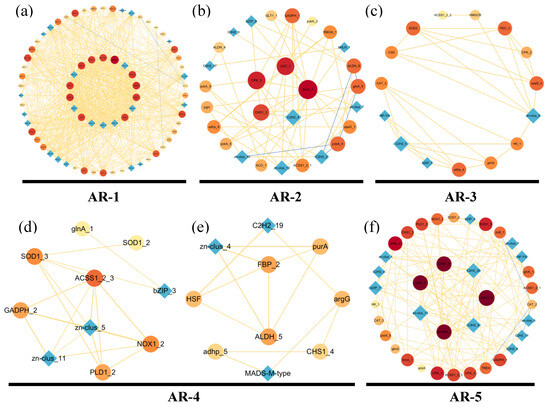
Figure 5.
Co-expression network (GCN) of DEGs related to the growth of the aerial roots during five periods (AR-1–AR-5) in flowering cherry ‘Gotenba zakura’. (a) Co-expression network (GCN) of DEGs of AR-1. (b) Co-expression network (GCN) of DEGs of AR-2. (c) Co-expression network (GCN) of DEGs of AR-3. (d,e) Co-expression network (GCN) of DEGs of AR-4. (f) Co-expression network (GCN) of DEGs of AR-5. Colors ranging from bright yellow (lowest degree) to dark red (highest degree) represents the level of connectivity. The GCN was visualized in Cytoscape. Circles (nodes) represent genes with a name on them, and the width of lines (edges) represent the strength of the correlation between genes.
AR-1 (Figure 5a) included 73 genes (nodes) and 956 connections (edges) which were related to the respiration and cellulose metabolic process. Genes such as FAS1 and FAS2, which are involved in the Citrate cycle and Fatty acid degradation were found in this period. Genes like AMY, bg1X, and CHS1, associated with amino sugar synthesis, provided energy for the aerial growth and participated in the cellulose metabolic process. Amino sugar-related genes, such as genes ACSL and ACAA1, involved in JA were detected. JA is a crucial endogenous hormone, which can not only regulate the growth of aerial roots, but can also mediate plant defense against abiotic stress. Among the hub genes, speD related to the ethanol synthesis (ETH) indicated that aerial root respiration was restricted by waterlogging in AR-1. Additionally, genes such as NOX1, NOX2, and RBOH played a vital role in ROS synthesis.
Abf1 and the transcription factor (TF) bZIP regulate the expression of genes involved in ROS synthesis and abiotic stress. HB-other is an important TF that regulates root development. AR-2 contained two modules of gene co-expression networks (Figure 5b,c). Genes related to the respiratory burst involved in the defense response and ethanol metabolic process were significantly expressed in AR-2. ACO directly induced ethanol synthesis. PEX13 was a key gene involved in ROS synthesis, indicating a response to waterlogging. The presence of genes related to auxin (IAA) synthesis (ALDH) and GAs synthesis (ACSS1_2) indicated a vigorous growth of aerial roots in this period. NF-YA, as an important TF involved in aerial roots growth and stress response, also appeared in this period.
Cell wall organization and catalase activity noted in GO demonstrated the cell division and hydrogen peroxide decomposition in AR-3 (Figure 5d). In this gene interaction network, CSD was identified as a TF that regulated the catalase synthesis genes, participating in the decomposition of hydrogen peroxide and playing a significant role in plant response to waterlogging environments. Gene KatG directed the synthesis of phenylpropionic acid, thereby promoting the synthesis of SA. TREH related to the amino sugar contributed to the cell wall organization, promoting the growth of aerial roots. In addition, genes (PDC, pckA) involved in the acetate metabolic process indicated a respiration reaction under waterlogging.
In the stage AR-4 (Figure 5e), ethanol synthesis and catalase activity were shown in the GO annotation. We assumed that in this period, aerial roots were removing ethanol and ROS, which were harmful for the aerial roots growth. CAT was a key gene for synthesizing catalase.
AR-5 (Figure 5f) included 35 genes (nodes) and 78 lines (edges) related to the respiration and cellulose metabolic process. Genes (ALDH, GCDH, FDH) related to the respiration and acetate metabolic were shown. ACO and PEX13 were also found in this period to strengthen the tolerance of waterlogging.
3.7. Hypothetical Model of the Complex Gene Network
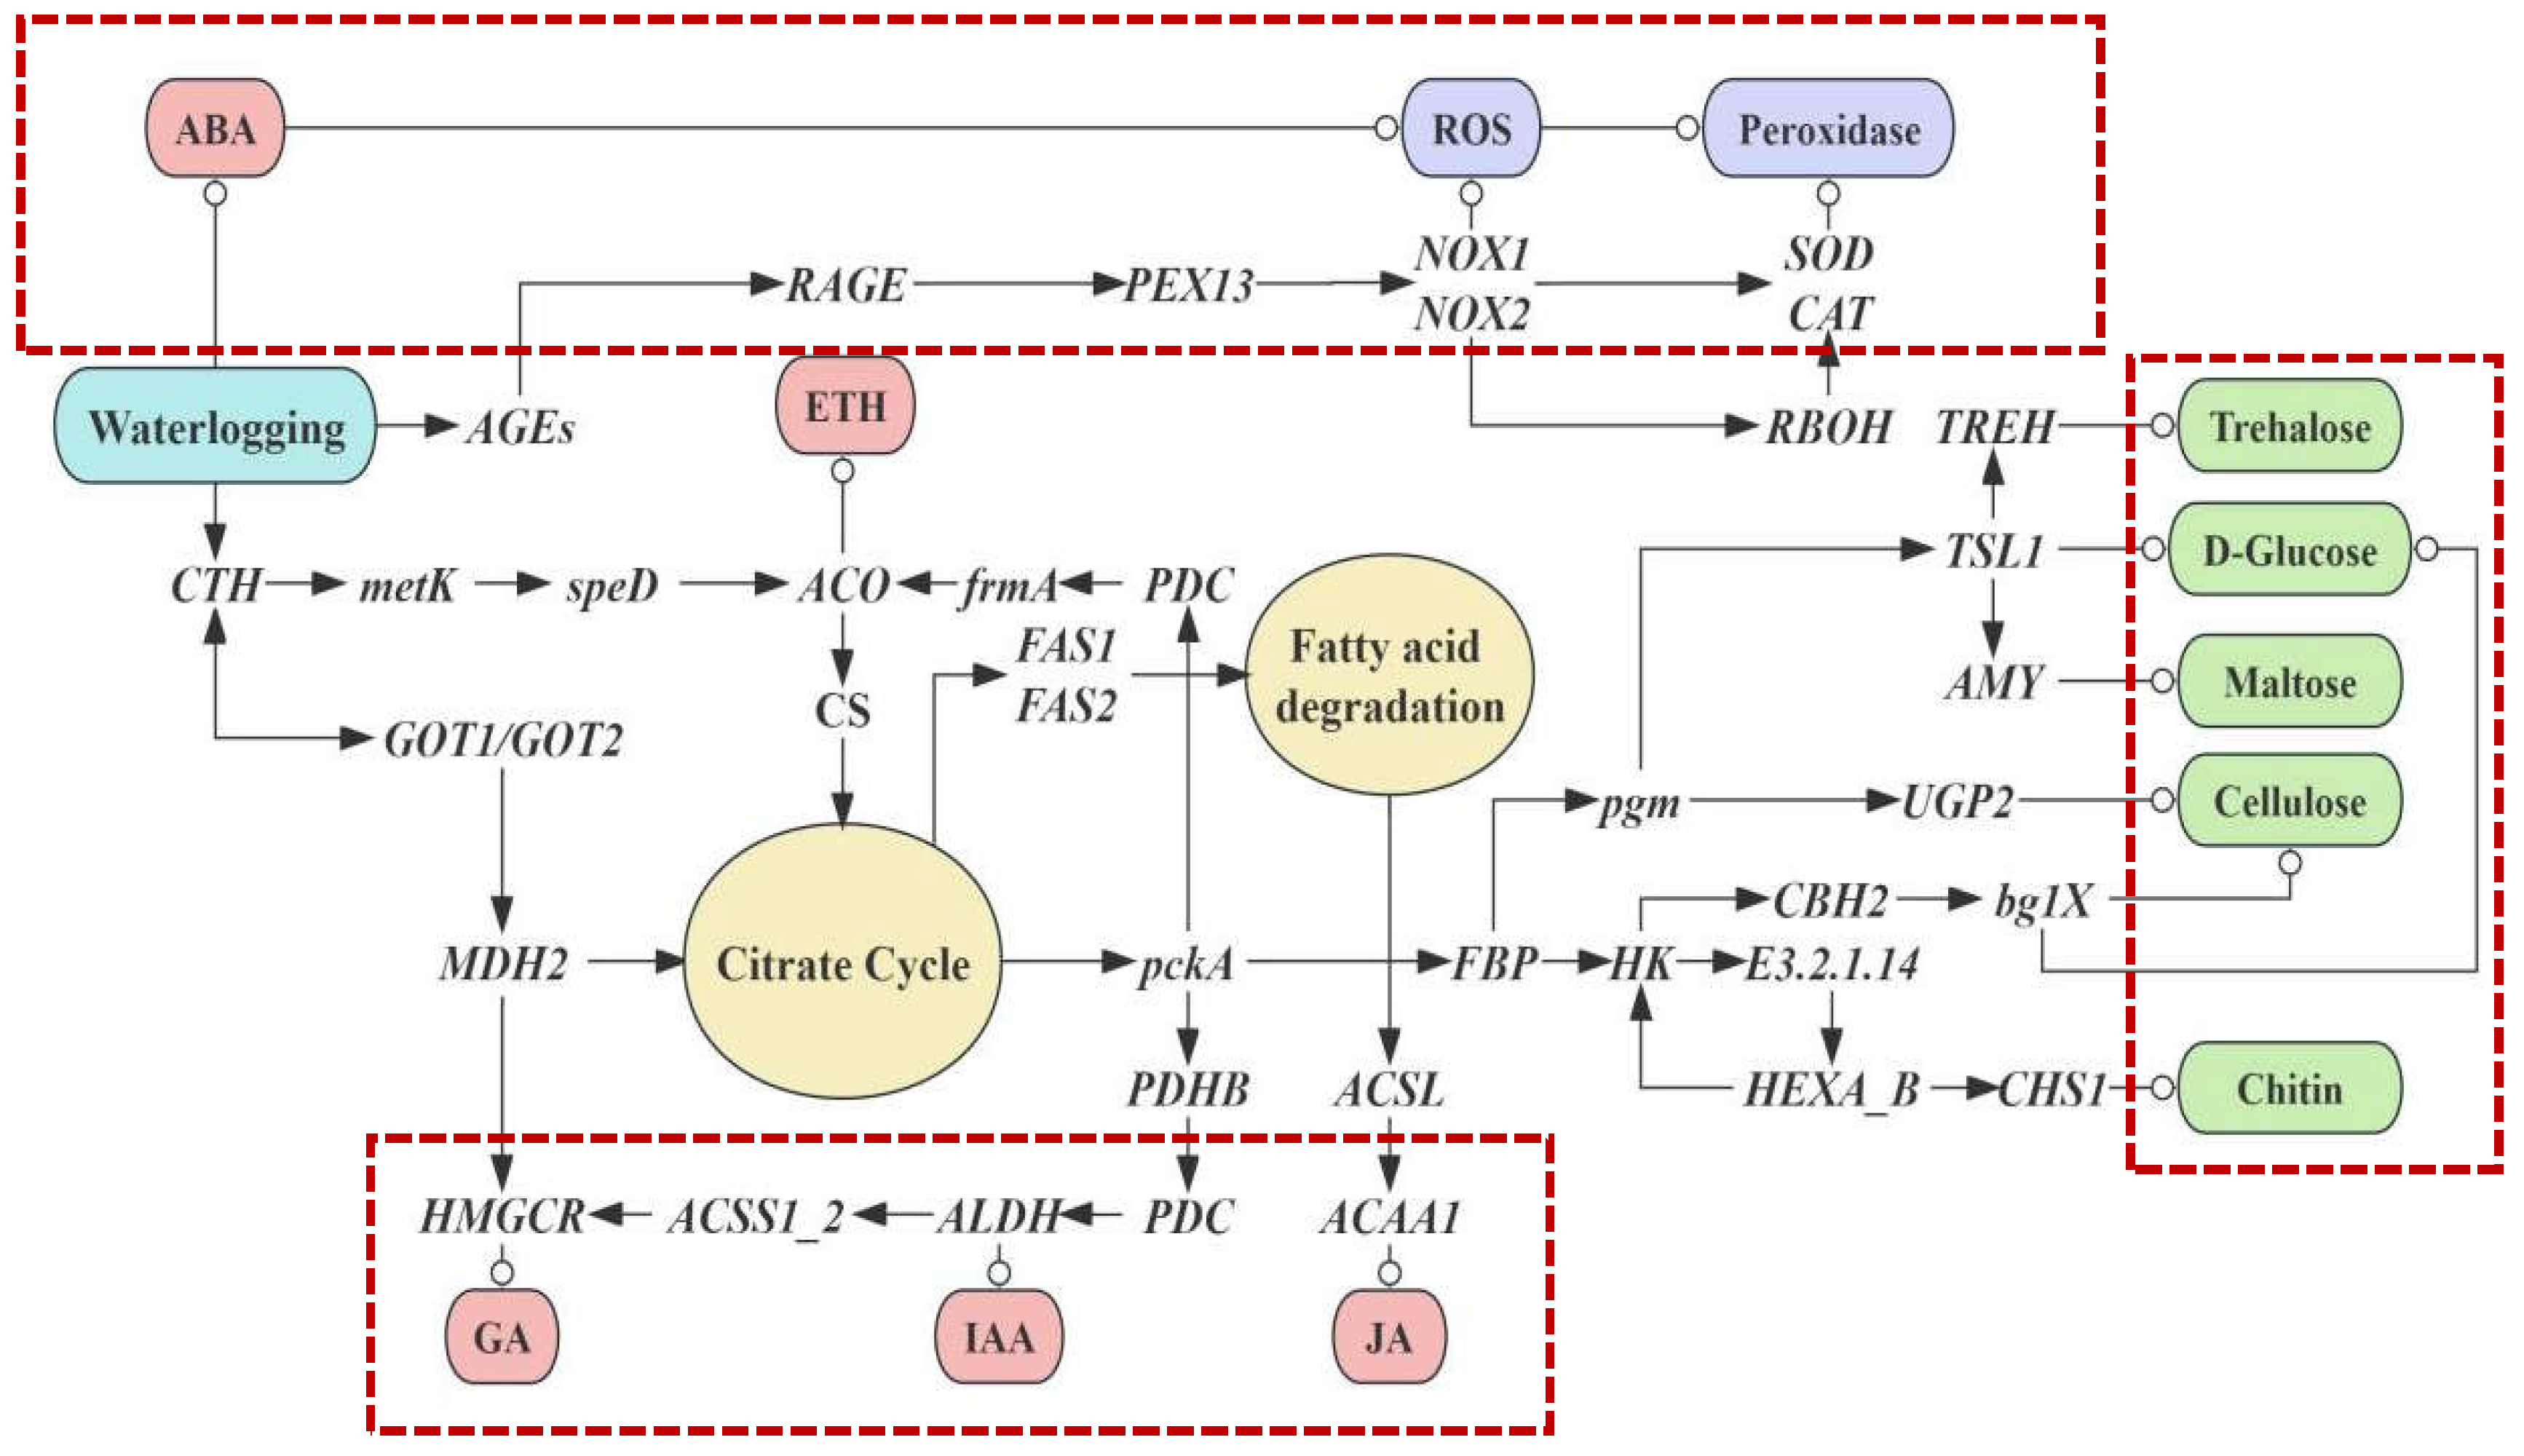
We constructed a network of the aerial root growth and waterlogging tolerance in flowering cherry ‘Gotenba zakura’ (shown in Figure 6). We predicted that the waterlogging tolerance improved when aerial roots were generated. On the one hand, the flood upregulated the genes related to the synthesis and degradation of ROS, while, on the other hand, the plant was activated to induce endogenous hormones and produce amino sugar. Three main pathways were highlighted with red dashed-lined frames, which referred to the regulatory mechanisms of amino sugar, endogenous hormones, and ROS degradation.

Figure 6.
Hypothetical model of the complex gene network of the regulatory mechanism of amino sugar, endogenous hormone, and pathways related to the ROS degradation, which mediate and regulate aerial roots growth and waterlogging tolerance in flowering cherry ‘Gotenba zakura’.
Due to heavy rainfall causing waterlogging, roots were submerged in water, resulting in the anaerobic respiration of plants. Thus, the plants showed a high concentration of ABA and stimulated ROS synthesis. The plant also synthesized ROS by instruction of several genes: AGEs, RAGE, PEX13, NOX1, NOX2, SOD, and CAT (shown in the top frame). A series of genes were triggered in sequence afterward. PEX13 started to operate the peroxisome biosynthesis when the matrix protein was imported. CAT and SOD played a vital role in the hydrogen peroxide metabolism. Superoxide anions (O2−) were transformed from oxygen (O2), with NADPH transformed from NADP; thus, ROS was synthesized. Genes such as NOX1 and NOX2, as well as RBOH, played a part in this process. Later, ROS was degraded to H2O and O2 under the effect of CAT and SOD. High concentrations of ABA, because of the lack of oxygen resulting from waterlogging, also directly led to ROS production.
Several kinds of endogenous hormones were also induced by various genes (shown in the frame at the bottom). ACO contributed to the synthesis of ethylene. Citrate cycle (TCA cycle) and Fatty acid degradation were involved in the expression of genes such as CS, MDH2, and so on. Fatty acid degradation was propelled by FAS1 and FAS2, which were connected to the TCA cycle. Genes related to the endogenous hormone were involved in these biochemical reactions. HMGCR activated by MDH2 could induce GAs. An appropriate concentration of GAs promoted aerial root growth, while an excessive concentration could be an inhibiter. ALDH played a role in the synthesis of IAA, which was essential for the growth of aerial roots. In addition, ACAA1 was also found in the network to induce JA.
The TCA cycle as well as genes such as pckA and FBP played a part in the amino sugar and nucleotide metabolism, as well as the starch and sucrose metabolism (shown in the frame on the right; green nodes indicate the products). Trehalose, D-Glucose, and other amino sugars were produced through the instruction of genes, such as TREH, TSL1, and so on.
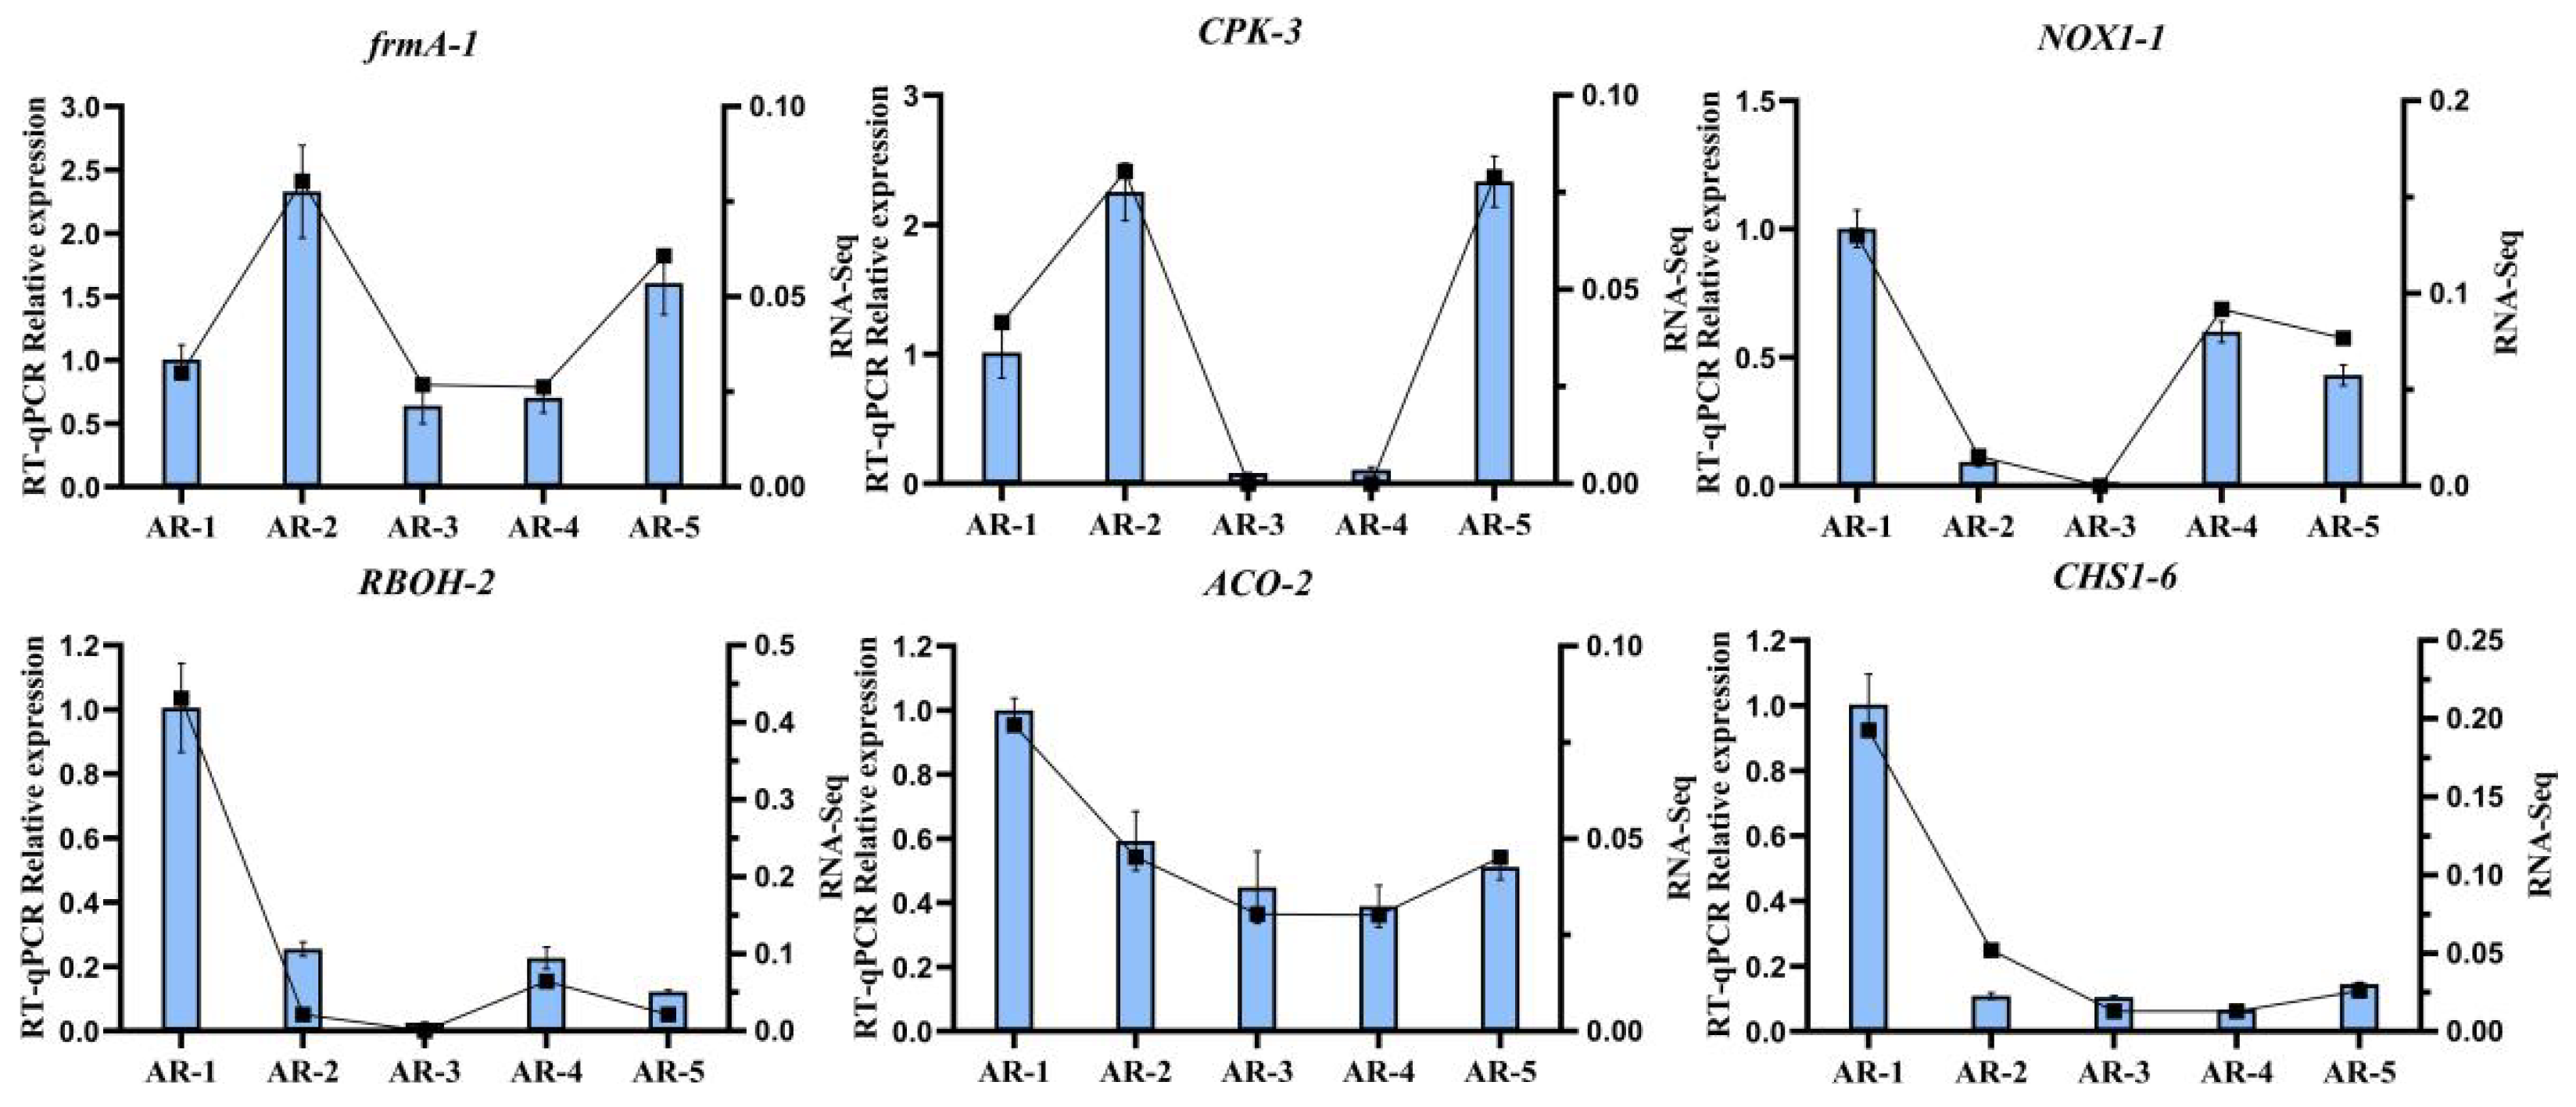
3.8. Validation of DEGs by qRT-PCR
To valid the results of RNA-seq, we randomly selected six key DEGs (frmA-1, CPK-3, NOX1-1, RBOH-2, ACO-2, CHS1-6) for qRT-PCR analysis (Figure 7). We conducted the correlation coefficient between expression level and transcriptome data, which was higher than 0.9, confirming the authenticity of the DEGs.
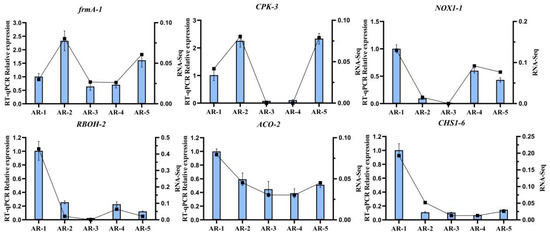
Figure 7.
Validation of the expression of cold-tolerant-related genes via qRT-PCR analysis. Bar charts indicate the values of qRT-PCR. Line plots indicate values of fragments per kilobase per million (FPKM). Error bars indicate the standard deviation of three biological replicates (n = 3).
4. Discussion
Based on the results, we assert that waterlogging is essential for the initiation of aerial roots generation, and ROS degradation plays the most crucial part in waterlogging tolerance.
Our observations clearly indicate that aerial roots cannot be generated in the absence of waterlogging stress. This aligns with the widely accepted notion that hyperosmotic signals caused by flooding lead to the accumulation of ABA, which triggers adaptive responses in plants [44]. Hormone measurements in our study further confirm this mechanism, revealing a strong connection between ABA and ROS accumulation. This relationship explains why plants accumulate ROS under waterlogging stress.
ROS, a collective term for oxygen-containing reactive substances with strong oxidizing properties, such as superoxide anions (O2−) and hydrogen peroxide (H2O2) [45], play a dual role in plant stress responses. Under normal physiological homeostasis conditions, ROS is detoxified through various antioxidant defense mechanisms. However, excessive ROS levels can overwhelm these defenses, causing oxidative stress, cell damage, and even cell death [46,47]. To prevent such damage, plants initiate the formation of aerial roots, which helps them adapt and survive under prolonged waterlogging stress.
Apart from ROS degradation, we propose that the AGE pathway, which is activated during both biotic and abiotic stress [48], also contributes to waterlogging tolerance. Furthermore, environmental changes, particularly oxygen deprivation, result in anaerobic respiration, compelling aerial roots to upregulate certain genes to adapt. We suggest that this gene regulation is another crucial adaptive strategy employed by plants to maintain physiological functions during adverse conditions.
Given these insights, we assume that this waterlogging-tolerant cherry blossom cultivar could serve as a promising rootstock for grafting. By leveraging its tolerance, it may be possible to enhance the waterlogging resistance of cherry blossom plants, mitigating the negative effects of waterlogging in their production and landscape applications.
5. Conclusions
This study demonstrated the cause of aerial roots of cherry ‘Gotenba zakura’ and revealed its waterlogging tolerance through phenotype analysis, hormone determination, and transcriptome analysis. Our study discovered significant pathways contributing to waterlogging tolerance, and ROS degradation was attributed as the most crucial. By analyzing the adaption of molecular mechanisms of aerial root development under waterlogging stress, we explained how aerial roots developed and why waterlogging tolerance can be enhanced. Based on our research, we provided a foundation for stress breeding by introducing a waterlogging-tolerant cultivar which can be a promising rootstock to improve waterlogging tolerance through grafting.
Supplementary Materials
The following supporting information can be downloaded at https://www.mdpi.com/article/10.3390/horticulturae10090991/s1, Table S1: The primer sequences used in qRT-PCR; Table S2: Assembly statistics of the clean reads.
Author Contributions
X.F., T.L. and Y.L. conceptualized and designed the experiment; X.F., T.L. and Y.L. performed the laboratory experiments and statical analysis; X.F., T.L. and Y.L. wrote and revised the manuscript; Y.L. funding acquisition and supervision. All authors have read and agreed to the published version of the manuscript.
Funding
This work was supported by the China National Natural Science Foundation (grant No. 31872138).
Data Availability Statement
Data are contained within the article.
Conflicts of Interest
The authors declare no conflicts of interest.
References
- Lotschert, W.; Liemann, F. Accumulation of salt in the embryo of Rhizophora mangle L. developing on the mother plant. Planta 1967, 77, 142–156. [Google Scholar] [PubMed]
- Vidoz, M.L.; Mignolli, F.; Aispuru, H.T.; Mroginski, L.A. Rapid formation of adventitious roots and partial ethylene sensitivity result in faster adaptation to flooding in the aerial roots mutant of tomato. Sci. Hortic. 2016, 201, 130–139. [Google Scholar] [CrossRef]
- Rich, S.M.; Ludwig, M.; Colmer, T.D. Aquatic adventitious root development in partially and completely submerged wetland plants Cotula coronopifolia and Meionectes brownii. Ann. Bot. 2012, 110, 405–414. [Google Scholar] [CrossRef]
- Deb, C.R.; Pongener, A. Studies on the in vitro regenerative competence of aerial roots of two horticultural important Cymbidium species. J. Plant Biochem. Biotechnol. 2012, 21, 235–241. [Google Scholar] [CrossRef]
- Rasmussen, A.; Dobrijevic, D.P.; Ola, A.; Ishaya, F.D.; Lovelock, C.E. Aerial root physiology: Reaching for the sky or down to earth? Annu. Plant Rev. Online 2019, 2, 753–784. [Google Scholar]
- Voesenek, L.; Bailey-Serres, J. Flood adaptive traits and processes: An overview. New Phytol. 2015, 206, 57–73. [Google Scholar] [CrossRef]
- Bailey-Serres, J.; Lee, S.C.; Brinton, E. Waterproofing crops: Effective flooding survival strategies. Plant Physiol. 2012, 160, 1698–1709. [Google Scholar] [CrossRef]
- Colmer, T.D. Aerenchyma and an inducible barrier to radial oxygen loss facilitate root aeration in upland, paddy and deep-water rice (Oryza sativa L.). Ann. Bot. 2003, 91, 301–309. [Google Scholar] [CrossRef]
- Yamauchi, T.; Nakazono, M. Modeling-based age-dependent analysis reveals the net patterns of ethylene-dependent and -independent aerenchyma formation in rice and maize roots. Plant Sci. 2022, 321, 111340. [Google Scholar] [CrossRef]
- Zotz, G. The systematic distribution of vascular epiphytes a critical update. Bot. J. Linn. Soc. 2013, 171, 453–481. [Google Scholar] [CrossRef]
- Wilson, J.P.; Montañez, I.P.; White, J.D.; Di Michele, W.A.; McElwain, J.C.; Poulsen, C.J.; Hren, M.T. Dynamic Carboniferous tropical forests: New views of plant function and potential for physiological forcing of climate. New Phytol. 2017, 215, 1333–1353. [Google Scholar] [CrossRef] [PubMed]
- Colmer, T.D.; Voesenek, L. Flooding tolerance: Suites of plant traits in variable environments. Funct. Plant Biol. 2009, 36, 665–681. [Google Scholar] [CrossRef] [PubMed]
- Sheeran, L.; Rasmussen, A. Aerial roots elevate indoor plant health: Physiological and morphological responses of three high-humidity adapted Araceae species to indoor humidity levels. Plant Cell Environ. 2023, 46, 1873–1884. [Google Scholar] [CrossRef] [PubMed]
- Biddick, M.; Hutton, I.; Burns, K.C. An alternative water transport system in land plants. Proc. R. Soc. B-Biol. Sci. 2018, 285, 1884. [Google Scholar] [CrossRef]
- Zotz, G.; Winkler, U. Aerial roots of epiphytic orchids: The velamen radicum and its role in water and nutrient uptake. Oecologia 2013, 171, 733–741. [Google Scholar] [CrossRef]
- Wittmann, F.; Parolin, P. Aboveground roots in Amazonian floodplain trees. Biotropica 2005, 37, 609–619. [Google Scholar] [CrossRef]
- Zhi-Guo, E.; Ge, L.; Wang, L. Molecular mechanism of adventitious root formation in rice. Plant Growth Regul. 2012, 68, 325–331. [Google Scholar]
- Pan, R.; Liu, Y.; Buitrago, S.; Jiang, W.; Gao, H.; Han, H.; Wu, C.; Wang, Y.; Zhang, W.; Yang, X. Adventitious root formation is dynamically regulated by various hormones in leaf-vegetable sweetpotato cuttings. J. Plant Physiol. 2020, 253, 153267. [Google Scholar] [CrossRef]
- Woodward, A.W.; Bartel, B. Auxin: Regulation, action, and interaction. Ann. Bot. 2005, 95, 707–735. [Google Scholar] [CrossRef]
- McAdam, S.A.M.; Manzi, M.; Ross, J.J.; Brodribb, T.J.; Gómez-Cadenas, A. Uprooting an abscisic acid paradigm: Shoots are the primary source. Plant Signal. Behav. 2016, 11, 6. [Google Scholar] [CrossRef]
- Yang, G.Q.; Wan, F.H.; Liu, W.X.; Guo, J.Y. Influence of two allelochemicals from Ageratina adenophora Sprengel on ABA, IAA and ZR contents in roots of upland rice seedlings. Allelopath. J. 2008, 21, 253–262. [Google Scholar]
- Li, H.; Teng, R.-M.; Liu, J.-X.; Yang, R.-Y.; Yang, Y.-Z.; Lin, S.-J.; Han, M.-H.; Liu, J.-Y.; Zhuang, J. Identification and analysis of genes involved in auxin, abscisic acid, gibberellin, and brassinosteroid metabolisms under drought stress in tender shoots of tea plants. DNA Cell Biol. 2019, 38, 1292–1302. [Google Scholar] [CrossRef] [PubMed]
- Jin, H.; Do, J.; Shin, S.-J.; Choi, J.W.; Choi, Y.I.; Kim, W.; Kwon, M. Exogenously applied 24-epi brassinolide reduces lignification and alters cell wall carbohydrate biosynthesis in the secondary xylem of Liriodendron tulipifera. Phytochemistry 2014, 101, 40–51. [Google Scholar] [CrossRef] [PubMed]
- Bellini, C.; Pacurar, D.I.; Perrone, I. Adventitious roots and lateral roots: Similarities and differences. Annu. Rev. Plant Biol. 2014, 65, 639. [Google Scholar] [CrossRef] [PubMed]
- Wasternack, C. Jasmonates: An update on biosynthesis, signal transduction and action in plant stress response, growth and development. Ann. Bot. 2007, 100, 681–697. [Google Scholar] [CrossRef]
- Ohta, S.; Yamamoto, T.; Nishitani, C.; Katsuki, T.; Iketani, H.; Omura, M. Phylogenetic relationships among Japanese flowering cherries (Prunus subgenus Cerasus) based on nucleotide sequences of chloroplast DNA. Plant Syst. Evol. 2007, 263, 209–225. [Google Scholar] [CrossRef]
- Li, M.; Song, Y.F.; Sylvester, S.P.; Wang, X.R. Comparative analysis of the complete plastid genomes in Prunus subgenus cerasus (Rosaceae): Molecular structures and phylogenetic relationships. PLoS ONE 2022, 17, e0266535. [Google Scholar] [CrossRef]
- Küçükyumuk, C.; Yildiz, H.; Sansu, H.C.; Kaçal, E.; Koçal, H. Response of sweet cherry grafted on different rootstocks to water stress. Fresenius Environ. Bull. 2015, 24, 3014–3024. [Google Scholar]
- Solari, L.I.l.; Johnson, S.; Dejong, T.M. Hydraulic conductance characteristics of peach (Prunus persica) trees on different rootstocks are related to biomass production and distribution. Tree Physiol. 2006, 26, 1343–1350. [Google Scholar] [CrossRef]
- Basile, B.; Marsal, J.; DeJong, T.M. Daily shoot extension growth of peach trees growing on rootstocks that reduce scion growth is related to daily dynamics of stem water potential. Tree Physiol. 2003, 23, 695–704. [Google Scholar] [CrossRef]
- He, Z. (Ed.) Guidance to experiment on chemical control in crop plants. In Guidance to Experiment on Chemical Control in Crop Plants; Beijing Agricultural University Publishers: Beijing, China, 1993; pp. 60–68. [Google Scholar]
- Yang, J. Hormonal changes in the grains of rice subjected to water stress during grain filling. Plant Physiol. 2001, 127, 315–323. [Google Scholar] [CrossRef] [PubMed]
- Weiler, E.W.; Jourdan, P.S.; Conrad, W. Levels of indole-3-acetic acid in intact and decapitated coleoptiles as determined by a specific and highly sensitive solid-phase enzyme immunoassay. Planta 1981, 153, 561–571. [Google Scholar] [CrossRef] [PubMed]
- Bolger, A.M.; Lohse, M.; Usadel, B. Trimmomatic: A flexible trimmer for Illumina sequence data. Bioinformatics 2014, 30, 2114–2120. [Google Scholar] [CrossRef]
- Grabherr, M.G.; Haas, B.J.; Yassour, M.; Levin, J.Z.; Thompson, D.A.; Amit, I.; Adiconis, X.; Fan, L.; Raychowdhury, R.; Zeng, Q.; et al. Trinity: Reconstructing a full-length transcriptome without a genome from RNA-Seq data. Nat. Biotechnol. 2011, 29, 644–652. [Google Scholar] [CrossRef] [PubMed]
- Buchfink, B.; Xie, C.; Huson, D.H. Fast and sensitive protein alignment using DIAMOND. Nat. Methods 2015, 12, 59–60. [Google Scholar] [CrossRef]
- Kanehisa, M.; Araki, M.; Goto, S.; Harrori, M.; Hirakawa, M.; Itoh, M. KEGG for linking genomes to life and the environment. Nucleic Acids Res. 2008, 36, D480–D484. [Google Scholar] [CrossRef]
- Langmead, B.; Salzberg, S.L. Fast gapped-read alignment with Bowtie 2. Nat. Methods 2012, 9, 357–359. [Google Scholar] [CrossRef]
- Roberts, A.; Pachter, L. Streaming fragment assignment for real-time analysis of sequencing experiments. Nat. Methods 2013, 10, 71–73. [Google Scholar] [CrossRef]
- Roberts, A.; Trapnell, C.; Donaghey, J.; Rinn, J. Improving RNA-Seq expression estimates by correcting for fragment bias. Genome Biol. 2011, 12, R22. [Google Scholar] [CrossRef]
- Love, M.I.; Huber, W.; Anders, S. Moderated estimation of fold change and dispersion for RNA-seq data with DESeq2. Genome Biol. 2014, 15, 550. [Google Scholar] [CrossRef]
- Tang, D.D.; Chen, M.J.; Huang, X.H.; Zhang, G.C.; Zeng, L.; Zhang, G.S.; Wu, S.; Wang, Y. SRplot: A free online platform for data visualization and graphing. PLoS ONE 2023, 18, 11. [Google Scholar] [CrossRef] [PubMed]
- Kumar, L.; Futschik, M. Mfuzz: A software package for soft clustering of microarray data. Bioinformation 2007, 2, 5–7. [Google Scholar] [CrossRef]
- Zhu, J.-K. Salt and drought stress signal transduction in plants. Annu. Rev. Plant Biol. 2002, 53, 247–273. [Google Scholar] [CrossRef] [PubMed]
- Li, G.Q.; Arnold, R.J.; Liu, F.F.; Li, J.Q.; Chen, S.F. Identification and pathogenicity of Lasiodiplodia species from Eucalyptus urophylla × grandis, Polyscias balfouriana and Bougainvillea spectabilis in Southern China. J. Phytopathol. 2015, 163, 956–967. [Google Scholar] [CrossRef]
- Xiong, C.H.; Xia, Y.L.; Zheng, P.; Wang, C.S. Increasing oxidative stress tolerance and subculturing stability of Cordyceps militaris by overexpression of a glutathione peroxidase gene. Appl. Microbiol. Biotechnol. 2013, 97, 2009–2015. [Google Scholar] [CrossRef] [PubMed]
- Farooq, M.A.; Niazi, A.K.; Akhtar, J.; Saifullah; Farooq, M.; Souri, Z.; Karimi, N.; Rengel, Z. Acquiring control: The evolution of ROS-Induced oxidative stress and redox signaling pathways in plant stress responses. Plant Physiol. Biochem. 2019, 141, 353–369. [Google Scholar] [CrossRef]
- Rankenberg, T.; Geldhof, B.; van Veen, H.; Holsteens, K.; Van de Poel, B.; Sasidharan, R. Age-dependent abiotic stress resilience in plants. Trends Plant Sci. 2021, 26, 692–705. [Google Scholar] [CrossRef]


Disclaimer/Publisher’s Note: The statements, opinions and data contained in all publications are solely those of the individual author(s) and contributor(s) and not of MDPI and/or the editor(s). MDPI and/or the editor(s) disclaim responsibility for any injury to people or property resulting from any ideas, methods, instructions or products referred to in the content. |
© 2024 by the authors. Licensee MDPI, Basel, Switzerland. This article is an open access article distributed under the terms and conditions of the Creative Commons Attribution (CC BY) license (https://creativecommons.org/licenses/by/4.0/).