Article

Transcriptional Regulatory Networks Oscillate Seasonal Plasticity of Fruit Metabolism in Melon

1
Laboratory of Germplasm Innovation and Molecular Breeding, Institute of Vegetable Science, Zhejiang University, Hangzhou 310058, China
2
College of Horticulture and Landscape Architecture, Yangzhou University, Yangzhou 225009, China
3
College of Agriculture and Biotechnology, Wenzhou Vocational College of Science and Technology, Wenzhou Academy of Agricultural Sciences, Wenzhou 325006, China
4
Hainan Institute, Zhejiang University, Yazhou Bay Science and Technology City, Sanya 572025, China
5
Key Laboratory of Horticultural Plant Growth and Development, Ministry of Agriculture and Rural Affairs, Hangzhou 310058, China
*
Author to whom correspondence should be addressed.
Horticulturae 2024, 10(9), 993; https://doi.org/10.3390/horticulturae10090993
Submission received: 8 July 2024 / Revised: 1 September 2024 / Accepted: 8 September 2024 / Published: 20 September 2024
(This article belongs to the Special Issue Germplasm and Breeding Innovations in Cucurbitaceous Crops)

Abstract

:
Environmental cues profoundly influence the developmental processes of plants that evolve to produce specific phenotypes. However, the developmental plasticity in response to seasonal changes, particularly temperature and day length, has not been fully understood in fruit development and quality. To explore the mechanism by which the transcriptional network adapts to external environmental changes by regulating metabolism during the development of melon fruits, this study selected the fruits grown under spring and fall conditions and focused on specific phenylpropanoid pathway metabolites, including phenolic acids, lignin, and flavonoids. Significant changes in these compounds result in noticeable differences in fruit quality such as texture, flavor, and color, which are of utmost importance to consumers. Employing co-expression analysis complemented by machine learning, we identified hub genes and pathways governing the metabolic changes, highlighting the influence of temperature and photoperiod cues in mediating the transcriptional regulatory networks. These results provide valuable insights into how fruits adapt to seasonal variability, and drive us to innovate broadly adaptable melon cultivars poised for improved climate resilience in the future.

1. Introduction

Melon (Cucumis melo), a member of the Cucurbitaceae family, is a global fruit crop of great economic importance, with an estimated annual yield of more than 30 million tons worldwide “http://www.fao.org/faostat/” (accessed on 15 November 2023). The most important traits of melon for consumer acceptance are its sweet, refreshing flesh and flavor [1]. To date, these traits have been extensively studied independently from a genetic or metabolic perspective [2,3,4,5]. These concerned fruit quality traits are susceptible to being influenced by the environment, such as temperature, light, or other factors [6,7,8]. Typically, winter/spring and summer/autumn cropping cycles are used mainly to meet the requirements of annual melon production, resulting in seasonally variable fruit quality.
Seasonal turnover is the dominant environmental fluctuation that organisms experience during their lifetime [9,10]. Both temperature and photoperiod are generally considered to be the two reliable cues for the response of plant development to environmental seasonality [11]. The combination of temperature and day length in natural habitats has shaped the adaptation to seasonal environments of the perennial plant Arabidopsis halleri subsp. Gemmifera, and its seasonal dynamics of the transcriptome elucidate the molecular mechanisms of environmental responses and demonstrate how plants utilize multiple types of environmental information to adapt to seasonal environmental changes [12]. Developmental plasticity in various traits is often observed to be seasonally controlled, as they evolve in a seasonal context. For example, many phenological events in plants, such as flowering, fruiting, budding, bud formation, and growth arrest [13,14]. In addition to the visible phenological events, physiological changes such as photosynthetic activity and metabolic changes also occur [12]. However, our current understanding of how molecular mechanisms govern the seasonal operation of plants as a whole remains limited. Understanding how environmental conditions regulate the biosynthesis of these specialized metabolites is essential for fruit development. Many existing studies have primarily focused on the relationship between environmental factors and plant growth, and the understanding of the interaction between fruit development caused by environmental cues and fruit quality is relatively preliminary and fragmented. Fruits are the plant organs with the most abundant metabolites; therefore, metabolomics provides an opportunity to study the metabolic processes involved in fruit quality development [15]. High-throughput screening of phenylalanine patterns through GC- or UPLC-MS allows to correlate metabolite patterns to transcriptional profiles in an organ- or tissue-specific manner in the absence of phenotypes [16]. This method may uncover the effects of individual genes in the phenylpropanoid pathway on other metabolic pathways [17].
Our study unveiled a strong correlation between metabolic and transcriptomic changes during fruit development under seasonal conditions. Employing an innovative approach to data mining, we utilized machine learning methods to iteratively cluster melon fruit transcriptome data. Through association studies linking key metabolites to protein interaction networks, we elucidated the molecular mechanisms influencing fruit quality under varying seasonal growth conditions. Furthermore, we identified central regulatory genes responsive to environmental changes. This collaborative regulatory network defined by highly correlated metabolites, referred to as “hub”, serves as a promising target for future high-throughput screening in breeding. This approach offers a comprehensive understanding of the transcriptional regulatory networks mediating the seasonal plasticity of fruit metabolism in melons.

2. Materials and Methods

2.1. Plant Materials, Growth Conditions and Sampling

Cucumis melo ssp. melo (var. inodorus) (XLH), a germplasm material of Xinjiang Hami melon, was introduced from Xinjiang Academy of Agricultural Sciences. As a high-sucrose accumulation cultivar, XLH showed significant quality differences in spring and autumn cultivation in the eastern coastal areas of China, was selected as a material and grown in a greenhouse at Ningbo Weimeng Seed Co., Ltd. (Ningbo, China) (121.634519° N, 29.838729° E) in 2019. According to the latitude and longitude of the growth site of melon materials, temperature and the duration of illumination were obtained and recorded from the National Meteorological Center (http://www.nmc.cn) (Figure 1a,b).
Fruits were sampled at five stages with a 10-day interval from 0 days (female flowers bloomed on the same day, and the petals were removed with tweezers) to 40 days after hand pollination in spring and autumn, respectively. Using a 0.5 cm diameter punch, a round 2 cm thick sarcocarp was removed and placed in a 50 mL CORNING RNase-free centrifuge tube. Samples were collected with three biological replicates. All samples collected were snap-frozen in liquid nitrogen and stored at −80 °C for RNA and metabolite extractions.

2.2. RNA Extraction and Library Construction

Total RNA was extracted from fruit samples at different developmental stages using Trizol. RNA degradation and contamination were monitored by 0.8% agarose gel electrophoresis. NanoPhotometer® Spectrophotometer (IMPLEN, Westlake Village, CA, USA) and Qubit® RNA Assay Kit in Qubit®2.0 Fluorometer (Life Technologies, Carlsbad, CA, USA) were used to detect the purity and concentration, respectively. Sequencing libraries of the qualified RNA were prepared using the NEBNext® UltraTM RNA Library Prep Kit for Illumina® (NEB, Ipswich, MA, USA).
From total RNA, mRNA was purified using oligo (dT) attached magnetic beads. The resulting mRNA was then randomly fragmented using divalent cations in NEB Fragmentation Buffer. Using the fragments as templates, first-strand cDNA was synthesized using random hexamer primers in the M-MuLV Reverse Transcriptase system, followed by the synthesis of second-strand cDNA using dNTPs as raw materials in DNA Polymerase I. After converting overhangs of the obtained double-stranded cDNA into blunt ends and adding poly-A tail at 3′ ends, NEBNext Adaptor was ligated to prepare for hybridization. To select cDNA fragments of approximately 200 bp in length, the library fragments were screened using the AMPure XP system (Beckman Coulter, Beverly, NJ, USA). PCR was then performed and the products were purified by using AMPure XP beads (AMPure XP system). Finally, the insert size of the library was determined using Agilent Bioanalyzer 2100 system (Agilent Technologies, Santa Clara, CA, USA) to evaluate the quality.

2.3. Metabolomic Analysis

Metabolite identification and quantification were performed using the database of Metware Bio-Tech Co. (Wuhan, China). Divided six 40-days-after-pollination (DAP) samples into spring and autumn groups for metabolic study, with 3 biological replicates in each group. The biological samples were freeze-dried using a vacuum freeze-dryer (Scientz-100F) (Scientz, Ningbo, China) and then comminuted using a mixer mill (MM 400) (Retsch, Hahn, Germany) with a zirconia bead for 1.5 min at 30 Hz. Then, 100 mg of lyophilized powder was dissolved in 1.2 mL of 70% methanol solution, by vortexing for 30 s every 30 min for a total of 6 times. After centrifugation at 12,000 rpm for 10 min, the extracts were filtered (SCAA-104, 0.22 μm pore size; ANPEL, Shanghai, China, http://www.anpel.com.cn/) before UPLC-MS/MS analysis. Sample extracts were analyzed using a UPLC-ESI-MS/MS system (UPLC, SHIMADZU Nexera X2, https://www.shimadzu.com.cn/; MS, Applied Biosystems 6500 Q TRAP, https://www.thermofisher.cn/cn/zh/home/brands/applied-biosystems.html.cn/).
All detected metabolites were qualitatively analyzed based on the MetWare database and quantified using the Multiple Reaction Monitoring (MRM) method. Processed metabolite mass spectrometry data using Analyst 1.6.3 software. Before conducting differential analysis, the multivariate statistical analysis method principal component analysis (PCA) was used to observe the degree of variation between different groups and within group samples, and an orthogonal partial least squares-discriminant analysis (OPLS-DA) model was constructed. Based on the variable importance in projection (VIP) of the multivariate analysis OPLS-DA model, differential metabolites were preliminarily screened. Combining the fold change (FC) of univariate analysis, use VIP ≥ 1 and FC ≥ 2 or ≤0.5, i.e., |Log2 (fold change)| ≥ 1, to determine differential metabolites with significantly different contents. The Kyoto Encyclopedia of Genes and Genomes (KEGG) database with a p-value < 0.01 was used to study differential metabolites in spring melon fruits compared to autumn ones.

2.4. Transcriptome Analysis

RNA-seq (RNA sequencing) was carried out on fruit samples from five stages (0, 10, 20, 30, and 40 DAP) in spring and autumn, in an attempt to record the dynamic changes in the unpollinated ovary to the mature fruit. After the library was qualified, sequencing was performed on a BGISEQ MGISEQ-2000RS platform from Metware Bio-Tech Co. (Wuhan, China). Library preparations were sequenced on an Illumina Hiseq platform. Fastp v0.19.3 was used to filter the raw data and remove reads containing adapters. Used HISAT v2.1.0 to construct the index [18]. Clean reads were then mapped to the Cucumis melo reference genome DHL92 v3.6.1 (http://cucurbitgenomics.org/ftp/genome/melon/DHL92/v3.6.1/, accessed on 15 November 2023). StringTie (v2.2.1) was used to perform statistics on the expression of all genes [19]. Differential expression analysis was performed using the DESeq2 [20]. Multiple hypothesis testing was performed to correct the p-value of the difference test, and the threshold value of the p-value threshold was determined by controlling the False Discovery Rate (FDR). Gene Ontology (GO) and KEGG pathway enrichment analysis of differentially expressed genes were performed using clusterProfiler (v4.9.0.2) [21], with p-adjust (FDR) < 0.05 as the threshold.

2.5. Machine Learning-Based Co-Expression Analysis

K-means, a deep clustering algorithm in machine learning, was used in this work to classify the gene clusters with high similarity in the study and to acquire hub genes to support the co-expression analysis. Cytoscape (v3.9.1) used to visualize the co-expression networks of all the relevant differential expressed genes (DEGs). For the co-expression network construction, BLASTP is used to identify the Arabidopsis homologs for the melon proteins. Cytoscape and the integrated STRING application, stringAPP (v2.0.3), and clusterMaker2 (v2.3.4), were used to construct the core hub protein–protein interaction (PPI) network and retrieve annotated gene sets for network enrichment analysis [22]. The input DEGs were placed into the STRING data network using the Analyze Network function, and then classified into 3 clusters using the k-means clustering function, with Euclidean distance as the distance metric, average shortest path length, betweenness centrality, closeness centrality, clustering coefficient, degree, eccentricity, and topological coefficient as node attributes, and 100 iterations were performed. Extract the cluster containing the gene with the highest overall centrality as the main subnetwork, with its genes serving as core hubs. KEGG and GO network enrichment analysis from the STRING application in Cytoscape was used to identify enriched gene function pathways within the network.

2.6. Enrichment Analysis

The genes in the main subnetwork of each stage ranked in the top 20% of both degree and betweenness centrality were identified, generating an expression set of 111 network-related DEGs and a correlation matrix based on Pearson’s Correlation Coefficient (PCC) calculated by FPKM values of gene pairs. A PPI network was constructed using the same method as the previous description to analyze the co-expression relationship at the gene level.
Manually checked and removed all nodes with no edge, along with the pairs that had |PPC| values < 0.8 to filter the expression set object to include only genes that are highly correlated with each other. Thus, the remaining 97 nodes show the potential relationships, and the edges in the network connect genes that are highly positively or inversely correlated. Closely related genes are clustered together using the k-means clustering function. GO enrichment analysis from the string application in Cytoscape subjected to functional enrichment analysis using the string enrichment function (FDR < 0.05).
The “igraph” package in R computes the attributes of nodes and edges from the correlation matrix. The shortest path length between any two nodes, i.e., the distance, was used as a proxy to evaluate their co-expression level. A distance matrix was then constructed in which the value represented the distance between any two nodes. Different GO biological processes were identified by searching for directly connected gene pairs (distance = 1) in the matrix. For simplicity, only pathways containing ≤ 10 hub genes were retained for further analysis. The co-expressed clusters were determined by extracting the gene pairs that were clustered together in the network. In addition to directly connected gene pairs in the same pathway, gene pairs that were indirectly connected with relatively short distances could also be co-expressed. Finally, pathway pairs with a distance ≤ 4 were considered as associated pathways.

3. Results

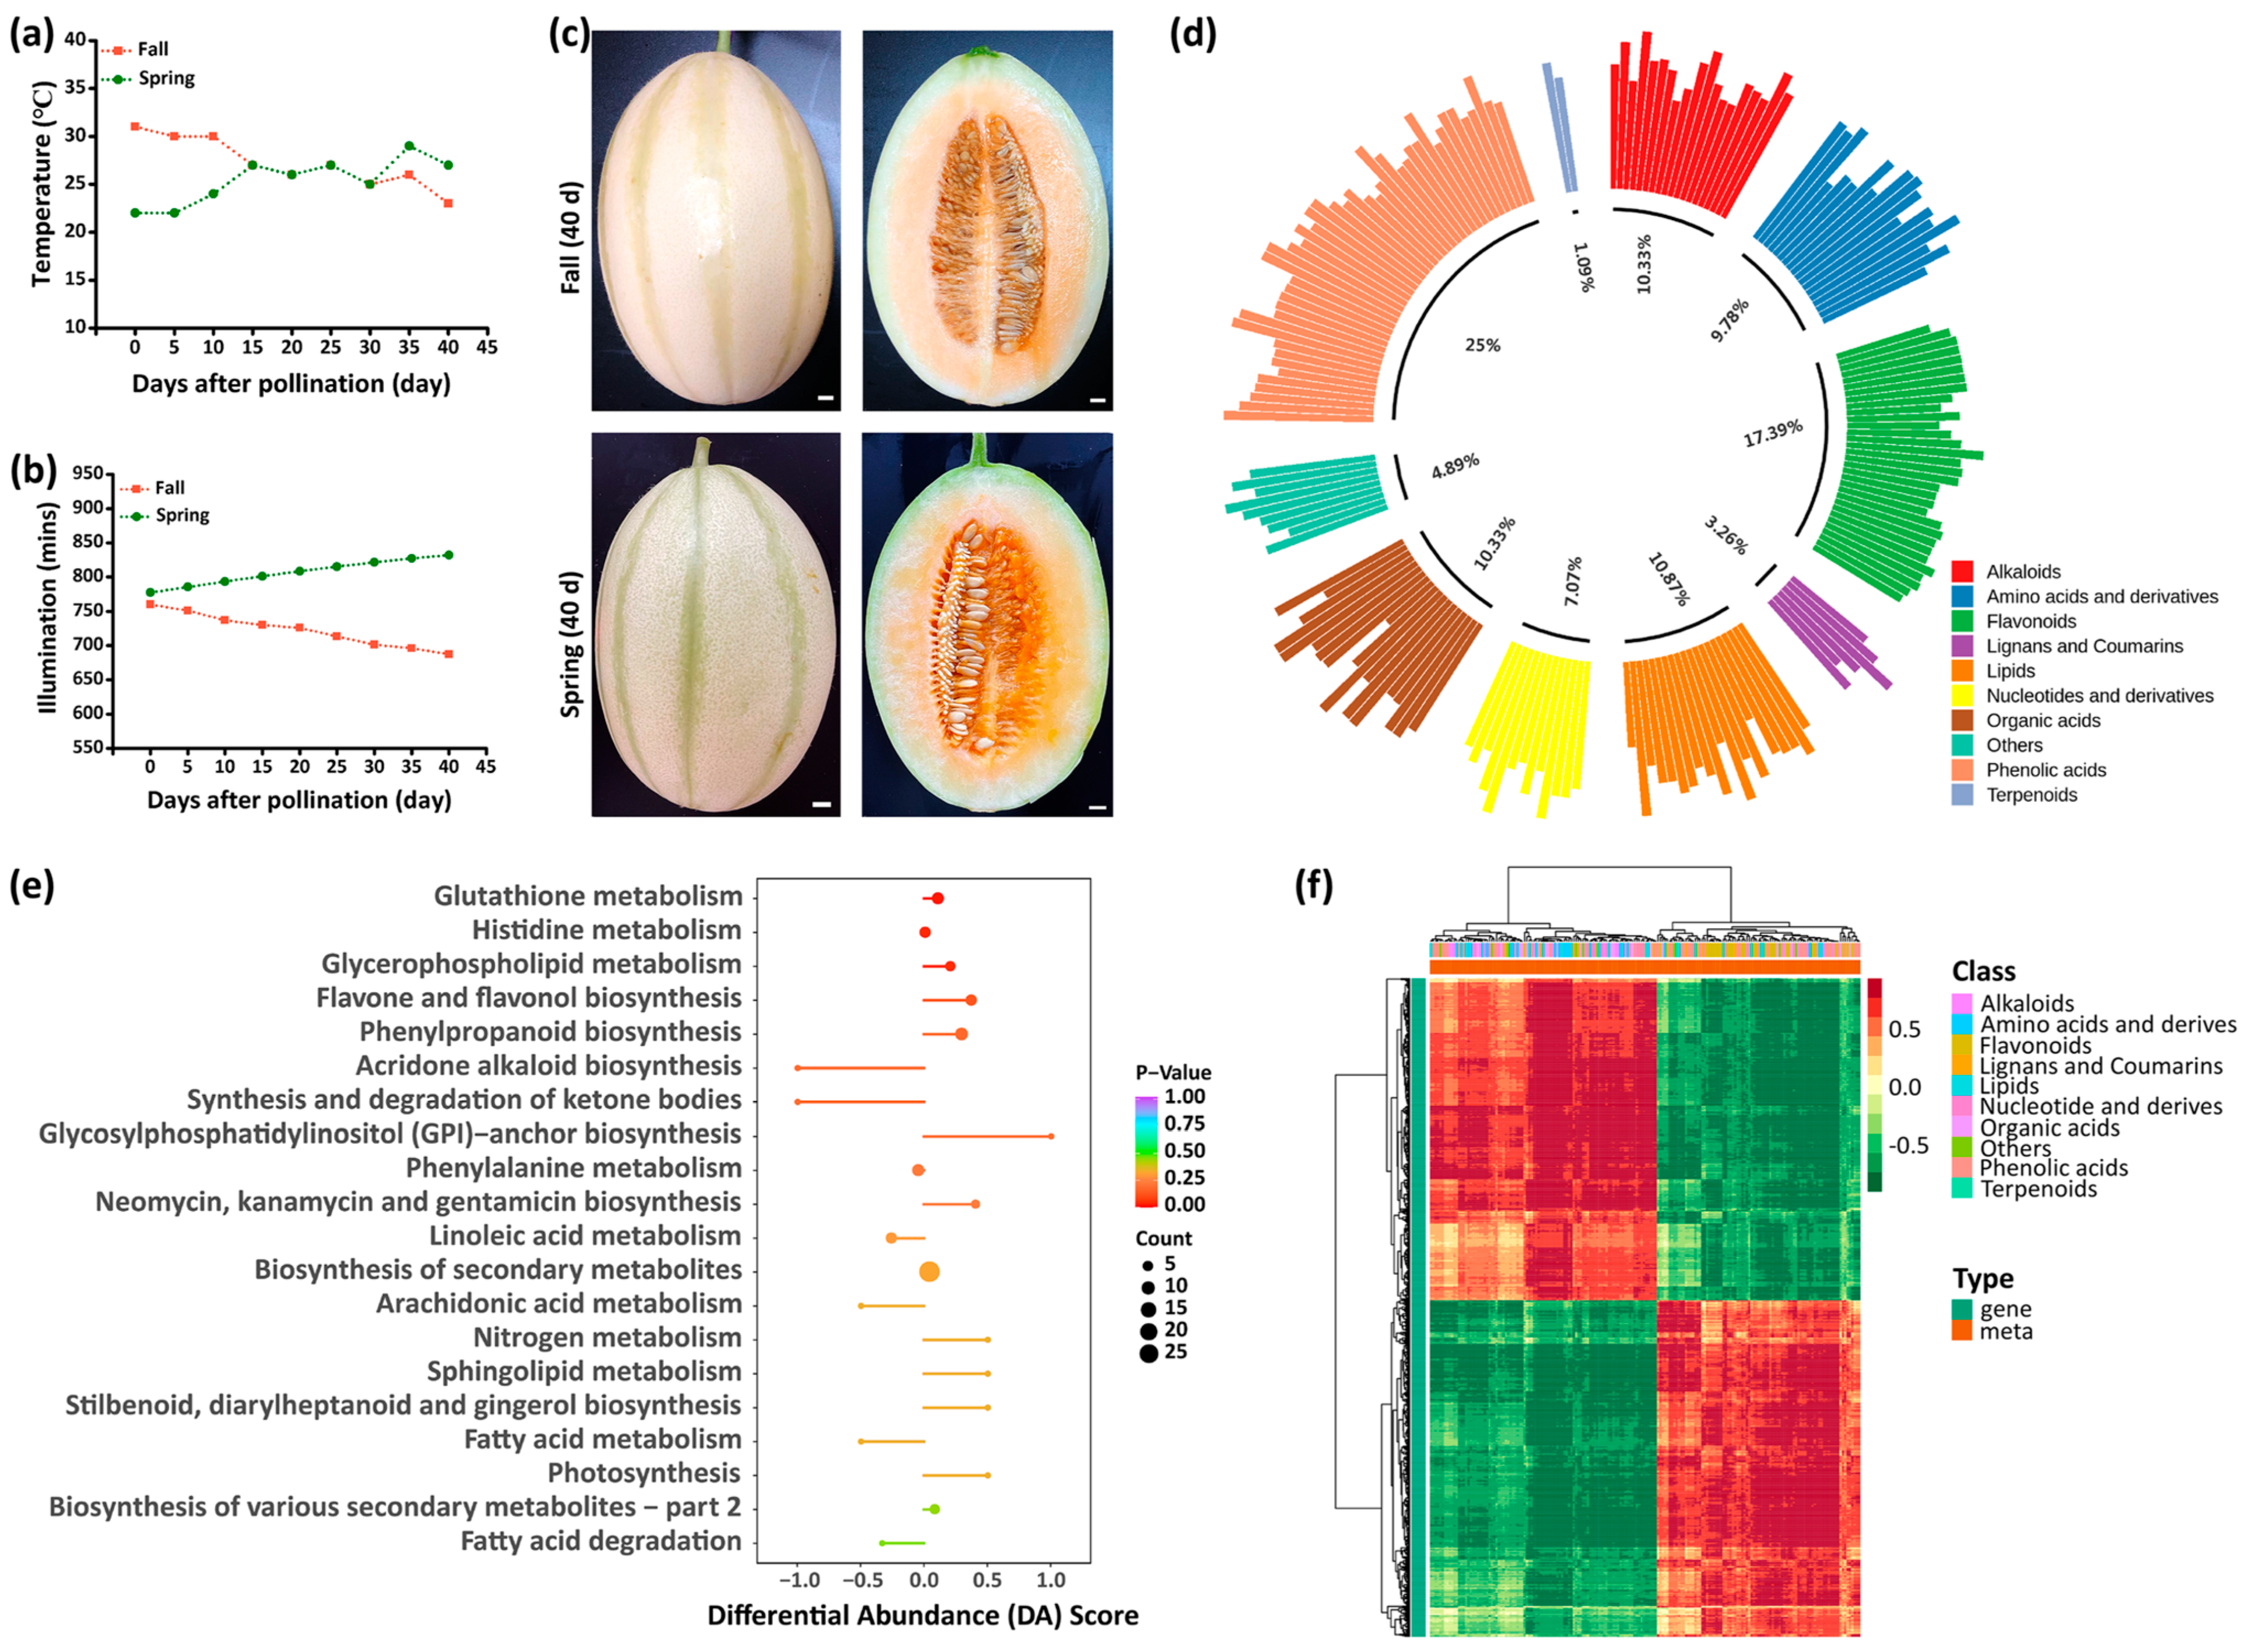
3.1. Metabolomic Analysis of Melons Grown in Spring and Autumn

Natural gradual changes in temperature and illumination were observed and recorded for melons grown in spring and autumn. The temperature of melons grown in spring showed an overall upward trend as time went by after pollination, while the opposite was observed in autumn (Figure 1a). Meanwhile, the difference in illumination between spring and autumn gradually increased (Figure 1b). This may lead to differences in phenology between the two seasons of melon fruits. We examined the metabolome of melon fruits at 40 DAP (Figure 1c) using a widely targeted metabolic analysis. Correlation analysis and principal component analysis of metabolites in three biological replicates showed reliable sampling of melon fruits, with strong intra-group repeat correlation during the same period (Figure S1a,b).
The differentially accumulated metabolites (DAMs) of the melon fruits between the two seasons were determined based on the criteria of VIP ≥ 1 and |Log2(Fold Change)| ≥ 1. In total, 184 significant DAMs with 87 up-regulated and 97 down-regulated metabolites (Figure S1c) were detected between spring and autumn. These DAMs were classified into 10 categories (Figure 1d; Table S1), including phenolic acids (46, 25.0%), flavonoids (32, 17.3%), lipids (20, 10.8%), alkaloids (19, 10.3%), organic acids (19, 10.3%), amino acids and derivatives (18, 9.7%), nucleotides and derivatives (13, 7.0%), lignans and coumarins (6, 3.2%), terpenoids (2, 1.0%), and others (9, 4.8%). Phenolic acids and flavonoids, both belong to phenylpropanoids, accounting for almost half (42.3%) of all DAMs. Summarized and sorted, all DAMs according to the |log2 (FoldChange)| value (Table S1), the content changes, and up-down information of the top30 DAMs can be visually observed using radar map and OPLS-DA S-plot (Figure S1d,e). Among them, mws0576 (organic acids, 3-hydroxybutyric acid), pme1975 (organic acids, malonic acid), mws1075 (lignans and coumarins, 7-methoxycoumarin), pme2122 (alkaloids, histamine), Zmdp000976 (amino acids and derivatives, S-(2-Carboxypropyl)cysteine), Zmgn002106 (amino acids and derivatives, N-Acetyl-L-phenylalanine), Jmwn002494 (phenolic acids, (2E)-3-[4-(β-D-glucopyranoside)-phenylacrylic]-acid), pmb3075 (phenolic acids, 3-O-p-Coumaroylshikimic acid), mws0954 (lipids, 5-Hydroxy-6,8,11,14-eicosatetraenoic acid), mws0145 (phenolic acids, O-Anisic acid) were only present in autumn melon fruits and were not detected in spring. On the contrary, Cmbn004127 (alkaloids, (S)-2-amino-5-((R)-1-carboxy-2-((E)-3-(4-hydroxy-3-methoxyphenyl)allylthio)ethyl-amino)-5-oxopentanoic acid), MWSmce355 (phenolic acids, methyl Syringate), pmn001695 (phenolic acids, trihydroxycinnamoyl quinic acid), Lmln001195 (phenolic acids, picein) and two flavonoid compounds pme0321 (flavonols, kaempferol-7-O-rhamnoside), and Lmxn007456 (flavones, acerosin) were only found in spring melon fruits (Table S1).
In addition, the majority of flavonoid DAMs (29/32, 90.63%) showed up-regulation in spring, while out of all 87 DAMs up-regulated, there were 29 flavonoid metabolites and 28 phenolic acid metabolites. We speculate that differences in the composition and content of phenolic acids and flavonoids in spring fruits may be one of the factors leading to differences in the quality of spring and autumn melons. KEGG pathway enrichment analysis demonstrated that the DAMs were significantly enriched mainly in glutathione metabolism, histidine metabolism, glycerophospholipid metabolism, flavone and flavanol biosynthesis, and phenylpropanoid biosynthesis, and overall expression tended to be up-regulated in spring (Figure 1e; Table S2). Correspondingly, phenylpropanoid biosynthesis, flavone and flavonol biosynthesis, and flavonoid biosynthesis were also highly represented pathways for up-regulated DAMs (Figure S1f). The results indicated that the reactions on the phenylpropanoid pathway and its branches, especially downstream flavonoid pathways, may be involved in fruit development and play a role in plant–environment interaction. The end products of these pathways make ripening fruits exhibit obvious seasonal specificity.

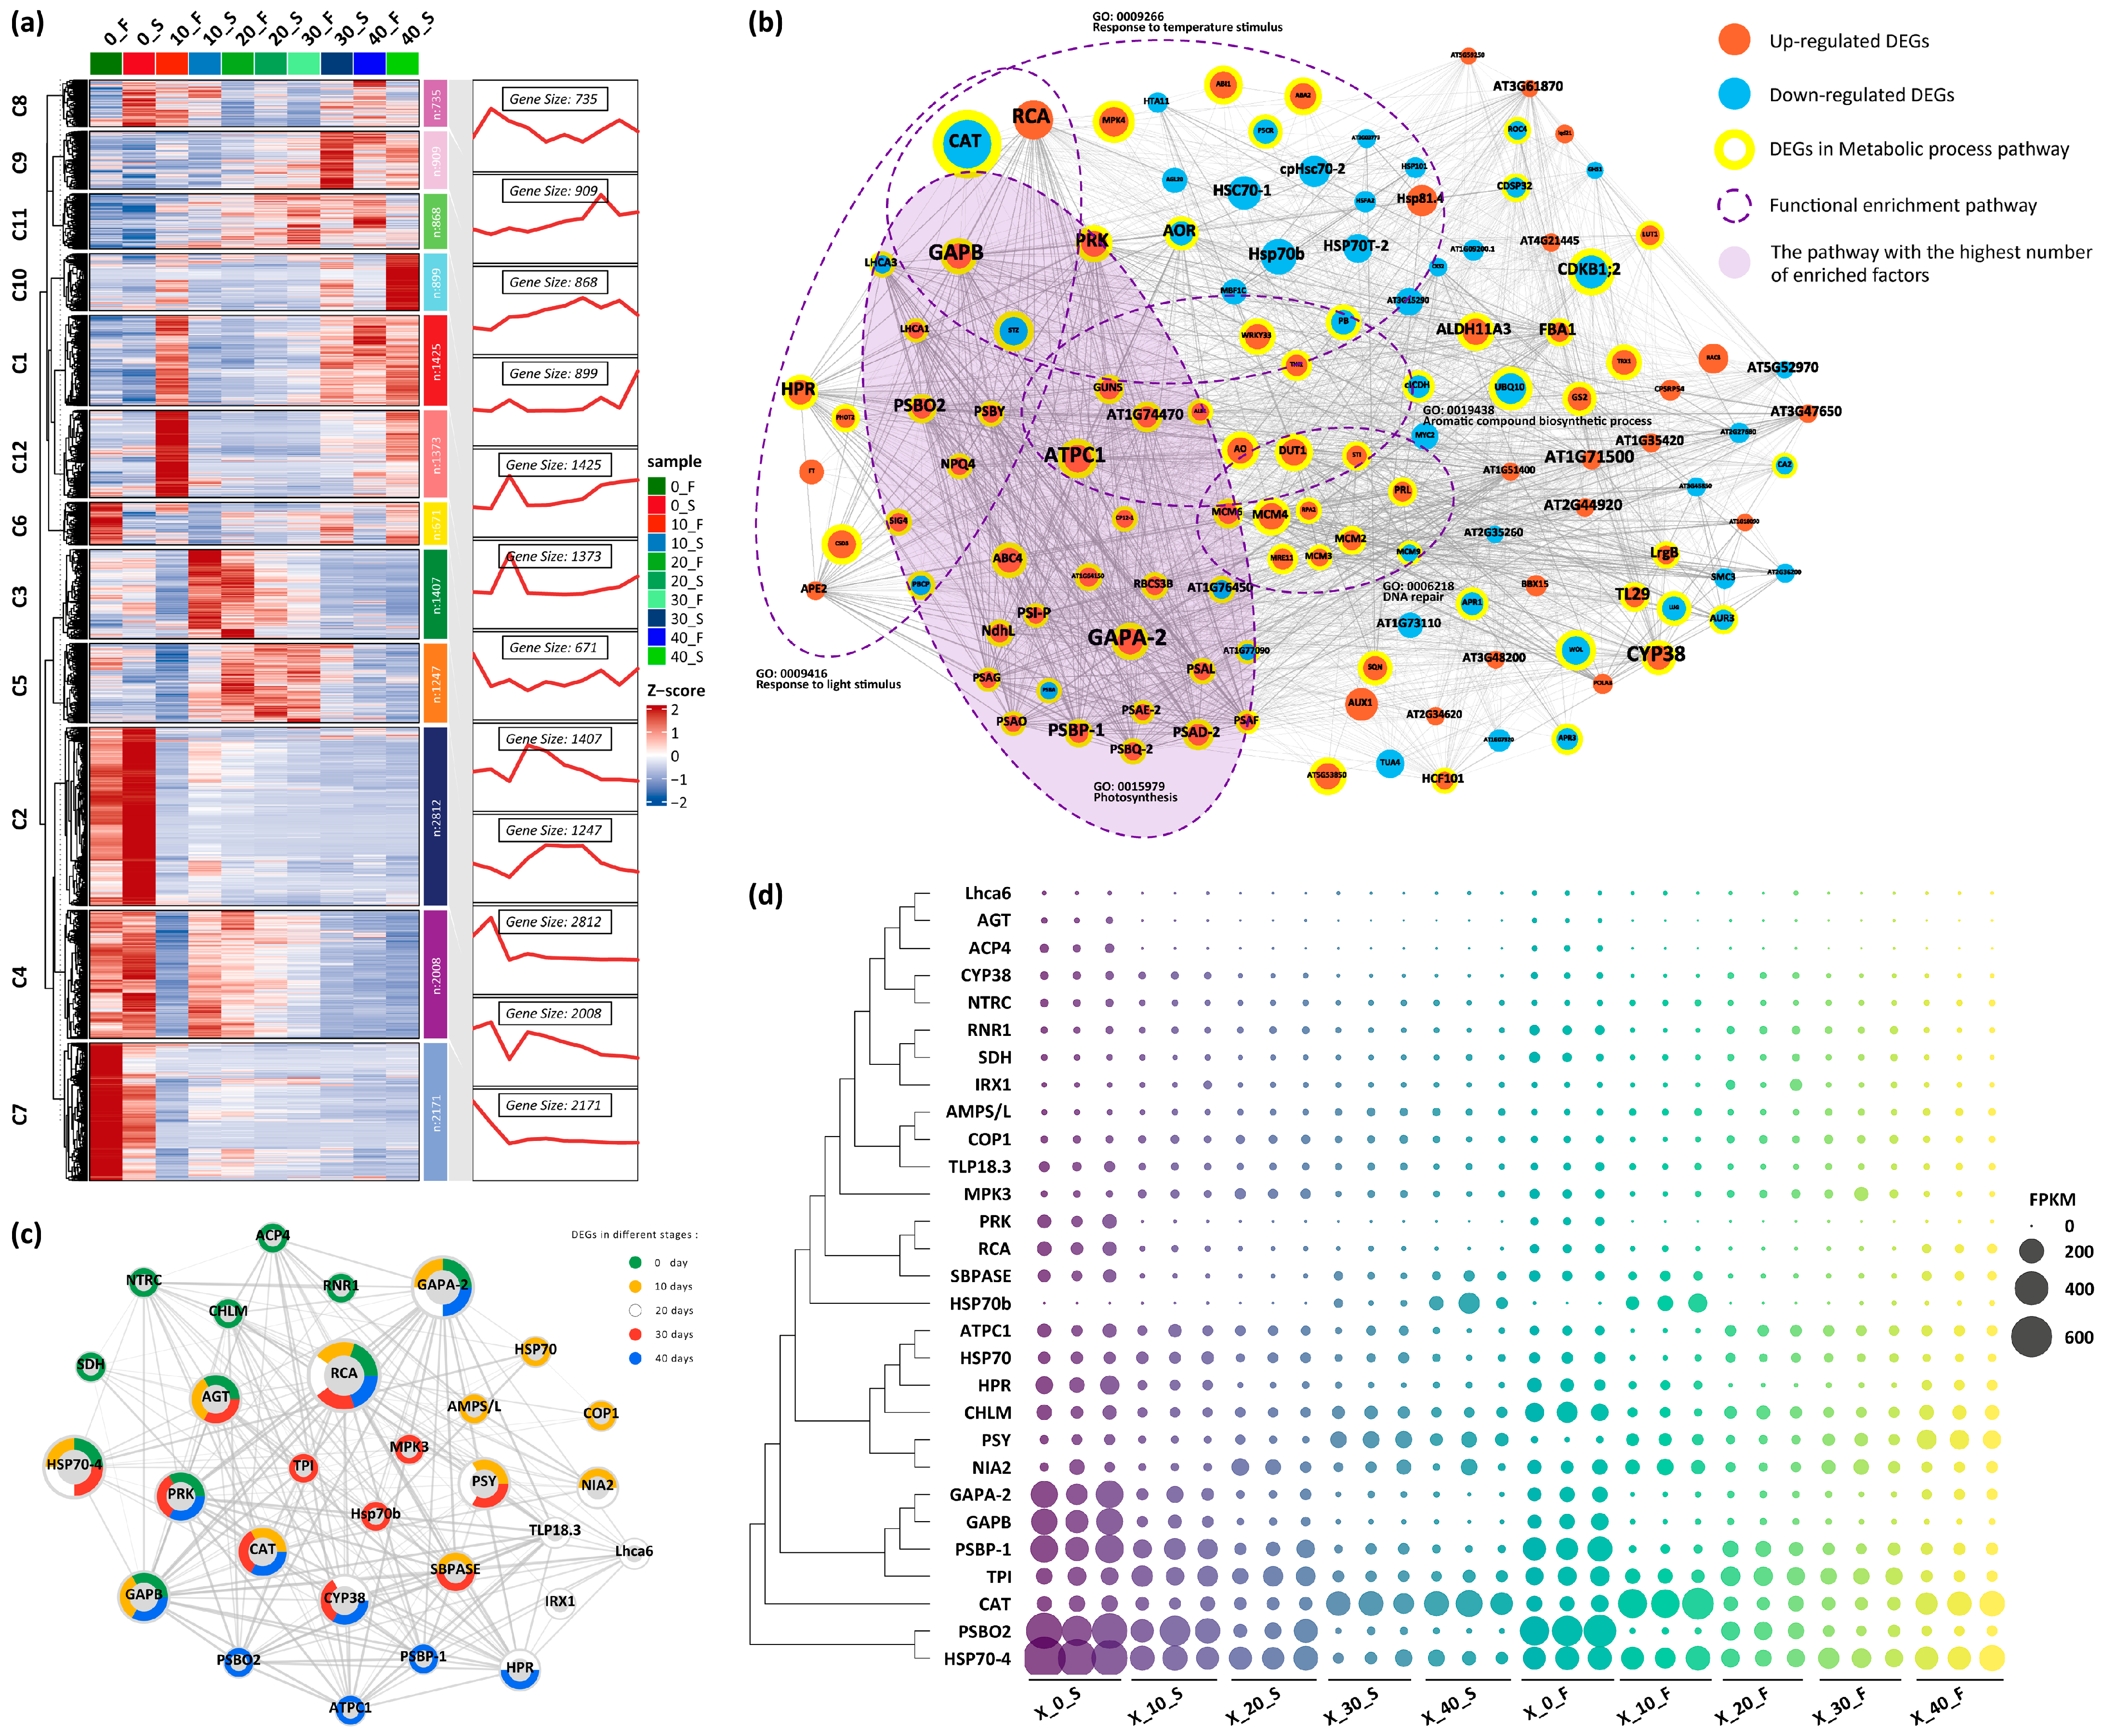
3.2. Transcriptomic Analysis of Melons Grown in Spring and Autumn

To investigate the mechanism of transcriptional plasticity caused by seasonal variation on the formation of differences in metabolites of melon fruits, transcriptomic analysis was performed in melon fruits at five stages (0, 10, 20, 30, and 40 DAP) in spring and autumn. Transcriptome sequencing yielded a total of 240.13 Gb of clean data after filtration. More than 91.19% of the clean reads were sequentially mapped to the C. melo genome DHL 92 genome (Table S3). The percentages of Q30 and GC content in each library exceeded 96.43% and 43.20%, respectively (Table S4), indicating the high-quality transcriptome data that can be used for further DEG analysis. PCA of the FPKM values for all expressed genes revealed the relationships between samples from different seasons and stages (Figure S2a). A total of 16,525 DEGs were identified in melon fruits at different developmental stages between spring and autumn. The Venn diagram showed the DEGs detected at each stage (Figure S2b).
We constructed protein–protein interaction (PPI) networks using Arabidopsis genes blasted by melon DEGs, and identified potential core networks containing central hub genes using k-means cluster analysis. At 0 DAP, a total of 3005 DEGs were used in the analysis, resulting in 220 genes forming the putative hub cluster. Similarly, 2200, 853, 1772, and 1626 DEGs were imported into 10, 20, 30, and 40 DAP analyses, respectively, and yielded a main cluster consisting of 242, 66, 210, and 122 nodes. Functional enrichment analysis (FDR < 0.05) on gene clusters was performed using the KEGG database and GO–biological process to reveal a PPI network comprising potential hub genes and their associated functional networks (Tables S5–S9). By comparing different seasons at the same stage, distinct enrichment pathways were projected to correspond to diverse phenotypic traits.
Five-stage gene sets all showed (Figure S3–S6 and Figure 2b) that cellular process (GO: 0009987) and metabolic process (GO: 0008152) were the pathways enriched with the highest number of DEGs, and they were most significantly enriched at 0, 10, and 30 DAP (Tables S5–S9), suggesting that these pathways were representative in the development process of fruit ripening affected by seasonal changes and were dynamically regulated at the transcriptional level. Differences in genes related to photosynthesis (GO: 0015979) began to appear from the 0 DAP stage and continued until the ripening stage, 40 DAP. There were also pigment biosynthesis/metabolic processes (GO: 0046148/GO: 0042440), which mainly consist of two types of pigments, chlorophyll and carotenoid biosynthesis/metabolic processes, and showed different significance in the biosynthesis or metabolism of different pigments according to different periods. Carbon metabolism (ath01200) was also a functional pathway that cannot be ignored during the developmental process, and its inclusion of carbon fixation in photosynthetic organizations (ath00710) suggested changes in the flow of carbon source metabolism caused by environmental signals. These same processes were reflected in the concentration of DEGs at different stages, indicating that these functions always played a role during development.
In addition to the pathways commonly present in various stages of the network mentioned above, genes related to cell division (GO: 0051301) and mitotic cell cycle (GO: 0051301) were significantly enriched in the core network of 0 DAP and up-regulated in spring. Moreover, the enrichment pathways detected include the hormone-mediated signaling pathway (GO: 0009755), MAPK signaling pathway (ath04016), and phenylpropanoid biosynthetic process (ath00280), as well as precursor substances of melon, and volatiles such as valine, leucine, and isoleucine degradation (GO: 0009699) [23]. It can be seen that the key metabolic pathway, the phenylpropanoid pathway, detected in the metabolome data was transcriptionally regulated at this stage. Due to the difference in temperature at which 0 DAP fruits grow during the spring and autumn seasons, DEGs were also enriched in the response-to-temperature stimulus (GO: 0009266) pathway. The core network detected by 10 DAP was also enriched in cell division-related genes. As the lighting time changes, there was a situation where the spring lighting time gradually exceeds the autumn (Figure 1b), and related genes of the response-to-light stimulus (GO: 0009416) began to show significance in the comparison of the two seasons. Notably, the most prominent hub gene, the ring finger ubiquitin E3 ligase, COP1, which is related to the control of plant photoperiod perception and participated in ubiquitin-mediated protein hydrolysis [24]. It was simultaneously annotated into the response-to-light stimulus (GO: 0009416) and photosynthesis (GO: 0015979) pathways.
Interestingly, the 20 DAP network was enriched with plant-type secondary cell wall biology (GO: 0009834), cell wall biology (GO: 0042546), and cellular polysaccharide biological process (GO: 0033692), which included xylan biological process (GO: 0045492), and the lignin biological process (GO: 0009809). The annotated DEGs were down-regulated in spring. The biosynthesis of these polysaccharide components and lignin were related to the formation of secondary cell walls. Lignin is an important component of the secondary cell wall, indicating that this stage underwent a secondary thickening process, significantly enhancing structural support and gradually losing the ability of cells to expand and grow, resulting in differences in pulp texture. The biosynthesis of lignin is a downstream branch of the phenylpropanoid pathway, which means that the phenylpropanoid genes are involved in the transcription of growth regulation mechanisms related to the content of its derived structural polymer, lignin.
The photosynthesis pathway and the response-to-light stimulus pathway exhibited significant enrichment at 30 DAP, and were mainly concentrated in the response to high light intensity (GO: 0009644). Additionally, several hormone-related pathways, such as the auxin-activated signaling pathway (GO: 0009734), were also involved, where the enriched genes were down-regulated overall. Remarkably, cellular response to the endogenous (GO: 0071495) and hormone-mediated signaling pathway (GO: 0009755)-related genes overlap, suggesting the regulatory role of endogenous hormones in this stage. Considering that the response to UV (GO: 0009411) also appeared in the core network of 30 DAP, sharing a prominent hub gene MPK3 with MAPK signaling pathway (ath04016), suggests a linkage between hormone activity and the initiation of endogenous hormone responses to environmental stress induced by differences in light, especially UV light, between the two seasons.
Aromatic compound biosynthetic process (GO: 0019438) appeared in the 40-DAP core network, possibly due to the precursor of phenylpropanoid compounds coming from tyrosine and phenylalanine [25], which belong to aromatic amino acids. A 40 DAP analysis showed that photosynthesis was the most significant enrichment pathway. Response-to-temperature and -light stimulus-related genes still showed significant differences in spring and autumn. The difference between the two seasons was greatest at 40 DAP (Figure 1b). Stress caused by ultraviolet (UV) radiation is widely recognized to promote the production of reactive oxygen species (ROS), leading to DNA damage in plants [26], and genes from DNA repair (GO: 0006281) were enriched. At this stage, the MAPK signaling pathway with catalase CAT as the core hub emerged. The results indicated that a series of physiological responses within cells respond to external environmental signals through the MAPK cascade, coordinating fruit growth and development while maintaining normal metabolic processes.
The DEGs associated with the above pathways may be modulated by seasonal environmental differences. It can be observed that photosynthesis was always affected. It is worth noting that there were often strong overlapping effects in related genes in response to temperature, light stimulus, and photosynthesis, which indicated that photosynthesis was the foundation for maintaining the normal growth and development of plants. In addition to light, temperature was also one of the environmental factors limiting photosynthesis, which dynamically changes during the development of fruits after pollination, showing that photosynthesis always has a function that cannot be ignored in the transcriptional regulatory networks. In addition, during the early stages of fruit development, transcriptional differences between the two seasons were mainly reflected in cell growth and fruit expansion, as well as the response-to-temperature stimulus caused by differences in temperature. At the latter period of development, with the increase in differences in environmental factors such as light, the fruit significantly enhanced its response-to-light stimulus, mobilized endogenous hormones, and synthesized secondary metabolites as protective substances to cope with changing environmental conditions. The analysis revealed the relationship between fruit development and the differences in environmental factors such as temperature and light conditions in spring and autumn, as well as the regulatory mechanism of fruit stress response to the environment. Phenylpropanoid compounds such as lignin and flavonoids were speculated to be involved in this coordination process. Starting from 0 DAP, the key role of the phenylpropanoid pathway began to manifest and persisted until the fruit maturity stage of 40 DAP, which was consistent with our analysis results in the metabolome.

3.3. Core Differentially Expressed Genes Were Retained in Spring and Autumn Grown Melons

The Mfuzz method based on FPKM values of 16,525 DEGs identified 12 distinct clusters with varied expression patterns (Figure 2a). In the PPI network of each stage, core hub genes with high centrality and high connectivity were highlighted in the gene cluster, and they were annotated into one or more pathways, suggesting the functions and core regulatory networks at this stage to a certain extent. For example, AGT was enriched in the carbon metabolism (ath01200) pathway, CAT was located in the MAPK signaling pathway-plant (ath04016). In addition, the core point of 10DAP, COP1, appeared in the ubiquitin-mediated proteolysis (ath04120) pathway, while HSP70 was annotated into the protein processing in the endoplasmic reticulum (ath04141) enriched pathway. We attempted to better define the protein–protein interactions between different states in spring and autumn by exploring the retention of core hub genes during fruit development.
Twenty-nine nodes that ranked in the top 10 by node degree at each stage were selected as hub genes in PPI networks to form a closely related network together (Figure 2c; Table S10). A dot plot with hierarchical clustering of 29 genes based on FPKM values showed the expression pattern of these genes (Figure 2c,d). Genes in the same cluster or nearby may have similar functions or participate in the same pathway of co-expression. The NADPH-dependent thioredoxin reductase C (NTRC) maintains the redox balance of chloroplasts. The chloroplast cyclophilin (CYP38) is involved in the assembly and stability of photosystem II. The ATPase (ATPC1), encoding the chloroplast ATP synthase γ-subunit, is a key enzyme of photosynthetic phosphorylation. Light-harvesting antenna protein (Lhca6) binds to chlorophyll a/b and mediates the interaction between PSI-LHCI and NDH. Thylakoid lumen protein (TLP18.3), a key enzyme of chlorophyll synthesis magnesium protoporphyrin IX methyltransferase (CHLM), is a photoinducible gene for repairing PSII. And the exogenous subunits of the PSII complex (PSBP-1, PSBO2). There was also the plant gene synthase (PSY), which catalyzes photosynthetic pigments. In addition, we identified genes related to environmental response and regulation of plant growth, such as hydroxypyruvate reductase (HPR) in the photorespiration pathway; the core regulatory factor of light morphogenesis, E3 ubiquitin ligase constitutively photomorphogenic 1 (COP1); acetaldehyde aminotransferase (AGT) and catalase (CAT) located in the peroxisome; the heat shock protein family (HSP70, HSP70-4, and HSP70b); saccharophane dehydrogenase (SDH), which is one of the main regulators in plants that control the content of free lysine; mitogen-activated protein kinase (MPK3), which is associated with stress; the enzyme encoding cellulose synthase catalytic subunit (IRX1), which is responsible for cellulose deposition in the secondary cell walls of xylem elements; AMP-dependent synthase and ligase family protein (AMPS/L), which is located in mitochondria; and a glycolytic enzyme, triphosphate isomerase (TPI), and acyl carrier protein (ACP4), ribonucleotide reductase large subunit (RNR1), and nitrate reductase (NIA2). These core DEGs were retained in spring- and autumn-grown melons.

3.4. Transcriptomic Regulatory Clusters of Spring- and Autumn-Grown Melon Fruits

To elucidate potential associations between individual genes/pathways within the co-expression network, we identified closely related genetic pathways by assessing distances in the network and calculating nodes and edges attributes from the correlation matrix. Given the significant transcriptional activation of metabolic pathways, their connections with other pathways have been investigated. We observed that pathways identified as the major members simultaneously involved in three other functional categories and pathways: response-to-light stimulus, response-to-temperature stimulus, and generation of precursor metabolites and energy (Figure 3), indicating potential cross-talk between these four pathways during fruit development. Interestingly, a subset of genes regulating photosynthesis in the metabolic pathway were co-expressed and strongly associated with the carbohydrate biosynthetic process and the pigment metabolic process, forming a co-expression cluster involving three functional pathways (Figure 3). In this cluster, AGT, the gene encoding an aminotransferase involved in photorespiration, the photosystem subunits PSBP-1 and PSBO2, and TLP18.3, the gene encoding a capsule lumen protein that regulates the photosystem II repair cycle, remained at the core connection and were closely linked to genes enriched in the other two pathways (Figure 3), suggesting that this cross-talk might regulate photosynthetic pigment formation and carbohydrate production in photosynthesis.
Another smaller cluster related to metabolism was identified, in which the genes enriched in the carbohydrate metabolism process acted as core nodes, including two genes related to fatty acid metabolism, ECH2 and A1M1, and the gene encoding an NADP+-isocitrate dehydrogenase thought to contribute to NADPH production under oxidative stress, cICDH (Figure 3). This nested co-expressed cluster also had close relationships with clusters of the organic matter biosynthesis process and the oxidoreductase activity pathway. The cohesiveness of the co-expressed clusters offered new insights into the interactions among diverse biological pathways, indicating that the metabolic process of fruits may depend on the generation of precursor metabolites and energy, and may be influenced by exogenous environmental factors such as light stimulation and temperature stimulation. Photosynthesis may cooperate with carbohydrate biosynthesis and pigment metabolism, and carbohydrate metabolism may cooperate with organic matter biosynthesis and oxidoreductase activity, collectively orchestrating a range of biological processes that govern the seasonal development of melon fruit.

3.5. Conjoint Analysis of Metabolome and Transcriptome

In the studies of metabolome and transcriptome, we identified the key role of the phenylpropanoid pathway in the metabolic process and identified related gene clusters. The transcriptional expression patterns are strongly associated with the differences in metabolites (Figure 1f). To dig out the detailed relationship between changes in the different metabolites and those of gene expression, and further explore the molecular mechanisms that cause differences in fruit quality, we performed conjoint analysis of metabolome and transcriptome, then established a predicted phenylpropanoid biosynthesis pathway. We analyzed the correlation between 19 DEGs and 8 DAMs, as well as their expression patterns and differential changes in the phenylpropanoid pathway (Figure 4), mainly focusing on common phenylpropanoid substances and their related genes such as monolignol, flavonoids (flavonoids, flavonols, anthocyanins), and phenolic acids. Correlation heatmaps and correlation networks can provide a more intuitive understanding of the relationship between DAMs and DEGs (Figure 4d and Figure S7a–c).
The biosynthesis of phenylpropanoids includes the general phenylpropanoid pathway (GPP) and subsequent specific branch pathways. Beginning with phenylalanine and tyrosine, two aromatic amino acids synthesized by the shikimic acid pathway, there was no significant difference between spring and autumn (Figure 4a). The derived coenzyme A substances act as an intermediate and begin to enter specific branch pathways of various phenylpropanoid compounds. Mainly downstream branches following the GPP are the monolignol pathway, the phenolic acid pathway, the coumarin pathway, and the flavonoid pathway. In general, a total of 27 metabolites were detected, of which 8 metabolites showed differential accumulation in the fruits of two seasons, including two aldehydes (p-coumaraldehide and sinapaldehide), three hydroxycinnamic acids belonging to phenolic acids (p-coumaroyl quinic acid, trans-2-hydroxycinnamic acid), one alcohol (coniferol alcohol), one flavonoid glycoside (naringin), and one proanthocyanin((-)-epicatechin). Among them, there was a significant difference in the content of (-)-epicatechin between the two seasons (p < 0.05) (Figure 4a,b). Interestingly, they were all more abundant in spring. Correspondingly, we found significant differences in the expression patterns of 19 genes distributed in various branches of the phenylpropanoid pathway (Figure 4a–c). The up-regulation of enzymes specific for lignin biosynthesis cinnamoyl-CoA reductase (CCR)(MELO3C009963.2, MELO3C012243.2, MELO3C023465.2) and anthocyanin-related genes flavanone 3-hydroxylase (F3H)(MELO3C005801.2, MELO3C024857.2) and anthocyanidin synthase (ANS)(MELO3C023957.2) could largely explain the high accumulation of p-coumaraldehyde, sinapaldehyde and (-)-epicatechin in the spring fruits. However, the coding genes of other proteins involved in the phenylpropanoid pathway were mixed-regulated, indicating that the synthesis of metabolites was the result of multiple systems participating and coordinating together. As highlighted by the background shadings, the same enzymes act at different steps in the pathway, this speaks to the modularity, versatility, and recurring themes in the pathway (Figure 4a). In addition, in the flavone and flavonol biosynthesis pathway, we also found significant accumulation of metabolite, rhoifolin (apigenin 7-O-neohesperidoside), chrysoeriol (5,7,4′-trihydroxy-3′-methoxyflavone), isoquercitrin (Quercetin 3-O-glucoside), and Rutin (Quercetin 3-rutinoside) (Figure S7d). IF7MAT (MELO3C022034.2) negatively regulated the biosynthesis of Chrysoeriol (Figure S7c,e).
These results indicate that seasonal growth conditions affect the plasticity of fruit metabolism through transcriptional expression reprogramming and reveal the possible regulatory function of the glutathione metabolism pathway in chloroplasts, and elucidating the relationship between changes in metabolites and gene expression during the transition stage from fruit development to maturity.

4. Discussion

Seasonal change is the most important source of environmental variation worldwide. Organisms respond to specific combinations of multiple seasonal signals under natural conditions to robustly control and produce optimal phenotypes, which may be independent of other evolutionary and developmental effects [27]. In particular, in response to a variety of external stimuli and changes in environmental conditions, plants intensively produce diverse specialized plant metabolites, which in turn leads to variations in fruit quality [28]. In resisting environmental stressors, various specialized metabolites produced by the phenylpropanoid biosynthesis pathway play a major role [29,30].
Currently, omics analysis combined with phenotype has been used in many crops to study the effects of plant–environment interactions on agronomic traits. For example, a combination of methylomics and transcriptome analysis was used to study flower bud formation in apple (Malus domestica Borkh.) [31]. In the study of various abiotic stresses, transcriptome data can be used to reveal the molecular mechanism of tomato drought resistance [32]. Combined with the metabolic level, the adaptation mechanism of olive seedlings to a high-salinity environment was studied [33]. The transcriptional response of Chinese cabbage leaves under heat stress was analyzed using scRNA-seq [34]. And in the context of biological stress, the transcriptome was used to analyze mechanisms of resistance to powdery mildew in pumpkin [35]. In addition, the combination analysis of metabolome and transcriptome has been widely used in melon, mainly involving peel color [36], flavor [37], fruit firmness [38], soluble sugar and organic acid [39], and other aspects affecting melon quality.
In our study, we analyzed a massive time-series transcriptome and metabolome set from seasonal cultivation conditions and identified several hub genes that are associated with temperature, photoperiod, and carbohydrate assimilation capacity signal-mediated fruit quality during fruit development under seasonal cultivation conditions using machine learning. Phenylalanine is generated via the shikimic acid pathway. Therefore, the phenylpropanoid metabolism pathway guides the metabolic flux from core (the primary metabolism) to specialized metabolism (the secondary metabolism) [36]; it is a precursor source of thousands of metabolites with multiple functions [30]. The metabolic branches of the phenylpropanoid pathway generate end products including flavonoids, hydroxycinnamic acids and esters, hydroxycinnamic acid amides, and precursors of lignin, lignans, and tannins, as well as a variety of other aromatic metabolites such as coumarins and phenolic volatiles [37]. According to the chemical structures, phenylpropanoid compounds can be divided into five categories, including flavonoids, monolignols, phenolic acids, stilbenes, and coumarins [30,38]. Phenylpropanoid homeostasis among different branches is maintained through metabolic flux redirection (MFR) regulation, demonstrating remarkable complexity and high levels of plasticity in continuous developmental phases and responses to environmental stimulus and changes [39]. It can be seen that phenylpropanoid metabolites are crucial for the development and survival of plants.
In this study, we analyzed a large number of time series transcriptomics and metabolomics under seasonal planting conditions and found that the phenylpropanoid pathway, especially the biosynthetic branches of monolignol and flavonoids, are key differential metabolic pathways. Through machine learning analysis, the core hub genes and their annotated functional pathways in each stage were identified, and the main regulatory pathways that formed the differences in each stage were identified, constructing a dynamic transcriptional regulatory network.
As photosynthesis is the foundation of plant growth and development, it is regulated by various factors, not only by light, but also by temperature, which is one of the environmental factors limiting photosynthesis. Throughout the entire process of melon fruit development to maturity, it exhibits core regulatory functions to maintain the dynamic balance of plant growth and development. The hub genes include multiple functions such as dark response, light-harvesting antenna proteins, chloroplast pigments, etc. (Tables S5–S9), which directly affect the structure and activity of photosynthetic organs, thereby affecting photosynthesis. Plants can perceive adverse environmental conditions as stresses and convert the stress signals into cellular responses, thereby making appropriate adjustments in their own metabolism, growth, and development processes [40,41,42,43]. Therefore, in the PPI network, the presence of hormone-related genes often accompanies the occurrence of other reactions, especially corresponding to environmental signals and biosynthetic pathways dominated by lignin and flavonoids, explaining the mutual influence and interaction between various pathways. For example, it is known that stress caused by UV-B light promotes the production of reactive oxygen species (ROS), and some flavonoids, especially flavonols, are efficient scavengers of ROS and selectively absorb UV-B radiation [44]. Light effects, including photoperiod, intensity, direction, and quality, can influence fruit quality in terms of some specific metabolites, such as flavonoids, carotenoids, and others [6,23,28,45]. MAPK cascades are involved in both the growth and development of plants and in response to environmental factors, making them reasonable candidates as hubs for integrating environmental factors into the internal growth and developmental program of plants [28]. MPK3, a mitogen-activated protein kinase that was initially associated with plant immunity and response to abiotic stresses, has since been shown to also play an important role in plant growth and development [46,47].
However, the phenylpropanoid pathway is not directly reflected in some stages of the core regulatory gene cluster, suggesting that environmental factors do not directly act on the structural gene promoter to initiate its transcriptional expression, but are regulated through transcription factors. Transcription factors are activated under external stimulus, up-regulating or inhibiting the expression of structural genes, thereby altering metabolic pathways.
In addition to responding to stress in the external environment, these metabolites can also affect the visual appearance of the fruit. Carotenoid levels directly affect the fresh color of fruits [48,49], whereas flavonoids can affect melon fruit skin colors [50], and lignin leads to the formation of fruit peel reticulation [51]. There are many determining substances for the taste and quality of cantaloupe, including sugars, aromatic substances, and organic acids. The bitter and astringent substances such as rutin and epicatechin produced by the flavonoid pathway in spring fruits are greatly promoted at the product level, and their use as taste characteristics can also affect the taste quality of melon fruits. However, relevant research has not yet been reported, and little is known about the synthesis and regulation of bitter and astringent substances in melon fruits.
In the present study, we found that HSP70s family proteins are consistently present in the core network of different stages and exhibit strong centrality (Figure 2b,c and Figures S3–S6), which revealed that HSP70s may be the several key proteins affecting fruit quality traits. In addition, the HSP70s are also molecular chaperones involved in a variety of cellular processes including protein folding, protein trafficking across membranes, modulation of protein activity, regulation of protein degradation, and prevention of irreversible protein aggregation [52]. Because of their characteristic molecular chaperone properties, it has been suggested that HSP70s may be involved in other biological processes in addition to various stress responses. Fruit ripening involves highly coordinated processes orchestrated by a network of interacting genes and signaling pathways. The protein–protein interactions of many proteins with HSP70s have been identified. These combinations of interactions provide opportunities to study the role and molecular strategies of HSP70s. External fruit color is a signal of ripeness and nutritional quality [53]. Carotenoid is one of the major pigments accumulated in the melon [54], and temperature stimulus can alter carotenoid accumulation in melon fruit. It has been reported that the degradation rate and folding state of phytoene synthase (PSY) are modulated by HSP70s, which affects carotenoid accumulation in ripe tomato fruit [55]. The HSP70s and interacting proteins identified in this study suggest that HSP70s are associated with the transcriptional regulatory network of fruit in response to signals from seasonal conditions. Understanding how plants respond to environmental signals from seasonal conditions is an important step in developing fruit crops with broad adaptability. Under seasonal growing conditions, light, like day length, is another important signal that influences growth and development. In the light-mediated signaling pathway, Constitutively Photomorphogenic 1 (COP1) is a master regulator that is involved in diverse biological processes in plants and animals, including development and metabolism, and responses to abiotic and biotic stimuli [56]. Recent studies have shown that SmCOP1 functions to inhibit tomato fruit ripening, reduce carotenoid content, and decrease ethylene production in fruits [57]. In addition, OsCOP1 has been reported to play a critical role in flavonoid biosynthesis in rice seeds [58], and Arabidopsis [59,60]. We found that COP1 is also involved in the transcriptional regulatory network in response to signals from seasonal conditions, suggesting that it could be used as a target for genetic improvement for resilience in response to environmental cues. Although there is no direct evidence to show that components of photosynthesis, such as Rubisco activase (RCA) and NADP-glyceraldehyde-3-phosphate dehydrogenase (GAPA/GAPB), are associated with metabolism in fruits, it is undoubtedly clear that carbohydrate fixation can increase the metabolic potential [61]. Furthermore, cyanobacterial RCA has a dual function in metabolic repair and recruitment to carboxysomes [62]. In addition, as a molecular chaperone in the regulation of Rubisco, RCA is essential for photosynthesis and is also sensitive to moderate heat stress, suggesting a possible role in response to environmental signaling stimulus [63,64]. Genetic manipulation of RCA clearly affects thermal tolerance in rice [65] and abiotic stress responses (drought, salinity, and heat) responses in Arabidopsis [66]. The association of RCA with the fruit transcriptional regulatory network in response to seasonal conditions signals suggests its possible role in source-sink regulation of metabolite accumulation in fruit.
In crops grown under seasonal conditions, fluctuations in environmental factors such as temperature and photoperiod introduce variability in growth, yield, and quality. Therefore, it is essential to thoroughly dissect the regulatory network of important environmental factors affecting crop metabolism, growth, and development. However, the precise mechanism connecting the regulation of metabolites with seasonally mediated signals is present almost as a blind box. The direct interactions between key seasonal signaling components and metabolic regulators remain largely unclear, hampering further understanding of how seasonal signals incrementally affect the metabolic network stepwise. The identification of hub genes and pathways in response to seasonal growing conditions during fruit development in melon provides new insights and comprehensive information for studying the relationship between seasonal changes and metabolic dynamics. The multi-omics assay with machine learning is a powerful approach to investigate the regulatory networks of environmental cues and metabolic dynamics, and can be further exploited to develop promising and robust strategies for breeding and cultivation of future fruit crops.

5. Conclusions

Taken together, using widely targeted metabolomics to compare mature melon fruits of 40 DAP in spring and autumn, we found that metabolites related to the phenylpropanoid pathway were highly accumulated in spring. We analyzed the expression changes in whole-genome transcripts based on RNA-seq data, a total of 16,525 DEGs were identified. Through K-means clustering analysis, we identified core gene sets and their interactions at different stages, whose functions are closely related to seasonal environmental regulation. In addition to the phenylpropanoid pathway, pathways such as photosynthesis, response-to-temperature stimulus, response-to-light stimulus, and carbon metabolism also play potential mediating roles in the transcriptional regulatory network. We also identified hub-gene-encoding HSP70 family proteins, RCA, AGT, and others. In addition, the co-joint analysis of metabolome and transcriptome revealed the molecular basis of phenylpropanoid and its branching pathways. Overall, we employed a novel mining mechanism that combines enriched pathways of key metabolites and co-expression networks of hub genes to reveal the plasticity and adaptability of phenylpropanoid-related pathways, which play a crucial role in seasonal differences in environmental signals in melon fruit, and their synergistic regulation with other co-expression networks, leading to differences in fruit quality during spring and autumn.

Supplementary Materials

The following supporting information can be downloaded at: https://www.mdpi.com/article/10.3390/horticulturae10090993/s1, Figure S1. Metabolomic analysis of melon fruit at 40 days after pollination grown in spring and autumn. Figure S2. Transcriptomic analysis of melon fruit at 0, 10, 20, 30, and 40 days after pollination grown in spring and autumn. Figure S3. PPI networks in associated melon fruit development built based on the hub genes of 0 day after pollination grown in spring and autumn comparison. Figure S4. PPI networks in associated melon fruit development built based on the hub genes of 10 day after pollination grown in spring and autumn comparison. Figure S5. PPI networks associated with melon fruit development were built based on the hub genes of 20 day after pollination grown in spring and autumn comparison. Figure S6. PPI networks in associated with melon fruit development built based on the hub genes of 30 day after pollination grown in spring and autumn comparison. Figure S7. Conjoint analysis of transcriptome and metabolome. Table S1. All differential metabolites of melon fruit at 40 days after pollination in spring and autumn comparison. Table S2. Differential abundance (DA) score statistics table of KEGG metabolic pathway. Table S3. Comparison efficiency statistics of transcriptome data and reference genome. Table S4. RNA-seq data and quality control information. Table S5. KEGG and GO–biological process enrichment for the hub gene sets of DEGs at 0 days after pollination in spring and autumn comparison. Table S6. KEGG and GO–biological process enrichment for the hub gene sets of DEGs at 10 days after pollination in spring and autumn comparison. Table S7. KEGG and GO–biological process enrichment for the hub gene sets of DEGs at 20 days after pollination in spring and autumn comparison. Table S8. KEGG and GO–biological process enrichment for the hub gene sets of DEGs at 30 days after pollination in spring and autumn comparison. Table S9. KEGG and GO–biological process enrichment for the hub gene sets of DEGs at 40 days after pollination in spring and autumn comparison. Table S10. 29 Hub genes associated with the metabolic changes resulting in differences in fruit quality in spring and autumn. Table S11. Differential accumulated metabolites (DAMs) on phenylpropanoid pathway.

Author Contributions

J.Y. and M.Z.: conceived the study; Z.G., J.Z. and X.Y.: performed the metabolism, transcriptome, and regulatory network analyses; G.D., Y.X., J.S. and Z.H.: grew and harvested the melon samples; Z.G., X.Y. and J.Y.: drafted the manuscript. All authors contributed to editing and preparation of the manuscript. All authors have read and agreed to the published version of the manuscript.

Funding

This work was supported partially by Hainan Province Science and Technology Special Funding (ZDYF2024XDNY282), Earmarked Fund for China Agriculture Research System (CARS-25-17), Major Science and Technology Innovation Development of Wenzhou (ZN2022004), and Technology Program for Agricultural (Vegetable) New Variety Breeding of Zhejiang Province (2021C02065).

Data Availability Statement

The RNA-seq data were deposited in the NCBI Sequence Read Archive (SRA) data library with accession number PRJNA1032845. Other data that support the findings of this study are availability from the corresponding author upon reasonable request.

Conflicts of Interest

The authors declare no conflicts of interest.

References

  1. Lester, G.E. Antioxidant, sugar, mineral, and phytonutrient concentrations across edible fruit tissues of orange-fleshed honeydew melon (Cucumis melo L.). J. Agric. Food Chem. 2008, 56, 3694–3698. [Google Scholar] [CrossRef] [PubMed]
  2. Allwood, J.W.; Cheung, W.; Xu, Y.; Mumm, R.; De Vos, R.C.H.; Deborde, C.; Biais, B.; Maucourt, M.; Berger, Y.; Schaffer, A.A.; et al. Metabolomics in melon: A new opportunity for aroma analysis. Phytochemistry 2014, 99, 61–72. [Google Scholar] [CrossRef] [PubMed]
  3. Galpaz, N.; Gonda, I.; Shem-Tov, D.; Barad, O.; Tzuri, G.; Lev, S.; Fei, Z.J.; Xu, Y.M.; Mao, L.Y.; Jiao, C.; et al. Deciphering genetic factors that determine melon fruit-quality traits using RNA-Seq-based high-resolution QTL and eQTL mapping. Plant J. 2018, 94, 169–191. [Google Scholar] [CrossRef]
  4. Moing, A.; Aharoni, A.; Biais, B.; Rogachev, I.; Meir, S.; Brodsky, L.; Allwood, J.W.; Erban, A.; Dunn, W.B.; Kay, L.; et al. Extensive metabolic cross-talk in melon fruit revealed by spatial and developmental combinatorial metabolomics. New Phytol. 2011, 190, 683–696. [Google Scholar] [CrossRef]
  5. Yang, J.H.; Deng, G.C.; Lian, J.M.; Garraway, J.; Niu, Y.C.; Hu, Z.Y.; Yu, J.Q.; Zhang, M.F. The chromosome-scale genome of melon dissects genetic architecture of important agronomic traits. iScience 2020, 23, 101422. [Google Scholar] [CrossRef] [PubMed]
  6. Allwood, J.W.; Woznicki, T.L.; Xu, Y.; Foito, A.; Aaby, K.; Sungurtas, J.; Freitag, S.; Goodacre, R.; Stewart, D.; Remberg, S.F.; et al. Application of HPLC-PDA-MS metabolite profiling to investigate the effect of growth temperature and day length on blackcurrant fruit. Metabolomics 2019, 15, 12. [Google Scholar] [CrossRef]
  7. Almeida, J.; Perez-Fons, L.; Fraser, P.D. A transcriptomic, metabolomic and cellular approach to the physiological adaptation of tomato fruit to high temperature. Plant Cell Environ. 2021, 44, 2211–2229. [Google Scholar] [CrossRef]
  8. D’Esposito, D.; Ferriello, F.; Dal Molin, A.; Diretto, G.; Sacco, A.; Minio, A.; Barone, A.; Di Monaco, R.; Cavella, S.; Tardella, L.; et al. Unraveling the complexity of transcriptomic, metabolomic and quality environmental response of tomato fruit. BMC Plant Biol. 2017, 17, 66. [Google Scholar] [CrossRef]
  9. Schwartz, M.D. Phenology: An Integrative Environmental Science; Kluwer Academic Publishers: Dordrecht, The Netherlands, 2003. [Google Scholar] [CrossRef]
  10. Tooke, F.; Battey, N.H. Temperate flowering phenology. J. Exp. Bot. 2010, 61, 2853–2862. [Google Scholar] [CrossRef]
  11. Kudoh, H. Photoperiod-temperature phase lag: A universal environmental context of seasonal developmental plasticity. Dev. Growth Differ. 2019, 61, 5–11. [Google Scholar] [CrossRef]
  12. Nagano, A.J.; Kawagoe, T.; Sugisaka, J.; Honjo, M.N.; Iwayama, K.; Kudoh, H. Annual transcriptome dynamics in natural environments reveals plant seasonal adaptation. Nat. Plants 2019, 5, 74–83. [Google Scholar] [CrossRef] [PubMed]
  13. Kudoh, H. Molecular phenology in plants: In natura systems biology for the comprehensive understanding of seasonal responses under natural environments. New Phytol. 2016, 210, 399–412. [Google Scholar] [CrossRef]
  14. Singh, R.K.; Svystun, T.; AlDahmash, B.; Jonsson, A.M.; Bhalerao, R.P. Photoperiod- and temperature-mediated control of phenology in trees—A molecular perspective. New Phytol. 2017, 213, 511–524. [Google Scholar] [CrossRef]
  15. Monti, L.L.; Bustamante, C.A.; Osorio, S.; Gabilondo, J.; Borsani, J.; Lauxmann, M.A.; Maulion, E.; Valentini, G.; Budde, C.O.; Fernie, A.R.; et al. Metabolic profiling of a range of peach fruit varieties reveals high metabolic diversity and commonalities and differences during ripening. Food Chem. 2016, 190, 879–888. [Google Scholar] [CrossRef]
  16. Matsuda, F.; Yonekura-Sakakibara, K.; Niida, R.; Kuromori, T.; Shinozaki, K.; Saito, K. MS/MS spectral tag-based annotation of non-targeted profile of plant secondary metabolites. Plant J. 2009, 57, 555–577. [Google Scholar] [CrossRef] [PubMed]
  17. Rohde, A.; Morreel, K.; Ralph, J.; Goeminne, G.; Hostyn, V.; De Rycke, R.; Kushnir, S.; Van Doorsselaere, J.; Joseleau, J.-P.; Vuylsteke, M.; et al. Molecular Phenotyping of the pal1 and pal2 Mutants of Arabidopsis thaliana Reveals Far-Reaching Consequences on Phenylpropanoid, Amino Acid, and Carbohydrate Metabolism. Plant Cell 2004, 16, 2749–2771. [Google Scholar] [CrossRef]
  18. Kim, D.; Landmead, B.; Salzberg, S.L. HISAT: A fast spliced aligner with low memory requirements. Nat. Methods 2015, 12, 357–360. [Google Scholar] [CrossRef] [PubMed]
  19. Pertea, M.; Pertea, G.M.; Antonescu, C.M.; Chang, T.C.; Mendell, J.T.; Salzberg, S.L. StringTie enables improved reconstruction of a transcriptome from RNA-seq reads. Nat. Biotechnol. 2015, 33, 290–295. [Google Scholar] [CrossRef]
  20. Love, M.I.; Huber, W.; Anders, S. Moderated estimation of fold change and dispersion for RNA-seq data with DESeq2. Genome Biol. 2014, 15, 550. [Google Scholar] [CrossRef]
  21. Yu, G.C.; Wang, L.G.; Han, Y.Y.; He, Q.Y. clusterProfiler: An R Package for Comparing Biological Themes Among Gene Clusters. Omics-A J. Integr. Biol. 2012, 16, 284–287. [Google Scholar] [CrossRef]
  22. Kundariya, H.; Sanchez, R.; Yang, X.D.; Hafner, A.; Mackenzie, S.A. Methylome decoding of RdDM-mediated reprogramming effects in the Arabidopsis MSH1 system. Genome Biol. 2022, 23, 167. [Google Scholar] [CrossRef] [PubMed]
  23. Gonda, I.; Bar, E.; Portnoy, V.; Lev, S.; Burger, J.; Schaffer, A.A.; Tadmor, Y.A.; Gepstein, S.; Giovannoni, J.J.; Katzir, N.; et al. Branched-chain and aromatic amino acid catabolism into aroma volatiles in Cucumis melo L. fruit. J. Exp. Bot. 2010, 61, 1111–1123. [Google Scholar] [CrossRef] [PubMed]
  24. Lau, O.S.; Deng, X.W. The photomorphogenic repressors COP1 and DET1: 20 years later. Trends Plant Sci. 2012, 17, 584–593. [Google Scholar] [CrossRef] [PubMed]
  25. Schiavon, M.; Pizzeghello, D.; Muscolo, A.; Vaccaro, S.; Francioso, O.; Nardi, S. High Molecular Size Humic Substances Enhance Phenylpropanoid Metabolism in Maize (Zea mays L.). J. Chem. Ecol. 2010, 36, 662–669. [Google Scholar] [CrossRef] [PubMed]
  26. Smith, J.L.; Burritt, D.J.; Bannister, P. Shoot dry weight, chlorophyll and UV-B-absorbing compounds as indicators of a plant’s sensitivity to UV-B radiation. Ann. Bot. 2000, 86, 1057–1063. [Google Scholar] [CrossRef]
  27. Chitwood, D.H.; Rundell, S.M.; Li, D.Y.; Woodford, Q.L.; Yu, T.T.; Lopez, J.R.; Greenblatt, D.; Kang, J.; Londo, J.P. Climate and Developmental Plasticity: Interannual Variability in Grapevine Leaf Morphology. Plant Physiol. 2016, 170, 1480–1491. [Google Scholar] [CrossRef]
  28. Zhang, M.; Zhang, S. Mitogen-activated protein kinase cascades in plant signaling. J. Integr. Plant Biol. 2022, 64, 301–341. [Google Scholar] [CrossRef]
  29. Dixon, R.A.; Paiva, N.L. Stress-Induced Phenylpropanoid Metabolism. Plant Cell 1995, 7, 1085–1097. [Google Scholar] [CrossRef]
  30. Vogt, T. Phenylpropanoid Biosynthesis. Mol. Plant 2010, 3, 2–20. [Google Scholar] [CrossRef]
  31. Xing, L.B.; Li, Y.M.; Qi, S.Y.; Zhang, C.G.; Ma, W.C.; Zuo, X.Y.; Liang, J.Y.; Gao, C.; Jia, P.; Shah, K.; et al. Comparative RNA-Sequencing and DNA Methylation Analyses of Apple (Malus domestica Borkh.) Buds with Diverse Flowering Capabilities Reveal Novel Insights into the Regulatory Mechanisms of Flower Bud Formation. Plant Cell Physiol. 2019, 60, 1702–1721. [Google Scholar] [CrossRef]
  32. Shi, J.Y.; Du, X.G. Transcriptome analysis reveals the regulation of cyclic nucleotide-gated ion channels in response to exogenous abscisic acid and calcium treatment under drought stress in tomato. Front. Genet. 2023, 14, 1139087. [Google Scholar] [CrossRef] [PubMed]
  33. Galicia-Campos, E.; García-Villaraco, A.; Montero-Palmero, M.B.; Gutiérrez-Mañero, F.J.; Ramos-Solano, B. Bacillus G7 improves adaptation to salt stress in Olea europaea L. plantlets, enhancing water use efficiency and preventing oxidative stress. Sci. Rep. 2023, 13, 22507. [Google Scholar] [CrossRef]
  34. Sun, X.X.; Feng, D.L.; Liu, M.Y.; Qin, R.X.; Li, Y.; Lu, Y.; Zhang, X.M.; Wang, Y.H.; Shen, S.X.; Ma, W.; et al. Single-cell transcriptome reveals dominant subgenome expression and transcriptional response to heat stress in Chinese cabbage. Genome Biol. 2022, 23, 262. [Google Scholar] [CrossRef] [PubMed]
  35. Guo, W.L.; Chen, B.H.; Chen, X.J.; Guo, Y.Y.; Yang, H.L.; Li, X.Z.; Wang, G.Y. Transcriptome profiling of pumpkin (Cucurbita moschata Duch.) leaves infected with powdery mildew. PLoS ONE 2018, 13, e0190175. [Google Scholar] [CrossRef] [PubMed]
  36. Fraser, C.M.; Chapple, C. The phenylpropanoid pathway in Arabidopsis. Arab. Book 2011, 9, e0152. [Google Scholar] [CrossRef] [PubMed]
  37. Gray, J.; Caparros-Ruiz, D.; Grotewold, E. Grass phenylpropanoids: Regulate before using! Plant Sci. 2012, 184, 112–120. [Google Scholar] [CrossRef]
  38. Liu, J.; Osbourn, A.; Ma, P. MYB Transcription Factors as Regulators of Phenylpropanoid Metabolism in Plants. Mol. Plant 2015, 8, 689–708. [Google Scholar] [CrossRef]
  39. Lanot, A.; Hodge, D.; Lim, E.-K.; Vaistij, F.E.; Bowles, D.J. Redirection of flux through the phenylpropanoid pathway by increased glucosylation of soluble intermediates. Planta 2008, 228, 609–616. [Google Scholar] [CrossRef]
  40. Chen, X.; Ding, Y.; Yang, Y.; Song, C.; Wang, B.; Yang, S.; Guo, Y.; Gong, Z. Protein kinases in plant responses to drought, salt, and cold stress. J. Integr. Plant Biol. 2021, 63, 53–78. [Google Scholar] [CrossRef]
  41. Fujita, M.; Fujita, Y.; Noutoshi, Y.; Takahashi, F.; Narusaka, Y.; Yamaguchi-Shinozaki, K.; Shinozaki, K. Crosstalk between abiotic and biotic stress responses: A current view from the points of convergence in the stress signaling networks. Curr. Opin. Plant Biol. 2006, 9, 436–442. [Google Scholar] [CrossRef]
  42. Gong, Z.; Xiong, L.; Shi, H.; Yang, S.; Herrera-Estrella, L.R.; Xu, G.; Chao, D.-Y.; Li, J.; Wang, P.-Y.; Qin, F.; et al. Plant abiotic stress response and nutrient use efficiency. Sci. China-Life Sci. 2020, 63, 635–674. [Google Scholar] [CrossRef] [PubMed]
  43. Zhu, J.-K. Abiotic Stress Signaling and Responses in Plants. Cell 2016, 167, 313–324. [Google Scholar] [CrossRef] [PubMed]
  44. Falcone Ferreyra, M.L.; Rius, S.P.; Casati, P. Flavonoids: Biosynthesis, biological functions, and biotechnological applications. Front. Plant Sci. 2012, 3, 222. [Google Scholar] [CrossRef] [PubMed]
  45. Zoratti, L.; Karppinen, K.; Escobar, A.L.; Haggman, H.; Jaakola, L. Light-controlled flavonoid biosynthesis in fruits. Front. Plant Sci. 2014, 5, 534. [Google Scholar] [CrossRef] [PubMed]
  46. Xu, J.; Zhang, S. Mitogen-activated protein kinase cascades in signaling plant growth and development. Trends Plant Sci. 2015, 20, 56–64. [Google Scholar] [CrossRef]
  47. Zhang, M.; Su, J.; Zhang, Y.; Xu, J.; Zhang, S. Conveying endogenous and exogenous signals: MAPK cascades in plant growth and defense. Curr. Opin. Plant Biol. 2018, 45, 1–10. [Google Scholar] [CrossRef]
  48. Chayut, N.; Yuan, H.; Saar, Y.; Zheng, Y.; Sun, T.; Zhou, X.; Hermanns, A.; Oren, E.; Faigenboim, A.; Hui, M.; et al. Comparative transcriptome analyses shed light on carotenoid production and plastid development in melon fruit. Hortic. Res. 2021, 8, 112. [Google Scholar] [CrossRef]
  49. Diao, Q.; Tian, S.; Cao, Y.; Yao, D.; Fan, H.; Zhang, Y. Transcriptome analysis reveals association of carotenoid metabolism pathway with fruit color in melon. Sci. Rep. 2023, 13, 5004. [Google Scholar] [CrossRef]
  50. Zhang, A.; Zheng, J.; Chen, X.; Shi, X.; Wang, H.; Fu, Q. Comprehensive Analysis of Transcriptome and Metabolome Reveals the Flavonoid Metabolic Pathway Is Associated with Fruit Peel Coloration of Melon. Molecules 2021, 26, 2830. [Google Scholar] [CrossRef]
  51. Cohen, H.; Dong, Y.; Szymanski, J.; Lashbrooke, J.; Meir, S.; Almekias-Siegl, E.; Zeisler-Diehl, V.V.; Schreiber, L.; Aharoni, A. A Multilevel Study of Melon Fruit Reticulation Provides Insight into Skin Ligno-Suberization Hallmarks. Plant Physiol. 2019, 179, 1486–1501. [Google Scholar] [CrossRef]
  52. Usman, M.G.; Rafii, M.Y.; Martini, M.Y.; Yusuff, O.A.; Ismail, M.R.; Miah, G. Molecular analysis of Hsp70 mechanisms in plants and their function in response to stress. Biotechnol. Genet. Eng. Rev. 2017, 33, 26–39. [Google Scholar] [CrossRef]
  53. Adaskaveg, J.A.; Blanco-Ulate, B. Targeting ripening regulators to develop fruit with high quality and extended shelf life. Curr. Opin. Biotechnol. 2023, 79, 102872. [Google Scholar] [CrossRef]
  54. Tadmor, Y.; Burger, J.; Yaakov, I.; Feder, A.; Libhaber, S.E.; Portnoy, V.; Meir, A.; Tzuri, G.; Saar, U.; Rogachev, I.; et al. Genetics of Flavonoid, Carotenoid, and Chlorophyll Pigments in Melon Fruit Rinds. J. Agric. Food Chem. 2010, 58, 10722–10728. [Google Scholar] [CrossRef] [PubMed]
  55. D’Andrea, L.; Rodriguez-Concepcion, M. Manipulation of plastidial protein quality control components as a new strategy to improve carotenoid contents in tomato fruit. Front. Plant Sci. 2019, 10, 1071. [Google Scholar] [CrossRef] [PubMed]
  56. Han, X.; Huang, X.; Deng, X.W. The photomorphogenic central repressor COP1: Conservation and functional diversification during evolution. Plant Commun. 2020, 1, 100044. [Google Scholar] [CrossRef] [PubMed]
  57. Naeem, M.; Muqarab, R.; Waseem, M. The Solanum melongena COP1 delays fruit ripening and influences ethylene signaling in tomato. J. Plant Physiol. 2019, 240, 152997. [Google Scholar] [CrossRef] [PubMed]
  58. Kim, B.; Piao, R.H.; Lee, G.; Koh, E.; Lee, Y.; Woo, S.; Reflinur; Jiang, W.Z.; Septiningsih, E.M.; Thomson, M.J.; et al. OsCOP1 regulates embryo development and flavonoid biosynthesis in rice (Oryza sativa L.). Theor. Appl. Genet. 2021, 134, 2587–2601. [Google Scholar] [CrossRef]
  59. Bhatia, C.; Gaddam, S.R.; Pandey, A.; Trivedi, P.K. COP1 mediates light-dependent regulation of flavonol biosynthesis through HY5 in Arabidopsis. Plant Sci. 2021, 303, 110760. [Google Scholar] [CrossRef]
  60. Bhatia, C.; Pandey, A.; Gaddam, S.R.; Hoecker, U.; Trivedi, P.K. Low temperature-enhanced flavonol synthesis requires light-associated regulatory components in Arabidopsis thaliana. Plant Cell Physiol. 2018, 59, 2099–2112. [Google Scholar] [CrossRef]
  61. Andralojc, P.J.; Carmo-Silva, E.; Degen, G.E.; Parry, M.A.J. Increasing metabolic potential: C-fixation. Chloroplasts Capture Prod. Modul. Plants 2018, 62, 109–118. [Google Scholar] [CrossRef]
  62. Flecken, M.; Wang, H.P.; Popilka, L.; Hartl, F.U.; Bracher, A.; Hayer-Hartl, M. Dual Functions of a Rubisco Activase in Metabolic Repair and Recruitment to Carboxysomes. Cell 2020, 183, 457–473. [Google Scholar] [CrossRef] [PubMed]
  63. Degen, G.E.; Orr, D.J.; Carmo-Silva, E. Heat-induced changes in the abundance of wheat Rubisco activase isoforms. New Phytol. 2021, 229, 1298–1311. [Google Scholar] [CrossRef] [PubMed]
  64. Degen, G.E.; Worrall, D.; Carmo-Silva, E. An isoleucine residue acts as a thermal and regulatory switch in wheat Rubisco activase. Plant J. 2020, 103, 742–751. [Google Scholar] [CrossRef] [PubMed]
  65. Qu, Y.C.; Sakoda, K.; Fukayama, H.; Kondo, E.; Suzuki, Y.; Makino, A.; Terashima, I.; Yamori, W. Overexpression of both Rubisco and Rubisco activase rescues rice photosynthesis and biomass under heat stress. Plant Cell Environ. 2021, 44, 2308–2320. [Google Scholar] [CrossRef]
  66. Wijewardene, I.; Mishra, N.; Sun, L.; Smith, J.; Zhu, X.L.; Payton, P.; Shen, G.X.; Zhang, H. Improving drought-, salinity-, and heat-tolerance in transgenic plants by co-overexpressing Arabidopsis vacuolar pyrophosphatase gene AVP1 and Larrea Rubisco activase gene RCA. Plant Sci. 2020, 296, 110499. [Google Scholar] [CrossRef]
Figure 1. Metabolomic analysis of melon fruit grown in spring and autumn: (a) Gradual changes in temperature under spring and autumn growing conditions. (b) Gradual changes in illumination under spring and autumn growing conditions. (c) Melon fruit in 40 days after pollination under spring and autumn growing conditions. (d) Circle diagram of the proportion of differential metabolites under primary classification in fruits 40 days after pollination under spring and autumn growing conditions. (e) KEGG metabolic enrichment pathway differential Abundance (DA) Score of differential metabolites in fruits 40 days after pollination under spring and autumn growing conditions. (f) Cluster heatmap of correlated differential metabolites and transcripts in fruits 40 days after pollination under spring and autumn growing conditions.
Horticulturae 10 00993 g001
Figure 2. Co-expression analysis of hub genes in the transcriptional regulatory networks in spring- and autumn-grown melon fruits: (a) The heatmap illustrates the gene clustering results achieved through the Mfuzz method based on their FPKM values. It identified 12 distinct clusters with varied expression patterns. A total of 16,525 DEGs were utilized as input. The expression profiles of genes in these 12 clusters were examined. The Mfuzz clustering was executed using the clusterData function from the R package ClusterGVis, with normalization performed using the Z-score method. (b) PPI network in associated with melon fruit development built based on the hub genes of 40 days after pollination grown in spring and autumn comparison. Purple dashed line marks the hub gene sets of the main enriched functional pathways. Purple shaded area is the pathway with the highest number of enrichment factors. Yellow ring represents DEGs in metabolic process pathway. Blue represents down-regulated DEGs, orange represents up-regulated DEGs. Size of each node is proportional to its value of betweenness centrality and label font size is proportional to node degree. The width of the edges is reparented by the co-expression value of proteins connected to the edge. (c) Regulatory networks of hub genes during fruit development under spring and autumn growing conditions. The color of the outer ring represents the stages they appeared as hub genes. Green, yellow, white, red, and blue represent 0, 10, 20, 30, and 40 days after pollination, respectively. Size of each node is proportional to its value of betweenness centrality and label font size is proportional to node degree. The width of the edges is reparented by the co-expression value of proteins connected to the edge. (d) Clustered expression patterns of hub genes during fruit development under spring and autumn growing conditions. Size of each node is proportional to its FPKM values.
Horticulturae 10 00993 g002
Figure 3. Co-expressed gene clusters and pathways in the co-expression network. Co-expressed clusters are indicated by circles in light blue and yellow. The color of genes in response to light and temperature stimuli and in the production of precursor metabolites and energy was assigned according to the color of the metabolic cluster to which they are connected in the network. The numbers next to the intra-/inter-connections indicate the average distance between two gene clusters. Smaller values indicate closer relationships.
Horticulturae 10 00993 g003
Figure 4. The DEGs and DAMs on the phenylpropanoid pathway in fruits 40 days after pollination under spring and autumn growing conditions: (a) The phenylpropanoid biosynthesis pathway and the downstream branch flavonoid biosynthesis pathway. (b) Heatmap of the differential metabolites on phenylpropanoid pathway. (c) Heatmap of the differential transcripts on phenylpropanoid pathway. (d) Heatmap of correlated differential metabolites and transcripts on phenylpropanoid pathway.
Horticulturae 10 00993 g004
Disclaimer/Publisher’s Note: The statements, opinions and data contained in all publications are solely those of the individual author(s) and contributor(s) and not of MDPI and/or the editor(s). MDPI and/or the editor(s) disclaim responsibility for any injury to people or property resulting from any ideas, methods, instructions or products referred to in the content.

