Article

Physiological and Biochemical Effects of Potassium Deficiency on Apple Tree Growth

by
Evangelia-Vasiliki Ladikou
1,
Gerasimos Daras
2,
Marco Landi
3,
Theocharis Chatzistathis
4,
Thomas Sotiropoulos
5,
Stamatis Rigas
2 and
Ioannis E. Papadakis
1,*
1
Laboratory of Pomology, Department of Crop Science, Agricultural University of Athens, Iera Odos 75, 11855 Athens, Greece
2
Laboratory of Molecular Biology, Department of Biotechnology, Agricultural University of Athens, Iera Odos 75, 11855 Athens, Greece
3
Department of Agriculture, Food and Environment, Via del Borghetto 80, 56124 Pisa, Italy
4
Hellenic Agricultural Organization (ELGO) ‘DIMITRA’, Institute of Soil and Water Resources, Thermi, 57001 Thessaloniki, Greece
5
Department of Deciduous Tree Fruit Growing, Institute of Plant Breeding and Genetic Resources, Hellenic Agricultural Organization (ELGO) ‘DIMITRA’, 11145 Naoussa, Greece
*
Author to whom correspondence should be addressed.
Horticulturae 2025, 11(1), 42; https://doi.org/10.3390/horticulturae11010042
Submission received: 20 November 2024 / Revised: 2 January 2025 / Accepted: 4 January 2025 / Published: 6 January 2025
(This article belongs to the Section Fruit Production Systems)

Abstract

:
Potassium (K) is an essential mineral element that supports numerous plant processes, including photosynthesis, enzyme activation, osmoregulation, and nutrient balance. This study investigated how K deficiency impacts growth, physiological performance, and carbohydrate metabolism in ‘Granny Smith’ apple trees grafted onto M9 rootstock. The experimental material was cultivated hydroponically in a greenhouse under four K regimes, including 0.00, 0.75, 1.50, and 3.00 mM K, over 159 days. Deficiency symptoms such as chlorosis and necrosis were observed primarily in basal leaves. A reduced net photosynthetic rate in top and basal leaves was linked to a decreased stomatal conductance, thus limiting CO2 uptake (stomatal limitations of photosynthesis). Photosynthetic pigments, including chlorophyll a, chlorophyll b, and carotenoids, were also significantly reduced in K-limited leaves. Furthermore, photochemical performance of PSII also declined under K deficiency, with lower electron transport rates, PSII efficiency, and photochemical quenching (non-stomatal limitations of photosynthesis). While the photosynthetic rate declined under K deficiency conditions, the carbohydrate metabolism remained relatively stable without significant variation in total, translocating, or non-translocating sugars. Notably, an increase in sucrose-to-hexose ratio under low K suggests changes in sugar partitioning and utilization. Biomass allocation was also affected, with a notable decrease in the shoot-to-root ratio, mainly due to increased dry weight of roots, likely reflecting an adaptive response to enhance K uptake. Our study provides valuable insights into sustainable K fertilization practices aiming to maximize photosynthetic capacity, pigment content, and biomass production. These findings emphasize the importance of considering rootstock/scion interactions in future research to enhance apple tree vigor and productivity.

1. Introduction

Potassium (K) is a crucial mineral nutrient for plant growth and development, required in large quantities among cations, constituting up to 6% of the plant dry weight (DW) [1,2,3]. As an essential macronutrient, K is involved in numerous physiological processes in plants, such as photosynthesis, enzyme activation, osmoregulation, protein synthesis, ion balance, and the regulation of anion–cation equilibrium [4]. The performance and metabolism maintenance of plants depend heavily on the tight regulation of intracellular K levels, which involves a precise balance between K uptake and efflux. This equilibrium is finely tuned by specific K channels and transporters, which mediate critical cellular responses during plant growth and development [5]. Unlike other macronutrients, K is neither metabolized nor integrated into macromolecules [4]. In certain cellular compartments, such as the cytoplasm, K cannot be replaced by other ions, highlighting a basal role in cellular function [6]. While K represents the fourth most abundant element in the lithosphere, only a small portion (1–4%) is bioavailable to plants, primarily existing on the surface of clay and humus particles [7].
High mobility within phloem is a unique characteristic of K that moves easily throughout the plant. Hence, K deficiency symptoms first appear in older, basal leaves, where reserves rapidly deplete. If the deficiency persists, the symptoms extend acropetally to the younger leaves [1]. K deficiency in plants manifests through a range of symptoms such as browning and curling of leaf tips, along with marginal and interveinal chlorosis. These symptoms are linked to chlorophyll degradation and are indicative of impaired photosynthetic capacity [4,8]. K plays a pivotal role in the translocation of solutes through the phloem, including the movement of sucrose from the shoot to the roots and other sink tissues, such as developing fruits [9]. A deficiency in K disrupts this process by impairing sink activity, which can lead to reduced water status in the plant and a subsequent halt in carbon flow [10].
The apple crop is one of the most ubiquitous and culturally important temperate fruit trees with significant global production and economic value [11]. However, apple cultivation frequently encounters problems with K deprivation, declining fruit yield and quality [12,13]. Adequate K supply is critical not only for the uptake of other essential nutrients, particularly nitrogen (N) [14], but also for the overall growth and development of apple trees. Notably, the demand of apple trees for K varies across the growth stages [15]. Furthermore, K is an important constituent of apple fruits comprising 0.6% to 1.1% of fruit dry mass, depending on the variety, and closely correlates with the K content in leaves [16].
Rootstocks are critical in driving apple trees’ growth, yield, soil interactions, and stress tolerance by influencing water relations and nutrient uptake, transport, and distribution. In this study, a specific combination of rootstock (M9, a dwarfing rootstock) and scion (cv. Granny Smith), widely used globally in intensive apple orchards for supporting high-density planting, was selected to understand how variable K levels affect growth and physiological performance of apple trees. Specifically, M9 is a widely recognized dwarfing rootstock, valued for its ability to control tree size, improve fruit quality and enhance nutrient use efficiency, making it well suited for intensive orchards. It is precocious, with excellent yield efficiency, but requires full tree support due to poor anchorage and brittle roots. M9 is highly susceptible to fire blight, woolly apple aphid, and burr knots, though it offers moderate resistance to collar rot. ‘Granny Smith’ is a vigorous and adaptable scion cultivar known for its high yield, good fruit quality, and preference in producing apples with green skin. We focused on key photosynthetic parameters and carbon metabolism, including dynamics of translocating and non-translocating sugars in the leaves of ‘Granny Smith’ apple trees subjected to K deficiency (0 mM K) and increasing concentrations of K (0.75, 1.50, and 3.00 mM K) within a nutrient solution. Our findings strongly suggest that K availability influences apple tree physiological performance and growth. The results highlight the importance of adequate K fertilization in improving both yield and quality of apple crops. This study aims to provide agronomists and farmers with valuable insights into sustainable K fertilization practices that can enhance apple tree growth and productivity, contributing to efficient use of resources and overall better orchard management.

2. Materials and Methods

2.1. Plant Material and Experimental Preparatory Activities

The experiment was conducted in a glasshouse at the arboretum of the Agricultural University of Athens, with coordinates latitude 37.981860 and longitude 23.705629 (37°58′54.7″ N 23°42′20.3″ E). One-and-a-half-year-old bare-rooted ‘Granny Smith’ apple plants (Malus domestica) grafted onto M9 rootstock were used. As part of the preliminary preparations, the chosen apple trees underwent an extensive pruning process, which included the removal of a substantial portion of their root systems and a significant section of the scion, leaving only a central scion stem approximately 20 cm above the grafting point. To remove any remaining soil substrate, the plants’ root systems were carefully washed first with tap water, followed by two rinses with distilled water. The plants were then transplanted into 5 L plastic pots filled with an experimental substrate consisting of two parts perlite and one part quartz sand. This substrate served as an inert growing medium to facilitate controlled fertilization treatments.
Transplantation occurred in late March to provide optimal conditions for the apple plants. Over the following two months, the plants were irrigated regularly according to their needs. Additionally, every 15 days, they were fertigated with 0.5 L of a solution prepared by dissolving 50 g of 20-20-20 compound fertilizer (including trace elements) and 2.5 g of chelated Fe (6% Fe) in 25 L of tap water.

2.2. Experimental Procedure and K Treatments

The initiation of the main experimental procedure was indicated by the creation of a satisfactory vegetative growth, approximately 12–15 leaves per plant. At that point, twenty (20) apple plants were appropriately pruned to ensure they had a similar number of shoots and leaf area. The plants were randomly divided into four (4) groups corresponding to four (4) K treatments (see below). For each K treatment, five (5) plants each (replicates) were used.
From the beginning of the K treatments until the end of the experiment, the plants were fertigated three times a week with a modified Hoagland’s nutrient solution [17]. Macronutrients were provided at 50% of the recommended concentration in the Hoagland’s solution [17], while the trace elements were supplied at full strength (100%). The different K treatment levels were obtained by adding varying amounts of potassium sulfate (K2SO4) into the nutrient solution, resulting in K concentrations ranging from 0 mM to 3 mM (0.00, 0.75, 1.50, and 3.00 mM K). The concentration of 3.00 mM K used in this study, as the upper K treatment, corresponded to half of the K concentration suggested in the Hoagland’s nutrient solution [17]. For the preparation of all nutrient solutions, deionized water was used. The pH of the nutrient solutions was maintained between 5.8 and 6.0. Every 15 days, substrate leaching was carried out with deionized water to eliminate any accumulated salts. Climatic parameters were closely monitored throughout the experiment using a weather station located inside the glasshouse. The average day/night temperature was maintained at 27 ± 2 °C/18 ± 3 °C, with relative humidity ranging from 50% to 80%. Light intensity at the canopy level averaged between 700 and 1400 μmol m−2 s−1 during midday. To prevent overheating during summer, the glasshouse was coated with a specialized white paint that adjusted its transparency based on light intensity, ensuring optimal growing conditions for the plants.

2.3. Experimental Duration and Data Collection

The experiment was completed at 159 days after the initiation of the K treatments (159 DAT), corresponding to the period when visible symptoms of K deficiency were observed in the basal leaves of the apple plants treated without K (0 mM K). Throughout the experiment, the plants were monitored at a physiological and phenotypical level, including measurements of various parameters relating to their photosynthetic performance. However, only the data collected at the end of the experiment is presented in this study, as we performed many different measurements and determinations to take a holistic approach to understanding K deficiency in apple plants.
In short, at the end of the experiment, photosynthetic parameters were measured under constant photosynthetically active radiation (PAR), and chlorophyll fluorescence measurements were also carried out across varying PAR levels. Additionally, plant leaves were sampled for chlorophyll, carotenoid carbohydrates, and electrolyte leakage analyses. Finally, after recording the lengths of the shoots of all experimental plants, they were harvested and separated into leaves, scion stems, rootstock stems, and roots. Each plant part was weighed, and various plant growth parameters were determined. Detailed methods for all measurements and determinations are described below.

2.4. Plant Growth

On the last day of the experiment (159 DAT), the total length of the scion’s stems per each experimental plant were recorded in centimeters (cm). Then, the plants were divided into various segments, namely leaves (top and basal), scion stems (top and basal), rootstock stem, and root. After this separation, the plant parts were individually weighed using an analytical digital balance (in grams, g), and their FWs were recorded. Subsequently, each plant part underwent a tap water wash followed by two washes with deionized water. The plant parts were then placed in paper bags and dried in an oven at 75 °C until a constant weight was attained for the respective measurements of their DWs. The FW and DW of the individual plant parts were summed to calculate the respective weights of each entire plant, scion, rootstock, and aboveground parts (shoot) of each experimental plant. Finally, the water content of each plant part was also calculated as a percentage of its total FW.

2.5. Photosynthesis

Gas exchange parameters, including photosynthetic rate (Pn), transpiration rate (E), intercellular CO2 concentration (Ci), stomatal conductance (gs), instantaneous (Pn/E) and intrinsic water use efficiency (Pn/gs), and CO2 use efficiency (Pn/Ci), were assessed at 157 DAT. Measurements were conducted on fully expanded leaves, ensuring uniform maturity. For consistency, basal leaves were selected from the middle of the lower half of the shoots, while top leaves were selected from the middle of the upper half. This standardized leaf selection approach ensured consistency in leaf position and maturity. These measurements were conducted separately on basal and top fully expanded leaves, with two basal and two top leaves used per experimental plant. A Portable Infrared Gas Analyzer (model Li-6400; LI-COR Inc., Lincoln, NE, USA) was utilized for the measurements, ensuring stable light conditions (1200 μmol photons m−2 s−1) and ambient CO2 concentration (400 ± 3 µmol CO2 mol air−1). The measurements were carried out between 9:15 and 11:15 in the morning.

2.6. Chlorophyll Fluorescence Analysis

Analyzing chlorophyll a fluorescence is a crucial aspect of studying plant physiology. In this particular study, chlorophyll a fluorescence parameters were measured at 158 DAT, separately in the top and basal leaves of apple plants treated with either 0.00 or 1.50 mM K. The measurements were conducted using a ΜΙΝΙ-PAM fluorometer from Walz, Germany, under different PAR levels ranging from 0 to 1700 μmol photons m−2 s−1. Dark-adapted leaves were used for measuring the baseline fluorescence (F0) and maximum fluorescence (Fm) before and after a saturating pulse. The maximal photosystem II (PSII) photochemical efficiency (Fv/Fm) and the operating PSII efficiency (ΦPSII) were calculated based on the fluorescence values. Additionally, the proportion of open reaction center (qp) was determined. Quantum yields of regulated (ΦNPQ) and non-regulated (ΦNO) photochemical energy loss in PSII, as well as operational PSII efficiency (ΦPSII) at varying photon flux densities, were calculated following established methods. The electron transport rate (ETR) was also determined, and light−response curves were generated using a light ramp with nine steps from 0 to 1700 μmol m−2 s−1. These comprehensive chlorophyll a fluorescence analyses provide valuable insights into the photosynthetic performance and response of apple plants to different K treatments and light conditions.

2.7. Chlorophylls and Carotenoids

For chlorophyll and carotenoid determinations, 10 fresh leaf discs (5 mm in diameter) were sampled from both the top and basal leaves of each experimental plant at 157 DAT. Before analysis, the FWs of the samples were recorded. Afterwards, the leaf discs of each sample were ground in a cold mortar with 10 mL of cold acetone−water solution (80%, v/v). The resulting mixture was then transferred to 15 mL falcon tubes, kept in the dark for 2 h and vortexed at 15 min intervals during this period. Following this, the samples were subjected to centrifugation at 4400 rpm for 5 min. Chlorophyll a (Chla), chlorophyll b (Chlb), and carotenoids (Car) concentrations were determined spectrophotometrically using a Helios Gamma UV−Vis Spectrophotometer 9423 UVG (Thermo Electron Corporation, Mercers Row, Cambridge CB5 8HY, UK). Absorbance was equations recorded at 470 nm, 647 nm, and 663 nm. Concentrations were determined using the provided by Lichtenthaler and Buschmann [18]:
C h l a = 12.25     A 663 2.79     A 647
C h l b = 21.5     A 647 5.1     A 663
C a r = 1000     A 470 1.82     C h l a 85.02     C h l b 198
In addition to determining the concentrations of Chla, Chlb, and Car, calculations were performed for total chlorophylls (Chla + Chlb) and the ratio between Chla and Chlb. All these determinations and calculations were conducted using both leaf FW (μg mg−1 FW) and area (μg cm−2) as bases.

2.8. Electrolyte Leakage

Ten (10) leaf discs, each with a diameter of 5 mm, were separately sampled from both the top and basal leaves of each experimental plant at 157 DAT. These discs were individually placed in falcon tubes, each containing 3 mL of a 0.3 M mannitol solution. The samples were kept at room temperature for 2 h, with periodic vortexing every 30 min using a vortex mixer. After 2 h, the electrical conductivity of each sample, denoted as C1, was measured. Additionally, the conductivity of a blank sample (C0) consisting solely of 0.3 M mannitol was measured. Subsequently, the samples were transferred to a water bath for 15 min at 80 °C. They were then transferred under running cold water to return to room temperature. Finally, the electrical conductivity of each sample, denoted as C2, was measured again. The percentage of electrolyte leakage from the cellular membranes of the leaves was calculated using the following formula:
%   E l e c t r o l y t e   L e a k a g e = ( C 1 C 0 ) 100 C 2 C 0

2.9. Carbohydrates

For carbohydrate concentration determination, 30 mg of freeze-dried leaf tissue (collected from the top leaves at 157 DAT) was mixed with 2 mL of HPLC-grade water (Carlo Erba Reagents S.A.S, Val-de-Reuil, France) and vortexed for 25 s. Subsequently, water-soluble carbohydrates were extracted using a microwave oven at 400 watts for 2 min. After this, the mixture was centrifuged at 4400× g for 10 min at 4 °C. The supernatant was carefully collected, and this process was repeated twice. The two supernatants were pooled together and then filtered using syringe filters with a pore size of 0.2 μM.
HPLC analyses were performed in isocratic mode using an HPLC pump (model 510 Waters, Milford, MA, USA) paired with an HP refractive index detector (HP 1047A, HP, Palo Alto, CA, USA). The mobile phase was HPLC-grade water. A 20 μL aliquot of the extract was injected into an Agilent HI-PLEX Ca2+ column (7.7 × 300 mm, 8 µm), with the mobile phase consisting of 100% H2O, a flow rate of 0.6 mL min−1, and a column temperature of 80 °C. Detection was carried out using a refractive index detector (Agilent, Santa Clara, CA, USA). Chromatogram analysis was performed with the Peak Simple Chromatography Data System, which included hardware (Model 302, SRI Instruments, Bad Honnef, Germany) and the Peak Simple 4.51 software for chromatography data acquisition and integration (SRI Instruments, Bad Honnef, Germany). The concentrations of sucrose, glucose, fructose, and sorbitol were calculated by comparing the sample values to reference curves obtained using HPLC-grade standards.

2.10. Statistical Data Analysis

The experiment followed a completely randomized design (CRD) with five plants per K treatment (0.00, 0.75, 1.50, and 3.00 mM K), each plant treated as an independent biological replicate (n = 5). The data were statistically analyzed using analysis of variance (ANOVA) with the IBM SPSS Statistics 26 software package (IBM Corp., Armonk, NY, USA). To compare means of each parameter among different K treatments, Duncan’s multiple range test was utilized (p ≤ 0.05). In each table presented in the Results section of this work for the visualization of the means alongside the four K treatments, means followed by the same letter(s) indicate nonsignificant differences between K treatments. Especially for the measurements of various chlorophyll fluorescence parameters which were only assessed in the plants treated without K (0.00 mM K) or with 1.50 mM K, the Student’s t-test (p ≤ 0.05) was used to compare the two K treatments at each PAR level. In the relevant figures, the presence of asterisk(s) indicates statistically significant differences between 0 and 1.50 mM K treatments.

3. Results

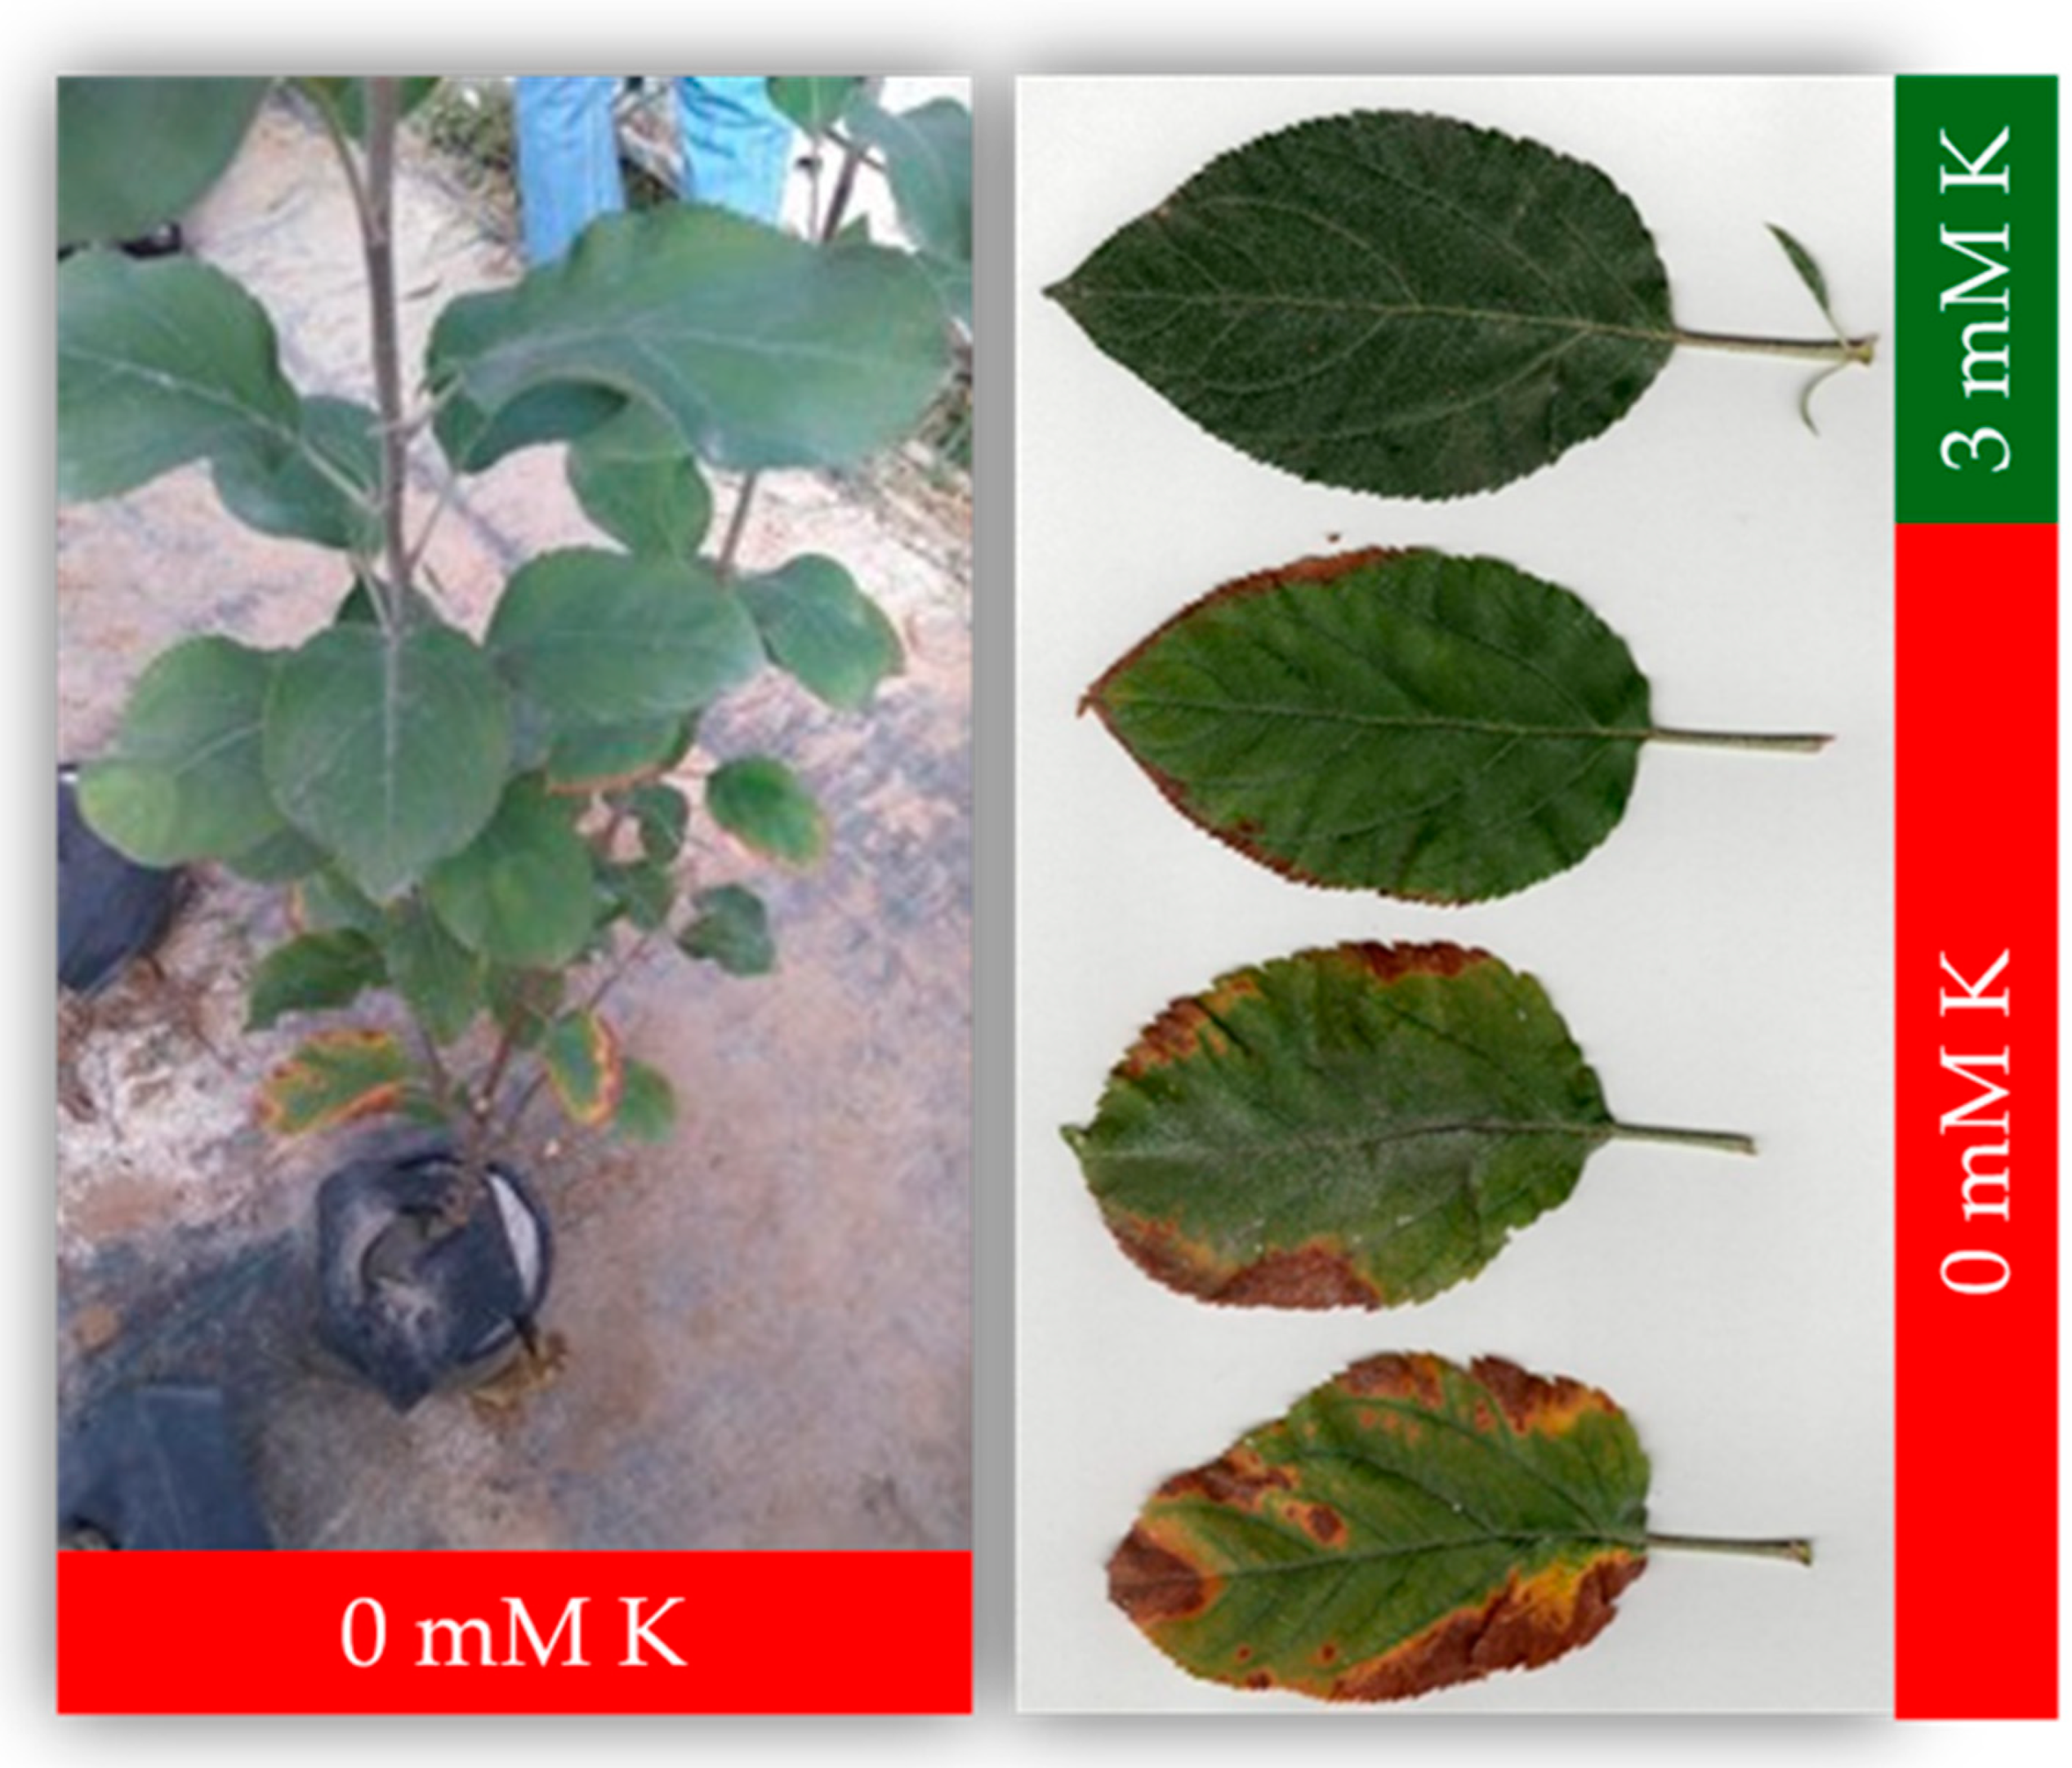
3.1. Potassium Deficiency Symptoms and Plant Growth Measurements

K is an essential nutrient for plant growth, and its deficiency causes significant physiological changes in plants, particularly in leaves. In the basal leaves of apple plants treated with a nutrient solution deprived of K (0 mM K), visual symptoms of K deficiency appeared by the end of the experiment. These symptoms included peripheral chlorosis, seen between the lateral main veins, starting from the leaf tip and extending toward the base. This chlorosis gradually spread from the leaf edges towards the central vein and was later followed by necrosis, evident as brown discoloration (Figure 1). K deficiency was further confirmed through nutrient analysis using flame photometry, which revealed significantly lower K levels in the K-deficient plants (0.328% DW K in basal leaves under 0.00 mM K treatment) compared to in plants receiving adequate K (1.886% DW K and 3.038% DW K in basal leaves under 1.50 and 3.00 mM K treatments, respectively).
To further comprehend the effects of K deficiency in plant growth, we measured the FWs and DWs of various parts of ‘Granny Smith’ apple trees together with the total length of the scion’s stems under varying K concentrations in the nutrient solution (0.00, 0.75, 1.50, and 3.00 mM) (Table 1). K levels in the nutrient solution did not significantly modify the total FW of leaves, which remained relatively consistent across treatments. However, a notable increase in the FW of scion stems was observed upon K increase given that plants without K had a significant low scion stem FW compared to those receiving K supplements. While the FW of the rootstock stem did not exhibit significant variation across treatments, the root FW showed a general decline as K concentrations increased, although these reductions were not statistically significant. Interestingly, the total FW of the entire plant remained unaffected by K levels, revealing no significant differences among the treatments. Similarly, neither the FW of the scion nor the rootstock demonstrated meaningful variation in response to changes in K concentrations. However, the shoot-to-root FW ratio revealed a significant increase with higher K concentrations (1.50–3.00 mM K), indicating a shift in biomass allocation favoring the aboveground parts of the plant. This ratio was markedly lower in plants grown without K, while those supplied with higher K levels (1.50–3.00 mM K) exhibited significantly higher shoot-to-root ratios. The leaf DW remained largely unaffected by K availability, showing minimal variation across treatments. In contrast, the scion’s stem DW increased notably upon higher K levels, being lowest in the absence of K (0.00 mM K) and significantly higher in treatments with added K (0.75–3.00 mM K). Rootstock’s stem DW remained unaffected, though there was a slight upward trend with increasing K levels. Interestingly, root DW decreased as K concentration increased, indicating a shift in biomass allocation. Despite these changes, the total plant DW did not significantly differ across treatments, with only minor fluctuations. Similarly, the DWs of both the scion and rootstock remained stable, showing unaltered variation with K levels. However, the shoot-to-root DW ratio significantly increased as K concentrations elevated (0.75–3.00 mM K), reflecting a shift toward greater shoot growth relative to root mass. Regarding the water content of various plant parts, it was unaffected by K treatments in most tissues, except for the scion’s stems and total scion, where significantly lower water content percentages were observed in plants grown without K supplementation (0.00 mM K) compared to those treated with 3.00 mM K. As for the scion stem length, K concentrations did not have any significant effect, with stem lengths remaining comparable across treatments, albeit minor variations. Overall, these findings demonstrate that while K deficiency induced visible physiological symptoms in apple leaves, the impact on plant growth was relatively subtle, influencing biomass allocation patterns. Specifically, K deficiency treatment (0 mM K) reduced the shoot-to-root ratio and scion stem DW while increasing root DW, with no significant impact on total plant weight (Table 1).

3.2. Impact of Potassium on Photosynthetic Parameters and Water Use Efficiency

The effects of K concentrations (0.00, 0.75, 1.50, and 3.00 mM) on several photosynthetic parameters were evaluated on the top and basal leaves of ‘Granny Smith’ apple trees (Table 2). The net photosynthetic rate (Pn) exhibited a clear positive response to increasing K concentrations on the top leaves of apple trees, reaching the highest value at 1.50 mM K. This increase in Pn at 1.50 mM K was significantly greater compared to at the low K concentrations (0.00–0.75 mM K), demonstrating that optimal K levels sustain photosynthesis.
Stomatal conductance (gs) showed a range of values across treatments, with the highest value recorded at 1.50 mM K, though no statistically significant differences were observed among the rest of K concentrations (0.00, 0.75, and 3.00 mM K). Interestingly, intercellular CO2 concentration (Ci) was notably lower at the highest K concentration (3.00 mM), compared to under the other treatments. However, the transpiration rate (E) remained stable across the treatments, without showing any significant alterations. Intrinsic water use efficiency (Pn/gs) improved markedly at 3.00 mM K, highlighting a more efficient use of water at this K concentration. Similarly, CO2 use efficiency (Pn/Ci) was the highest at 1.50–3.00 mM K, and the instantaneous water use efficiency (Pn/E) also significantly increased at the highest K concentration (3.00 mM K), showing a complex relationship between K availability and physiological efficiency in apple trees. Further, the net photosynthetic rate (Pn) showed a marked improvement upon an increase of K levels on the basal leaves of apple plants, with the highest values observed when K concentration reached the highest level (3.00 mM K). This significant enhancement in Pn highlights the positive role of K in promoting photosynthesis in lower canopy leaves.
Stomatal conductance (gs) also improved while K increased, showing notable differences among treatments and indicating a better gas exchange efficiency at higher K levels (1.50–3.00 mM K). Although the intercellular CO2 concentration (Ci) remained relatively constant among treatments, the overall stability of this parameter suggests that K had a subtle effect on internal CO2 levels. Similarly, transpiration rates (E) remained constant without any significant variations among treatments, pointing to a consistent water loss through leaves. Intrinsic water use efficiency (Pn/gs) remained high, irrespective of K concentrations, indicating efficient CO2 assimilation per unit of water used. Both CO2 use efficiency (Pn/Ci) and instantaneous water use efficiency (Pn/E) showed significant improvements at high K concentrations, further emphasizing the beneficial effects of K on physiological performance of ‘Granny Smith’ apple trees. These findings demonstrate the importance of adequate K supply in enhancing photosynthetic capacity, gas exchange and water use efficiency, particularly in basal leaves, which are more susceptible to K deficiency than the top leaves due to K high mobility in phloem.

3.3. Potassium Levels Affect Leaf Photosynthetic Pigments and Electrolyte Leakage

K played a critical role on physiological homeostasis maintenance of apple trees and, upon K+ deficiency, detrimental effects became evident regarding the photosynthetic pigments and cell membrane stability (Table 3). K deficiency (0.00 mM K) reduced Chla levels per unit area of the top leaves, which significantly increased upon treatment with higher K concentrations. Similarly, total Chl (a + b) and carotenoids per unit area were reduced under K deficiency (0.00 mM K), while higher K levels (1.50–3.00 mM K) restored these parameters. Electrolyte leakage was significantly higher in K-deficient trees, decreasing from 28.47% leakage at 0.00 mM K to 13.94% at 3.00 mM K, indicating an impaired membrane stability under K deficiency.
K deficiency also reduced Chla content on the basal leaves, which nearly duplicated at 0.75 mM K and remained high upon elevated K levels (1.50–3.00 mM K). Chlb and total Chl followed similar trends. Carotenoid content was lower in K-deficient leaves but significantly increased with higher K concentrations (0.75–3.00 mM K). Electrolyte leakage in the basal leaves was also highest at 0.00 mM K and decreased progressively while the K levels increased from 0.75 to 3.00 mM. These findings suggest that K deficiency impairs pigment accumulation and cell membrane integrity particularly in the basal leaves of apple trees. These results show the importance of adequate K supply in enhancing chlorophyll and carotenoid content while restricting electrolyte leakage, particularly in the basal leaves of ‘Granny Smith’ vulnerable apple cultivar.

3.4. Potassium Affects Glucose and the Sucrose-to-Hexose Ratio in Leaves

K availability subtly affected carbohydrate metabolism in apple trees, influencing specific sugar fractions while preserving overall carbohydrate stability across different K concentrations (Table 4). Sucrose levels remained relatively constant across all K treatments without any significant differences. However, glucose content was significantly higher at 3.00 mM K compared to under the rest of treatments (0.00, 0.75, and 1.50 mM K), including K deficiency (0.00 mM K). Sorbitol, as the primary sugar alcohol, together with fructose, remained at steady levels among all K treatments. The total sugar content and translocating sugars were not significantly affected by K deficiency, with total and translocating sugars ranging from 14.94% to 17.51% and 12.71% to 15.15%, respectively. Non-translocating sugars showed a slight increase under K deficiency, though these differences were not statistically significant. The ratios of translocating to total sugars, non-translocating to total sugars, and translocating to non-translocating sugars did not vary significantly among the treatments, indicating that K levels did not markedly alter the balance between such sugar fractions. However, the ratio of sucrose to the sum of fructose or glucose (sucrose-to-hexose ratio) was significantly higher under K deficiency and decreased as K levels increased. Our findings suggest that K deficiency exclusively influences glucose and the sucrose-to-hexose ratio while the overall carbohydrate profile remains relatively stable among distinct K concentrations.

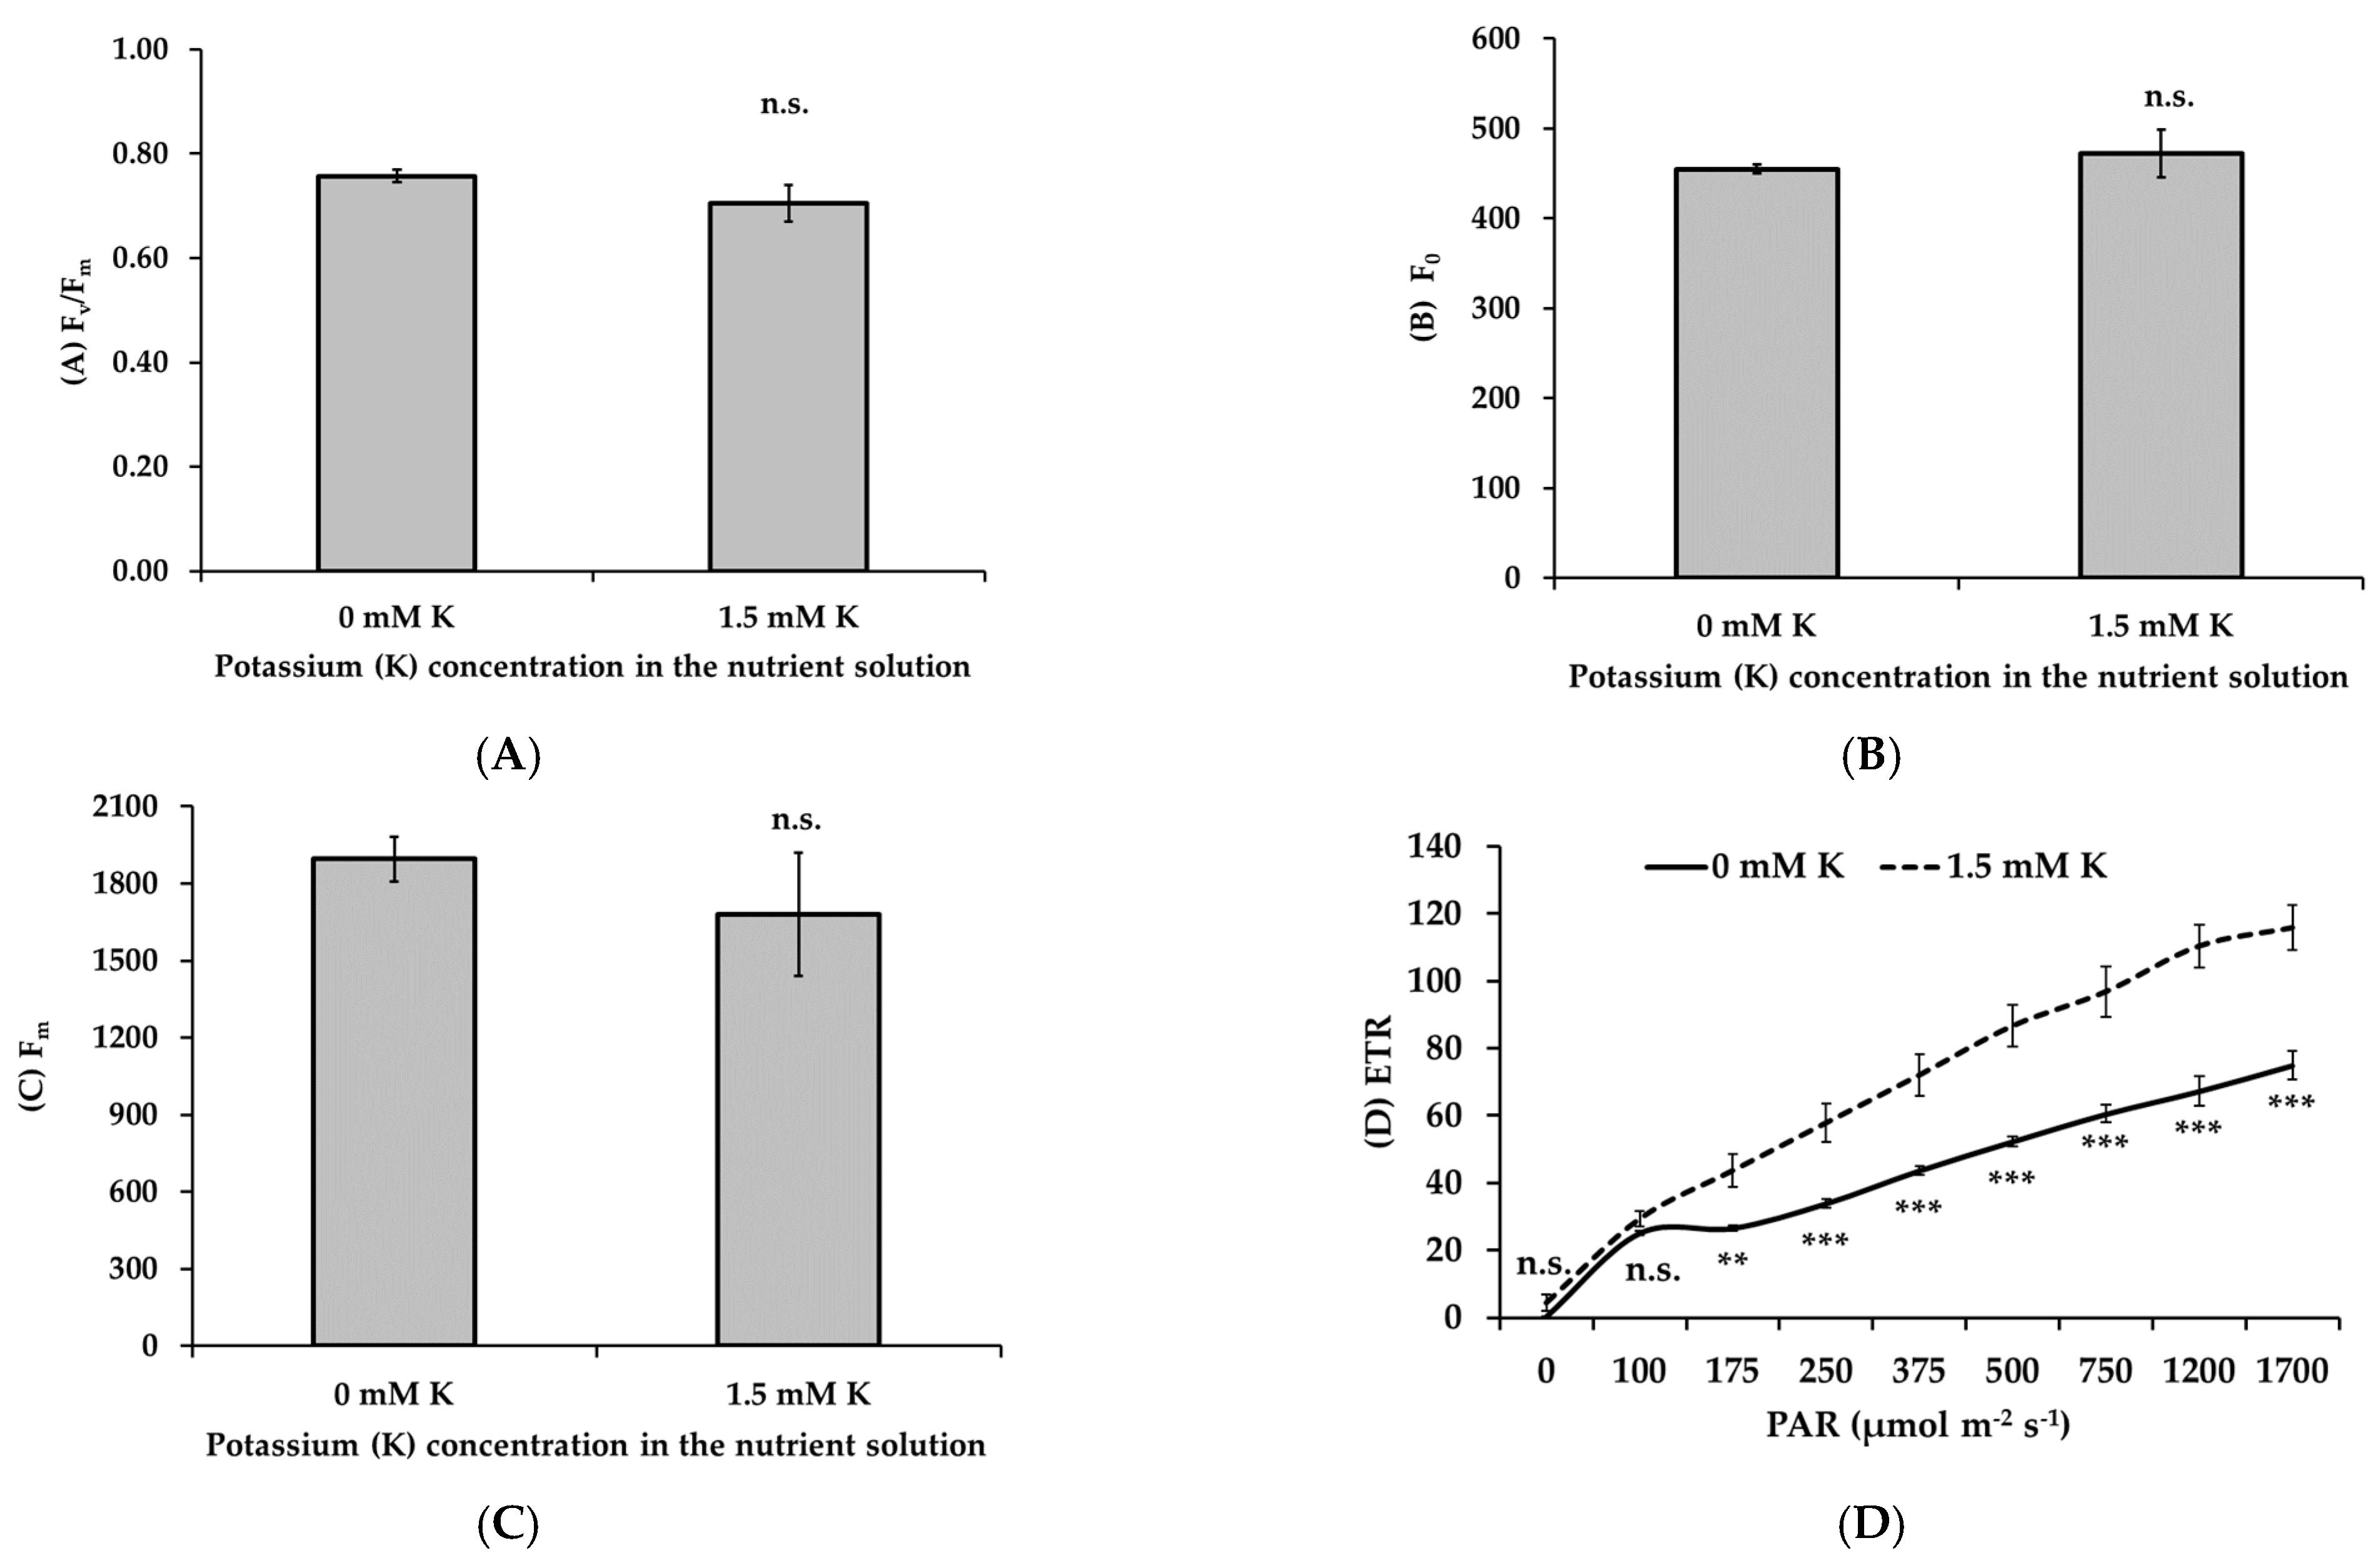
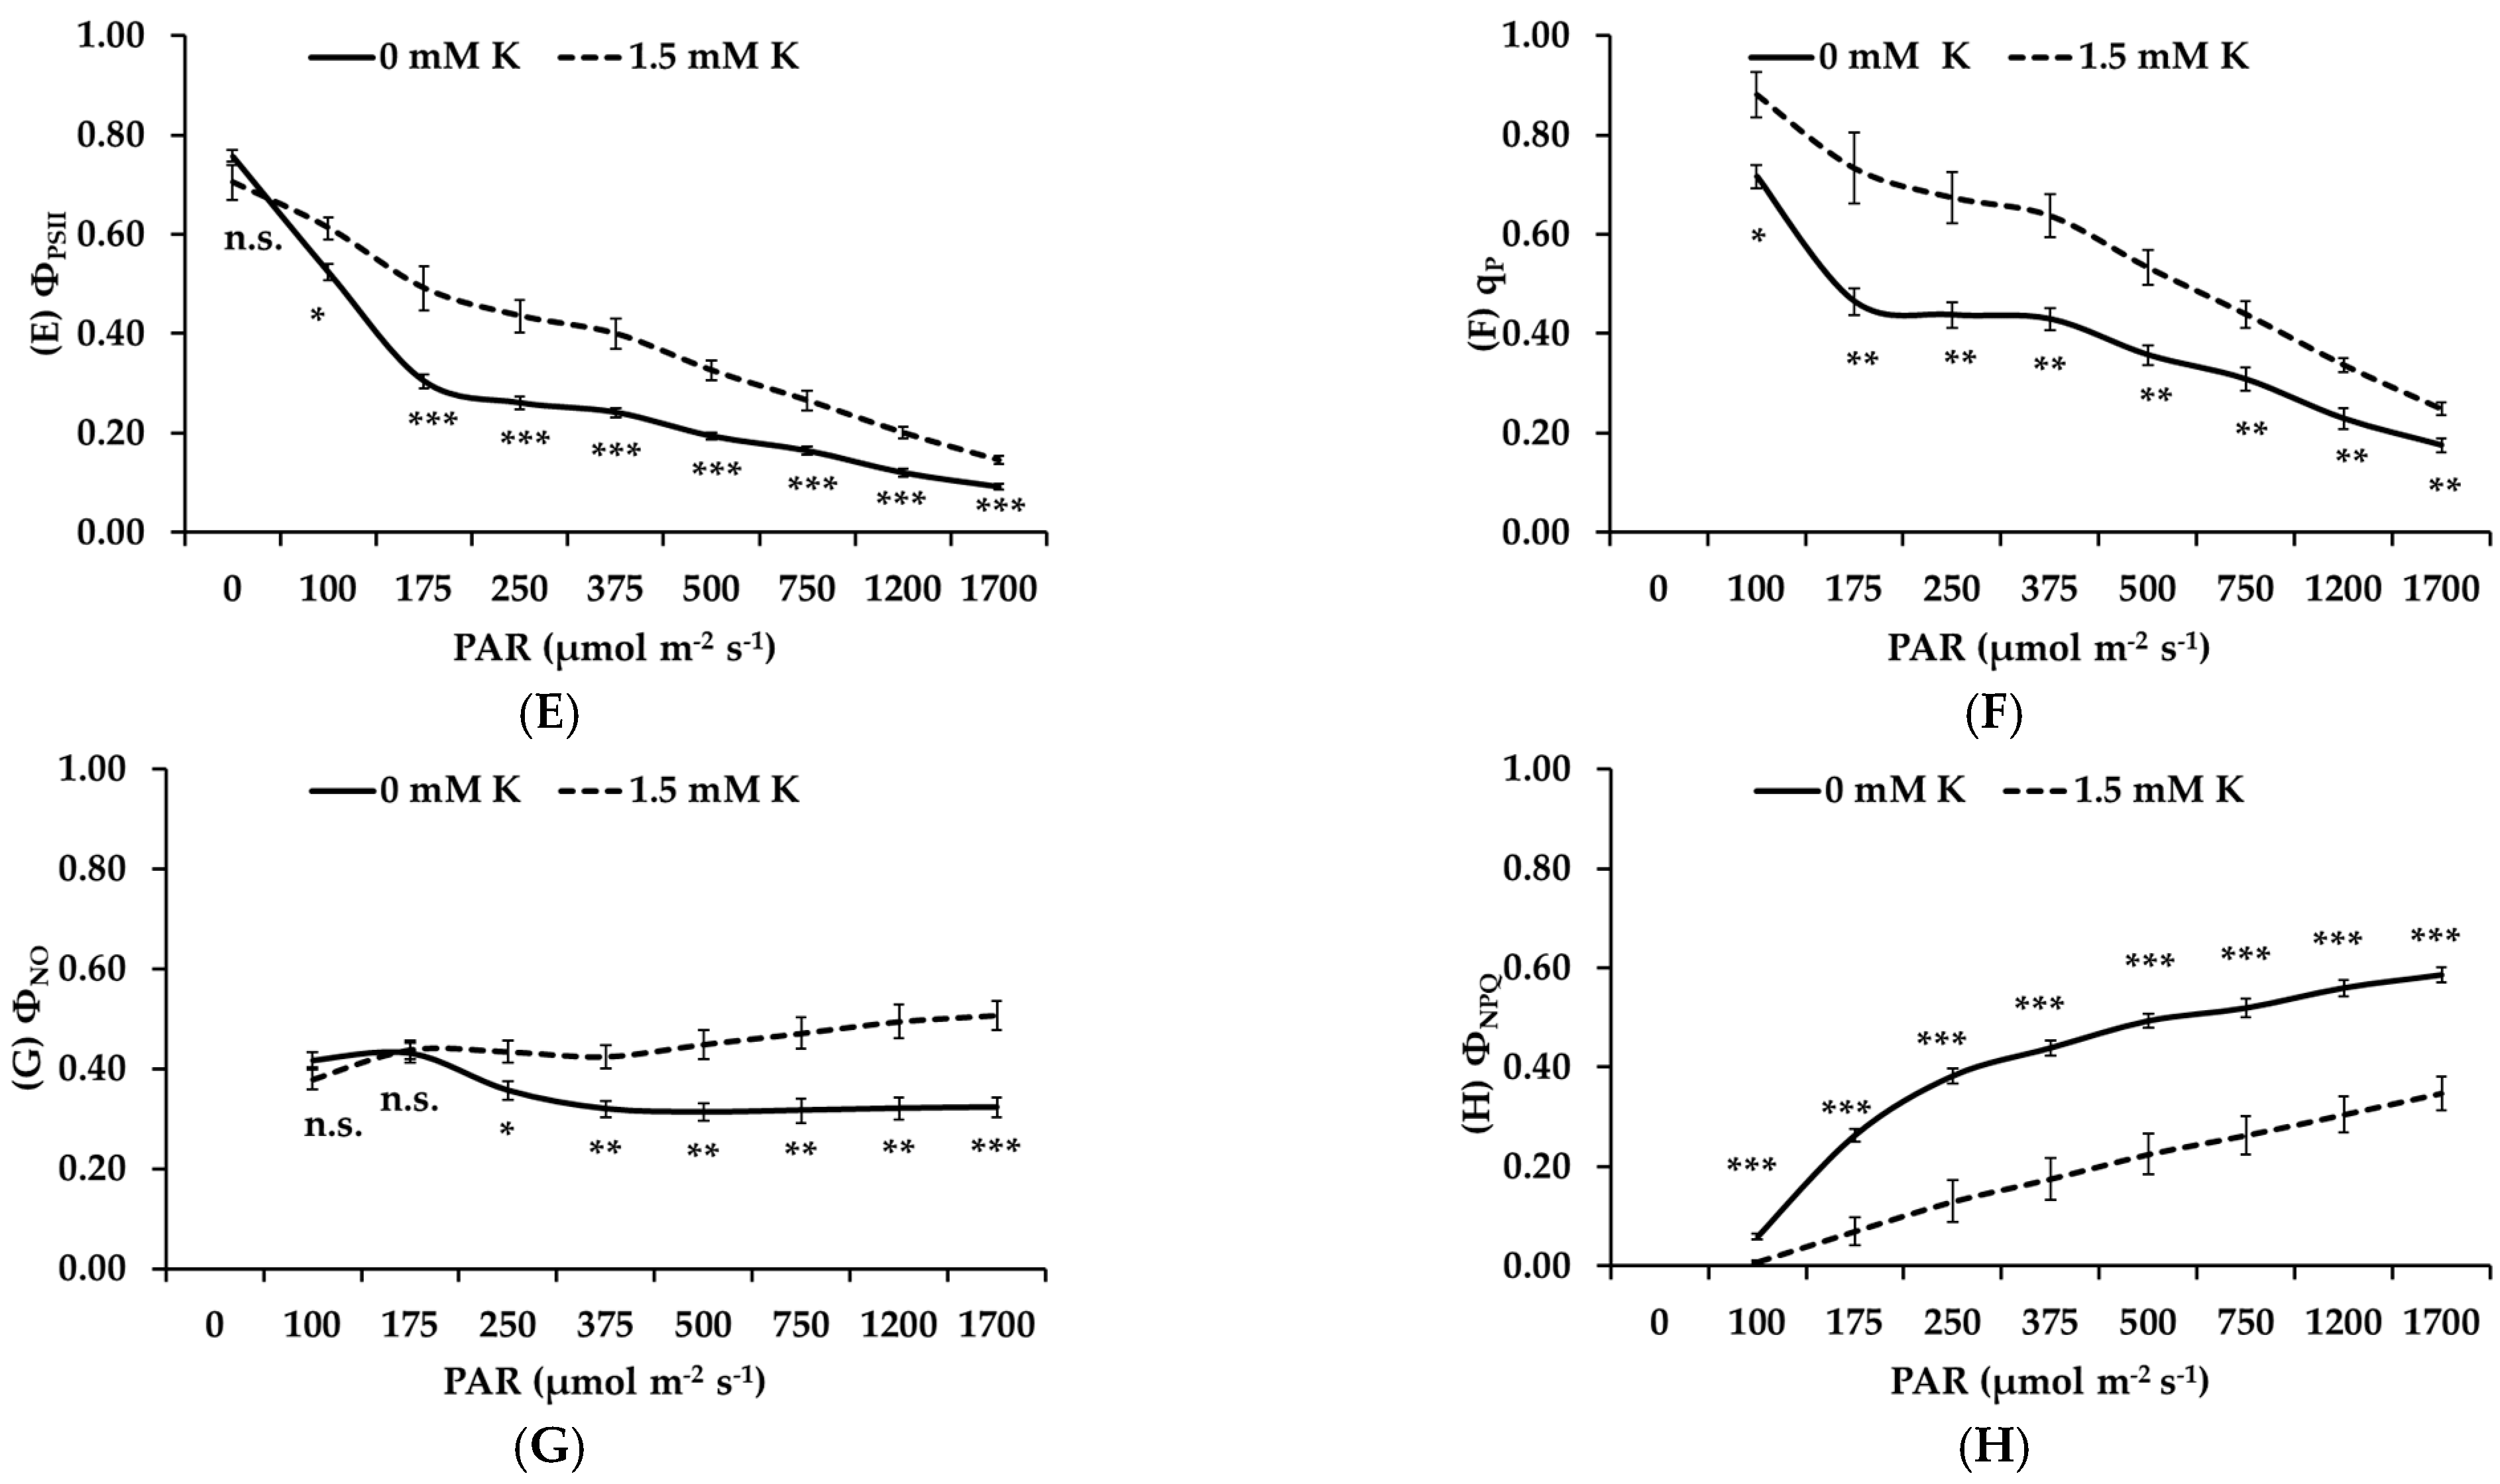
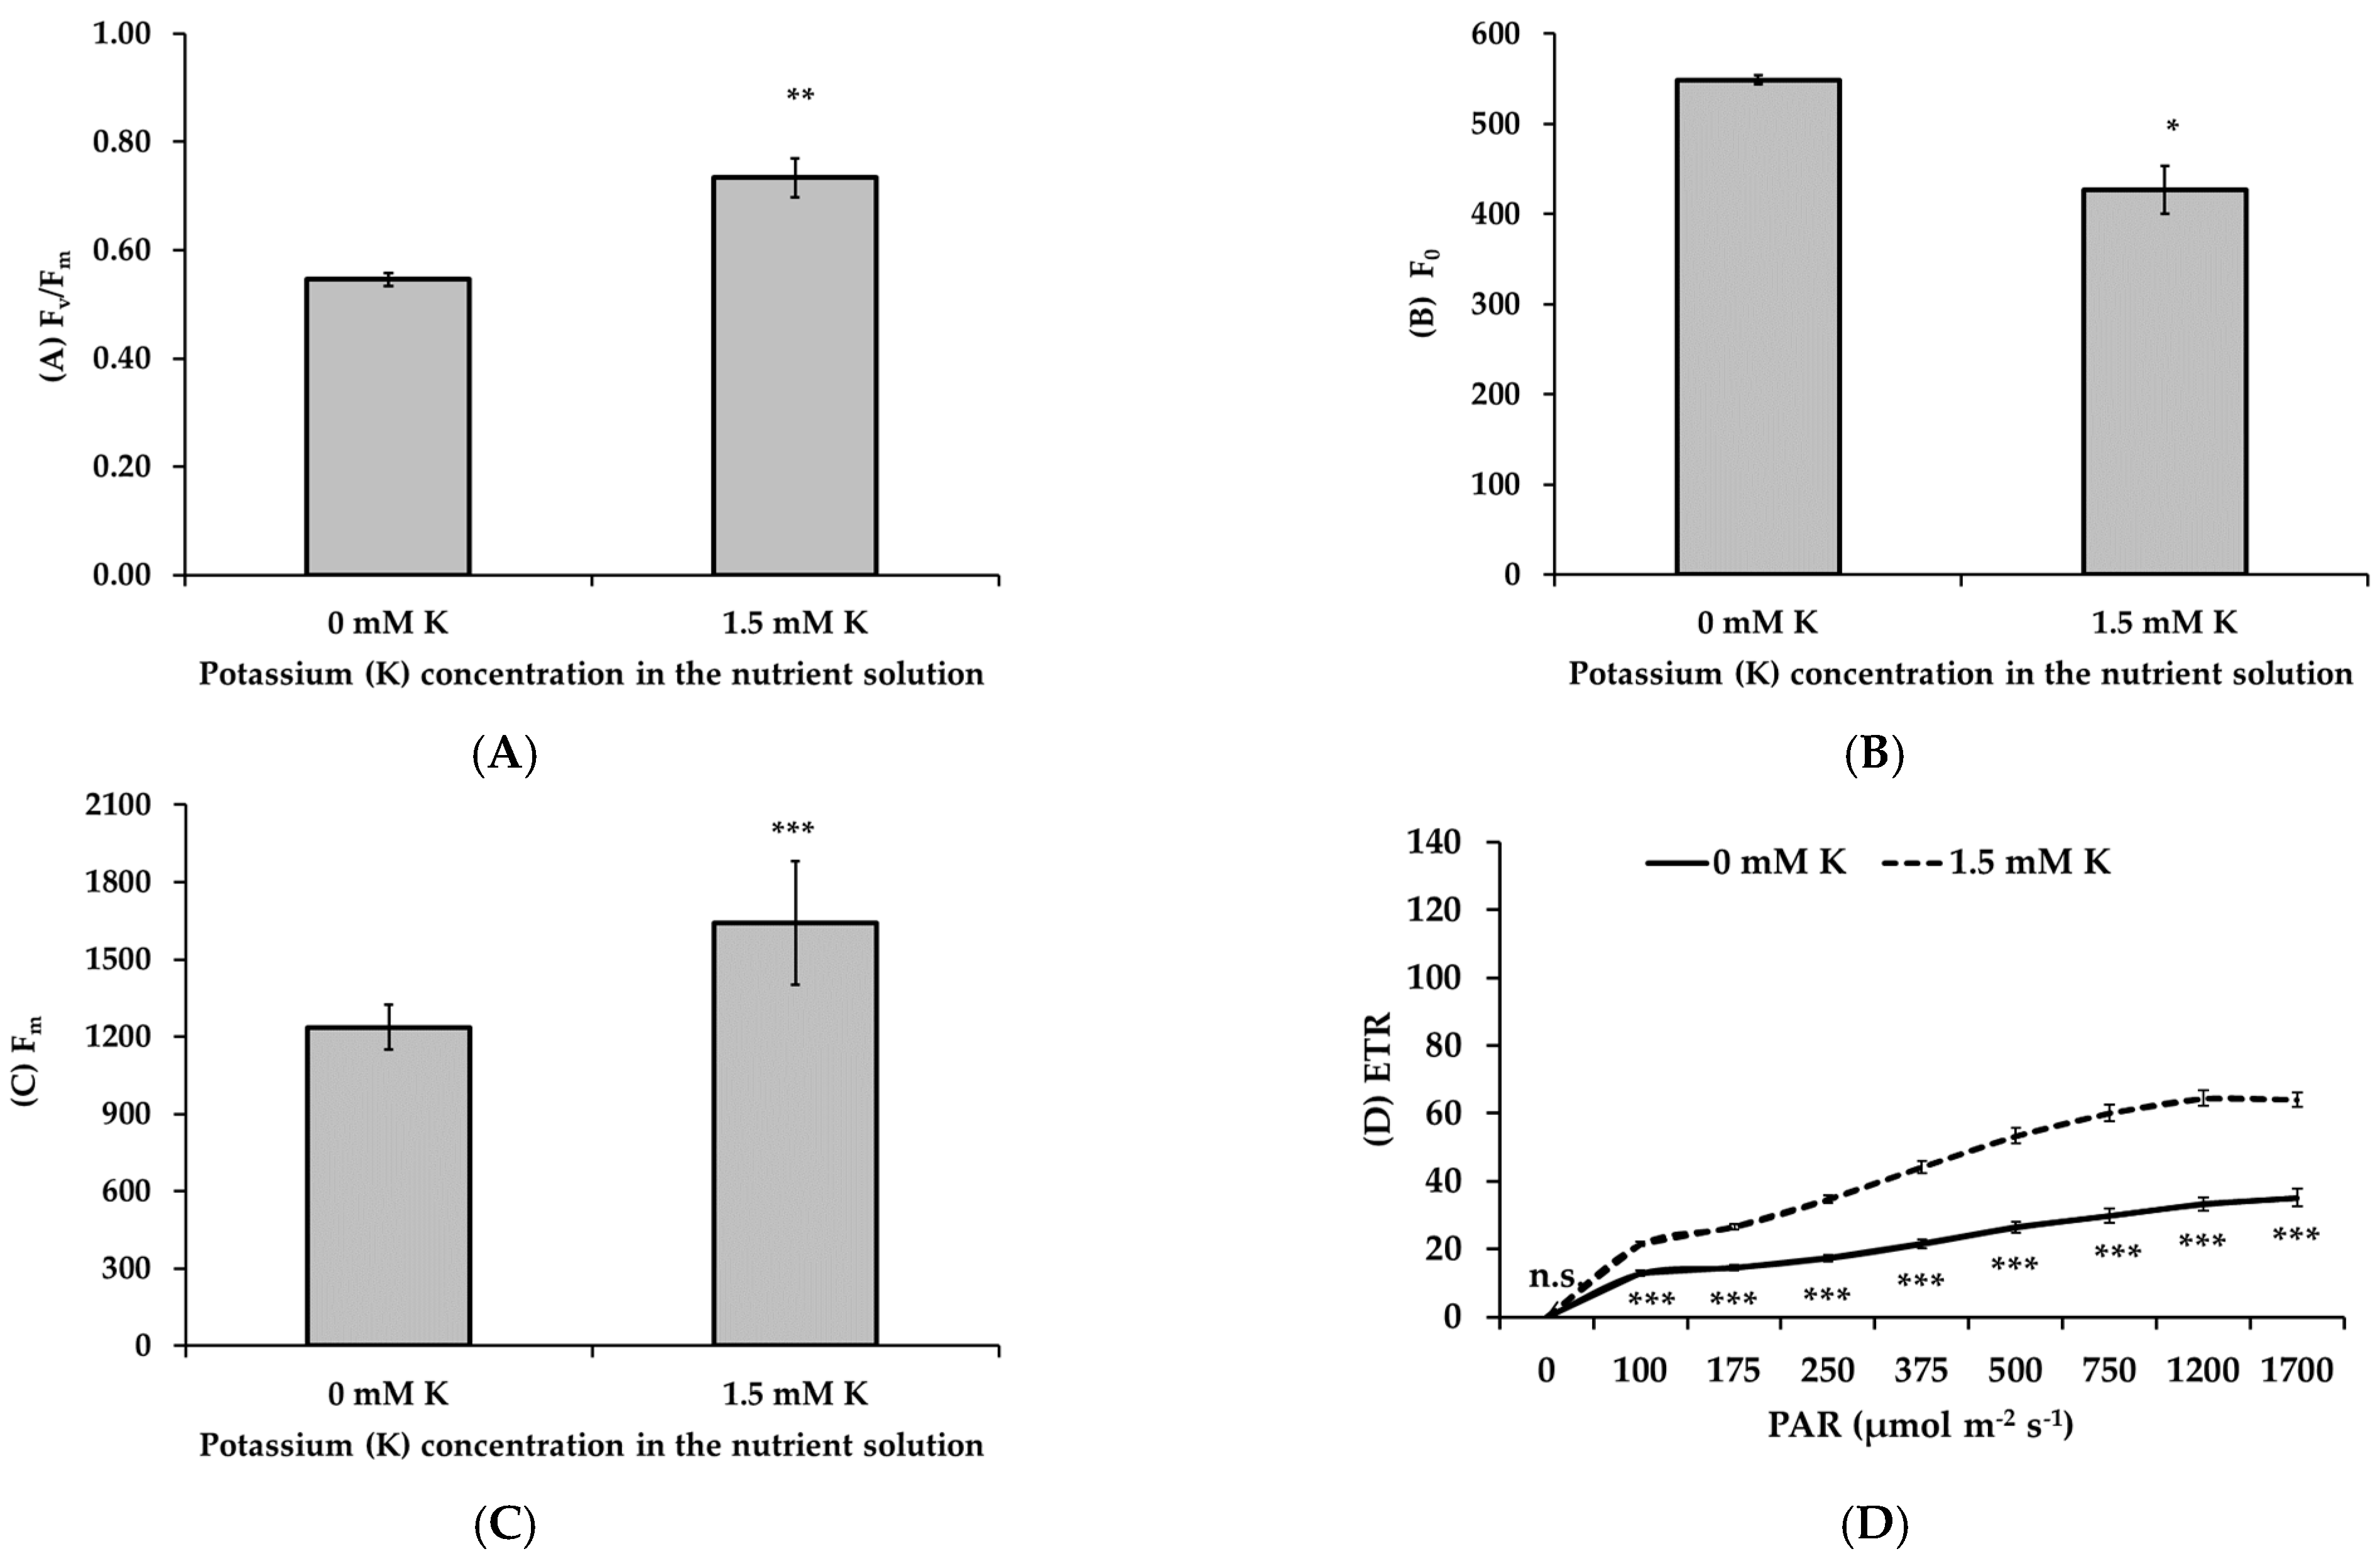
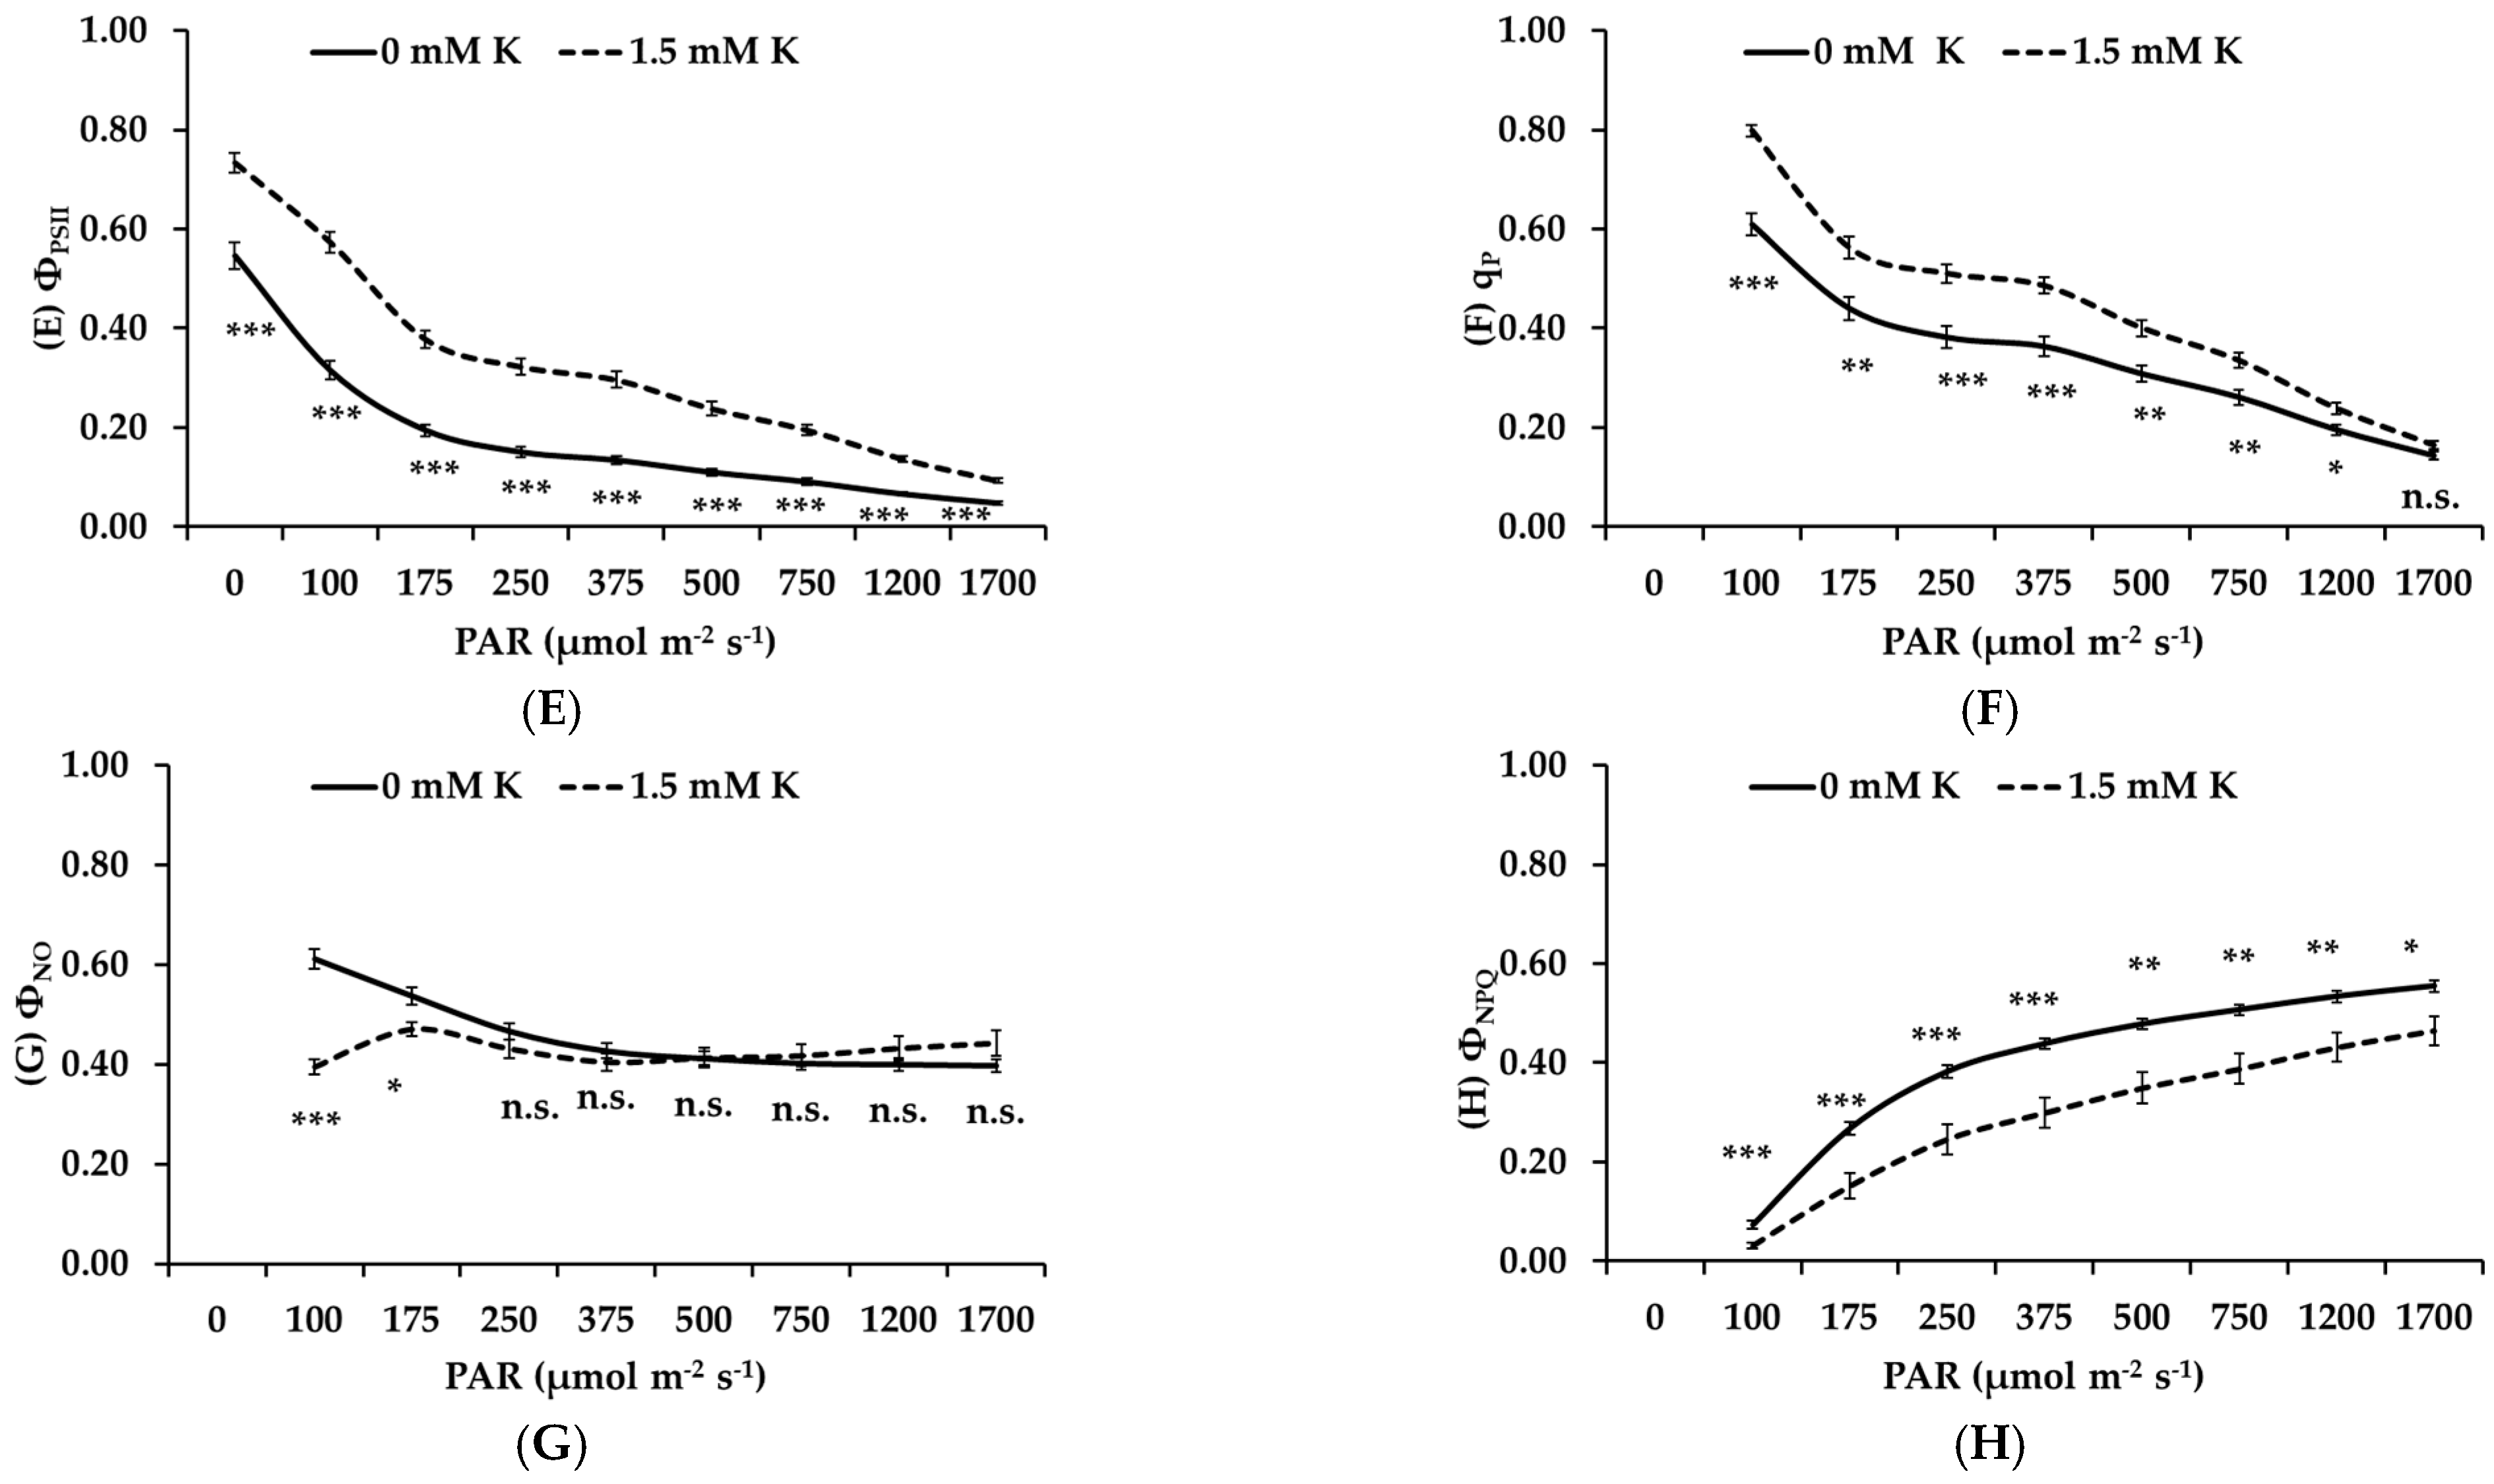
3.5. Potassium Deficiency Inhibits the Photochemical Performance of Apple Trees

To analyze the photochemical performance of apple trees under K deficiency, we measured chlorophyll a fluorescence parameters on the top and basal leaves of apple trees under varying light intensities and different levels of photosynthetic active radiation (PAR) (Figure 2 and Figure 3). K deficiency significantly affected several aspects of photosynthetic performance, particularly under high light intensities. The maximal PSII photochemical efficiency (Fv/Fm) and the minimal level of fluorescence (Figure 2A,B) remained unaffected between the treatments on the top leaves, suggesting that the overall capacity of PSII remained intact on the top leaves of both K-sufficient and -deficient trees. Additionally, the maximum level of fluorescence (Fm) was slightly reduced on the top leaves of K-deficient plants, particularly at higher PAR levels, though the differences were not statistically significant (Figure 2C). The electron transport rate (ETR) was significantly lower on top leaves of K-deficient trees across all PAR levels, especially at higher light intensities, indicating reduced photosynthetic electron flow under K deficiency (Figure 2D). Similarly, the operating PSII efficiency (ΦPSII) (Figure 2E) and photochemical quenching (qp) (Figure 2F) were both significantly reduced on the top leaves of K-deficient plants, demonstrating impaired PSII photochemistry and reduced light-use efficiency. In terms of energy dissipation, K deficiency caused a decreased quantum yield of non-regulated energy loss (ΦNO), reflecting greater non-regulated photochemical energy loss under stress (Figure 2G). Further, the quantum yield of regulated energy dissipation (ΦNPQ) was elevated on the top leaves of K-deficient trees (Figure 2H).

4. Discussion

K is an essential mineral nutrient playing a pivotal role in apple tree development and yield. As the primary cationic inorganic nutrient in plants, K is involved in several key aspects of photosynthesis, both in the light-dependent and biochemical phases. These include the following: (i) facilitating CO2 diffusion through the leaf boundary layer due to alterations of leaf anatomy caused by K deficiency; (ii) maintaining chloroplast ultrastructure that is compromised under low K availability; and (iii) activating and regulating Rubisco, key photosynthetic enzyme of the Calvin cycle [19]. Although photosynthetic CO2 assimilation rates remain stable across a wide range of K concentrations in leaves, adequate K nutrition is essential to sustain photosynthetic activity and prevent declines in CO2 assimilation, as previously shown in both herbaceous [20] and tree species [21]. In our study, Pn rates on the top leaves showed a significant increase when plants were supplied with 1.50 and 3.00 mM K, while even 0.75 mM K had a positive impact on Pn levels in the more K-deficient basal leaves (Table 2). In basal leaves, the positive effect was dose-dependent and is conceivable that this result is attributed to high mobility of K in phloem, where it reaches up to 80% of all cations, suggesting that redistribution of K from older to younger leaves improves its utilization efficiency [22]. Indeed, in terms of mobile nutrients, the symptoms of deficiency appeared rapidly in older (basal) leaves and then progressively expand to younger leaves following an acropetal way, if the deficiency is persistent (Figure 1) [1,23]. In other words, basal apple leaves were more affected due to potassium’s high mobility within the phloem, a fact strongly supported by the visible symptoms of K deficiency apparent exclusively in the basal leaves, as well as the higher K concentration found in the top leaves compared to the basal ones (e.g., 2.226% vs. 1.886% DW K under the 1.50 mM K treatment). In K-deficient plants, K is preferentially redistributed from older (basal) leaves to younger (top), actively growing tissues, leading to localized deficiencies and more pronounced symptoms in basal leaves. This pattern aligns with the general behavior of mobile nutrients, such as K, which are translocated to meet the demands of newer tissues during deficient conditions.
In non-necrotic portion of the basal leaves of 1.50 and 3.00 mM K-treated plants, higher level of Pn were associated with increased values of gs, allowing higher CO2 influx into the substomatal chamber. In contrast, under 0 mM K treatment, the significant reduction in photosynthetic rate (Pn) was due to decreased stomatal conductance (gs) (Table 2), which restricted CO2 influx into the substomatal chamber, limiting carbon availability for photosynthesis. This finding clearly demonstrates that stomatal limitations to photosynthesis occur under K-deficient conditions. Stomatal movement is known to be regulated by turgor pressure, which is controlled by K concentration. Depending on the plant species, K levels in guard cells may vary significantly [1]. For CO2 fixation, K plays a vital role to sustain the function of stomata and maintain chloroplast performance in relation to turgor, pH, and activity of enzymes [24]. In addition to the stomata contribution in improving photosynthesis under adequate K supply (1.50–3.00 mM K), unchanged values of Ci in both top and basal leaves (or even a decline of Ci in top leaves with 3.0 mM K) are strongly supportive for the concomitant biochemical stimulation of the photosynthetic machinery, which allows for the efficient use of CO2 reaching the chloroplast, thereby avoiding accumulation at the intercellular level (Table 2). This is in accordance with previous findings in apple, suggesting that K deficiency leads to a simultaneous decline of gs and the parameters related to photosystem II (PSII) performance, including lower electron transport rate as well as the maximal photochemical efficiency of PSII, namely Fv/Fm [14].
The focus on light-curve-derived chlorophyll fluorescence parameters, in which we consider 1.50 mM K as the optimum concentration to be supplied for apple trees, unveils deeper differences between the basal and top leaves (Figure 2 and Figure 3). In particular, the maximal photochemical efficiency of PSII was not affected by K on top leaves, as Fv/Fm as well as F0 and Fm values was not significantly different between control and K-supplied plants. Conversely, basal leaves exhibited a severe reduction of Fv/Fm, which was dependent on both F0 decline and Fm increase. Despite these differences, in both basal and top leaves, the K fertilization promoted PSII activity under the growing light condition (i.e., actualized PSII efficiency) and improved the level of energy tunnelled to photochemistry as revealed by an increase in ETR, ϕPSII, and qp values. In parallel, the K deficiency increased the need to dissipate excess energy trough non-photochemical processes in both top and basal leaves, as highlighted by elevated values of NPQ when light intensity increased.
In addition to the reduced photosynthetic rate associated with K deficiency, which may result from changes in leaf anatomy that decrease mesophyll conductance and reduce the chloroplast surface area relative to leaf area [19], a decline in photosynthetic pigment content further contributes to the observed decrease in Pn values under K-deficient conditions [25]. Our observations based on the basal leaves (Table 3) revealed significant enhancement in chlorophyll and carotenoid content in response to K application, although this stimulation was generally not related to K dosage concerning most parameters related to Chla, Chlb, and carotenoids. Notably, the highest level of Chla/Chlb was observed at 3.00 mM K-treated trees, which was possibly attributed to both the increased accumulation of Chla and the reduction of Chlb content at the highest K dose. On the top leaves, the highest K dose significantly enhanced the accumulation of photosynthetic pigments, particularly Chla, resulting in a markedly elevated Chla/Chlb ratio (Table 3). Similarly, the carotenoid content was promoted by all the level of K in basal leaves but in a dose-independent manner.
PSI, PSII, light-harvesting antenna complexes, and minor antennae are made up of chlorophylls and carotenoids, although the relative proportions of these components vary across the different systems, which have distinct compositions [26]. Chlb is a pigment exclusively present in antenna complexes, and changes in the Chla/Chlb ratio are important for understanding the mechanism of leaves adaptation when plants grow under stress [27]. Chlb biosynthesis has been reported to control antenna size; a large antenna is linked to low Chla/Chlb ratio, whereas a small antenna is associated with a high Chla/Chlb ratio [27]. This influences not only light harvesting and thermal energy dissipation but also the stability of the pigment−protein complexes in the antennae, making it a key factor in the regulation of leaf development [26]. Therefore, the decrease in Chlb contents observed herein is associated with reduction of light-harvesting complexes function to decrease the burden of light over chloroplast and/or dissipate the excess of excitation energy as revealed by NPQ increases.
Elevated electrolyte leakages observed under K deficiency in both top and basal apple leaves indicate compromised membrane integrity, reflecting the physiological stress caused by K limitation. This disruption likely exacerbates oxidative stress, impairs membrane functionality and reduces cell viability, ultimately diminishing overall plant efficiency. These effects contribute to observed reductions in photosynthetic pigment content, photosynthetic performance, and biomass production. Furthermore, compromised membranes may accelerate water loss and disrupt nutrient balances, further hindering the growth of scion tissues. These findings highlight the critical role of K in maintaining membrane stability and cellular functionality in plant tissues.
K availability plays a critical role in regulating the transport and distribution of photosynthesis products within plants [2,28]. Adequate K levels establish osmotic potential in the phloem, promoting the transfer of photosynthates from source organs, like leaves, to sink organs such as roots [29]. However, K deficiency can impair phloem loading, limiting the efficient transport of photosynthates to roots and potentially impacting root growth and function [24,30]. In our experimental conditions, we did not observe any significant variations regarding the total or translocating sugars, such as sorbitol, among the K treatments (Table 4). This suggests that apple trees are able to adjust sugar production and transport, even under K-limited conditions maintaining carbohydrate stability. Sorbitol, the primary translocating sugar in apples, remained stable among the K treatments, which possibly highlights an essential stability mechanism that ensures carbon supply to vital organs despite nutrient stress. However, K deficiency led to changes in specific carbohydrate fractions, notably an increase in glucose levels at the highest K treatment (3.00 mM K) and a higher sucrose-to-hexose ratio under K deprivation (Table 4). This altered sucrose-to-hexose ratio may suggest a reduced sucrose breakdown or limited hexose production that could possibly be ascribed to impaired osmotic conditions hindering sucrose utilization in deficient plants. In addition, K deficiency significantly altered biomass allocation, as shown by the decreased shoot-to-root ratio due to increased root biomass and, to a lesser extent, reduced scion stem biomass (Table 1). This shift likely reflects an adaptive response of K-deficient trees by reallocating resources toward root growth to optimize K uptake. The increased root biomass at the expense of shoot growth aligns with findings in other crops under nutrient stress, where roots act as the primary sinks for carbon to enhance nutrient acquisition. This adaptive strategy is supported by the observed stability of translocating sugars, such as sorbitol, which likely facilitates carbon delivery to the roots during K limitation. This finding partially aligns with previous work by Coffey et al. [31], which reported decreased shoot-to-root ratios under low K conditions in barley, albeit root biomass also declined due to limited photoassimilates transport to roots. In contrast to the barley experiment, the apple trees themselves or the specific rootstock-scion combination used in the current study may further modulate sugar transport and nutrient distribution, potentially enhancing the plant’s adaptive response to low K conditions. The observed stability of carbohydrate fractions (translocated, non-translocated, total, and the ratios among them) under K deficiency also underscores a close link between carbon and K metabolism. This stability suggests the presence of compensatory mechanisms, such as the mobilization of stored reserves or redistribution of sugars. Such redistribution may prioritize root growth to enhance nutrient acquisition K deficiency stress conditions. The significant increase in root DW under K deficiency (0.00 mM K) further supports the hypothesis that sugar utilization in roots plays a key role in maintaining growth under K-limited conditions. In line with this notion, Yang et al. [32] reported that overexpression of genes associated with sugar metabolism could facilitate K cycling and improve adaptability to low-K environments in pears. The stability of translocating sugars, coupled with increased glucose content under optimal K and the elevated sucrose-to-hexose ratio under K deficiency, suggests that apple trees may balance sugar partitioning and adjust metabolic pathways as part of an adaptive strategy. Notably, the stability of sorbitol levels highlights its importance as the primary translocated sugar in apple, ensuring continued carbon transport to sink organs under adverse conditions. This indicates that sorbitol transport may be prioritized over other sugars, such as glucose and fructose, to maintain vital metabolic processes during K deficiency. Recent findings by Zhao et al. [33] revealed a similar phenomenon in apple trees grown under N deficiency, where root sugar metabolism and sink strength increased to support rapid root growth. This suggests that nutrient deficiencies in apple trees, namely K or N, may enhance sugar utilization in roots, potentially as part of a compensatory response to maintain essential growth functions and improve nutrient uptake.
In terms of water retention, the data presented in Table 1 show that K deficiency significantly affected the water content of scion stems and total scion biomass. However, the reduction in the FW of scion stems cannot be solely attributed to changes in water retention, as water content significantly increased with higher K levels in the nutrient solution. Instead, this reduction is primarily due to growth limitations caused by K deficiency, as discussed above, and is further evidenced by the decrease in DW of scion stems. For the roots, despite the significant decrease in fresh biomass with increasing K levels, the water content remained statistically constant across treatments. This suggests that the reduction in root FW was primarily due to changes in tissue growth and biomass allocation, rather than alterations in water retention, as indicated by the significantly higher root DW observed in plants suffering from K deficiency (0 mM K). These findings emphasize the critical role of K in osmotic balance and water retention, particularly in scion tissues. K deficiency likely disrupts stomatal conductance and turgor pressure, impairing water uptake and transport, which contributes to dehydration in specific tissues (e.g., scion tissues). Additionally, this deficiency may trigger an adaptive mechanism that reallocates biomass to other tissues, such as roots, to cope with the reduced K availability.

5. Conclusions

This study investigated the impact of K deficiency on ’Granny Smith’ apple cultivar grafted onto M9 rootstock, revealing a range of physiological and metabolic changes and adaptations that highlight the essential role of K in supporting plant growth and yield. Our findings highlight several key responses to K deficiency, summarized below:
  • Symptoms of K deficiency: Prolonged K deficiency led to visible symptoms, including chlorosis and necrosis, which initially appeared in the basal leaves and then spread upwards. This pattern is indicative of the mobility of K, as K is efficiently transported from older to newer tissues via the phloem.
  • Effects on photosynthesis: The photosynthetic capacity of K-deficient trees was significantly impaired due to both stomatal and non-stomatal factors:
    Stomatal limitations: Reduced stomatal conductance limited CO2 uptake, directly hindering photosynthesis.
    Non-stomatal limitations: Decreased concentrations of chlorophyll and carotenoids, key pigments for light absorption, led to compromised light energy capture. Additionally, chlorophyll fluorescence analysis revealed decreased electron transport rates, PSII efficiency, and photochemical quenching, particularly under high light conditions. These findings suggest that both light-dependent reactions and carbon fixation were negatively affected by K deficiency.
  • Sugar metabolism: Despite the significant impairment in photosynthetic processes, K deficiency did not cause major alterations in overall leaf sugar metabolism, suggesting that apple trees can adjust sugar production and transport even under K-limited conditions to maintain carbohydrate stability. However, there was a notable increase in the sucrose-to-hexose ratio, indicating a shift in the partitioning and utilization of sugars.
  • Biomass allocation: A redistribution of plant biomass was observed under K deficiency. Specifically, K-deficient plants exhibited a decreased shoot-to-root ratio mainly due to the increased root biomass. This redistribution of biomass towards roots likely represents an adaptive strategy to enhance K uptake from the soil, helping the plant to cope with limited K availability.
  • Future directions: Further research is needed to explore how rootstock−scion interactions might influence K utilization in apple trees. These interactions could play a significant role in optimizing K uptake and improving tree vigor and productivity under conditions of nutrient deficiency.
Overall, this study provides new insights into the physiological and biochemical effects of K deficiency on apple trees. Our findings demonstrate that K deficiency impairs photosynthesis through both stomatal and non-stomatal limitations, alters biomass allocation by promoting root growth and influences sugar partitioning by increasing the sucrose-to-hexose ratio. These results underscore the critical role of K in maintaining physiological function and plant productivity. However, limitations such as the absence of specific nutrient uptake data should be addressed in future studies. Additionally, exploring rootstock−scion interactions could provide further insights into how grafted apple systems adapt to K deficiency. These findings contribute to the development of more sustainable nutrient management practices for apple cultivation.

Author Contributions

Conceptualization, I.E.P., T.C. and T.S.; methodology, I.E.P., E.-V.L., G.D., T.C. and T.S.; software, I.E.P., G.D. and E.-V.L.; validation, I.E.P., G.D., S.R., M.L., E.-V.L., T.S. and T.C.; formal analysis, I.E.P., E.-V.L., S.R., M.L. and G.D.; investigation, I.E.P., E.-V.L., T.C., G.D., S.R. and T.S.; resources, I.E.P.; data curation, I.E.P. and E.-V.L.; writing—original draft preparation, I.E.P., G.D., M.L. and E.-V.L.; writing—review and editing, I.E.P., S.R., T.S. and T.C.; visualization, I.E.P., G.D., M.L. and E.-V.L.; supervision, I.E.P.; project administration, I.E.P.; funding acquisition, I.E.P. All authors have read and agreed to the published version of the manuscript.

Funding

This research received no external funding.

Data Availability Statement

Data are contained within the article. Further inquiries can be directed to the corresponding author (I.E.P).

Conflicts of Interest

The authors declare no conflicts of interest.

References

  1. Marschner, H. Marschner’s Mineral Nutrition of Higher Plants, 3rd ed.; Academic Press: London, UK, 2012; pp. 178–189. [Google Scholar]
  2. Pettigrew, W.T. Potassium influences on yield and quality production for maize, wheat, soybean and cotton. Physiol. Plant. 2008, 133, 670–681. [Google Scholar] [CrossRef]
  3. Wang, Y.; Wu, W.H. Potassium transport and signaling in higher plants. Annu. Rev. Plant Biol. 2013, 64, 451–476. [Google Scholar] [CrossRef] [PubMed]
  4. Pandey, G.K.; Mahiwal, S. Potassium in plant growth and development. In Role of Potassium in Plants; Springer: Cham, Switzerland, 2020; pp. 37–43. [Google Scholar]
  5. Templalexis, D.; Tsitsekian, D.; Liu, C.; Daras, G.; Šimura, J.; Moschou, P.; Ljung, K.; Hatzopoulos, P.; Rigas, S. Potassium transporter TRH1/KUP4 contributes to distinct auxin-mediated root system architecture responses. Plant Physiol. 2022, 188, 1043–1060. [Google Scholar] [CrossRef] [PubMed]
  6. Leigh, R.A.; Wyn Jones, R.G. A hypothesis relating critical potassium concentrations for growth to the distribution and functions of this ion in the plant cell. New Phytol. 1984, 97, 1–13. [Google Scholar] [CrossRef]
  7. Mengel, K.; Kirkby, E.A. Potassium. In Principles of Plant Nutrition; Mengel, K., Kirkby, E.A., Eds.; International Potash Institute: Worblaufeu-Bern, Switzerland, 1982; pp. 335–368. [Google Scholar]
  8. Xiao-Li, T.; Gang-Wei, W.; Rui, Z.; Pei-Zhu, Y.; Liu-Sheng, D.; Zhao-Hu, L. Conditions and indicators for screening cotton (Gossypium hirsutum L.) varieties tolerant to low potassium. Acta Agric. Sin. 2008, 34, 1435–1443. [Google Scholar]
  9. White, P.J.; Karley, A.J. Potassium. In Cell Biology of Metals and Nutrients; Hell, R., Mendel, R.-R., Eds.; Springer: Heidelberg, Germany, 2010; pp. 199–224. [Google Scholar]
  10. Kanai, S.; Ohkura, K.; Adu-Gyamfi, J.J.; Mohapatra, P.K.; Nguyen, N.T.; Saneoka, H.; Fujita, K. Depression of sink activity precedes the inhibition of biomass production in tomato plants subjected to potassium deficiency stress. J. Exp. Bot. 2007, 58, 2917–2928. [Google Scholar] [CrossRef]
  11. Juniper, B.E.; Mabberley, D.J. The Story of the Apple; Timber Press, Inc.: Portland, OR, USA, 2006; 240p. [Google Scholar]
  12. Bai, Q.; Shen, Y.; Huang, Y. Advances in mineral nutrition transport and signal transduction in Rosaceae fruit quality and postharvest storage. Front. Plant Sci. 2021, 12, 620018. [Google Scholar] [CrossRef] [PubMed]
  13. Zhang, W.; Zhang, X.; Wang, Y.; Zhang, N.; Guo, Y.; Ren, X.; Zhao, Z. K fertilization arrests malate accumulation and alters soluble sugar metabolism in apple fruit. Biol. Open 2018, 7, bio024745. [Google Scholar] [CrossRef] [PubMed]
  14. Xu, X.; Du, X.; Wang, F.; Sha, J.; Chen, Q.; Tian, G.; Zhu, Z.; Ge, S.; Jiang, Y. Effects of potassium levels on plant growth, accumulation and distribution of carbon, and nitrate metabolism in apple dwarf rootstock seedlings. Front. Plant Sci. 2020, 11, 904. [Google Scholar] [CrossRef] [PubMed]
  15. Nachtigall, G.R.; Dechen, A.R. Seasonality of nutrients in leaves and fruits of apple trees. Sci. Agric. 2006, 63, 493–501. [Google Scholar] [CrossRef]
  16. Brunetto, G.; de Melo, G.W.B.; Toselli, M.; Quartieri, M.; Tagliavini, M. The role of mineral nutrition on yields and fruit quality in grapevine, pear and apple. Rev. Bras. Frutic. 2015, 37, 1089–1104. [Google Scholar] [CrossRef]
  17. Hoagland, D.R.; Arnon, D.I. The water-culture method for growing plants without soil. Circ. Calif. Agric. Exp. Stn. 1950, 347, 23–32. [Google Scholar]
  18. Lichtenthaler, H.K.; Buschmann, C. Chlorophylls and carotenoids: Measurement and characterization by UV-VIS spectroscopy. Curr. Protoc. Food Anal. Chem. 2001, 1, F4.3.1–F4.3.8. [Google Scholar] [CrossRef]
  19. Tränkner, M.; Tavakol, E.; Jákli, B. Functioning of potassium and magnesium in photosynthesis, photosynthate translocation and photoprotection. Physiol. Plant. 2018, 163, 414–431. [Google Scholar] [CrossRef] [PubMed]
  20. Jákli, B.; Tavakol, E.; Tränkner, M.; Senbayram, M.; Dittert, K. Quantitative limitations to photosynthesis in K deficient sunflower and their implications on water-use efficiency. J. Plant Physiol. 2017, 209, 20–30. [Google Scholar] [CrossRef]
  21. Papadakis, I.E.; Ladikou, E.-V.; Oikonomou, A.; Chatzistathis, T.; Chatziperou, G. Exploring the impact of potassium on growth, photosynthetic performance, and nutritional status of lemon trees (cv. Adamopoulou) grafted onto sour orange and volkamer lemon rootstocks. Sustainability 2023, 15, 15858. [Google Scholar] [CrossRef]
  22. Sustr, M.; Soukup, A.; Tylova, E. Potassium in root growth and development. Plants 2019, 8, 435. [Google Scholar] [CrossRef]
  23. Tewari, R.K.; Kumar, P.; Sharma, P.N. Oxidative stress and antioxidant responses in young leaves of mulberry plants grown under nitrogen, phosphorus or potassium deficiency. J. Integr. Plant Biol. 2007, 49, 313–322. [Google Scholar] [CrossRef]
  24. Chen, D.; Cao, B.; Wang, S.; Liu, P.; Deng, X.; Yin, L.; Zhang, S. Silicon moderated the K deficiency by improving the plant-water status in sorghum. Sci. Rep. 2016, 6, 22882. [Google Scholar] [CrossRef] [PubMed]
  25. Martineau, E.; Domec, J.C.; Bosc, A.; Dannoura, M.; Gibon, Y.; Benard, C.; Jordan-Meille, L. The role of potassium on maize leaf carbon exportation under drought condition. Acta Physiol. Plant. 2017, 39, 219. [Google Scholar] [CrossRef]
  26. Voitsekhovskaja, O.V.; Tyutereva, E.V. Chlorophyll b in angiosperms: Functions in photosynthesis, signaling and ontogenetic regulation. J. Plant Physiol. 2015, 189, 51–64. [Google Scholar] [CrossRef] [PubMed]
  27. Tanaka, R.; Koshino, Y.; Sawa, S.; Ishiguro, S.; Okada, K.; Tanaka, A. Overexpression of chlorophyllide a oxygenase (CAO) enlarges the antenna size of photosystem II in Arabidopsis thaliana. Plant J. 2001, 26, 365–373. [Google Scholar] [CrossRef] [PubMed]
  28. Sardans, J.; Peñuelas, J. Potassium control of plant functions: Ecological and agricultural implications. Plants 2021, 10, 419. [Google Scholar] [CrossRef] [PubMed]
  29. Cakmak, I. The role of potassium in alleviating detrimental effects of abiotic stresses in plants. J. Plant Nutr. Soil Sci. 2005, 168, 521–530. [Google Scholar] [CrossRef]
  30. Gerardeaux, E.; Jordan-Meille, L.; Constantin, J.; Pellerin, S.; Dingkuhn, M. Changes in plant morphology and dry matter partitioning caused by potassium deficiency in Gossypium hirsutum (L.). Environ. Exp. Bot. 2010, 67, 451–459. [Google Scholar] [CrossRef]
  31. Coffey, O.; Bonfield, R.; Corre, F.; Sirigiri, J.A.; Meng, D.; Fricke, W. Root and cell hydraulic conductivity, apoplastic barriers and aquaporin gene expression in barley (Hordeum vulgare L.) grown with low supply of potassium. Ann. Bot. 2018, 122, 1131–1141. [Google Scholar] [CrossRef]
  32. Yang, H.; Peng, L.; Chen, L.; Zhang, L.; Kan, L.; Shi, Y.; Mei, X.; Malladi, A.; Xu, Y.; Dong, C. Efficient potassium (K) recycling and root carbon (C) metabolism improve K use efficiency in pear rootstock genotypes. Plant Physiol. Biochem. 2023, 196, 43–54. [Google Scholar] [CrossRef] [PubMed]
  33. Zhao, H.; Sun, S.; Zhang, L.; Yang, J.; Wang, Z.; Ma, F.; Li, M. Carbohydrate metabolism and transport in apple roots under nitrogen deficiency. Plant Physiol. Biochem. 2020, 155, 455–463. [Google Scholar] [CrossRef]
Figure 1. Visual symptoms of K deficiency were prominently observed in the basal-bottom leaves of apple plants subjected to the 0 mM K treatment (left). On the right side, the upper leaf, sampled from a plant treated with 3 mM K, contrasts with the other three leaves sampled from plants treated with 0 mM K, exhibiting varying degrees of K deficiency.
Horticulturae 11 00042 g001
Figure 2. Chlorophyll a fluorescence parameters were measured in top leaves of ‘Granny Smith’ apple plants treated with 0.00 and 1.50 mM K. These parameters were obtained from the rapid light curves measurements conducted at varying PAR levels, ranging from 0 to 1700 μmol photons m−2 s−1. The following parameters are shown: (A) maximal photosystem II (PSII) photochemical efficiency (Fv/Fm); (B) minimal level of fluorescence (F0); (C) maximum level of fluorescence (Fm); (D) electron transport rate electron transport rate (ETR); (E) operating PSII efficiency (ΦPSII); (F) photochemical quenching of PSII (qp); (G) quantum yield of non-regulated photochemical energy loss (ΦNO); and (H) quantum yield of regulated photochemical energy loss (ΦNPQ). Mean ± S.E.; n = 5. n.s. indicates no significant differences, while *, **, and *** denote significant differences at p ≤ 0.05, p ≤ 0.01, and p ≤ 0.001, respectively, between two K treatments for each PAR level.
Horticulturae 11 00042 g002aHorticulturae 11 00042 g002b
Figure 3. Chlorophyll a fluorescence parameters were measured in basal leaves of ‘Granny Smith’ apple plants treated with 0.00 and 1.50 mM. These parameters were obtained from the rapid light curves measurements conducted at varying PAR levels, ranging from 0 to 1700 μmol photons m−2 s−1. The following parameters are shown: (A) maximal photosystem II (PSII) photochemical efficiency (Fv/Fm); (B) minimal level of fluorescence (F0); (C) maximum level of fluorescence (Fm); (D) electron transport rate electron transport rate (ETR); (E) operating PSII efficiency (ΦPSII); (F) photochemical quenching of PSII (qp); (G) quantum yield of non-regulated photochemical energy loss (ΦNO); (H) quantum yield of regulated photochemical energy loss (ΦNPQ). Mean ± S.E.; n = 5. n.s. indicates no significant differences, while *, **, and *** denote significant differences at p ≤ 0.05, p ≤ 0.01, and p ≤ 0.001, respectively, between two K treatments for each PAR level.
Horticulturae 11 00042 g003aHorticulturae 11 00042 g003b
Table 1. Impact of varying K concentrations (0.00, 0.75, 1.50, and 3.00 mM) in the nutrient solution on the FWs and DWs of various parts of ‘Granny Smith’ apple plants and the total lengths of their scion’s stems. The water content of each plant part across all K treatments is also provided.
ParameterPlant Part0.00 mM K0.75 mM K1.50 mM K3.00 mM K
Fresh weight
(FW) (g)
Leaves91.14 ± 2.32 a93.18 ± 10.79 a86.82 ± 5.12 a96.01 ± 7.35 a
Scion’s stems130.48 ± 5.03 b161.48 ± 5.03 a159.97 ± 6.91 a161.32 ± 2.36 a
Rootstock’s stem113.29 ± 8.22 a136.1 ± 8.72 a144.29 ± 15.4 a128.41 ± 12.64 a
Root200.17 ± 45.36 a138.83 ± 10.77 a121.44 ± 13.09 a121.3 ± 13.11 a
Entire plant535.07 ± 42.68 a529.6 ± 24.06 a512.52 ± 22.4 a507.03 ± 23.31 a
Scion221.62 ± 5.81 a254.66 ± 14.48 a246.79 ± 10.01 a257.33 ± 8.81 a
Rootstock313.45 ± 44.36 a274.93 ± 12.56 a265.73 ± 19.15 a249.7 ± 20.28 a
Shoot/Root ratio1.95 ± 0.34 b2.85 ± 0.15 ab 3.36 ± 0.36 a3.34 ± 0.42 a
Dry weight
(DW) (g)
Leaves45.7 ± 0.52 a45.87 ± 3.96 a42.03 ± 1.9 a44.72 ± 2.21 a
Scion’s stems69.87 ± 2.45 b84.4 ± 3.12 a83.51 ± 3.56 a82 ± 1.29 a
Rootstock’s stem57.98 ± 4.02 a70.83 ± 5.71 a76.57 ± 7.81 a68.14 ± 7.03 a
Root28.87 ± 1.12 a23.04 ± 1.37 b24.83 ± 1.55 b24.64 ± 1.03 b
Entire plant202.42 ± 5.43 a224.14 ± 9.16 a226.95 ± 10.09 a219.5 ± 8.54 a
Scion115.57 ± 2.68 a130.28 ± 6.31 a125.54 ± 4.42 a126.72 ± 3.22 a
Rootstock86.85 ± 3.04 a93.87 ± 5.95 a101.4 ± 6.88 a92.78 ± 6.94 a
Shoot/root ratio6.08 ± 0.45 b8.79 ± 0.32 a8.35 ± 0.92 a7.96 ± 0.5 a
Water
content
(% FW)
Leaves49.76 ± 1.10 a50.02 ± 1.69 a51.43 ± 0.70 a52.92 ± 1.71 a
Scion’s stems46.42 ± 0.34 c47.76 ± 0.58 b47.78 ± 0.46 b49.17 ± 0.30 a
Rootstock’s stem48.72 ± 1.14 a48.12 ± 1.32 a46.82 ± 0.37 a47.04 ± 0.40 a
Root83.47 ± 2.48 a83.3 ± 0.61 a79.1 ± 1.41 a78.47 ± 2.93 a
Entire plant61.28 ± 2.89 a57.6 ± 1.00 a55.67 ± 1.01 a56.6 ± 1.16 a
Scion47.82 ± 0.55 b48.73 ± 0.70 b49.08 ± 0.57 ab50.69 ± 0.62 a
Rootstock70.47 ± 3.38 a65.81 ± 1.63 a61.65 ± 1.48 a62.55 ± 2.33 a
Total length of the scion’s stems (cm)260 ± 18.68 a223.8 ± 27.61 a248.6 ± 19.61 a235.2 ± 8.1 a
Mean ± S.E.; n = 5. Different letters within the same row denote significant differences between the K treatments, as determined by Duncan’s multiple range test (p ≤ 0.05).
Table 2. The effects of varying Κ concentrations (0.00, 0.75, 1.50, and 3.00 mM) in the nutrient solution on the following parameters in top and basal leaves of ‘Granny Smith’ apple plants: net photosynthetic rate (Pn; µmol CO2 m−2 s−1), stomatal conductance (gs; mmol H2O m−2 s−1), intercellular CO2 concentration (Ci; µmol CO2 mol air−1), transpiration rate (E; mmol H2O m−2 s−1), intrinsic water use efficiency (Pn/gs; µmol CO2/mmol H2O), CO2 use efficiency (Pn/Ci; [µmol CO2 m−2 s−1/(µmol CO2 mol air−1)]), and instantaneous water use efficiency (Pn/E; µmol CO2/mmol H2O). Measurements were conducted under stable conditions of CO2 (400 mg L−1) and PAR (1200 μmol m−2 s−1).
Plant PartParameter0.00 mM K0.75 mM K1.50 mM K3.00 mM K
Top leavesPn6.17 ± 0.19 b6.64 ± 0.32 b9.08 ± 0.53 a8.82 ± 0.45 a
gs0.09 ± 0.01 b0.08 ± 0.01 b0.12 ± 0.01 a0.09 ± 0.01 b
Ci261.46 ± 6.12 a246.56 ± 12.34 a250.9 ± 10.44 a205.82 ± 15.5 b
E1.77 ± 0.18 a1.57 ± 0.07 a2.16 ± 0.09 a1.83 ± 0.25 a
Pn/gs72.15 ± 4.23 b81.76 ± 7.36 b76.38 ± 5.83 b105.03 ± 10.29 a
Pn/Ci0.02 ± 0 b0.03 ± 0 b0.04 ± 0 a0.04 ± 0 a
Pn/E3.64 ± 0.37 b4.25 ± 0.16 ab4.2 ± 0.12 ab4.99 ± 0.43 a
Basal leavesPn5.32 ± 0.4 c7.73 ± 0.31 b8.22 ± 0.27 ab9.25 ± 0.46 a
gs0.07 ± 0 b 0.09 ± 0.01 ab0.11 ± 0.01 a0.12 ± 0.01 a
Ci248.41 ± 10.18 a234.55 ± 13.7 a242.52 ± 15.04 a238.59 ± 10.39 a
E1.46 ± 0.09 a2.02 ± 0.23 a2.05 ± 0.26 a2.3 ± 0.29 a
Pn/gs81.1 ± 6.12 a87.05 ± 8.78 a82.35 ± 9.78 a83.32 ± 6.83 a
Pn/Ci0.02 ± 0 b0.03 ± 0 a0.03 ± 0 a0.04 ± 0 a
Pn/E3.67 ± 0.28 a4.09 ± 0.49 a4.43 ± 0.58 a4.3 ± 0.39 a
Mean ± S.E.; n = 5. Different letters within the same row denote significant differences between the K treatments, as determined by Duncan’s multiple range test (p ≤ 0.05).
Table 3. Effects of different K concentrations (0.00, 0.75, 1.50, and 3.00 mM) in the nutrient solution on the levels of photosynthetic pigments and electrolyte leakage in the top and basal leaves of ‘Granny Smith’ apple plants.
Plant PartParameter0.00 mM K0.75 mM K1.50 mM K3.00 mM K
Top leaves[Chla] (μg mg−1 FW)2.23 ± 0.05 a2.38 ± 0.1 a2.42 ± 0.18 a2.56 ± 0.15 a
[Chlb] (μg mg−1 FW)0.76 ± 0.02 a0.8 ± 0.03 a0.83 ± 0.05 a0.8 ± 0.05 a
[Chla] + [Chlb] (μg mg−1 FW)2.99 ± 0.07 a3.18 ± 0.13 a3.25 ± 0.23 a3.36 ± 0.19 a
[Carotenoids] (μg mg−1 FW)0.53 ± 0.02 a0.59 ± 0.01 a0.58 ± 0.04 a0.62 ± 0.04 a
[Chla] (μg cm−2)42.49 ± 1.96 b48.91 ± 1.45 ab49.5 ± 3.09 ab53.63 ± 2.52 a
[Chlb] (μg cm−2)14.46 ± 0.64 a16.41 ± 0.55 a17.1 ± 0.89 a16.89 ± 0.84 a
[Chla] + [Chlb] (μg cm−2)56.95 ± 2.56 b65.32 ± 1.97 ab66.59 ± 3.95 a70.52 ± 3.36 a
[Carotenoids] (μg cm−2)10 ± 0.3 b12.2 ± 0.23 a11.82 ± 0.56 a13.07 ± 0.57 a
[Chla]/[Chl b]2.94 ± 0.06 b2.98 ± 0.04 b2.89 ± 0.05 b3.18 ± 0.01 a
SPAD values56.46 ± 1.17 a55.71 ± 1.66 a 57.13 ± 0.46 a53.92 ± 1.6 a
Electrolyte leakage (%)28.47 ± 1.88 a19.66 ± 1.57 bc24.43 ± 3.13 ab13.94 ± 1.22 c
Basal leaves[Chla] (μg mg−1 FW)1.23 ± 0.05 b 2.03 ± 0.12 a 2.22 ± 0.08 a2 ± 0.05 a
[Chlb] (μg mg−1 FW)0.46 ± 0.01 c 0.75 ± 0.04 ab0.81 ± 0.03 a0.7 ± 0.02 b
[Chla] + [Chlb] (μg mg−1 FW)1.69 ± 0.06 b2.78 ± 0.16 a3.03 ± 0.11 a2.7 ± 0.07 a
[Carotenoids] (μg mg−1 FW)0.34 ± 0.01 b0.49 ± 0.02 a 0.5 ± 0.01 a 0.46 ± 0.01 a
[Chla] (μg cm−2)23.78 ± 1.04 b43.28 ± 3 a42.34 ± 0.98 a41.61 ± 0.66 a
[Chlb] (μg cm−2)8.86 ± 0.38 b16.04 ± 1.1 a15.48 ± 0.28 a14.51 ± 0.2 a
[Chla] + [Chlb] (μg cm−2)32.64 ± 1.4 b59.32 ± 4.09 a57.81 ± 1.23 a56.12 ± 0.85 a
[Carotenoids] (μg cm−2)6.49 ± 0.34 b10.47 ± 0.68 a9.57 ± 0.25 a9.46 ± 0.08 a
[Chla]/[Chlb]2.69 ± 0.04 b2.7 ± 0.02 b2.74 ± 0.03 b2.87 ± 0.01 a
SPAD values38.27 ± 0.99 c 49.79 ± 1.7 a48.1 ± 1.63 ab 44.34 ± 1.22 b
Electrolyte leakage (%)34.73 ± 2.08 a25.67 ± 1.65 b26.38 ± 1 b20.96 ± 1.25 c
Mean ± S.E.; n = 5. Different letters within the same row denote significant differences between the K treatments, as determined by Duncan’s multiple range test (p ≤ 0.05).
Table 4. Effects of varying K concentrations (0.00, 0.75, 1.50, and 3.00 mM) in the nutrient solution on carbohydrate content (% DW) in the top leaves of ‘Granny Smith’ apple plants, including sucrose (Suc), glucose (Glu), fructose (Fru), sorbitol (Sorb), total sugars (Suc + Glu + Fru + Sorb), translocating sugars (Trans; Suc + Sorb), non-translocating sugars (Non-trans; Fru + Glu), and Trans/Total, Non-trans/Total, Trans/Non-trans, and Sucr/(Fru + Glu) ratios.
Parameter0.00 mM K0.75 mM K1.50 mM K3.00 mM K
Sucrose (Suc)3.32 ± 0.7 a2.41 ± 0.28 a3.09 ± 0.07 a2.79 ± 0.15 a
Glucose (Glu)0.7 ± 0.04 b0.38 ± 0.07 c0.65 ± 0.05 b1.07 ± 0.09 a
Fructose (Fru)0.59 ± 0.25 a1.84 ± 0.44 a1.61 ± 0.15 a1.29 ± 0.29 a
Sorbitol (Sorb)11.58 ± 0.43 a10.3 ± 0.7 a11.64 ± 0.17 a12.36 ± 0.61 a
Total sugars16.19 ± 1 a14.94 ± 1.38 a16.99 ± 0.29 a17.51 ± 0.52 a
Translocating sugars14.9 ± 0.8 a12.71 ± 0.94 a14.73 ± 0.2 a15.15 ± 0.69 a
Non-translocating sugars1.29 ± 0.21 a2.23 ± 0.5 a2.26 ± 0.15 a2.36 ± 0.24 a
Trans/Total 0.92 ± 0.01 a0.86 ± 0.03 a0.87 ± 0.01 a0.86 ± 0.02 a
Non-trans/Total0.08 ± 0.01 a0.14 ± 0.03 a0.13 ± 0.01 a0.14 ± 0.02 a
Trans/Non-trans12.16 ± 1.25 a7.23 ± 2.3 a6.57 ± 0.39 a6.65 ± 0.77 a
Sucr/Fru + Glu2.54 ± 0.15 a1.28 ± 0.3 b1.38 ± 0.1 b1.23 ± 0.15 b
Mean ± S.E.; n = 5. Different letters within the same row denote significant differences between the K treatments, as determined by Duncan’s multiple range test (p ≤ 0.05).
Disclaimer/Publisher’s Note: The statements, opinions and data contained in all publications are solely those of the individual author(s) and contributor(s) and not of MDPI and/or the editor(s). MDPI and/or the editor(s) disclaim responsibility for any injury to people or property resulting from any ideas, methods, instructions or products referred to in the content.

