Article

Lycopene and Other Bioactive Compounds’ Extraction from Tomato Processing Industry Waste: A Comparison of Ultrasonication Versus a Conventional Stirring Method

by
Konstantinos Mavridis
,
Nikolaos Todas
,
Dimitrios Kalompatsios
,
Vassilis Athanasiadis
and
Stavros I. Lalas
*
Department of Food Science and Nutrition, University of Thessaly, Terma N. Temponera Street, 43100 Karditsa, Greece
*
Author to whom correspondence should be addressed.
Horticulturae 2025, 11(1), 71; https://doi.org/10.3390/horticulturae11010071
Submission received: 24 December 2024 / Revised: 8 January 2025 / Accepted: 9 January 2025 / Published: 10 January 2025

Abstract

:
The tomato (Lycopersicon esculentum) is a prominent fruit in Mediterranean countries with established biological activities for consumers. Given the widespread distribution of the fruit and its large production, the need to utilize the by-products seems imperative. With a view to valorizing the main carotenoid of tomato processing industry waste, lycopene, as well as other bioactive compounds (i.e., polyphenols), the optimization of a green extraction method involving ultrasound-assisted bath extraction (UBAE) was carried out. The results showed that the optimized UBAE technique achieved substantial yields of total carotenoids (420.8 μg of lycopene equivalents per gram of dry weight (dw)) and total polyphenols (2.62 mg of gallic acid equivalents per gram of dw). Flavonoid naringin (0.48 mg/g dw) and non-flavonoid coniferyl alcohol (0.32 mg/g dw) were the most abundant identified polyphenols. However, comparison with a conventional stirring extraction revealed that the latter technique marked double figures in all assays, including antioxidant activity assays. The study revealed that UBAE was not a preferable technique for recovering carotenoids because of the possible degradation of labile compounds found in tomato processing industry waste. Given that the extraction solvent was pure ethanol, the study established a foundation for the development of a unique lycopene-enriched product in the food industry. It is essential to conduct additional studies using alternative food-grade solvents or other environmentally friendly extraction methods.

1. Introduction

A highly cultivated vegetable crop worldwide and a staple of the Mediterranean diet are tomatoes, which are scientifically known as Lycopersicon esculentum [1]. The various health advantages of eating tomatoes include reduced blood cholesterol, the avoidance of inflammatory reactions, and the prevention of cancer. Annually, ~130 million tons of tomatoes are handled, including 8 million tons of waste. A significant number of tomatoes do not meet color, maturity, and form standards, resulting in financial losses for producers and detrimental environmental impacts [1]. Processing generates a substantial amount of tomato peel waste. Developing novel applications for tomato waste is essential, and its recycling represents a significant environmental concern. Tomato pomace, the solid residue resulting from the industrial processing of tomatoes, often leads to the disposal of numerous tomato seeds and peels in landfills or their use as animal feed and fertilizer [2]. Lycopene, including 80–90% of the pigments in ripe tomatoes, is the primary antioxidant; however, carotenoids, phenolic compounds, vitamins, and various other phytochemicals are also prevalent [3]. Multiple epidemiological studies have linked the consumption of carotenoids, especially lycopene, to the prevention of cancer and cardiovascular disease [4]. Phenolics mitigate oxidative stress-related diseases through their antibacterial and antioxidant properties [5].
Biowaste products are a great resource left over from manufacturing processes. Ignoring or not recycling them could harm the environment as well as resulting in financial losses for the company. The vegetable sector and the expenses and waste associated with agriculture have been brought to scientific attention. These wastes are composted and applied to crops so that nutrients can be recycled [6]. Establishing more sustainable food systems and tackling the rising issue of overconsumption of natural resources depends on first reducing waste. It is advised to strengthen the by-product market to help to reduce the consumption of raw resources and related waste [7]. One significant challenge is shifting the consumer’s perception of waste from a problem to a resource by identifying new applications in fields such as bioenergy, cosmetics, pharmaceuticals, and the recovery of components that can enhance and extend the shelf life of food [1].
Organic solvent extraction has indeed been a cornerstone in the food sector for extracting valuable compounds like carotenoids from tomatoes. Researchers have explored a variety of solvents, both polar and nonpolar, such as hexane, ethanol, acetone, dichloromethane, petroleum ether, benzene, and chloroform [8]. However, many nonpolar solvents, despite their high extraction efficiency, pose significant health and environmental risks. To address these concerns, innovative methods have been developed. For instance, Giovanoudis et al. [9] introduced a cloud point extraction (CPE) technique using lecithin to recover carotenoids from liquid tomato wastewater. This method offers a safer alternative to traditional solvents. Similarly, Vlachoudi et al. [10] enhanced the extraction of carotenoids from tomato industry waste using a menthol/hexanoic acid (2:1) deep eutectic solvent, which is more environmentally friendly. Ethanol, being a food-grade solvent, is also a viable option for extracting carotenoids, balancing efficiency and safety [11]. These advancements highlight the ongoing efforts to find safer and more sustainable extraction methods in the food industry.
The use of heat and extended duration in classical procedures like Soxhlet and maceration extraction could lead to decreased selectivity and even the destruction of valuable compounds that are susceptible to heat. Improved yields, less environmental impact, and greater recovery of target compounds have resulted from advancements in extraction processes [12]. One environmentally friendly extraction method is ultrasonication, which creates cavitation bubbles in the solvent. Collapsing close to cell walls, these bubbles damage plant tissues and improve solvent penetration. With less heat used, this mechanical effect promotes mass transfer, leading to quicker extraction and greater yields. Both hydrophilic and hydrophobic bioactive substances can be safely extracted using ultrasonic extraction [13]. Ultrasound extraction is an undoubtedly promising technique; however, certain drawbacks need to be addressed first. The effects of ultrasound waves are dependent on the position of the matrix and solvent. In addition, the lack of temperature control under continuous ultrasound waves could lead to overheating. Finally, the need for ultrasound intensity optimization is vital; liquid agitation could proceed at high-intensity values which could lead to decreased ultrasonic wave propagation [14].
The extraction of bioactive chemicals from tomatoes and their by-products, particularly through green extraction methods, has been thoroughly investigated in recent years [15,16,17,18,19,20,21]. However, there is a scarcity of reports that address the optimization of ultrasonic extraction methods using food-grade solvents. This study addresses the aforementioned gap and proceeds to conduct a systematic investigation. The optimization of a green extraction technique utilizing ethanol, an eco-friendly and food-compatible solvent, addresses a gap in the literature. To that end, the study aimed to valorize tomato processing industry wastes using ethanol as solvent, optimize a green extraction technique (i.e., ultrasound-assisted bath extraction), and compare it with a conventional stirring technique. The results of this study could lead to the generation of a novel, high-added value product in the food sector.

2. Materials and Methods

2.1. Solvents, Reagents, and Materials

Anhydrous sodium carbonate was purchased from Penta (Prague, Czech Republic), and iron (III) chloride was obtained from Merck (Darmstadt, Germany). Methanol, hydrochloric acid, 2,4,6-tris(2-pyridyl)-s-triazine (TPTZ), 2,2-diphenyl-1-picrylhydrazyl synthetic radical (DPPH), lycopene analytical standard (≥85%), and all standards for the HPLC determination of polyphenols were purchased from Sigma-Aldrich (Darmstadt, Germany). These included both flavonoids (i.e., rutin, naringin, naringin dihydrochalcone, and naringenin) and non-flavonoids (i.e., coniferyl alcohol, syringic acid, 4-methylcatechol, ferulic acid, trans-cinnamic acid, and 3,4,5-trimethoxycinnamic acid). Ethanol, gallic acid, and Folin–Ciocalteu reagent were purchased from Panreac Co. (Barcelona, Spain). Acetonitrile was obtained from Labkem (Barcelona, Spain). A deionizing column generated deionized water for the conducted experiments. The Damavand S.A. tomato processing factory, located in Filia (Karditsa, Central Greece) supplied the tomato processing industry waste (TPIW), which included the seeds and peels of the tomatoes. The samples were kept at 4 °C until analysis.

2.2. Instrumentation

A Biobase BK-FD10 (Biobase Group, Jinan, China) freeze-dryer was used to lyophilize the TPIW samples. An electric mill was used to grind the dried material which turned into a fine powder after being sieved by an Analysette 3 PRO sieving apparatus from Fritsch GmbH (Oberstein, Germany). A 40-mesh (400 μm) sieve was used to assure uniformity in particle size. A Heidolph magnetic stirring hotplate from Heidolph Instruments GmbH & Co. KG (Schwabach, Germany) was used for the extraction procedure. Correspondingly, the ultrasonication (US) process was conducted through an Elmasonic P70H US bath from Elma Schmidbauer, GmbH (Singen, Germany). The supernatant liquid from all extracts was isolated through a centrifugation process with a NEYA 16R centrifuge from Remi Elektrotechnik Ltd. (Palghar, India) and was stored at −40 °C in a freezer Platinum 500 model from Angelantoni Life Sciences (Massa Martana, Italy). To perform spectrophotometric determinations, a double-beam Shimadzu UV-1900i PharmaSpec Spectrophotometer (Shimadzu Corporation, Kyoto, Japan) was used. Finally, chromatographic quantification of bioactive compounds was performed through a High-Performance Liquid Chromatography (HPLC) system from Shimadzu Europa GmbH (Duisburg, Germany). The HPLC apparatus was a Shimadzu CBM-20A model connected to an SPD-M20A diode array detector (DAD). The employed chromatographic column (100 Å, 5 μm, 4.6 mm × 250 mm) was a Phenomenex Luna model C18(2) from Phenomenex Inc. (Torrance, CA, USA).

2.3. Extraction Process

2.3.1. Ultrasonic Bath-Assisted Extraction (UBAE)

The freeze-dried TPIW was extracted in an ultrasonication bath at several time intervals. A liquid-to-material ratio of 10–40 mL/g of TPIW powder was mixed with ethanol in a 25 mL screw-capped bottle. The ultrasonication bath had the frequency set at 37 kHz in sweep mode, with the highest power of 220 W and within a duration of 5–25 min (using 10 min intervals). The temperature was measured to be <40 °C before and after the ultrasonication process. Finally, the supernatant liquid from the centrifuged samples was stored at −40 °C.

2.3.2. Stirring Extraction (STE)

A quantity of freeze-dried TPIW was mixed with 10 mL of ethanol in a 25 mL screw-capped bottle. The extraction occurred in a magnetic stirring hotplate with a continuous stirring of 500 rpm within a duration of 30–90 min (using 30 min intervals). The supernatants from the centrifuged samples were stored at −40 °C.

2.4. Experimental Design and Response-Surface Methodology (RSM) Optimization

Response-Surface Methodology (RSM) via Box–Behnken design, incorporating three factors at three levels, was employed to ascertain the optimal extraction conditions for total carotenoid content (TCC) and antiradical activity (DPPH assay). This methodology was applied to two extraction methods: (I) ultrasonic bath-assisted extraction (UBAE) and (II) stirring extraction (STE) using TPIW. The examined independent variables included the liquid-to-solid ratio (R, mL/g) as X1, extraction time (t, min) as X2, and either ultrasonic power (E, %) or extraction temperature (T, °C) as X3. These variables were assigned three coded levels: low (−1), medium (0), and high (+1), as shown in Table 1 for UBAE and Table 2 for STE (vide infra). To assess method repeatability, 15 experimental runs with 3 central points were conducted. Each run was replicated three times, recording the average response values.
Stepwise regression was utilized to refine the model’s predictive precision by reducing variance from superfluous term estimation, leading to a second-order polynomial equation that delineates the interactions between the three independent variables:
Y k = β 0 + i = 1 2 β i X i + i = 1 2 β i i X i 2 + i = 1 2 j = i + 1 3 β i j X i X j
where the independent variables are denoted by Xi and Xj, and the predicted response variable is defined by Yk. In the model, the intercept and regression coefficients β0, βi, βii, and βij represent the linear, quadratic, and interaction terms, respectively.

2.5. Quantification of Bioactive Compounds

2.5.1. Determination of Total Polyphenol Content (TPC)

The evaluation of TPC was based on spectrophotometric measurements of a bluish mixture at 740 nm, as previously established [22]. The results were expressed as mg gallic acid equivalents (GAE) per g of dry weight (dw), as shown in Equation (2). Briefly, 200 μL of properly diluted sample was mixed with the same volume of the Folin–Ciocalteu reagent and 1600 μL of 5% w/v aqueous sodium carbonate solution after 2 min in an Eppendorf tube. The mixture was finally incubated at 40 °C for 20 min. The total polyphenol concentration (CTP, mg/L), the exact volume of the extraction solvent V (in L), and the dried weight of the sample (w, in g) were calculated. A calibration curve of 10–100 mg GAE/L in methanol was conducted before the analysis.
TPC   ( mg   GAE / g   dw ) = C TP × V w

2.5.2. Individual Polyphenol Quantification

The individual polyphenols were identified and quantified chromatographically using an established method [22]. The identification was conducted through a comparison of the absorbance spectrum and retention times to those of pure standards. The quantification process was performed through excellent linearity (<0.99) calibration curves (0–500 mg/L). To fit the data into a specific range, data from TPC were used to properly dilute each sample. The mobile phase involved 0.5% v/v aqueous formic acid (mixture A) and 0.5% v/v formic acid in acetonitrile (mixture B). The flow rate was kept constant at 1 mL/min. The separation of bioactive molecules was performed in a column which was kept at a constant temperature at 40 °C. Isolating and quantifying flavonoid and non-flavonoid compounds effectively requires separate programs. To identify flavonoids, a gradient program was utilized. The program began with a 3 min increase from 5% to 30% B, continued for 34 min to 68% B, then for 1 min to 100% B, followed by a 3 min hold, and finally, it swiftly returned to 5% B. To the contrary, the non-flavonoid identification gradient program was conducted as follows: 5% to 12% B ramped up in 15 min, 55% in 35 min, and 100% in 1 min. The procedure decreased the B concentration to 5% after maintaining a constant state for 3 min. Both programs had a total duration of 40 min. The injection volume was constant at 20 μL. The total polyphenolic components can be determined by comparing the absorbance spectra and retention periods to pure standards. Calibration curves ranging from 0 to 500 mg/L were utilized for their measurement, and they exhibited high linearity (<0.99). The identified molecules were measured at the wavelength where their peaks were most noticeable, in accordance with the protocol.

2.5.3. Determination of TCC

The TCC of the specific agricultural waste was determined spectrophotometrically through the UV–Vis spectrum from 400 to 700 nm, using a modified method from Popescu et al. [21]. Specifically, proper dilution of extracts was performed with ethanol, and the samples were scanned within a wavelength range of 400–700 nm using 1 cm quartz cuvette cells. A calibration curve of lycopene (0.1–5 μg/mL, R2 = 0.9981) was constructed to calculate the TCC, with results expressed as μg lycopene equivalents (LyE)/g dw.

2.6. In Vitro Antioxidant Capacity Assessment

2.6.1. DPPH Scavenging Activity

The antioxidant activity of the TPIW extract was evaluated through radical-scavenging assay. A volume of 975 μL of the purplish methanolic DPPH (100 μM) was mixed with 25 μL of each extract, as previously discussed by Shehata et al. [23]. The decolorization of DPPH was assessed spectrophotometrically at 515 nm, wherein the initial (A515(i)) and final (A515(f)) absorbance after 30 min storage in the dark was measured (Equation (3)). Specifically, the blank solution contained 975 μL of the methanolic DPPH and 25 μL of methanol. The calculation of antiradical activity (AAR) of each extract was feasible with the employment of a powerful antioxidant with scavenging potential (ascorbic acid, AA). The results involved the solvent volume (V, in L), the measured AA concentration (CAA, in μmol/L), and the dried mass of TPIW (w, in g), as shown in Equation (4).
Inhibition   % = A 515 i   A 515 f A 515 i   ×   100
A AR μ mol   AAE / g   dw = C AA   ×   V w

2.6.2. Ferric-Reducing Antioxidant Power (FRAP)

The antioxidant capacity of TPIW extracts was further evaluated with another antioxidant assay. An ion-reducing-based methodology (i.e., FRAP) by Shehata et al. [23] was used, in which a stable blueish complex of Fe+2 − TPTZ was formed and the absorbance at 620 nm was recorded. Briefly, 100 μL of properly diluted sample was mixed with 100 μL of iron chloride (III). After being incubated at 37 °C for 30 min, 1800 μL of TPTZ (1 mM in 0.05M HCl) was added to the mixture. The calibration curve of AA dissolved in 0.05 M HCl had a range of 50–500 μM and was used before analysis. The reducing power (PR) of ferric ions was assessed using Equation (5) and expressed as μmol of ascorbic acid equivalents (AAE) per g of dw.
  P R   ( μ mol   AAE / g   dw ) = C AA   ×   V w

2.7. Statistics

Each assay and extraction was performed in triplicate. Statistical processes including RSM and distribution analysis were conducted using JMP® Pro 16 software (SAS, Cary, NC, USA). Principal component analysis was conducted with the same software. The Kolmogorov–Smirnov test was used to test the data for normality. A significance level of 95% was used in a one-way analysis of variance (ANOVA) to explore statistically significant differences. This was followed by post hoc Tukey HSD (honestly significant difference) test calculations, applying the Tukey–Kramer method. The results are expressed as mean values ± standard deviations.

3. Results and Discussion

3.1. Optimization of Extraction Parameters
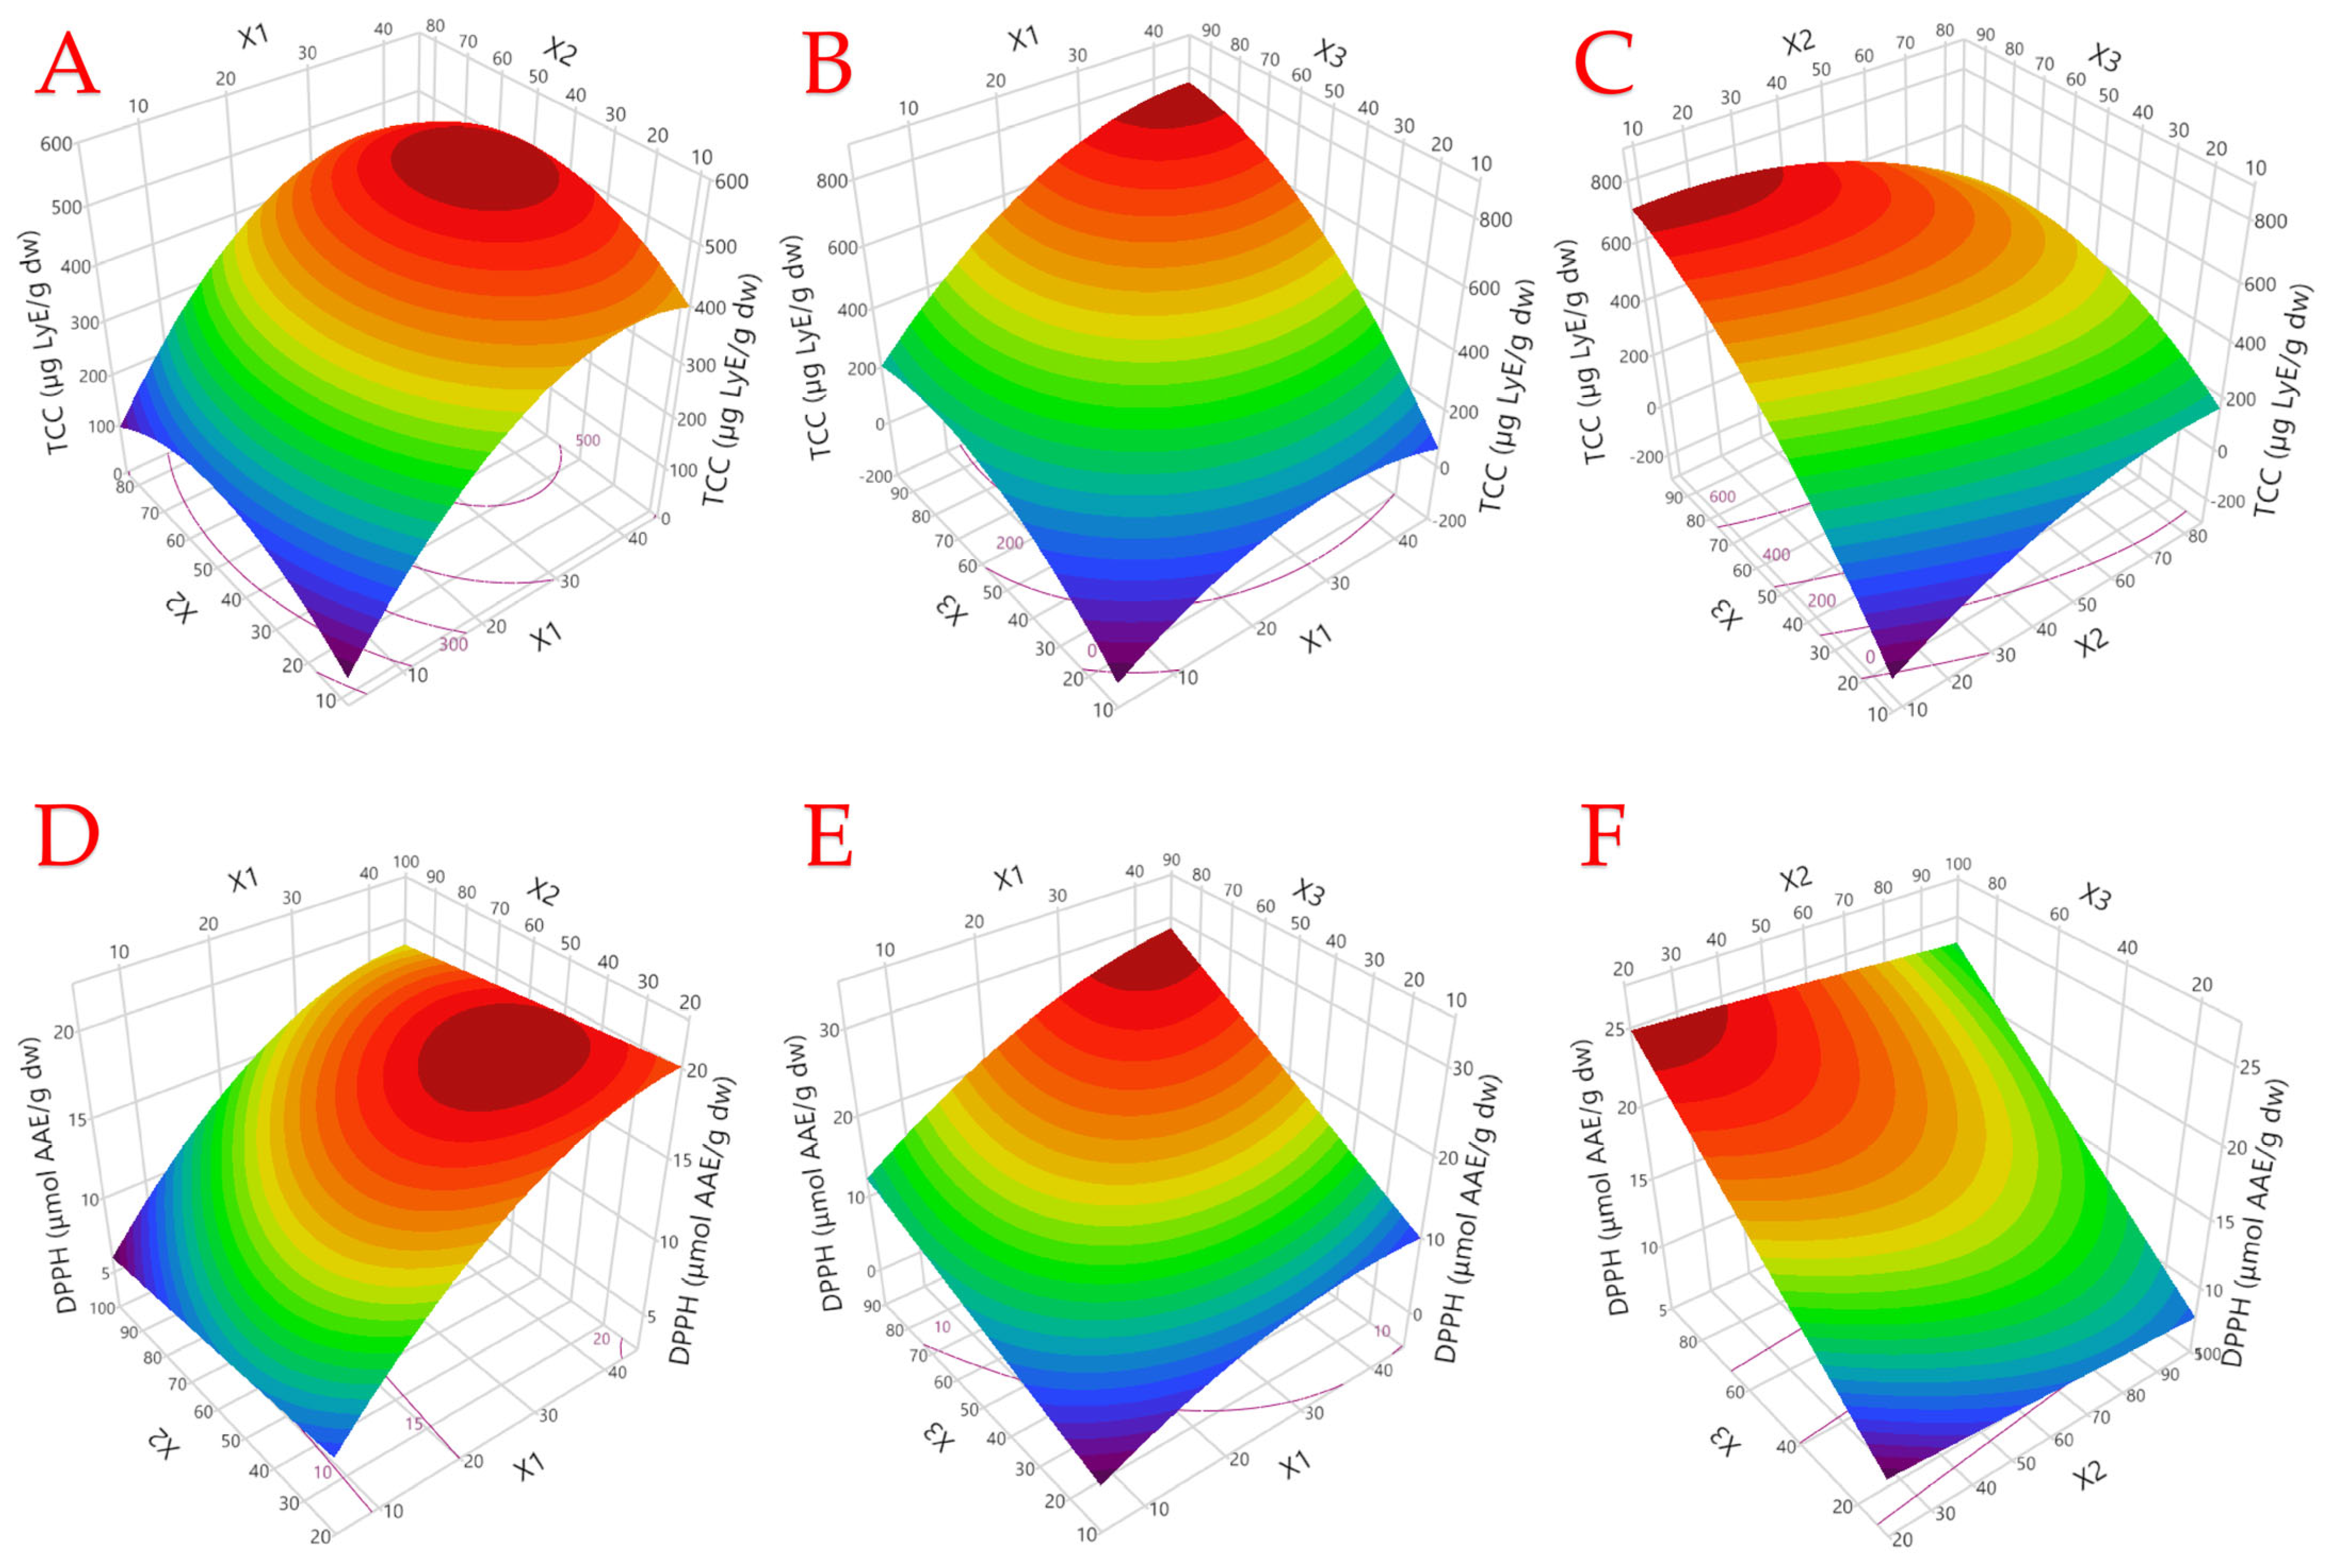
Optimization of the extraction of TPIW bioactive compounds, mainly targeting lycopene and polyphenols, was one of the main objectives of the study. The target was performed with a solvent of intermediate polarity, which is also food-compatible (i.e., ethanol). Multiple bioactive substances cause differences in solubility and polarity, which might complicate the extraction process [24]. The antioxidant capacity and extraction yield are also significantly affected by the extraction technique and other processing parameters. Modern extraction techniques have surpassed critical issues, such as the reduction in the need for harmful solvents, the safeguarding of public health, and the low energy requirement. The successful implementation of this technology relies on the use of an environmentally acceptable solvent [25]. As a solvent of medium polarity, ethanol is much more effective at extracting both polar and nonpolar molecules. Due to its lack of toxicity, it finds extensive application in the food and pharmaceutical industries, where it excels in extracting lipids, fatty acids, and phenolic compounds [26].
Regarding the TCC in the UBAE extraction, the range was found to be quite wide (i.e., from 113.5 to 475.7 μg/g dw), noting a four-fold difference. An even wider range was found in the conventional STE extraction (97–691.3 μg/g dw). It can thus be seen that the extraction conditions significantly affect the examined parameters. A comparable trend was noted in the evaluation of antioxidant activity. The UBAE technique yielded 2.50–6.84 μmol AAE/g dw, whereas the corresponding range from the STE technique was found to be from 5.84 to 24.63 μmol AAE/g dw. As was previously mentioned, it was observed that the highest antioxidant capacity was obtained in the extract that was prepared with the use of low ultrasonication intensity (i.e., design point 6). The results demonstrated that STE is the most efficient approach for extracting antioxidant compounds from solid TPIW, achieving nearly double the efficacy of the UBAE technique. Finally, Table 3 provides the statistical features of the TCC technique and DPPH stepwise regression analysis of ANOVA on UBAE and STE, respectively. We removed it from the equation for all variables that did not make a statistically significant difference (p > 0.05). More importantly, the obtained models satisfactorily matched the data; nonetheless, it should be noted that the STE method had a better R2 value (>0.96).

3.2. Model Analysis

Simplified polynomial equations were generated from the response surface of the model’s evaluated data, with variables that do not show a statistically significant contribution (p > 0.05) to improving the recovery of the targeted bioactive molecules being excluded. The TCC, with lycopene being the most abundant carotenoid, and its antiradical activity through DPPH scavenging were examined. Equations (6) and (7) refer to UBAE, whereas Equations (8) and (9) involve the STE procedure. In both cases, the models contained only significant terms.
TCC = 4.424 − 16.392X1 + 5.011X2 + 8.391X3 + 0.227X12 + 0.915X22 − 0.472X2X3
DPPH = −15.06 + 0.520X1 − 0.024X2 + 0.365X3 − 0.003X12 + 0.008X22 − 0.001X32 − 0.004X1X3 − 0.003X2X3
TCC = −686.86 + 18.686X1 + 11.076X2 + 15.888X3 − 0.322X12 − 0.064X22 − 0.072X32 + 0.104X1X3 − 0.092X2X3
DPPH = −1.396 + 0.554X1 − 0.020X2 + 0.124X3 − 0.007X12 + 0.002X1X3
The extraction optimization of bioactive molecules, assessed via the TCC and DPPH methods, can also be illustrated through 3D graphical plots utilizing the specific parameters X1, X2, and X3, as demonstrated in Figure 1 and Figure 2. Figure 1 illustrates the influence of the parameters X1 and X2 for specific assays within the PLE extraction technique. The reasoning behind the interpretation of these diagrams lies in the selection of parameters that yield the highest value of the variable in focus (i.e., red color), whereas the less favorable low values are represented in blue. For example, in Figure 1A which corresponds to the UBAE technique, it is observed that for TCC optimization, the parameter X1 required values below 10, whereas for X2, values lower than 5 were necessary, indicated by the red color on the graph. Concerning the STE technique, it was noted that optimization yielded higher values compared to UBAE, where the blue color is dominant, suggesting that optimizing the specific parameters did not markedly improve the extraction of bioactive molecules. This finding could indicate further parameter optimization regarding the UBAE technique. The optimal conditions as identified through the 3D plots for both extraction techniques are presented in Table 4. A high desirability value (>0.95) indicates the reliability of the method.

3.3. Pareto Plot Analysis of the Effect of Extraction Parameters on Assays

The impact of the examined extraction conditions of the two techniques was analyzed in detail to enhance our understanding of their influence. A Pareto plot was utilized to accomplish this. The t-ratio on a Pareto plot (Figure 3) is determined by dividing the parameter estimate by its standard error. This ratio is crucial for assessing the significance of each parameter estimate. Additionally, the cumulative line on the plot illustrates the total of absolute t-ratios, providing insight into the relative explanatory power of each estimate. The diagram utilizes different colors that are clearly distinguishable for interpretation. Blue signifies a positive impact, while red denotes a negative impact. An asterisk denotes the statistical significance (p < 0.05) of the effect. As such, an increase in the X1 parameter had a negative impact on the TCC, as observed in the UBAE technique (Figure 1A). An increasing X2 value was deemed preferable for carotenoid extraction, whereas the X3 parameter had no impact at all. On the other hand, the X3 parameter had a vast impact on the extraction of carotenoids, an expected trend as the molecule’s solubility increases at higher temperatures. In addition, an increasing liquid-to-material ratio was preferable in the STE technique when compared to the UBAE method, meaning that the latter method demanded lower ratios. This finding could be a matter of the propagation of ultrasonic waves within the matrix–solvent solution.

3.4. Investigating Optimal Extraction Conditions Through Partial Least Squares (PLS) Analysis

The effect of the extraction parameters was further studied using PLS to graphically reveal the impact on the parameters under investigation. In addition, the model will suggest the optimal extraction conditions for each technique, taking into account the key parameters (i.e., temperature, extraction time, ultrasonic intensity, and solid-to-solvent ratio) [27]. Figure 4 illustrates the results from the PLS model using both techniques. Regarding the UBAE technique, it could be interpreted that the solvent-to-solid ratio had a negative impact on the DPPH technique, but it was higher in carotenoid extraction, as revealed in Figure 4A. The corresponding Figure 4B reveals how this parameter positively affected carotenoid extraction by means of quantitation. Concerning the X2 parameter, which was again the same for the two extraction techniques, an extended UBAE duration was deemed undesirable for the extraction of bioactive compounds, most probably due to the labile nature of these compounds. This parameter was of low significance for STE. Finally, the X3 parameter, which was unique for each extraction technique (i.e., ultrasonication power for UBAE and temperature for STE), showed a positive impact when increased in both extraction techniques. The increased solubility of the molecules and the increased cavitation bubble force could be the matter of this pattern. Variance importance plots (VIPs) are also illustrated in Figure 4C,D. The rationale behind these graphs resembles that of the Pareto plot we examined earlier. Rather than determining whether the impact of each extraction parameter was positive or negative, the primary focus of the plot was determining whether that impact was positive or negative. The red line denotes statistical significance (0.8). Regardless, the results are in accordance with previous findings.
According to Table 5, the UBAE technique indeed uses a lower solvent-to-material ratio (R) and a shorter extraction time (t), making it more desirable in terms of these variables. However, the STE technique excels in achieving a higher TCC and DPPH radical scavenging activity, which indicates a more efficient extraction process under its optimal conditions. This highlights the contrast between the two techniques, where UBAE is more efficient in terms of solvent use and time, while STE is more effective in extracting higher quantities of carotenoids and antioxidants.
The experimental results and PLS model predictions exhibit outstanding concordance, as evidenced by the high correlation coefficients of 0.9966 and 0.9971, and substantial coefficient of determination (R2) values of 0.9933 and 0.9943 for the UBAE and STE techniques, respectively. Furthermore, the p-values being less than 0.0001 for both UBAE and STE indicates that the deviations between the actual and predicted values are statistically insignificant.

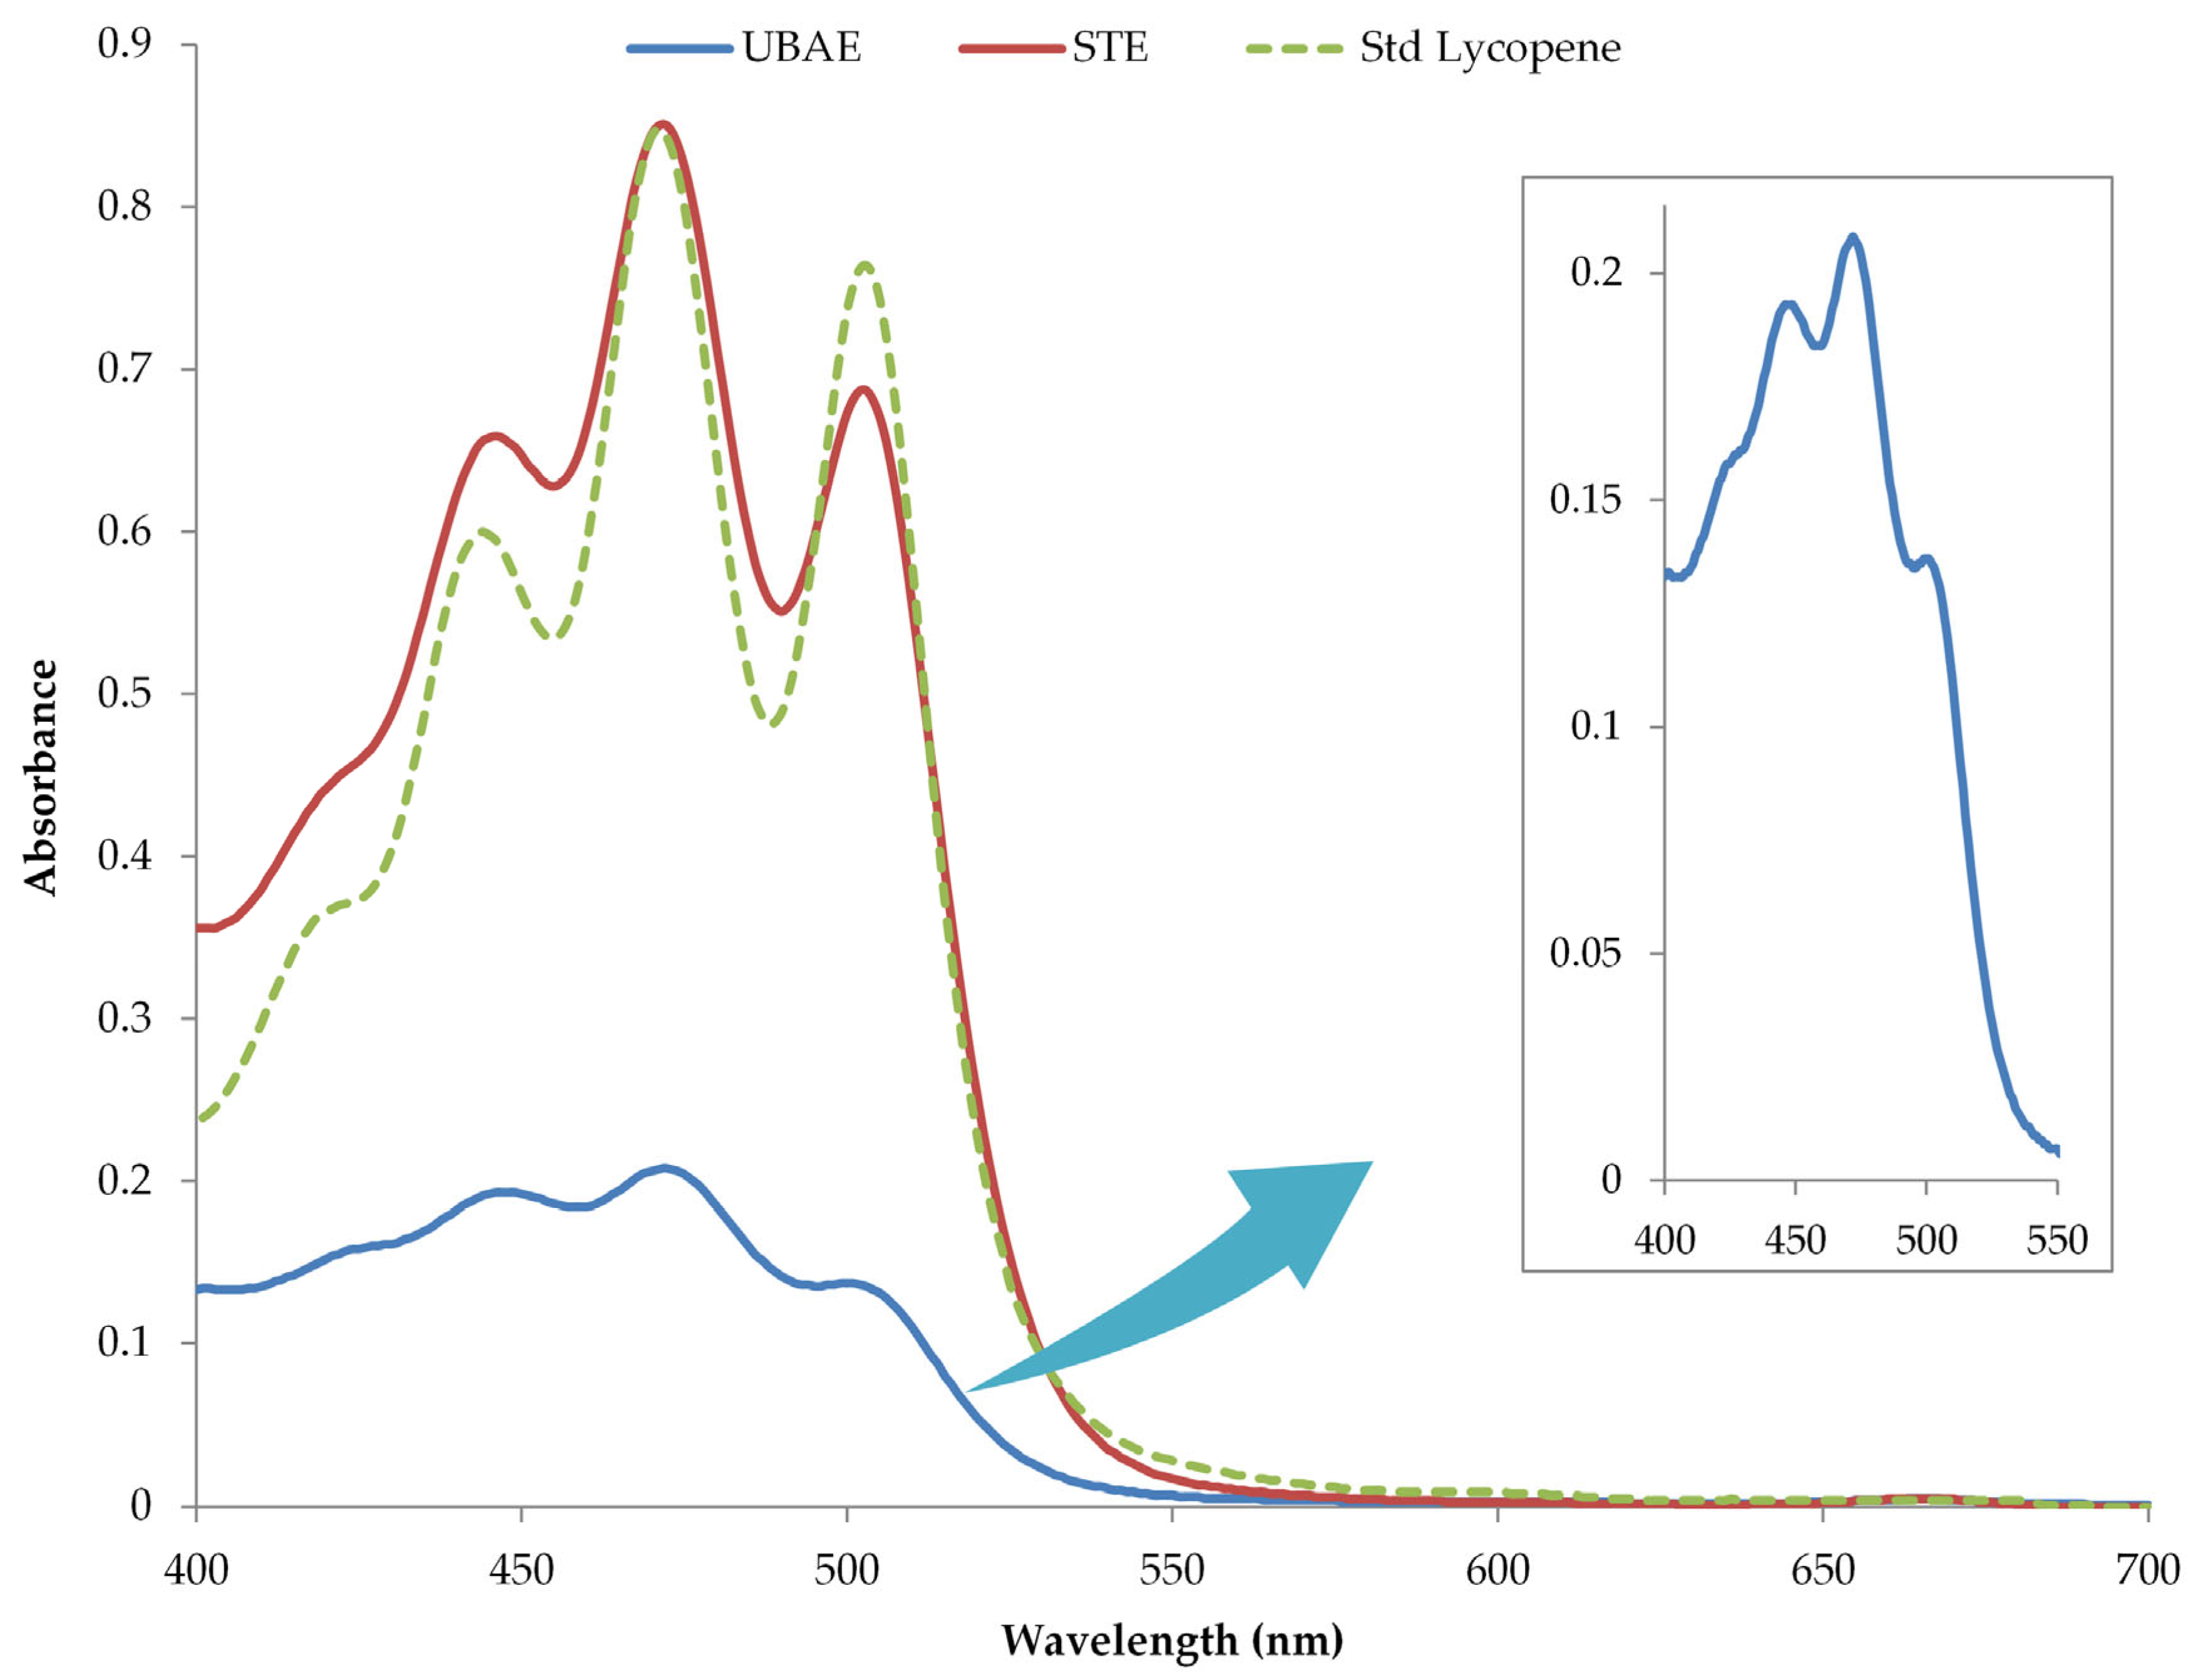
3.5. Comparison of Two Extraction Techniques

3.5.1. Antioxidant Activity of Extracts

Naturally occurring polyphenols are among the most well-known types of chemicals for their potential to improve health. Many fields could benefit from these compounds, including the food and pharmaceutical industries [28]. The carotenoids found in tomatoes, of which lycopene is the most abundant, aid in the substantial decrease in cancer, cardiovascular illness, and age-related macular degeneration [29]. The extraction of carotenoids and polyphenols from tomato residue is therefore essential since they also have potent antioxidant activity.
By their mode of action, antioxidant agents can be categorized as either primary or secondary. The polyphenols (including flavonoids) and carotenoids found in tomatoes are the principal “chain-breaking” antioxidants. These donate hydrogen atoms to radicals, which inhibits or delays lipid oxidation. “Preventers” are secondary antioxidants that impede initiation by chelating metal ions, most commonly iron and copper, and slow lipid oxidation. The mentioned mode of action could be of high significance should the extracts be employed as natural antioxidants in oily food products. The oxidation of free radicals and lipids is prevented by lycopene, which is classified as a secondary antioxidant [30]. The antioxidant activity was measured by utilizing ion-reducing assays (FRAP) and a radical scavenging test (DPPH), given the nature of the extracted antioxidants from TPIW. DPPH is used to detect antioxidant activity in both hydrophilic and lipophilic molecules, while the FRAP assay has the best results in hydrophilic antioxidants [31]. The unique UV–Vis absorbance of lycopene is illustrated in Figure 5, where spectra of the two optimal samples are recorded. A representative spectrum from a lycopene standard solution, at a concentration of 3.5 mg/L, was also recorded for comparison reasons. It should be highlighted that the spectrum from the STE sample resembled the unique peaks from pure lycopene. The fact that the UBAE sample had a significantly lower absorbance could be a matter of lycopene degradation due to ultrasound, as reported elsewhere [30]. The unstable nature of carotenoids could demand the further optimization of ultrasonic extraction or the development of other extraction techniques.
For each prepared optimum extract, the measured responses, including bioactive compounds (TPC and TCC) and antioxidant capacity (DPPH and FRAP), are shown in Table 6. It was observed that the values obtained from the STE technique had statistically significant (p < 0.05) differences compared to the UBAE technique. This pattern was observed in both the recovery of the bioactive substance and the obtained antioxidant activity.
However, it should be mentioned that we employed ethanol to recover lycopene and other compounds as a green solvent which could be used in the food sector in several oily products. Ethanol was not as efficient as other organic solvents, such as hexane, ethyl acetate, acetone, and molecular mixtures, according to a previous study by Strati et al. [15]. The authors used a conventional extraction technique with a solid-to-liquid ratio of 3:1–10:1 (v/w). The particle size ranged from 500 to 1000 μm, where ethanol yielded up to 6.1 mg lycopene/kg dried tomato waste. In a more recent study by Silva et al. [20], the authors employed ultrasound-assisted extraction using a water bath with hydrophobic eutectic mixtures as solvents. The results were comparable to ours, in which the isolated lycopene ranged from 774.1 to 1462.8 µg/g. This specific study suggests that this mixture involving DL-menthol and lactic acid could be a reliable alternative lipophilic, food-grade solvent. Regarding the determination of TPC, our results ranged from 2.62 to 3.69 mg GAE/g dw. In a similar study by Grassino et al. [32], ultrasound and high hydrostatic pressure were applied to tomato peel waste to extract pectin. However, the authors measured TPC, which ranged from 0.16 to 0.25 mg GAE/g dw. The difference in the cultivar could describe variations in the above recovered bioactive compounds in addition to the extraction techniques. Regarding the extraction solvent, further studies including other food-grade solvents could be conducted to shed more light on the valorization of TPIW.

3.5.2. Individual Polyphenols Composition

The extraction of polyphenolic compounds has been the subject of many research studies. To begin with, ethanol not only comprises a food-grade solvent, it is also a solvent of medium polarity which could extract a wide range of polyphenols. The results from the identified individual polyphenols are shown in Table 7. We divided the polyphenols into flavonoids and non-flavonoids for better interpretation of the obtained results. The total flavonoids were measured at 1.03 and 2.13 mg/g in UBAE and STE, respectively. The corresponding yield of non-flavonoid compounds was measured at 0.59 and 1.21 mg/g dw, further supporting the evidence that STE was a preferable technique. The findings were both contradictory and highly interesting, particularly considering the earlier study by Kalompatsios et al. [22], which showed that the US probe extraction of Opuntia macrorhiza suggested ultrasonication could serve as a reliable, time- and energy-efficient extraction technique. The results also revealed that the labile nature of the compounds present in TPIW may explain the inefficiency of ultrasound as an extraction technique for the specific by-product. To that end, a similar study from Solaberrieta et al. [19] was conducted to extract bioactive compounds from tomato waste. The authors used microwave- and ultrasound-assisted extraction (with a probe) using hydroethanolic mixtures for that reason. Using the latter method, the authors quantified similar compounds to ours (i.e., naringenin and rutin at 19.3 and 7.5 mg/g dw, respectively). The difference in this yield could be a matter of the solvent or the ultrasound probe extraction. However, it was revealed that microwave extraction was again preferable to US, marking an almost two-fold increase in the obtained polyphenols.

3.6. Principal Component Analysis

Principal component analysis (PCA) was employed to extract additional information from the variables and conduct a more thorough data analysis. Finding a link between TPC, carotenoids, and antioxidant tests was the goal of this investigation. Two primary components were determined based on eigenvalues >1, as seen in Figure 6. Together, these factors explained 99.96% of the variation. A correlation, either positive or negative, between the parameters was shown by the results. For instance, TCC and the sum of total non-flavonoids had a positive correlation with PC2, whereas all of the depicted variables had a positive correlation with PC1, which was the most prevalent. The majority of the examined parameters were discriminated and in close proximity with the STE technique, highlighting that this technique was preferable for TPIW valorization.

4. Conclusions

This study enhances the current research on the use of tomato by-products, a significant fruit in the Mediterranean. The chain-breaking properties of antioxidants present in TPIW suggest that the extracts obtained could be utilized to develop high-value products within the food industry. The labile nature of the bioactive compounds found in TPIW renders the ultrasonication method a less preferable option for their recovery. However, this study highlights the potential for environmentally friendly and non-destructive extraction methods, which could yield high-value products for future research. One recommended technique for lycopene extraction is magnetic stirring, as it is a less destructive method. This pattern was similarly noted in the extraction of various bioactive compounds, including flavonoids and non-flavonoid polyphenols. Although the recovery of molecules with biological activity has been low, this study indicates the potential for developing new high-added value products, as the use of ethanol is suitable for this aim. Furthermore, the study suggests opportunities for the advancement of alternative green methods or the application of other food-grade solvents. These findings open up new avenues for research and development in the field of sustainable extraction techniques, contributing to the creation of high-value products from TPIW.

Author Contributions

Conceptualization, V.A., and S.I.L.; methodology, V.A., software, V.A.; validation, V.A.; formal analysis, K.M., N.T., D.K. and V.A.; investigation, D.K. and V.A.; resources, S.I.L.; data curation, D.K. and N.T.; writing—original draft preparation, D.K.; writing—review and editing, K.M., N.T., D.K., V.A. and S.I.L.; visualization, K.M., N.T. and D.K.; supervision, V.A., and S.I.L.; project administration, S.I.L.; funding acquisition, S.I.L. All authors have read and agreed to the published version of the manuscript.

Funding

This research received no external funding.

Data Availability Statement

The original contributions presented in this study are included in the article, and further inquiries can be directed to the corresponding author.

Acknowledgments

The authors would like to acknowledge the Damavand S.A. tomato processing industry, located in Filia (Karditsa, Greece), for providing fresh tomato by-products.

Conflicts of Interest

The authors declare no conflicts of interest.

References

  1. Trombino, S.; Cassano, R.; Procopio, D.; Di Gioia, M.L.; Barone, E. Valorization of Tomato Waste as a Source of Carotenoids. Molecules 2021, 26, 5062. [Google Scholar] [CrossRef] [PubMed]
  2. Radić, K.; Galić, E.; Vinković, T.; Golub, N.; Vitali Čepo, D. Tomato Waste as a Sustainable Source of Antioxidants and Pectins: Processing, Pretreatment and Extraction Challenges. Sustainability 2024, 16, 9158. [Google Scholar] [CrossRef]
  3. Chaudhary, P.; Sharma, A.; Singh, B.; Nagpal, A.K. Bioactivities of Phytochemicals Present in Tomato. J. Food Sci. Technol. 2018, 55, 2833–2849. [Google Scholar] [CrossRef] [PubMed]
  4. Imran, M.; Ghorat, F.; Ul-Haq, I.; Ur-Rehman, H.; Aslam, F.; Heydari, M.; Shariati, M.A.; Okuskhanova, E.; Yessimbekov, Z.; Thiruvengadam, M.; et al. Lycopene as a Natural Antioxidant Used to Prevent Human Health Disorders. Antioxidants 2020, 9, 706. [Google Scholar] [CrossRef]
  5. Rudrapal, M.; Khairnar, S.J.; Khan, J.; Dukhyil, A.B.; Ansari, M.A.; Alomary, M.N.; Alshabrmi, F.M.; Palai, S.; Deb, P.K.; Devi, R. Dietary Polyphenols and Their Role in Oxidative Stress-Induced Human Diseases: Insights Into Protective Effects, Antioxidant Potentials and Mechanism(s) of Action. Front. Pharmacol. 2022, 13, 806470. [Google Scholar] [CrossRef]
  6. Santagata, R.; Ripa, M.; Genovese, A.; Ulgiati, S. Food Waste Recovery Pathways: Challenges and Opportunities for an Emerging Bio-Based Circular Economy. A Systematic Review and an Assessment. J. Clean. Prod. 2021, 286, 125490. [Google Scholar] [CrossRef]
  7. Awasthi, M.K.; Sarsaiya, S.; Patel, A.; Juneja, A.; Singh, R.P.; Yan, B.; Awasthi, S.K.; Jain, A.; Liu, T.; Duan, Y.; et al. Refining Biomass Residues for Sustainable Energy and Bio-Products: An Assessment of Technology, Its Importance, and Strategic Applications in Circular Bio-Economy. Renew. Sustain. Energy Rev. 2020, 127, 109876. [Google Scholar] [CrossRef]
  8. Morón-Ortiz, Á.; Mapelli-Brahm, P.; Meléndez-Martínez, A.J. Sustainable Green Extraction of Carotenoid Pigments: Innovative Technologies and Bio-Based Solvents. Antioxidants 2024, 13, 239. [Google Scholar] [CrossRef]
  9. Giovanoudis, I.; Athanasiadis, V.; Chatzimitakos, T.; Gortzi, O.; Nanos, G.D.; Lalas, S.I. Development of a Cloud Point Extraction Technique Based on Lecithin for the Recovery of Carotenoids from Liquid Tomato Wastewater. Waste 2022, 1, 105–114. [Google Scholar] [CrossRef]
  10. Vlachoudi, D.; Chatzimitakos, T.; Athanasiadis, V.; Bozinou, E.; Lalas, S.I. Enhanced Extraction of Carotenoids from Tomato Industry Waste Using Menthol/Fatty Acid Deep Eutectic Solvent. Waste 2023, 1, 977–992. [Google Scholar] [CrossRef]
  11. Kultys, E.; Kurek, M.A. Green Extraction of Carotenoids from Fruit and Vegetable Byproducts: A Review. Molecules 2022, 27, 518. [Google Scholar] [CrossRef] [PubMed]
  12. Jha, A.K.; Sit, N. Extraction of Bioactive Compounds from Plant Materials Using Combination of Various Novel Methods: A Review. Trends Food Sci. Technol. 2022, 119, 579–591. [Google Scholar] [CrossRef]
  13. Chemat, F.; Rombaut, N.; Sicaire, A.-G.; Meullemiestre, A.; Fabiano-Tixier, A.-S.; Abert-Vian, M. Ultrasound Assisted Extraction of Food and Natural Products. Mechanisms, Techniques, Combinations, Protocols and Applications. A Review. Ultrason. Sonochem. 2017, 34, 540–560. [Google Scholar] [CrossRef] [PubMed]
  14. Carreira-Casais, A.; Otero, P.; Garcia-Perez, P.; Garcia-Oliveira, P.; Pereira, A.G.; Carpena, M.; Soria-Lopez, A.; Simal-Gandara, J.; Prieto, M.A. Benefits and Drawbacks of Ultrasound-Assisted Extraction for the Recovery of Bioactive Compounds from Marine Algae. Int. J. Environ. Res. Public. Health 2021, 18, 9153. [Google Scholar] [CrossRef]
  15. Strati, I.F.; Oreopoulou, V. Effect of Extraction Parameters on the Carotenoid Recovery from Tomato Waste. Int. J. Food Sci. Technol. 2011, 46, 23–29. [Google Scholar] [CrossRef]
  16. Strati, I.F.; Oreopoulou, V. Process Optimisation for Recovery of Carotenoids from Tomato Waste. Food Chem. 2011, 129, 747–752. [Google Scholar] [CrossRef]
  17. Szabo, K.; Teleky, B.-E.; Ranga, F.; Roman, I.; Khaoula, H.; Boudaya, E.; Ltaief, A.B.; Aouani, W.; Thiamrat, M.; Vodnar, D.C. Carotenoid Recovery from Tomato Processing By-Products through Green Chemistry. Molecules 2022, 27, 3771. [Google Scholar] [CrossRef]
  18. Anarjan, N. Evaluation the Effects of Ultrasonic Parameters on Simultaneously Extraction and Size Reduction of Lycopene from Tomato Processing Waste. Waste Biomass Valorization 2020, 11, 1929–1940. [Google Scholar] [CrossRef]
  19. Solaberrieta, I.; Mellinas, C.; Jiménez, A.; Garrigós, M.C. Recovery of Antioxidants from Tomato Seed Industrial Wastes by Microwave-Assisted and Ultrasound-Assisted Extraction. Foods 2022, 11, 3068. [Google Scholar] [CrossRef]
  20. Silva, Y.P.A.; Ferreira, T.A.P.C.; Jiao, G.; Brooks, M.S. Sustainable Approach for Lycopene Extraction from Tomato Processing By-Product Using Hydrophobic Eutectic Solvents. J. Food Sci. Technol. 2019, 56, 1649–1654. [Google Scholar] [CrossRef]
  21. Popescu, M.; Iancu, P.; Pleșu, V.; Bîldea, C.S.; Todasca, C.M. Different Spectrophotometric Methods for Simultaneous Quantification of Lycopene and β-Carotene from a Binary Mixture. LWT 2022, 160, 113238. [Google Scholar] [CrossRef]
  22. Kalompatsios, D.; Athanasiadis, V.; Mantiniotou, M.; Lalas, S.I. Optimization of Ultrasonication Probe-Assisted Extraction Parameters for Bioactive Compounds from Opuntia macrorhiza Using Taguchi Design and Assessment of Antioxidant Properties. Appl. Sci. 2024, 14, 10460. [Google Scholar] [CrossRef]
  23. Shehata, E.; Grigorakis, S.; Loupassaki, S.; Makris, D.P. Extraction Optimisation Using Water/Glycerol for the Efficient Recovery of Polyphenolic Antioxidants from Two Artemisia Species. Sep. Purif. Technol. 2015, 149, 462–469. [Google Scholar] [CrossRef]
  24. Thoo, Y.; Ng, S.Y.; Khoo, M.; Mustapha, W.; Ho, C. A Binary Solvent Extraction System for Phenolic Antioxidants and Its Application to the Estimation of Antioxidant Capacity in Andrographis paniculata Extracts. Int. Food Res. J. 2013, 20, 1103. [Google Scholar]
  25. Athanasiadis, V.; Chatzimitakos, T.; Makrygiannis, I.; Kalompatsios, D.; Bozinou, E.; Lalas, S.I. Antioxidant-Rich Extracts from Lemon Verbena (Aloysia citrodora L.) Leaves through Response Surface Methodology. Oxygen 2024, 4, 1–19. [Google Scholar] [CrossRef]
  26. Lee, J.-E.; Jayakody, J.T.M.; Kim, J.-I.; Jeong, J.-W.; Choi, K.-M.; Kim, T.-S.; Seo, C.; Azimi, I.; Hyun, J.; Ryu, B. The Influence of Solvent Choice on the Extraction of Bioactive Compounds from Asteraceae: A Comparative Review. Foods 2024, 13, 3151. [Google Scholar] [CrossRef]
  27. More, P.R.; Jambrak, A.R.; Arya, S.S. Green, Environment-Friendly and Sustainable Techniques for Extraction of Food Bioactive Compounds and Waste Valorization. Trends Food Sci. Technol. 2022, 128, 296–315. [Google Scholar] [CrossRef]
  28. Zhang, Z.; Li, X.; Sang, S.; McClements, D.J.; Chen, L.; Long, J.; Jiao, A.; Jin, Z.; Qiu, C. Polyphenols as Plant-Based Nutraceuticals: Health Effects, Encapsulation, Nano-Delivery, and Application. Foods 2022, 11, 2189. [Google Scholar] [CrossRef]
  29. Crupi, P.; Faienza, M.F.; Naeem, M.Y.; Corbo, F.; Clodoveo, M.L.; Muraglia, M. Overview of the Potential Beneficial Effects of Carotenoids on Consumer Health and Well-Being. Antioxidants 2023, 12, 1069. [Google Scholar] [CrossRef]
  30. Campos-Lozada, G.; Pérez-Marroquín, X.A.; Callejas-Quijada, G.; Campos-Montiel, R.G.; Morales-Peñaloza, A.; León-López, A.; Aguirre-Álvarez, G. The Effect of High-Intensity Ultrasound and Natural Oils on the Extraction and Antioxidant Activity of Lycopene from Tomato (Solanum lycopersicum) Waste. Antioxidants 2022, 11, 1404. [Google Scholar] [CrossRef]
  31. Munteanu, I.G.; Apetrei, C. Analytical Methods Used in Determining Antioxidant Activity: A Review. Int. J. Mol. Sci. 2021, 22, 3380. [Google Scholar] [CrossRef] [PubMed]
  32. Ninčević Grassino, A.; Ostojić, J.; Miletić, V.; Djaković, S.; Bosiljkov, T.; Zorić, Z.; Ježek, D.; Rimac Brnčić, S.; Brnčić, M. Application of High Hydrostatic Pressure and Ultrasound-Assisted Extractions as a Novel Approach for Pectin and Polyphenols Recovery from Tomato Peel Waste. Innov. Food Sci. Emerg. Technol. 2020, 64, 102424. [Google Scholar] [CrossRef]
Figure 1. The optimal extraction via the UBAE technique, depicted in 3D graphs, demonstrates the effects of process variables on the responses (TCC and DPPH). For TCC, plot (A) represents the covariation in X1 (liquid-to-solid ratio; R, mL/g) and X2 (extraction time; t, min); plot (B), the covariation in X1 and X3 (ultrasonic power; E, %); and plot (C), the covariation in X2 and X3. For DPPH, plot (D) represents the covariation in X1 and X2; plot (E), the covariation in X1 and X3; and plot (F), the covariation in X2 and X3.
Horticulturae 11 00071 g001
Figure 2. The optimal extraction via the STE technique, depicted in 3D graphs, demonstrates process variables’ effects on the responses (TCC and DPPH). For TCC, plot (A) represents the covariation in X1 (liquid-to-solid ratio; R, mL/g) and X2 (extraction time; t, min); plot (B), the covariation in X1 and X3 (extraction temperature; T, °C); and plot (C), the covariation in X2 and X3. For DPPH, plot (D) represents the covariation in X1 and X2; plot (E), the covariation in X1 and X3; and plot (F), the covariation in X2 and X3.
Horticulturae 11 00071 g002
Figure 3. Pareto plots represent the significance of each parameter estimate for the UBAE and STE techniques on TCC (A,B), and DPPH assays (C,D), respectively. A pink asterisk is included in the plot to denote the significance level (p < 0.05). Red bars show negative values, and blue bars show positive values.
Horticulturae 11 00071 g003
Figure 4. The optimization of UBAE and STE techniques from TPIW extracts is shown in plots (A) and (B), respectively, using a desirability function with extrapolation control and a partial least squares (PLS) prediction profiler. The variable importance plot (VIP) graph is shown in plots (C) and (D), which show the VIP values for each predictor variable in the UBAE and STE approaches, respectively. Each variable in plots (C,D) has a red dashed line at the 0.8 significance level.
Horticulturae 11 00071 g004
Figure 5. UV spectra of extracts from TPIW were obtained under optimal conditions using the UBAE and STE techniques with dilutions of 1:50 and 1:5, respectively. A lycopene standard at 3.5 mg/L was included for comparison.
Horticulturae 11 00071 g005
Figure 6. Principal component analysis (PCA) was used to compare the UBAE and STE techniques for extracting compounds from TPIW, focusing on the measured variables.
Horticulturae 11 00071 g006
Table 1. Experimental findings for the three investigated independent variables and the dependent variables’ responses to the UBAE technique.
Design PointIndependent VariablesResponses
TCC (μg LyE/g dw)DPPH (μmol AAE/g dw)
X1 (R, mL/g)X2 (t, min)X3 (E, %)Actual *PredictedActual *Predicted
11 (40)−1 (5)0 (80)164.9 ± 6.6241.76.56 ± 0.336.52
2−1 (10)1 (25)0 (80)325.4 ± 18.2287.34.28 ± 0.274.40
30 (25)0 (15)0 (80)115.4 ± 5.7122.05.30 ± 0.125.24
40 (25)1 (25)−1 (60)148.8 ± 8.6228.75.69 ± 0.336.11
5−1 (10)0 (15)−1 (60)294 ± 20222.73.06 ± 0.092.56
61 (40)0 (15)−1 (60)121.6 ± 8.871.06.84 ± 0.446.41
70 (25)0 (15)0 (80)119.8 ± 6.9122.05.36 ± 0.245.24
80 (25)−1 (5)−1 (60)121.2 ± 4.1146.05.15 ± 0.185.67
9−1 (10)−1 (5)0 (80)406.6 ± 13.4393.55.31 ± 0.395.26
100 (25)−1 (5)1 (100)475.7 ± 28.1387.26.59 ± 0.456.17
110 (25)0 (15)0 (80)113.5 ± 4.9122.05.07 ± 0.215.24
121 (40)1 (25)0 (80)143.9 ± 3.6135.55.68 ± 0.365.65
131 (40)0 (15)1 (100)141.1 ± 4.1123.22.50 ± 0.053.00
14−1 (10)0 (15)1 (100)152.4 ± 7.3275.03.91 ± 0.284.34
150 (25)1 (25)1 (100)125.5 ± 7.592.14.51 ± 0.124.00
* Values represent the mean of triplicate determinations ± standard deviation. UBAE, ultrasonic bath-assisted extraction; TCC, total carotenoid content; LyE, lycopene equivalents; DPPH, antiradical activity; AAE, ascorbic acid equivalents; dw, dry weight.
Table 2. Experimental findings for the three investigated independent variables and the dependent variables’ responses to the STE technique.
Design PointIndependent VariablesResponses
TCC (μg LyE/g dw)DPPH (μmol AAE/g dw)
X1 (R, mL/g)X2 (t, min)X3 (T, °C)Actual *PredictedActual *Predicted
11 (40)−1 (30)0 (50)442.1 ± 24.3504.021.01 ± 1.1619.61
2−1 (10)1 (90)0 (50)224.9 ± 13.5198.08.46 ± 0.279.03
30 (25)0 (60)0 (50)491.6 ± 16.7481.116.13 ± 0.5215.96
40 (25)1 (90)−1 (20)191.8 ± 5.6232.29.61 ± 0.449.79
5−1 (10)0 (60)−1 (20)97 ± 5.3101.05.84 ± 0.335.18
61 (40)0 (60)−1 (20)247.1 ± 17.5241.012.55 ± 0.712.32
70 (25)0 (60)0 (50)471 ± 17.4481.114.85 ± 0.6515.96
80 (25)−1 (30)−1 (20)177.7 ± 10.1139.410.41 ± 0.2611.00
9−1 (10)−1 (30)0 (50)254 ± 8.6270.810.76 ± 0.5710.24
100 (25)−1 (30)1 (80)691.3 ± 37.3650.921.69 ± 1.1722.13
110 (25)0 (60)0 (50)480.6 ± 26481.115.88 ± 0.8615.96
121 (40)1 (90)0 (50)483 ± 25.6431.217.81 ± 0.7318.40
131 (40)0 (60)1 (80)684.1 ± 30.8680.124.63 ± 0.4925.68
14−1 (10)0 (60)1 (80)347.6 ± 22.6353.713.49 ± 0.3514.10
150 (25)1 (90)1 (80)374 ± 20.6412.423.15 ± 1.7420.92
* Values represent the mean of triplicate determinations ± standard deviation. STE, stirring extraction; TCC, total carotenoid content; LyE, lycopene equivalents; DPPH, antiradical activity; AAE, ascorbic acid equivalents; dw, dry weight.
Table 3. Analysis of variance (ANOVA) was utilized for the response-surface quadratic polynomial model in the context of UBAE and STE techniques.
FactorUBAESTE
TCCDPPHTCCDPPH
Stepwise regression coefficients
Intercept121.97 *5.243 *481.07 *15.96 *
X1—liquid-to-solid ratio−75.86 *0.628 *116.60 *4.681 *
X2—extraction time−53.10−0.431−36.42−0.605
X3—ultrasonic power/temperature26.138−0.404172.93 *5.569 *
X1 × 2----
X1X3-−1.298 *46.61.107
X2X3−94.45 *−0.655−82.85 *-
X1251.004−0.597−72.41 *−1.641 *
X2291.529 *0.811 *−57.66-
X32-−0.569−64.71 *-
ANOVA
F-value (model)4.2368.04523.2568.1
F-value (lack of fit)744.3719.132.5653.334
p-value (model)0.0323 *0.0102 *0.0006 *<0.0001 *
p-value (lack of fit)0.0013 *0.0504 ns0.0300 *0.2501 ns
R20.7610.9150.9690.974
Adjusted R20.5810.8010.9270.960
RMSE76.3730.55348.3961.138
CV59.624.5547.5237.71
DF (total)14141414
* Values significantly affected responses at a probability level of 95% (p < 0.05). UBAE, ultrasonic bath-assisted extraction; STE, stirring extraction; TCC, total carotenoid content; DPPH, antiradical activity; ns, non-significant; F-value, test for comparing model variance with residual (error) variance; p-value, probability of seeing the observed F-value if the null hypothesis is true; RMSE, root mean square error; CV, coefficient of variation; DF, degrees of freedom.
Table 4. Optimal extraction conditions maximize predicted responses for the dependent variables.
TechniqueParametersIndependent VariablesDesirabilityStepwise
Regression
X1 (R, mL/g)X2 (t, min)X3 (E, %)
UBAETCC (μg LyE/g dw)105960.9576489.9 ± 145.5
DPPH (μmol AAE/g dw)405660.97616.97 ± 1.17
X1 (R, mL/g)X2 (t, min)X3 (T, °C)
STETCC (μg LyE/g dw)3737800.9946731.1 ± 100.4
DPPH (μmol AAE/g dw)3833800.994525.86 ± 1.97
UBAE, ultrasonic bath-assisted extraction; STE, stirring extraction; TCC, total carotenoid content; LyE, lycopene equivalents; DPPH, antiradical activity; AAE, ascorbic acid equivalents; dw, dry weight.
Table 5. The highest desirability for every variable under each optimal extraction condition for the UBAE and STE procedures was ascertained by the partial least squares (PLS) prediction profiler.
TechniqueIndependent VariablesPLS Model Values
X1 (R, mL/g)X2 (t, min)X3 (E, %)TCC (μg LyE/g dw)DPPH (μmol AAE/g dw)
UBAE105100514.056.24
X1 (R, mL/g)X2 (t, min)X3 (T, °C)
STE403080741.6926.28
UBAE, ultrasonic bath-assisted extraction; STE, stirring extraction; TCC, total carotenoid content; LyE, lycopene equivalents; DPPH, antiradical activity; AAE, ascorbic acid equivalents; dw, dry weight.
Table 6. Bioactive compounds and antioxidant activities were assessed under optimal conditions using the UBAE and STE techniques for TPIW extracts.
ParametersUBAESTE
TCC (μg LyE/g)420.8 ± 29.46723.75 ± 46.32 *
DPPH (μmol AAE/g)7.5 ± 0.5219.94 ± 0.98 *
FRAP (μmol AAE/g)4.76 ± 0.1516.68 ± 0.82 *
TPC (mg GAE/g)2.62 ± 0.053.69 ± 0.08 *
* Indicate the statistical significance differences when p < 0.05 for each row. UBAE, ultrasonic bath-assisted extraction; STE, stirring extraction; TCC, total carotenoid content; LyE, lycopene equivalents; DPPH and FRAP, antiradical activity; AAE, ascorbic acid equivalents; TPC, total polyphenol content; GAE, gallic acid equivalents; dw, dry weight.
Table 7. Optimal extraction conditions for phenolic compounds using the UBAE and STE techniques for TPIW extracts.
Phenolic Compounds (mg/g)UBAESTE
Non-Flavonoids
Coniferyl alcohol0.32 ± 0.010.38 ± 0.02 *
Syringic acid0.11 ± 0.01 *n.d.
4-Methylcatechol0.03 ± 00.11 ± 0 *
Ferulic acid0.07 ± 00.29 ± 0.02 *
trans-Cinnamic acid0.06 ± 00.37 ± 0.02 *
3,4,5—Trimethoxycinnamic acidn.d.0.07 ± 0 *
∑ Non-flavonoids0.59 ± 0.021.21 ± 0.08 *
Flavonoids
Rutin0.29 ± 0.010.46 ± 0.01 *
Naringin0.48 ± 0.020.92 ± 0.02 *
Naringin dihydrochalcone0.14 ± 0.010.39 ± 0.03 *
Naringenin0.12 ± 00.35 ± 0.03 *
∑ Flavonoids1.03 ± 0.042.13 ± 0.09 *
Total identified phenolics (TIP)1.62 ± 0.063.33 ± 0.17 *
* Indicates statistically significant differences when p < 0.05 for each row; n.d. means not detected. UBAE, ultrasonic bath-assisted extraction; STE, stirring extraction.
Disclaimer/Publisher’s Note: The statements, opinions and data contained in all publications are solely those of the individual author(s) and contributor(s) and not of MDPI and/or the editor(s). MDPI and/or the editor(s) disclaim responsibility for any injury to people or property resulting from any ideas, methods, instructions or products referred to in the content.

