Article

Synthesis and Application of Natural Deep Eutectic Solvents (NADESs) for Upcycling Horticulture Residues

by
Udodinma Jude Okeke
1,2,3,*,
Matteo Micucci
2,
Dasha Mihaylova
3,* and
Achille Cappiello
1
1
Department of Pure and Applied Science, University of Urbino Carlo Bo, 61029 Urbino, Italy
2
Department of Biomolecular Science, University of Urbino Carlo Bo, 61029 Urbino, Italy
3
Department of Microbiology and Biotechnology, University of Food Technologies, 4002 Plovdiv, Bulgaria
*
Authors to whom correspondence should be addressed.
Horticulturae 2025, 11(4), 439; https://doi.org/10.3390/horticulturae11040439
Submission received: 13 March 2025 / Revised: 16 April 2025 / Accepted: 17 April 2025 / Published: 19 April 2025

Abstract

:
Upcycling horticulture residues offers a sustainable solution to reduce environmental impact, maximize resource utilization, mitigate climate change, and contribute to the circular economy. We synthesized and characterized 14 natural deep eutectic solvents (NADESs) and applied them to upcycle horticulture residues, offering an innovative valorization approach. Using an initial many-factors-at-a-time (MFAT) screening followed by a rotatable central composite response surface methodology (RCCRSM) for optimization, quadratic models fitted the response data for all the synthesized NADESs given: TPC (R2 = 0.984, p < 0.0001), TFC (R2 = 0.9999, p < 0.0001), AA-CUPRAC (R2 = 0.918, p < 0.0001), FRAP (R2 = 1.000, p < 0001), and DPPH (R2 = 0.9992, p < 0.0001). An ultrasound temperature of 45 °C, extraction time of 5 min, solvent volume of 25 mL, and solvent concentration of 90% (v/v) were considered the optimal conditions for achieving maximum desirability (0.9936) for TPC yield. For TFC and CUPRAC, the optimal conditions were 30 °C, 5 min, 25 mL, and 90% (v/v), with maximum desirability values of 0.9003 and 1.00, respectively. The maximum desirability for FRAP (0.9605) was achieved under conditions of 45 °C, 25 min, 25 mL, and 50%, while DPPH had a maximum desirability of 0.9313, with 50 °C, 15 min, 15 mL, and 70% (v/v) as the optimized conditions.

Graphical Abstract

1. Introduction

The growing concern over environmental sustainability has driven the need for innovative strategies to manage waste, particularly in industries such as horticulture, where large quantities of plant residues are produced annually [1]. Traditionally, these horticultural by-products, including leaves, stems, trimmings, stalks, and peels, are discarded, contributing to landfills and environmental degradation [2]. However, recent advances in green chemistry have introduced promising solutions, one of the most notable being the use of natural deep eutectic solvents (NADESs) for the valorization of agrifood wastes, including horticulture residues [3]. NADESs, a class of environmentally pleasant solvents, are composed of natural, biodegradable, and non-toxic components such as sugars, amino acids, organic acids, and salts [4]. These solvents exhibit remarkable properties, including tunable solubility, low toxicity, and the ability to dissolve a wide range of biomolecules, making them ideal candidates for efficient extraction processes [5].
The application of NADESs for upcycling horticultural residues represents a groundbreaking approach to valorizing plant waste [4,6,7,8]. By harnessing the unique solvent properties of NADESs, valuable bioactive compounds, such as antioxidants, phenolic acids, essential oils, and polysaccharides, can be extracted from horticultural waste with minimal environmental impact [9,10]. This sustainable method not only mitigates the disposal of agricultural waste but also opens new avenues to produce bio-based products in sectors such as food, cosmetics, and pharmaceuticals [11,12]. Moreover, the versatility of NADESs, coupled with their low environmental footprints, makes them a crucial tool in the development of a circular economy, where waste is transformed into valuable resources, reducing dependency on synthetic chemicals and promoting eco-friendly industrial processes [13,14].
Therefore, NADESs offer a range of remarkable benefits that make them a compelling alternative to traditional solvents. Their environmentally friendly, biodegradable, and non-toxic nature, combined with their ability to dissolve a wide range of compounds, makes them highly useful across many industries. Whether in pharmaceuticals, food processing, biotechnology, or green chemistry, NADESs contribute to safer, more sustainable practices while maintaining the high efficiency, performance, and improved stability of bioactive compounds [15,16].
In the present study, we synthesized 14 different novel deep eutectic solvents (NADESs) using citric acid as a hydrogen bond acceptor (HBA) and sucrose, fructose, glucose, glycerol, glycine, and xylitol as hydrogen bond donors (HBDs) and applied the NADESs in upcycling horticultural residues, exploring their potential to revolutionize waste management, enhance resource recovery, and contribute to a sustainable, green future. By integrating NADESs into the upcycling process, we can not only address the growing issues of horticultural waste but also create high-value products that benefit both the environment and society.

2. Materials and Methods

2.1. Materials

2.1.1. Chemicals

All the chemicals and solvents used were of analytical grade and standard grade. Citric acid monohydrate (≤100% purity), sucrose (99.8% purity), glucose monohydrate (99.0% purity), fructose (98.5–101.2% purity), xylitol (99% purity), glycerol (99–101% purity), sodium carbonate (99% purity), sodium acetate (99% purity), potassium acetate (99% purity), iron (iii) chloride hexahydrate (99% purity), and 2,2-diphenyl-1-picrylhydrazyl (DPPH) (99% purity) were supplied by Sigma-Aldrich, Munich, Germany; glycine (99% purity) and potassium persulfate (≥99% purity) were supplied by Fluka Analytica, Frankfurt, Germany; methanol (HPLC grade) (≥99.9% purity) was supplied by Sigma-Aldrich, St. Quentin Fallavier, France; ethanol (96% purity) was purchased from Fillab, Plovdiv, Bulgaria; ammonium acetate (≥98% purity) was supplied by Sigma-Aldrich, Amsterdam, the Netherlands; 2,4,6-tris(2-pyridyl)-s-triazine (TPTZ) (≥99% purity) and the Folin–Ciocalteu phenol reagent were supplied by Sigma-Aldrich, Buchs, Switzerland; copper (ii) chloride (99% purity) was bought from Sigma-Aldrich, Suffolk, UK; aluminum (iii) nitrate nonahydrate (98.5% purity) was purchased from Chem-Lab NV, Zedelgem, Belgium; Neocuprine (99.9% purity) was supplied by Sigma-Aldrich, Vienna, Austria; and (±)-6-hydroxy-2,5,7,8-tetramethylchromane-2-carboxylic acid (Trolox) (≥99% purity) and 3,4,5-trihydroxybenzoic acid (gallic acid) (99% purity) were purchased from Sigma-Aldrich, Milano, Italy. Water was purified using a Milli-Q Plus 185 system from Millipore (Milford, MA, USA).

2.1.2. Horticulture Residue

The horticulture residue used in this study was peels from dried seeds of African nutmeg fruits from the 2022 harvest, which were purchased from Zuba Fruit Market, Abuja, Nigeria. The seeds were cleaned, packed under vacuum following WTO guidelines on sanitary and phytosanitary measures as provided by the Standards Organisation of Nigeria (https://epingalert.org/, accessed on 22 August 2023), and brought to the Biotechnology Laboratory at the University of Food Technologies, Plovdiv, Bulgaria. In the laboratory, the seeds were peeled, and the peels collected and grind into powder with an electric coffee grinder. The ground peels were passed through Gilson’s laboratory shakers (Gilson, OH, USA). Those that passed through sieve No. 4 (4.75 mm) and lower were collected, packed, vacuum-sealed, and stored in a desiccator until further use [17]. African nutmeg (Monodora myristica (Gaertn.) Dunal) was first described by Joseph Gaertner as Annona myristica in 1791 and was later transferred to the genus Monodora by Michael Felix Dunal in 1817, and it has retained the latter genus till this day [18]. A voucher specimen is presented in Supplementary Materials as Specimen S1.

2.2. Methodology

2.2.1. Preparation of Natural Deep Eutectic Solvents (NADESs)

An ultrasound-assisted technique for the synthesis of NADESs was first screened with a general factorial experimental design with three factors at three levels to obtain a total of 27 experimental runs as shown in Table 1 for coded and uncoded display. The NADESs were synthesized by weighing the designated mole ratios of the HBA and HBD (1:1, 1:2, 2:1) into a synthesis bottle, and then 5 mL of distilled water was added to moisten the two materials. The bottle was vigorously shaken to mix them into a homogenous mixture before sonicating in an ultrasonic bath operated at a frequency of 35 kHz with a maximum input power of 240 w (USTS 5.7150 Siel, Gabrovo, Bulgaria) at three designed temperatures (50, 70, 90 °C) and three designated times (60, 90, 120 min) with intermittent vigorous stirring to achieve uniformity. The three sonication temperatures, and three sonication times were selected for the synthesis based on information found in the literature for the synthesis of NADESs using heating and stirring (3–6 h) [19,20], rotary evaporation (1–3 h) [21,22], freeze-drying (24–48 h) [21], and microwave radiation (0.25–0.75 h) [23,24]. At the end of each synthesis time, using the corresponding temperature, the solvent was observed for proper and complete solvation. Those that did not solvate completely were further sonicated for a quarter of the experimental time at that temperature. After the extra sonication time, those that still failed to form clear solvents were discarded. The synthesis was taken to be successful when clear solutions were obtained after 24 h of sonication, cooling, and storing in a desiccator to minimize moisture absorption. The temperature and time values that were appropriate for the screening study were then applied to different HBA–HBD ratios following the same steps. Using an infrared drier (Labtech, Munchen, Germany), the water content in the solvents were measured and ranged from 0.25–1.05% depending on the molar ratio and the type of HBD used.

2.2.2. Characterization of NADESs

The synthesized NADESs were characterized to understand their physical, chemical, and thermodynamic properties, which can vary significantly depending on their components and composition. Specifically, the density, viscosity, water activity, pH, and molecular interactions within the NADESs were measured to properly characterize the solvents.

Density

Density measurements help in understanding the intermolecular interactions within the NADES and how the components’ molecular weights and structure impact the overall density of the solvent. This information is valuable for calculating the solvent’s potential to dissolve various solutes. In this study, the density of the samples was measured at 25 °C in triplicate using a glass pycnometer following Equation (1):
ρ s = d × ρ w   ( k g m 3 )
where
ρs = density of sample; d = relative density of the sample to water = ms/mw; ρw = 0.997 at 25 °C taken from the appropriate table.

Water Activity

The digital water activity meter Amtast wa-60a (Amtast, Qingdao, China) was used to measure the water activity of the samples in triplicate at 25 °C.

Viscosity

The viscosity of NADESs is a critical property for their performance in various applications, such as extraction and catalysis. Viscosity measurements, typically conducted using rheometers or viscometers, reveal how the molecular structure and the ratio of components influence the flow behavior. The viscosity of the samples at 25 °C was measured in triplicate using a glass pycnometer and calculated using Equation (2):
ɳ s = ɳ w ρ s t s ρ w t w   ( p a . s )  
where
ɳs = viscosity of the sample in [pa.s]; ts = average time for which the sample flows out (s); ɳw = viscosity of distilled water obtained from the table (0.89 mpa.s at 25 °C); ρw = density of distilled water obtained from the table (0.997 kg/m3 at 25 °C); tw = average time for which the water flows out (s).

pH

An Orion 2 digital pH meter Thermo Scientific (Langenselbold, Germany) was used to measure the pH of the synthesized NADESs in triplicate at 25 °C.

Spectroscopic Technique

Infrared spectroscopy (FTIR) was used to investigate the molecular interactions within the NADESs. This technique helps to identify the nature of solute–solvent interactions, the presence of any functional groups in the solvent mixture, and the hydrogen bonding, which is a principal characteristic of the NADES structure.

2.3. Application of NADESs for Bioactive Molecule Extraction

2.3.1. Experimental Design

A many-factors-at-a-time (MFAT) screening design with 24 fractional factorial experiment (FFE) of eight (8) corners and two (2) central points was carried out to study the effects of the extraction conditions on the phenolic content and the antioxidant activity of the African nutmeg peel (ANP) extracts (Table 2), and the process further developed with a rotatable central composite response surface methodology (RCCRSM) with four factors at five levels, following the desirability function where maximal extraction and antiradical activities were the desired outcomes. The RCCRSM design is presented in Table 3. The extraction yield was calculated using Equation (3), with Equation (4) used to determine the level of the independent factors.
The independent variables chosen are temperature (UT), time (ET), volume (SV), and concentration (SC), while the dependent variables are total phenolic content (TPC), total flavonoid content (TFC), cupric ion reducing antioxidant capacity (CUPRAC), ferric reducing antioxidant power (FRAP), and 2,2-diphenyl-2-picrylhydrazyl (DPPH) inhibition. A total of 90 experimental runs with 48 cube points, 18 center points (12 on cube, and 6 on axial), and 24 axial points were performed based on a rotatable central composite design of 30 base experiments replicated three times. The RCCRSM was chosen because orthogonality was absent among the models from our prior investigations [3], leading us to select the RCCRSM for its efficiency in optimization experiments under such conditions, as described by Montgomery [25].
Y = β O + i = 1 3 β i X i + i = 1 3 β i i X i i + i = 1 2 . j = 2 3 β i j X i X j + ε
where
βo is the intercept, βi is the linear slope, βii is the quadratic slope, and βij is the interaction slope, all relative to the dependent variable Y. Xi and Xj are the levels of the independent variables coded according to Equation (4):
X i = x i x m i x i
where
xi and Xi represent the real and coded values of the independent variables i, respectively, xmi represents the value of the independent variable i at the central point, and Δxi refers to the step change of the independent variable i.

2.3.2. Optimization

To optimize the operational parameters involved in the extraction process, the desirability function methodology [26,27] was used. The main concept of this method is to calculate a desirability value for each of the k responses as an indicator of how closely the fitted value aligns with the desired value at the optimal factor settings. These individual desirability values are then combined to create an overall desirability for a set of k response variables. The desirability function operates on a scale ranging from zero, representing a completely undesirable response, to one, indicating a fully desired outcome.
In the present study, the optimization objective is to simultaneously maximize the responses of TPC, TFC, and AA measured using CUPRAC and FRAP with respect to the independent variables UT, ET, SV, and SC. For each of the three responses, the minimum and maximum acceptable values correspond to the minimum and maximum experimental values obtained from the extraction experiments. Predicted values obtained from the model of the response k (yk) were converted to individual desirability values (dk) using Equation (5):
d k = 0 1 y k y k m i n y k m a x y k m i n
where
ykmin and ykmax are the minimum and maximum acceptable values of the response k, respectively. The overall desirability function (D) is defined as the geometric mean of the three individual desirability functions (d1, d2, and d3), given by Equation (6):
D = d 1 d 2 d 3 3

2.4. Extraction Procedure

Ground ANP (1.0 g) was weighed in synthesis bottles, and an appropriate volume of appropriate solvent (NADES) diluted with distilled water to achieve the appropriate concentration was added. The samples were irradiated at the designed temperature and time using an ultrasonic bath operated at a frequency of 35 kHz with a maximum input power of 240 W (USTS 5.7-150 Siel, Gabrovo, Bulgaria) with automatic temperature control. At the end of each extraction, the bottles were removed from the bath, and the contents transferred to centrifuge tubes and centrifuged at 4500 rpm for 10 min (centrifuge MPW-260R Labtech, Munchen, Germany). The supernatants were further filtered into solvent bottles using Whatman No. 1 filter paper (11 µm pore size). The bottles were sealed and kept in a refrigerator at −4 °C until further analysis.

2.5. Antioxidant Power

2.5.1. Total Phenolic Content (TPC)

The TPC assay was performed spectrophotometrically by modifying the Folin–Ciocalteu (F-C) reagent method presented by Ianni et al. [28]. In a reaction tube, 0.1 mL of extract samples were mixed with 0.5 mL of F-C reagent. After approximately 1 min, 0.4 mL of 7.5% Na2CO3 was added, the mixture was incubated at 50 °C for 5 min, the absorbance was measured using a microplate reader (SPECTROstar Nano Microplate Reader, BMG LABTECH, Ortenberg, Germany) at 765 nm against an appropriate blank sample, and the TPC was evaluated using a gallic acid standard curve and reported in mgGAE/g dry weight of sample using Equation (7):
T P C = Y 0.04 0.0204 × D × C B × 1000 D W
where
Y = area of the standard curve measured at 765 nm; B = weight of the sample used in the extraction; C = volume of the solvent used in the extraction; D = dilution factor (where applicable); DW = dry weight of sample

2.5.2. Total Flavonoid Content (TFC)

The TFC was evaluated according to the method described by Kivrak et al., with minor adjustments [29]. In Eppendorf tubes (2 mL), aliquots of 0.25 mL of the extracts were added to 0.025 mL of 10% Al(NO2)3, 0.025 mL of 1 M CH3COOK, and 0.95 mL of ethanol. The mixture was incubated at room temperature (RT) for 40 min, after which the absorbance was read at 415 nm using a microplate reader (SPECTROstar Nano Microplate Reader, BMG LABTECH, Ortenberg, Germany) against the designated blank control. The TFC calibration curve was determined by relying on the quercetin equivalence (QE) and was used as a standard to calibrate and standardize the spectrophotometric measurements.
Equation (8) was used to determine and express the TFC in microgram equivalent of quercetin per gram of dry sample (µgQE/g, DW):
T F C = Y 0.0075 0.0128 × D × C B D W
where
Y = area of the standard curve measured at 415 nm; B = weight of the sample used in the extraction; C = volume of the solvent used in the extraction; D = dilution factor (where applicable).

2.6. Antiradical Scavenging Activities

2.6.1. Ferric Reducing Antioxidant Power (FRAP)

The FRAP assay was carried out according to the procedure of Benzie and Strain as slightly modified in subsequent studies [30,31]. The FRAP reagent was prepared fresh each day and warmed up to 37 °C before use. The FRAP reagent consists of (1) 300 mM acetate buffer (pH 3.6), (2) TPTZ (10 mM in 40 mM HCl), and (3) FeCl3.6H2O (20 mM). Solutions (1), (2), and (3) were mixed at a ratio of 10:1:1 to form the FRAP reagent. In a 15 mL tube, 2.85 mL of freshly prepared and warmed FRAP reagent was blended with 0.15 mL of sample and incubated at 37 °C for 4 min, after which the absorbance was measured at 593 nm using a microplate reader (SPECTROstar Nano Microplate Reader, BMG LABTECH, Ortenberg, Germany) against the appropriate blank. The result is expressed as µMTE/g dry sample derived from Equation (9):
F R A P = Y + 0.0017 0.0013 × D × C B D W
where
Y = area of the standard curve measurement at 593 nm; B = weight of the sample used in the extraction; C = volume of the solvent used in the extraction; D = dilution factor where applicable.

2.6.2. Cupric Ion Reducing Antioxidant Capacity (CUPRAC) Assay

The CUPRAC assay was performed according to the procedure of Apak et al., as described by Akyuz et al. [32,33], with slight modifications. Briefly, 0.25 mL of 1.0 × 10⁻² M copper (II) chloride solution, 7.5 × 10⁻³ M Neocuprine (Nc), 1 M CH2COONH4 buffer (pH 7.0) solution, and distilled water were mixed in a 2 mL Eppendorf tube, after which 0.025 mL sample was added and mixed. The resultant mixtures were allowed to stand at RT for 30 min to incubate. At the end of the incubation period, absorbance was measured at 450 nm against the blank using a microplate reader (SPECTROstar Nano Microplate Reader, BMG LABTECH, Ortenberg, Germany). Trolox was used to prepare a standard curve, and the total antioxidant capacities of the samples were calculated following Equation (10) and expressed as μMTE/g dry weight (DW):
C U P R A C = Y + 0.0372 0.4128 × C × D B D W
where
Y = area of the standard curve measured at 450 nm; B = weight of the sample used in the extraction; C = Volume of the solvent used in the extraction; D = dilution factor where applicable.

2.6.3. 2,2-Diphenyl-2-Picrylhydrazyl (DPPH) Assay

The antiradical scavenging activity of the extracts was performed using 2,2-diphenyl-2-picrylhydrazyl (DPPH) based on the method of Brands-Williams et al. [34], with adjustments for specificity to our samples. To prepare the DPPH stock solution, we dissolved 24 mg of DPPH in 100 mL of methanol. This solution was then diluted to achieve an absorbance of 1 ± 0.02 using the spectrophotometer (SPECTROstar Nano Microplate Reader, BMG LABTECH, Ortenberg, Germany). For the assay, we combined 40 microliters of extract with 3 mL of the prepared DPPH working solution and kept it in the dark for 30 min at room temperature. Subsequently, we measured the absorbance at 515 nm using a spectrophotometer (SPECTROstar Nano Microplate Reader, BMG LABTECH, Ortenberg, Germany) to assess the reduction in DPPH concentration, indicative of the antiradical activity (ARA), utilizing Equation (11):
a r a % = A C A S A C × 100 D W
where
ARA (%) = antiradical activity; AC = absorbance of the control; AS = absorbance of the sample.

2.7. Statistical Analysis

The analysis of variance technique was used to calculate the RCCRSD statistical parameters. For building the model, calculating the predicted values and optimal desirability for each of the solvents, plotting three-dimensional surface graphs to show the effects of independent variables on the response factors, calculating regression equations for the best-fitted model having non-significant lack of fit with effect to pure error, the response optimizer, and every other data analysis, Minitab statistical software 21.4.0 (Minitab LLC, State College, PA, USA) was used. The Fisher least significant difference (LSD) test value (F-value), coefficient of determination R2 and lack of fit were used to determine the quality and adequacy of the model at (p > 0.05).

3. Results

3.1. Synthesis of NADESs

The NADESs were synthesized with citric acid as HBA and sucrose, fructose, xylitol, glycerol, glycine, and glucose as HBDs at three different molar ratios: 1:1, 1:2, and 2:1, respectively. Based on the preliminary studies, other molar ratios were eliminated from the study. In the preliminary investigation, three ultrasonic temperature ranges (50 °C, 70 °C, and 90 °C), three time intervals (60 min, 45 min, and 30 min), and six molar ratios of HBA and HBD (1:1, 1:2, 1:3, 2:1, 2:3, and 3:1) were tested before selecting the promising molar ratios and operating temperature and time. Table 4 shows the 14 NADESs that were successfully synthesized from the study.

3.2. Characterization of NADESs

3.2.1. Physical Properties

The physical properties (density, water activity, viscosity, and pH) of the synthesized NADESs were measured in triplicate and analyzed using a one-way analysis of variance and Fisher’s least significant difference (LSD) to compare and separate the NADESs into groups to further investigate if similarity in the physical properties could lead to similarity in performance of the solvents during application. The physical properties of the synthesized NADESs are shown in Table 5.

3.2.2. Molecular Properties

FTIR spectroscopy was employed to identify the chemical structure of the NADES and validate the presence of hydrogen bonding between the hydrogen bond donor and hydrogen bond acceptor in NADES molecules. FTIR analysis was used to identify chemical structures and confirm the existence of intermolecular bonds among the individual components of mixtures. In this study, citric acid was used as the hydrogen bond acceptor, while sucrose, fructose, xylitol, glycerol, glycine, and glucose were applied as hydrogen bond donors. The synthesized NADESs show the presence of the following prominent characteristic functional groups in the FTIR peaks: OH (3400–3200 cm−1), CH (3000–2800 cm−1), and so on, and are presented in Table 6. The FTIR spectra of individual NADES are presented as Supplementary Figure S1 (SF S1) in Supplementary Materials.

3.3. Application of NADESs for Extraction

3.3.1. Extraction Yields

A multifactorial (MFAT) model was first designed to investigate the effects of conditions on the capacity of the synthesized NADESs to extract bioactive compounds from ANP. The antioxidant and antiradical scavenging activities of the extracts under the applied conditions were also investigated. The use of the MFAT model in the NADES-UAE study highlights an innovative approach, bridging the gap between traditional extraction methods and modern, sustainable techniques. Antioxidant capacity was measured in terms of total polyphenol content (TPC) and total flavonoid content (TFC) via spectrophotometric methods. The antiradical scavenging power of the extracts was analyzed via the cupric ion reducing antioxidant capacity (CUPRAC) assay and the ferric reducing antioxidant power (FRAP) assay. The results of the MFAT modeling are presented in Table 7.

3.3.2. Effects of Extraction Conditions on Antioxidant Yield

Different factors affecting the efficiency of NADES-UAE extraction, including the temperature (UT), time (ET), volume (SV), and concentration (SC), were studied together on the yield of the antioxidants using the MFAT model. Detailed factor effects are presented as contour plots in Supplementary Documents as Supplementary Plots (SPs).

Effects of Extraction Conditions on TPC

Figure 1 shows the TPC of extracts from the ANP using the synthesized NADESs. The extraction efficiency of all the synthesized NADESs differed significantly based on extraction conditions (p ≤ 0.5). CaFr12 and CaFr11 (908 mg GAE/g DW and 860 mg GAE/g DW, respectively) showed superior TPC extraction efficiency under conditions of UT 40 °C, ET 20 min, SV 20 mL, and SC 60%, while the least efficient TPC extraction conditions were UT 40 °C, ET 10 min, SV 20 mL, and SC 80%, which yielded less than 100 mg GAE/g DW across most of the synthesized NADESs.
In relation to the influence of the HBD and/or HBA–HBD ratios used to prepare the NADES on TPC extraction, fructose performed the best among the HBDs used, while the HBA–HBD ratios of 1:1 and 1:2 proved to be a good combination.

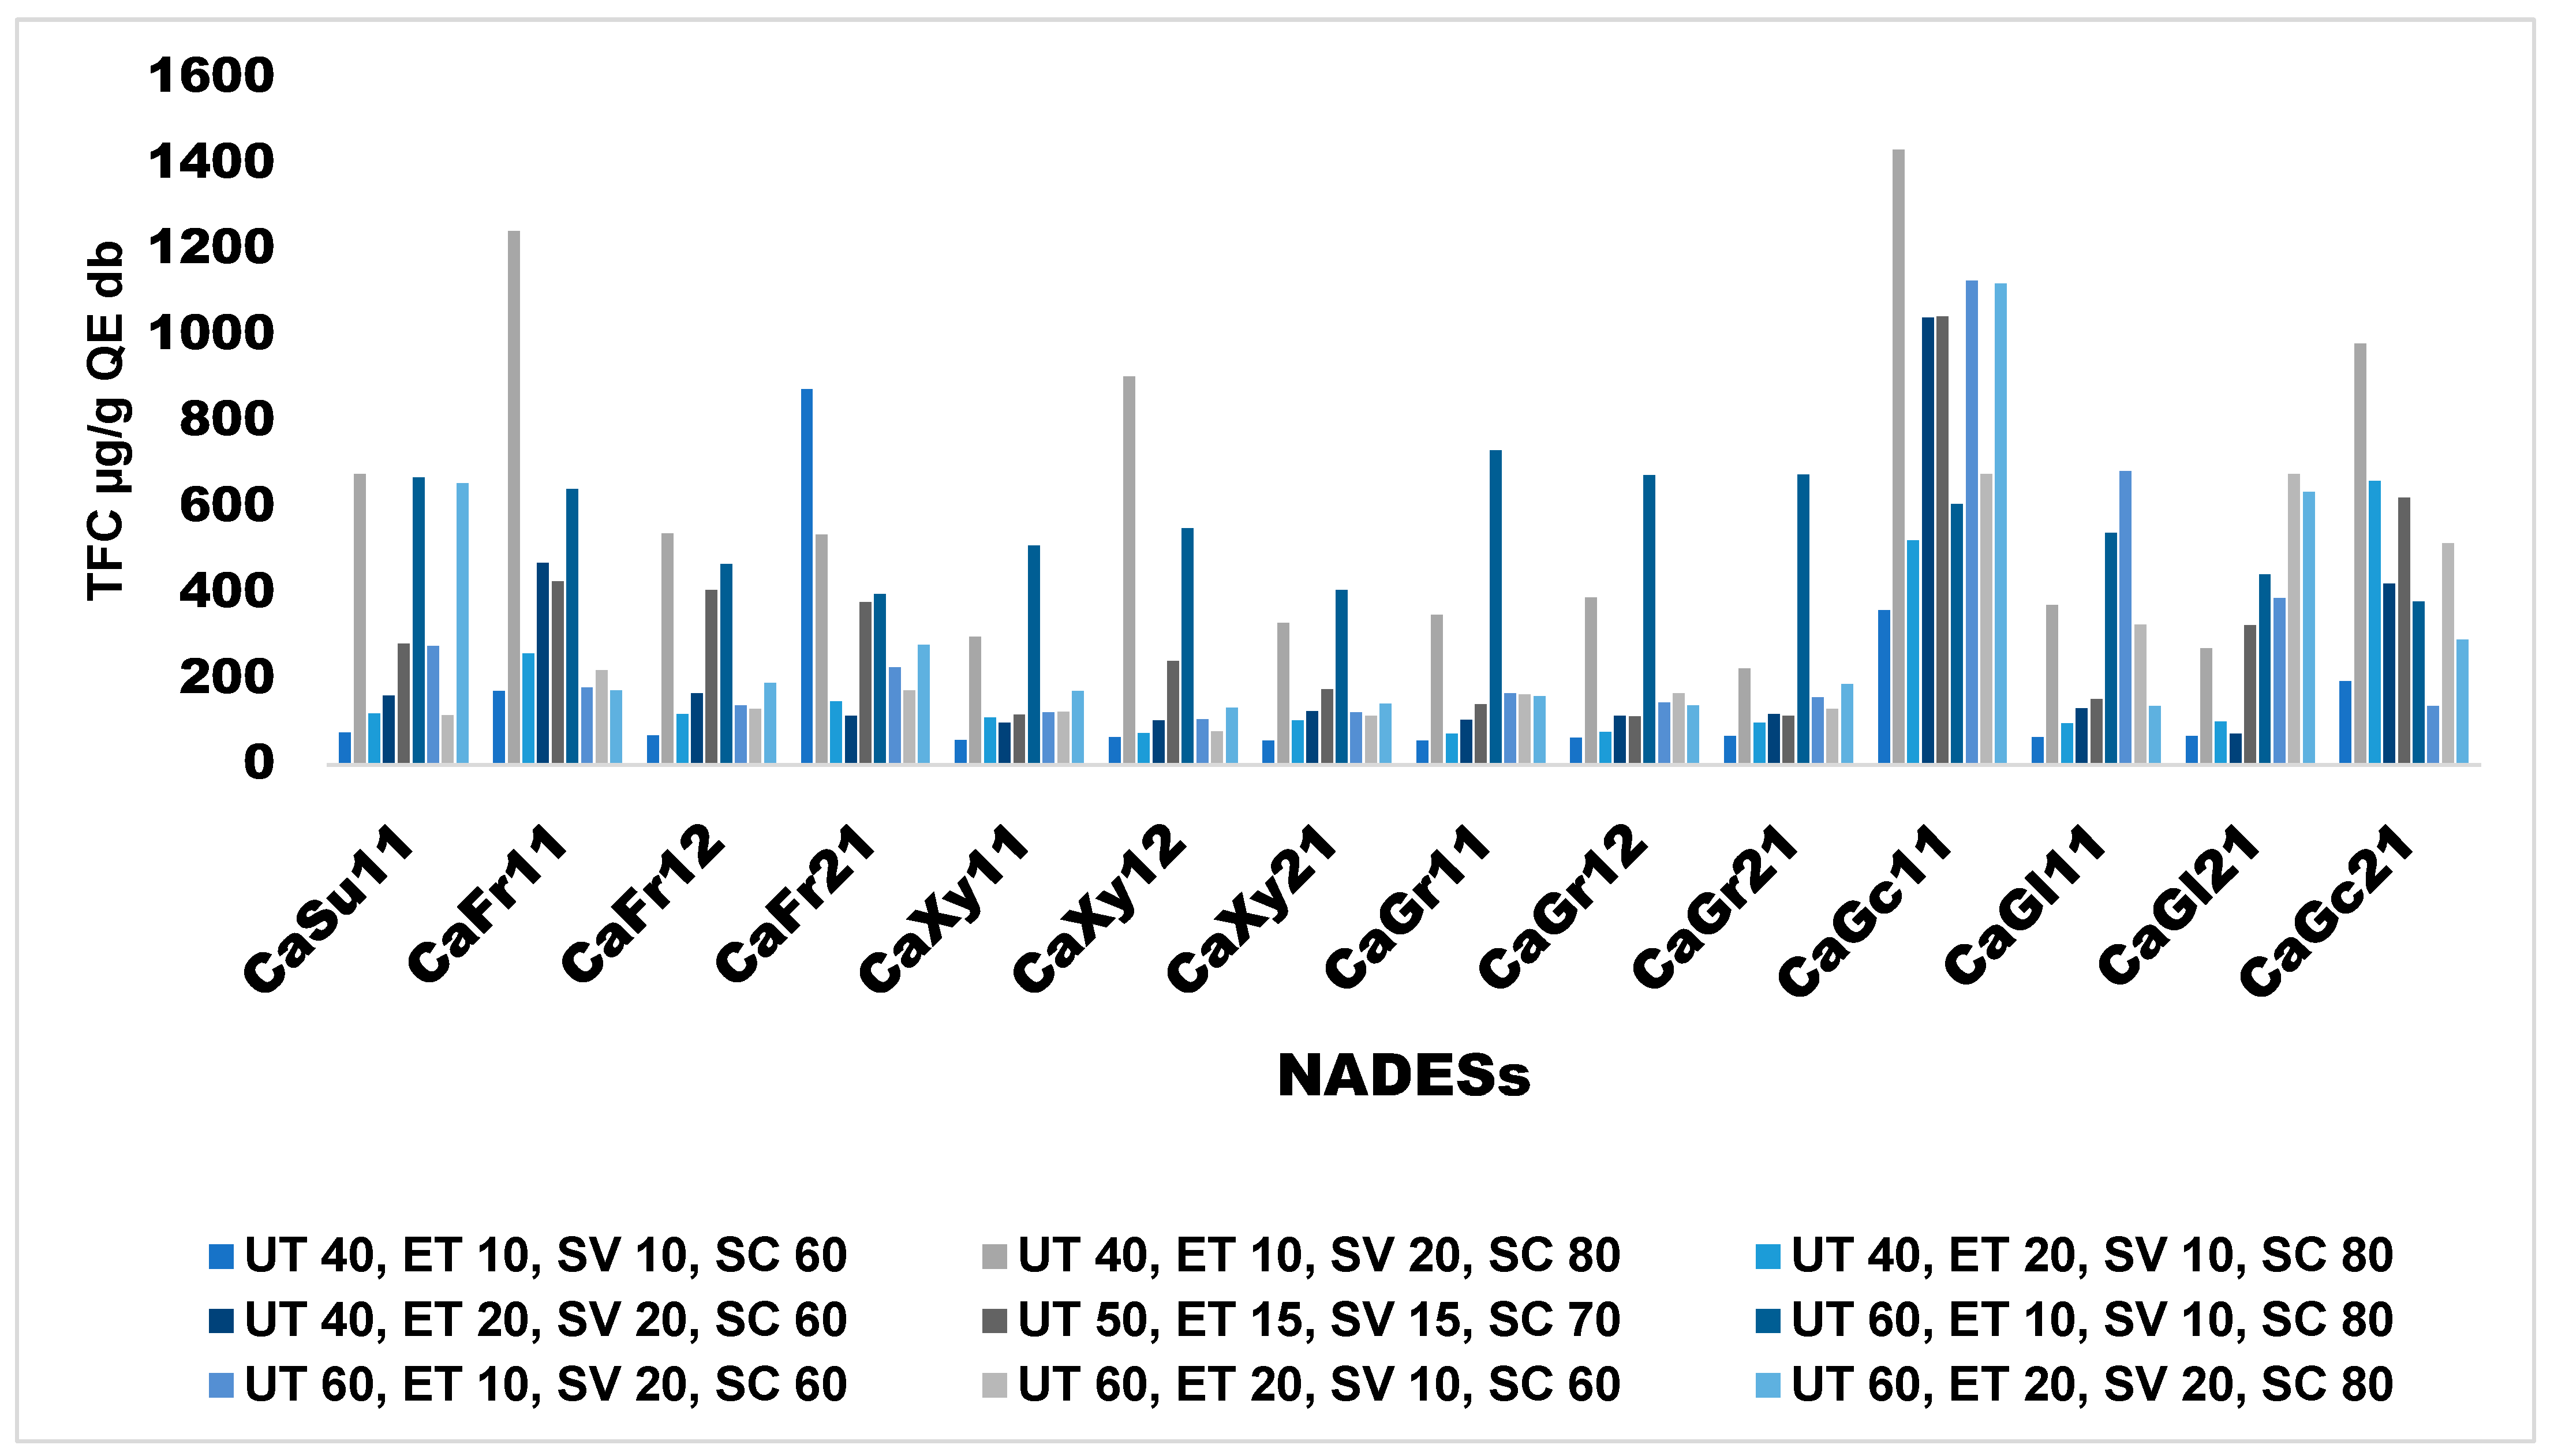
Effects of Extraction Conditions on TFC

The effects of extraction conditions on the TFC of ANP are presented in Figure 2. In terms of TFC, the most efficient conditions for extraction were UT 40 °C, ET 10 min, SV 20 mL, and SC 80%. Moreover, NADESs synthesized with different HBDs showed outstanding efficiency at the above conditions for TFC extraction, as can be seen with CaFr11, Caxy12, CaGc11, and CaGc21, yielding above 800 µg/g QE DW each. However, the best-performing NADES for TFC extraction is CaGc11, which yields more than 1200 µg/g QE DW.

3.3.3. Effects of Extraction Conditions on Antiradical Scavenging Activity

The effects of the various extraction conditions on the antiradical scavenging activity of the extracts were equally elucidated using the same MFAT model.

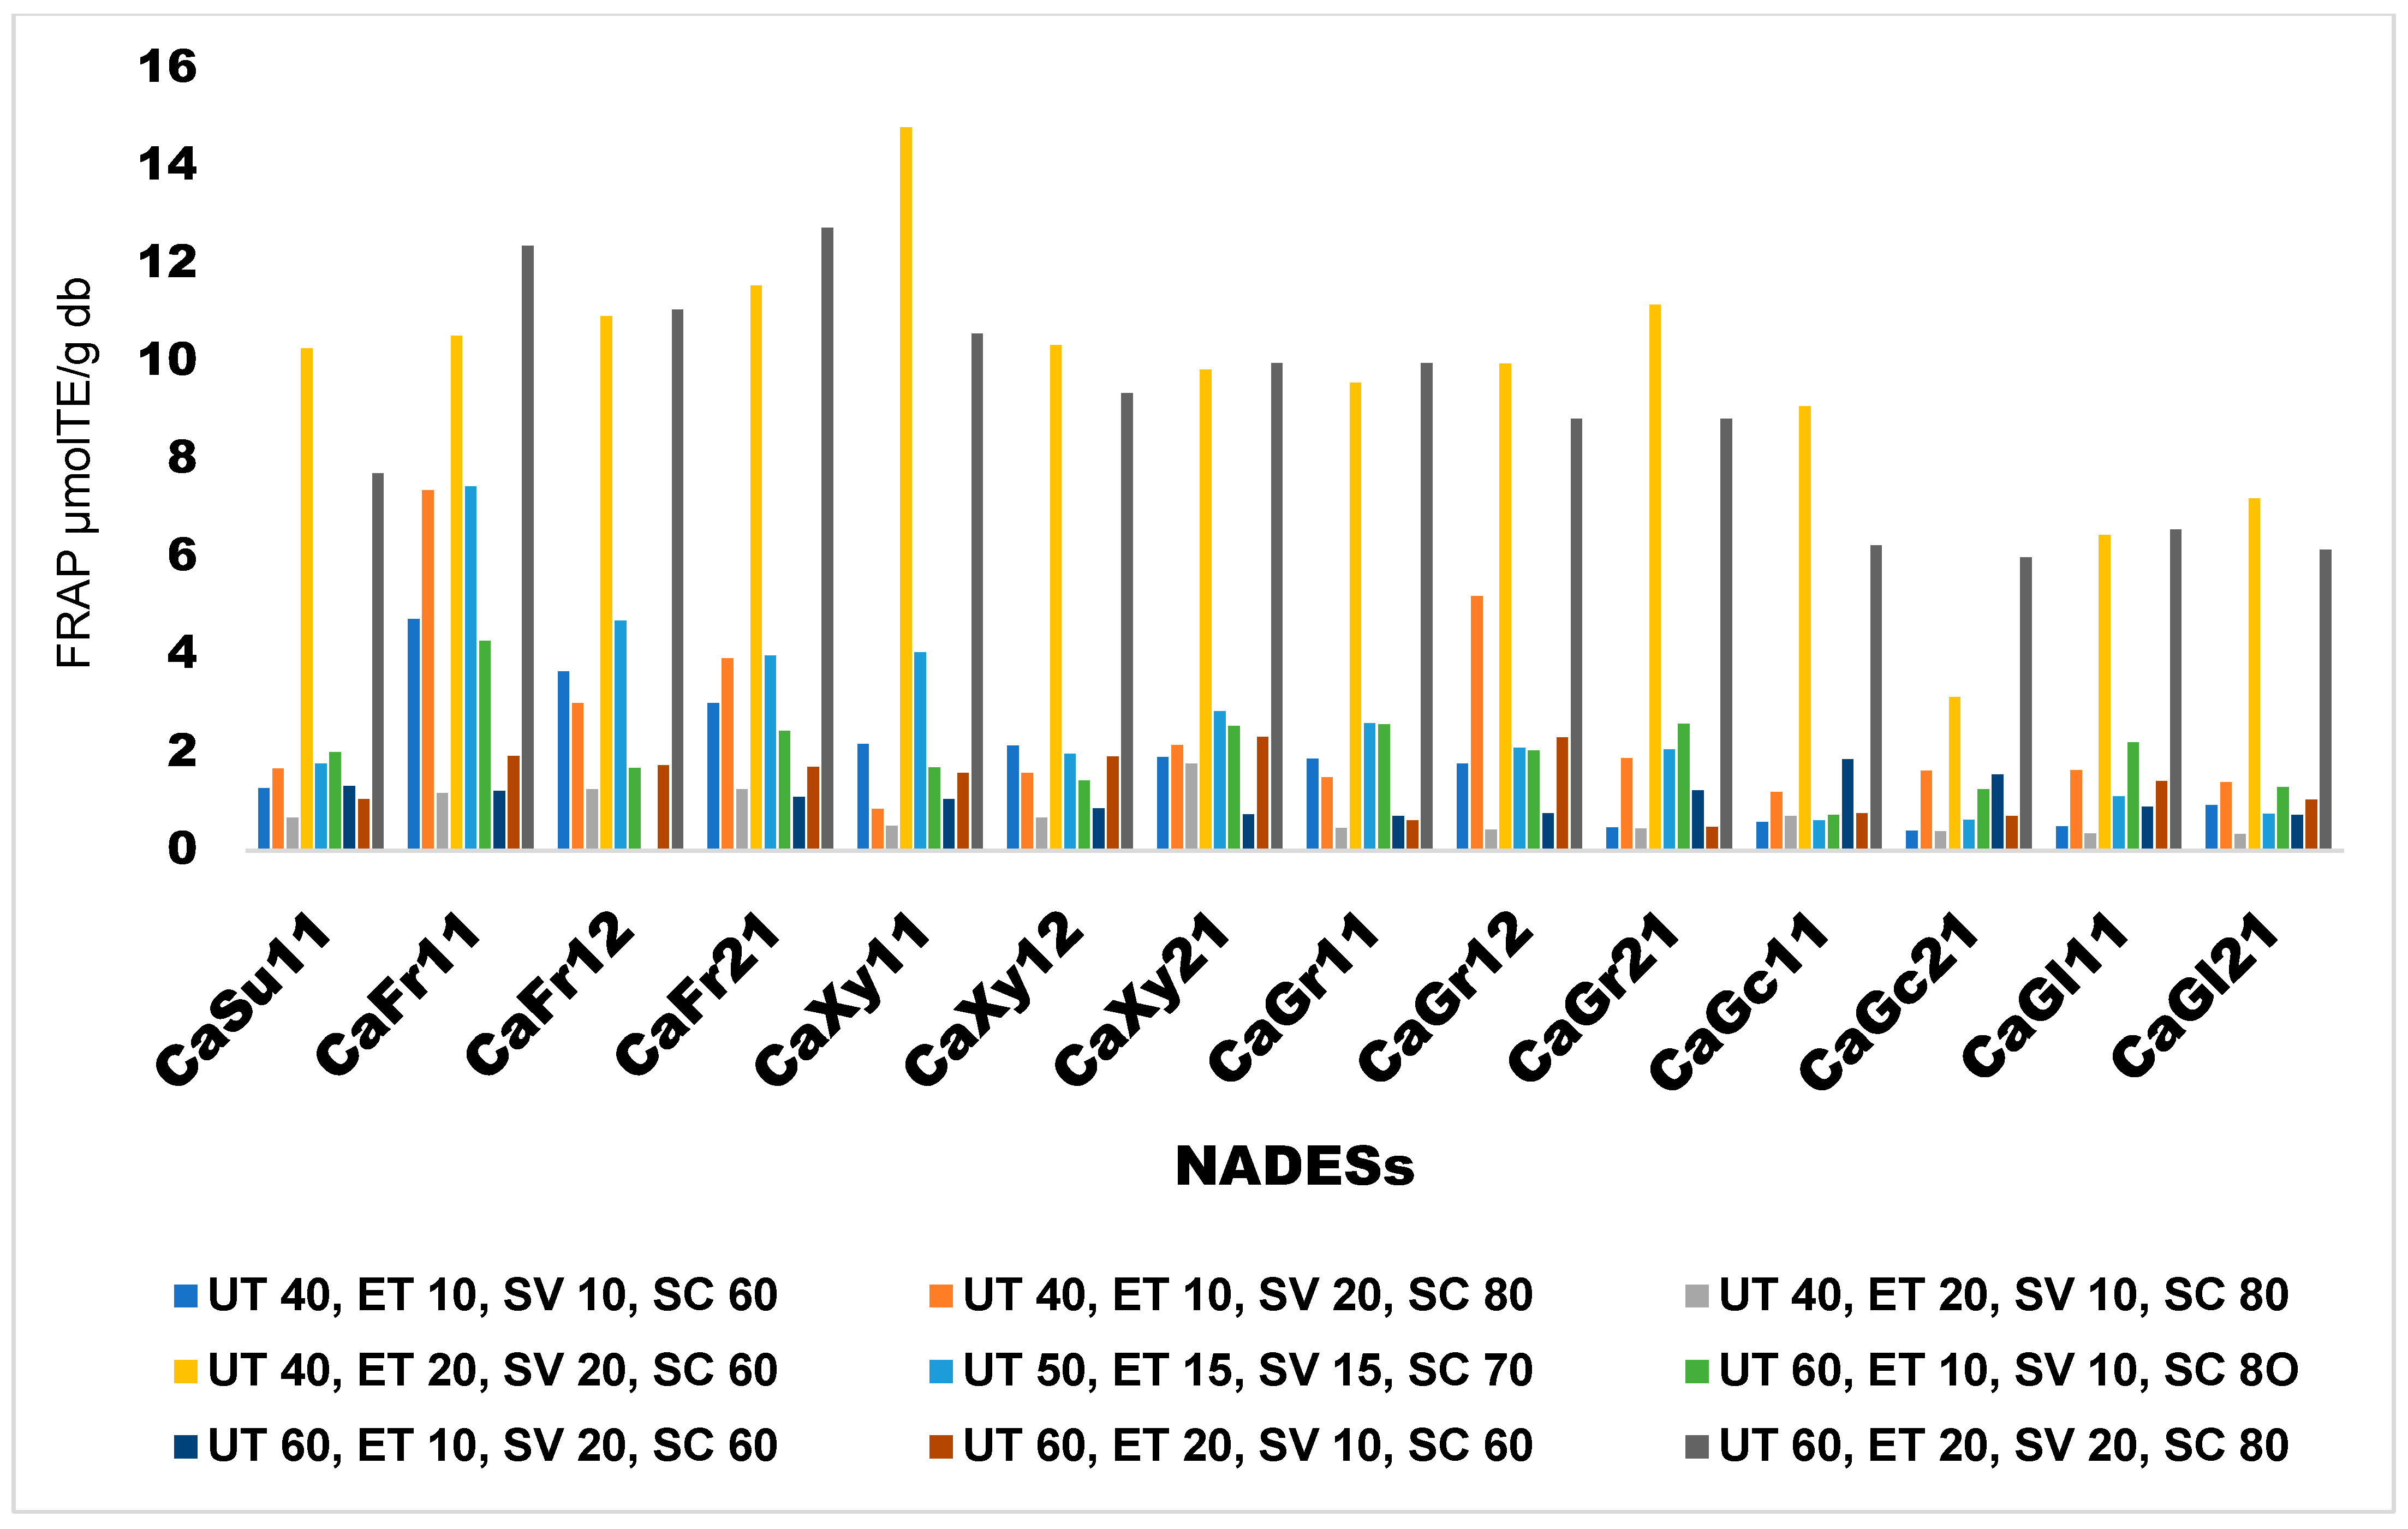
Effects of Extraction Conditions on FRAP

High antiradical scavenging activity across the synthesized NADESs as measured with FRAP was observed under extraction conditions of UT 40 °C, ET 20 min, SV 20 mL, and SC 60%, and extracts from CaXy11 showed the highest antiradical scavenging activity of 14 μmol/gTE db of sample under the same conditions. The antiradical scavenging activity measured using the FRAP method is presented in Figure 3.

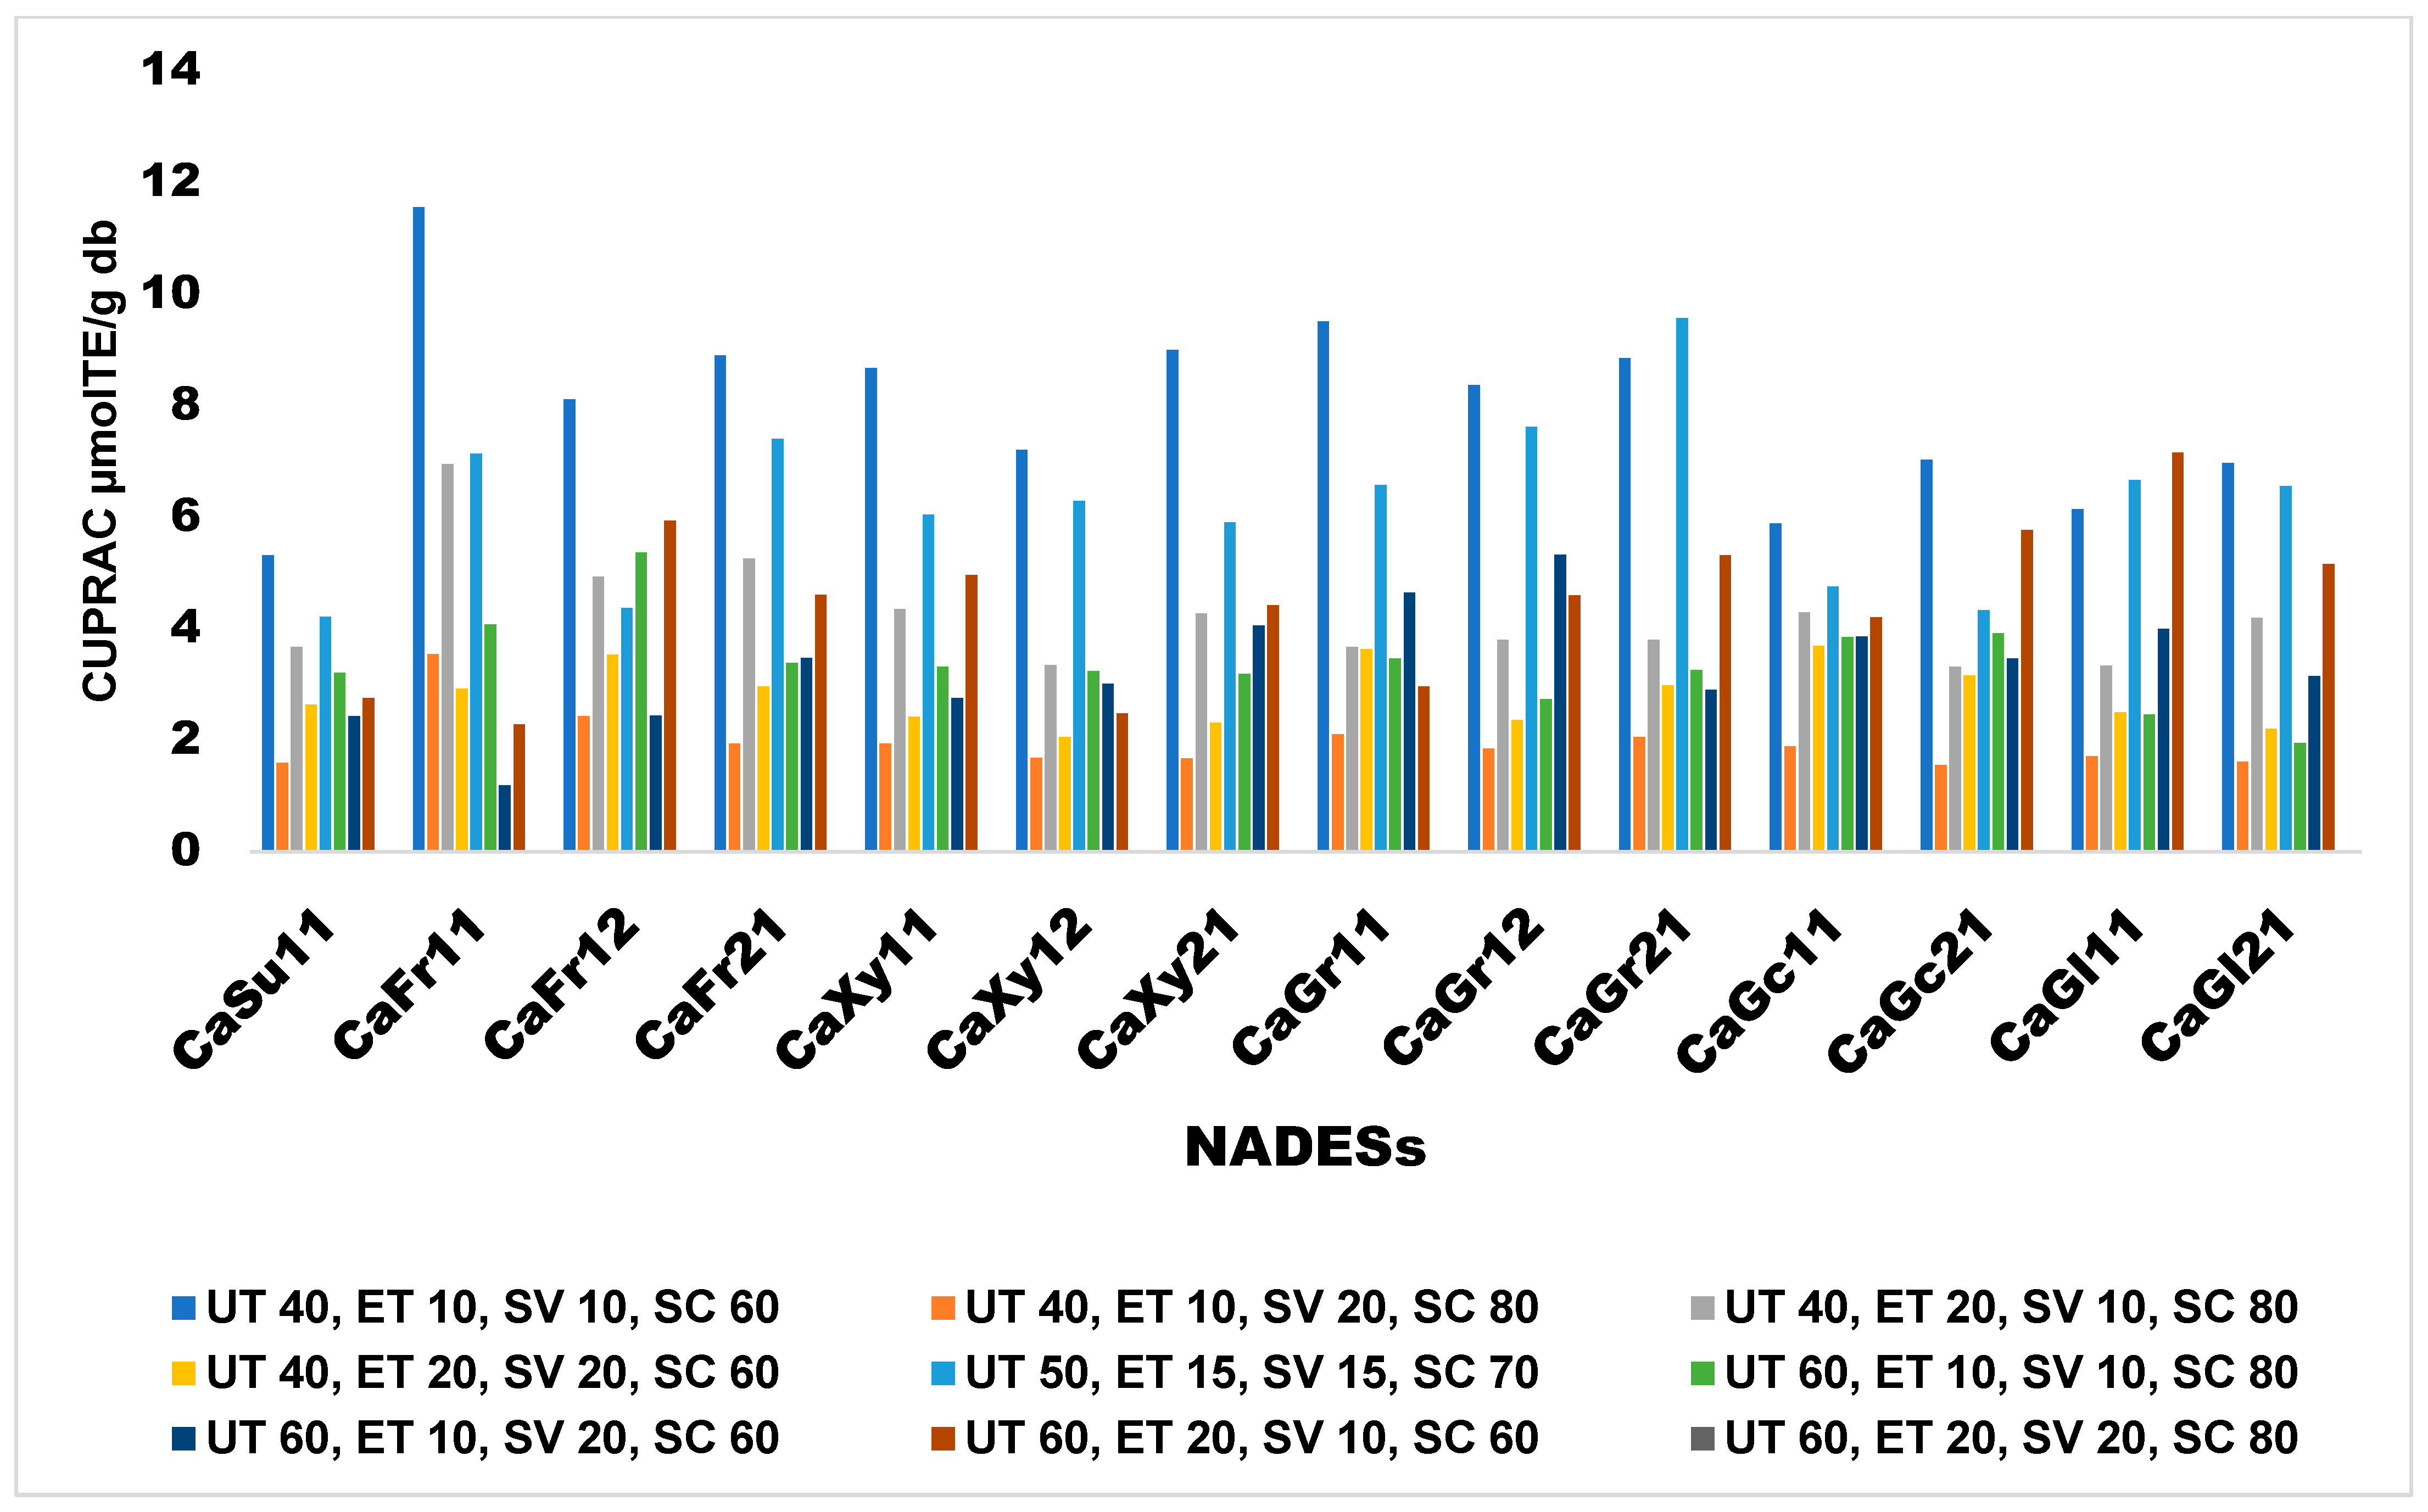
Effects of Extraction Conditions on CUPRAC

The antiradical scavenging activity of ANP extracts under different NADES-UAE extraction conditions measured using the CUPRAC method showed UT 40 °C, ET 10 min, SV 20, and SC 80% as the best conditions for efficient antiradical scavenging. CaFr11 was shown to have the highest radical activity of 12 μmol/g TE db of extracts under those conditions. The CUPRAC results are presented in Figure 4.

3.4. Rotatable Central Composite Response Surface Methodology (RCCRSM)

A rotatable central composite RSM design was used to model the extraction process and validate the effects of extraction conditions (UT, ET, SV, and SC) on the response variables TPC, TFC, and antiradical scavenging activity (CUPRAC, FRAP, and DPPH) of ANP using the NADES-UAE extraction technique. From the MFAT screening experiments, the conditions responsible for extraction and antiradical scavenging were established. However, an RCCRSM design was carried out to fully study and understand the experiment’s directional focus and the effects of each interaction of the factors to fully model and optimize the process. The results of the RCCRSM experiments are presented in Table 8, using CaFr12 to represent all the synthesized NADESs. Table 8 shows that TPC varied from 100 ± 1.47 mg GAE/g DW to 695.42 ± 2.83 mg GAE/g DW, and TFC varied from 60.026 ± 1.19 µg QE/g DW to 1313 ± 3.61 µg QE/g DW. Antiradical scavenging activity measured using CUPRAC varied from 3.0895 ± 0.01 µmol TE/g DW to 15.4877 ± 0.14 µmol TE/g DW, antiradical scavenging activity measured using FRAP varied from 0.521 ± 0.346 µmol TE/g DW to 10.267 ± 0.018 µmol TE/g DW, and antiradical scavenging activity measured using DPPH varied from 1.51 ± 0.1% DW to 89.6 ± 0.1% DW, respectively. Table 9 presents a summary of the ANOVA results for the five response variables. On the one hand, the five models (one for each of the response variables) showed p-values lower than 0.0001, which means that the models are highly significant. On the other hand, the insignificant lack of fit values (p > 0.05) indicates that each of the models is adequate to predict the corresponding response. Table 10 shows the regression coefficients (in coded variables) and the coefficients of determination for the TPC, TFC, CUPRAC, FRAP, and DPPH models for all significant terms (p < 0.05). The five models indicate high values of coefficient of determination (R2) and adjusted coefficient of determination (R2adj). The values of the predicted coefficient of determination (R2pred) were in good agreement with R2adj. This indicates a high degree of correlation between the experimental and predicted values for the five models.
As can be seen from Table 10, TPC was positively influenced by all main factors, the squares of temperature, time, and concentration, but negatively influenced by quadratic volume and all-factor interaction. TFC was positively influenced by time, volume, and concentration; quadratic temperature and time; and interactions between temperature and volume, temperature and concentration, and volume and concentration, but negatively influenced by temperature; squared volume and concentration; and interactions of temperature with time, time with volume, and volume with concentration. All squared factors, including interactions of temperature with concentration and volume with concentration, positively influenced the efficiency of CUPRAC. However, all main factors, including interaction of temperature with time, temperature with volume, time with volume, and time with concentration, exerted negative influence on CUPRAC efficiency. In the case of FRAP, time, volume, all squared factors, and interaction of temperature with concentration and time with volume had positive effects, while temperature, concentration, and interaction of temperature with time, temperature with volume, time with concentration, and volume with concentration all had negative effects on FRAP efficacy. Antiradical activity measured using DPPH showed all main factors to positively influence its efficiency, while all squared factors, including interactions of temperature with time, temperature with volume, and temperature with concentration, had negative effects on the antiradical potential of extracts measured using the DPPH method.
The model equations for the five response variables coded as Y1–Y5 are presented in Equations (12)–(16), where Y1 is TPC, Y2 is TFC, Y3 is CUPRAC, Y4 is FRAP, and Y5 is DPPH.
Y 1 = 2111 + 52.6 X 1 + 17.3 X 2 + 102.6 X 3 + 1.2 X 4 + 0.075 X 1 2 + 1.603 X 2 2 0.063 X 3 2 + 0.112 X 4 2 1.22 X 1 X 2 1.28 X 1 X 3 0.312 X 1 X 4 0.4 X 2 X 3 0.015 X 2 X 4 0.146 X 3 X 4
Y 2 = 930 66.6 X 1 + 129 X 2 + 33 X 3 + 43.2 X 4 + 0.429 X 1 2 + 0.231 X 2 2 1.032 X 3 2 0.24 X 4 2 0.332 X 1 X 2 + 0.14 X 1 X 3 + 0.26 X 1 X 4 1.69 X 2 X 3 1.56 X 2 X 4 + 0.082 X 3 X 4
Y 3 = 38.1 0.479 X 1 0.144 X 2 0.526 X 3 0.572 X 4 + 0.0033 X 1 2 + 0.0347 X 2 2 + 0.0346 X 3 2 + 0.0031 X 4 2 0.0065 X 1 X 2 0.0063 X 1 X 3 0.0036 X 1 X 4 0.157 X 2 X 3 0.0059 X 2 X 4 + 0.0078 X 3 X 4
Y 4 = 0.5 0.085 X 1 + 1.051 X 2 + 0.681 X 3 + 0.298 X 4 + 0.0044 X 1 2 + 0.0114 X 2 2 + 0.0107 X 3 2 + 0.0031 X 4 2 0.011 X 1 X 2 0.0129 X 1 X 3 + 0.00363 X 1 X 4 + 0.211 X 2 X 3 0.0158 X 2 X 4 0.0068 X 3 X 4
Y 5 = 1825 + 28.17 X 1 + 45.73 X 2 + 7.48 X 3 + 23.25 X 4 0.181 X 1 2 0.675 X 2 2 0.164 X 3 2 0.157 X 4 2 0.485 X 1 X 2 0.066 X 1 X 3 0.027 X 1 X 4

3.5. Optimization of the Extraction Conditions and Validation of the Models

Numeric optimization of responses was carried out using the desirability function following Equations (5) and (6), as already described in Section 2.2. Optimization was carried out with the goal set to maximize the total phenolic content, total flavonoid content, and antiradical scavenging activity using the independent variables UT, ET, SV, and SC in the ranges that were used in the rotatable central composite response surface experiments. Five different solutions were calculated using Minitab software with different levels of independent variables with good desirability. To verify the models obtained through RSM, nine extractions were performed under conditions that predicted maximum desirability. Table 11 shows the maximum desirability for the five response variables as well as the experimental conditions to achieve the desired goal. In Table 12, the experimental results, along with the values predicted by the models under the maximum desirability and optimal extraction conditions, are presented. As can be seen, the experimental values of the five responses are within the confidence intervals of the values predicted by the models (with a 95% confidence level), which indicates a good degree of prediction of the models obtained in this work under the extraction conditions tested. On the other hand, Table 12 presents the experimental data of TPC, TFC, and antiradical scavenging activity using water (conventional solvent) under the same optimal extraction conditions used for the case of NADESs.

4. Discussions

In our recent work [3], we focused on a single NADES-CaFr11, providing in-depth exploration, analysis, and discussion of its efficient phenolic extraction capability, as well as antiradical scavenging efficacy. In contrast, in the present work, we broaden the scope significantly, expanding the discussion to include 13 additional NADESs synthesized with similar HBA, but different HBDs at different molar ratios. Our aim is to expand the NADES candidates, providing diversification that enhances the breadth of the research, offering a more comprehensive exploration of the application of NADESs in extraction studies and potentially introducing new perspectives, comparisons, and relationships between the synthesized NADESs.

4.1. Synthesis of NADESs

NADES is a homogeneous mixture that forms a superlattice when combined at a specific molar ratio using natural components. The joint superlattice melts at eutectic temperatures below the melting point of its components. DES formations have mostly been designed with ChCl as an HBA. The formation of a transparent liquid at a certain molar ratio suggests the effects of the hydrogen bond interaction between the HBA and the HBD [35]. The freezing point of DES is lowered due to hydrogen bonding between the HBA and the HBD, resulting in a liquid form [36].
In the study, the amount of citric acid was insufficient to form appropriate hydrogen bonding with sucrose, glycine, and glucose at a molar ratio of 1:2, respectively. As a result, the solutions solidified into a white mass on cooling. At a 2:1 molar ratio, the NADES formed with sucrose was extremely viscous like a gel and could not be used for extraction application and was discarded. We therefore suggest that a critical factor in synthesizing citric acid-based NADES is to establish the ideal HBA to HBD molar ratio that will produce a stable liquid-phase mixture on standing [37].
Heating and stirring was the primary method used by most researchers in the synthesis of deep eutectic solvents (DESs), including NADES [9,19,23,38,39,40,41,42,43]. Due to high energy consumption, as well as a longer duration of synthesis time (between 6–24 h) in the heating and stirring (HS) technique, more novel approaches are being explored. For instance, microwave [23,24,41], freeze-drying [39,40], rotary evaporation [21,44], extrusion [23] and ultrasonication [45]. Application of ultrasound to the mixture caused acoustic cavitation by generating, growing, and eventually collapsing of the bubbles. As ultrasound waves propagated, the bubbles oscillated and collapsed, causing thermal, mechanical, and chemical effects. Mechanical effects include collapsed pressure, turbulence, and shear stresses, while chemical effects include ionization of bonds and an increase in hydrogen bonding potential to form. The locally produced alternating positive and negative pressures caused the expansion of the mixture, resulting in bond rupture and realignment. Ultrasound causes hydrolysis of water inside the oscillating bubbles, leading to the formation of H+ and OH that were captured in the chemical reaction by the rearrangement of HBA and HBD to form the NADESs. When cavitation is generated, OH radicals are released, which is why a chemical effect is obtained in the solution.
Temperature and time played significant roles in the ultrasound-assisted synthesis of the NADESs. At 50 °C, the HBA and HBD were unable to form the desired solvent at different time intervals. At 90 °C, the synthesized solvents with sugar-based HBDs were very dark in color, which was suspected to be the effects of caramelization of sugars. The caramelization effect was also observed when the temperature was 70 °C and the time prolonged above 80 min. In their study with choline chloride-based NADES, Hsieh et al. [45] employed an ultrasound-assisted technique with a frequency of 40 kHz, 300 W power, and synthesis time of 5 h. The temperature was not controlled but was measured to be 50 °C at the end of the synthesis time. Based on their findings, 50 °C could also be used for the synthesis of citric acid-based NADESs but will require such a long period of time. Therefore, thermal effects, in addition to the cavitation and mechanical effects, significantly influence ultrasound-assisted synthesis (UAS) [46], making temperature and time important UAS variables for NADES production.

4.2. Characterization of NADES

4.2.1. Physical Properties of NADESs

The physical properties of the NADESs prepared using citric acids (Ca), sugars, amino acids, and sugar alcohols depicted excellent physicochemical properties like those synthesized using other hydrophilic hydrogen bond acceptors, such as choline chloride [47]. The basic physical properties of NADESs at 25 °C were measured, including density, viscosity, and pH, to provide a reference for their application in extracting bioactive compounds from horticulture materials. The results of the physical properties are shown in Table 5.

Density

The density of a solvent is critical for its diffusion and miscibility with other liquids. The density of NADES is crucial in chemical processes involving extraction, fluid mechanics, and mass transfer [48]. The high density of NADES may be advantageous for phase separation, even though it may impact the handling and mixing processes. The densities of the synthesized NADESs at 25 °C show that fructose-based NADESs have higher density than glucose-based ones, irrespective of the molar ratios, and may explain why the former have superior extraction efficiency than the latter. The densities obtained in this study are similar to those obtained from choline chloride-based NADESs (1.00–1.35 g/cm3) [49,50] and glycolic acid-based NADESs (1.3528–1.3741 g/cm3) [22]. NADESs have higher densities than water due to their varying degrees of hydrogen bonding in the formulation [51,52]. The arrangement and packing of NADES molecules significantly impact their density [53]. According to Abbott et al., DES mixtures, like ionic liquid counterparts, contain holes whose size controls the density of the solvent [54]. NADESs formed from sugars (sucrose, fructose, and glucose) have higher densities than those formed from sugar alcohol (xylitol and glycerol), indicating that the HBD functional groups substantially impact the properties. Although the densities of DESs decrease dramatically as the chain length of HBDs increases in the case of choline chloride-based NADESs [50,55], the contrary was observed in the present study.

Water Activity

Water activity is an important and critical thermodynamic property used to predict the shelf life of food products, microbial activity, microbial growth, solute–solute interactions, etc. It is defined as the ratio of the fugacity of water in a system at a given temperature to the fugacity of pure water at the same temperature. In food products, water activity can be manipulated by the addition or reduction of electrolyte solution to achieve the desired goal [56]. Water activity also provides treasured data with respect to solute–solute and solute– solvent interactions, an important factor for extraction processes [57]. In the present work, the water activity of the synthesized NADESs was measured with a digital water activity meter at 25 °C. There is a paucity of information in the literature about the water activity of NADESs; however, data obtained for some ternary mixtures of choline chloride-based NADESs with sugars and water show that the present NADESs have lower water activity than those ternary mixtures. For example, Behboudi et al. provided water activity data for choline chloride + urea + sucrose + water, choline chloride + ethylene glycol + sucrose + water, and choline chloride + glycerol + sucrose + water as 0.942–0.988, 0.949–0.974, and 0.98–0.982, respectively [58]. These results were far higher compared with the results obtained in the current study: 0.71–0.83. The discrepancies in the results could be explained by the dilution effects of water on the ternary mixtures of water and NADESs as against the concentrated NADESs that we synthesized. In the present study, we discovered that water activity is influenced by the molar ratios of HBD in the structure. The higher the ratio of the HBA in the NADESs structure, the lower the water activity; hence, CaFr11, CaXy11, CaGr11, and CaGl11 have higher water activity than CaFr21, CaXy21, CaGr21, and CaGl21, respectively. This observation could be used in tuning the NADESs for a given purpose, such as application in the formulation of preservatives.

Viscosity

Dynamic viscosity measures the resistance of fluid to flow and the molecular bond strength of the fluid. The viscosities of the NADESs for all functional groups of HBD at different molar ratios are shown to range from 0.0131 pa.s to 0.3545 pa.s and are similar to those obtained by Sazali et al. (0.235–0.453 pa.s, using choline chloride: glycerol; and 0.04–0.06 pa.s, using choline chloride: lactic acid) [59] and Liu et al. (0.207–2.66 pa.s, using choline chloride: glycerol at the same molar ratio) [60]. Similarly, Francisco et al. obtained choline chloride: lactic acid viscosities of 0.3–0.7 Pa. s at 1:1.3–1:5 mole ratios [61] and Kang et al. obtained similar viscosities for different molar ratios of glycolic acid: l-proline-based NADESs [22]. Due to their dense hydrogen bond networks, NADESs have higher viscosities than water, molten salts, and other molecular solvents. This is due to the inhibition of free mobility species within the NADES structure [62]. Higher viscosities are also caused by electrostatic interactions, van der Waals forces, ion sizes, and void volumes [59]. In this study, the role of the HBD chemical structure and functional groups in the properties of NADESs is demonstrated. Carboxylic acid and hydroxyl groups, in addition to the alkyl chain length, affect viscosity, with more hydroxyl groups and longer hydrocarbon chains resulting in higher viscosities [63]. Alcalde et al. observed that water dilutes the hydrogen bonding between choline chloride and lactic acid, but only at concentrations greater than 10%; accordingly, increasing the HBD molar ratio will increase viscosity [64].

pH

The pH of NADESs is very important for chemical analysis, extraction processes, catalysis, biological activity, and metal treatment. The pH of NADESs can affect process engineering, as it involves operational conditions and materials of construction [59,65]. The pH is dictated by the acidity and basicity of HBA and HBD and their combined acidity and basicity [66]. The pH values of the synthesized NADESs at 25 °C are shown to be below pH 2, except CaGc11 and CaGc21, whose pH values are above pH 2. CaGc11 (citric acid: glycine, 1:1) and CaGc21 (citric acid: glycine, 2:1) are the only NADES samples synthesized using amino acid as HBD. Amino acids have fewer hydroxyl groups in their molecular structure compared to sugars and sugar alcohols, hence the acidity in relation to others. The limited number of hydroxyl groups in the structure of glycine as HBD may have influenced the resultant NADESs to be less acidic—that is, to have a higher pH value. There is a significant difference between the pH of CaFr12 (citric acid and fructose, 1:2) and CaXy12 (citric acid: xylitol, 1:2). This may be explained by the similar numbers of hydroxyl groups in the respective molecules of fructose and xylitol.
The pH is also affected not only by the HBD groups but also by the molar ratio of HBA to HBD. For instance, the pH values of CaFr12 (citric acid: fructose, 1:2), CaXy12 (citric acid: xylitol, 1:2), and CaGr12 (citric acid: glycerol, 1:2), respectively, were all higher than those of CaFr21 (citric acid: fructose, 2:1), CaXy21 (citric acid: xylitol, 2:1), and CaGr21 (citric acid: glycerol, 2:1), respectively. This may be explained using the hole theory of Abbott et al. [54]. In this case, there are more free hydrogen bond donating groups from two moles of fructose, xylitol, and glycerol that need to be accepted by the HBA but could not, because there were no free bonding sites on the one mole of citric acid, thereby creating a more acidic environment.
Overall, DES prepared using organic acids either as an HBA or HBD tend to have extremely high acidity because of HBA–HBD hydrogen bonding [53]. Skulcova et al. [66] obtained pH values ranging from 4.1 to 4.5 using choline chloride and glycerol at a 1:2 M ratio and at temperatures of 25 °C to 60 °C; however, the pH of DES synthesized with choline chloride and lactic acid was established to vary between 0.99 and 1.8 for molar ratios of 1:5 and 1:10 under similar conditions [66]. The pH of choline chloride: lactic acid DES and choline chloride: glycerol DES were significantly impacted by the type of HBD used, with the first DES containing an acid and the second containing an alcohol [65].
Lemaouni et al. suggested that the trend of pH with molar ratios caused by functional group addition to HBDs is not always correlated for some DESs; instead, molecular-level interactions between HBA and HBD significantly affect the pH of DESs [67].

4.3. Molecular Properties

The charge delocalization of HBA and HBD occurring through hydrogen bonding is responsible for the formation of DESs. The NADESs prepared by combining citric acid with glycine shows changes in the FTIR spectra indicated by a second peak following the OH peak compared to others. This second peak is identified as amide stretching (3300–3200 cm−1). The FTIR spectra of the synthesized NADESs show the absence of intensive OH stretching bands at wavenumbers between 3800 cm−1 and 3400 cm−1, indicating a very low water content solvent [68] (spectra presented in Supplementary Materials). The NADESs FTIR spectra show OH stretching bands at wavenumbers 3305, 3327, 3287, 3375, 3321, 3298, 3385, 3358, 3286, 3367, 3373, 3392, 3321, 3371 cm−1 for CaSu11, CaFr11, CaFr12, CaFr21, CaXy11, CaXy12, CaXy21, CaGr11, CaGr12, CaGr21, CaGc11, CaGc21, CaGl11, and CaGl21, respectively, as presented in Table 5. According to the literature, changes in the stretching vibration of NADESs at the wavenumber of 3300 cm−1 are the main indication of hydrogen bonding formation between the hydrogen bond acceptor and the hydrogen bond donor [68,69]. These results confirm the synthesis of NADESs with the increase and strengthening of hydrogen bonds. The presence of characteristic functional groups indicated in FTIR spectra were OH (3500–3200 cm−1), CH (3000–2500 cm−1), RCOOR (1710–1730 cm−1), C꞊C allyl stretching (1615–1682 cm−1), ꞊CH2 bending (1416–1485 cm−1), C–O (1112–1000 cm−1), C꞊C allyl wagging vibration, and =CH2 wagging vibration (1000–727 cm−1), which further validate the synthesized solvents as natural deep eutectic solvents and not just mere solvents. The results obtained agreed with the results obtained by Silva et al. [69] and Rashid et al. [70] for choline chloride-based NADESs. NADESs prepared using a combination of individual components reveal alteration in the infrared spectra when differentiated with the separate components. The broader peaks seen at 3000–3500 cm−1 accord to more O–H bond formation between individual components in the NADES. According to [71], changes in the band stretching between 3000 and 3500 are the main evidence of hydrogen bond formation between the individual components, which confirms the synthesis of NADES. The FTIR spectra of CaGc11 and CaGc21 show two distinct functional peaks at 3373 cm−1 to 3392 cm−1, indicating OH stretching from the citric acid, and 3207 cm−1 to 3230 cm−1, indicating amide N-H bond from amino acid glycine, respectively. The number of bonds in each of the NADESs formed are indicated by the number of peaks in each individual solvent; however, the most important indication of the formation of a eutectic solvent is the presence of H-bonding in the molecules. In the present study, the presence of H-bonding indicated by peaks featured prominently among all the synthesized solvents, indicating the formation of NADESs.

4.4. Application of NADESs for Extraction

4.4.1. Extraction Yields

While extraction studies utilizing the properties of ultrasonic waves exist in volumes, there is a dearth of knowledge on the use of ultrasonication for the preparation of NADESs. However, it has been established that the practical application of extraction of bioactive compounds with NADESs is more suitable than organic solvents for use in food and pharmaceutical products [70,71,72]. Therefore, citric acid-based NADESs were investigated for efficient extraction of phenolic compounds using multifactorial modeling with a rotatable central composite response surface methodology, as shown in our previous study [3]. The NADESs were found to be suitable solvents for extracting bioactive compounds from horticulture residues such as AFP. The affinity of phenolic compounds with a greater tendency towards acidic NADESs could explain the basis for increased extraction efficiency and antiradical scavenging potentials of the extracts [73,74]. Extraction with NADESs coupled with ultrasonication techniques has been reported by different authors [75]. Bertolo et al. prepared NADESs with choline chloride as HBA and glucose, sucrose, glycerol, lactic acid, and citric acid as HBDs and reported the most efficient NADES for extracting bioactive and phenolic compounds from pomegranate to be the choline chloride-lactic acid (ChCl-LA)-based NADES coupled with an ultrasonic bath [75]. In similar studies, Obluchinskaya et al., Olfat et al., and Koraqi et al. extracted bioactive compounds from brown seaweed, sea velvet, and damask rose using NADESs coupled with ultrasonication, respectively, and reported that NADESs based on lactic acid coupled with an ultrasonic bath led to better extraction of phenolic and bioactive compounds [17,76,77]. In our study, we found similarity of efficiency between citric acid-fructose-based NADESs and ChCl-LA-based NADESs in TPC extraction. Therefore, it may be appropriate to state that the extraction efficiency of citric acid-based NADESs performs better when citric acid is used as HBA rather than HBD when coupled with the ultrasonication process.
Among the synthesized NADESs, fructose-based NADESs at a 1:1 molar ratio provided the most excellent extraction media for polyphenol extraction. However, at a 2:1 molar ratio, it provided the weakest extraction efficiency. More studies are required to establish the reason for this phenomenon. We cannot accurately speculate that the differences in physical properties between the two fructose-based NADES formulations were responsible for such a substantial performance gap.

4.4.2. Effects of Extraction Conditions on Antioxidants

In the presence of a solvent, the cavitation phenomenon occurs by exposing the samples to ultrasound waves. Cavitations are microbubbles formed by the application of ultrasonic waves due to the cycle of compression and rarefaction. Compression and rarefaction cause the formation, growth, and implosion of bubbles. As the bubbles explode, the tissue matrix of the sample collapses. The cycle of compression and rarefaction is directly related to the solvent volume, so that at higher volumes, the rate of cavitation will be higher. Therefore, because of increasing the solvent volume, the ultrasound cavitation increases, leading to increased tissue disruption and ultimate increase in TPC extraction [67,68,69]. The two main steps on which the UAE process is based are the washing and slow extraction mechanisms. In the washing stage, the soluble compounds on the surface or close to the surface are washed and extracted by the solvent, which is accompanied by a rapid increase in the extraction slope, while during the slow extraction stage, soluble materials are slowly extracted from the sample matrix into the solvent by both diffusion and osmotic phenomena [78,79]. In the slow extraction stage, temperature plays a role as it helps in diffusion and osmosis through increased molecular mobility. At this point, sufficient time to extract bioactive compounds from the target matrix is required [80]. Therefore, providing sufficient time will cause the most bioactive compounds to be extracted and thus increase the extraction efficiency. However, prolonging the time may lead to polyphenol degradation. The concentration of the solvent increases by reducing the amount of water added to the NADES. Increasing the solvent concentration causes mass transfer more rapidly and the phenolic compounds in the samples to diffuse into the solvent [81]. This may be because a higher solvent concentration means the availability of more hydrogen bond species for interaction with the bioactive molecules leaving the sample matrix into the solvent. A higher concentration of NADESs increases the content of hydrophilic compounds because of the acidic nature of the solvents.

4.4.3. Efficiency of NADESs as Solvent for Polyphenol Extraction

Comparing the TPC and TFC compounds extracted using the UAE-NADESs method under optimized conditions with those extracted using UAE-water (water is the greenest solvent) under the same optimized conditions, as shown in Table 12, all the synthesized NADESs showed superior TPC extraction to water extraction. In addition, the synthesized NADESs also showed superior TFC extraction efficiency to water except CaF21, where water had superior extraction efficiency. The combination of ultrasonic process and eutectic solvent, probably due to its role in improving the mass transfer process of bioactive compounds from the sample, caused more bioactive and phenolic compounds to be extracted, thereby increasing the total phenol content extracted [82]. The UAE-NADESs, due to their role in the stability of solutes, may have prevented the degradation of the phenolic compounds during the extraction process and thus increased the extraction efficiency. In the extraction process, due to the formation of strong hydrogen bonds between solutes and NADES molecules, the stability of the target compounds may have increased against adverse extraction conditions (oxidative degradation) [83]. Also, during the UAE process, the high solubility of NADESs may have conferred a significant advantage for the extraction and stability of bioactive compounds (polyphenols, flavonoids) at such a shorter extraction time than conventional extraction processes [84]. Macchioni et al. reported similar results for extracting phenolic compounds from common hops using NADESs and UAE [85] and found extraction efficiency of phenolic compounds by lactic acid-based eutectic solvents higher than the conventional extraction method using ethanol 80%. They attributed this behavior to the improvement of the mass transfer process by the UAE method and the increase in the stability of phenolic compounds induced by eutectic solvents [85]. Further study is needed to elucidate the reason UAE-water performed better than UAE-CaFr21 extracts for flavonoid extraction.

4.5. Effects of Extraction Conditions on Antiradical Scavenging Activity

The antiradical scavenging activity of bioactive compounds extracted from ANP using the UAE-NADESs method was compared with UAE-water extracts under the optimized conditions, as shown in Table 10. The antiradical scavenging activity was determined using the CUPRAC, FRAP, and DPPH methods and differences were compared using Fisher’s least significant difference (LSD) test. The antiradical scavenging tests by DPPH inhibitions performed significantly better in all UAE-NADESs than in UAE-water (p < 0.05). The CUPRAC test shows that all UAE-NADESs had significantly higher activity than UAE-water, except for UAE-CaGc11, which showed no significant difference compared to UAE-water (p < 0.05). However, UAE-water performed significantly better than UAE-CaGl11, UAE-CaGl21, and UAE-CaGc21 when the scavenging test was conducted using the FRAP method, but significantly worse than all other UAE-NADESs studied (p < 0.05) (see Table 10). The free radical scavenging activity of DPPH, CUPRAC, and FRAP of NADES-UAE extracts may probably be connected to the content of higher phenolic compounds extracted using the NADES-UAE methods. These bioactive compounds (nutraceuticals) have various antioxidant and biological activities in food and biological systems due to their structural properties [76,77,86]. The hydrogen donating capability and reduction ability of phenolic compounds cause the oxidation chain reaction to break, and these compounds are referred to as potent antioxidants [87]. These findings are consistent with the results of other researchers. Mansinhos et al. studied the extraction of phenolic compounds from butterfly lavender using UAE and NADES and found that the combination of UAE and NADES resulted in higher antioxidant activity compared to conventional methods [88]. They stated that scavenging of DPPH free radicals using the UAE-NADES methods was greater than that of extracts obtained using conventional methods, which attributed the higher antioxidant activity to the content of higher phenolic compounds in the UAE method [88,89,90].

5. Conclusions

In this study, we synthesized, characterized, and applied 14 natural deep eutectic solvents for extraction of bioactive compounds from horticulture residues. The extraction procedure was first screened using a multifactorial model and then optimized using rotatable central composite response surface methodology. In our previous study [3], we had investigated the potential of only one solvent and determined its effectiveness at extracting TPC and TFC from ANP and the radical scavenging potentials of the extracts using the FRAP and CUPRAC methods. In the present study, we conducted a comprehensive investigation of all the synthesized NADESs and optimized the independent variables with the aim of obtaining maximum TPC and TFC extracts, as well as maximum antiradical scavenging activity. We extended the antiradical study to include DPPH. The optimal extraction parameters were determined to be UT, ET, SV, and SC: 45 °C, 5 min, 25 mL, 90%, with TPC yield ranging from 281.05 ± 18 mgGAE/g in CaFr21 to 1290.9 ± 5.6 mgGAE/g in CaFr11. Similarly, optimal conditions for the maximal output of other response variables were determined. The optimal conditions for maximal TFC yield were UT, ET, SV, and SC of 30 °C, 5 min, 25 mL, and 90% to obtain 442.13 ± 8.7 µgQE/g in CaFr21 to 2398.7 ± 23 µgQE/g in CaFr11. For antiradical scavenging properties of the extracts, the optimized conditions for maximum CUPRAC activity were the same as those of TFC, and yield ranged between 22.78 ± 0.43 µMTE/g in CaGc11 and 38.46 ± 0.44 µMTE/g in CaFr11; FRAP had optimal conditions, with UT, ET, SV, and SC of 45 °C, 25 min, 25 mL, and 50% to yield 7.59 ± 0.14 µMTE/g in CaGc21 to 26.17 ± 0.17 µMTE/g in CaSu11, while DPPH had optimal conditions, with UT, ET, SV, and SC of 50 °C, 15 min, 15 mL, and 70% to produce between 34.77 ± 0.24% in CaGl11 and 90.05 ± 0.23%. Among the synthesized NADESs, CaFr11 emerged as the ultimate in terms of superior TPC and TFC extraction efficiency, as well as a top contender in antiradical scavenging power. The antiradical scavenging activity of the NADESs-UAE extracts showed superior scavenging power to extracts obtained with UAE-water when studied using CUPRAC, FRAP, and DPPH methods, except CaGc11 FRAP, which was inferior. Our solvents and methods also showed similar or superior performance to the results obtained by other researchers who studied other plant materials using different NADES formulations coupled with UAE [79,80,81,82]. The bioactive compounds extracted from our sample using UAE-NADESs exhibited volume and concentration dependency. The findings further provide insights into the capacity of NADESs as powerful solvents for extraction applications. The lack of literature on the extraction of bioactive compounds from ANP using NADESs coupled with ultrasound-assisted techniques gives credence to the originality of the present work. Further research should be carried out to elucidate the individual constituents of the NADES-UAE extracts from ANP, and also to investigate if it is possible to directly apply the extracts obtained by the methodology used in this work to food, pharmaceutical, and cosmetic products, taking advantage of the fact that the components of the synthesized NADESs (citric acid, sucrose, fructose, xylitol, glycerol, glycine, and glucose) are widely used as additives or food, pharmaceutical, or cosmetic ingredients. Further research should also be carried out to consider if a previous stage of separation is necessary to obtain a purified extract of phenolic compounds with antiradical scavenging activity before the extracts obtained from this method could be utilized further. The current study is limited to the synthesis and application of citric acid-based NADESs to TPC and TFC extraction from ANP, and the evaluation of the crude extracts for antiradical scavenging activities using in vitro methods. The study does not involve isolation of individual compounds from the extracts, nor does it involve biological testing of the extract through animal or cell-based or in vivo studies.

Supplementary Materials

The following supporting information can be downloaded at https://www.mdpi.com/article/10.3390/horticulturae11040439/s1: Supplementary Plot S1. Contour plots of factors effects on TPC extraction from African nutmeg peels using CaSu11. Supplementary Plot S2. Contour plots of factors effects on TPC extraction from African nutmeg peels using CaFr11. Supplementary Plot S3. Contour plots of factors effects on TPC extraction from African nutmeg peels using CaFr12. Supplementary Plot S4. Contour plots of factors effects on TPC extraction from African nutmeg peels using CaFr21. Supplementary Plot S5. Contour plots of factor effects on TPC extraction from African nutmeg peels using CaXy11. Supplementary Plot S6. Contour plots of factors effects on TPC extraction from African nutmeg peels using CaXy12. Supplementary Plot S7. Contour plots of factors effects on TPC extraction from African nutmeg peels using CaXy21. Supplementary Plot S8. Contour plots of factors effects on TPC extraction from African nutmeg peels using CaGr11. Supplementary Plot S9. Contour plots of factors effects on TPC extraction from African nutmeg peels using CaGr12. Supplementary Plot S10. Contour plots of factors effects on TPC extraction from African nutmeg peels using CaGr21. Supplementary Plot S11. Contour plots of factors effects on TPC extraction from African nutmeg peels using CaGc11. Supplementary Plot S12. Contour plots of factor effects on TPC extraction from African nutmeg peels using CaGc21. Supplementary Plot S13. Contour plots of factors effects on TPC extraction from African nutmeg peels using CaGl11. Supplementary Plot S14. Contour plots of factors effects on TPC extraction from African nutmeg peels using CaGl21. Supplementary Figure S1. Fourier Transform Infrared Spectra of fourteen synthesized NADESs. Specimen S1: African nutmeg peels, peels’ powder, seeds, peels and seeds powders.

Author Contributions

U.J.O.: Conceptualization, data curation, formal analysis, investigation, methodology, project administration, validation, and writing—original draft. M.M.: Supervision and editing. D.M.: Supervision, resources, and writing—review and editing. A.C.: Supervision, editing, and funding acquisition. All authors have read and agreed to the published version of the manuscript.

Funding

This research received no external funding.

Data Availability Statement

Data generated and used in this research are available from the corresponding authors on reasonable request.

Acknowledgments

U.J.O. is very grateful to the University of Urbino Carlo Bo for providing a generous Ph.D. scholarship and to the University of Food Technologies, Plovdiv, for hosting his six-month research stay in their facility.

Conflicts of Interest

The authors declare no conflicts of interest.

Abbreviations

The following abbreviations are used in this manuscript:
NADESsNatural deep eutectic solvents
ANPAfrican nutmeg peel
UAEUltrasound-assisted extraction
UASUltrasound-assisted synthesis
UTUltrasound (extraction) temperature
ETExtraction time
SVSolvent (NADES) volume
SCSolvent (NADES) concentration
CUPRACCupric ion reducing antioxidant capacity
FRAPFerric reducing antioxidant power
DPPH2,2-Diphenyl-2-picrylhydrazyl
ARAAntiradical activity
TPCTotal phenolic content
TFCTotal flavonoid content
ChCl-LACholine chloride–lactic acid
HBAHydrogen bond acceptor
HBDHydrogen bond donor
MFATMany factors at a time
RCCRSMRotatable central composite response surface methodology
CHCLCholine chloride
FTIRFourier transform infrared spectroscopy
LSDLeast significant difference
SPSupplementary plot
SFSupplementary figure

References

  1. Sharma, A.; Soni, R.; Soni, S.K. From Waste to Wealth: Exploring Modern Composting Innovations and Compost Valorization. J. Mater. Cycles Waste Manag. 2024, 26, 20–48. [Google Scholar] [CrossRef]
  2. Waqas, M.; Hashim, S.; Humphries, U.W.; Ahmad, S.; Noor, R.; Shoaib, M.; Naseem, A.; Hlaing, P.T.; Lin, H.A. Composting Processes for Agricultural Waste Management: A Comprehensive Review. Processes 2023, 11, 731. [Google Scholar] [CrossRef]
  3. Okeke, U.J.; Micucci, M.; Mihaylova, D.; Cappiello, A. The Effects of Experimental Conditions on Extraction of Polyphenols from African Nutmeg Peels Using NADESs-UAE: A Multifactorial Modelling Technique. Sci. Rep. 2025, 15, 4890. [Google Scholar] [CrossRef]
  4. Zhuang, B.; Dou, L.-L.; Li, P.; Liu, E.-H. Deep Eutectic Solvents as Green Media for Extraction of Flavonoid Glycosides and Aglycones from Platycladi cacumen. J. Pharm. Biomed. Anal. 2017, 134, 214–219. [Google Scholar] [CrossRef] [PubMed]
  5. Yao, J.; Zeng, J.; Tang, H.; Cheng, Y.; Tan, J.; Li, T.; Li, X.; He, J.; Zhang, Y. Effect of Deep Eutectic Solvent Extraction on Auricularia Auricula Polysaccharide Solubilization and Antioxidant Potential. Sustain. Chem. Pharm. 2023, 34, 101166. [Google Scholar] [CrossRef]
  6. Yoo, D.E.; Jeong, K.M.; Han, S.Y.; Kim, E.M.; Jin, Y.; Lee, J. Deep Eutectic Solvent-Based Valorization of Spent Coffee Grounds. Food Chem. 2018, 255, 357–364. [Google Scholar] [CrossRef] [PubMed]
  7. Zannou, O.; Pashazadeh, H.; Ghellam, M.; Ibrahim, S.A.; Koca, I. Extraction of Anthocyanins from Borage (Echium amoenum) Flowers Using Choline Chloride and a Glycerol-Based, Deep Eutectic Solvent: Optimization, Antioxidant Activity, and In Vitro Bioavailability. Molecules 2021, 27, 134. [Google Scholar] [CrossRef] [PubMed]
  8. Yu, Q.; Wang, F.; Jian, Y.; Chernyshev, V.M.; Zhang, Y.; Wang, Z.; Yuan, Z.; Chen, X. Extraction of Flavonoids from Glycyrrhiza Residues Using Deep Eutectic Solvents and Its Molecular Mechanism. J. Mol. Liq. 2022, 363, 119848. [Google Scholar] [CrossRef]
  9. Yang, G.-Y.; Song, J.-N.; Chang, Y.-Q.; Wang, L.; Zheng, Y.-G.; Zhang, D.; Guo, L. Natural Deep Eutectic Solvents for the Extraction of Bioactive Steroidal Saponins from Dioscoreae Nipponicae Rhizoma. Molecules 2021, 26, 2079. [Google Scholar] [CrossRef]
  10. Wei, Z.; Qi, X.; Li, T.; Luo, M.; Wang, W.; Zu, Y.; Fu, Y. Application of Natural Deep Eutectic Solvents for Extraction and Determination of Phenolics in Cajanus Cajan Leaves by Ultra Performance Liquid Chromatography. Sep. Purif. Technol. 2015, 149, 237–244. [Google Scholar] [CrossRef]
  11. Rathee, P.; Sehrawat, R.; Rathee, P.; Khatkar, A.; Akkol, E.K.; Khatkar, S.; Redhu, N.; Türkcanoğlu, G.; Sobarzo-Sánchez, E. Polyphenols: Natural Preservatives with Promising Applications in Food, Cosmetics and Pharma Industries; Problems and Toxicity Associated with Synthetic Preservatives; Impact of Misleading Advertisements; Recent Trends in Preservation and Legislation. Materials 2023, 16, 4793. [Google Scholar] [CrossRef] [PubMed]
  12. Aires, A. Polyphenols Applications in Pharmaceutic and Cosmetic Industries. In Technologies to Recover Polyphenols from AgroFood By-Products and Wastes; Elsevier: Amsterdam, The Netherlands, 2022; pp. 337–357. ISBN 978-0-323-85273-9. [Google Scholar]
  13. Clijnk, D.; Codera, V.; Pou, J.O.; Fernandez-Garcia, J.; Gonzalez-Olmos, R. Enhancing Circular Economy of Waste Refrigerants Management Using Deep Eutectic Solvents. Sustain. Mater. Technol. 2024, 41, e01062. [Google Scholar] [CrossRef]
  14. Gao, H.; Xiao, J.; Wang, Y.; Yu, Y.; Wu, J.; Zhang, J.; Wang, Z.; Wang, S.; Luo, Q. Advancing Circular Economy: Biorefinery of Agri-Waste via Green Multicomponent Deep Eutectic Solvent Pretreatment. Ind. Crops Prod. 2025, 226, 120673. [Google Scholar] [CrossRef]
  15. Gomez-Urios, C.; Puchades-Colera, P.; Frigola, A.; Esteve, M.J.; Blesa, J.; Lopez-Malo, D. Natural Deep Eutectic Solvents: A Paradigm of Stability and Permeability in the Design of New Ingredients. J. Mol. Liq. 2024, 412, 125864. [Google Scholar] [CrossRef]
  16. Hikmawanti, N.P.E.; Ramadon, D.; Jantan, I.; Mun’im, A. Natural Deep Eutectic Solvents (NADES): Phytochemical Extraction Performance Enhancer for Pharmaceutical and Nutraceutical Product Development. Plants 2021, 10, 2091. [Google Scholar] [CrossRef] [PubMed]
  17. Olfat, A.; Mostaghim, T.; Shahriari, S.; Salehifar, M. Extraction of Bioactive Compounds of Hypnea Flagelliformis by Ultrasound-Assisted Extraction Coupled with Natural Deep Eutectic Solvent and Enzyme Inhibitory Activity. Algal Res. 2024, 78, 103388. [Google Scholar] [CrossRef]
  18. Agiriga, A.; Siwela, M. Monodora myristica (Gaertn.) Dunal: A Plant with Multiple Food, Health and Medicinal Applications: A Review. Am. J. Food Technol. 2017, 12, 271–284. [Google Scholar] [CrossRef]
  19. Florindo, C.; Oliveira, F.S.; Rebelo, L.P.N.; Fernandes, A.M.; Marrucho, I.M. Insights into the Synthesis and Properties of Deep Eutectic Solvents Based on Cholinium Chloride and Carboxylic Acids. ACS Sustain. Chem. Eng. 2014, 2, 2416–2425. [Google Scholar] [CrossRef]
  20. Rodríguez-Martínez, B.; Ferreira-Santos, P.; Alfonso, I.M.; Martínez, S.; Genisheva, Z.; Gullón, B. Deep Eutectic Solvents as a Green Tool for the Extraction of Bioactive Phenolic Compounds from Avocado Peels. Molecules 2022, 27, 6646. [Google Scholar] [CrossRef]
  21. Zhang, M.; Tian, R.; Han, H.; Wu, K.; Wang, B.; Liu, Y.; Zhu, Y.; Lu, H.; Liang, B. Preparation Strategy and Stability of Deep Eutectic Solvents: A Case Study Based on Choline Chloride-Carboxylic Acid. J. Clean. Prod. 2022, 345, 131028. [Google Scholar] [CrossRef]
  22. Kang, K.; Jia, X.; Zheng, K.; Wang, X.; Liu, B.; Hou, Y. Physical Properties of Natural Deep Eutectic Solvent and Its Application in Remediation of Heavy Metal Lead in Soil. J. Contam. Hydrol. 2023, 258, 104222. [Google Scholar] [CrossRef] [PubMed]
  23. Gomez, F.J.V.; Espino, M.; Fernández, M.A.; Silva, M.F. A Greener Approach to Prepare Natural Deep Eutectic Solvents. ChemistrySelect 2018, 3, 6122–6125. [Google Scholar] [CrossRef]
  24. Pelosi, C.; Gonzalez-Rivera, J.; Bernazzani, L.; Tiné, M.R.; Duce, C. Optimized Preparation, Thermal Characterization and Microwave Absorption Properties of Deep Eutectic Solvents Made by Choline Chloride and Hydrated Salts of Alkali Earth Metals. J. Mol. Liq. 2023, 371, 121104. [Google Scholar] [CrossRef]
  25. Montgomery, D.C. Design and Analysis of Experiments, 9th ed.; John Wiley & Sons, Inc.: Hoboken, NJ, USA, 2017; ISBN 978-1-119-11347-8. [Google Scholar]
  26. Cabrera, L.; Xavier, L.; Zecchi, B. Extraction of Phenolic Compounds with Antioxidant Activity from Olive Pomace Using Natural Deep Eutectic Solvents: Modelling and Optimization by Response Surface Methodology. Discov. Food 2024, 4, 29. [Google Scholar] [CrossRef]
  27. Alburquerque, J. Agrochemical Characterisation of “Alperujo”, a Solid by-Product of the Two-Phase Centrifugation Method for Olive Oil Extraction. Bioresour. Technol. 2004, 91, 195–200. [Google Scholar] [CrossRef]
  28. Ianni, F.; Scandar, S.; Mangiapelo, L.; Blasi, F.; Marcotullio, M.C.; Cossignani, L. NADES-Assisted Extraction of Polyphenols from Coriander Seeds: A Systematic Optimization Study. Antioxidants 2023, 12, 2048. [Google Scholar] [CrossRef]
  29. Kivrak, İ.; Duru, M.E.; Öztürk, M.; Mercan, N.; Harmandar, M.; Topçu, G. Antioxidant, Anticholinesterase and Antimicrobial Constituents from the Essential Oil and Ethanol Extract of Salvia potentillifolia. Food Chem. 2009, 116, 470–479. [Google Scholar] [CrossRef]
  30. Benzie, I.F.F.; Strain, J.J. [2] Ferric Reducing/Antioxidant Power Assay: Direct Measure of Total Antioxidant Activity of Biological Fluids and Modified Version for Simultaneous Measurement of Total Antioxidant Power and Ascorbic Acid Concentration. In Methods in Enzymology; Elsevier: Amsterdam, The Netherlands, 1999; Volume 299, pp. 15–27. ISBN 978-0-12-182200-2. [Google Scholar]
  31. Lim, C.S.H.; Lim, S.L. Ferric Reducing Capacity Versus Ferric Reducing Antioxidant Power for Measuring Total Antioxidant Capacity. Lab. Med. 2013, 44, 51–55. [Google Scholar] [CrossRef]
  32. Apak, R.; Güçlü, K.; Özyürek, M.; Bektaşoğlu, B.; Bener, M. Cupric Ion Reducing Antioxidant Capacity Assay for Antioxidants in Human Serum and for Hydroxyl Radical Scavengers. In Advanced Protocols in Oxidative Stress II; Armstrong, D., Ed.; Methods in Molecular Biology; Humana Press: Totowa, NJ, USA, 2010; Volume 594, pp. 215–239. ISBN 978-1-60761-410-4. [Google Scholar]
  33. Akyüz, E.; Türkoğlu, S.; Sözgen Başkan, K.; Tütem, E.; Apak, M.R. Comparison of Antioxidant Capacities and Antioxidant Components of Commercial Bitter Melon (Momordicacharantia L.) Products. Turk. J. Chem. 2020, 44, 1663–1673. [Google Scholar] [CrossRef]
  34. Brand-Williams, W.; Cuvelier, M.E.; Berset, C. Use of a Free Radical Method to Evaluate Antioxidant Activity. LWT—Food Sci. Technol. 1995, 28, 25–30. [Google Scholar] [CrossRef]
  35. Wang, H.; Tao, Y.; Masuku, M.V.; Cao, J.; Yang, J.; Huang, K.; Ge, Y.; Yu, Y.; Xiao, Z.; Kuang, Y.; et al. Effects of Deep Eutectic Solvents on the Biotransformation Efficiency of ω-Transaminase. J. Mol. Liq. 2023, 377, 121379. [Google Scholar] [CrossRef]
  36. Hayyan, M.; Mbous, Y.P.; Looi, C.Y.; Wong, W.F.; Hayyan, A.; Salleh, Z.; Mohd-Ali, O. Natural Deep Eutectic Solvents: Cytotoxic Profile. SpringerPlus 2016, 5, 913. [Google Scholar] [CrossRef] [PubMed]
  37. Dai, Y.; Witkamp, G.-J.; Verpoorte, R.; Choi, Y.H. Tailoring Properties of Natural Deep Eutectic Solvents with Water to Facilitate Their Applications. Food Chem. 2015, 187, 14–19. [Google Scholar] [CrossRef]
  38. Zaman, S.U.; Mehdi, M.S.; Umar, M.; Rafiq, S.; Saif-ur-Rehman; Zaman, M.K.U.; Javed, M.D.; Waseem, M.A.; Tahir, N. Preparation of Ammonium Persulfate/Glycerol Based Novel Deep Eutectic Solvent under Controlled Conditions; Characterizations, Physical Properties. J. Mol. Struct. 2023, 1283, 135265. [Google Scholar] [CrossRef]
  39. Rodriguez Rodriguez, N.; van den Bruinhorst, A.; Kollau, L.J.B.M.; Kroon, M.C.; Binnemans, K. Degradation of Deep-Eutectic Solvents Based on Choline Chloride and Carboxylic Acids. ACS Sustain. Chem. Eng. 2019, 7, 11521–11528. [Google Scholar] [CrossRef]
  40. Delgado-Mellado, N.; Larriba, M.; Navarro, P.; Rigual, V.; Ayuso, M.; García, J.; Rodríguez, F. Thermal Stability of Choline Chloride Deep Eutectic Solvents by TGA/FTIR-ATR Analysis. J. Mol. Liq. 2018, 260, 37–43. [Google Scholar] [CrossRef]
  41. Xu, F.-X.; Zhang, J.-Y.; Jin, J.; Li, Z.-G.; She, Y.-B.; Lee, M.-R. Microwave-Assisted Natural Deep Eutectic Solvents Pretreatment Followed by Hydrodistillation Coupled with GC-MS for Analysis of Essential Oil from Turmeric (Curcuma longa L.). J. Oleo Sci. 2021, 70, 1481–1494. [Google Scholar] [CrossRef] [PubMed]
  42. Jeong, K.M.; Jin, Y.; Yoo, D.E.; Han, S.Y.; Kim, E.M.; Lee, J. One-Step Sample Preparation for Convenient Examination of Volatile Monoterpenes and Phenolic Compounds in Peppermint Leaves Using Deep Eutectic Solvents. Food Chem. 2018, 251, 69–76. [Google Scholar] [CrossRef] [PubMed]
  43. Gutiérrez, M.C.; Ferrer, M.L.; Mateo, C.R.; Del Monte, F. Freeze-Drying of Aqueous Solutions of Deep Eutectic Solvents: A Suitable Approach to Deep Eutectic Suspensions of Self-Assembled Structures. Langmuir 2009, 25, 5509–5515. [Google Scholar] [CrossRef]
  44. Santana, A.P.R.; Mora-Vargas, J.A.; Guimarães, T.G.S.; Amaral, C.D.B.; Oliveira, A.; Gonzalez, M.H. Sustainable Synthesis of Natural Deep Eutectic Solvents (NADES) by Different Methods. J. Mol. Liq. 2019, 293, 111452. [Google Scholar] [CrossRef]
  45. Hsieh, Y.-H.; Li, Y.; Pan, Z.; Chen, Z.; Lu, J.; Yuan, J.; Zhu, Z.; Zhang, J. Ultrasonication-Assisted Synthesis of Alcohol-Based Deep Eutectic Solvents for Extraction of Active Compounds from Ginger. Ultrason. Sonochem. 2020, 63, 104915. [Google Scholar] [CrossRef] [PubMed]
  46. Wen, C.; Zhang, J.; Zhang, H.; Dzah, C.S.; Zandile, M.; Duan, Y.; Ma, H.; Luo, X. Advances in Ultrasound Assisted Extraction of Bioactive Compounds from Cash Crops—A Review. Ultrason. Sonochem. 2018, 48, 538–549. [Google Scholar] [CrossRef] [PubMed]
  47. Sardroudi, H.; Javadi, A.; Jafarizadeh-Malmiri, H.; Anarjan, N.; Mirzaei, H. Different Deep Eutectic Solvents in Lutein Extraction from Lyophilized Egg Yolk: Preparation, Screening and Characterization. Waste Biomass Valor 2023, 15, 1379–1389. [Google Scholar] [CrossRef]
  48. Yadav, A.; Kar, J.R.; Verma, M.; Naqvi, S.; Pandey, S. Densities of Aqueous Mixtures of (Choline Chloride+ethylene Glycol) and (Choline Chloride+malonic Acid) Deep Eutectic Solvents in Temperature Range 283.15–363.15K. Thermochim. Acta 2015, 600, 95–101. [Google Scholar] [CrossRef]
  49. Kalhor, P.; Ghandi, K. Deep Eutectic Solvents for Pretreatment, Extraction, and Catalysis of Biomass and Food Waste. Molecules 2019, 24, 4012. [Google Scholar] [CrossRef]
  50. Moradi, H.; Farzi, N. Experimental and Computational Assessment of the Physicochemical Properties of Choline Chloride/Ethylene Glycol Deep Eutectic Solvent in 1:2 and 1:3 Mole Fractions and 298.15–398.15 K. J. Mol. Liq. 2021, 339, 116669. [Google Scholar] [CrossRef]
  51. Dai, Y.; Witkamp, G.-J.; Verpoorte, R.; Choi, Y.H. Natural Deep Eutectic Solvents as a New Extraction Media for Phenolic Metabolites in Carthamus tinctorius L. Anal. Chem. 2013, 85, 6272–6278. [Google Scholar] [CrossRef]
  52. Che Zain, M.S.; Yeoh, J.X.; Lee, S.Y.; Shaari, K. Physicochemical Properties of Choline Chloride-Based Natural Deep Eutectic Solvents (NaDES) and Their Applicability for Extracting Oil Palm Flavonoids. Sustainability 2021, 13, 12981. [Google Scholar] [CrossRef]
  53. Panić, M.; Radošević, K.; Radojčić Redovniković, I.; Zagajski Kučan, K.; Sander, A.; Halambek, J.; Prlić Kardum, J.; Mitar, A. Physicochemical Properties, Cytotoxicity, and Antioxidative Activity of Natural Deep Eutectic Solvents Containing Organic Acid. Chem. Biochem. Eng. Q. 2019, 33, 1–18. [Google Scholar] [CrossRef]
  54. Abbott, A.P.; Harris, R.C.; Ryder, K.S. Application of Hole Theory to Define Ionic Liquids by Their Transport Properties. J. Phys. Chem. B 2007, 111, 4910–4913. [Google Scholar] [CrossRef]
  55. Biernacki, K.; Souza, H.K.S.; Almeida, C.M.R.; Magalhães, A.L.; Gonçalves, M.P. Physicochemical Properties of Choline Chloride-Based Deep Eutectic Solvents with Polyols: An Experimental and Theoretical Investigation. ACS Sustain. Chem. Eng. 2020, 8, 18712–18728. [Google Scholar] [CrossRef]
  56. Neri, L.; Di Mattia, C.D.; Sacchetti, G.; Pittia, P.; Mastrocola, D. The Influence of Water Activity and Molecular Mobility on Pectinmethylesterase Activity in Salt and Glucose–Maltodextrin Model Systems. Food Bioprod. Process. 2018, 107, 1–9. [Google Scholar] [CrossRef]
  57. Sato, Y.; Miyawaki, O. Analysis of Hydration Parameter for Sugars Determined from Viscosity and Its Relationship with Solution Parameters. Food Chem. 2016, 190, 594–598. [Google Scholar] [CrossRef]
  58. Behboudi, E.; Shekaari, H.; Zafarani-Moattar, M.T. Water Activity in Aqueous Solution of Sucrose in the Presence of Some Deep Eutectic Solvents. J. Chem. Eng. Data 2021, 66, 1043–1054. [Google Scholar] [CrossRef]
  59. Sazali, A.L.; AlMasoud, N.; Amran, S.K.; Alomar, T.S.; Pa’ee, K.F.; El-Bahy, Z.M.; Yong, T.-L.K.; Dailin, D.J.; Chuah, L.F. Physicochemical and Thermal Characteristics of Choline Chloride-Based Deep Eutectic Solvents. Chemosphere 2023, 338, 139485. [Google Scholar] [CrossRef]
  60. Liu, C.; Fang, H.; Qiao, Y.; Zhao, J.; Rao, Z. Properties and Heat Transfer Mechanistic Study of Glycerol/Choline Chloride Deep Eutectic Solvents Based Nanofluids. Int. J. Heat Mass Transf. 2019, 138, 690–698. [Google Scholar] [CrossRef]
  61. Francisco, M.; van den Bruinhorst, A.; Kroon, M.C. New Natural and Renewable Low Transition Temperature Mixtures (LTTMs): Screening as Solvents for Lignocellulosic Biomass Processing. Green Chem. 2012, 14, 2153. [Google Scholar] [CrossRef]
  62. AlOmar, M.K.; Hayyan, M.; Alsaadi, M.A.; Akib, S.; Hayyan, A.; Hashim, M.A. Glycerol-Based Deep Eutectic Solvents: Physical Properties. J. Mol. Liq. 2016, 215, 98–103. [Google Scholar] [CrossRef]
  63. Florindo, C.; Branco, L.C.; Marrucho, I.M. Development of Hydrophobic Deep Eutectic Solvents for Extraction of Pesticides from Aqueous Environments. Fluid Phase Equilibria 2017, 448, 135–142. [Google Scholar] [CrossRef]
  64. Alcalde, R.; Gutiérrez, A.; Atilhan, M.; Aparicio, S. An Experimental and Theoretical Investigation of the Physicochemical Properties on Choline Chloride—Lactic Acid Based Natural Deep Eutectic Solvent (NADES). J. Mol. Liq. 2019, 290, 110916. [Google Scholar] [CrossRef]
  65. Shishov, A.; Pochivalov, A.; Dubrovsky, I.; Bulatov, A. Deep Eutectic Solvents with Low Viscosity for Automation of Liquid-Phase Microextraction Based on Lab-in-Syringe System: Separation of Sudan Dyes. Talanta 2023, 255, 124243. [Google Scholar] [CrossRef]
  66. Skulcova, A.; Russ, A.; Jablonsky, M.; Sima, J. The pH Behavior of Seventeen Deep Eutectic Solvents. BioRes 2018, 13, 5042–5051. [Google Scholar] [CrossRef]
  67. Lemaoui, T.; Abu Hatab, F.; Darwish, A.S.; Attoui, A.; Hammoudi, N.E.H.; Almustafa, G.; Benaicha, M.; Benguerba, Y.; Alnashef, I.M. Molecular-Based Guide to Predict the pH of Eutectic Solvents: Promoting an Efficient Design Approach for New Green Solvents. ACS Sustain. Chem. Eng. 2021, 9, 5783–5808. [Google Scholar] [CrossRef]
  68. Ghaedi, H.; Ayoub, M.; Sufian, S.; Lal, B.; Uemura, Y. Thermal Stability and FT-IR Analysis of Phosphonium-Based Deep Eutectic Solvents with Different Hydrogen Bond Donors. J. Mol. Liq. 2017, 242, 395–403. [Google Scholar] [CrossRef]
  69. Silva, D.T.D.; Pauletto, R.; Cavalheiro, S.D.S.; Bochi, V.C.; Rodrigues, E.; Weber, J.; Silva, C.D.B.D.; Morisso, F.D.P.; Barcia, M.T.; Emanuelli, T. Natural Deep Eutectic Solvents as a Biocompatible Tool for the Extraction of Blueberry Anthocyanins. J. Food Compos. Anal. 2020, 89, 103470. [Google Scholar] [CrossRef]
  70. Rashid, R.; Mohd Wani, S.; Manzoor, S.; Masoodi, F.A.; Masarat Dar, M. Green Extraction of Bioactive Compounds from Apple Pomace by Ultrasound Assisted Natural Deep Eutectic Solvent Extraction: Optimisation, Comparison and Bioactivity. Food Chem. 2023, 398, 133871. [Google Scholar] [CrossRef] [PubMed]
  71. Ozturk, B.; Parkinson, C.; Gonzalez-Miquel, M. Extraction of Polyphenolic Antioxidants from Orange Peel Waste Using Deep Eutectic Solvents. Sep. Purif. Technol. 2018, 206, 1–13. [Google Scholar] [CrossRef]
  72. Vanda, H.; Dai, Y.; Wilson, E.G.; Verpoorte, R.; Choi, Y.H. Green Solvents from Ionic Liquids and Deep Eutectic Solvents to Natural Deep Eutectic Solvents. Comptes Rendus Chim. 2018, 21, 628–638. [Google Scholar] [CrossRef]
  73. Zannou, O.; Pashazadeh, H.; Ghellam, M.; Ali Redha, A.; Koca, I. Enhanced Ultrasonically Assisted Extraction of Bitter Melon (Momordica charantia) Leaf Phenolic Compounds Using Choline Chloride-Acetic Acid–Based Natural Deep Eutectic Solvent: An Optimization Approach and in Vitro Digestion. Biomass Conv. Bioref. 2022, 14, 11491–11503. [Google Scholar] [CrossRef]
  74. Pontes, P.V.d.A.; Czaikoski, A.; Almeida, N.A.; Fraga, S.; Rocha, L.d.O.; Cunha, R.L.; Maximo, G.J.; Batista, E.A.C. Extraction Optimization, Biological Activities, and Application in O/W Emulsion of Deep Eutectic Solvents-Based Phenolic Extracts from Olive Pomace. Food Res. Int. 2022, 161, 111753. [Google Scholar] [CrossRef]
  75. Bertolo, M.R.V.; Martins, V.C.A.; Plepis, A.M.G.; Bogusz, S. Utilization of Pomegranate Peel Waste: Natural Deep Eutectic Solvents as a Green Strategy to Recover Valuable Phenolic Compounds. J. Clean. Prod. 2021, 327, 129471. [Google Scholar] [CrossRef]
  76. Obluchinskaya, E.; Pozharitskaya, O.; Shevyrin, V.; Kovaleva, E.; Flisyuk, E.; Shikov, A. Optimization of Extraction of Phlorotannins from the Arctic Fucus Vesiculosus Using Natural Deep Eutectic Solvents and Their HPLC Profiling with Tandem High-Resolution Mass Spectrometry. Mar. Drugs 2023, 21, 263. [Google Scholar] [CrossRef] [PubMed]
  77. Koraqi, H.; Aydar, A.Y.; Khalid, W.; Ercisli, S.; Rustagi, S.; Ramniwas, S.; Pandiselvam, R. Ultrasound-Assisted Extraction with Natural Deep Eutectic Solvent for Phenolic Compounds Recovery from Rosa Damascene Mill.: Experimental Design Optimization Using Central Composite Design. Microchem. J. 2024, 196, 109585. [Google Scholar] [CrossRef]
  78. Al-Dhabi, N.A.; Ponmurugan, K.; Maran Jeganathan, P. Development and Validation of Ultrasound-Assisted Solid-Liquid Extraction of Phenolic Compounds from Waste Spent Coffee Grounds. Ultrason. Sonochemistry 2017, 34, 206–213. [Google Scholar] [CrossRef]
  79. Luque-García, J.L.; Luque De Castro, M.D. Ultrasound: A Powerful Tool for Leaching. TrAC Trends Anal. Chem. 2003, 22, 41–47. [Google Scholar] [CrossRef]
  80. Şahin, S.; Şamlı, R. Optimization of Olive Leaf Extract Obtained by Ultrasound-Assisted Extraction with Response Surface Methodology. Ultrason. Sonochemistry 2013, 20, 595–602. [Google Scholar] [CrossRef]
  81. Zhang, Z.-S.; Wang, L.-J.; Li, D.; Jiao, S.-S.; Chen, X.D.; Mao, Z.-H. Ultrasound-Assisted Extraction of Oil from Flaxseed. Sep. Purif. Technol. 2008, 62, 192–198. [Google Scholar] [CrossRef]
  82. Mohammadpour, H.; Sadrameli, S.M.; Eslami, F.; Asoodeh, A. Optimization of Ultrasound-Assisted Extraction of Moringa Peregrina Oil with Response Surface Methodology and Comparison with Soxhlet Method. Ind. Crops Prod. 2019, 131, 106–116. [Google Scholar] [CrossRef]
  83. Bener, M.; Şen, F.B.; Önem, A.N.; Bekdeşer, B.; Çelik, S.E.; Lalikoglu, M.; Aşçı, Y.S.; Capanoglu, E.; Apak, R. Microwave-Assisted Extraction of Antioxidant Compounds from by-Products of Turkish Hazelnut (Corylus avellana L.) Using Natural Deep Eutectic Solvents: Modeling, Optimization and Phenolic Characterization. Food Chem. 2022, 385, 132633. [Google Scholar] [CrossRef]
  84. Mišan, A.; Nađpal, J.; Stupar, A.; Pojić, M.; Mandić, A.; Verpoorte, R.; Choi, Y.H. The Perspectives of Natural Deep Eutectic Solvents in Agri-Food Sector. Crit. Rev. Food Sci. Nutr. 2020, 60, 2564–2592. [Google Scholar] [CrossRef]
  85. Macchioni, V.; Carbone, K.; Cataldo, A.; Fraschini, R.; Bellucci, S. Lactic Acid-Based Deep Natural Eutectic Solvents for the Extraction of Bioactive Metabolites of Humulus lupulus L.: Supramolecular Organization, Phytochemical Profiling and Biological Activity. Sep. Purif. Technol. 2021, 264, 118039. [Google Scholar] [CrossRef]
  86. Bus, K.; Szterk, A. Relationship between Structure and Biological Activity of Various Vitamin K Forms. Foods 2021, 10, 3136. [Google Scholar] [CrossRef] [PubMed]
  87. Teplova, V.V.; Isakova, E.P.; Klein, O.I.; Dergachova, D.I.; Gessler, N.N.; Deryabina, Y.I. Natural Polyphenols: Biological Activity, Pharmacological Potential, Means of Metabolic Engineering (Review). Appl. Biochem. Microbiol. 2018, 54, 221–237. [Google Scholar] [CrossRef]
  88. Mansinhos, I.; Gonçalves, S.; Rodríguez-Solana, R.; Ordóñez-Díaz, J.L.; Moreno-Rojas, J.M.; Romano, A. Ultrasonic-Assisted Extraction and Natural Deep Eutectic Solvents Combination: A Green Strategy to Improve the Recovery of Phenolic Compounds from Lavandula pedunculata Subsp. Lusitanica (Chaytor) Franco. Antioxidants 2021, 10, 582. [Google Scholar] [CrossRef]
  89. Wang, W.; An, M.; Zhao, G.; Wang, Y.; Yang, D.; Zhang, D.; Zhao, L.; Han, J.; Wu, G.; Bo, Y. Ultrasonic-Assisted Customized Natural Deep Eutectic Solvents Extraction of Polyphenols from Chaenomeles speciosa. Microchem. J. 2023, 193, 108952. [Google Scholar] [CrossRef]
  90. Kutlu, N.; Kamiloğlu, A.; Abca, T.E.; Yilmaz, Ö. Ultrasound-assisted Deep Eutectic Solvent Extraction of Bioactive Compounds from Persimmon Calyx. J. Food Sci. 2024, 89, 294–305. [Google Scholar] [CrossRef]
Figure 1. Effects of extraction conditions, HBD types, and HBA–HBD ratios on the extraction of TPC from ANP using the NADES-UAE technique (means of 30 replicates, p ≤ 0.5).
Horticulturae 11 00439 g001
Figure 2. Effects of extraction conditions, HBD types, and HBA–HBD ratios on the extraction of TFC from ANP using the NADES-UAE technique (means of 30 replicates, p ≤ 0.5).
Horticulturae 11 00439 g002
Figure 3. Effects of extraction conditions, HBD types, and HBA–HBD ratios on FRAP antiradical activity of ANP extracts using the NADES-UAE technique (means of 30 replicates, p ≤ 0.5).
Horticulturae 11 00439 g003
Figure 4. Effects of extraction conditions, HBD types, and HBA–HBD ratios on CUPFRAC antiradical activity of ANP extracts using the NADES-UAE technique (means of 30 replicates, p ≤ 0.5).
Horticulturae 11 00439 g004
Table 1. Screening experiment for ultrasound-assisted synthesis of NADESs shown as coded and uncoded factors.
RunCodedUncoded
ABCTemperature (°C) Time (h)HBA:HBD Ratio
1231702.01:1
2212701.01:2
3223701.52:1
4232702.01:2
5111501.01:1
6322901.51:2
7112501.01:2
8333902.02:1
9123501.52:1
10132502.01:2
11222701.51:2
12312901.01:2
13113501.02:1
14233702.02:1
15331902.01:1
16133502.02:1
17131502.01:1
18311901.01:1
19313901.02:1
20332902.01:2
21221701.51:1
22121501.51:1
23211701.01:1
24321901.51:1
25213701.02.1
26122501.51:2
27323901.52:1
Table 2. Two by four fraction factorial (MFAT) design with two center points for screening the extraction of phenolic compounds from African nutmeg peels using the NADES-UAE technique.
Model ID(A) Temperature (°C)(B) Time (min)(C) Volume (mL)(D) Concentration (%)
(1)− (40)− (10)− (10)− (60)
c− (40)− (10)+ (20)− (60)
ab+ (60)+ (20)− (10)− (60)
ac+ (60)− (10)+(20)− (60)
ad+ (60)− (10)− (10)+ (80)
bc− (40)+ (20)+ (20)− (60)
cd− (40)− (10)+ (20)+ (80)
abcd+ (60)+ (20)+ (20)+ (80)
Ç0 (50)0 (15)0 (15)0 (70)
Ç0 (50)0 (15)0 (150)0 (70)
Ç is the central point.
Table 3. Central composite design of response surface methodology for optimization of extraction of phenolic compounds from African nutmeg peels using the NADES-UAE technique.
VariableCoded Levels
−α−10+1
Experimental Actual Values
Ultrasound temperature (UT) (°C)3040506070
Extraction time (ET) (min)510152025
Solvent volume (SV) (mL)510152025
Solvent concentration (SC) (%)5060708090
Table 4. Natural deep eutectic solvents (NADESs), synthesis conditions, and physical appearance.
S/NoCodeHBAHBDHBA:HBD
Ratio
Synthesis
Temperature (°C)
Synthesis Time (min)Physical
Appearance
1CaSu11Citric acidSucrose1:17060Orange-yellow
2CaFr11Citric acidFructose1:17060Faintly yellow
3CaFr12Citric acidFructose1:27060Yellow
4CaFr21Citric acidFructose2:17060Yellow
5CaXy11Citric acidXylitol1:17060Colorless
6CaXy12Citric acidXylitol1:27060Colorless
7CaXy21Citric acidXylitol2:17060Colorless
8CaGr11Citric acidGlycerol1:17060Colorless
9CaGr12Citric acidGlycerol1:27060Colorless
10CaG21Citric acidGlycerol2:17060Colorless
11CaGc11Citric acidGlycine1:17060Colorless
12CaGc21Citric acidGlycine2:17060Colorless
13CaGl11Citric acidGlucose1:17060Yellow
14CaGl21Citric acidGlucose2:17060yellow
Table 5. Physical properties of the synthesized NADESs.
NADESsHBAHBDRatiopHWater ActivityViscosity (pa. s)Density (g/cm3)
CaSu11Citric acidsucrose1:11.92 ± 0.00C0.73 ± 0.010F0.3545 ± 0.0003A1.3768 ± 0.0002A
CaFr11Citric acidfructose1:11.75 ± 0.01H 0.77 ± 0.006DE0.0805 ± 0.0001F1.3293 ± 0.0003B
CaFr12Citric acidfructose1:21.90 ± 0.01C0.76 ± 0.010E0.1797 ± 0.0002B1.3768 ± 0.0008A
CaFr21Citric acidfructose2:11.84 ± 0.00EF 0.72 ± 0.010FG0.1221 ± 0.0001D1.3770 ± 0.0000A
CaXy11Citric acidxylitol1:11.85 ± 0.05E0.78 ± 0.010CD0.0269 ± 0.0001J1.2818 ± 0.0004C
CaXy12Citric acidxylitol1:21.90 ± 0.03C0.76 ± 0.010E0.0806 ± 0.0002F1.2818 ± 0.0008C
CaXy21Citric acidxylitol2:11.89 ± 0.03CD 0.72 ± 0.006FG0.0871 ± 0.0001E1.3293 ± 0.0002B
CaGr11Citric acidglycerol1:11.68 ± 0.02I 0.79 ± 0.000C0.0131 ± 0.0001M1.2344 ± 0.0004D
CaGr12Citric acidglycerol1:21.86 ± 0.02DE 0.77 ± 0.010DE0.0191 ± 0.0020L1.2344 ± 0.0006D
CaGr21Citric acidglycerol2:11.78 ± 0.01GH0.77 ± 0.010DE0.0525 ± 0.0005H1.3293 ± 0.0003B
CaGc11Citric acidglycine1:12.61 ± 0.04A0.83 ± 0.010A0.0204 ± 0.0000K1.3293 ± 0.0004B
CaGc21Citric acidglycine2:12.39 ± 0.01B0.81 ± 0.000B0.0760 ± 0.0020G1.3293 ± 0.0004B
CaGl11Citric acidglucose1:11.81 ± 0.01FG0.77 ± 0.010DE0.0438 ± 0.0001I1.2818 ± 0.0004C
CaGl21Citric acidglucose2:11.71 ± 0.01I0.71 ± 0.010G0.1313 ± 0.0002C1.3293 ± 0.0003B
Results presented as mean ± SD of 3 replicates. Means that do not share a letter among the same responses are significantly different (p ≤ 0.5).
Table 6. Prominent characteristic functional groups in the FTIR peaks of the synthesized NADESs.
NADESsPEAKS
1(OH)2(CH)3(RCOOR)4(C=C)5(=CH2)6789(C-O)10(C=C; =CH2)
CaSu11330629361713163914001333120911011028897
CaFr113327294117151655163813981339121711401101
CaFr123288294117171655164716391398134112171144
CaFr213375294317111638139813191206113011031057
CaXy11332129491713163813981211112610571001876
CaXy123298294317131639139813171211112510961001
CaXy213385324629492565170916321396120411191043
CaGr11335829511713163913961319121111131042991
CaGr12328729491717163913961319120911111040991
CaGr21336829552581170916381396131711191043989
CaGc113374323117111624150814061319121911251038
CaGc213393320829532615170916241508139813191209
CaGl113321293617131638139813171213110510761028
CaGl213372321829412585171316361396131512061109
Table 7. Antioxidant and antiradical scavenging power of African nutmeg peels extracted with NADESs based on MFAT experimental design.
NADESsRunsTPC (mgGAE/g)TFC (µgQE/g)FRAP (µMTE/g)CUPRAC (µMTE/g)
CaSu1130270.6B331.3BCD2.954BC3.147A
CaFr1130389.2A421.4BC5.848A4.718A
CaFr1230458.0A262.7CD4.278ABC4.341A
CaFr2130163.7C271.3CD4.571AB4.359A
CaXy1130174.3BC172.1D4.132ABC3.910A
CaXy1230136.7C249.2CD3.225ABC3.274A
CaXy2130125.3C175.0D3.696ABC3.934A
CaGr1130147.8C208.7D3.246ABC4.241A
CaGr1230167.6C199.0D3.552ABC4.101A
CaGr2130143.4C188.7D3.123ABC4.393A
CaGc1130146.93C897.3A2.236BC3.852A
CaGc2130123.0C482.6B1.641C3.790A
CaGl1130143.3C265.3CD2.222BC3.798A
CaGl2130139.0C330.1BCD2.057BC3.626A
Results presented as the means of 30 runs. Means that do not share a letter among the same responses are significantly different (p ≤ 0.5). TPC = total phenolic content, TFC = total flavonoid content, FRAP = ferric reducing antioxidant power, CUPRAC = cupric ion reducing antioxidant capacity.
Table 8. Experimental conditions and results for the extraction of phenolic compounds from, and antiradical scavenging activity of ANP using the NADES-UAE techniques according to a central composite response surface design.
RunExp. IDConditions ªResponse ɓ
X1X2X3X4TPC
(mgGAE/g)
TFC
(µgQE/g)
CUPRAC
(µMTE/g)
FRAP
(µMTE/g)
DPPH (%)
1abd60 (1)20 (1)10 (−1)80 (1)179.09 ± 0.7561.328 ± 0.783.1702 ± 0.010.7490 ± 0.0126.7 ± 0.1
2b40 (−1)20 (1)10 (−1)60 (−1)113.4 ± 2.47116.41 ± 1.566.2274 ± 0.030.7387 ± 0.0189.6 ± 0.1
3050 (0)15 (0)15 (0)70 (0)260.05 ± 0.42339.26 ± 1.174.8886 ± 0.041.0656 ± 0.0189.0 ± 0.1
4(1)40 (−1)10 (−1)10 (−1)60 (−1)164.05 ± 1.5860.026 ± 1.193.1864 ± 0.030.8105 ± 0.01653.6 ± 0.1
5ab60 (1)20 (1)10 (−1)60 (−1)229.25 ± 0.2875.65 ± 1.973.1702 ± 0.031.7003 ± 0.00917.2 ± 0.2
6d40 (−1)10 (−1)10 (−1)80 (1)168.63 ± 0.98546.61 ± 1.86.3889 ± 0.031.539 ± 0.01814.6 ± 0.1
7cd40 (−1)10 (−1)20 (1)80 (1)635.29 ± 1.96457.03 ± 10.98.0685 ± 0.062.7236 ± 0.00918.4 ± 0.1
8bc40 (−1)20 (1)20 (1)60 (−1)650.33 ± 0.57120.57 ± 1.86.4212 ± 0.0310.267 ± 0.01810.5 ± 0.4
9abc60 (1)20 (1)20 (1)60 (−1)221.24 ± 1.13414.32 ± 1.86.292 ± 0.111.9903 ± 0.01813.7 ± 0.2
10ad60 (1)10 (−1)10 (−1)80 (1)322.71 ± 0.28284.51 ± 0.94.196 ± 0.011.2618 ± 0.0097.33 ± 0.6
11bd40 (−1)20 (1010 (−1)80 (1)183.5 ± 1.0261.59 ± 1.83.2187 ± 0.010.7413 ± 0.00919.2 ± 0.1
12ac60 (1)10 (−1)20 (1)60 (−1)695.42 ± 2.83123.7 ± 1.86.2435 ± 0.031.4774 ± 0.00921.5 ± 0.2
13abcd60 (1)20 (1)20 (1)80 (1)276.47 ± 0.98122.14 ± 4.516.4212 ± 0.061.4364 ± 0.01831.7 ± 0.2
14a60 (1)10 (−1)10 (−1)60 (−1)237.09 ± 1.9859.245 ± 0.453.0895 ± 0.010.7439 ± 0.01363.9 ± 0.1
15c40 (−1)10 (−1)20 (1)60 (−1)379.09 ± 1.13831.77 ± 3.6112.6163 ± 0.11.5441 ± 0.0091.51 ± 0.1
16acd60 (1)10 (−1)20 (1)80 (1)406.54 ± 3.011313.0 ± 3.6112.33 ± 0.012.9344 ± 0.01824.9 ± 0.1
17bcd40 (−1)20 (1)20 (1)80 (1)620.92 ± 1.13755.73 ± 7.2212.52 ± 0.013.0164 ± 0.01874.7 ± 0.1
1850 (0)15 (0)25 (α)70 (0)231.21 ± 1.42345.7 ± 6.7715.4877 ± 0.143.7449 ± 0.04473.6 ± 0.3
1970 (α)15 (0)15 (0)70 (0)370.74 ± 1.9591.99 ± 4.064.6827 ± 0.021.0735 ± 0.00720.6 ± 0.2
2050 (0)15 (0)15 (0)90 (α)148.04 ± 0.85290.23 ± 1.359.3653 ± 0.042.3854 ± 0.02722.4 ± 0.4
2150 (0)25 (α)15 (0)70 (0)409.31 ± 3.06347.27 ± 5.419.3411 ± 0.042.17 ± 0.01315.5 ± 0.1
22−bα50 (0)5 (−α)15 (0)70 (0)302.45 ± 2.25311.33 ± 5.419.2926 ± 0.082.2623 ± 0.01317.9 ± 0.2
23−aα30 (−α)15 (0)15 (0)70 (0)100 ± 1.47862.89 ± 5.419.6318 ± 0.042.1931 ± 0.0133.15 ± 0.4
24−dα50 (0)15 (0)15 (0)50 (−α)332.84 ± 1.12130.27 ± 0.684.8401 ± 0.061.1273 ± 0.0220.2 ± 0.3
25−cα50 (0)15 (0)5 (−α)70 (0)147.22 ± 1.560.286 ± 0.453.1379 ± 0.010.521 ± 0.34662.1 ± 0.1
ª X1: temperature (°C); X2: time (min); X3: volume (mL); X4: concentration (%). Actual and coded (in parenthesis) values. ɓ TPC (mg GAE/g db); TFC (µG QE/g db); CUPRAC and FRAP (µmol TE/g db). Mean ± SD of 3 replicates (p ≤ 0.5).
Table 9. Analysis of variance (ANOVA) summary statistics for response surface modeling of extraction of phenolic compounds and antiradical scavenging activity of ANP using the CaFr12 NADES-UAE techniques.
Model Comp ª.Response
TPCTFCCUPRACFRAPDPPH
F-Valuep-Value F-Valuep-ValueF-Valuep-ValueF-Valuep-ValueF-Valuep-Value
X10.250.61810.830.00218.640.00016.180.0000.210.650
X21.090.3019.180.0033.170.0796.950.01010.180.003
X363.610.00030.930.000148.550.00065.150.0003.800.058
X40.750.39011.720.00113.750.0002.680.1060.460.500
X120.390.5363.150.0803.020.0861.620.20862.540.000
X2211.160.0010.060.81121.310.0006.740.01154.390.000
X320.020.8961.140.28921.260.0005.320.0243.210.081
X420.880.3530.990.3242.780.1008.020.00647.250.000
X1X215.100.0000.280.6011.590.21214.280.00080.730.000
X1X316.610.0000.050.8251.460.23120.220.0001.500.227
X1X43.590.0510.680.4132.010.1616.390.0141.000.323
X2X30.410.5261.790.1842.360.12913.530.000--
X2X40.000.9636.140.01518.640.00030.210.000--
X3X40.220.6431.040.3123.170.0795.650.020--
model10.240.00073.670.00038.40.00019.9340.00035.5120.000
Lack of fit0.620.8430.0280.9630.2700.8010.240.9680.710.812
Pure error0.84 0.49 0.65 0.18 0.92
ª X1 temperature in °C, X2 time in min, X3 solvent volume in mL, X4 solvent concentration in %. X12, X22, X32, and X42 are the square factors corresponding quadratic functions, while X1X2, X1X3, X1X4, X2X3, X2X4, and X3X4 are the various factor interactions. The p-values in bold are statistically significant.
Table 10. Regression coefficients for full quadratic response surface models (in coded variables) for the study of extraction of phenolics and antiradical scavenging activity of ANP using CaFr12 as a solvent with ultrasound-assisted extraction techniques.
Coefficients ª TPCTFCCUPRACFRAPDPPH
(I)−2111−93038.10.5−1825
X152.6−66.6−0.479−0.08528.17
X217.3129−0.1441.05145.73
X3102.633−0.5260.6817.48
X41.243.2−0.572−0.29823.25
X120.0750.4280.003260.0014−0.181
X221.6030.2310.034650.01142−0.6751
X32−0.063−1.0320.034610.01073−0.1639
X420.112−0.240.003130.00312−0.1573
X1X2−1.221−0.332−0.00645−0.01086−0.4851
X1X3−1.280.14−0.00627−0.01292−0.0662
X1X4−0.3120.260.003630.00363−0.0270
X2X3−0.4−1.69−0.01570.02114-
X2X4−0.015 −1.566−0.00587−0.0158-
X3X4−0.1460.6440.00778−0.00683-
R20.9840.99990.9181.000.9992
R2adj0.97790.99980.8871.000.9988
R2Pred0.97670.99970.8821.000.9981
ª (I) the constant (intercept), X1 is temperature in °C, X2 is time in min, X3 is solvent volume in mL, X4 is solvent concentration in %. X12, X22, X32, and X42 are the squares of the corresponding factors, while X1X2, X1X3, X1X4, X2X4, and X3X4 are the various interactions.
Table 11. Maximum desirability and predicted conditions for numeric optimization of TPC, TFC, CUPRAC, FRAP, and DPPH of African nutmeg peels.
ParametersPredicted Optimum Factors to Achieve the Desirability a Maximum Desirability
UT (°C)ET (min)SV (mL)SC (%)
TPC45525900.993634
TFC30525900.900334
CUPRAC30525901.000000
FRAP452525500.960543
DPPH501515700.931252
a Predicted optimum factors were rounded up to the whole numbers in multiples of 5 based on instrument calibration.
Table 12. Optimized antioxidant and antiradical scavenging properties of AFP extracts using the UAE-NADES techniques: predicted (fitted) and experimental values, UAE-water.
NADESsTPC (mgGAE/g)TFC (µgQE/g)CUPRAC (µMTE/g)FRAP (µMTE/g)DPPH (%)
FittedExperimentalFittedExperimentalFittedExperimentalFittedExperimentalFittedExperimental
CaSu11732 ± 128860.02 ± 4.7 B1061 ± 3731176.0 ± 13 F23.27 ± 3.124.76 ± 0.39 H26.28 ± 3.126.17 ± 0.17 A79.18 ± 7.372.24 ± 0.15 J
CaFr111269 ± 3321290.9 ± 5.6 A2329 ± 4272398.7 ± 23 A38.03 ± 4.438.46 ± 0.44 A26.05 ± 3.326.15 ± 0.11 B86.40 ± 1173.55 ± 0.24 I
CaFr12711 ± 142748.64 ± 12 C1449 ± 3381446.0 ± 12 C26.20 ± 2.826.24 ± 0.31 F16.75 ± 1.317.31 ± 0.12 G89.65 ± 7.484.19 ± 0.35 F
CaFr21272.9 ± 56.8281.05 ± 18 L437.5 ± 84.3442.13 ± 8.7 L27.71 ± 3.125.15 ± 0.34 G18.07 ± 1.318.45 ± 0.08 E87.68 ± 6.084.26 ± 0.36 F
CaXy11375.0 ± 39.7365.20 ± 11 K607 ± 124618.27 ± 10 J28.34 ± 2.824.71 ± 0.49 H18.12 ± 1.519.21 ± 0.13 D81.81 ± 4.264.78 ± 0.25 K
CaXy12577.1 ± 41.5588.78 ± 9.4 F1694 ± 2371777.1 ± 10 B25.96 ± 3.028.92 ± 0.53 E17.11 ± 1.718.13 ± 0.11 F94.20 ± 1397.42 ± 0.40 A
CaXy21294.8 ± 38.9289.76 ± 6.7 L551 ± 112584.85 ± 19 K28.58 ± 3.129.53 ± 0.55 D15.82 ± 1.416.19 ± 0.11 I85.25 ± 6.964.19 ± 0.33 L
CaGr11507.7 ± 67.7539.76 ± 16 G621 ± 168633.85 ± 20 I31.72 ± 2.732.29 ± 0.52 B16.41 ± 1.017.04 ± 0.09 H86.43 ± 9.283.55 ± 0.25 G
CaGr12748.5 ± 90.5754.63 ± 7.1 C828 ± 130869.57 ± 12 H29.92 ± 2.929.89 ± 0.32 CD17.07 ± 1.518.52 ± 0.18 E90.52 ± 6.289.71 ± 0.31 C
CaGr21393.6 ± 56.8396.24 ± 9.7 J681 ± 220632.60 ± 10 I31.45 ± 3.029.92 ± 0.37 C26.59 ± 3.326.21 ± 0.12 C86.42 ± 7.880.93 ± 0.20 H
CaGc11498.8 ± 90.5475.22 ± 8.6 I1330 ± 4171354.4 ± 15 D22.16 ± 3.222.78 ± 0.43 J16.30 ± 1.517.21 ± 0.22 G89.70 ± 1286.08 ± 0.15 E
CaGc21499.3 ± 63.9502.72 ± 7.5 H1224 ± 2511341.4 ± 8.8 E24.02 ± 2.923.89 ± 0.50 I7.92 ± 1.07.59 ± 0.14 M95.98 ± 5.490.05 ± 0.23 B
CaGl11626.8 ± 69.7660.13 ± 7.6 E1224 ± 1491448.6 ± 10 C25.29 ± 3.225.40 ± 0.15 G8.11 ± 1.68.59 ± 0.13 L34.98 ± 6.034.77 ± 0.24 M
CaGl21649.6 ± 52.0688.45 ± 7.8 D1003 ± 1421025.4 ± 9.4 G25.99 ± 3.025.50 ± 0.52 G10.64 ± 2.711.59 ± 0.14 K89.29 ± 7.286.49 ± 0.27 D
Water-144.34 ± 8.0 M-589.63 ± 11 K-22.81 ± 0.46 J-12.07 ± 0.14 J-11.69 ± 0.24 N
Means ± SD of 9 replicates. Means that do not share the same letter within the same response variable are significantly different (p ≤ 0.5).
Disclaimer/Publisher’s Note: The statements, opinions and data contained in all publications are solely those of the individual author(s) and contributor(s) and not of MDPI and/or the editor(s). MDPI and/or the editor(s) disclaim responsibility for any injury to people or property resulting from any ideas, methods, instructions or products referred to in the content.

