Correction: Wang et al. Establishment of an In Vitro Regeneration System and Analysis of Endogenous Hormone Dynamics in Melastoma dodecandrum. Horticulturae 2025, 11, 875
- In the original publication, there was a mistake in Table 1 as published. Due to inconsistencies in the post hoc analysis method during the preparation of the original table, the superscript letters indicating significance were incorrectly assigned. After re-analysis using the correct post hoc comparison method, the significance groupings have been revised. The corrected Table 1 appears below.
| Treatment Number | Concentration of 6-BA/mg·L−1 | Concentration of 2,4-D/mg·L−1 | Induction Rate/% | Callus Growth |
|---|---|---|---|---|
| CK | 0.0 | 0.0 | 0.00 ± 0.00 f | Browning, death |
| Y1 | 0.1 | 1.0 | 73.33 ± 3.35 de | Callus appeared on Day 12, reddish-brown, loose |
| Y2 | 0.5 | 1.0 | 94.43 ± 5.10 a | Callus appeared on Day 14, reddish-brown, loose |
| Y3 | 1.0 | 1.0 | 85.57 ± 5.10 abc | Callus appeared on Day 14, reddish-brown, loose |
| Y4 | 0.1 | 1.5 | 91.10 ± 1.90 ab | Callus appeared on Day 12, yellowish-white with red granules, loose |
| Y5 | 0.5 | 1.5 | 76.70 ± 10.00 cde | Callus appeared on Day 13, yellowish-white, red granules, loose |
| Y6 | 1.0 | 1.5 | 95.53 ± 3.87 a | Callus appeared on Day 10, yellow-green whitish, compact |
| Y7 | 0.1 | 2.0 | 82.23 ± 6.93 bcd | Callus appeared on Day 13, yellow-green, compact |
| Y8 | 0.5 | 2.0 | 96.67 ± 3.35 a | Callus appeared on Day 11, yellow-green, compact |
| Y9 | 1.0 | 2.0 | 66.67 ± 12.05 e | Callus appeared on Day 13, yellow-green, compact |
- 2.
- In the original publication, there was a mistake in Table 2 as published. Due to inconsistencies in the post hoc analysis method during the preparation of the original table, the superscript letters indicating significance were incorrectly assigned. After re-analysis using the correct post hoc comparison method, the significance groupings have been revised. The corrected Table 2 appears below.
- 3.
- In the original publication, there was a mistake in Table 3 as published. Due to inconsistencies in the post hoc analysis method during the preparation of the original table, the superscript letters indicating significance were incorrectly assigned. After re-analysis using the correct post hoc comparison method, the significance groupings have been revised. The corrected Table 3 appears below.
- 4.
- 5.
- In the original publication, there was a mistake in Table 4 as published. To improve clarity and readability, we have modified the presentation of the rooting images by separating them into two tables (Table 4 and Table 5). Due to inconsistencies in the post hoc analysis method during the preparation of the original table, the superscript letters indicating significance were incorrectly assigned. After re-analysis using the correct post hoc comparison method, the significance groupings have been revised. The corrected Table 5 appears below.
| Treatment Number | Basic Medium | Concentration of IBA/mg·L−1 | Number of Roots/Strip | Root Length/cm | Rooting Rate/% |
|---|---|---|---|---|---|
| CK2 | 1/2MS | 0.0 | 2.73 ± 0.89 c | 1.91 ± 0.37 c | 80.99 ± 18.37 b |
| S4 | 0.1 | 5.14 ± 0.49 b | 2.97 ± 0.52 a | 100.00 ± 0.00 a | |
| S5 | 0.2 | 5.45 ± 0.69 b | 2.43 ± 0.46 ab | 100.00 ± 0.00 a | |
| S6 | 0.5 | 7.35 ± 1.36 a | 2.37 ± 0.16 ab | 100.00 ± 0.00 a |
- 6.
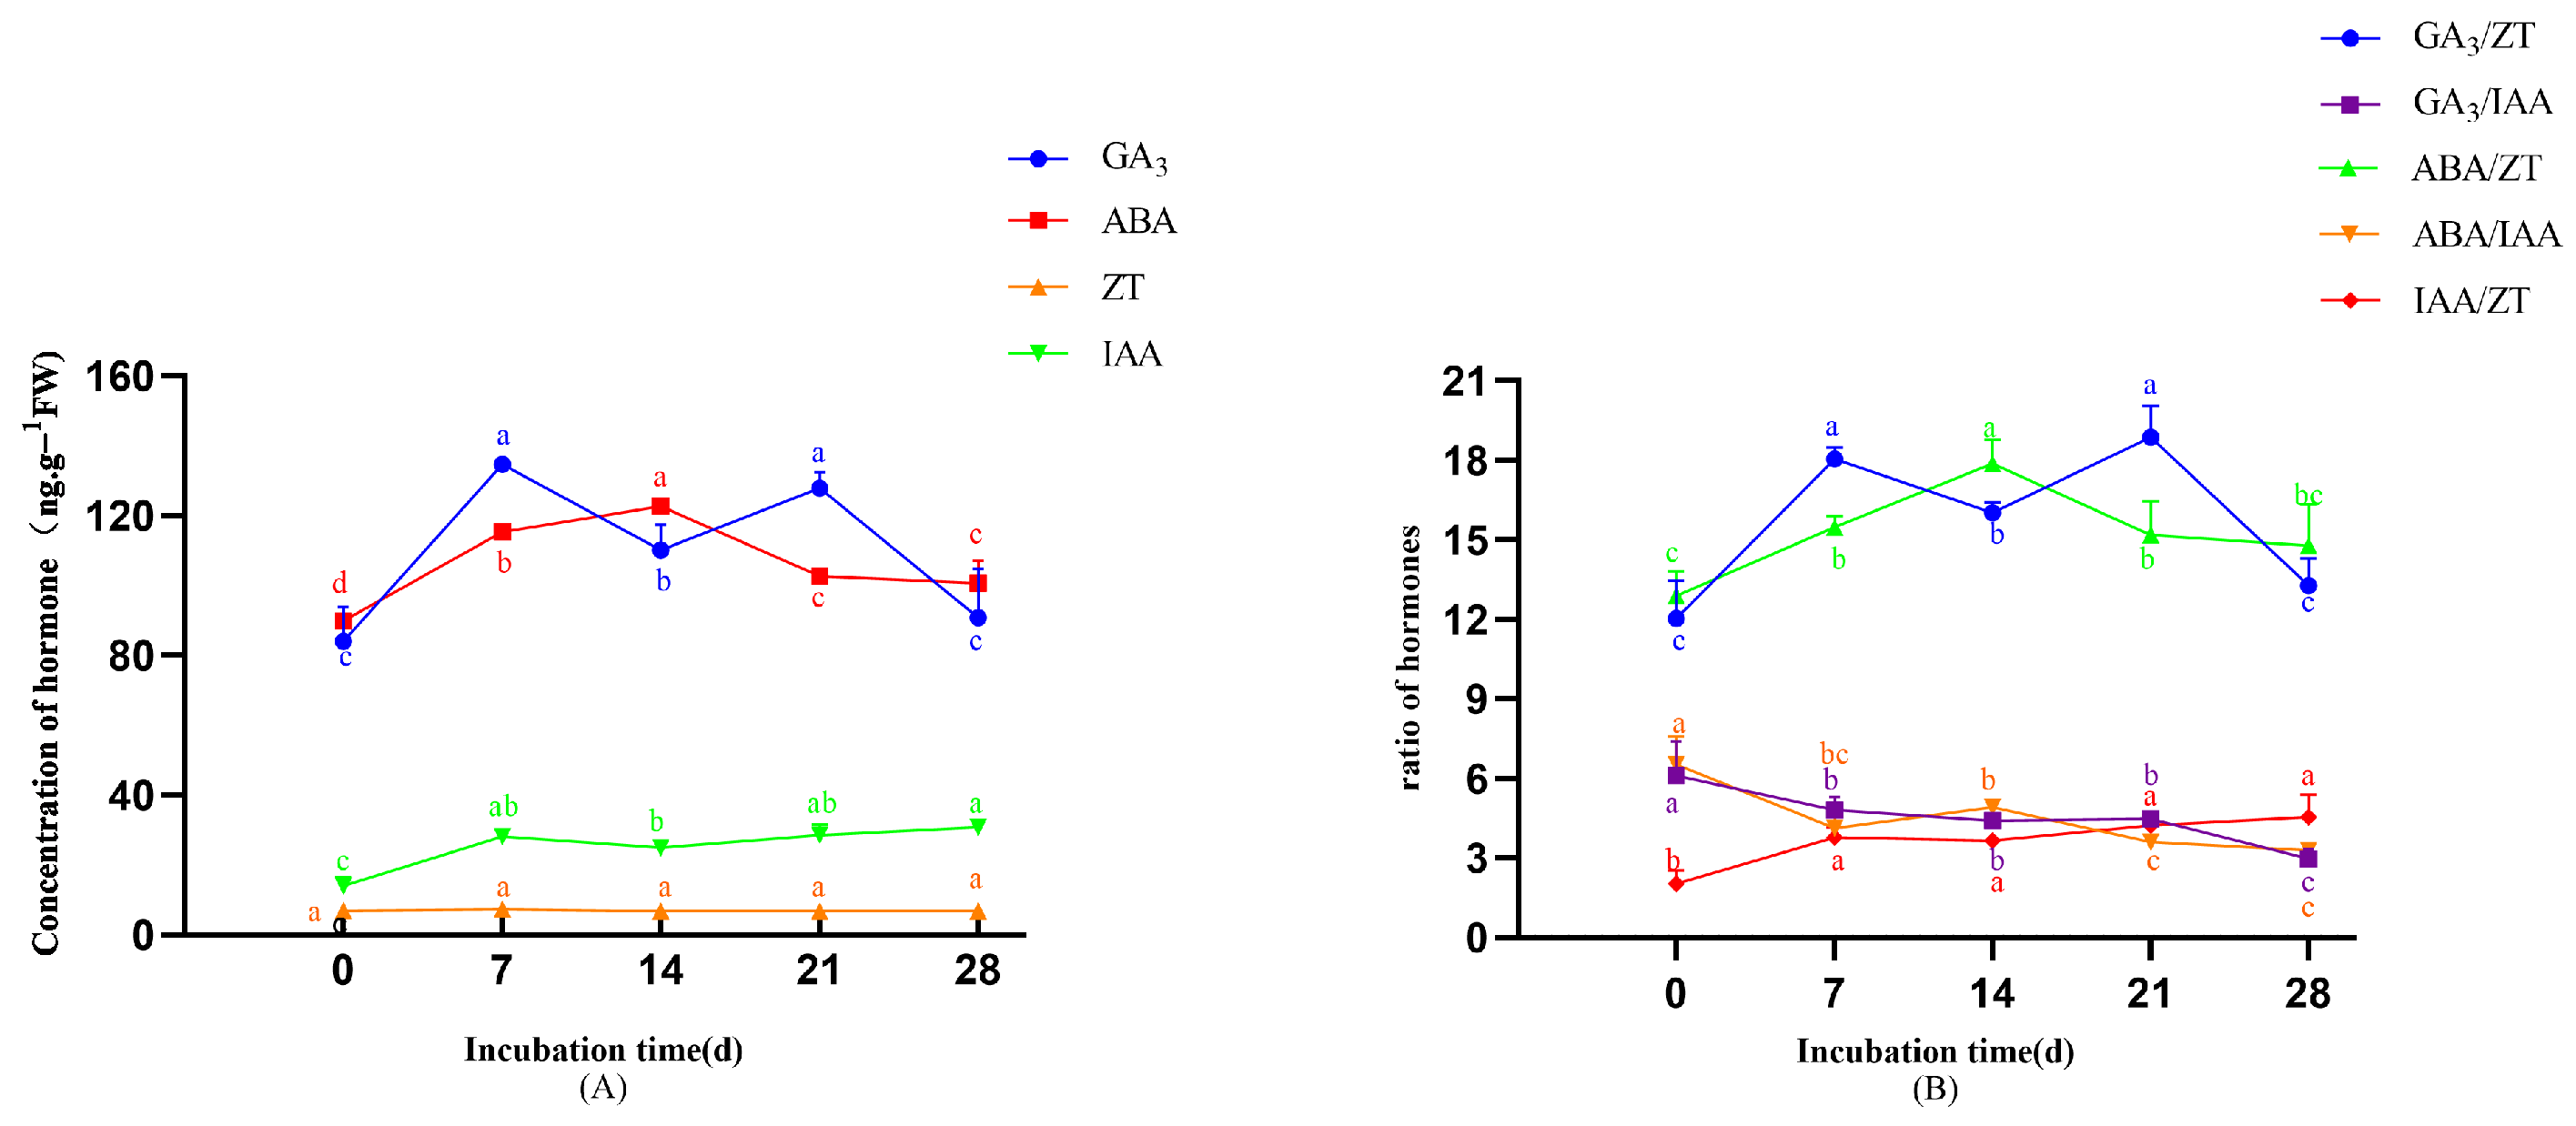
- In the original publication, there was a mistake in Figure 6 as published. Due to inconsistencies in the post hoc analysis method during the preparation of the original table, the superscript letters indicating significance were incorrectly assigned. After re-analysis using the correct post hoc comparison method, the significance groupings have been revised. The corrected Figure 6 appears below.
- 7.
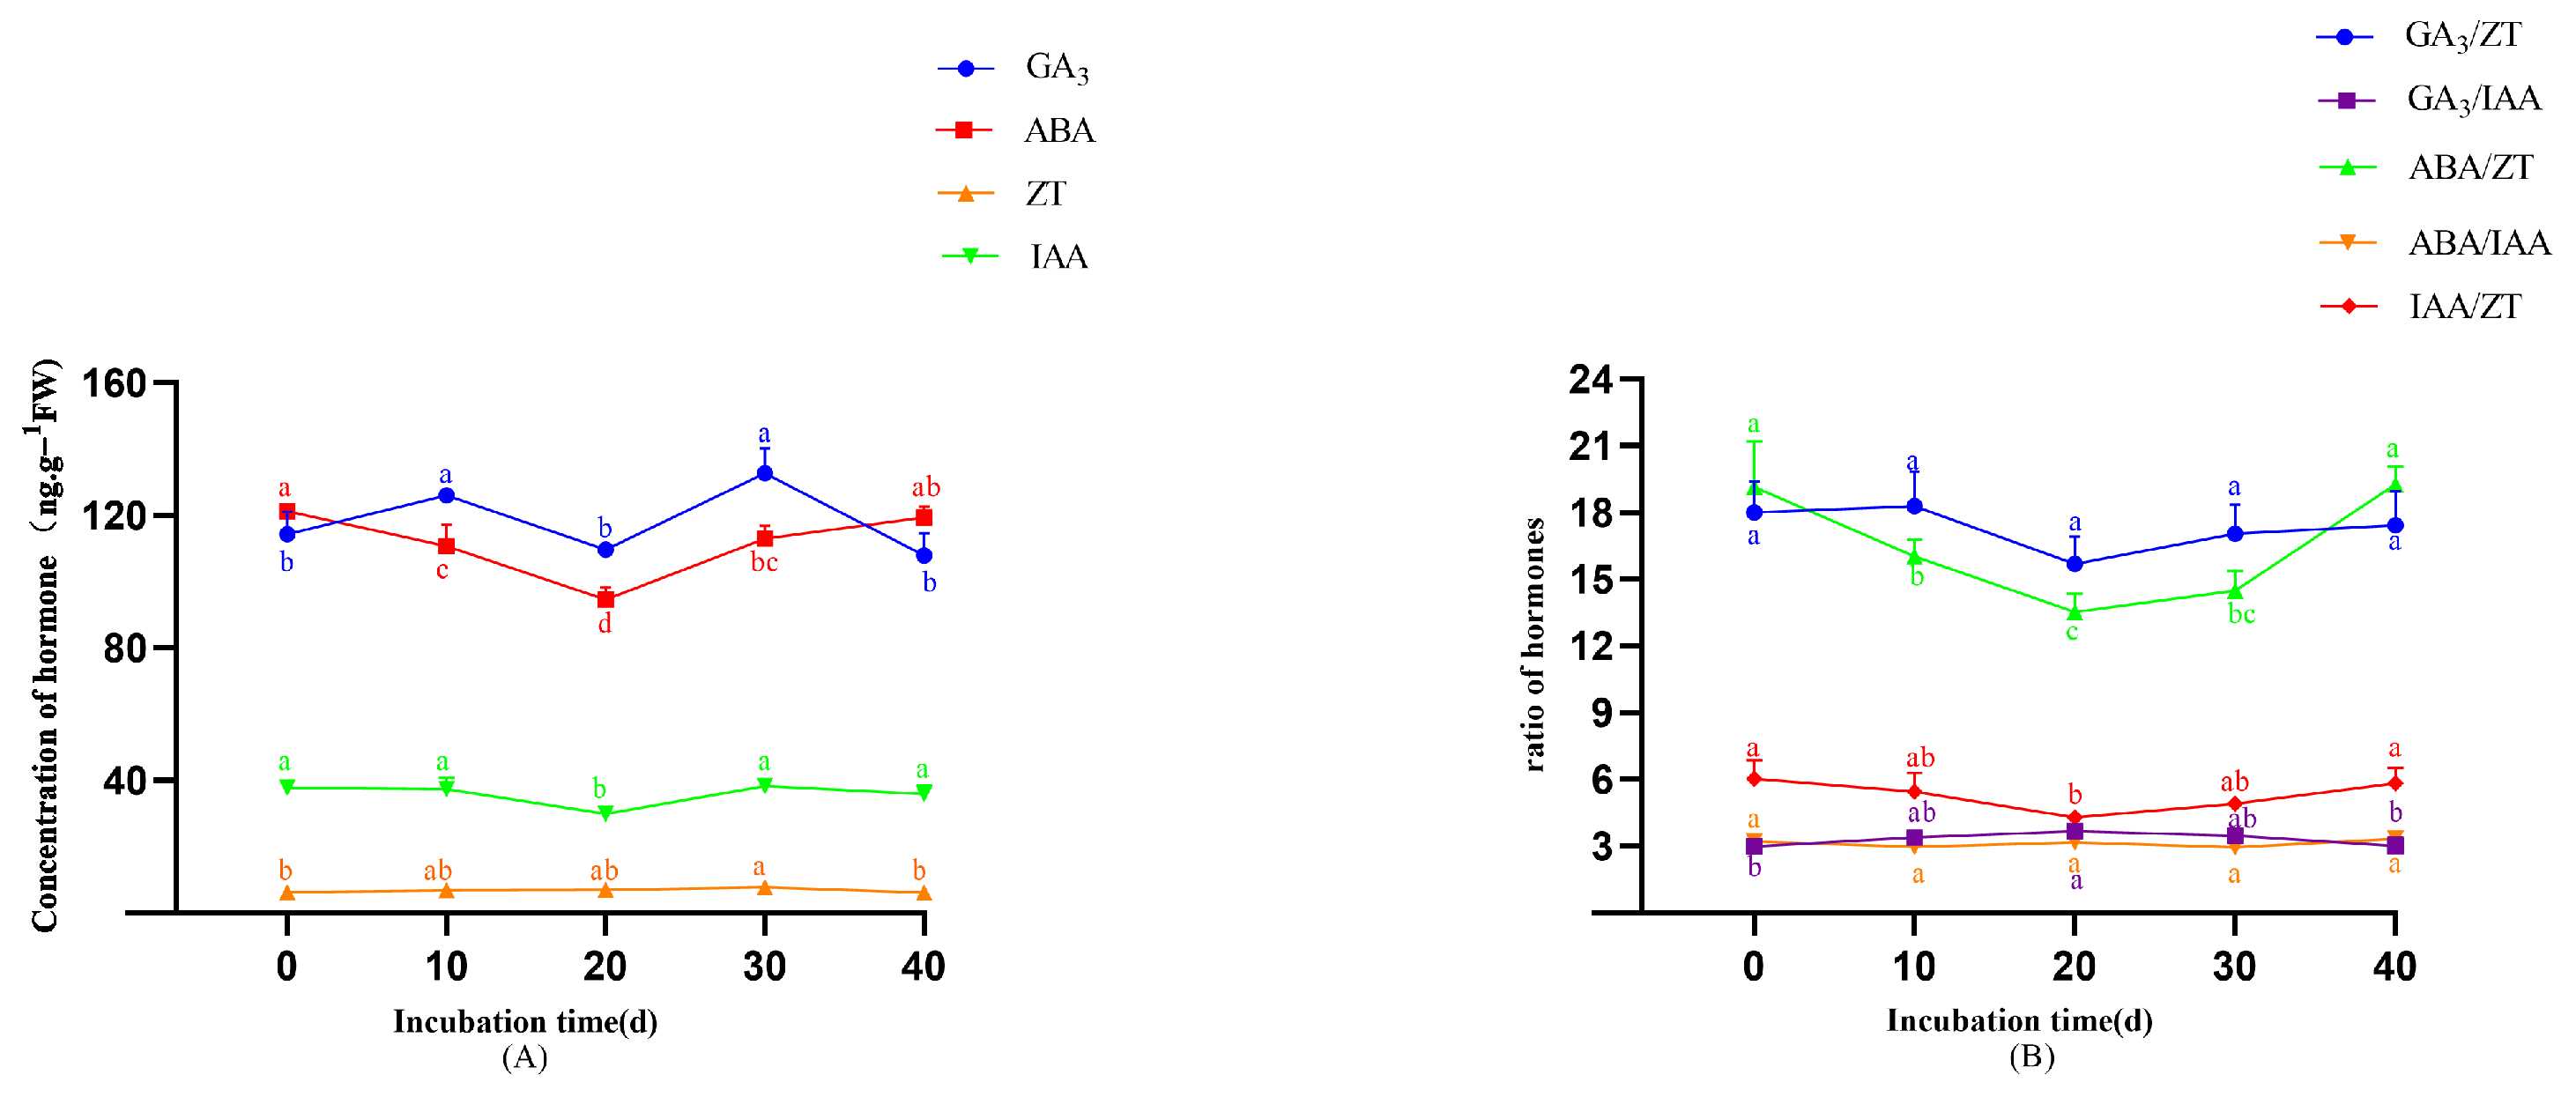
- In the original publication, there was a mistake in Figure 7 as published. Due to inconsistencies in the post hoc analysis method during the preparation of the original table, the superscript letters indicating significance were incorrectly assigned. After re-analysis using the correct post hoc comparison method, the significance groupings have been revised. The corrected Figure 7 appears below.
- 8.
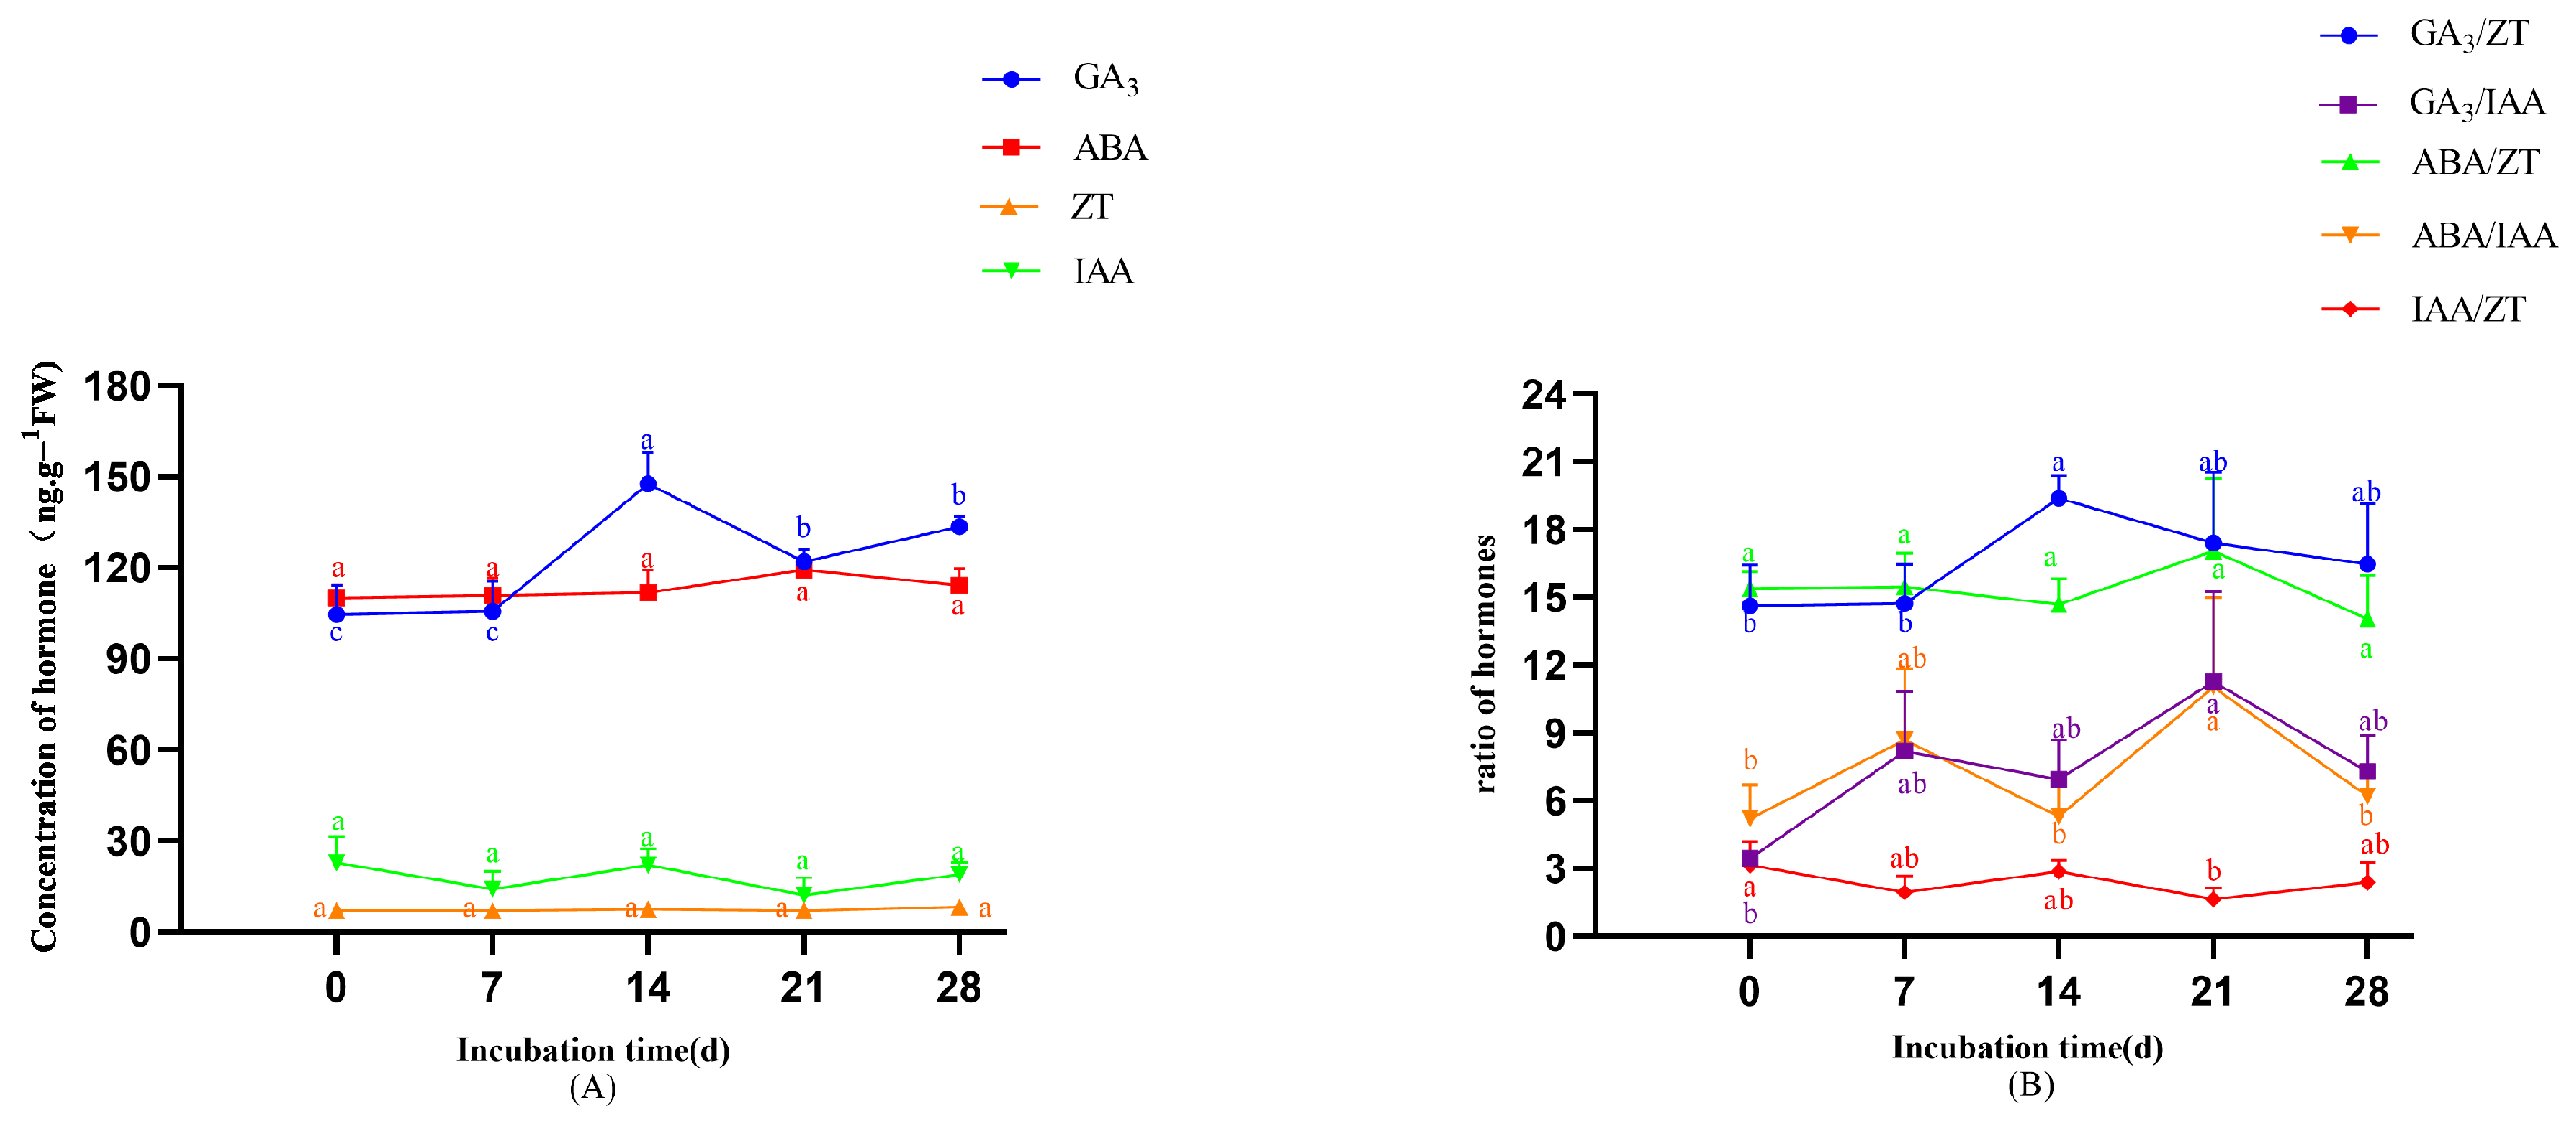
- In the original publication, there was a mistake in Figure 8 as published. The error was due to a misalignment during the formatting or export of the figure, which caused inconsistencies between the statistical output and the graphical annotations; the significance groupings have been revised. The corrected Figure 8 appears below.
- 9.
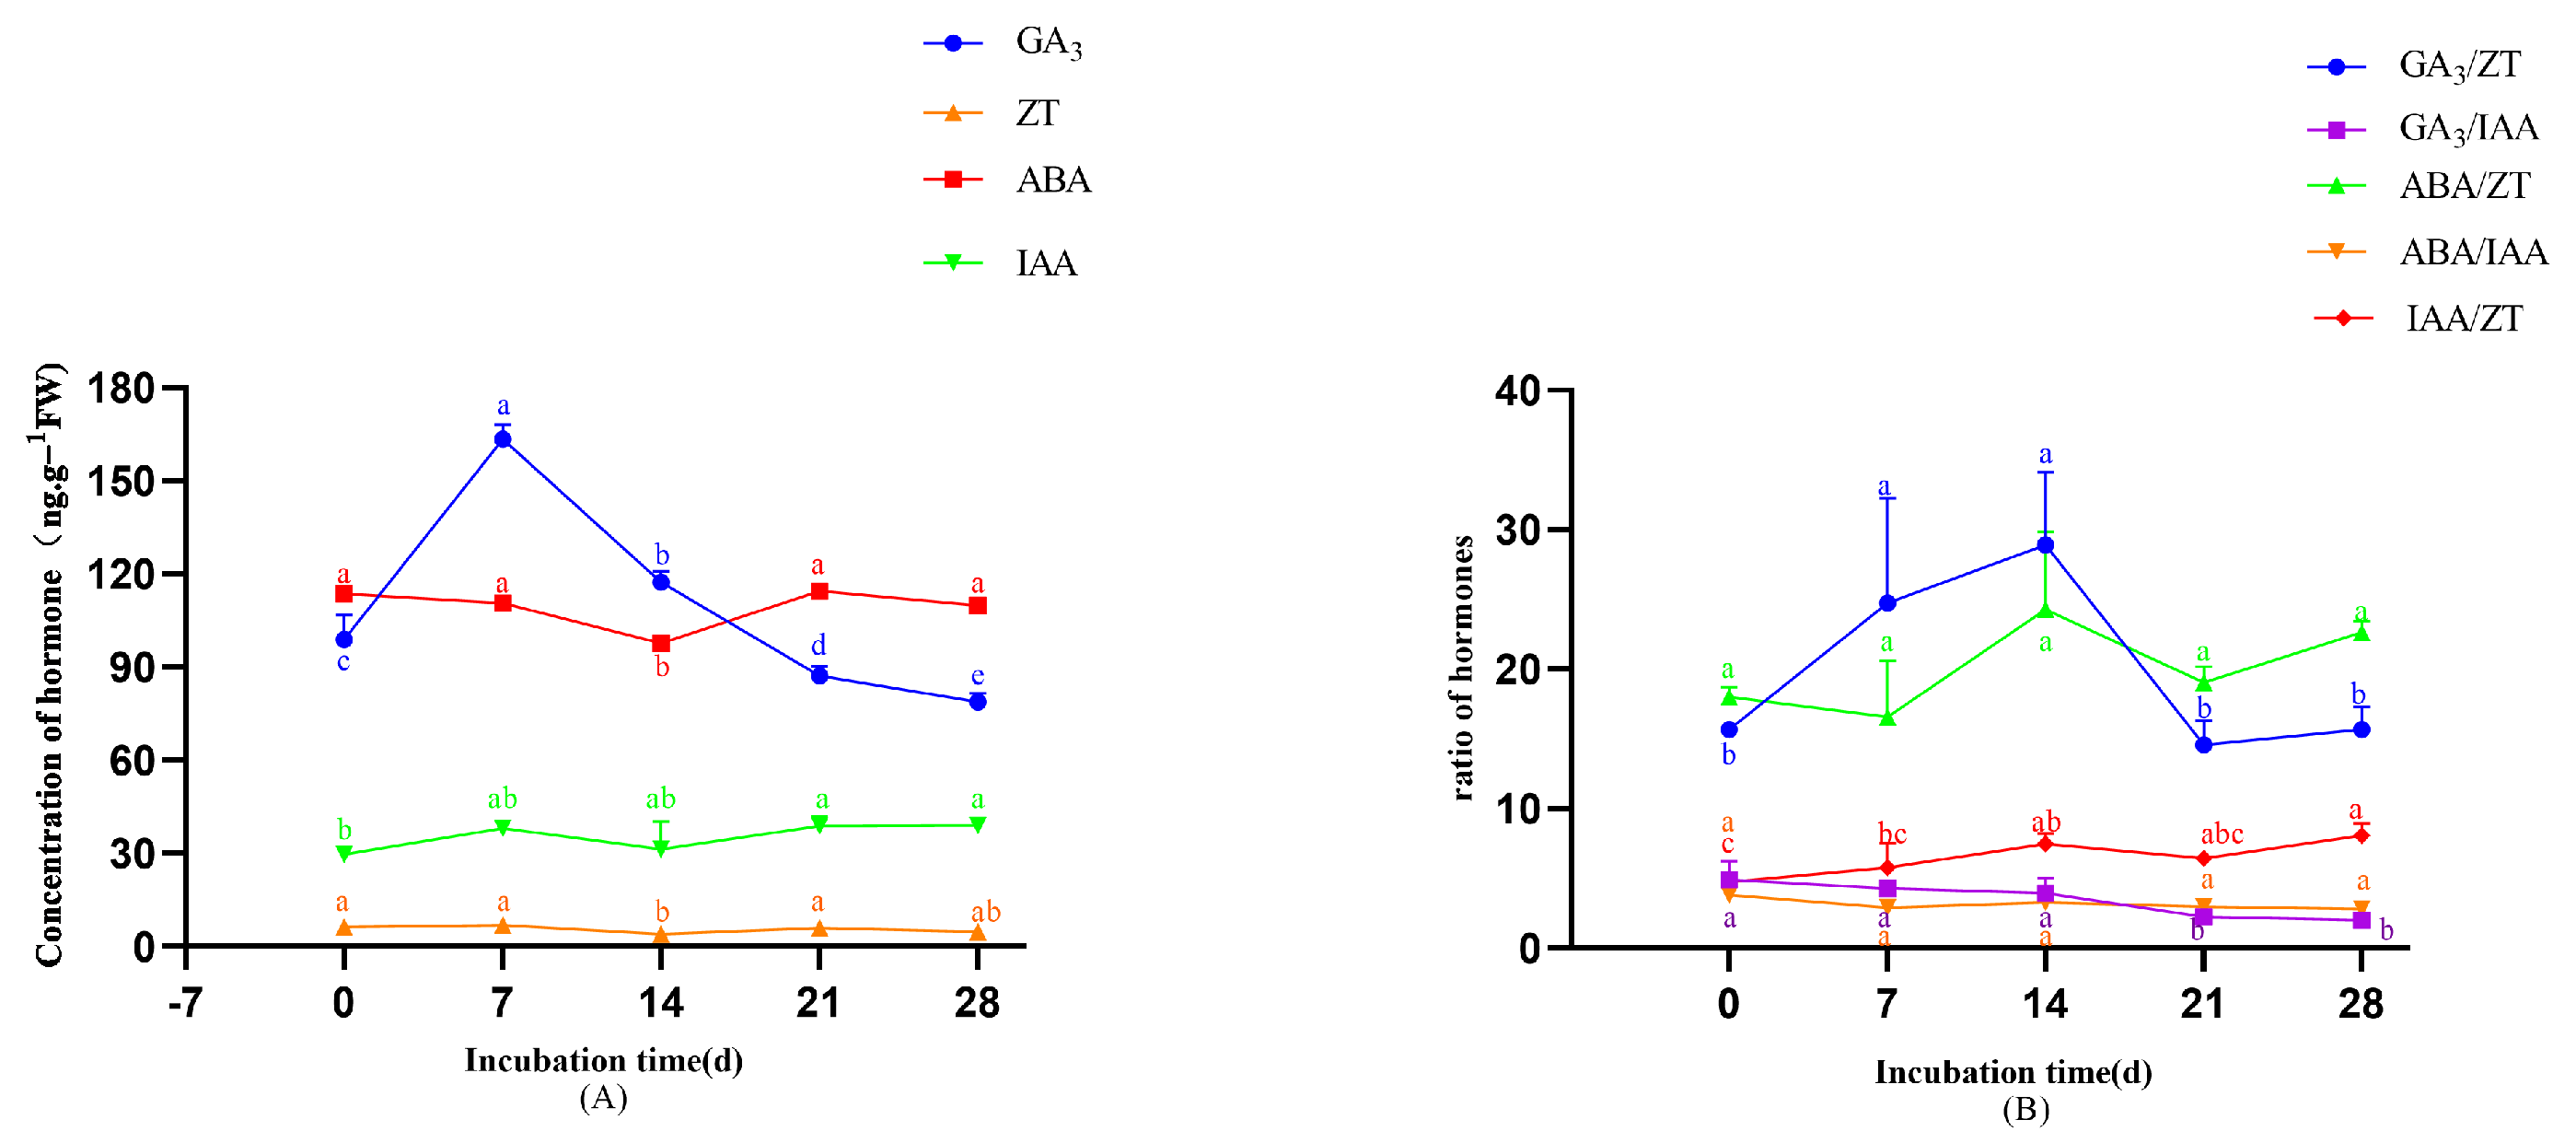
- In the original publication, there was a mistake in Figure 9 as published. The error was due to a misalignment during the formatting or export of the figure, which caused inconsistencies between the statistical output and the graphical annotations; the significance groupings have been revised. The corrected Figure 9 appears below.
- There was an error in the original publication [1]. Due to inconsistencies in the post hoc analysis method during the preparation of the original table, the superscript letters indicating significance were incorrectly assigned. After re-analysis using the correct post hoc comparison method, the significance groupings have been revised.
- 2.
- An error was made due to inconsistencies in the post hoc analysis method during the preparation of the original table; the superscript letters indicating significance were incorrectly assigned.
- 3.
- Due to inconsistencies in the post hoc analysis method during the preparation of the original table, the superscript letters indicating significance were incorrectly assigned. After re-analysis using the correct post hoc comparison method, the significance groupings have been revised.
- 4.
- Due to inconsistencies in the post hoc analysis method during the preparation of the original table, the superscript letters indicating significance were incorrectly assigned. After re-analysis using the correct post hoc comparison method, the significance groupings have been revised.
- 5.
- The error was due to an oversight, and we confirm that it resulted from an inadvertent typographical error during editing.
- 6.
- The error was due to an oversight, and we confirm that it resulted from an inadvertent typographical error during editing.
- 7.
- The error was due to a misalignment during the formatting or export of the figure, which caused inconsistencies between the statistical output and the graphical annotations; the significance groupings have been revised.
- 8.
- This error was due to a misalignment during the formatting or export of the figure, which caused inconsistencies between the statistical output and the graphical annotations; the significance groupings have been revised.
- 9.
- Due to inconsistencies in the post hoc analysis method during the preparation of the original table, the superscript letters indicating significance were incorrectly assigned. After re-analysis using the correct post hoc comparison method, the significance groupings have been revised.
- 10.
- Due to inconsistencies in the post hoc analysis method during the preparation of the original table, the superscript letters indicating significance were incorrectly assigned. After re-analysis using the correct post hoc comparison method, the significance groupings have been revised.
Reference
- Wang, S.; Tang, R.; Wang, F.; Pan, Y.; Duan, Y.; Xue, L.; Zeng, D.; Chen, J.; Peng, D. Establishment of an In Vitro Regeneration System and Analysis of Endogenous Hormone Dynamics in Melastoma dodecandrum. Horticulturae 2025, 11, 875. [Google Scholar] [CrossRef]


| Treatment Number | Concentration of 6-BA/mg·L−1 | Concentration of NAA/mg·L−1 | Differentiation Rate/% |
|---|---|---|---|
| CK | 0.0 | 0.0 | 0.00 ± 0.00 f |
| F1 | 1.0 | 0.3 | 42.23 ± 3.85 de |
| F2 | 1.5 | 0.3 | 33.33 ± 3.34 e |
| F3 | 2.0 | 0.3 | 51.11 ± 8.39 d |
| F4 | 2.5 | 0.3 | 65.56 ± 5.09 c |
| F5 | 1.0 | 0.5 | 73.22 ± 9.01 abc |
| F6 | 1.5 | 0.5 | 76.67 ± 3.34 ab |
| F7 | 2.0 | 0.5 | 83.33 ± 3.34 a |
| F8 | 2.5 | 0.5 | 67.78 ± 5.09 bc |
| Treatment Number | Concentration of 6-BA/mg·L−1 | Concentration of NAA/mg·L−1 | Initial Weight/g | Final Weight/g | Adventitious Bud Proliferation Coefficient |
|---|---|---|---|---|---|
| CK | 0.0 | 0.0 | 2.68 ± 0.48 a | 10.02 ± 2.42 c | 3.98 ± 0.73 f |
| Z1 | 0.5 | 0.1 | 1.16 ± 0.41 c | 12.73 ± 2.73 bc | 11.92 ± 2.24 cde |
| Z2 | 1.0 | 0.1 | 1.17 ± 0.19 c | 15.45 ± 2.95 ab | 15.44 ± 1.33 bc |
| Z3 | 1.5 | 0.1 | 1.05 ± 0.25 c | 19.78 ± 3.64 a | 20.44 ± 2.51 a |
| Z4 | 2.0 | 0.1 | 1.25 ± 0.44 c | 14.72 ± 4.51 abc | 13.07 ± 0.89 bcd |
| Z5 | 0.5 | 0.2 | 1.14 ± 0.04 c | 17.36 ± 0.02 ab | 16.45 ± 1.67 b |
| Z6 | 1.0 | 0.2 | 1.57 ± 0.81 bc | 16.62 ± 2.26 ab | 13.44 ± 3.70 bcd |
| Z7 | 1.5 | 0.2 | 1.64 ± 0.44 bc | 15.98 ± 2.99 ab | 10.12 ± 0.93 de |
| Z8 | 2.0 | 0.2 | 2.14 ± 0.53 ab | 17.44 ± 1.88 ab | 8.69 ± 1.16 e |
| Treatment Number | Basic Medium | Concentration of IBA/mg·L−1 | Number of Roots/Strip | Root Length/cm | Rooting Rate/% |
|---|---|---|---|---|---|
| CK1 | MS | 0.0 | 3.27 ± 0.49 b | 1.11 ± 0.13 b | 87.41 ± 6.58 b |
| S1 | 0.1 | 5.91 ± 0.41 a | 2.11 ± 0.15 a | 98.15 ± 3.21 a | |
| S2 | 0.2 | 6.76 ± 0.97 a | 2.18 ± 0.32 a | 100.00 ± 0.00 a | |
| S3 | 0.5 | 6.97 ± 0.23 a | 2.39 ± 0.11 a | 100.00 ± 0.00 a |
Disclaimer/Publisher’s Note: The statements, opinions and data contained in all publications are solely those of the individual author(s) and contributor(s) and not of MDPI and/or the editor(s). MDPI and/or the editor(s) disclaim responsibility for any injury to people or property resulting from any ideas, methods, instructions or products referred to in the content. |
© 2025 by the authors. Licensee MDPI, Basel, Switzerland. This article is an open access article distributed under the terms and conditions of the Creative Commons Attribution (CC BY) license (https://creativecommons.org/licenses/by/4.0/).
Share and Cite
Wang, S.; Tang, R.; Wang, F.; Pan, Y.; Duan, Y.; Xue, L.; Zeng, D.; Chen, J.; Peng, D. Correction: Wang et al. Establishment of an In Vitro Regeneration System and Analysis of Endogenous Hormone Dynamics in Melastoma dodecandrum. Horticulturae 2025, 11, 875. Horticulturae 2025, 11, 1212. https://doi.org/10.3390/horticulturae11101212
Wang S, Tang R, Wang F, Pan Y, Duan Y, Xue L, Zeng D, Chen J, Peng D. Correction: Wang et al. Establishment of an In Vitro Regeneration System and Analysis of Endogenous Hormone Dynamics in Melastoma dodecandrum. Horticulturae 2025, 11, 875. Horticulturae. 2025; 11(10):1212. https://doi.org/10.3390/horticulturae11101212
Chicago/Turabian StyleWang, Shunshun, Ruonan Tang, Fei Wang, Yun Pan, Yanru Duan, Luyu Xue, Danqi Zeng, Jinliao Chen, and Donghui Peng. 2025. "Correction: Wang et al. Establishment of an In Vitro Regeneration System and Analysis of Endogenous Hormone Dynamics in Melastoma dodecandrum. Horticulturae 2025, 11, 875" Horticulturae 11, no. 10: 1212. https://doi.org/10.3390/horticulturae11101212
APA StyleWang, S., Tang, R., Wang, F., Pan, Y., Duan, Y., Xue, L., Zeng, D., Chen, J., & Peng, D. (2025). Correction: Wang et al. Establishment of an In Vitro Regeneration System and Analysis of Endogenous Hormone Dynamics in Melastoma dodecandrum. Horticulturae 2025, 11, 875. Horticulturae, 11(10), 1212. https://doi.org/10.3390/horticulturae11101212


