Article

Comparative Transcriptomic Analysis of Pyrethrin and EβF Biosynthesis in Tanacetum cinerariifolium Stems and Flowers

1
School of Life Sciences, Guizhou Normal University, Guiyang 550025, China
2
National Key Laboratory for Germplasm Innovation & Utilization of Horticultural Crops, College of Horticulture & Forestry Sciences, Huazhong Agricultural University, Wuhan 430070, China
*
Author to whom correspondence should be addressed.
These authors contributed equally to this work.
Horticulturae 2025, 11(2), 201; https://doi.org/10.3390/horticulturae11020201
Submission received: 19 December 2024 / Revised: 5 February 2025 / Accepted: 11 February 2025 / Published: 13 February 2025

Abstract

:
Tanacetum cinerariifolium, a perennial Asteraceae plant, is renowned for its ornamental value and natural insecticidal compounds, especially pyrethrins. These compounds, primarily stored in flower heads, are highly effective as insecticides with low toxicity to mammals, making them crucial for organic agriculture, along with the sesquiterpene (E)-β-farnesene (EβF), play critical roles in T. cinerariifolium defense mechanisms. However, the spatiotemporal patterns of these secondary metabolites in stems and flower heads, as well as their regulatory mechanisms, remain unclear. This study investigated the biosynthesis and regulation of pyrethrins and EβF across developmental stages (S1–S4) in flowers and stems using GC-MS and transcriptomics. Transcriptome analysis revealed that the expression of pyrethrin biosynthetic genes was not synchronized with pyrethrin accumulation. The main pyrethrin biosynthetic genes exhibited coordinated expression patterns, peaking during early flowering stages (S1–S2), while pyrethrin accumulation was primarily observed during mid-flower development. In contrast, the biosynthetic genes of EβF showed synchronized expression with EβF accumulation, with the highest activity observed in stems and early flowers. WGCNA identified jasmonic acid signaling, trichome differentiation, and terpene transport pathways as potentially associated with pyrethrin biosynthesis. Hub genes including MYC2 were identified as playing pivotal roles in regulating secondary metabolite biosynthesis. These findings provide new insights into the regulation and biosynthesis of pyrethrins and EβF, offering a foundation for optimizing bioactive compound production and advancing sustainable pest management strategies.

1. Introduction

Tanacetum cinerariifolium, commonly known as pyrethrum, is a perennial plant in the Asteraceae family, valued for its ornamental application and its role as a source of natural insecticides. The plant is characterized by white ray florets surrounding a dense center of yellow disc florets and is particularly renowned for the high concentration of natural pyrethrins in its flower heads. These pyrethrins, comprising pyrethrin I, cinerin I, jasmolin I, pyrethrin II, cinerin II, and jasmolin II, provide significant economic benefits [1]. Pyrethrins are highly effective insecticides that incapacitate pests quickly, exhibit minimal toxicity to mammals, and are resistant to pest tolerance. Moreover, they are fully biodegradable, making them environmentally friendly [2,3]. These properties have ensured their long-standing use in household and agricultural pest control [4]. Due to their potent insecticidal properties, pyrethrins have made pyrethrum a globally cultivated plant, not only for ornamental purposes but also as a key resource for bio-pesticides [5,6]. This makes pyrethrum an excellent choice for organic farming, home gardening, and agro-industrial applications.
Recent advancements in plant physiological ecology and secondary metabolite research have expanded interest in T. cinerariifolium, focusing on its primary insecticidal compounds and other bioactive substances. Pyrethrum flower extracts are recognized for their potent insecticidal properties and repellent effects against aphids and mosquitoes. Notably, approximately 70% of the volatile compounds in pyrethrum are composed of (E)-β-farnesene (EβF) and germacrene D (GD) [7]. The efficacy of these compounds is attributed to the synergistic action between the highly volatile EβF and the less volatile pyrethrins [7,8].
EβF plays a crucial role as a key component of alarm pheromones in many aphid species, attracting predatory insects, such as ladybugs, in response to predator attacks [9,10]. This pheromone is primarily released from a viscous droplet secreted from the aphid’s dorsal abdominal tubes during attacks. At high concentrations and purity, EβF can trigger an alarm response, causing conspecifics to disperse from the feeding site. Moreover, this signaling compound is likely intercepted by predatory insects, serving as an important cue in their search for food [9,11]. Pyrethrins and EβF together form the defensive arsenal of T. cinerariifolium. Notably, pyrethrins predominantly accumulate in the ovary walls of the flower heads, accounting for over 94% of the plant’s total pyrethrins [12,13]. Both the flower heads and stems contain high levels of EβF. These compounds exhibit significant spatiotemporal variations in their accumulation.
While pyrethrins are monoterpenoid derivatives, EβF is classified as a sesquiterpene. Both compounds are synthesized via the isoprenoid metabolic pathway, which involves a complex interplay of competition and enhancement. Volatile substances dominated by EβF can even promote the synthesis of pyrethrins [14,15]. EβF is synthesized from the precursor molecules isopentenyl pyrophosphate (IPP) and its isomer dimethylallyl pyrophosphate (DMAPP) through the mevalonate (MVA) pathway. Farnesyl diphosphate synthase (FPS) catalyzes the formation of farnesyl diphosphate (FPP), which is then converted to EβF by sesquiterpene synthase (E)-beta-farnesene synthase (EbF) [16]. In T. cinerariifolium, pyrethrins are primarily biosynthesized in the flower heads through the esterification of a monoterpenoid acyl moiety (pyrethric or chrysanthemic acid) with an alcohol moiety (pyrethrolone, jasmolone, and cinerolone). The acid component originates from the methylerythritol-4-phosphate (MEP) pathway within plastids, a key branch of the terpene biosynthetic network [17], whereas the alcohol component is derived from jasmonates [2]. Initial studies have explored the metabolic roles and biosynthetic pathways of these compounds in pyrethrum. However, detailed information regarding their expression patterns, regulatory mechanisms, and ecological functions during different growth stages, particularly during key phases of flower development, remains limited. Systematic omics approaches are needed to further investigate the biological and ecological significance of pyrethrin and EβF synthesis and release during these critical stages.
In T. cinerariifolium, the flowering phase is characterized by elongated peduncles that are typically erect or slightly curved, serving to support the capitulum and facilitate adaptation to the pollination environment. Flower head development proceeds through eight distinct stages: S1, a well-developed closed bud; S2, with ray flowers positioned vertically; S3, where ray flowers become horizontal, and the first row of disc flowers opens; S4, with three rows of disc flowers open; S5, when all disc flowers are open; S6, the early senescent stage marked by fading disc flower color while ray flowers remain intact; S7, the late senescent stage with minimal disc flower coloration and dried ray flowers; and S8, when ray flowers are shed, thereby enabling wind-driven seed dispersal (Figure S1a). Notably, during the S2 stage, pyrethrum flowers are rich in volatile secondary metabolites and contain moderate levels of pyrethrins (further, GC–MS analyses for additional stages are provided in the Supplementary Information (Figure S1b).
This study employs high-throughput transcriptomics and GC-MS technologies to systematically analyze the expression and regulation of pyrethrins and EβF during stem and flower development stages S1 to S4 in T. cinerariifolium. The goal is to elucidate the metabolic pathways and regulatory networks controlling the biosynthesis and accumulation of these secondary metabolites during critical developmental stages. This comprehensive analysis is expected to provide new insights into plant secondary metabolite regulatory mechanisms and their potential applications in pest management.

2. Results

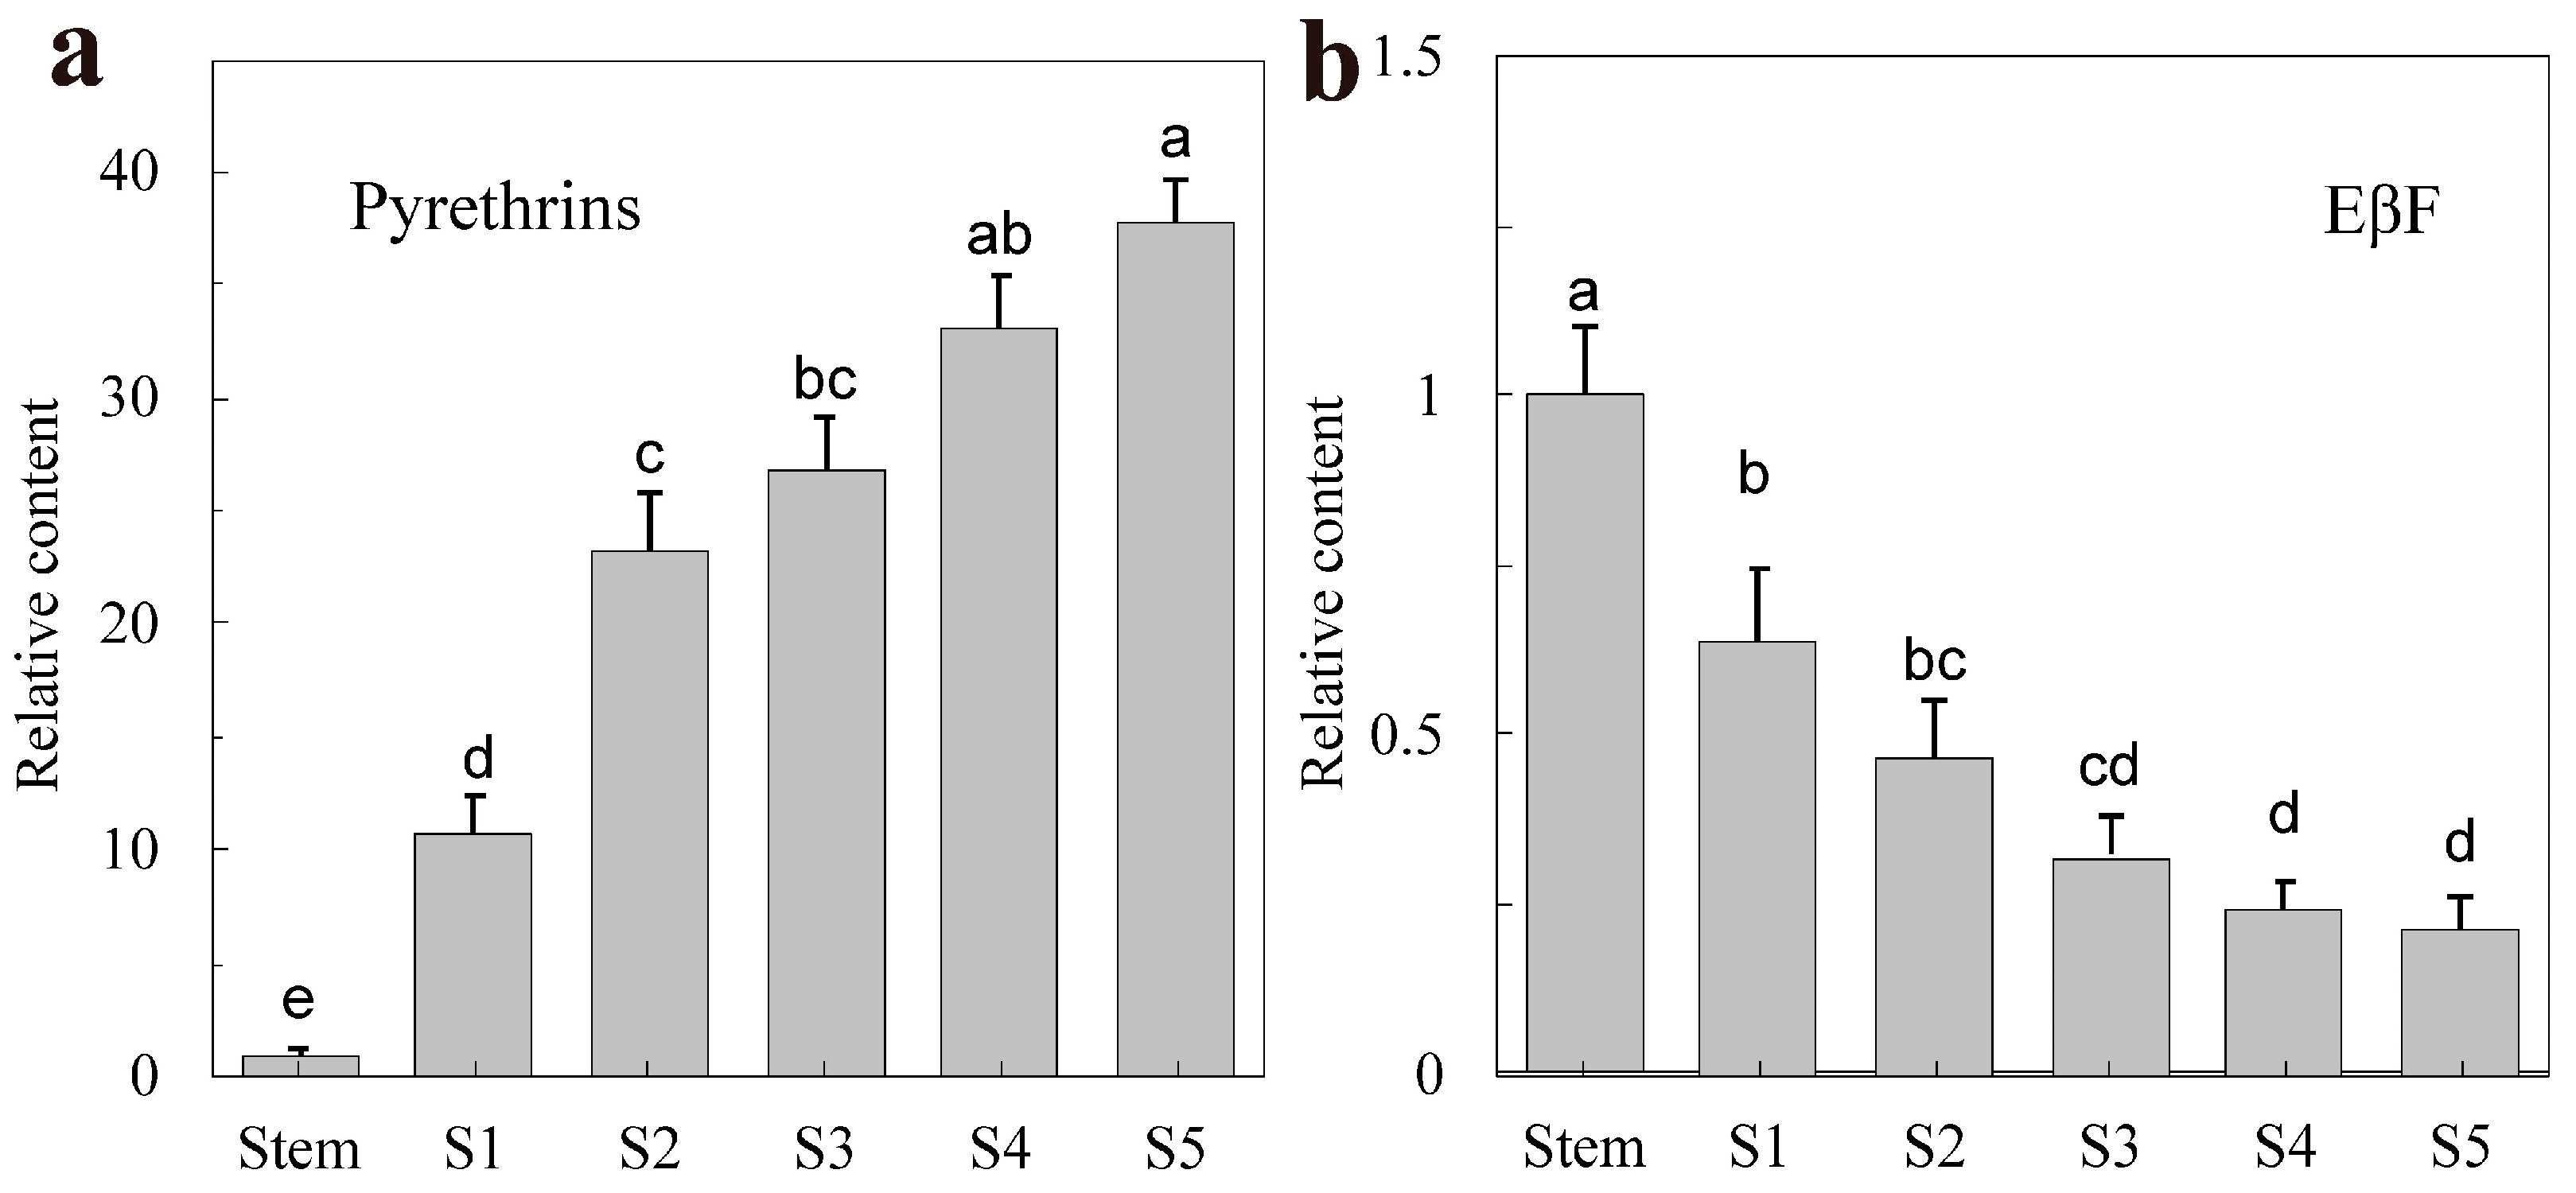
2.1. The Content of Pyrethrin and EβF in T. cinerariifolium

To characterize the tissue-specific biosynthesis patterns of key defensive metabolites, we quantified pyrethrins and EβF concentrations across vegetative stems and flowering developmental stages (S1–S5) using GC-MS. Details of identified compounds are listed in Table S1. The total pyrethrin content is lowest in the stem and increases progressively from S1, peaking during stages S4 and S5. No significant difference in pyrethrin content was observed between S4 and S5 (Figure 1a; Table S2). For optimal production efficiency and large-scale mechanical harvesting, pyrethrum is typically collected during stages S4 and S5 [6]. In contrast, EβF content is highest in the stem, relatively high at S1, and gradually declines and stabilizes between S3 and S5 (Figure 1b; Table S2). This distribution pattern indicates that EβF may serve primarily in early floral developmental stages and the stem for signaling and defensive purposes, complementing the role of pyrethrins, which are predominantly involved in defense during the flower mature stages.

2.2. Transcriptome Sequencing, Assembly, and Annotation of T. cinerariifolium

A total of 15 sequencing libraries were constructed from T. cinerariifolium flower stems and flowering stages (S1–S4), yielding 101.5 Gb of clean data. Each sample produced more than 6.09 Gb of clean data, with a Q30 base percentage exceeding 93.63% (Table S3), which met the quality standards for subsequent analysis. The clean data from all 15 libraries were assembled using Trinity v2.6.6 [18], resulting in 100,099 unigenes. The average read length was 977 bp, with a GC content of 38.67%. Clean reads were aligned to the reference sequences derived from the Trinity assembly. BUSCO analysis confirmed that the majority of genes were well represented in the BUSCO library (Figure 2a), demonstrating the high quality of the sequencing data for downstream analyses.
To gain comprehensive functional information, gene annotation was performed using Blast v2.10 and Diamond v5.10 software against seven major databases: UniProt, KEGG, GO, Nr, Pfam, COG, and KEGG Pathway. In total, 50,295 unigenes (50.25%) were annotated, with 12.98% of the unigenes annotated across all databases. The number of unigenes annotated in each database was as follows: Nr (47,835; 47.79%), Pfam (34,235; 34.20%), Swiss-Prot (33,950; 33.92%), GO (40,738; 40.70%), COG (35,709; 35.67%), and KEGG (20,949; 20.93%) (Figure 2b). Species annotation from the Nr database revealed that the top five annotated species were Artemisia annua (65.52%), Quercus suber (7.76%), Helianthus annuus (5.27%), Cynara cardunculus (4.21%), and Lactuca sativa (3.15%) (Figure 2c).
To evaluate the consistency among samples, Pearson correlation and principal component analysis (PCA) were performed. The Pearson correlation results revealed minimal variation within each sample group, indicating a high degree of consistency within groups (Figure 3a). The PCA results further showed clear separation between different sample groups, suggesting distinct clustering patterns, the observed separation between groups provides strong visual evidence of group differentiation, confirming the consistency of the data for transcriptome analysis (Figure 3b). Differentially expressed genes (DEGs) were identified using the criteria of p-adj < 0.05 and |log2 FoldChange| > 1. Compared to the stem, a total of 13,239 DEGs were detected in S1 (6008 upregulated and 7231 downregulated). Between S1 and S3, 12,160 DEGs were identified (6635 upregulated and 5525 downregulated), and a similar number of DEGs (12,160) was observed between S1 and S4 (7139 upregulated and 4768 downregulated) (Figure 3c). These findings highlight marked differences between the stem and the flowering stages, while expression patterns were more similar between adjacent stages, such as S1 and S2, or S3 and S4 (Figure 3d).

2.3. Differential Gene Expression in JA Biosynthesis

JA plays a critical role in flower development and serves as a precursor for the synthesis of pyrethrins. An analysis of DEGs involved in JA revealed notable expression patterns for key genes such as SPLA2 (Secretory Phospholipase A2, 1 DEG), LOX (Lipoxygenase, 8 DEGs), OPR3 (12-Oxophytodienoate Reductase, 8 DEGs), AOS (Allene Oxide Synthase, 1 DEG), AOC (Allene Oxide Cyclase, 1 DEG), ACX (Acyl-CoA Oxidase, 2 DEGs), and MFP (Multifunctional Protein, 2 DEGs) (Figure 4). These genes are expressed at very low levels in the stem but are highly expressed during the early flowering stages (S1 and S2). Subsequently, their expression levels decline, with a particularly pronounced decrease in AOC, a key gene in JA biosynthesis. qRT-PCR results confirm that the expression of LOX, AOS, and AOC increases from the stem to the early flower stages (S1 and S2). LOX peaks at S3 and S4, while AOC and AOS show their highest expression at S1 and S2 before progressively declining through S3 and S4. These trends indicate that JA biosynthesis is most active during the early to mid-flower stages, supporting its role in initiating defense and developmental processes.

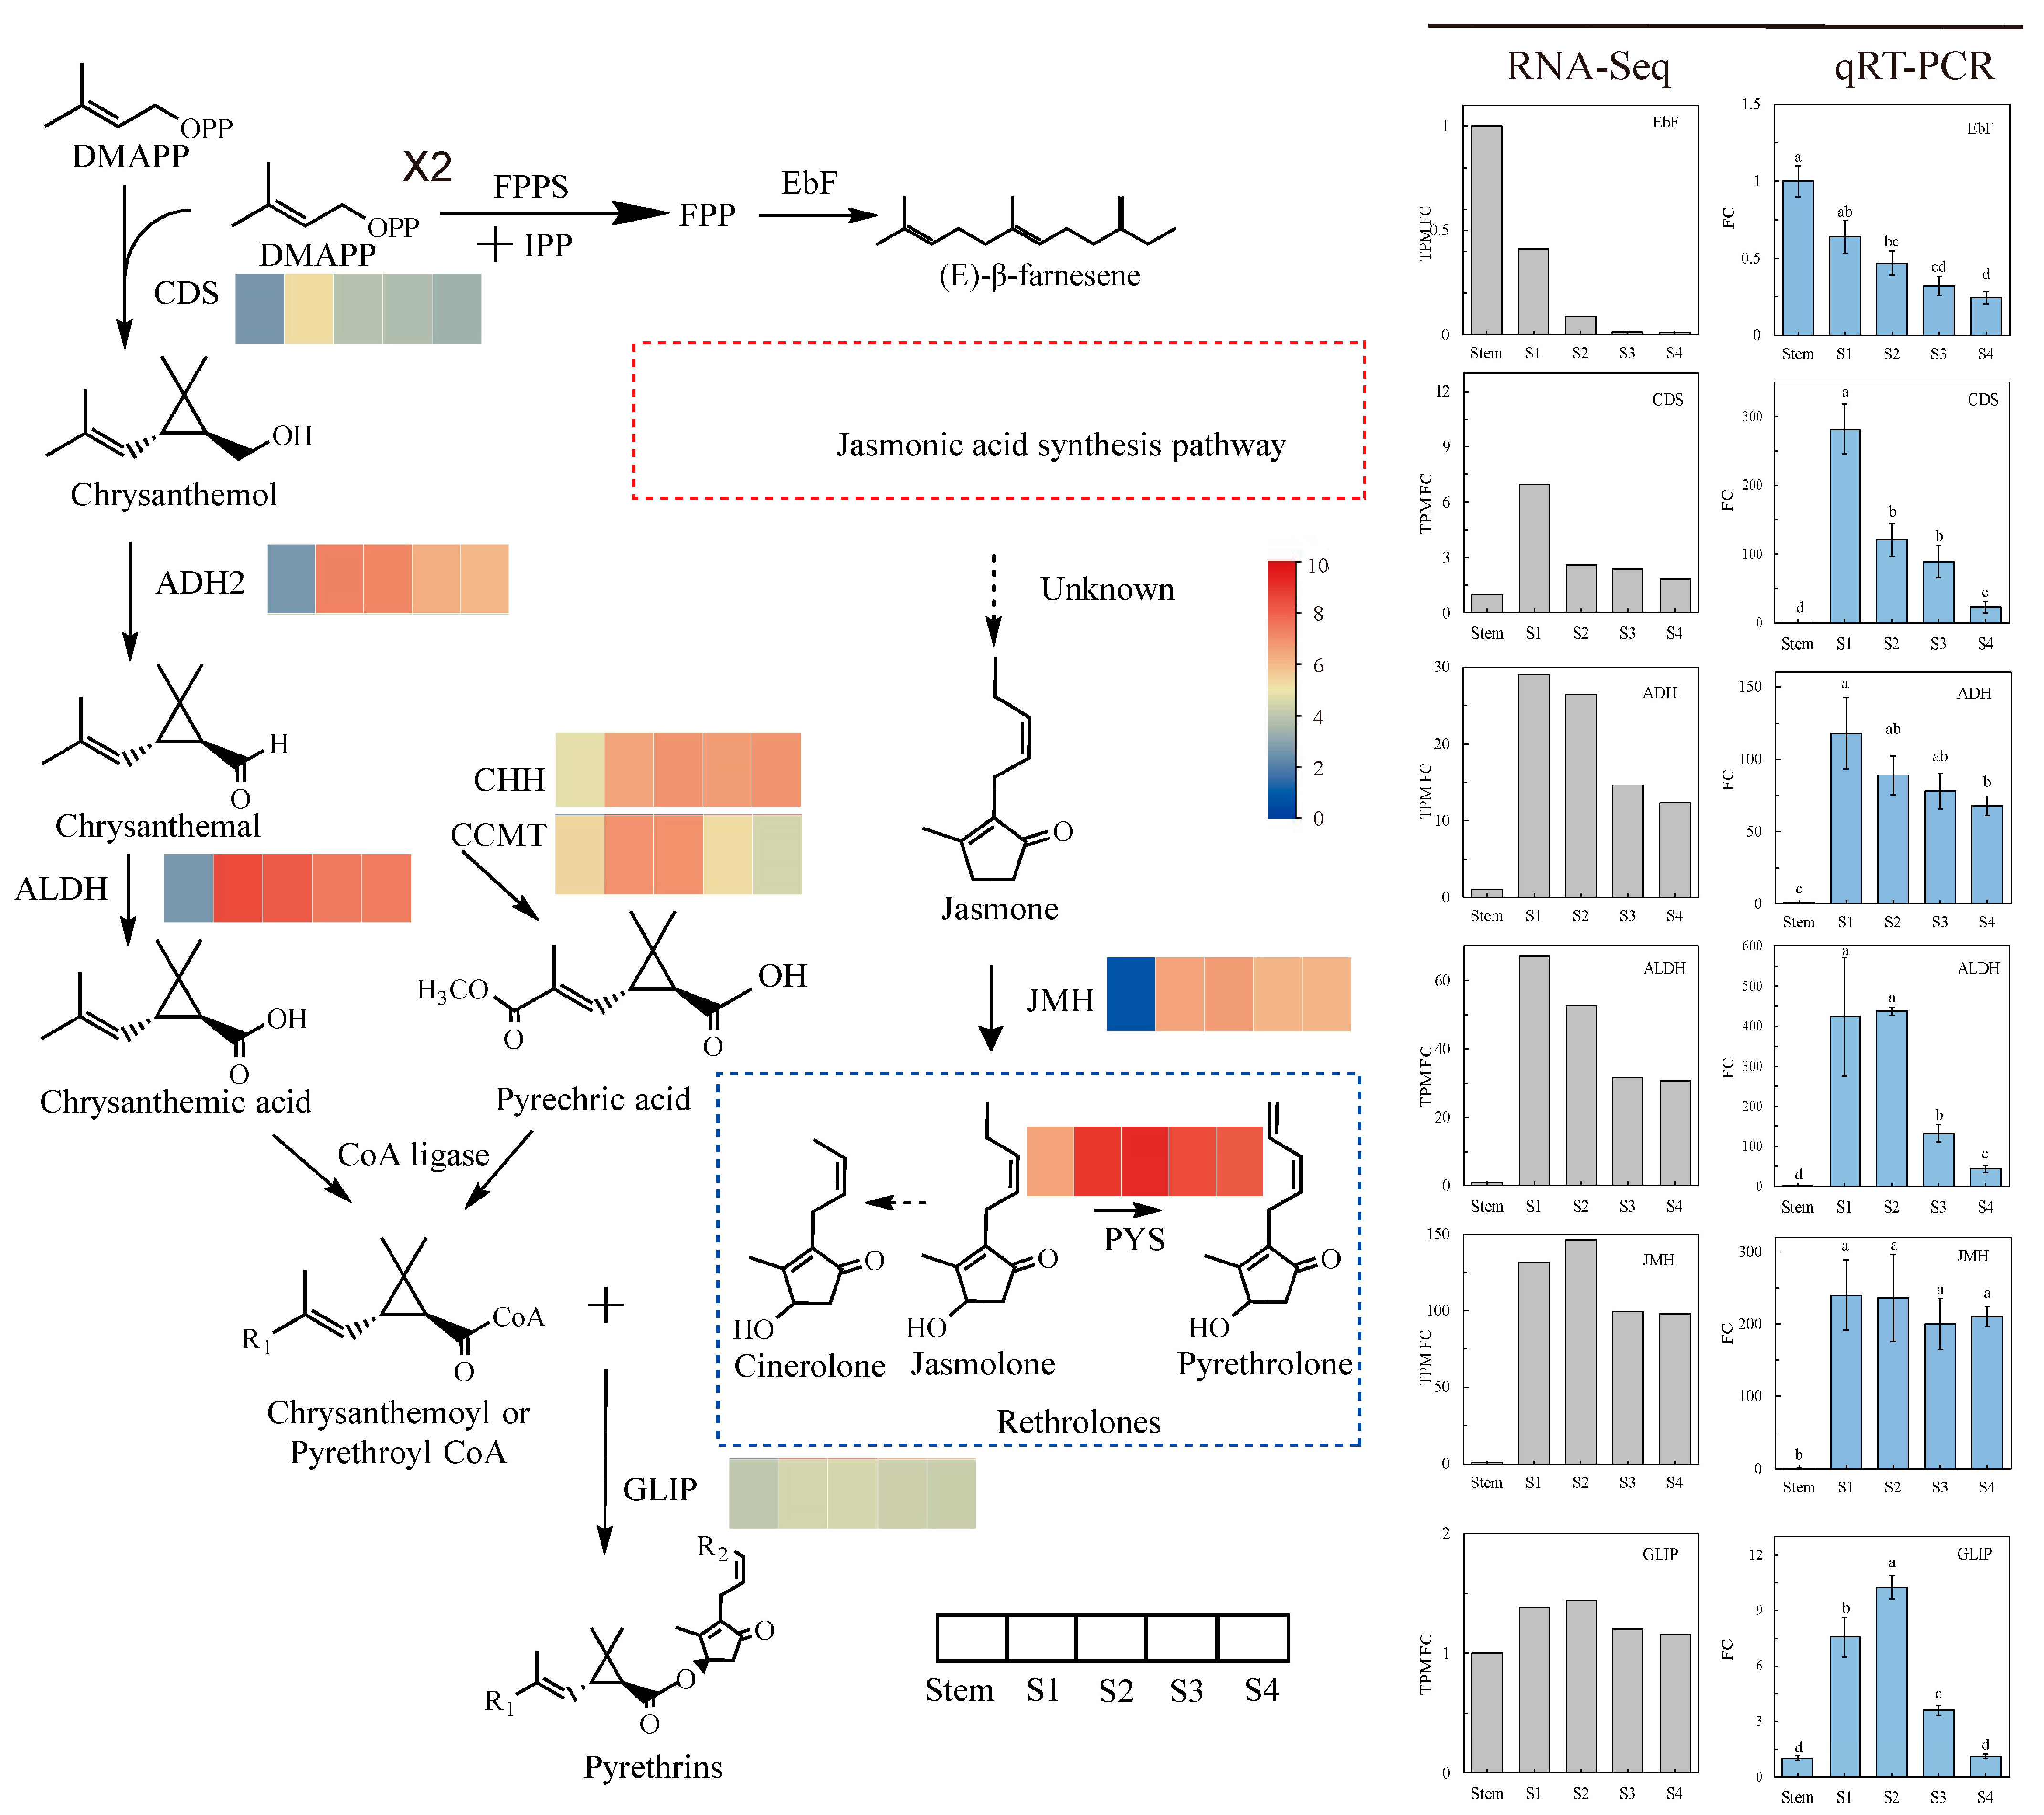
2.4. Differential Gene Expression in Pyrethrins Biosynthesis

While some pathways in the synthesis of pyrethrins remain unclear, most have been well elucidated. The DEGs selected for expression analysis have been previously validated in T. cinerariifolium as key regulators or enzymes involved in the biosynthesis of pyrethrins and EβF. DEG analysis reveals that the expression of pyrethrin biosynthetic genes is extremely low in the stem but significantly elevated during the early flowering stages (S1 and S2). Their expression is subsequently downregulated during the mid-flowering stages (S3 and S4). qRT-PCR results show that genes such as CDS (Chrysanthemyl Diphosphate Synthase), ADH (Alcohol Dehydrogenase), ALDH (Aldehyde Dehydrogenase) and GLIP (GDSL-like Lipase) are highly expressed during the early to mid-flowering stages (S1 and S2). Notably, JMH (Jasmonate Hydroxylase) maintains consistently high expression levels throughout all flowering stages. In contrast, EβF expression is highest in the stem and at the early flowering stage (S1) (Figure 5).

2.5. WGCNA Co-Expression Analysis

To further investigate the biosynthesis of pyrethrins in T. cinerariifolium, a filtering threshold was applied, selecting genes with an average TPM value greater than 1 and a coefficient of variation exceeding 0.2. Using the filtered expression matrix containing 28,749 genes, co-expression modules were constructed with a fitting index and optimal connectivity, using a soft threshold power of 11. A merging threshold of 0.3 yielded 66 modules, whereas a threshold of 0.2 reduced the number to 22 modules (Figure 6a,b). Among these, the darkolivegreen module (2856 genes), honeydew1 module (1091 genes), and coral1 module (3026 genes) were identified as being highly correlated with pyrethrin biosynthesis (Figure 6c).
To further investigate the association between these three modules and pyrethrin biosynthesis, KEGG enrichment analysis was performed, and the top 20 pathways were visualized based on their significance (Figure S2a–c). The major enriched pathways in the coral1, honeydew1, and darkolivegreen modules were largely consistent, including metabolic pathways (222, 218, and 73 genes, respectively) and biosynthesis of secondary metabolites (102, 132, and 73 genes, respectively). Additionally, the honeydew1 module showed specific enrichment in pathways related to monoterpenoid biosynthesis (4 genes) and plant–pathogen interactions (30 genes), highlighting potential links to plant defense mechanisms. In contrast, the darkolivegreen module was enriched in plant hormone signal transduction pathways (31 genes) and α-linolenic acid metabolism pathways (14 genes), both associated with JA biosynthesis. These results suggest that hormonal regulation, particularly involving JA, plays a pivotal role in pyrethrin biosynthesis in T. cinerariifolium.
GO enrichment further confirmed these results (Figure S2d–f). In the honeydew1 module, the main enrichments included 104 protein bindings, 4 trichome differentiations, and 3 ABC-type xenobiotic transporter activities. The synthesis of pyrethrins is highly related to gland differentiation. During the flowering stage, it is synthesized by the glands and then transported to the ovary wall outside the glands. The pathways associated with the activity of these ABC-type transporters may play a significant role in pyrethrin synthesis and transport. In the darkolivegreen module, the most significant enrichment was observed in 297 plasma membrane proteins, as well as numerous pathways related to hormones, including 32 responses to jasmonic acid, 56 responses to abscisic acid, 25 responses to ethylene, 11 jasmonic acid biosynthetic processes, and 14 jasmonic acid-mediated signaling pathways. This module also included 34 defense responses to fungus and 118 DNA-binding transcription factor activities. Additionally, 28 responses to wounding pathways were identified, indicating that genes involved in these pathways may play a crucial role in enhancing pyrethrin content in response to damage. In the coral1 module, the most significant enrichments were 328 plasma membrane proteins, 35 responses to wounding, 31 defense responses to fungus, and 21 responses to jasmonic acid. These pathways related to damage response, antifungal activity, and response to MeJA are highly associated with pyrethrin synthesis.
The enrichment of JA-related pathways across multiple modules further supports the role of JA as a central regulator in pyrethrin biosynthesis. Given that JA is well known for its function in plant defense, it is plausible that pyrethrins and JA share a coordinated regulatory mechanism. The identification of genes involved in ABC-type transporters, trichome differentiation, and defense responses suggests that both transport and glandular structures are crucial for efficient pyrethrin accumulation. Moreover, the observed enrichment in wounding response pathways reinforces the idea that pyrethrin biosynthesis may be inducible by biotic or abiotic stressors, similar to other secondary metabolites in plants.
To identify key regulatory genes in these modules, protein–protein interaction (PPI) networks were constructed using the STRING database, and hub genes were identified with the Cytohubba plugin in Cytoscape. In the honeydew1 module, hub genes included AP2, which is involved in transcriptional regulation, TTG1 (trichome development), TPS11 (terpene synthesis), PLA2A (lipid hydrolysis), and transcription factors MYB73 and MYB12 (Figure 7a). The darkolivegreen module featured hub genes such as ALDH7B4, ALDH3H1, and ALDH10A8, which are known to play roles in pyrethrin biosynthesis. Additionally, this module included EIN3 (ethylene-insensitive 3), which interacts with MYC2, MYC3, and MYC4 to inhibit the expression of jasmonic acid-induced wound response genes and herbivore defense genes (Figure 7b). In the coral1 module, hub genes included COI1 (CORONATINE INSENSITIVE 1), MYC2, and JAZ1 (Figure 7c). Among these, the MYC2 gene corresponds to the TRINITY_DN73856_c0_g1 gene. Amplification of the MYC2 interaction network revealed that MYC2 plays a central role in the jasmonic acid pathway, interacting with multiple JAZ proteins to mediate responses in the JA signaling pathway (Figure 7d).

3. Discussion

3.1. Dynamics of Pyrethrin and EβF Biosynthesis in T. cinerariifolium

This study provides a comprehensive analysis of the biosynthesis and regulation of pyrethrins and EβF in T. cinerariifolium, elucidating their accumulation patterns and the gene expression profiles. Pyrethrin content increases from S1 to S5, with relatively high levels observed during the S4–S5, aligning with its critical role in plant defense and representing a common harvest time for industrial applications [6]. Conversely, EβF levels are elevated in the stem and early floral stages, suggesting its function in early defense signaling and ecological interactions, a phenomenon observed in fields where pyrethrum attracts numerous predatory ladybugs during the S1–S2 stages [8]. The biosynthetic pathways of pyrethrins and EβF, both stemming from isoprenoid metabolic precursors but diverging into monoterpenoid and sesquiterpenoid routes, respectively, exemplify a sophisticated ecological defense strategy. Pyrethrins, synthesized via the MEP pathway [17], are crucial for deterring pests in later floral stages. EβF, synthesized from the MVA pathway [16], acts as an alarm pheromone to attract predatory insects during the early flowering stages [8]. In addition, EβF enhances the pyrethrin’s effectiveness [19]. This establishes a nuanced regulatory network that orchestrates pyrethrin biosynthesis and supports the plant’s adaptive responses to environmental cues.
Endogenous JAs and pyrethrin synthesis-related genes exhibited similar expression patterns: they were expressed at low levels during the stem elongation stage, increased during the S1 and S2 stages of flowering, and were downregulated in S3 and S4. This co-expression pattern, particularly the simultaneous upregulation of JA and pyrethrin-related genes during early flowering, suggests a coordinated regulation of these pathways. Such synchronization indicates that other co-expressed genes during these peak periods could play roles in pyrethrin biosynthesis, providing potential targets for identifying new genes involved in this synthetic pathway.
Notably, while our study highlights the coordinated expression of JA and pyrethrin biosynthesis genes in flower heads, previous studies have reported contrasting findings regarding the role of MeJA treatment. For example, in leaves, MeJA treatment strongly induced early-stage pyrethrin biosynthesis genes but downregulated late-stage genes encoding enzymes such as GLIP, JMH, and PYS, ultimately slowing pyrethrin production [20]. In flower heads, however, pyrethrin synthesis exhibited a diminished response to MeJA treatment, with no significant impact on pyrethrin content [21]. These earlier findings suggest substantial tissue-specific regulatory differences in pyrethrin biosynthesis.

3.2. Insights from Co-Expression Analysis

WGCNA is a robust tool for studying gene interactions and identifying modules associated with secondary metabolite pathways. It has been widely used to integrate transcriptomic and metabolomic data, revealing key regulatory mechanisms. For instance, WGCNA effectively identified genes and pathways associated with high sugar, high acid, and high anthocyanin traits in Vaccinium duclouxii [22], flavonoids linked to cold tolerance in chrysanthemum [23], and the effects of forchlorfenuron and thidiazuron on flavonoid biosynthesis in table grape skins [24].
However, WGCNA has limitations, especially when gene expression and metabolite synthesis or accumulation are asynchronous. qRT-PCR analysis revealed that genes related to pyrethrin biosynthesis are highly expressed during the S1–S2 stages of flowering but exhibit significant lag in pyrethrin accumulation, which becomes substantial only during the S4–S5 stages. In contrast, EβF shows synchronous patterns of gene expression and accumulation. This difference can be attributed to the contrasting biosynthetic pathways and storage characteristics of the two compounds. Pyrethrin biosynthesis involves the complete MEP pathway and parts of the JA synthesis pathway, making it a complex, multi-step process influenced by numerous regulatory factors [2,17]. Additionally, pyrethrins are primarily stored in intercellular spaces or the fruit pericarp tissues, which likely reduces their phytotoxic effects but also delays their accumulation [25]. This storage mechanism further contributes to the diminished responsiveness of pyrethrin synthesis in flower heads to JA signal [20,21]. In contrast, EβF synthesis is a simpler, single-step process catalyzed by sesquiterpene synthase, and it is localized in glandular trichomes and head cells, facilitating faster synthesis and transport [11,26].
The asynchronous nature of pyrethrin gene expression and metabolite accumulation underscores the limitations of using pyrethrin content as a direct trait for WGCNA analysis. Therefore, in this study, analyzing the co-expression patterns of known pyrethrin biosynthetic genes represents a more reliable approach for identifying regulatory networks and candidate genes involved in pyrethrin synthesis.
Through WGCNA, three key modules, honeydew1, darkolivegreen and coral1, were identified as strongly associated with pyrethrin biosynthesis and defense responses. Each module revealed distinct but interconnected pathways contributing to secondary metabolite production. The honeydew1 module was enriched in genes related to trichome differentiation, plant–pathogen interactions, and monoterpenoid biosynthesis, underscoring its relevance to glandular structures where pyrethrins are synthesized. The darkolivegreen module highlighted pathways involving JA biosynthesis and signaling, while the coral1 module included key JA pathway components such as MYC2, JAZ1, and COI1, which are critical regulators of JA responses. The presence of ABC transporters and plasma membrane proteins across these modules suggests their roles in metabolite synthesis and transport. Collectively, these modules provide a comprehensive regulatory map integrating pyrethrin biosynthesis with broader plant defense mechanisms.
Our analysis also revealed modules associated with trichome differentiation. Laboratory experiments demonstrated that MeJA treatment enhances trichome density in seedlings, correlating directly with increased pyrethrin content [20]. Similarly, field studies reported a positive correlation between trichome density and pyrethrin accumulation [27]. Supporting this, experiments on T. cinerariifolium callus and CRISPR-Cas9-edited hairy roots devoid of glandular trichomes failed to produce pyrethrins, even under induced differentiation conditions [28]. These observations emphasize that glandular trichomes are essential for pyrethrin biosynthesis and may represent a critical rate-limiting factor in its production.
Among the key genes identified, TcTTG1, a WD40-repeat protein, was co-expressed with pyrethrin biosynthetic genes. TcTTG1 shares homology with TTG1 in A. thaliana and A. annua, both of which are involved in trichome development [29]. In A. thaliana, TTG1 interacts with the MYB-family gene GL1 and bHLH-family gene GL3, forming a MYB-bHLH-WD40 ternary complex that governs trichome formation [30,31]. Similarly, A. annua homolog AaGSW2, a WRKY transcription factor, positively regulates glandular development and enhances artemisinin synthesis [32]. Although functional details of TcTTG1 require further validation, its co-expression with pyrethrin biosynthetic genes suggests it may play a critical role in glandular trichome formation and pyrethrin biosynthesis.
Furthermore, transcription factors such as MYB73, MYC2, and JAZ1 emerged as key regulatory genes. Studies have shown that MYC2, enriched in MeJA-treated leaf transcriptomes, acts as a central regulator of JA-mediated pathways [20], while MYB73 in apples regulates vacuolar transport systems to influence malic acid accumulation [33]. Additionally, ABC transporters, identified within these modules, are critical for transporting pyrethrin precursors and products between plastids, cytoplasm, and extracellular spaces. These transport systems, along with key transcription factors, represent integral components of the pyrethrin biosynthetic pathway and promising targets for metabolic engineering to enhance pyrethrin production.

3.3. Implications for Pest Management and Future Directions

The elucidation of pyrethrin and EβF biosynthesis pathways provides valuable insights into how T. cinerariifolium produces and deploys these compounds as defense mechanisms. The distinct roles of pyrethrins in direct insecticidal activity and EβF in predator attraction and alarm signaling highlight a synergistic defense strategy that can be exploited in integrated pest management. By enhancing the natural production of these compounds, either through genetic engineering or optimized cultivation practices, it may be possible to develop bio-based solutions that reduce reliance on synthetic pesticides, aligning with global goals for sustainable agriculture.
The co-expression modules identified through WGCNA, particularly the honeydew1, darkolivegreen, and coral1 modules, point to key regulatory nodes that could be targeted for metabolic engineering. For example, manipulating MYC2, EIN3, and ABC transporters may enhance pyrethrin accumulation without compromising plant growth or other metabolic functions. Moreover, understanding the interplay between the JA pathway and other hormonal pathways, such as ABA and ethylene provides a framework for designing strategies that optimize plant resilience under various environmental conditions while maintaining high secondary metabolite yields.
Future research should focus on the application of these findings to improve the commercial viability of T. cinerariifolium as a bio-pesticide resource. This includes developing molecular tools to precisely regulate pyrethrin and EβF biosynthesis during key growth stages, as well as exploring how environmental factors, such as light, temperature, and biotic stress, influence these pathways. Additionally, investigating the role of glandular trichomes and transport mechanisms in pyrethrin localization and secretion may reveal further targets for enhancing yield and efficiency. Advancing transcriptomic and metabolomic techniques will allow for a more comprehensive understanding of how secondary metabolism is dynamically regulated in response to environmental stimuli, paving the way for innovations in plant science and sustainable agriculture.

4. Materials and Methods

4.1. Plant Materials

The T. cinerariifolium plants, derived from tissue culture (clonal progeny), were cultivated in the greenhouse at Huazhong Agricultural University. Flowers at different developmental stages (S1–S4) and flower stalks were collected according to the stages defined by Ramirez’s study [34], and the flower stalks were collected as described in [8]. At each stage, tissues were randomly sampled from different plants within the same stage and then pooled to ensure representativeness. A total of 15 samples were collected, including 3 stem samples and 3 samples from each flowering stage (S1–S4). All samples were replicated in triplicate and immediately transferred to liquid nitrogen for rapid freezing and further analysis.

4.2. GC-MS Analysis

For the stored samples, 100 mg of the thoroughly ground powder was transferred to a 2 mL vial containing n-hexane with 8.7 ng/μL methyl laurate as an internal standard (chromatography grade). The mixture was vortexed for 15 s, centrifuged at 5000× g for 10 min, and the supernatant was passed through a drying column packed with anhydrous sodium sulfate. For tissues too small to be ground, n-hexane extraction was performed directly, and the extracts were transferred to 1.5 mL autosampler vials and stored at −20 °C until analysis.
The GC/MS analysis was performed using a GC/MS-QP2010 Ultra system (Shimadzu Corporation, Kyoto, Japan) equipped with an HP-5 MS column. The column temperature was maintained at 40 °C for 3 min, then ramped at 10 °C/min to 280 °C and held for 2 min. The ion source and transfer line temperatures were set at 230 °C and 280 °C, respectively. Electron ionization was conducted at 70 eV, with a mass scan range of 45 to 450 m/z and a scanning rate of 5 scans per second. Data analysis was carried out using Shimadzu GC solutions software v4.20, with qualitative and quantitative assessments based on the NIST2011 and the PESTEI3 pesticide databases. Each sample was analyzed in triplicate with chrysanthemum flower head extract (Sigma-Aldrich, Saint Louis, MO, USA) used as the standard reference material.

4.3. Total RNA Extraction, cDNA Library Construction and Sequencing

Total RNA was extracted from the samples using the phenol/chloroform method. RNA concentration and integrity were assessed using the NanoDrop 2000 spectrophotometer (Thermo Scientific, Waltham, MA, USA) and the Agilent Bioanalyzer 2100 System (Agilent Technologies, Santa Clara, CA, USA). The NEBNext® Ultra™ RNA Library Prep Kit for Illumina® (NEB, Ipswich, MA, USA) was used to generate sequencing libraries. The PCR products were purified and the library quality was assessed using the Agilent Bioanalyzer 2100 system. Sequencing was performed by a commercial sequencing company (MGI, Wuhan, China). The raw sequences described in this article were submitted and released to The National Genomics Data Center (NGDC, https://ngdc.cncb.ac.cn) under BioProject PRJCA033633 (accessed on 13 December 2024).

4.4. Transcript Splicing, Annotation, and Quality Assessment

Raw reads were processed for quality control using Fastp v0.20.1 software with default parameters to remove low-quality values, adapter sequences, and poly-N sequences [35]. Reads with low-quality values, adapter sequences, and poly-N sequences were filtered out. Clean reads were then assembled using Trinity v2.6.6 [18]. The longest transcript from the assembly was designated as the unigene for subsequent analyses. The assembly’s accuracy and completeness were assessed using N50 and BUSCO v3.0.2 metrics [36].
The TransDecoder v5.5.0 software was used to predict the reading frames of unigenes and translate the coding sequences (https://github.com/TransDecoder/TransDecoder, accessed on 13 December 2024, parameter: -m 50). Transcription factors were identified using the PlantTFdb (http://planttfdb.gao-lab.org/, accessed on 13 December 2024) database [37]. Alignment was performed using Diamond v0.9.24 (parameters: -max-target-seqs 1, -evalue 1 × 10⁻⁵) [38], aligning unigenes to the NCBI non-redundant (Nr) database (https://ftp.ncbi.nlm.nih.gov/blast/db/, accessed on 13 December 2024), COG database (http://www.ncbi.nlm.nih.gov/COG, accessed on 13 December 2024), Swiss-Prot database (http://www.expasy.ch/sprot), KEGG database (http://www.genome.jp/kegg, accessed on 13 December 2024), and Gene Ontology (GO) database (http://www.geneontology.org/, accessed on 13 December 2024). Based on the alignment results against the Nr database, the species distribution of the aligned sequences was statistically analyzed and plotted. The Venn diagram was generated using Evenn (http://www.ehbio.com/test/venn/, accessed on 13 December 2024) [39].
The reads were aligned back to the assembled transcripts using Bowtie2 v2.3.4 (parameters: mismatch 0) software [40]. The alignment results were analyzed using RSEM v1.3.1 [41], to obtain the read count of each sample mapped to the unigenes, which were then normalized to TPM values. For quality assessment, Pearson correlation coefficients and PCA were performed using R v3.6.1 programming language to evaluate the correlation and reproducibility among samples.

4.5. Screening and Enrichment Analysis of Differential Genes

Differential gene expression analysis between samples was performed using the R package DESeq2 v1.10 [42], with a threshold set at |log2FoldChange| > 1 and an adjusted p-value (Padj) < 0.05. The DEGs (differentially expressed genes) were subjected to K-means hierarchical clustering. The R package ClusterProfiler facilitated GO and KEGG enrichment analysis of these genes [43].

4.6. WGNCA Analysis

Co-expression network analysis was performed using the R package WGCNA v1.703 in R v3.6.3 to assess modules of genes with high correlation [44]. Transcripts with an average expression below 1 were excluded. Modules linked to phenotypic traits were pinpointed in the network by converting the adjacency matrix into a topological overlap matrix using WGCNA. Modules were clustered based on similar expression patterns. The obtained modules were subjected to KEGG and GO enrichment analysis using KOBAS v3.0 [45]. Protein–protein interaction networks were retrieved from the STRING v11.5 database (http://string-db.org/). Hub genes were selected using the CytoHubba plugin [46], and visualization analysis was performed using Cytoscape v3.8.2 [47].

4.7. Transcriptome qRT-PCR Validation

To validate the accuracy of RNA-Seq data, pyrethrins synthesis-related genes were selected for qRT-PCR. The RNA samples were reverse transcribed using a reverse transcription kit (Toyobo, Osaka, Japan). Specific primers were designed (Table S4), and qRT-PCR was performed using the SYBR preMix Ex Taq Kit (Takara, Kusatsu, Japan) and the Roche LightCycler® 96 System (Roche, Basel, Switzerland) with the local transcriptome library validated using Tbtools v1.075 [48]. The qRT-PCR reaction system, with a total volume of 20 µL, included 10 µL of SYBR mixture, 0.4 µL of the upstream primer, 0.4 µL of the downstream primer, and 0.5 ng of the template. The amplification program consisted of pre-denaturation at 94 °C for 30 s, followed by 40 cycles of denaturation at 94 °C for 5 s, annealing at 60 °C for 15 s, and extension at 72 °C for 10 s. The relative expression levels were calculated using the 2−ΔΔCT method with the GADPH gene as the reference gene [49]. Each sample was analyzed by qRT-PCR with three independent biological replicates and two technical replicates.

5. Conclusions

This study provides novel insights into the dynamic biosynthesis and regulation of pyrethrins and EβF in T. cinerariifolium, highlighting the complexity of their spatiotemporal expression and functional roles in plant defense. The observed asynchrony between pyrethrin gene expression and metabolite accumulation underscores the intricate regulation of monoterpenoid pathways, while the synchronization of EβF biosynthesis points to its distinct ecological functions during early flower development. By identifying key pathways such as JA signaling, trichome differentiation, and terpene transport as potentially associated with pyrethrin biosynthesis, and pinpointing hub genes like MYC2, this study lays the groundwork for future research into metabolic engineering and targeted breeding strategies. Furthermore, the results emphasize the significance of integrating transcriptomic data with functional studies to unravel the regulation of secondary metabolite pathways. These findings not only advance our understanding of T. cinerariifolium biology but also offer practical applications in optimizing bio-pesticide production for sustainable agriculture.

Supplementary Materials

The following supporting information can be downloaded at: https://www.mdpi.com/article/10.3390/horticulturae11020201/s1, Figure S1: Developmental stages of T. cinerariifolium flowers and GC-MS analysis of key metabolites in S2. Figure S2: WGCNA modules gene functional enrichment analysis. Table S1: The mass spectrograms of T. cinerariifolium S2 flowers. Table S2: GCMS Analysis of Pyrethrins and EβF in Different Samples. Table S3: Summary of Illumina HiSeq sequencing data, Table S4: Primers used in experiment.

Author Contributions

Conceptualization, T.Z. and J.L. (Jiawen Li); investigation, T.Z. and J.L. (Jiawen Li); methodology, T.Z. and J.L. (Jiawen Li); software, T.Z. and J.L. (Jiawen Li); validation, T.Z. and J.L. (Jiawen Li); data curation, J.L. (Jinjin Li); writing—original draft preparation, T.Z. and J.L. (Jinjin Li); writing—review and editing, T.Z., J.L. (Jinjin Li) and C.W.; visualization, T.Z.; supervision, J.L. (Jinjin Li) and C.W. All authors have read and agreed to the published version of the manuscript.

Funding

This work was supported by the National Natural Science Foundation of China (grant no. 32160718): the Guizhou Normal University QSXM[2022]19, the college student innovation and entrepreneurship training program project (202310663009), and Guizhou Science and technology innovation team project (Molecular biology of stress resistance in crop).

Data Availability Statement

The raw sequences described in this article were submitted and released to The National Genomics Data Center (NGDC, https://ngdc.cncb.ac.cn) under BioProject PRJCA033633 (accessed on 13 December 2024).

Conflicts of Interest

The authors declare no conflicts of interest.

References

  1. Mossa, A.H.; Mohafrash, S.M.M.; Chandrasekaran, N. Safety of natural insecticides: Toxic effects on experimental animals. BioMed Res. Int. 2018, 2018, 4308054. [Google Scholar] [CrossRef] [PubMed]
  2. Lybrand, D.B.; Xu, H.; Last, R.L.; Pichersky, E. How plants synthesize pyrethrins: Safe and biodegradable insecticides. Trends Plant Sci. 2020, 25, 1240–1251. [Google Scholar] [CrossRef] [PubMed]
  3. Matsuda, K. Chemical and biological studies of natural and synthetic products for the highly selective control of pest insect species. Biosci. Biotechnol. Biochem. 2022, 86, 1–11. [Google Scholar] [CrossRef] [PubMed]
  4. Grdisa, M.; Carovic-Stanko, K.; Kolak, I.; Satovic, Z. Morphological and biochemical diversity of dalmatian pyrethrum (Tanacetum cinerariifolium (Trevir.) Sch Bip.). Agric. Conspec. Sci. 2009, 74, 73–80. [Google Scholar]
  5. Jeran, N.; Grdiša, M.; Varga, F.; Šatović, Z.; Liber, Z.; Dabić, D.; Biošić, M. Pyrethrin from Dalmatian pyrethrum (Tanacetum cinerariifolium/Trevir./Sch. Bip.): Biosynthesis, biological activity, methods of extraction and determination. Phytochem. Rev. 2021, 20, 875–905. [Google Scholar] [CrossRef]
  6. Zeng, T.; Li, J.; Li, J.; Hu, H.; Zhu, L.; Liu, K.; Bai, J.; Jiang, Q.; Wang, C. Pyrethrins in Tanacetum cinerariifolium: Biosynthesis, regulation, and agricultural application. Ornam. Plant Res. 2024, 4, e015. [Google Scholar] [CrossRef]
  7. Li, J.J.; Hu, H.; Chen, Y.; Xie, J.; Li, J.; Zeng, T.; Wang, M.Q.; Luo, J.; Zheng, R.R.; Jongsma, M.A.; et al. Tissue specificity of (E)-beta-farnesene and germacrene D accumulation in pyrethrum flowers. Phytochemistry 2021, 187, 112768. [Google Scholar] [CrossRef]
  8. Li, J.J.; Hu, H.; Mao, J.; Yu, L.; Stoopen, G.; Wang, M.Q.; Mumm, R.; de Ruijter, N.C.A.; Dicke, M.; Jongsma, M.A.; et al. Defense of pyrethrum flowers: Repelling herbivores and recruiting carnivores by producing aphid alarm pheromone. New Phytol. 2019, 223, 1607–1620. [Google Scholar] [CrossRef] [PubMed]
  9. Vandermoten, S.; Mescher, M.C.; Francis, F.; Haubruge, E.; Verheggen, F.J. Aphid alarm pheromone: An overview of current knowledge on biosynthesis and functions. Insect Biochem. Mol. Biol. 2012, 42, 155–163. [Google Scholar] [CrossRef] [PubMed]
  10. Zhang, R.; Wang, B.; Grossi, G.; Falabella, P.; Liu, Y.; Yan, S.; Lu, J.; Xi, J.; Wang, G. Molecular basis of alarm pheromone detection in aphids. Curr. Biol. 2017, 27, 55–61. [Google Scholar] [CrossRef]
  11. Li, J.; Hu, H.; Ren, S.; Yu, L.; Luo, Y.; Li, J.; Zeng, T.; Wang, M.; Wang, C. Aphid alarm pheromone mimicry in transgenic Chrysanthemum morifolium: Insights into the potential of (E)-β-farnesene for aphid resistance. Front. Plant Sci. 2024, 15, 1373669. [Google Scholar] [CrossRef] [PubMed]
  12. Bhat, B.K.; Menary, R.C. Scanning electron microscopic study of oil glands in pyrethrum flowers. Pyrethrum Post 1975, 15, 11–15. [Google Scholar]
  13. Head, S.W. A study of the insecticidal constituents in Chrysanthemum cinerariaefolium. (1) Their development in the flower head. (2) Their distribution in the plant. Pyrethrum Post 1966, 8, 32–37. [Google Scholar]
  14. Kikuta, Y.; Ueda, H.; Nakayama, K.; Katsuda, Y.; Ozawa, R.; Takabayashi, J.; Hatanaka, A.; Matsuda, K. Specific regulation of pyrethrin biosynthesis in Chrysanthemum cinerariaefolium by a blend of volatiles emitted from artificially damaged conspecific plants. Plant Cell Physiol. 2011, 52, 588–596. [Google Scholar] [CrossRef] [PubMed]
  15. Ueda, H.; Kikuta, Y.; Matsuda, K. Plant communication: Mediated by individual or blended VOCs? Plant Signal. Behav. 2012, 7, 222–226. [Google Scholar] [CrossRef] [PubMed]
  16. Liu, Y.; Wang, Z.; Cui, Z.; Qi, Q.; Hou, J. Progress and perspectives for microbial production of farnesene. Bioresour. Technol. 2022, 347, 126682. [Google Scholar] [CrossRef]
  17. Matsuda, K.; Kikuta, Y.; Haba, A.; Nakayama, K.; Katsuda, Y.; Hatanaka, A.; Komai, K. Biosynthesis of pyrethrin I in seedlings of Chrysanthemum cinerariaefolium. Phytochemistry 2005, 66, 1529–1535. [Google Scholar] [CrossRef]
  18. Grabherr, M.G.; Haas, B.J.; Yassour, M.; Levin, J.Z.; Thompson, D.A.; Amit, I.; Adiconis, X.; Fan, L.; Raychowdhury, R.; Zeng, Q.; et al. Full-length transcriptome assembly from RNA-Seq data without a reference genome. Nat. Biotechnol. 2011, 29, 644–652. [Google Scholar] [CrossRef]
  19. Liu, F.; Wang, Q.; Xu, P.; Andreazza, F.; Valbon, W.R.; Bandason, E.; Chen, M.; Yan, R.; Feng, B.; Smith, L.B.; et al. A dual-target molecular mechanism of pyrethrum repellency against mosquitoes. Nat. Commun. 2021, 12, 2553. [Google Scholar] [CrossRef] [PubMed]
  20. Zeng, T.; Li, J.W.; Xu, Z.Z.; Zhou, L.; Li, J.J.; Yu, Q.; Luo, J.; Chan, Z.L.; Jongsma, M.A.; Hu, H.; et al. TcMYC2 regulates pyrethrin biosynthesis in Tanacetum cinerariifolium. Hortic. Res. 2022, 9, uhac178. [Google Scholar] [CrossRef]
  21. Zito, S.W.; Zieg, R.G.; Staba, E.J. Distribution of pyrethrins in oil glands and leaf tissue of Chrysanthemum cinerariaefolium. Planta Medica 1983, 47, 205–207. [Google Scholar] [CrossRef] [PubMed]
  22. Zeng, T.; He, Z.J.; He, J.F.; Lv, W.; Huang, S.X.; Li, J.W.; Zhu, L.Y.; Wan, S.; Zhou, W.F.; Yang, Z.S.; et al. The Telomere-to-telomere gap-free reference genome of wild blueberry (Vaccinium duclouxii) provides its high soluble sugar and anthocyanin accumulation. Hortic. Res. 2023, 10, uhad209. [Google Scholar] [CrossRef] [PubMed]
  23. Wu, D.; Wu, Y.; Gao, R.; Zhang, Y.; Zheng, R.; Fang, M.; Li, Y.; Zhang, Y.; Guan, L.; Gao, Y. Integrated metabolomics and transcriptomics reveal the key role of flavonoids in the cold tolerance of chrysanthemum. Int. J. Mol. Sci. 2024, 25, 7589. [Google Scholar] [CrossRef] [PubMed]
  24. Ting, Z.; Pengcheng, Z.; Jiang, X.; Lingzhu, W.; Wanting, S.; Jiang, W.; Jianhui, C. Integrated transcriptomic and metabolomic analysis reveals the effects of forchlorfenuron and thidiazuron on flavonoid biosynthesis in table grape skins. Curr. Plant Biol. 2024, 40, 100417. [Google Scholar]
  25. Li, J.J.; Hu, H.; Fu, H.S.; Li, J.; Zeng, T.; Li, J.W.; Wang, M.Q.; Jongsma, M.A.; Wang, C.Y. Exploring the co-operativity of secretory structures for defense and pollination in flowering plants. Planta 2024, 259, 41. [Google Scholar] [CrossRef] [PubMed]
  26. Li, J.; Luo, Y.; Li, M.; Li, J.; Zeng, T.; Luo, J.; Chang, X.; Wang, M.; Jongsma, M.A.; Hu, H.; et al. Nocturnal burst emissions of germacrene D from the open disk florets of pyrethrum flowers induce moths to oviposit on a nonhost and improve pollination success. New Phytol. 2024, 244, 2036–2048. [Google Scholar] [CrossRef] [PubMed]
  27. Suraweera, D.; Groom, T.; Nicolas, M. Pattern of pyrethrin accumulation, achene and trichome development in relation to pattern of flower development in pyrethrum. II Int. Symp. Pyrethrum 2015, 1169, 93–100. [Google Scholar] [CrossRef]
  28. Li, J.W.; Zeng, T.; Xu, Z.Z.; Li, J.J.; Hu, H.; Yu, Q.; Zhou, L.; Zheng, R.R.; Luo, J.; Wang, C.Y. Ribozyme-mediated CRISPR/Cas9 gene editing in pyrethrum (Tanacetum cinerariifolium) hairy roots using a RNA polymerase II-dependent promoter. Plant Methods 2022, 18, 32. [Google Scholar] [CrossRef] [PubMed]
  29. Tian, H.; Wang, S. TRANSPARENT TESTA GLABRA1, a key regulator in plants with multiple roles and multiple function mechanisms. Int. J. Mol. Sci. 2020, 21, 4881. [Google Scholar] [CrossRef] [PubMed]
  30. Pesch, M.; Dartan, B.; Birkenbihl, R.; Somssich, I.E.; Hülskamp, M. Arabidopsis TTG2 regulates TRY expression through enhancement of activator complex-triggered activation. Plant Cell 2014, 26, 4067–4083. [Google Scholar] [CrossRef]
  31. Zhao, M.; Morohashi, K.; Hatlestad, G.; Grotewold, E.; Lloyd, A. The TTG1-bHLH-MYB complex controls trichome cell fate and patterning through direct targeting of regulatory loci. Development 2008, 135, 1991–1999. [Google Scholar] [CrossRef] [PubMed]
  32. Xie, L.H.; Yan, T.X.; Li, L.; Chen, M.H.; Ma, Y.N.; Hao, X.L.; Fu, X.Q.; Shen, Q.; Huang, Y.W.; Qin, W.; et al. The WRKY transcription factor AaGSW2 promotes glandular trichome initiation in Artemisia annua. J. Exp. Bot. 2020, 72, 1691–1701. [Google Scholar] [CrossRef]
  33. Hu, D.G.; Li, Y.Y.; Zhang, Q.Y.; Li, M.; Sun, C.H.; Yu, J.Q.; Hao, Y.J. The R2R3-MYB transcription factor MdMYB73 is involved in malate accumulation and vacuolar acidification in apple. Plant J. 2017, 91, 443–454. [Google Scholar] [CrossRef] [PubMed]
  34. Ramirez, A.M. Pyrethrum Secondary Metabolism: Biosynthesis, Localization and Ecology of Defence Compounds. Ph.D. Thesis, Wageningen University, Wageningen, The Netherlands, 2013. [Google Scholar]
  35. Chen, S.F.; Zhou, Y.Q.; Chen, Y.R.; Gu, J. Fastp: An ultra-fast all-in-one FASTQ preprocessor. Bioinformatics 2018, 34, 884–890. [Google Scholar] [CrossRef] [PubMed]
  36. Simão, F.A.; Waterhouse, R.M.; Ioannidis, P.; Kriventseva, E.V. BUSCO: Assessing genome assembly and annotation completeness with single-copy orthologs. Bioinformatics 2015, 19, 3210–3212. [Google Scholar] [CrossRef]
  37. Tian, F.; Yang, D.C.; Meng, Y.Q.; Jin, J.P.; Gao, G. PlantRegMap: Charting functional regulatory maps in plants. Nucleic Acids Res. 2020, 48, D1104–D1113. [Google Scholar] [CrossRef] [PubMed]
  38. Buchfink, B.; Xie, C.; Huson, D.H. Fast and sensitive protein alignment using DIAMOND. Nat. Methods 2015, 12, 59–60. [Google Scholar] [CrossRef] [PubMed]
  39. Chen, T.; Zhang, H.; Liu, Y.; Liu, Y.X.; Huang, L. EVenn: Easy to create repeatable and editable Venn diagrams and Venn networks online. J. Genet. Genom. 2021, 48, 863–866. [Google Scholar] [CrossRef]
  40. Langmead, B.; Salzberg, S.L. Fast gapped-read alignment with Bowtie 2. Nat. Methods 2012, 9, 357–359. [Google Scholar] [CrossRef]
  41. Li, B.; Dewey, C.N. RSEM: Accurate transcript quantification from RNA-Seq data with or without a reference genome. BMC Bioinform. 2011, 12, 16. [Google Scholar] [CrossRef]
  42. Anders, S.; Huber, W. Differential expression analysis for sequence count data. Genome Biol. 2010, 11, R106. [Google Scholar] [CrossRef] [PubMed]
  43. Yu, G.; Wang, L.G.; Han, Y.; He, Q.Y. ClusterProfiler: An R package for comparing biological themes among gene clusters. Omics J. Integr. Biol. 2012, 16, 284–287. [Google Scholar] [CrossRef]
  44. Zhang, B.; Horvath, S. A general framework for weighted gene co-expression network analysis. Stat. Appl. Genet. Mol. Biol. 2005, 4, 1. [Google Scholar] [CrossRef] [PubMed]
  45. Bu, D.; Luo, H.; Huo, P.; Wang, Z.; Zhang, S.; He, Z.; Wu, Y.; Zhao, L.; Liu, J.; Guo, J.; et al. KOBAS-i: Intelligent prioritization and exploratory visualization of biological functions for gene enrichment analysis. Nucleic Acids Res. 2021, 49, W317–W325. [Google Scholar] [CrossRef] [PubMed]
  46. Chin, C.H.; Chen, S.H.; Wu, H.H.; Ho, C.W.; Ko, M.T.; Lin, C.Y. CytoHubba: Identifying hub objects and sub-networks from complex interactome. BMC Syst. Biol. 2014, 8, S11. [Google Scholar] [CrossRef] [PubMed]
  47. Shannon, P.; Markiel, A.; Ozier, O.; Baliga, N.S.; Wang, J.T.; Ramage, D.; Amin, N.; Schwikowski, B.; Ideker, T. Cytoscape: A software environment for integrated models of biomolecular interaction networks. Genome Res. 2003, 13, 2498–2504. [Google Scholar] [CrossRef]
  48. Chen, C.J.; Chen, H.; Zhang, Y.; Thomas, H.R.; Frank, M.H.; He, Y.H.; Xia, R. TBtools: An integrative toolkit developed for interactive analyses of big biological data. Mol. Plant 2020, 13, 1194–1202. [Google Scholar] [CrossRef]
  49. Livak, K.J.; Schmittgen, T.D. Analysis of relative gene expression data using real-time quantitative PCR and the 2−ΔΔCT method. Methods 2001, 408, 402–408. [Google Scholar] [CrossRef]
Figure 1. Comparison of pyrethrins and EβF levels in T. cinerariifolium. (a) Relative content of pyrethrins at different flower developmental stages and in stems. (b) Relative content of EβF at different flower developmental stages and in stems. Error bars represent mean ± SD. Different lower-case letters indicate a significant difference (p < 0.05) from one-way ANOVA followed by a post hoc Tukey test. The values are normalized based on the stem sample.
Horticulturae 11 00201 g001
Figure 2. Transcriptome assembly and gene functional annotation. (a) BUSCO assessment results. (b) The Venn diagram shows the total number of functional annotations in databases. (c) Species distribution of the BlastX result against the Nr database.
Horticulturae 11 00201 g002
Figure 3. The quantification and DEGs of the samples. (a) Pearson correlation analysis of samples. (b) Principal Component Analysis of samples. (c) Distribution of DEGs between different periods. (d) Heat map of DEG clusters. The x-axis represents hierarchical clustering of samples based on gene expression similarity.
Horticulturae 11 00201 g003
Figure 4. DEGs assigned to JAs biosynthesis pathway. The colors in the heatmaps represent the normalized expression levels of DEGs, expressed as log10(TPM + 1). RNA-Seq (gray bars) and qRT-PCR (blue bars) data are shown. FC values are presented for expression level and normalized to the stem samples. Error bars represent mean ± SD. Different lower-case letters indicate a significant difference (p < 0.05) from one-way ANOVA followed by a post hoc Tukey test.
Horticulturae 11 00201 g004
Figure 5. The biosynthesis of pyrethrin and gene expression. The color shows the normalized expression score from log2(TPM + 1) of DEGs. Solid arrows indicate known steps in the pathway, dotted arrows indicate steps not yet elucidated, red dotted box indicates JAs synthesis pathway, blue dotted box indicates rethrolones, a pyrethrin molecule incorporates one of three rethrolones, right diagram: grey color represents RNA-Seq, blue color represents qRT-PCR. Error bars represent mean ± SD. Different lower-case letters indicate a significant difference (p < 0.05) from one-way ANOVA followed by a post hoc Tukey test.
Horticulturae 11 00201 g005
Figure 6. Co-expression modules determined by weighted gene co-expression network analysis. (a) The cluster dendrogram groups genes into modules based on their co-expression patterns. Each color below the dendrogram represents a distinct module. (b) Co-expression module expression spectrum diagram. Modules were identified using the dynamic tree cut method and subsequently merged based on their similarity. (c) Heatmap of correlations between module eigengenes (rows) and sample traits (columns). Red denotes a positive correlation, blue indicates a negative correlation, and the intensity of the color reflects the strength of the correlation. The numbers in each cell indicate the correlation coefficient and the p-value (in parentheses). Values are presented using scientific notation, such as “5e-06”, which denotes a value of 5 × 10⁻⁶.
Horticulturae 11 00201 g006
Figure 7. Co-expression modules determined by weighted gene co-expression network analysis. (ac) The predicted protein–protein interaction network of the honeydew1, darkolivergreen, and coral1 modules, constructed based on the Arabidopsis protein database using STRING. (d) Correlation network of MYC2.
Horticulturae 11 00201 g007
Disclaimer/Publisher’s Note: The statements, opinions and data contained in all publications are solely those of the individual author(s) and contributor(s) and not of MDPI and/or the editor(s). MDPI and/or the editor(s) disclaim responsibility for any injury to people or property resulting from any ideas, methods, instructions or products referred to in the content.

