Abstract
Hawthorn (Cratageus monogyna Jacq.), one of the important wild fruit species in Turkey, is an important fruit species in many countries due to its use in traditional medicine, landscaping studies, and the food and beverage industry. In this study, morphological characterization revealed significant variation among genotypes, with fruit weight ranging from 0.55 g to 2.87 g, fruit width from 9.74 mm to 18.39 mm, and leaf width from 19.53 mm to 41.19 mm. Genotype-dependent variations were observed in the total phenolic content (151.34 mg–491.88 mg GAE 100 g−1 flesh), the total flavonoid content (16.74–48.13 mg CAE 100 g−1 flesh), the total anthocyanin content (26.34–79.79 mg cyn-3 gluc 100 g−1 flesh), and the antioxidant activity (29.20% to 56.70%). HPLC-based phenolic profiling identified substantial variations in key bioactive compounds, with the highest levels of chlorogenic acid (16.16 mg 100 g−1 fw), caffeic acid (10.21 mg 100 g−1 fw), epicatechin (13.83 mg 100 g−1 fw), rutin (74.05 mg 100 g−1 fw), and protocatechuic acid (2.00 mg 100 g−1 fw). ISSR marker-based molecular analysis revealed a high degree of genetic polymorphism (89.12%), with 55 out of 62 bands classified as polymorphic. The polymorphic information content values ranged from 0.34 to 0.44. The Jaccard similarity coefficient ranged from 0.04 (M9 and M16) to 0.63 (M17 and M3), indicating substantial genetic variability. The tanglegram analysis comparing genetic and morphological–biochemical dendrograms yielded an entanglement score of 0.714, indicating an alignment between molecular and phenotypic data. These findings show that hawthorn genotypes from the Kelkit Valley exhibit extensive genetic and biochemical diversity, which is critical for conservation efforts, breeding programs, and the development of high-value medicinal and functional food products.
1. Introduction
The medicinal and nutritional characteristics of hawthorn, also known as Crataegus spp., have been highly regarded for a long time [1]. These features are related to the bioactive components that the plant contains, such as phenolics, which provide considerable advantages to one’s health. Inflammation of the throat, cough, weakening of heart activity, heart palpitations, renal illnesses, atherosclerosis, and liver discomfort are some of the cases that can be cured using the dried fruits and flowers of the hawthorn [2,3]. The fruits of many Crataegus species may be regarded as a substantial source of antioxidants, attributable to their elevated phenolic content and notable antioxidant components, including protocatechuic acids, rutin, quercetin, chlorogenic acid, epicatechin, and isoquercetin [4,5]. With the growing demand for natural health products throughout the world, it is becoming more important to have a grasp of the bioactive substances that are present within regional genotypes. It is known that the biochemical contents of fruits can be affected by genetic factors, environmental factors, and post-harvest processes [6]. In addition, the amount of biochemical contents varies according to species and even genetic varieties within the same species [7].
In Türkiye, hawthorn, a member of the Rosaceae family, is naturally found in mountainous regions. These plants are not subjected to any cultural management [8,9]. It is possible to see hawthorn trees in almost every region of Türkiye due to their low water requirement and their ability to grow naturally in mountainous and rocky areas [9]. Polymorphism and hybridization in hawthorns are very high, and genetic diversity extends from Türkiye to Iran [10]. Hawthorns, which have grown spontaneously and openly in nature for many years, are propagated by seeds [11]. This situation creates a high level of genetic diversity in nature through the hybridization of different species and genotypes over the years. Although many hawthorn species are grown for their edible fruits in Asia, Central America, and the Mediterranean countries, the species commonly grown in the Mediterranean countries, including Türkiye, is Crataegus monogyna Jacq. [12].
With the increasing world population, the unconscious use of plant resources to meet human needs and damage to the natural cover due to land expansion, urbanization, and industrialization have caused a decrease and rapid loss of plant gene resources [13]. The starting point for the effective use and protection of gene resources is the detection of genetic variation [14]. Germplasms are very important in providing material to breeders in the development of plant species [15,16].
Researchers have long used morphological, molecular, phenological, and phytochemical markers to assess genetic diversity in plants, including Crataegus spp. [2,17,18,19,20]. Molecular techniques, in particular, provide more accurate insights into genetic relationships by remaining unaffected by environmental variability [20,21]. Since many traits linked to resistance to abiotic and biotic stresses are regulated by complex gene networks, integrative studies that incorporate morphological, phytochemical, and molecular markers are essential for accurately assessing, preserving, and maintaining plant genetic diversity [22]. These approaches are critical not only for conservation but also for enhancing resilience and adaptability in plant breeding programs. For hawthorn, these analyses not only contribute to conservation efforts but may also contribute to the development of functional foods and medicinal products by helping to identify genotypes with optimum bioactive properties.
Researchers in the agricultural sector have mostly concentrated their efforts on defining the properties of hawthorn fruits, as well as their biochemical contents, tissue culture, and genetic study [2,23,24]. Morphological characterization alone may be insufficient to fully understand the genetic diversity and evolutionary relationships among hawthorn genotypes [2,25]. Molecular studies, including DNA-based markers and genomic analyses, are necessary to fully characterize genetic variation, assess phylogenetic relationships, and support conservation strategies. Integrating molecular approaches with morphological assessments can increase the accuracy of genotype classification, facilitate breeding programs, and help preserve valuable genetic resources [20,26]. Therefore, the incorporation of molecular techniques into hawthorn research is crucial for comprehensive biodiversity assessments and effective genetic improvement strategies. One of the reliable markers in determining the genetic relationships of entire plant populations is molecular markers [27]. During the last decade, several novel DNA-based markers were rapidly developed for characterizing the Crataegus genome and studying genetic diversity within and among wild landraces of this species. Such marker techniques include randomly amplified polymorphic DNA (RAPD) [28]; inter-simple sequence repeats (ISSRs) [29,30]; simple sequence repeats (SSRs) [31]; and SSR, ISSR, and SCoT markers [32].
The Kelkit Valley is a geographical transition region between the Black Sea region and the Central Anatolia region. The region has both a Black Sea climate and a continental climate. Kelkit Valley is very rich in terms of natural resources and biodiversity, and the climate and soil conditions are extremely suitable for agricultural production. The Kelkit Valley is at the intersection of the European–Siberian and Iran–Turanian floristic regions. It is also seen in plants belonging to the Mediterranean floristic region [33]. Kelkit Valley is located within grid squares A6 and A7 in the grid system created by Davis [34]. In a study carried out in the region, 2800 plants were collected. It was determined that the collected plants consisted of 519 genera and 1316 species and subspecific taxa belonging to 105 families, and 132 of these taxa were endemic [33]. Hawthorn has been growing naturally for hundreds of years in the Kelkit Valley, which is rich in both climate and plant diversity. For this reason, the study area is very rich in hawthorn genetic resources.
The Crataegus gene pool is threatened by genetic erosion, and the native plants of this genus have rapidly disappeared during the last decades [29,35]. To determine the variation in hawthorns, systematic collection and evaluation of plant materials are necessary [36]. Therefore, this study aims to evaluate the genetic diversity among hawthorn genotypes of the Cratageus monogyna Jacq. species in the Kelkit Valley, which show significant variation in morphological characteristics such as fruit and leaf characteristics. By employing ISSR molecular markers alongside phytochemical profiling and a detailed examination of leaf and fruit characteristics, this research seeks to provide a comprehensive understanding of the genetic variation present within these genotypes.
2. Materials and Methods
2.1. Plant Material
In the study, the plant material consisted of 21 distinct hawthorn (Crataegus mo-nogyna Jacq.) genotypes that differed from one another in terms of characteristics such as fruit yield status, fruit size, flesh and seed status, fruit peel color, and the distance between genotypes. Different parts of the Kelkit Valley in Türkiye were selected to collect the genotypes, which are listed in Table 1. The genus Crataegus has a well-deserved reputation for taxonomic complexity. Extensive hybridization and introgression between closely related species have resulted in the formation of hybrid, polyploid, and agamic complexes [1,37]. This is particularly relevant when closely related species grow in the vicinity of each other, e.g., Crataegus monogyna Jacq. hybridizes easily with Crataegus laevigata [38]. For this reason, genotypes were selected from areas where we thought there was no hybridization occurring. The narrowness of these areas in the region caused the number of genotypes to be low. There are studies in the literature with similar genotype numbers [2,5].

Table 1.
Information regarding the coordinates and altitude of hawthorn genotypes.
2.2. Fruit and Leaf Characterization
In the study, fruit and leaf analyses were performed for each of the naturally growing hawthorn genotypes in three replications. In each replication, the necessary measurements were performed on 20 randomly selected fruits and leaves. Fruit samples were collected at the maturity stage in late September and early October. Fruit and seed weights were measured with a digital scale with a sensitivity of 0.01 g. Dimensional measurements of fruit and leaves were measured with a digital caliper with a sensitivity of 0.01 mm. The number of seeds was expressed by numerically determining the seeds coming out of each fruit. The color of the fruit rind was ascertained using a Minolta CR-300 chromometer (Konica Minolta, Tokyo, Japan) in two opposing orientations along the central axis of the fruit, in accordance with the C.I.E. L*a*b method. The CIE Lab color space is based on color difference formulas. This method provides a lot of information in evaluating color differences [39]. The CIE Lab method provides simpler, more reliable, and closer-to-reality color tones compared to other color methods [40,41]. For this reason, the CIE Lab method was preferred in the study.
2.3. Biochemical Analysis
Biochemical measurements were performed on a repetitive basis for each genotype. After the fruits were washed with water and dried, the seeds of the fruits were removed. The fruits separated from their seeds were taken to a food processor and turned into a homogeneous puree. The pureed fruits were stored at −20 °C until biochemical analyses were performed. After the samples were thawed at room conditions for analysis, they were centrifuged at 12,000× g for 35 min at 4 °C. The filtrate obtained was used to determine the total phenolic content, total flavonoid content, antioxidant activity (DPPH), and anthocyanin content of the samples. UV-Vis spectrophotometer (Shimadzu, Kyoto, Japan) was used to determine the biochemical compounds.
Total phenolic content: The Folin–Ciocalteu method, as described by Slinkard and Singleton [42], was employed to determine the total phenolic content. In this procedure, 1 g of fruit sample was mixed with 80% methanol and agitated at 200 rpm for 2 h at ambient temperature. Subsequently, the mixture was filtered. Subsequently, 100 μL of the sample extract was combined with 400 μL of dH2O and 1 mL of Folin–Ciocalteu reagent (diluted 1:10 with water). After 8 min, 2 mL of a 5% sodium carbonate (Na2CO3) dilution was put into the solution, which was then incubated in the dark at room temperature for 90 min. Using a spectrophotometer, the blue solution absorbance that resulted was measured at 765 nm. The results were calculated as mg gallic acid equivalents (GAE) per 100 g of fresh weight.
Total flavonoid content: The method employed by Elikara et al. [43] was utilized to ascertain the total flavonoid content. Briefly, 1 g of homogenized fruit sample was combined with 80% methanol and agitated at 200 rpm for 1 h at ambient temperature. Following the filtration process, 1 mL of the sample extract was combined with 4 mL of dH2O and 0.3 mL of a 5% sodium nitrite (NaNO2) solution, and the mixture was Vortexed. After a 5 min incubation, 0.6 mL of a 10% aluminum chloride (AlCl3) solution was introduced. Additionally, 2 mL of 1 M sodium hydroxide (NaOH) was incorporated after an additional 5 min. Distilled water was employed to modify the final volume to 10 mL. Following the combining process, the absorbance was measured at 510 nm, and the flavonoid content was determined as mg catechin equivalents (CAE) per 100 g fresh weight.
Total anthocyanin content: Giusti et al. [44] employed the pH differential method to analyze total anthocyanins. At two pH levels (1.0 and 4.5), monomeric anthocyanins were evaluated by measuring their absorbance at 520 and 700 nm. A 5 g fruit sample was homogenized with 10 mL of methanol containing 1% HCl and left overnight. A total of 1 mL of the filtrate was combined with 4 mL of 0.025 M potassium chloride buffer (pH 1.0), and another 1 mL of the filtrate was combined with 4 mL of 0.4 M sodium acetate buffer (pH 4.5). Subsequently, the mixture was filtered. The absorbances were recorded at 520 and 700 nm, and the total anthocyanin content was given as mg cyanidin-3-glycoside per 100 g of fresh weight.
Antioxidant Activity: According to Brand-Williams et al. [45], antioxidant activity was assessed through a modified DPPH procedure. The sample was filtered after being mixed with 80% methanol and centrifuged at 200× g rpm for 1 h at ambient temperature. Subsequently, 3900 μL of a 0.2 mM DPPH solution was combined with 100 μL of the fruit extract, vortexed, and incubated in the dark at room temperature for 30 min. The antioxidant activity was reported as a percentage inhibition based on the control values, and the absorbance was measured at 517 nm.
Phenolic Profile
This study identified several bioactive compounds, including 4-aminobenzoic acid, catechin, epicatechin, 4-hydroxybenzoic acid, protocatechuic acid, rutin, chlorogenic acid, p-coumaric acid, caffeic acid, and ferulic acid. Following the method outlined by Ozturk et al. [46], ultra-high performance liquid chromatography (UHPLC, Thermo-Scientific, Ultimate-3000, Norwalk, CT, USA) with a DAD detector (DAD 3000, Norwalk, CT, USA) was employed for chromatographic separation in this research. Randomly selected fruits were crushed with a blender, then homogenized, and 5 g of fruit sample was placed in tubes. Fruit samples were taken into tubes, and after dilution with distilled water (1:1 ratio) and centrifugation at 15,000× g for 20 min, the resulting liquid was filtered through a 0.45 µm millipore filter and injected using ultra-high performance liquid chromatography (UHPLC Perkin-Elmer Series 200; Perkin-Elmer, Norwalk, CT, USA). Separation was achieved using a 250 × 3.0 μm, 5 m Hypersil GD column (manufactured in the USA by Thermo Scientific) at a column temperature of 30 °C. The elution solvents consisted of solvent A (aqueous 2.5% formic acid) and solvent B (100% methanol), and detection was performed at 274 nm. The total runtime was 60 min with an injection volume of 20 µL and a mobile phase flow rate of 1.0 mL min−1. Results were reported in mg kg−1.
2.4. Molecular Analysis
The CTAB method was employed to extract DNA from immature leaves of hawthorn genotypes [47]. The DNA concentrations of genotypes were determined using a spectrophotometer (BioTek Instruments, Inc., Winooski, VT, USA), and the DNAs were stored at −20 °C. In total, 20 different ISSR primers were screened for polymorphism using eight randomly picked hawthorn genotypes. Consequently, only 7 of the most polymorphic primers with clear and visible banding patterns were chosen for the genetic diversity assessment of all genotypes. The PCR mixture consisted of 1.5 µL of DNA (25 ng), 2 µL of 10 × PCR Buffer, 1.5 µL of 10 mM ISSR primer, 1.7 µL of MgCl2 (25 mM), 1.3 µL of dNTP (2.5 mM), 0.3 µL of Taq DNA polymerase (5 u/µL), and 6.7 μL of dH2O. The ultimate volume of PCR products was 15 μL. The PCR cycle parameters were executed in accordance with the procedure established in [48]. The initial denaturation was conducted for 3 min at 94 °C, followed by 39 cycles of 1 min at 94 °C, 1 min at primer annealing temperature, and 1.5 min at 72 °C. The final cycle was 8 min of extension at 72 °C.
2.5. Data Analysis
Fruit and leaf samples used for morphological characterization and phytochemical analysis were examined using XLSTAT software version 2022.3.1 (Addinsoft, New York, NY, USA). The least significant difference (LSD) test was conducted at a significance level of 5% after the analysis of variance (ANOVA) was conducted to determine the differences among means. Principal component analysis (PCA) and correlation analysis of biochemical and morphological data were conducted using the XLSTAT program, whereas heatmap analysis was executed with the R 4.4.0 program. In ISSR studies, pictures acquired post-agarose gel electrophoresis and imaging (KODAK) were assigned a score of 0 for lack of a band, 1 for existence of a band, and 9 for no amplification. The acquired data were analyzed using R 4.4.0 software for polymorphic information content (PIC), effective number of alleles (Ne) (I), Shannon’s information index, and resolving power (Rp). A similarity matrix was generated using the Jaccard method in the R 4.4.0 programming language using “vegan” package. Dendrogram was constructed using UPGMA (unweighted pair group method with arithmetic mean) based on Jaccard matrix for ISSR analysis after 1000 replicate bootstrap analysis (“boot” package in the R 4.4.0). Furthermore, comparative dendrograms of hawthorn genotypes, derived from genetic data as well as morphological and biochemical traits, were examined via tanglegram analysis utilizing the R 4.4.0 programming language and “dendextend” package. In the tanglegram analysis, the dendrogram of genetic data was constructed using the Jaccard method, while the dendrogram of morphological and biochemical data was constructed using the Euclidean method.
3. Results and Discussion
3.1. Fruit, Leaf Characterization, and Biochemical Analysis
With the exception of the seed number, the genotypes exhibited considerable variation in the morphological characteristics analyzed in the research, and these findings were statistically significant (Table 2). When genotypes were examined in terms of fruit traits, the M12 genotype had the highest fruit weight value at 2.87 g, the highest fruit width value at 18.39 mm, the highest fruit length value at 16.36 mm, and the highest stone weight value at 0.51 g. The M6 genotype had the lowest fruit weight value at 0.55 g, the lowest fruit width value at 9.74 mm, the lowest fruit length value at 10.47 mm, and the lowest stone weight value at 0.11 g. The seed number of the genotypes was generally determined as 1.
Table 2.
Descriptive statistics for fruit traits of the examined hawthorn genotypes.
Previous studies on the Crataegus monogyna Jacq. species show that fruit width values range from 0.65 to 1.38 g [49], range from 0.70 to 2.04 g [50], range from 0.26 to 0.89 g [51], range from 0.29 to 1.04 g [23], and range from 0.18 to 1.15 g [52]. Previously, the fruit length and fruit width of Crataegus monogyna Jacq. hawthorn genotypes were reported with a range from 8.00 to 15.25 and 6.56 to 15.32 mm, respectively [23,49,50,51]. In comparison to the study’s findings, it may be concluded that hawthorn genotypes cultivated naturally in the Kelkit Valley produce similar fruit characteristics. While most findings of the present study are in agreement with those of other researchers, some findings are in discord. This is attributed to the variability of accessions used in the studies as well as different environmental factors. A greater fruit weight is the most desirable fruit characteristic in hawthorn breeding programs [53]. However, it has been demonstrated that morphological characteristics, especially traits related to fruit, are affected by genetic factors, climatic factors, and soil structure [54].
During the examination of leaf characteristics, the genotype M19 had the broadest leaf width value, which was 41.19 mm. The genotype M7 had the lowest value, which was 19.53 mm. The genotype M15 had the greatest leaf length value, which was 47.85 mm, while the genotype M7 had the shortest value, which was 26.10 mm. Regarding the leaf petiole values, genotype M19 had the largest value, 23.53 mm, while genotype M1 had the smallest value, 9.53 mm. Genotype M11 had the thickest leaf petiole value, which was 0.86 mm, while genotype M1 had the thinnest value, which was 0.33 mm. Leaf traits are used as factors to differentiate genotypes, with variations in outcomes potentially arising from the plant material employed [55]. Previously, LW, LL, and PL Crataegus monogyna Jacq. hawthorn genotypes were reported with a range from 17.44 to 70.41 mm, 19.77 to 75.91 mm, and 9.10 to 39.60 mm, respectively [36,50]. Similar to our work, the literature indicates variations in leaf metrics across hawthorn genotypes [56]. Overall, our results regarding morphological attributes exhibited similarities with the existing literature, with some minor discrepancies. This may be attributed to the disparate genetic material used.
There was a range of L* values from 24.25 (M6, M21) to 27.93 (M12), which indicated that M6 and M21 seemed to have the darkest color, while M12 appeared to have the lightest color. According to the a* parameter, which ranged from 78.20 (M19) to 114.73 (M11), M19 displayed the least amount of redness, while M11 had the most prominent amount of redness (Table 3). The appeal of color is a critical qualitative element of processed food, significantly influencing customer acceptance and preference. Gurlen et al. [23] indicated that the L* value ranged from 23.98 to 36.08, the a* value ranged from 27.78 to 41.94, and the b* value ranged from 7.06 to 23.09. In several research studies, fruit color was mostly assessed visually. Similarly, Yalçın Dokumacı et al. [57] reported ranges between 29.27 for mean L, 27.76 for mean a, and 8.19 for mean b in hawthorn genotypes. In several research, fruit color is mostly assessed visually. Yanar et al. [49] indicated that the hawthorn in the Malatya area exhibited colors including light green, green, yellow, light orange, orange, dark red, and red, whereas Bektaş et al. [58] identified the hawthorn colors in the Malatya region as orange, red, and yellow.
Table 3.
Fruit colorimetric and biochemical properties of the examined hawthorn genotypes.
Plants provide important information about potential therapeutic benefits in both traditional medicine and modern pharmacology. Crataegus monogyna Jacq. are particularly renowned for their antidiabetic, antifungal, antibacterial, and antioxidant benefits [59]. Plant extracts containing phenolic compounds with antioxidant properties have demonstrated their effectiveness in reducing diabetes-related complications [60,61]. Thus, it may be advantageous to consume natural antioxidants or use dietary supplements to benefit from their effects [59]. Phytochemicals are essential for human health. Research has been conducted on several fruit species, particularly focusing on antioxidants, phenolics, anthocyanins, and flavonoids, which are essential phytochemicals. Significant differences were seen across genotypes across all variables analyzed in this research. In terms of biochemical attributes, the total phenolic content varied in a broad range, ranging from 151.34 mg (M10) to 491.88 mg (M7). This indicates that M7 was a genotype that stood out, especially in terms of phenolic accumulation. Based on the findings, it can be concluded that genotypes M7 and M12 may provide especially significant flavonoid advantages. The lowest value of total flavonoid content was reported to be 16.74 mg (M10), while the maximum value was 48.13 mg (M7 and M21). It was determined that the antioxidant activity of M7 was possibly better in terms of its power to scavenge free radicals, as the lowest value recorded for antioxidant activity was 29.20% (M10) and the highest value was 56.70% (M7). Finally, the overall anthocyanin content ranged from 26.34 mg (M16) to 79.79 mg (M18), indicating that the M18 genotype had the highest anthocyanin content of all the genes tested.
Yildiz et al. [2] indicated that the antioxidant activity of hawthorn across twenty-two genotypes ranged from 23.13% to 61.59%, the total phenolic content was between 277.28 mg GAE 100 g−1 flesh and 310.80 mg GAE 100 g−1 flesh, and the total flavonoid content varied between 14.63 mg GAE 100 g−1 flesh and 57.22 mg GAE 100 g−1 flesh. In a separate investigation, Güzel [62] documented total phenolic content ranging from 155.2 to 490.3 mg GAE 100 g−1 flesh and total flavonoid content ranging from 78.7 to 272.6 mg CE 100 g−1 flesh in hawthorn genotypes. Okatan et al. [63] established that the concentration of phenolic compounds ranged from 960 to 3626 μg GAE g–1 flesh, while antioxidant activity levels varied between 59.24% and 19.24% across twenty distinct genotypes of hawthorn fruits. Calişkan et al. [64] established that the antioxidant activity values of hawthorn genotypes ranged from 21.4% to 33.2%. According to research that was conducted by Alirezalu et al. [5], various hawthorn genotypes were found to have phenolic content that varied from 69.12 to 21.19 mg GAE g−1 flesh. Salmanian et al. [65] reported that the total anthocyanin value in hawthorn fruit was found to be 1.94 mg CE g−1 flesh. As a whole, the findings that were acquired from the study are comparable to those that have been found in previous research. The discrepancies may be because the genetic material that was utilized in the research was different from what was used in the study, as well as the procedures that were employed. The flavonoid content, phenolic compound concentrations, and fruit pigments such as anthocyanin and carotenoid contents in hawthorn fruits are influenced by the high temperature and the level of CO2 [5,66].
3.2. Individual Phenolic Compounds
The development of new products derived from medicinal plants, harnessing both their active ingredients and secondary metabolites, represents a burgeoning scientific field in recent years [67]. This surge in interest stems from the potential of these herbal-based products to address limitations associated with conventional medicine, offering new avenues for treating human diseases such as cancer [68]. Within the scope of the study, aminobenzoic acid, catechin, p-Hydroxybenzoic acid, protocatechuic acid, caffeic acid, chlorogenic acid, epicatechin, p-Coumaric acid, ferulic acid, and rutin were determined as individual phenolic contents in the hawthorn species C. monogyna. This is an expected range of identified phenolic compounds in this plant extract and in line with the results of similar studies in this field [69].
The levels of aminobenzoic acid were found to vary from a minimum of 10.46 mg (M10) to a high of 38.56 mg 100 g−1 (M16), as shown by the findings of the research. It was found that the protocatechuic acid levels in M9 were the lowest, coming in at 0.14 mg, while the value in M7 was found to be the highest, coming in at 2.00 mg 100 g−1. The value of p-hydroxybenzoic acid increased from 0.01 mg in M12 and M14 to 0.60 mg 100 g−1 in M9 during the course of the study. It was possible to find levels of catechin that were as low as 5.12 mg (M10) and as high as 29.53 mg 100 g−1 (M17). It was observed that the M21 genotype had the lowest chlorogenic acid value, which was 1.02 mg, and that the M7 genotype also had the highest chlorogenic acid value, which was 16.16 mg 100 g−1. There was a range of 1.06 mg (M10) to 10.21 mg 100 g−1 (M7) in terms of the amount of caffeic acid present. The levels of epicatechin varied from 13.83 mg (M7) to 2.06 mg 100 g−1 (M11). It was found that the levels of p-Coumaric acid varied from 0.24 mg (M10) to 7.43 mg 100 g−1 (M3). The quantity of ferulic acid that was found to be present in M10 was found to be the lowest (0.29 mg 100 g−1), while the amount that was found to be present in M1 was 4.06 mg. There was a wide range of rutin readings, with the lowest being 1.57 mg (M18) and the highest being 74.05 mg 100 g−1 (M7) (Table 4, Supplementary Figure S1).
Table 4.
Contents of individual phenolic compounds in fruit of the examined hawthorn genotypes.
Özturk and Tunçel [70] conducted phenolic acid analysis using methanol extract (ME), ethyl acetate extract (EA), and water extract (W) techniques from the leaves, fruit peel, and seeds of Crataegus monogyna Jacq. by HPLC. The ethyl acetate extract (EA) derived from leaves had the greatest phenolic acid concentrations. The researchers reported the chlorogenic acid concentration as 4.637 mg 100 g−1, ferulic acid concentration as 3.462 mg 100 g−1, caffeic acid concentration as 206.3 mg 100 g−1, p-Hydroxybenzoic acid concentration as 141 mg 100 g−1, and protocatechuic acid concentration as 128 mg 100 g−1. Alirezalu et al. [5] documented the chlorogenic acid concentration as 0.40 mg g DW−1 in the Crataegus monogyna Jacq. species within their comparative research of phenolic compounds in the fruits of several hawthorn species (Crataegus spp.). Furthermore, the researchers indicated that Crataegus pseudomelanocarpa had the greatest concentrations of chlorogenic acid and rutin, at 1.16 mg g DW−1 and 2.68 mg g DW−1, respectively. Liu et al. [4] compared phenolic compounds in the fruits of Chine hawthorn species (Crataegus spp.) and reported the highest chlorogenic acid value as 1.57 mg g DM−1 in Crataegus pinnatifida var. major and the highest epicatechin value as 11.72 mg g DM−1 in Crataegus pinnatifida var. major. According to the findings of the current research, the primary agent responsible for the antioxidant activity of hawthorn fruits is the presence of total and individual phenolic compounds. This activity may also be affected by the different species of fruits. In addition, the content of phenolic compounds in plants is influenced by several environmental conditions [71]. An increase in flavonoid content and concentrations of phenolic compounds was observed to occur in this setting [72]. This was because higher growth temperatures and levels of CO2 were present. In addition, the conditions of the soil affect the phenolic content of plants. There was a decrease in the synthesis of some phenolic compounds as a result of soil fertilization, which included a high level of nitrogen, as well as an increase in the soil moisture deficit [73]. The production of phenolic chemicals, such as flavonoids, flavones, and anthocyanins, as well as the enzyme PAL (phenylalanine ammonialyase), is significantly accelerated by exposure to light. Changes in growing circumstances [74], genetic background [5], and methodological variances [70] may be the primary factors that contribute to the diversity in the reported flavonoid concentrations and phenolic component contents within a single species.
These findings, taken as a whole, brought to light a substantial amount of genotypic variability both in terms of colorimetric and biochemical characteristics, therefore providing useful information that may be used for future breeding and conservation measures.
3.3. Correlation of Principal Component and Heatmap Analysis
The correlation between FWe and FWi, FL, SW, and SN was determined to be significantly favorable. There was a significant positive correlation between the fruit width and the fruit length, the stone weight, and the stone number. The fruit length had a strong and significant correlation with the stone weight. There was a significant correlation between the stone weight and the stone number. There was a significant correlation between the stone number and the fruit length. There was a positive correlation between L* and the fruit weight, the fruit width, the stone weight, and the stone number. The level of correlation between leaf width and leaf length was found to be significantly positive, as well as with petiole length. The leaf length was shown to have a positive correlation with the petiole length and the petiole thickness. According to the results of the study, there was a positive correlation between petiole thickness and leaf width, b*, and a* (Supplementary Figure S2).
This study utilized a Pearson correlation matrix for the biochemical components of hawthorn genotypes, focusing on phenolic compounds, flavonoids, antioxidants, anthocyanins, and related secondary metabolites. The correlation between total phenolics and total flavonoids, between total phenolics and total antioxidants, and between total phenolics and total anthocyanins was determined to be significantly favorable. There was a significant positive correlation between the total flavonoids and the total antioxidants and between the total flavonoids and the total anthocyanins. The total antioxidants had a significant correlation with the total anthocyanins. There was a significant correlation between catechin and chlorogenic acid, caffeic acid, epicatechin, ferulic acid, and rutin. There was a significant correlation between protocatechuic acid and chlorogenic acid and between protocatechuic acid and rutin. There was a positive correlation between chlorogenic acid and caffeic acid, epicatechin, and rutin. Caffeic acid was shown to have a positive correlation with epicatechin, ferulic acid, and rutin. The level of correlation between epicatechin and ferulic acid was found to be significantly positive, as well as with rutin (Supplementary Figure S3).
Previous studies have reported similar findings to our results. Özcan et al. [75] reported that there was a significant positive correlation between fruit diameter and fruit length and between fruit diameter and fruit weight in the morphological variances observed in fruits collected from wild hawthorn (Crataegus spp.). Yalçın Dokumacı et al. [57] indicated a substantial positive link between fruit diameter and fruit length, as well as between fruit diameter and fruit weight. A positive correlation between rutin and chlorogenic acid was reported by Liu et al. [76]. Cui et al. [77] conducted a correlation analysis of the levels of nine compounds across thirty-seven cultivars, revealing a significant correlation between the total procyanidin level and the individual levels of four procyanidins, as well as between chlorogenic acid and flavonoids. Calişkan et al. [64] reported that there was a positive correlation between fruit weight and fruit width, fruit weight and fruit length, fruit width and fruit length, L* and fruit width, and L* and fruit length in hawthorn genotypes collected from the central regions of Türkiye.
PCA, one of the multivariate statistical methods, is widely used to determine the most important features in a data set and to evaluate the diversity of plant species. PCA is an effective statistical method used to determine the change in a data set and to reveal strong relationships [78]. Due to its superior feature, PCA is frequently used by many researchers in breeding and population genetics studies [2,43,79,80]. Within the scope of this study, PCA was performed on a total of 26 features related to the morphological and biochemical characteristics of hawthorn genotypes (Figure 1, Supplementary Table S1). It is known that there is a positive correlation between narrow-angle features and a negative correlation between wide-angle features in the principal component analysis graph [81]. Accordingly, the correlation analysis results coincide with the two-dimensional PCA graph results.
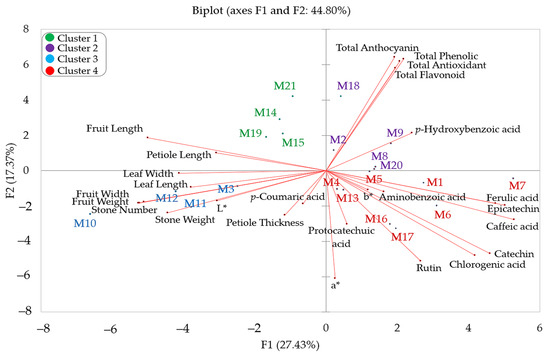
Figure 1.
PCA distribution graph of hawthorn genotypes based on biochemical and morphological traits of fruit.
The biplot graph shows the outcomes of a PCA that shows how the morphological and biochemical traits of different hawthorn genotypes are related to each other (Figure 1). It also shows how these traits affect the distribution of genotypes. The first two principal components (F1 and F2) explained 44.80% of the total variance, with F1 contributing 27.43% and F2 contributing 17.37%. Fruit weight, fruit width, fruit length, stone weight, stone number, leaf width, leaf length, petiole length, caffeic acid, ferulic acid, catechin, epicatechin, and chlorogenic acid contributed the most to F1. Total phenolic, a*, total anthocyanins, total antioxidants, total flavonoids, and rutin contributed the most to F2. M3, M10, M11, and M12 genotypes were grouped in relation to fruit weight, fruit width, stone wieght, stone number, leaf width, and leaf length variables. Similar clustering is seen in the heatmap graph (Figure 2). While M14, M15, M19, and M21 genotypes were determined to be related to fruit length and petiole length variables in the PCA graph, it was determined that they were in the same cluster in the heatmap graph. M2, M8, M9, M18, and M 20 genotypes were determined to be related to total anthocyanins, total phenolics, total flavonoids, total antioxidants, and p-Hydroxybenzoic acid, while M1, M4, M5, M6, M7, M13, M16 and M17 genotypes were determined to be related to ferulic acid, aminobenzoic acid, epicatechin, caffeic acid, chlorogenic acid, rutin, protocatechuic acid, a*, b* and catechin. Additionally, these genotypes are grouped within the same cluster in the heatmap graph (Figure 2).
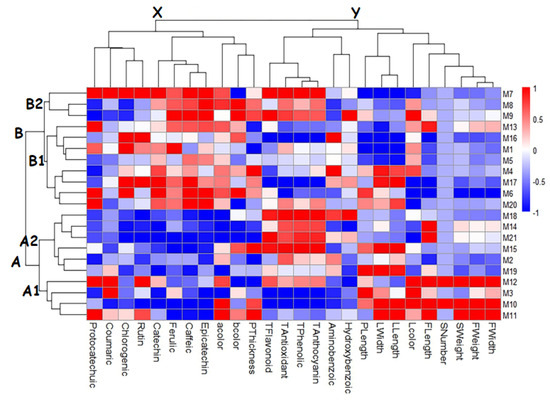
Figure 2.
Trait–genotype association heatmap for hawthorn genotypes.
Regarding the first two components, the results of our study were lower than the results found by Erfani-Moghadam et al. [28] (55.24%), Betancourt-Olvera et al. [82] (64.40%), and Alirezalu et al. [5] (58%) but similar to the results of Yildiz et al. [2] (42.1%). It can be said that the differences between the study results are due to the number of genotypes/species examined and the parameters evaluated.
Heatmap hierarchical clustering analysis is one of the most common multivariate statistical methods that allows the genotypes and the examined traits in the studies to be evaluated together. Heatmap hierarchical clustering analysis has been widely used in many fruit species such as hawthorn [83], grape [80], strawberry [43], and oleaster [79] to cluster genotypes or varieties according to their traits. Heatmap hierarchical clustering analysis was performed to classify the examined hawthorn genotypes according to their morphological and biochemical traits (Figure 2). In the heatmap hierarchical clustering analysis, the color intensity changing from blue to red indicates the height in the values of the traits of the genotypes. Accordingly, as a result of the heatmap hierarchical clustering analysis, the genotypes were divided into two main groups. Each group was divided into two subgroups within itself. The genotypes M1, M4, M5, M6, M7, M8, M9, M13, M16, M17, and M20 constituted Group B, while the other genotypes constituted Group A. The genotypes in Group B1 (M7, M8, and M9) had high values in terms of biochemical contents and individual phenolics, while the genotypes in Group B2 (M1, M4, M5, M6, M13, M16, M17, and M20) had high values in terms of individual phenolic contents. The genotypes in Group A1 (M3, M10, M11, and M12) exhibited high values in terms of fruit and leaf characteristics, while the genotypes in Group A2 (M2, M14, M15, M18, M19, and M21) exhibited high values in terms of biochemical properties.
3.4. Molecular Analysis
Each primer employed in the investigation yielded distinct and scoreable bands, as illustrated in Table 5. The seven primers employed resulted in the production of 62 bands in total. Of these, 55 bands that represented polymorphic variations were both visible and quantifiable. The primers exhibited an allelic diversity that ranged from 5 alleles ((GA)8YG) to 10 alleles (HVH(TCC)7), with an average of 7.86 alleles. The analysis of ISSR markers revealed a range of PIC values, with the lowest value of 0.34 being (GA)8YG and the highest value of 0.44 being HVH(TCC)7. The average PIC value for all markers was determined to be 0.40. The polymorphism rate demonstrated a range of variability, from 66.67% (BDB(CA)7C) to 100% (HVH(TCC)7, (AGC)6G, (GT)6GG, and (CAC)3GC). Shannon’s information index (I) demonstrated a range of values, from the lowest value of 0.51 for (GA)8YG to the highest value of 0.63 for HVH(TCC)7. The average value of I across all observations was determined to be 0.58. The average value of the effective allele number (Ne) was 1.68, with a range of 1.79 (HVH(TCC)7) to 1.53 ((GA)8YG). The average value of Rp was 2.65, with a range of 2.37 (HVH(TCC)7) to 3.22 ((GA)8YG). The informative parameters and genetic diversity obtained from the ISSR marker analysis conducted in the investigated hawthorn germplasm are comprehensively summarized in these results. When the band size ranges were examined, the primers HVH(TCC)7 and (CAC)3GC had the widest band size ranges (300–1200 bp and 200–1200 bp), representing a wide spectrum in terms of amplification of different gene regions. This showed that these primers are suitable for screening various genetic regions.
Table 5.
Polymorphism and sequence information of ISSR primers.
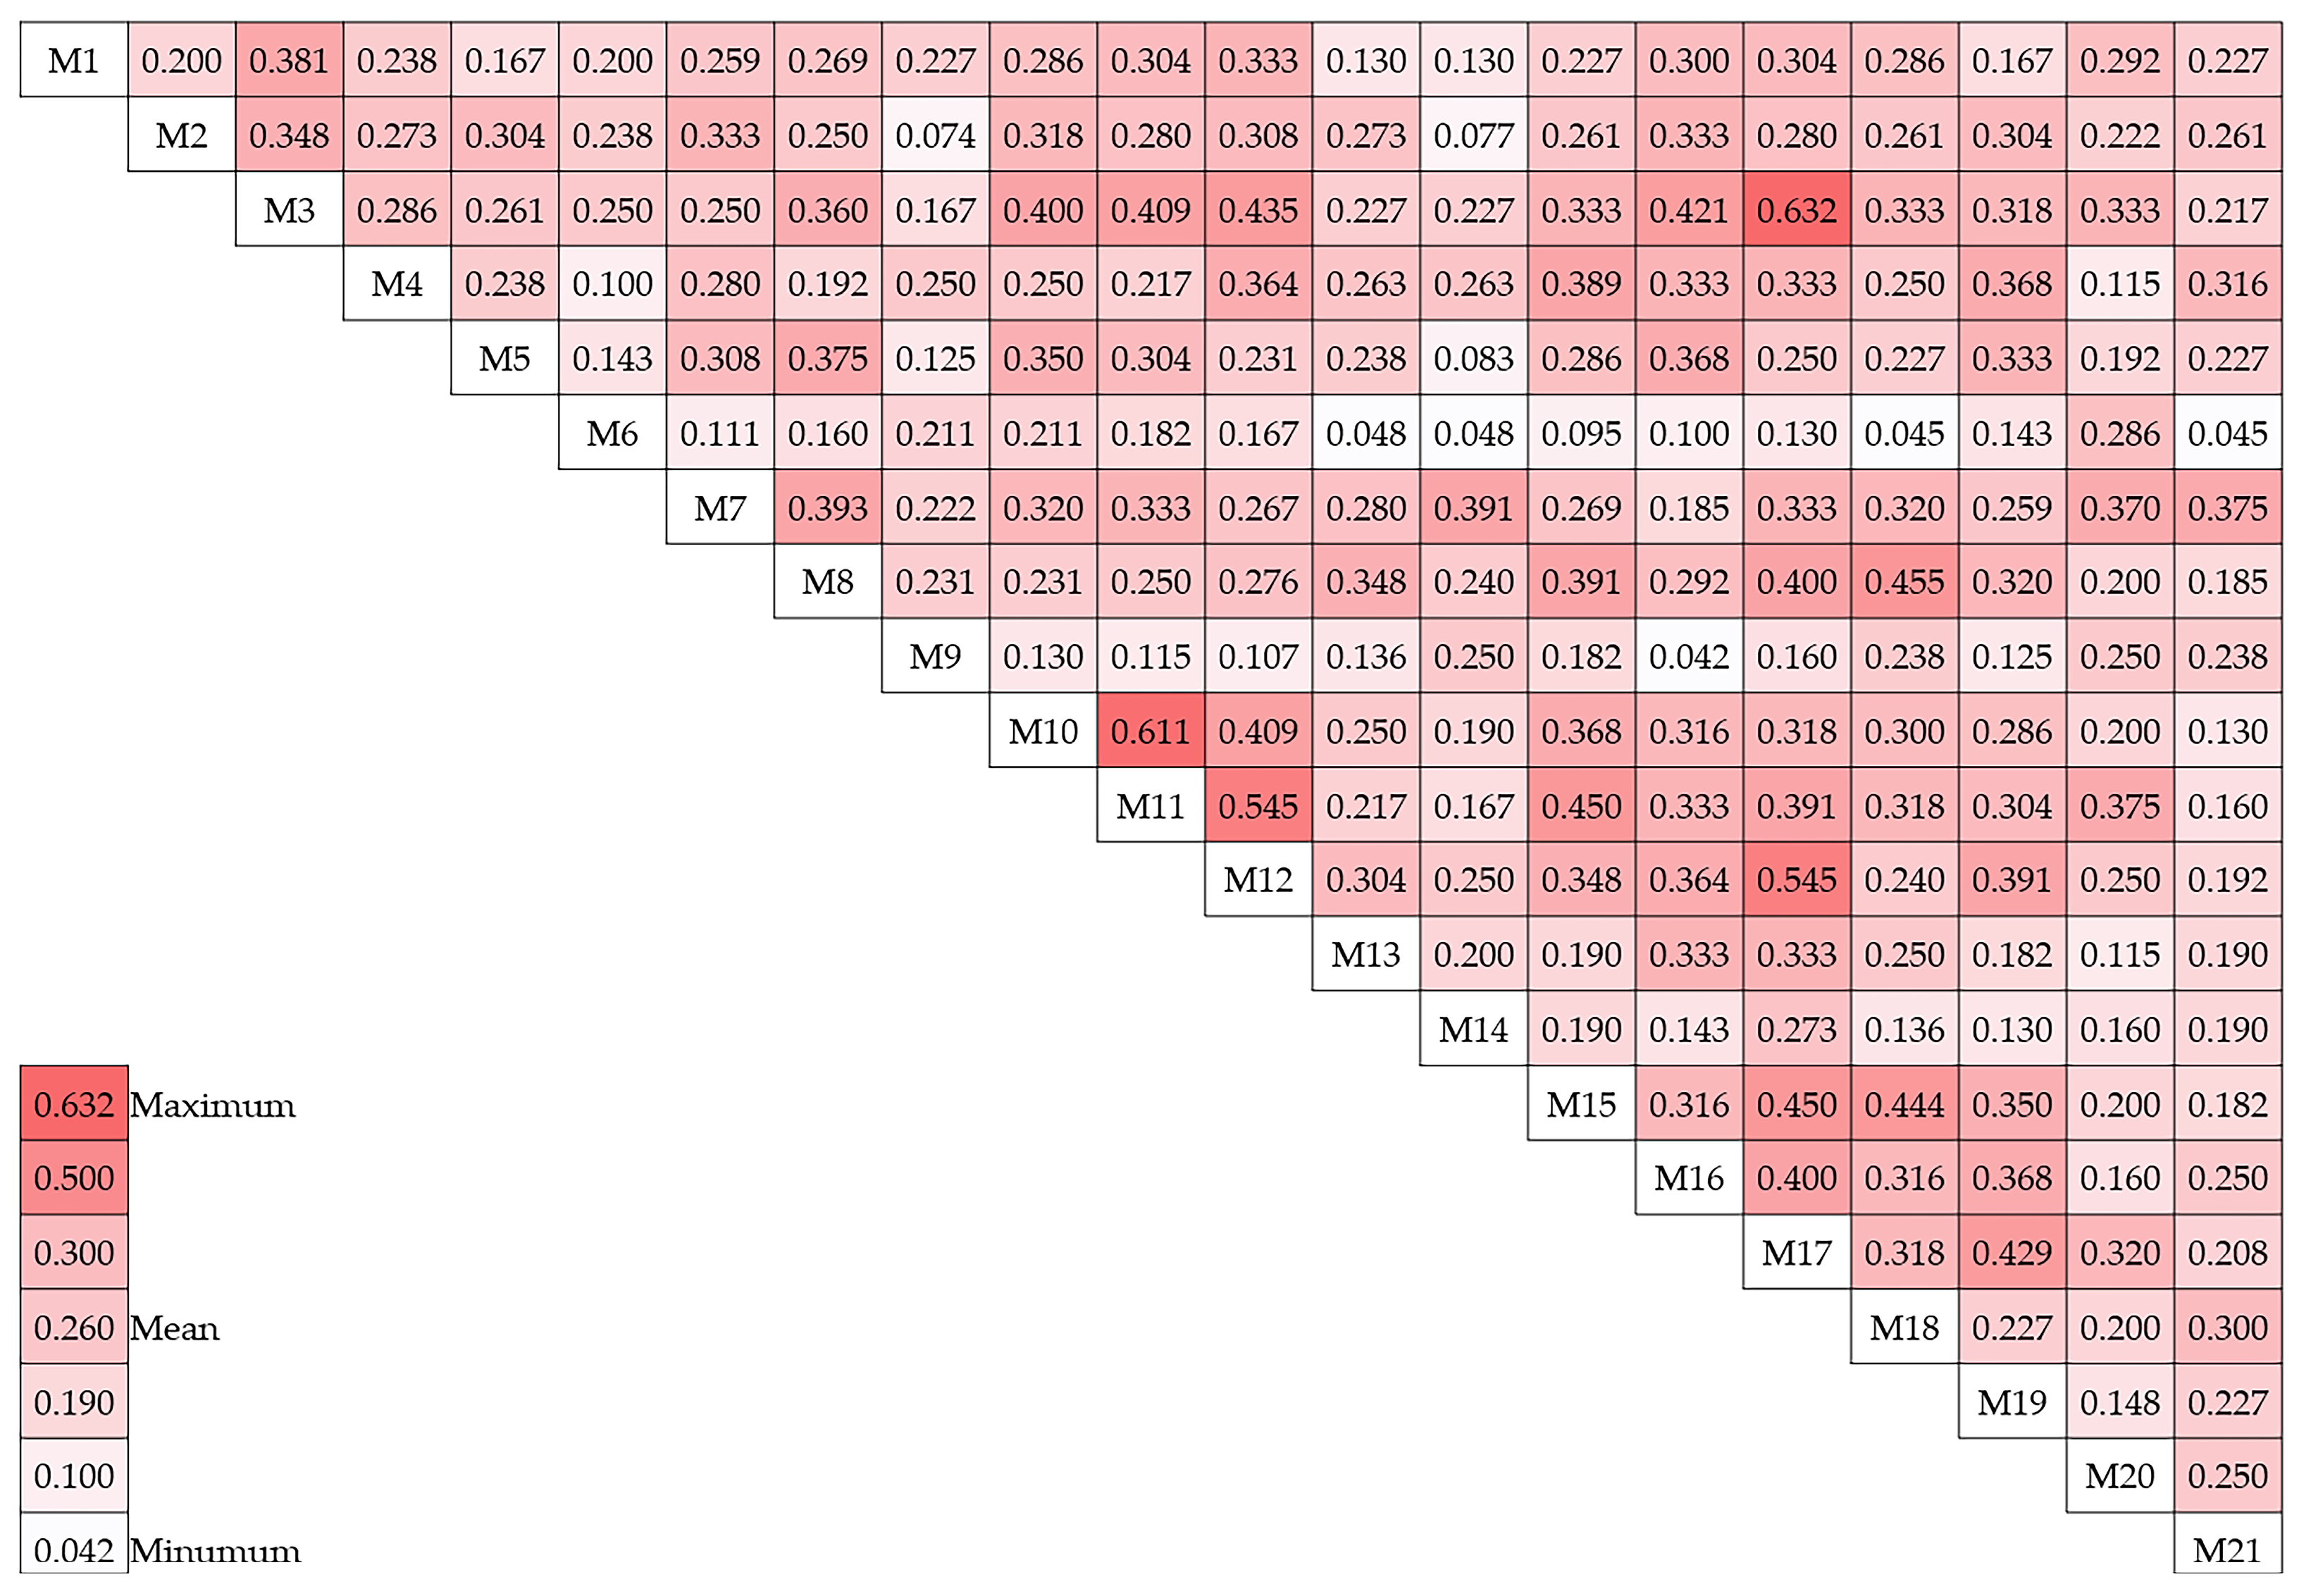
The Jaccard method was employed to evaluate the similarity among the 21 genotypes, which led to the production of similarity coefficient values for each genotype (Figure 3). The average dice similarity coefficient was determined to be 0.26. The Jaccard similarity coefficient was employed to analyze the genotypes, and it was determined that genotype M9 and genotype 16 had the lowest similarity, with a coefficient value of 0.04. Conversely, the coefficient value of 0.63 was used to determine that genotypes M17 and M3 were the most similar.
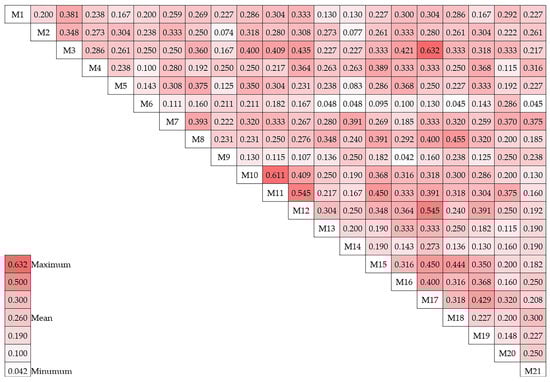
Figure 3.
Jaccard similarity matrix of 21 hawthorn genotypes.
Studies were conducted using several marker systems to ascertain the genetic connection among hawthorn species. In research using the SSR marker method, scoreable bands varied from 2 to 21 based on the primers [55]. Additionally, researchers reported PIC values ranging from 0.16 to 0.89, mean PIC values ranging from 0.60, expected heterozygosity ranging from 0.17 to 0.89, and observed heterozygosity ranging from 0.00 to 1.00 [27]. Separate research found that the average number of bands per marker in ISSR analysis of hawthorn genotypes was 8.53 [84]. In a study assessing genetic variation among five hawthorn species cultivated in Iran, 79 scoreable bands were generated using six distinct ISSR primers, yielding an average polymorphism rate of 89.9%, with 71 of these bands classified as polymorphic [85]. Serçe et al. [86] reported that in a study evaluating the genetic diversity among fifteen hawthorn genotypes in Türkiye, they generated 107 scorable bands using nineteen RAPD primers, and 76 of these bands were classified as polymorphic, resulting in an average polymorphism rate of 73%. In a study evaluating the genetic diversity among twenty-two hawthorn genotypes from the Kayseri region of Türkiye, Yildiz et al. [2] reported that they obtained 101 scorable bands using thirteen ISSR primers and 76 of these bands were classified as polymorphic, yielding an average polymorphism rate of 75.24%. One research study used 92 distinct genotypes of C. songorica, revealing that the similarity index values across the genotypes ranged from 0.53 to 0.87 in the ISSR marker analysis [30]. Gurlen et al. [23] previously reported a polymorphism rate of 95.59%, PIC values ranging from 0.12 to 0.42, and an average PIC value of 0.32 among hawthorn genotypes naturally occurring in Western Türkiye using iBPS markers. Rahmani et al. [35] established the polymorphism rates for IRAP, ISSR, and SCoT markers as 90.48%, 93.37%, and 83.78%, respectively, across hawthorn genotypes. Khiari et al. [31] used SSR primers to analyze hawthorn genotypes, reporting a polymorphism rate of 65.43%, PIC values ranging from 0.00 to 0.89, a mean PIC value of 0.54, an anticipated heterozygosity value from 0.00 to 0.66, and an observed heterozygosity value from 0.00 to 0.52. Erfani-Moghadam et al. [28] in Iran and Betancourt-Olvera et al. [82] in Mexico reported that the average value and the PIC value range were 0.72, 0.64–0.79, and 0.7, 0.5–0.86, respectively, in their separate investigations on hawthorn. The results that we obtained are in accordance with the findings of molecular studies that were carried out on hawthorn in the past, and all of the results that were described above suggest that there is a significant amount of genetic variation among hawthorn genotypes. Additionally, long-lived perennials have much higher amounts of genetic diversity within populations compared to annual plants. This is a characteristic of natural populations of outcrossing species, which are characterized by high levels of genetic diversity [87,88,89].
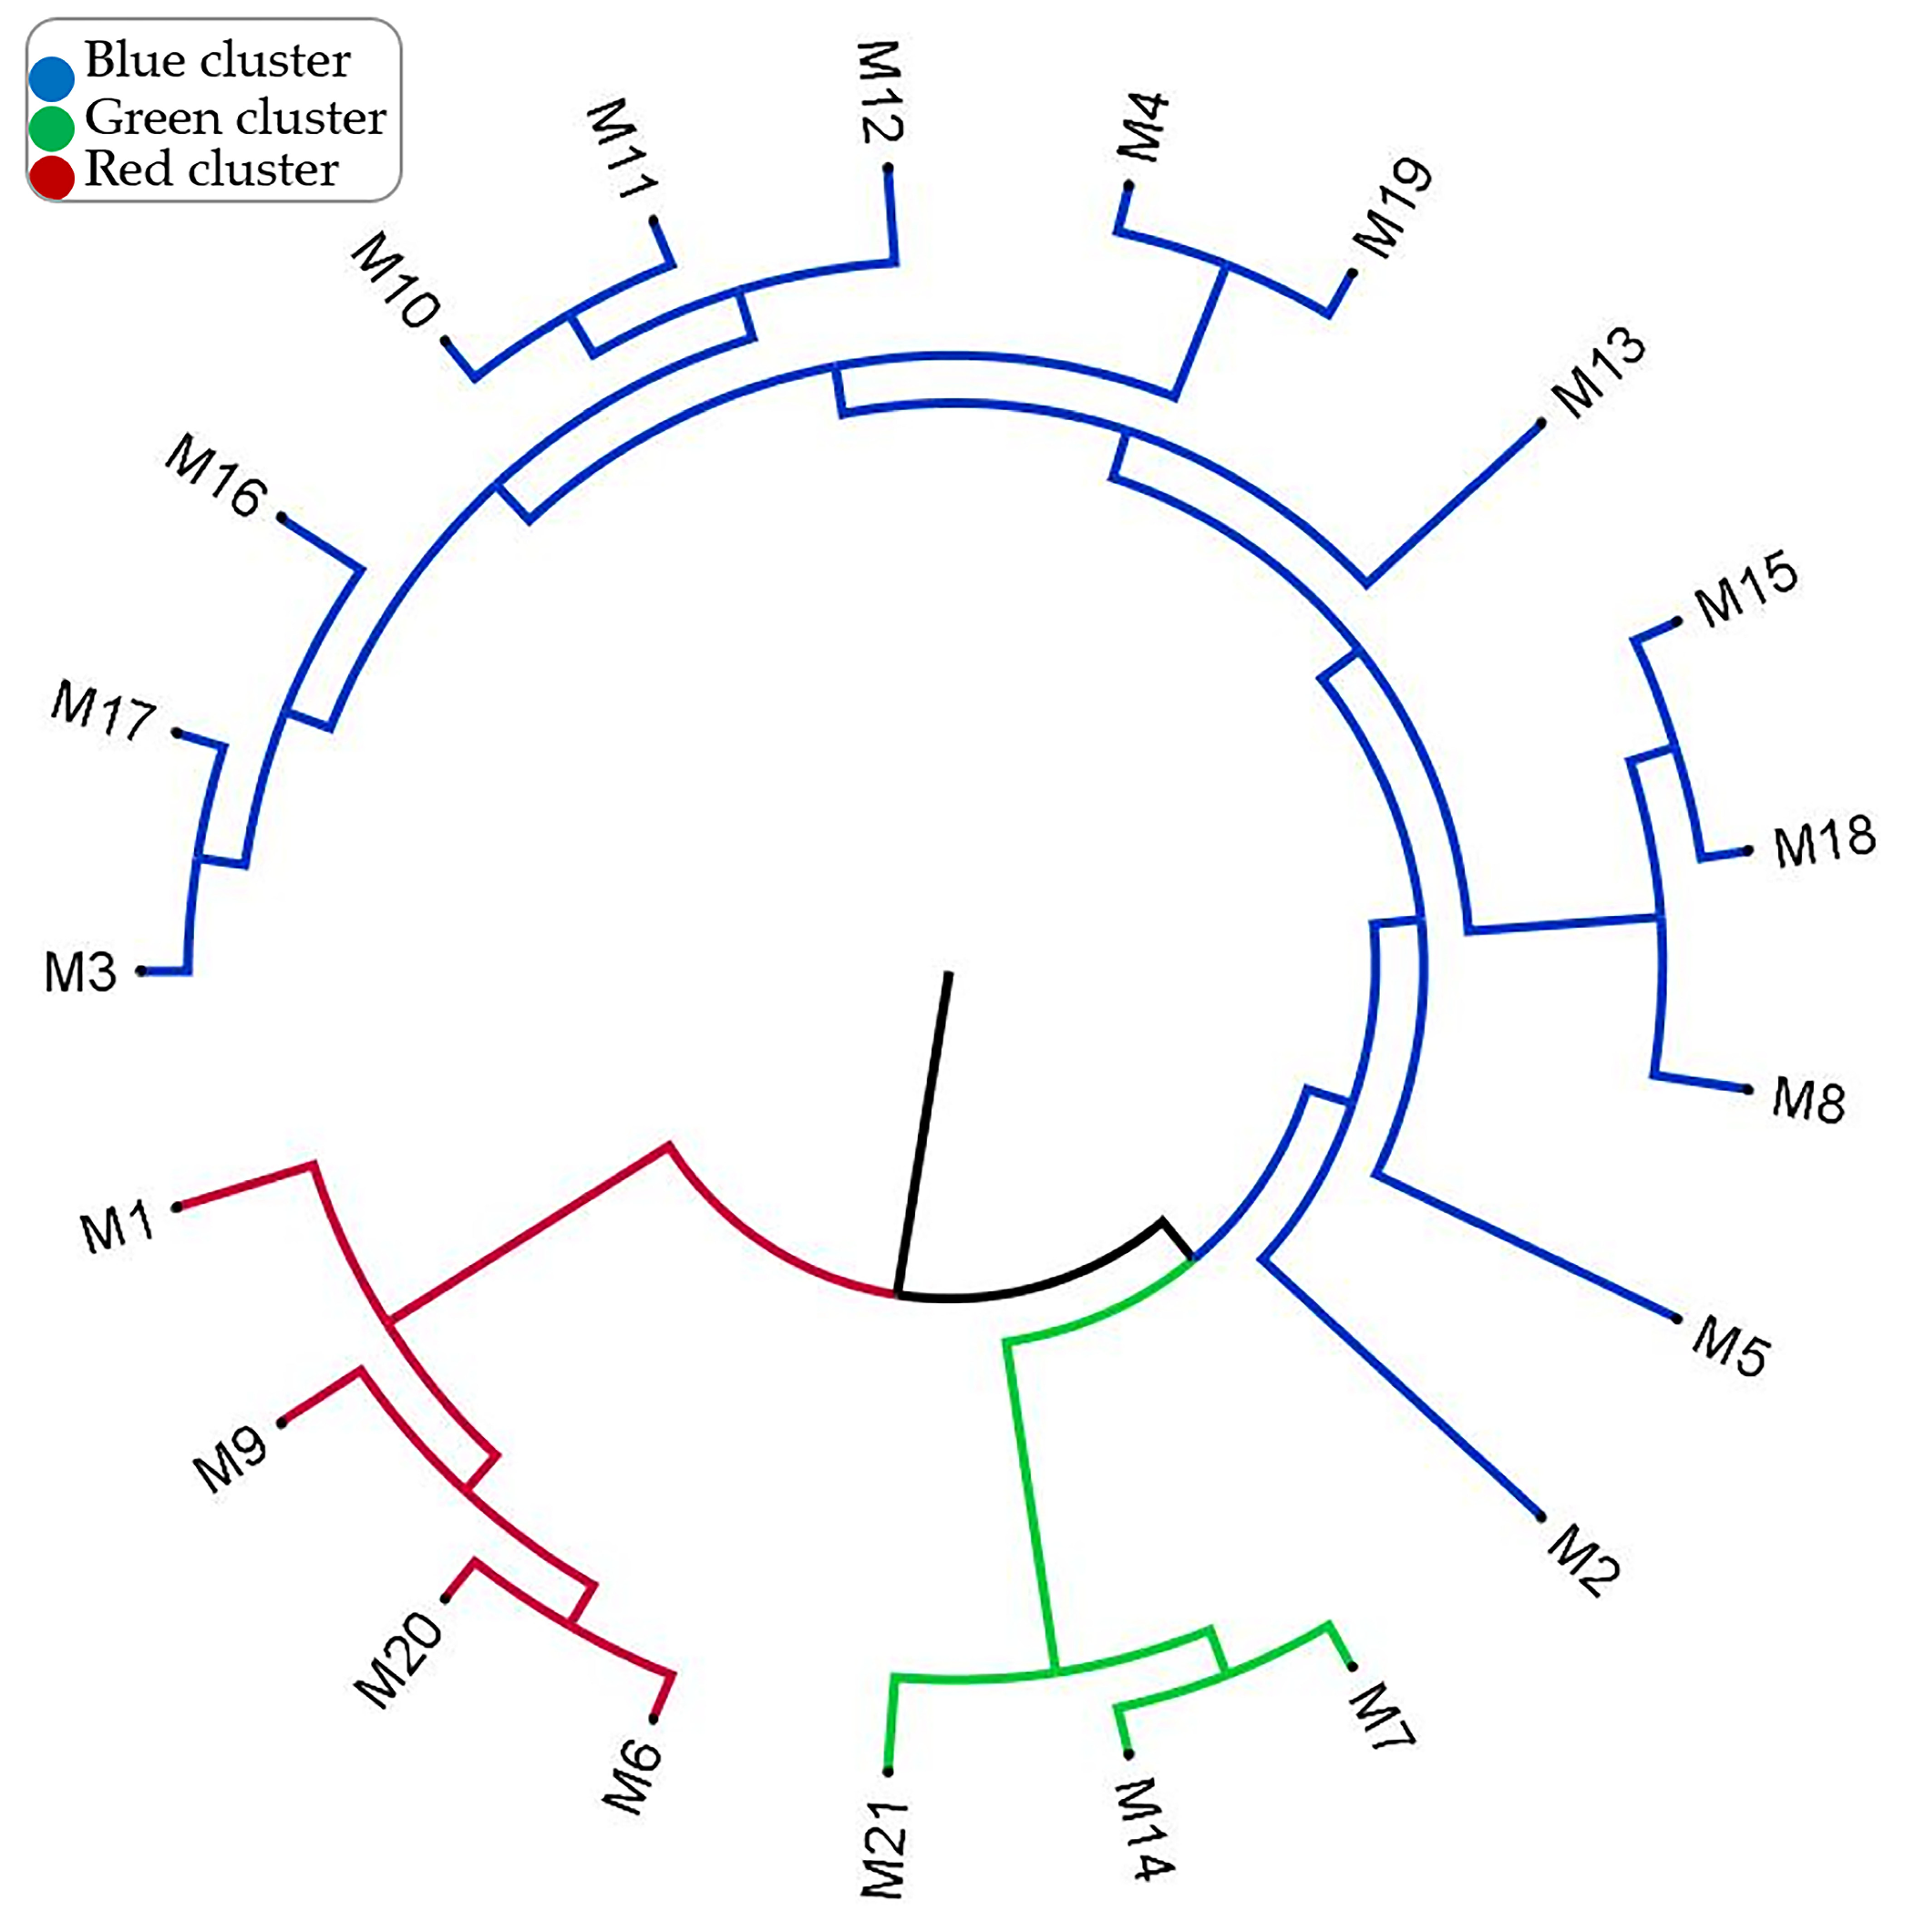
To understand the differentiation levels and diversity of genotypes, the UPGMA dendrogram is presented in Figure 4. The blue group, which includes the genotypes M2, M3, M4, M5, M8, M10, M11, M12, M13, M15, M16, M17, M18, and M19, represents genotypes that are genetically close to each other. It can be understood that there is a significant similarity between these genotypes and that they probably come from the same genetic pool. The green group includes the genotypes M7, M14, and M21, and it was determined that they have a different genetic structure compared to the other groups. The red group includes the genotypes M1, M6, M9, and M20, and it was determined that these genotypes have a different genetic profile than the other groups. The separation of the colors represents the degree of genetic distance. While the blue genotypes are more genetically close to each other, the genotypes in the blue and green groups are genetically more different than the genotypes in the red group. The green and red groups have branched off from a common ancestor with the blue group. This may be a result of genetic differentiation. According to the dendrogram result, it can be used for preserving genetic diversity, planning breeding programs, and selecting genotypes with specific agronomic traits. More similar genotypes, such as the blue group, carry the same traits, while more distant genotypes, such as the green and red groups, can be considered potential candidates to increase genetic diversity.

Figure 4.
Phylogenetic relationships among hawthorn genotypes based on morphological and molecular data.
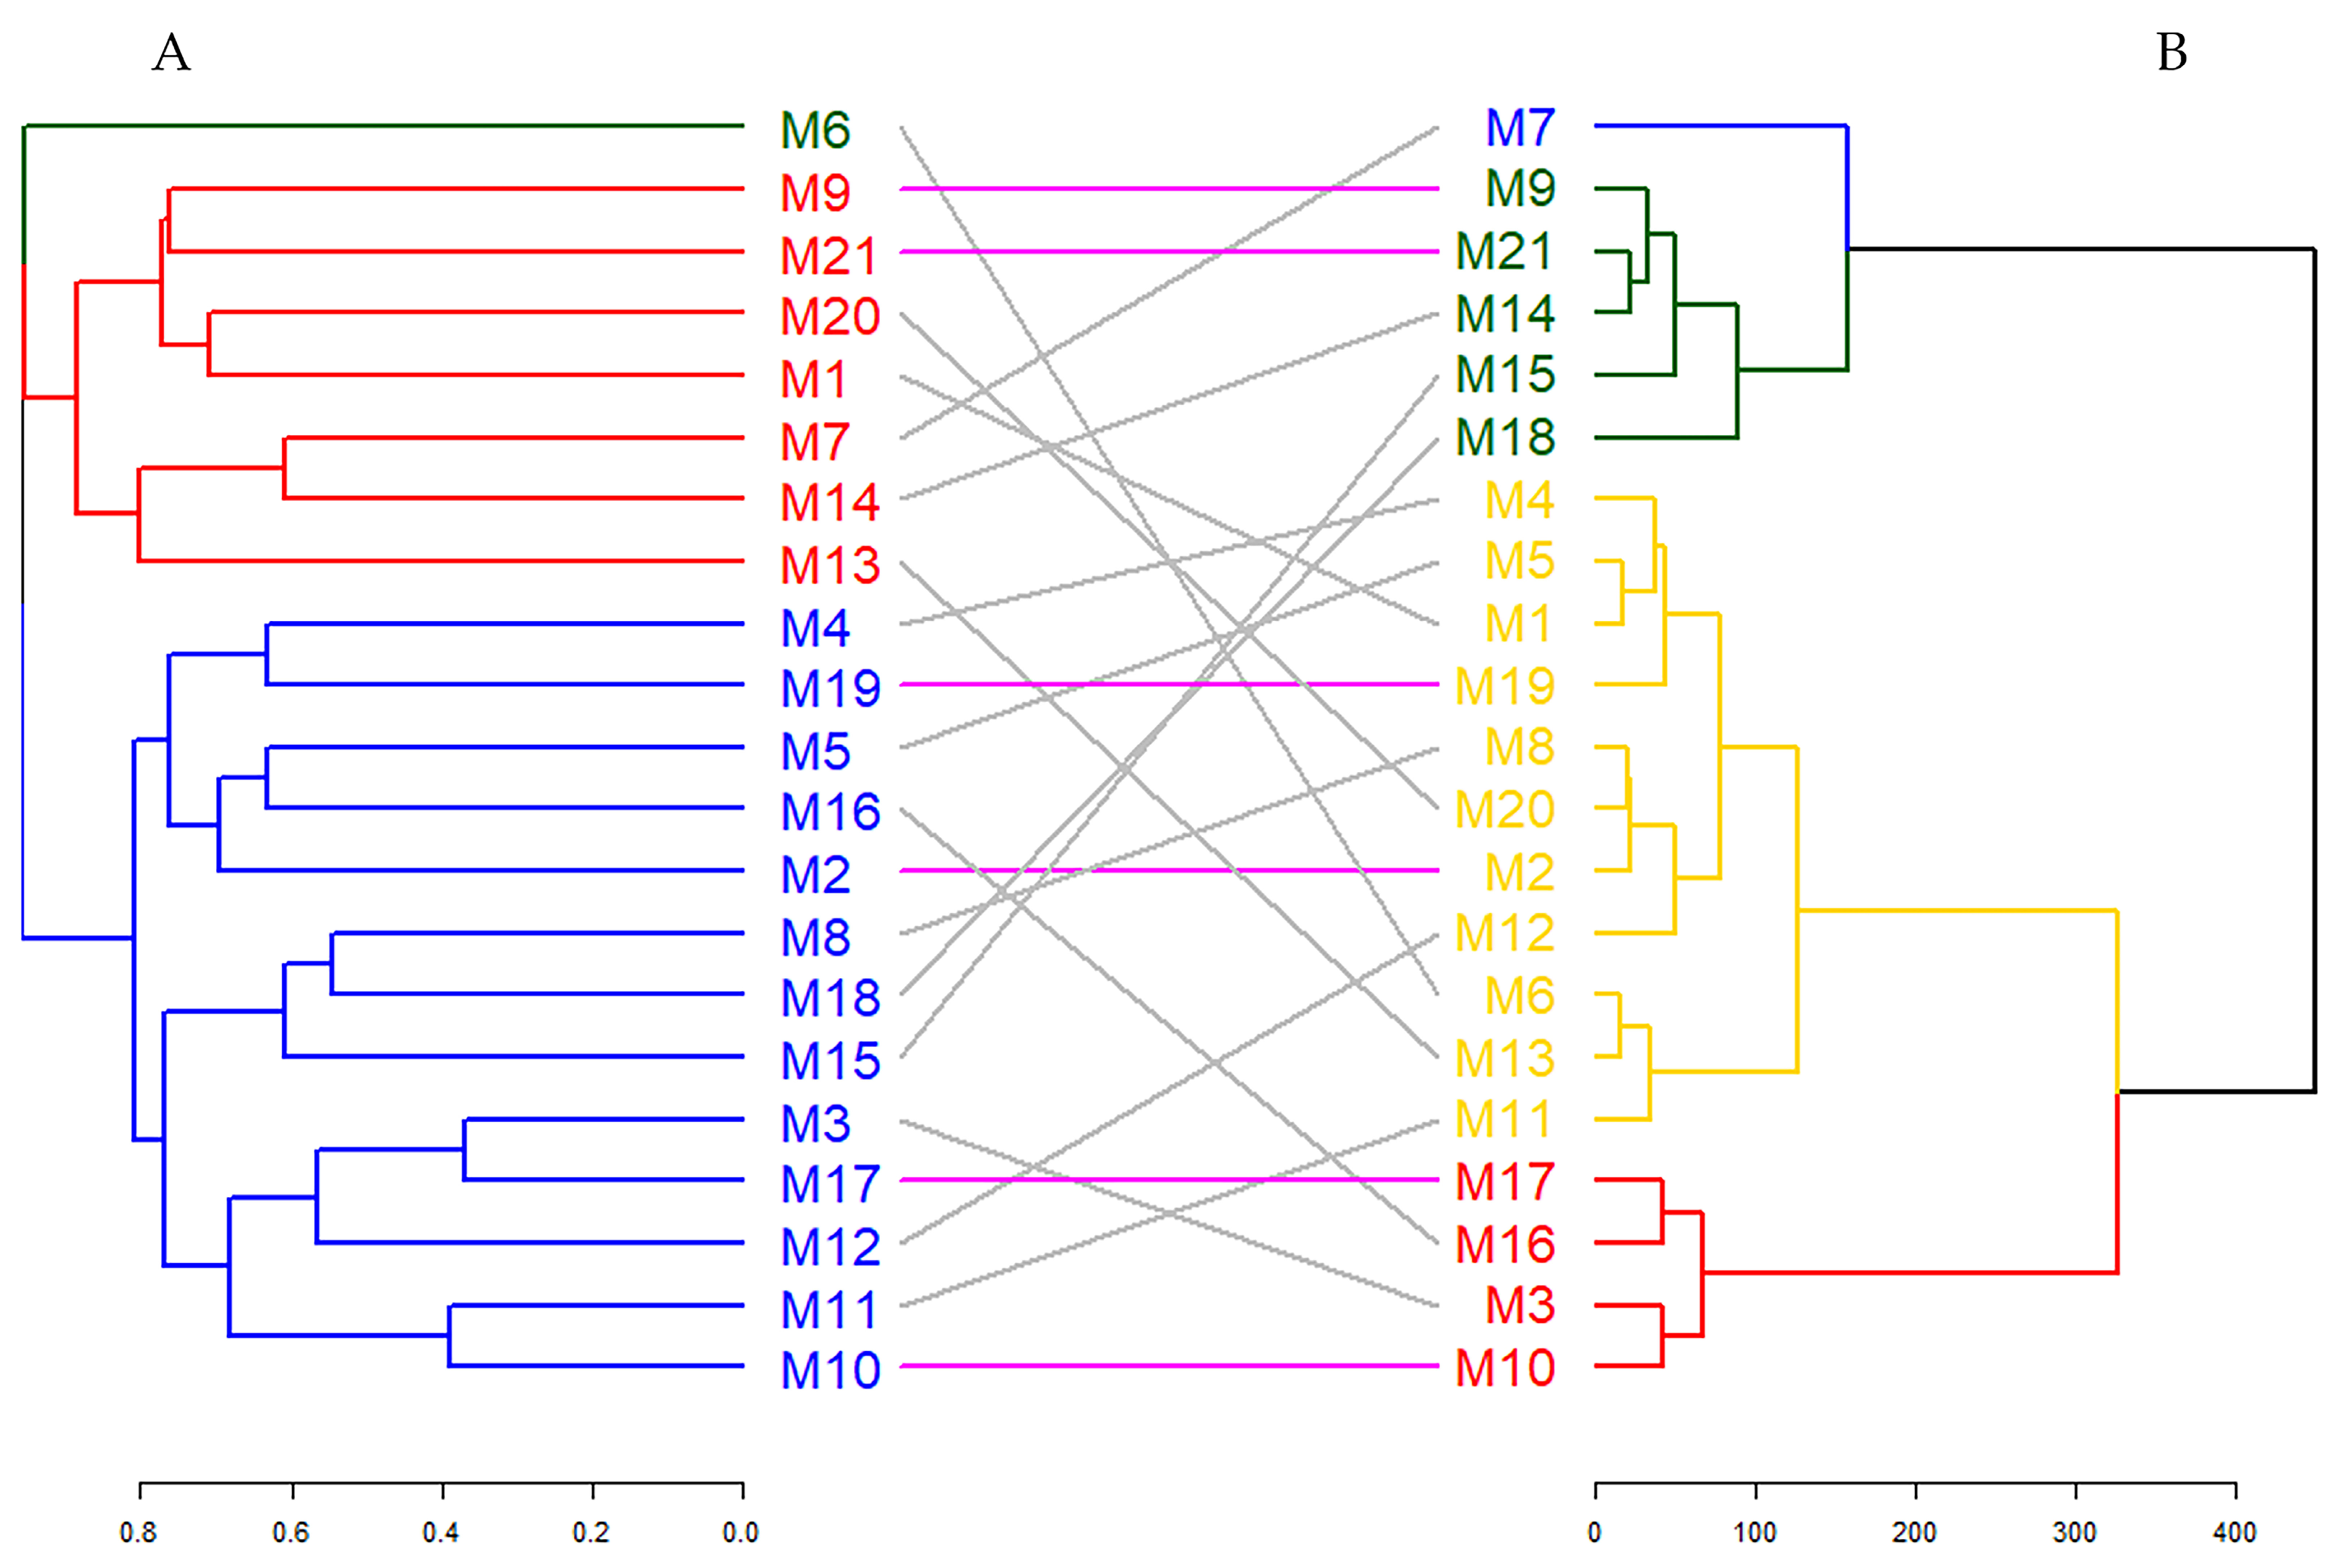
Figure 5 illustrates a binary dendrogram analysis displaying the clustering of hawthorn genotypes based on molecular data (Dendrogram A) and morphological and biochemical traits (Dendrogram B). This figure offers a comparative visualization of the relationships between the two datasets, with connecting lines representing the correspondence of genotypes across clusters [90]. Specifically, gray lines denote genotypes that differ between clusters, while colorful lines indicate genotypes that maintain consistent clustering across both dendrograms.
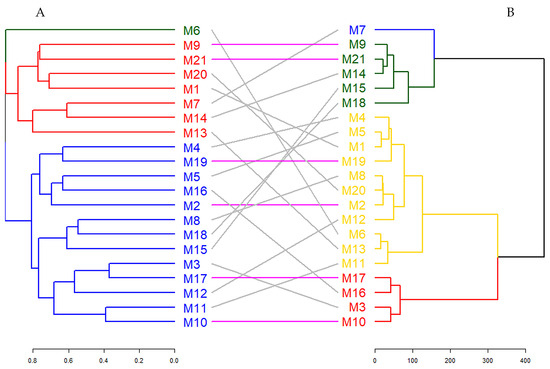
Figure 5.
Comparison of dendrograms for ISSR markers (A) and morphological and biochemical data (B) with entanglement = 0.714.
As a result of the tanglegram analysis, it was determined that six genotypes (M2, M9, M10, M17, M19, and M21) matched between the two dendrograms. The entanglement score calculated during the study was found to be 0.714. This score reveals that there is a moderate level of agreement between the two dendrograms and that genetic and phenotypic characteristics capture genotype relationships that partially overlap but from different directions [91]. Entanglement quantifies genotype correspondence across disparate dendrograms, with values spanning from 1 (total entanglement) to 0 (an absence of entanglement). A reduced entanglement coefficient indicates favorable alignment [92]. In addition, the fact that six genotypes are in the same cluster with both genetic and morphological–biochemical data indicates that these genotypes may have stable characteristics or strong genetic–phenotypic connections. These findings emphasize the complexity of genotype relationships, highlighting the importance of integrating genetic and phenotypic data to achieve a more comprehensive understanding of clustering patterns [93]. The consistent clustering of six genotypes across datasets may signify the presence of stable traits or robust genetic–phenotypic linkages in these genotypes.
4. Conclusions
This extensive investigation of hawthorn genotypes from Kelkit Valley, Türkiye, using morphological, phytochemical, and molecular studies, demonstrated considerable variety in fruit and leaf characteristics as well as in the levels of bioactive substances, including flavonoids, antioxidants, and phenolics. Correlation, heatmap, and PCA studies revealed substantial connections between morphological and biochemical variables, reinforcing the importance of phenotypic markers in genotype distinction. The fact that hawthorns are a strong source of antioxidants and are widely used in traditional medicine in many countries reveals the importance of these genotypes. The finding of significant bioactive substances, including chlorogenic acid, epicatechin, caffeic acid, and rutin, at variable amounts among genotypes underscores the medicinal and nutritional potential of these plants. Genotype M7 consistently demonstrated the greatest phenolic and antioxidant capacity, positioning it as a suitable option for functional food development. The significant variety in flavonoid and anthocyanin levels across genotypes indicates that hawthorn fruits may be carefully cultivated for health-enhancing characteristics. As a result, genotypes M7, M12, and M18 were recognized as promising candidates for breeding owing to their exceptional fruit characteristics, elevated phenolic content, and robust antioxidant activity. Genotypes M7 and M18 consistently demonstrated the greatest phenolic and antioxidant capacity, positioning them as a suitable option for functional food development. The high phenolic content of the M7 and M18 genotypes makes them valuable in terms of their health-improving properties and breeding studies. Also, fruit size is an important breeding criterion in hawthorns. In this respect, M12 is commercially important in fruit breeding studies. A molecular study with ISSR markers proved significant genetic variety, with polymorphism rates of 89.12%, and indicated a structured genetic history among genotypes. The clustering patterns derived from UPGMA and tanglegram analysis revealed that some genotypes had robust genetic–morphological congruence, whilst others showed unique clustering patterns, suggesting intricate genotype–phenotype connections. The moderate tangle score (0.714) indicates that although molecular data provide significant insights into genetic variety, integrating them with morphological and biochemical evaluations yields a more comprehensive picture of genotype variance. These results possess significant implications for conservation, breeding, and biotechnological applications. The identification of genetically unique and biochemically diverse genotypes may enhance breeding strategies focused on improving fruit quality, augmenting medicinal capabilities, and boosting stress resistance. The significant genetic diversity seen in natural populations makes it important to preserve rare genotypes that may have useful traits for future agricultural and medical uses.
Supplementary Materials
The following supporting information can be downloaded at: https://www.mdpi.com/article/10.3390/horticulturae11030238/s1.
Author Contributions
Conceptualization, M.Y., B.E. (Bora Erkek) and A.S. (Ahmet Sümbül); methodology, M.Y., B.E. (Bora Erkek) and Ö.F.Ç.; software, F.D., S.D., A.E. and A.A.; validation, A.A., A.E., B.E. (Barış Eren) and F.D.; formal analysis, F.D., A.S. (Ahmet Sümbül) and B.E. (Bora Erkek); investigation, Ö.F.Ç., S.D., A.S. (Ahmet Say) and M.Y.; resources, A.S. (Ahmet Sümbül), M.Y. and B.E. (Bora Erkek); data curation, F.D., B.E. (Barış Eren), A.A., B.E. (Bora Erkek), M.Y. and A.S. (Ahmet Say); writing—original draft preparation, F.D., S.D. and M.Y.; writing—review and editing, Ö.F.Ç., A.E. and A.A.; visualization, M.Y. and A.S. (Ahmet Sümbül); supervision, A.S. (Ahmet Sümbül) and M.Y.; project administration, M.Y. and B.E. (Bora Erkek); funding acquisition, M.Y. and B.E. (Bora Erkek). All authors have read and agreed to the published version of the manuscript.
Funding
This research received no external funding.
Data Availability Statement
The raw data supporting the conclusions of this article will be made available by the authors upon request.
Conflicts of Interest
The authors declare no conflicts of interest.
References
- Martinelli, F.; Perrone, A.; Yousefi, S.; Papini, A.; Castiglione, S.; Guarino, F.; Salami, S.A. Botanical, phytochemical, anti-microbial and pharmaceutical characteristics of hawthorn (Crataegus monogyna Jacq.), Rosaceae. Molecules 2021, 26, 7266. [Google Scholar] [CrossRef] [PubMed]
- Yildiz, E.; Sümbül, A.; Yaman, M.; Nadeem, M.A.; Say, A.; Baloch, F.S.; Popescu, G.C. Assessing the genetic diversity in hawthorn (Crataegus spp.) genotypes using morphological, phytochemical and molecular markers. Genet. Resour. Crop Evol. 2023, 70, 135–146. [Google Scholar] [CrossRef]
- Cakmak, U. Phytochemical analyses by LC-HRMS, FTIR spectral analysis, antioxidant, antidiabetic and antityrosinase activity of Crataegus orientalis Pall. ex M. Bieb fruit extracted with various solvents. J. Sci. Food Agric. 2024, 104, 3767–3775. [Google Scholar] [CrossRef]
- Liu, P.; Kallio, H.; Lü, D.; Zhou, C.; Yang, B. Quantitative analysis of phenolic compounds in Chinese hawthorn (Crataegus spp.) fruits by high performance liquid chromatography–electrospray ionisation mass spectrometry. Food Chem. 2011, 127, 1370–1377. [Google Scholar] [CrossRef] [PubMed]
- Alirezalu, A.; Ahmadi, N.; Salehi, P.; Sonboli, A.; Alirezalu, K.; Mousavi Khaneghah, A.; Barba, F.J.; Munekata, P.E.S.; Lorenzo, J.M. Physicochemical characterization, antioxidant activity, and phenolic compounds of hawthorn (Crataegus spp.) fruits species for potential use in food applications. Foods 2020, 9, 436. [Google Scholar] [CrossRef]
- Lorenzo, J.M.; Munekata, P.E.S. Phenolic compounds of green tea: Health benefits and technological application in food. Asian Pac. J. Trop. Biomed. 2016, 6, 709–719. [Google Scholar] [CrossRef]
- Wang, C.Y.; Chen, C.T.; Wang, S.Y. Changes of flavonoid content and antioxidant capacity in blueberries after illumination with UV-C. Food Chem. 2009, 117, 426–431. [Google Scholar] [CrossRef]
- Dönmez, A.A. Nomenclatural, taxonomic and biogeographic novelties in the Turkish Crataegus L. (Rosaceae-Maleae) taxa. Adansonia 2014, 36, 245–253. [Google Scholar] [CrossRef]
- Çalışkan, O.; Bayazıt, S.; Kılıç, D. Alıç (Crataegus spp.) cultivation. In Minör Meyveler-1; Sülüşoğlu Durul, M., Polat, M., Eds.; İKSAD Publishing: Ankara, Türkiye, 2022. [Google Scholar]
- Donmez, A.A. Taxonomic notes on the genus Crataegus (Rosaceae) in Turkey. Bot. J. Linn. Soc. 2007, 155, 231–240. [Google Scholar] [CrossRef]
- Tadeo, E.; Muñiz, E.; Rull, J.; Yee, W.L.; Aluja, M.; Lasa, R. Development of a low-cost and effective trapping device for apple maggot fly (Diptera: Tephritidae) monitoring and control in Mexican Commercial Hawthorn Groves. J. Econ. Entomol. 2017, 110, 1658–1667. [Google Scholar] [CrossRef]
- Çalışkan, O.; Gündüz, K.; Bayazıt, S. Sarı alıç (Crataegus azarolus L.) genotipinin morfolojik, biyolojik ve meyve kalite özelliklerinin incelenmesi. J. Agric. Fac. Gaziosmanpaşa Univ. (JAFAG) 2018, 35, 69–74. (In Turkish) [Google Scholar]
- Corlett, R.T. Plant diversity in a changing world: Status, trends, and conservation needs. Plant Divers. 2016, 38, 10–16. [Google Scholar] [CrossRef] [PubMed]
- Koornneef, M.; Alonso-Blanco, C.; Vreugdenhil, D. Naturally occurring genetic variation in Arabidopsis thaliana. Annu. Rev. Plant Biol. 2004, 55, 141–172. [Google Scholar] [CrossRef]
- Ali, F.; Nadeem, M.A.; Habyarimana, E.; Yılmaz, A.; Nawaz, M.A.; Khalil, I.H.; Ercişli, S.; Chung, G.; Chaudhary, H.J.; Baloch, F.S. Molecular characterization of genetic diversity and similarity centers of safflower accessions with ISSR markers. Braz. J. Bot. 2020, 43, 109–121. [Google Scholar] [CrossRef]
- Nadeem, M.A.; Nawaz, M.A.; Shahid, M.Q.; Doğan, Y.; Comertpay, G.; Yıldız, M.; Hatipoğlu, R.; Ahmad, F.; Alsaleh, A.; Labhane, N. DNA molecular markers in plant breeding: Current status and recent advancements in genomic selection and genome editing. Biotechnol. Biotechnol. Equip. 2018, 32, 261–285. [Google Scholar] [CrossRef]
- Yaman, M. Evaluation of genetic diversity by morphological, biochemical and molecular markers in sour cherry genotypes. Mol. Biol. Rep. 2022, 49, 5293–5301. [Google Scholar] [CrossRef] [PubMed]
- Yaman, M.; Sun, M.; Sümbül, A.; Demirel, F.; Tunç, Y.; Khadivi, A.; Yılmaz, K.U. Multivariate analysis of morphological variation, biochemical content, antioxidant activity, and molecular characteristics of autochthonous Berberis crataegina DC. genotypes in Central Türkiye. BMC Plant Biol. 2024, 24, 1155. [Google Scholar] [CrossRef] [PubMed]
- Sümbül, A.; Yildiz, E.; Yaman, M.; Dirim, E.; Ateş, U.; Say, A.; Ünsal, H.T.; Öztürk, B.; Necas, T. Morphological, biochemical, and molecular evaluation of genetic diversity in different plum genotypes (Prunus domestica L.). Genet. Resour. Crop Evol. 2024, 71, 1973–1988. [Google Scholar] [CrossRef]
- Yildiz, E.; Pinar, H.; Uzun, A.; Yaman, M.; Sumbul, A.; Ercisli, S. Identification of genetic diversity among Juglans regia L. genotypes using molecular, morphological, and fatty acid data. Genet. Resour. Crop Evol. 2021, 68, 1425–1437. [Google Scholar] [CrossRef]
- Demirel, S.; Demirel, F. Molecular identification and population structure of emmer and einkorn wheat lines with dif-ferent ploidy levels using SSR markers. Genet. Resour. Crop Evol. 2024, 71, 363–372. [Google Scholar] [CrossRef]
- Sümbül, A.; Yildiz, E.; Sabir, A.; Nadeem, M.A. Investigation of genetic diversity among autochthonous grape cultivars grown in Türkiye using molecular primers. Genet. Resour. Crop Evol. 2024, 71, 3507–3520. [Google Scholar] [CrossRef]
- Gurlen, A.; Gundogdu, M.; Ozer, G.; Ercisli, S.; Duralija, B. Primary, secondary metabolites and molecular characterization of hawthorn (Crataegus spp.) genotypes. Agronomy 2020, 10, 1731. [Google Scholar] [CrossRef]
- Amiri, S.; Mohammadi, R. The effect of plant growth regulators on hawthorn (Crataegus sp.) in vitro direct regeneration and confirmation of the genetic fidelity. Plant Biosyst. Int. J. Deal. Asp. Plant Biol. 2020, 154, 786–791. [Google Scholar] [CrossRef]
- Eren, B.; Keskin, B.; Demirel, F.; Demirel, S.; Türkoğlu, A.; Yilmaz, A.; Haliloğlu, K. Assessment of genetic diversity and population structure in local alfalfa genotypes using iPBS molecular markers. Genet. Resour. Crop Evol. 2023, 70, 617–628. [Google Scholar] [CrossRef]
- Gürcan, K.; Yılmaz, K.U.; Tunç, Y.; Yaman, M.; Güneş, A.; Yıldız, E.; Demirel, F.; Demirel, S.; Khadivi, A. Evaluation of genetic diversity in some hybrid individuals of honeyberry (Lonicera caerulea L.) based on fruit characteristics, leaf morphology, vitamin C, antioxidant activity, and biochemical and nutritional contents. BMC Plant Biol. 2024, 24, 1158. [Google Scholar] [CrossRef]
- Güney, M.; Kafkas, S.; Keles, H.; Aras, S.; Ercişli, S. Characterization of hawthorn (Crataegus spp.) genotypes by SSR markers. Physiol. Mol. Biol. Plants 2018, 24, 1221–1230. [Google Scholar] [CrossRef]
- Erfani-Moghadam, J.; Mozafari, M.; Fazeli, A. Genetic variation of some hawthorn species based on phenotypic characteristics and RAPD marker. Biotechnol. Biotechnol. Equip. 2016, 30, 247–253. [Google Scholar] [CrossRef]
- Emami, A.; Shabanian, N.; Rahmani, M.S.; Khadivi, A.; Mohammad-Panah, N. Genetic characterization of the Crataegus genus: Implications for in situ conservation. Sci. Hortic. 2018, 231, 56–65. [Google Scholar] [CrossRef]
- Sheng, F.; Chen, S.Y.; Tian, J.; Li, P.; Qin, X.; Wang, L.; Luo, S.P.; Li, J. Morphological and ISSR Molecular Markers Reveal Genetic Diversity of Wild Hawthorns (Crataegus songorica K. Koch.) in Xinjiang, China. J. Integr. Agric. 2017, 16, 2482–2495. [Google Scholar] [CrossRef]
- Khiari, S.; Boussaid, M.; Messaoud, C. Genetic diversity and population structure in natural populations of Tunisian Azarole (Crataegus azarolus L. var. aronia L.) assessed by microsatellite markers. Biochem. Syst. Ecol. 2015, 59, 264–270. [Google Scholar] [CrossRef]
- Mohammed, K.E.; Ahmad, N.S.; Ahmad, S.A. Genetic diversity of wild hawthorn (Crataegus spp.) in Iraqi Kurdistan region using biochemical and molecular markers. Genet. Resour. Crop Evol. 2025. [Google Scholar] [CrossRef]
- Karaer, F.; Kılınç, M. The Flora of Kelkit Valley. TÜBITAK Turk. J. Bot. 2001, 25, 195–238. [Google Scholar]
- Davis, P.H. Flora of Türkiye and the East AegeanIslands; Edinburgh University Press: Edinburgh, UK, 1965–1988. [Google Scholar]
- Rahmani, M.S.; Shabanian, N.; Khadivi-Khub, A.; Woeste, K.E.; Badakhshan, H.; Alikhani, L. Population structure and genotypic variation of Crataegus pontica inferred by molecular markers. Gene 2015, 572, 123–129. [Google Scholar] [CrossRef]
- Khadivi, A.; Heidari, P.; Rezaei, M.; Safari-Khuzani, A.; Sahebi, M. Morphological variabilities of Crataegus monogyna and Crataegus pentagyna in northeastern areas of Iran. Ind. Crops Prod. 2019, 139, 111531. [Google Scholar] [CrossRef]
- Christensen, K.I. Revision of Crataegus sect. Crataegus and Nothosect. Crataeguineae (Rosaceae-Maloideae) in the old world. Syst. Bot. Monogr. 1992, 35, 1–199. [Google Scholar] [CrossRef]
- Thomas, P.A.; Leski, T.; La Porta, N.; Dering, M.; Iszkuło, G. Biological flora of the British Isles: Crataegus laevigata. J. Ecol. 2021, 109, 572–596. [Google Scholar] [CrossRef]
- Hill, B.; Roger, T.; Vorhagen, F.W. Comparative analysis of the quantization of color spaces on the basis of the CIELAB color-difference formula. ACM Trans. Graph. (TOG) 1997, 16, 109–154. [Google Scholar] [CrossRef]
- Recky, M.; Leberl, F. Windows detection using k-means in cie-lab color space. In Proceedings of the 2010 20th International Conference on Pattern Recognition, Istanbul, Turkey, 23–26 August 2010; IEEE: Piscataway, NJ, USA, 2010; pp. 356–359. [Google Scholar]
- Corbala’n, M.; Milla’n, M.A.S.; Yzuel, M.A.J. Color pattern recognition with CIELAB coordinates. Opt. Eng. 2002, 41, 130–138. [Google Scholar] [CrossRef]
- Slinkard, K.; Singleton, V.L. Total phenol analysis: Automation and comparison with manual methods. Am. J. Enol. Vitic. 1977, 28, 49–55. [Google Scholar] [CrossRef]
- Elikara, A.U.; Popescu, G.C.; Demirel, S.; Sümbül, A.; Yaman, M.; Demirel, F.; Say, A.; Güneş, A. Effect of Rhizobacteria Application on Nutrient Content, Bioactive Compounds, Antioxidant Activity, Color Properties and Fruit Characteristics of Strawberry Cultivars. Processes 2024, 12, 2242. [Google Scholar] [CrossRef]
- Giusti, M.M.; Rodríguez-Saona, L.E.; Wrolstad, R.E. Molar absorptivity and color characteristics of acylated and non-acylated pelargonidin-based anthocyanins. J. Agric. Food. Chem. 1999, 47, 4631–4637. [Google Scholar] [CrossRef] [PubMed]
- Brand-Williams, W.; Cuvelier, M.E.; Berset, C.L.W.T. Use of a free radical method to evaluate antioxidant activity. LWT Food Sci. Technol. 1995, 28, 25–30. [Google Scholar] [CrossRef]
- Ozturk, B.; Yıldız, K.; Kucuker, E. Effect of pre-harvest methyl jasmonate treatments on ethylene production, water-soluble phenolic compounds and fruit quality of Japanese plums. J. Sci. Food Agric. 2015, 95, 583–591. [Google Scholar] [CrossRef]
- Doyle, J.J.; Doyle, J.L. Isolation of plant DNA from fresh tissue. Focus 1990, 12, 39–40. [Google Scholar]
- Uzun, A.; Gulsen, O.; Kafa, G.; Seday, U. Field performance and molecular diversification of lemon selections. Sci. Hortic. 2009, 120, 473–478. [Google Scholar] [CrossRef]
- Yanar, M.; Ercisli, S.; Yilmaz, K.; Sahiner, H.; Taskin, T.; Zengin, Y.; Akgul, I.; Celik, F. Morphological and chemical diversity among hawthorn (Crataegus spp.) genotypes from Turkey. Sci. Res. Essays 2011, 6, 35–38. [Google Scholar]
- Khadivi-Khub, A.; Karimi, S.; Kameli, M. Morphological diversity of naturally grown Crataegus monogyna (Rosaceae, Maloideae) in Central Iran. Braz. J. Bot. 2015, 38, 921–936. [Google Scholar] [CrossRef]
- Özderin, S.; Fakir, H. Some botanical properties of hawthorn (Crataegus L. spp.) taxa natural distributed in the western Anatolia part of Turkey. Int. J. Agric. Innov. Res. 2015, 4, 567–572. [Google Scholar]
- Stoenescu, A.M.; Cosmulescu, S. Variability of morphological characteristics in hawthorn (Crataegus monogyna L.) fruit genotypes. South-West. J. Hortic. Biol. Environ. 2020, 11, 15. [Google Scholar]
- Ercisli, S. A short review of the fruit germplasm resources of Turkey. Genet. Resour. Crop Evol. 2004, 51, 419–435. [Google Scholar] [CrossRef]
- Gundogdu, M.; Ozrenk, K.; Ercisli, S.; Kan, T.; Kodad, O.; Hegedus, A. Organic acids, sugars, vitamin C content and some pomological characteristics of eleven hawthorn species (Crataegus spp.) from Turkey. Biol. Res. 2014, 47, 21. [Google Scholar] [CrossRef]
- Balasooriya, B.L.W.K.; Samson, R.; Mbikwa, F.; Vitharana, U.W.A.; Boeckx, P.; Van Meirvenne, M. Biomonitoring of urban habitat quality by anatomical and chemical leaf characteristics. Environ. Exp. Bot. 2009, 65, 386–394. [Google Scholar] [CrossRef]
- Kuhn, T.; Jancsó, B.; Ruprecht, E. Hawthorn (Crataegus L.) taxa and their hybrids in north-western Romania: A recommendation for national identification keys based on morphometric analyses. Contrib. Bot. 2020, 55, 7–26. [Google Scholar] [CrossRef]
- Yalçın Dokumacı, K.; Uslu, N.; Hacıseferoğulları, H.; Örnek, M.N. Determination of Some Physical and Chemical Properties of Common Hawthorn (Crataegus monogyna Jacq. var.). Erwerbs-Obstbau 2021, 63, 99–106. [Google Scholar] [CrossRef]
- Bektaş, M.; Bükücü, Ş.B.; Özcan, A.; Sütyemez, M. Plant and pomological characteristics of hawthorn (Crataeugus spp.) genotypes found in Akçadağ and Hekimhan region. Turk. J. Agric. Nat. Sci. 2017, 4, 484–490. (In Turkish) [Google Scholar]
- Radi, F.Z.; Bencheikh, N.; Anarghou, H.; Bouhrim, M.; Alqahtani, A.S.; Hawwal, M.F.; Zair, T. Quality control, phytochemical profile, and biological activities of Crataegus monogyna Jacq. and Crataegus laciniata Ucria fruits aqueous extracts. Saudi Pharm. J. 2023, 31, 101753. [Google Scholar] [CrossRef] [PubMed]
- Nazhand, A.; Lucarini, M.; Durazzo, A.; Zaccardelli, M.; Cristarella, S.; Souto, S.B.; Santini, A. Hawthorn (Crataegus spp): An updated overview on its beneficial properties. Forests 2020, 11, 564. [Google Scholar] [CrossRef]
- Mihailović, M.; Dinić, S.; Arambašić Jovanović, J.; Uskoković, A.; Grdović, N.; Vidaković, M. The influence of plant extracts and phytoconstituents on antioxidant enzymes activity and gene expression in the prevention and treatment of impaired glucose homeostasis and diabetes complications. Antioxidants 2021, 10, 480. [Google Scholar] [CrossRef]
- Güzel, N. Hawthorn: Extraction of bioactive compounds by thermosonication and evaluation of physico-chemical properties. Gıda 2021, 46, 939–948. (In Turkish) [Google Scholar]
- Okatan, V.; Gündoğdu, M.; Çoalk, A.M. Determination of some chemical and pomological characteristics of different hawthorn genotypes (Crataegus spp.) fruits grown in Uşak. J. Ins. Sci. Technol. 2017, 7, 39–44. [Google Scholar] [CrossRef]
- Çalişkan, O.; Gündüz, K.; Serçe, S.; Toplu, C.; Kamiloğlu, O.; Sengül, M.; Ercişli, S. Phytochemical characterization of several hawthorn (Crataegus spp.) species sampled from the Eastern Mediterranean region of Turkey. Pharmacogn. Mag. 2012, 8, 16–21. [Google Scholar] [CrossRef]
- Salmanian, S.; Sadeghi, M.A.; Alami, M.; Ghorbani, M. Phenolic content, antiradical, antioxidant, and antibacterial properties of hawthorn (Crataegus elbursensis) seed and pulp extract. J. Agric. Sci. Technol. 2014, 16, 343–354. [Google Scholar]
- Chang, C.L.; Chen, H.S.; Shen, Y.C.; Lai, G.H.; Lin, P.K.; Wang, C.M. Phytochemical composition, antioxidant activity and neuroprotective effect of Crataegus pinnatifida fruit. South Afr. J. Bot. 2013, 88, 432–437. [Google Scholar] [CrossRef]
- Mssillou, I.; Agour, A.; Hamamouch, N.; Lyoussi, B.; Derwich, E. Chemical Composition and In Vitro Antioxidant and Antimicrobial Activities of Marrubium vulgare L. Sci. World J. 2021, 7011493. [Google Scholar] [CrossRef] [PubMed]
- Yuan, H.; Ma, Q.; Ye, L.; Piao, G. The traditional medicine and modern medicine from natural products. Molecules 2016, 21, 559. [Google Scholar] [CrossRef] [PubMed]
- Ez-Zahra Amrati, F.; Mssillou, I.; Boukhira, S.; Djiddi Bichara, M.; El Abdali, Y.; Galvão de Azevedo, R.; Bousta, D. Phenolic Composition of Crataegus monogyna Jacq. Extract and Its Anti-Inflammatory, Hepatoprotective, and Antileukemia Effects. Pharmaceuticals 2024, 17, 786. [Google Scholar] [CrossRef] [PubMed]
- Öztürk, N.; Tunçel, M. Assessment of phenolic acid content and in vitro antiradical characteristics of hawthorn. J. Med. Food 2011, 14, 664–669. [Google Scholar] [CrossRef] [PubMed]
- Mojtahed Zadeh Asl, R.; Niakousari, M.; Hashemi Gahruie, H.; Saharkhiz, M.J.; Mousavi Khaneghah, A. Study of two-stage ohmic hydro-extraction of essential oil from Artemisia aucheri Boiss.: Antioxidant and antimicrobial characteristics. Food Res. Int. 2018, 107, 462–469. [Google Scholar] [CrossRef] [PubMed]
- Wang, S.Y.; Bunce, J.A.; Maas, J.L. Elevated carbon dioxide increases contents of antioxidant compounds in field-grown strawberries. J. Agric. Food Chem. 2003, 51, 4315–4320. [Google Scholar] [CrossRef] [PubMed]
- Keinänen, M.; Julkunen-Tiitto, R.; Mutikainen, P.; Walls, M.; Ovaska, J.; Vapaavuori, E. Trade-offs in phenolic metabolism of silver birch: Effects of fertilization, defoliation, and genotype. Ecology 1999, 80, 1970–1986. [Google Scholar] [CrossRef]
- Cohen, S.D.; Kennedy, J.A. Plant metabolism and the environment: Implications for managing phenolics. Crit. Rev. Food Sci. Nutr. 2010, 50, 620–643. [Google Scholar] [CrossRef] [PubMed]
- Özcan, M.; Hacıseferoğulları, H.; Marakoğlu, T.; Arslan, D. Hawthorn (Crataegus spp) fruit: Some physical and chemical properties. J. Food Eng. 2005, 69, 409–413. [Google Scholar] [CrossRef]
- Liu, Y.; Chen, L.; Shen, G.; Gu, Y.; Guo, Y.; Han, J. Altitude-driven variations in nutritional, bioactive, and mineral profiles of hawthorn (Crataegus spp.). Foods 2025, 14, 241. [Google Scholar] [CrossRef] [PubMed]
- Cui, T.; Li, J.Z.; Kayahara, H.; Ma, L.; Wu, L.X.; Nakamura, K. Quantification of the polyphenols and triterpene acids in Chinese hawthorn fruit by high-performance liquid chromatography. J. Agric. Food Chem. 2006, 54, 4574–4581. [Google Scholar] [CrossRef]
- Hair, J.J.; Black, W.C.; Babin, B.J.; Anderson, R.R.; Tatham, R.L. Multivariate Data Analysis; MacMillan Pub: New York, NY, USA, 2006. [Google Scholar]
- Say, A.; Sümbül, A.; Dirim, E.; Yaman, M.; Yildiz, E. Unravelling the Genetic Diversity of Oleaster (Elaeagnus angustifolia L.) with Multivariate Analysis. Appl. Fruit Sci. 2024, 66, 719–730. [Google Scholar] [CrossRef]
- Sümbül, A.; Yıldız, E. Explanation of morphological and biochemical diversity of autochthonous grapes grown in Türkiye (Kelkit Basin) using multivariate analysis. Turk. J. Food Agric. Sci. 2024, 6, 160–172. [Google Scholar] [CrossRef]
- Garazhian, M.; Gharaghani, A.; Eshghi, S. Genetic diversity and inter-relationships of fruit bio-chemicals and antioxidant activity in Iranian wild blackberry species. Sci. Rep. 2020, 10, 18983. [Google Scholar] [CrossRef] [PubMed]
- Betancourt-Olvera, M.; Nieto-Ángel, R.; Urbano, B.; González-Andrés, F. Analysis of the biodiversity of hawthorn (Crataegus spp.) from the morphological, molecular, and ethnobotanical approaches, and implications for genetic resource conservation in scenery of increasing cultivation: The case of Mexico. Genet. Resour. Crop Evol. 2018, 65, 897–916. [Google Scholar] [CrossRef]
- Muradoğlu, F.; Gürsoy, S.; Güler, E. Multivariate analysis revealed the morphological variability among Crataegus species. Yuz. Yıl Univ. J. Agric. Sci. 2021, 31, 961–972. [Google Scholar] [CrossRef]
- Ghanbari, A.; Estaji, A.; Fahim, S.; Jamali, M. Assessment of genetic diversity among Crataegus genotypes by Application of ISSR markers in Ardabil province. J. Plant Mol. Breed. 2019, 7, 77–83. [Google Scholar]
- Beigmohamadi, M.; Rahmani, F.; Mirzaei, L. Study of Genetic Diversity Among Crataegus Species (Hawthorn) Using ISSR Markers in Northwestern of Iran. Pharm. Biomed. Res. 2021, 7, 59–66. [Google Scholar] [CrossRef]
- Serçe, S.; Şimşek, Ö.; Toplu, C.; Kamiloǧlu, Ö.; Çalişkan, O.; Gündüz, K.; Özgen, M.; Kaçar, Y.A. Relationships among Crataegus accessions sampled from Hatay, Turkey, as assessed by fruit characteristics and RAPD. Genet. Resour. Crop Evol. 2011, 58, 933–942. [Google Scholar] [CrossRef]
- Sagbas, H.I.; Ercisli, S.; Ozkan, G.; Ilhan, G. Inter-and ıntraspecific genetic variation of native hawthorn (Crataegus spp.) genotypes grown in the Çoruh valley in Türkiye. Erwerbs-Obstbau 2023, 65, 2537–2546. [Google Scholar] [CrossRef]
- Coşkun, Ö.F.; Toprak, S.; Mavi, K. Some seed properties and molecular analysis with inter-primary binding site (iPBS) retrotranposons markers of edible-seeded watermelon genotypes. Genet. Resour. Crop Evol. 2024, 71, 3151–3162. [Google Scholar] [CrossRef]
- Coskun, O.F.; Gulsen, O. Determination of markers associated with important agronomic traits of watermelon (Citrullus lanatus L.). J. Agric. Sci. Technol. 2024, 26, 1359–1371. [Google Scholar] [CrossRef]
- Cornea-Cipcigan, M.; Pamfil, D.; Sisea, C.R.; Margaoan, R. Characterization of Cyclamen genotypes using morphological descriptors and DNA molecular markers in a multivariate analysis. Front. Plant Sci. 2023, 14, 1100099. [Google Scholar] [CrossRef] [PubMed]
- Galili, T. dendextend: An R package for visualizing, adjusting and comparing trees of hierarchical clustering. Bioinformatics 2015, 31, 3718–3720. [Google Scholar] [CrossRef] [PubMed]
- Santos, M.A.; dos Santos, B.R.C. Silagem da palma forrageira consorciada com resíduos da mandioca e bagaço da cana-de-açúcar: Revisão. Pubvet 2018, 12, 133. [Google Scholar] [CrossRef]
- Tabaripour, R.; Sheidai, M.; Talebi, S.M.; Noormohammadi, Z. Molecular and morphological investigation in Hymenocrater: Species delimitation, relationship, divergence time and DNA barcoding. Genet. Resour. Crop Evol. 2021, 68, 2003–2017. [Google Scholar] [CrossRef]


Disclaimer/Publisher’s Note: The statements, opinions and data contained in all publications are solely those of the individual author(s) and contributor(s) and not of MDPI and/or the editor(s). MDPI and/or the editor(s) disclaim responsibility for any injury to people or property resulting from any ideas, methods, instructions or products referred to in the content. |
© 2025 by the authors. Licensee MDPI, Basel, Switzerland. This article is an open access article distributed under the terms and conditions of the Creative Commons Attribution (CC BY) license (https://creativecommons.org/licenses/by/4.0/).