Article

Nutrient Balance of Citrus Across the Mandarin Belts of India

by
Anoop Kumar Srivastava
1,*,
Ambadas Dattatray Huchche
1,
Leon-Etienne Parent
2,
Suresh Kumar Malhotra
3,
Vasileios Ziogas
4 and
Lohit Kumar Baishya
5
1
ICAR—Central Citrus Research Institute, Nagpur 440033, Maharashtra, India
2
Department of Soils and Agrifood Engineering, Laval University, Quebec, QC G1V0A6, Canada
3
Maharana Pratap Horticultural University, Karnal 132001, Haryana, India
4
Hellenic Agricultural Organization—DIMITRA (ELGO—DIMITRA), Institute of Olive Tree, Subtropical Crops and Viticulture, 73134 Chania, Greece
5
ICAR—Indian Agricultural Research Institute, Dhemaji 787035, Assam, India
*
Author to whom correspondence should be addressed.
Horticulturae 2025, 11(3), 254; https://doi.org/10.3390/horticulturae11030254
Submission received: 10 January 2025 / Revised: 24 February 2025 / Accepted: 26 February 2025 / Published: 27 February 2025

Abstract

:
India is a major producer of mandarin oranges. However, the average fruit yield remains below potential due in part to multiple nutrient deficiencies. Our objective was to elaborate compositional nutrient diagnosis (CND) log-ratio standards accounting for nutrient interactions and the dilution the leaf tissue. We hypothesized that equally or unequally weighted dual nutrient log ratios integrated into centered log ratios (clr) or weighted log ratios (wlr) influence the accuracy of the CND diagnosis. The database comprised 494 observations on ‘Nagpur’, ‘Khasi’, and ‘Kinnow’ cultivars surveyed in contrasting agroecosystems of India. Weights were provided by gain ratios that indicated the importance of the dual log ratio on crop performance. The cutoff yield was set at the upper high-yield quarter for each variety. Centered log ratios (clrs) and weighted log ratios (wlrs) returned accuracies of 0.7–0.8 depending on the machine learning classification model. The gain ratios were not contrasted enough to make a difference between clr and wlr. We derived clr and wlr nutrient standards following the Gradient Boosting model. In a case study, the clr and wlr returned similar diagnoses. The capacity of clr and wlr to generalize to unseen cases and correct nutrient imbalance should be further verified in fertilizer trials. The diagnosis could also be conducted at a local scale, thanks to the Euclidian geometry and additivity of clr and wlr variables.

1. Introduction

Citrus is a genetically diversified fruit crop grown under tropical, subtropical, and subtropical/temperate climates [1]. India, with a production of 148 × 106 Mg on 13.9 × 10⁶ ha, is the third orange producer worldwide next to Brazil and China [2]. In India, citrus is grown under various pedoclimatic conditions [3,4,5,6], mainly in the northwest (e.g., Punjab, Haranya, Rajasthan, and Himachal Pradesh), northeast (e.g., Assam, Nagaland, Tripura, Sikkim, Meghalaya, Mizoram, Manipur, and Arunachal Pradesh), and central-south (e.g., Maharashtra, Madhya Pradesh, and Karnataka) states.
‘Kinnow’ (hybrid of King mandarin as Citrus nobilis, Lour × Willow mandarin as Citrus deliciosa Tanaka budded on Jatti Khatti rootstock, Citrus jambhiri Lush), ‘Khasi’ (Citrus reticulata Blanco from seedlings), and ‘Nagpur’(Citrus reticulata Blanco budded on rough lemon rootstock, Citrus jambhiri Lush) are the most common mandarin cultivars grown in India. Wide yield disparity is common among cultivars [7]. Soils vary regionally from highly acidic to calcareous. Multiple nutrient deficiencies in the form of N, P, Fe, Mn, and Zn in ‘Nagpur’; N, P, K, Fe, Mn, and Zn in ‘Kinnow’; and N, P, K, Zn, B, and Mo in ‘Khasi’ mandarin cultivars are commonly observed cutting the potential yield of orchards. Primary symptoms of these nutrient deficiencies comprise general yellowing due to the chlorosis of the entire canopy without the preferential appearance of symptoms on young/older leaves along the canopy (N-deficiency), the expanded central core of fruits coupled with increased peel thickness (P-deficiency), an exceptionally smaller fruit size with fruits misshapen due to excess elongation along the equatorial axis (K-deficiency), younger leaves displaying uniform chlorosis with pointed and small in size (Fe-deficiency), younger leaves with a network of green midrib and veins in the chlorotic background (Mn-deficiency), uniform chlorosis on both sides of the midrib of leaves showing pointed protuberance, small in size and rosette formation (Zn-deficiency), a uniform distribution of yellow spots (Mo-deficiency), and a swollen midrib (B-deficiency). The manifestation of these symptoms, once developed, is colossal on fruit yield, and since they most often make the visual symptoms of these nutrient deficiencies quite difficult to unravel and rank them in order, they affect the yield due to the overlapping of symptoms [7]. Furthermore, fertilizer practices depend on the nature and properties of soils, rootstock–scion combination, orchard age, planting density, agroclimatic environments, and rely primarily on the outcome of leaf analyses as an integrative result of these factors.
The highly variable agroecological and climatic features, rootstock–scion combinations, tree ages, and management practices have been a long-standing issue of major concern with respect to citrus in India. No single nutrient diagnosis sufficed to address the numerous nutrient constraints [8]. Questions will continue about the effectiveness of nutrient diagnosis in the field unless efforts are made using a uniform sampling procedure, analytical methods, data generation, and interpretation of nutrient limitations at a landscape or regional scale [9].
Because plants integrate all factors influencing crop performance and the roots explore nutrient reserves in the subsoil, tissue testing is an appropriate means to test the nutrient status of perennial fruit crops like mandarin. Previously, nutrient standards have been developed from parametric correlation–regression analysis [10,11], the Diagnosis and Recommendation Integrated System (DRIS) [10,12,13], and log-ratio diagnosis [14] to a web-based expert system [15]. Critical nutrient concentration ranges [16] have been widely used to diagnose the nutrient status of mandarin groves and guide fertilization in India [7,12,13,17]. However, raw concentration values do not account for nutrient interactions reported in the literature as dual nutrient ratios [18,19,20]. Nutrient diagnostic tools have also been criticized and questioned due to wide gaps between the lower and higher values of nutrients [8]. Moreover, nutrient interactions used for diagnostic purposes could influence crop performance differently depending on plant physiology and growing conditions. Tools of Artificial Intelligence and log-ratio tools of compositional data analysis (CoDa) can be combined to account for plant-specific nutrient interactions and enhance the accuracy of predictive machine learning (ML) models [21,22].
Our objective was to develop models to diagnose the nutrient status of mandarin groves in India and account for the underlying nutrient interactions. We hypothesized that the log-ratio integration of properly weighted binary interactions increases the accuracy of nutrient diagnostic models for mandarin.

2. Materials and Methods

2.1. Dataset

A dataset of 494 observational data of three mandarin cultivars was assembled in Madhya Pradesh and Maharashtra (central India, n = 178), Punjab, Rajasthan, and Haryana (northwest India, n = 162), and Sikkim, Tripura, Meghalaya, Mizoram, Assam, Arunachal Pradesh, Nagaland, and Manipur (northeast India, n = 154) (Figure 1). Trees of 10–17 years of age were representative of peak production efficiency and devoid of Phytophthora-induced foot and root rot diseases and Huanglongbing (HLB) as two predominant diseases of these citrus belts. Plantation density varied between 5.5 m × 5.5 m (330 trees ha−1) for budded trees and 5 m × 5 m (400 trees ha−1) for seedlings. Copper-based fungicides were applied to control canker disease (Xanthomonas citri ssp. citri). In all orchards, the fruits of 25 trees were harvested for marketable yields and reported in Mg fruits ha−1.
‘Kinnow’ mandarin was grown on alkaline sandy loam soils under an arid climate in northwest India (Rajasthan, Punjab, and Haryana). The soils were Entisols (Typic Ustorthent, Typic Ustipsamment), Inceptisols (Typic Ustochrept, Haplic Ustochrept), and Aridisols (Typic Haplargid, Typic Calciargids). The soils were calcareous and of a loam–sandy to loamy texture. The calcium carbonate content hardly reached 10–12%, and soil pH seldom exceeded 8.5. Due to coarser texture, calcium carbonate led to micronutrient deficiencies in this mandarin belt, especially Fe, Mn, and Zn. The multiple application of foliar spray-carrying micronutrients (0.50% ZnSO4 + 0.50% FeSO4 + 0.50% MnSO4 + 0.25% CuSO4) is a popular practice to ward off frequent micronutrient deficiencies.
‘Khasi’ mandarin was grown on acidic sandy loam soils in northeastern India under a humid tropical climate (Madhya Pradesh). The soils were Entisols (Typic Ustorthent), Inceptisols (Typic Ustochrept), Alfisols (Typic Aqualf, Typic Ustalfs, Aquic Ustalfs), and Ultisols (Typic Ustults, Hplic Ustults, Aquic Ustults). Those soils were highly acidic.
The fertilization of ‘Nagpur’ mandarin varied as follows: 167.0–223.4 kg N ha−1, 55.6–83.4 kg P2O5 ha−1, 83.4–139.0 kg K2O ha−1, 13.9–27.8 kg ZnSO4 ha−1, 13.9–27.8 kg FeSO4 ha−1, and 13.9–27.8 kg MnSO4 ha−1 under basin/flood irrigation. Nearly 50% of orchards used drip/fertigation. There were two harvesting seasons: one in November–December as a winter crop and one in March–April as a summer crop [9].
The fertilization of ‘Kinnow’ was as follows: 240.0–300.0 kg N ha−1, 45.0–60.0 kg P2O5 ha−1, 90.0–120.0 kg K2O ha−1, 15.0–22.5 kg ZnSO4 ha−1, 15.0–22.5 kg FeSO4 ha−1, and 15.0–22.5 kg MnSO4 ha−1 coupled with three foliar sprays of micronutrient mixture (0.50% ZnSO4 + 0.50% FeSO4 + 0.50% MnSO4 + 0.25% CuSO4 + 0.10% Borax) at fruit set, followed by two additional sprays at a 45-day interval during fruit development. Most orchards were flood irrigated. Less than 25% of orchards were drip fertigated [7,8,23]. Harvest occurred in December–January.
The fertilization of ‘Khasi’ was as follows: 1.20–1.80 Mg Farmyard manure ha−1 and 150–180 kg rock phosphate ha−1. There was a rare addition of 15.0–30.0 kg ZnSO4 ha−1. Most orchards in this region received organic sources of nutrients for more than 100 years under rainfed conditions without any other crop management practices. Those mandarins have often been called “organic citrus” [17]. Harvest occurred during the December to February period depending on the altitude.

2.2. Methods of Tissue Analysis

Five- to seven-month-old current flush leaf samples were collected from non-fruiting terminals. Four recently mature leaves (3rd or 4th leaf) were collected per plant when terminal fruits were 2 to 4 cm in diameter [24]. The branches were located at mid-canopy height and distributed in the different quadrants of each tree. A leaf sample consisted of 100 leaves from non-fruiting terminals, randomly collected from 25 healthy trees (devoid of any apparent pests and diseases) per homogeneous plot.
The leaves were washed in running water, deionized water, and a solution of neutral detergent (0.1%); a solution of deionized water and hydrochloric acid (0.3%); and deionized water [25]. The leaves were dried in a forced-air oven at 60 ± 3 °C, and ground in a Willey mill to pass through a sieve with an opening of 0.841 mm (20 mesh). The leaf samples were digested in 1 part of HCIO4 and 2.5 parts of H2SO4 di-acid mixture [25]. The nutrient concentrations (N, P, K, Ca, Mg, S, B, Cu, Fe, Mn, and Zn) were quantified as follows [26]: nitrogen using the Dumas method of dry combustion by the Auto Nitrogen Analyzer (Perkin-Elmer 2410 Series), phosphorous by colorimetry (Systronics: SpecIndiatronic 21D), potassium by flame photometry (392 dual Channel Electronics India), calcium and magnesium using the versine titration method, and cationic micronutrients by atomic absorption spectrophotometry (GBC-908, Australia).

2.3. The Sample Space

The compositional data are intrinsically multivariate, strictly positive data constrained to 100% for proportion and to the measurement unit for concentration. The closed sample space S D of a D-part composition is defined as follows:
S D = { x = x 1 , x 2 , x D | x i > 0 ,   i = 1   t o   D ; i = 1 D x i = κ }
where x D is a filling value computed by the difference between κ (the measurement unit) and the sum of the quantified components ( x 1 , x 2 , ). For dried plant tissues, x D includes C, H, O, and non-quantified elements.
The increase or decrease in any one proportion must impact the other proportions within a closed space, the evidence of which is called ‘resonance’ in the simplex [27]. For tissue compositions, ‘resonance’ can be driven physiologically by nutrient interactions, dilution, and cross-talks [18,20,28]. A D-part composition contains D-1 degrees of freedom [27]. Ignoring the sum closure is a source of false correlation that distorts the results of statistical analysis [29]. Confidence intervals about the means of raw compositional data may miss the limits of the sample space (less than zero or more than 100%) after conducting statistical analyses. The sum of the means of proportions may also differ from 100%, leading to absurd results.

2.3.1. Need for Log-Ratio Transformation

To run statistical analysis, the scale of measurement should be one for which the linear additive models hold [30]. Most relationships between pairs of nutrients are non-linear [31]. Dual nutrient ratios are common expressions to represent binary nutrient interactions [18]. The ratio between nutrients x and y is multiplicative: x y = x × 1 y . Expressions that are multiplicative in their original scale of measurement become additive on the logarithmic scale [30]. Several log-ratio transformations have been proposed [26,31].
Log ratios free raw concentration data from their constrained compositional space and project them into the real space (± ) required to conduct statistical analyses. Indeed, l o g a / b   i f   a or b 0, and conversely. Beyond the dual relationships between elements, three elements were constrained into ternary diagrams [32,33]. Several dual ratios were integrated into nutrient indices [34,35]. None of the latter approaches relied on strong mathematical theory. Nutrient interrelationships have been solved theoretically by the sound methods of Composition Data Analysis or CoDa [14,27].

2.3.2. Centered Log-Ratio Transformation (clr)

The clr is a log-ratio transformation defined as follows [27]:
c l r i = l n x i / g x
where g x = x 1 x 2 x D 1 D is the geometric mean across components including x D . The sum of the D clr values is zero. The clr takes advantage of the additivity of the D D 1 / 2 dual log ratios computable in a D-part composition. The clr for nutrient x i is the mean of D equally weighted ( 1 D ) dual log ratios, as follows:
l n x i g x = l n x i x 1 × x i x 2 × × x i S D 1 D = 1 D l n x i x 1 + l n x i x 2 + + l n x i S D
The clr variables are additive and have Euclidean geometry, as follows:
= j = 1 D c l r j c l r j * 2
where is the Euclidean distance between two compositions of equal length, c l r j is the jth clr value of the diagnosed specimen, and c l r j * is the corresponding reference clr value of a performing crop. Each nutrient index c l r j c l r j * can be displayed in a histogram illustrating the degree of deficiency or excess of each nutrient.
The c l r x i mean can be back-transformed into a nutrient concentration x i centroid expressed in g kg−1, as follows:
= i = 1 D e x p c l r x i x i = e x p c l r x i × 1000
Using population statistics as clr means and standard deviation, the nutrient x i index can be computed as follows:
I n d e x   x i = c l r x i c l r x i * S D x i *
The mean variance across clr variances allows comparing cultivars. The mean variance V A R ¯ across a centered log ratio is computed as follows [32]:
V A R ¯ = 1 D j = 1 D V A R c l r j

2.3.3. Weighted Log-Ratio Transformation

The heroic assumption that dual ratios have equal weights across species and growing conditions may fail [31]. Each dual ratio could be weighted to account for their importance to the target variable. A new formulation of clr variables is needed to account for the unequal importance of each dual ratio, as follows:
w l r x i = 1 D j = 1 D l n x i x j φ j = 1 D j = 1 D φ j l n x i x j ,   i j
where x i is the common numerator for nutrient i, x j represents other components, and φ j is a coefficient assigned to each log-transformed dual ratio. If all φ j = 1 , w l r x i = c l r x i . The φ j coefficients are then assigned to each dual log ratio to compute weighted log ratios (wlr). To maintain nutrient x i at numerator in order to compute w l r x i , φ j l n x j x i is multiplied by −1 to relocate x i at numerator and thus to recover φ j l n x i x j .

2.4. Statistical Analysis

Descriptive statistics were computed using Excel Microsoft 365. Data inspection and machine learning (ML) analysis were run using the Orange 3.37 freeware (University of Ljubljana, Ljubljana, Slovenia). The tested ML classification models were Random Forests, Naïve Bayes, Support Vector Machine (SVM), k-Nearest Neighbors (KNNs), and Gradient Boosting. The target variable specific to each cultivar was fruit yield class about yield cutoff using specimens in the upper quarter as high-yielders. The cutoff yields used as the horizontal cursors were 22.5 Mg ha−1 for ‘Nagpur’, 28.4 Mg ha−1 for ‘Khasi, and 32.3 Mg ha−1 for ‘Kinnow’. The features were cultivars and nutrient expressions. The dataset was processed by cross-validation using k = 10.
The relative importance of each feature for the target variable was determined as the gain ratios φ j assigned to each dual ratio. The gain ratio is an unbiased measure of importance computed as the ratio of information gained over the intrinsic information. The gain ratios rely on the database while dual log ratios are physiologically meaningful.
Model performance was measured as the area under the curve–receiver operator characteristic curve (AUC-ROC) and classification accuracy. The AUC-ROC is an evaluation metric for binary classification problems that separates the signal from the noise. The specimens were classified in a confusion matrix as true negative (TN = population of high-yielding and nutritionally balanced specimens), true positive (TP = population of low-yielding and nutritionally imbalanced specimens), false negative (FN = population of low-yielding yet nutritionally balanced specimens), and false positive (FP = population of low-yielding but nutritionally imbalanced specimens due to luxury consumption or contamination). The accuracy of ML classification models was computed as T N + T P T N + T P + F N + F P . Nutrient standards are derived from nutritionally balanced specimens.

3. Results

3.1. Gain Ratio

The gain ratios are presented in Table 1 and Table 2. The gain ratios in Table 1 varied between 0.037 for K/xD to 0.089 for N/S. The N/S, Mn/xD, N/xD, S/Mn, Ca/S, P/S, Ca/Cu, and S/xD log ratios were the most important features, indicating the central roles of N and S regarding yield classification.
After integrating the dual log ratios, the clr and wlr variables returned similar gain ratios across nutrients (Table 2), indicating the little impact of unequal coefficients on yield classification. The xD ranked first followed by Fe, K, and N. In comparison, the nitrogen ranked first for raw concentrations, followed by xD and S. However, raw concentrations do not account for nutrient interactions and dilution, missing important information on the tissue nutrient status.

3.2. Machine Learning (ML) Classification Models

The AUC-ROC and accuracy of the ML classification models were in the range of 0.7–0.8, whatever the nutrient expression (Table 3). Raw concentration values returned the highest performance for KNN due likely to overfitting attributable to the non-Euclidean geometry of raw concentration values. The clr and wlr variables that account for interactions and have Euclidean geometry returned comparable performance, likely because the gain ratios assigned to the dual log ratios in the wlr expressions were not contrasting enough (Table 1). Gradient Boosting was the most performing ML classification model for both clr and wlr.

3.3. Nutrient Standards by Cultivars

Statistics on nutrient log ratios for the nutritionally balanced specimens (Table 4) showed that the clr variances varied widely among nutrients and cultivars. ‘Kinnow’ showed the highest average variance, and ‘Khasi’, the lowest. There were 125 nutritionally balanced specimens (TN + FN) allowing to compute nutrient standards (means and standard deviations) for the three cultivars. The number of balanced specimens per cultivar was the same for clr and wlr.
The updated values often differed from those reported in the Indian literature (Table 5). The nutrient concentration ranges for mandarin documented in India also lacked S for ‘Nagpur’, ‘Khasi’, and ‘Kinnow’, as well as Ca and Mg for ‘Kinnow’. Several back-transformed clr means are located outside the concentration ranges suggested in India. This is the case for N, K, Ca, Fe, Mn, and Cu for ‘Kinnow’; N, Ca, and Mg for ‘Khasi’; and Mg and Mn for ‘Nagpur’. The nutrient standards elaborated using the present database thus showed that (1) the growing conditions (soil, management, climate) impacted the mineral nutrition of surveyed crops (hence database dependency), and (2) more features should be documented to diagnose tissue nutrients at a local scale.

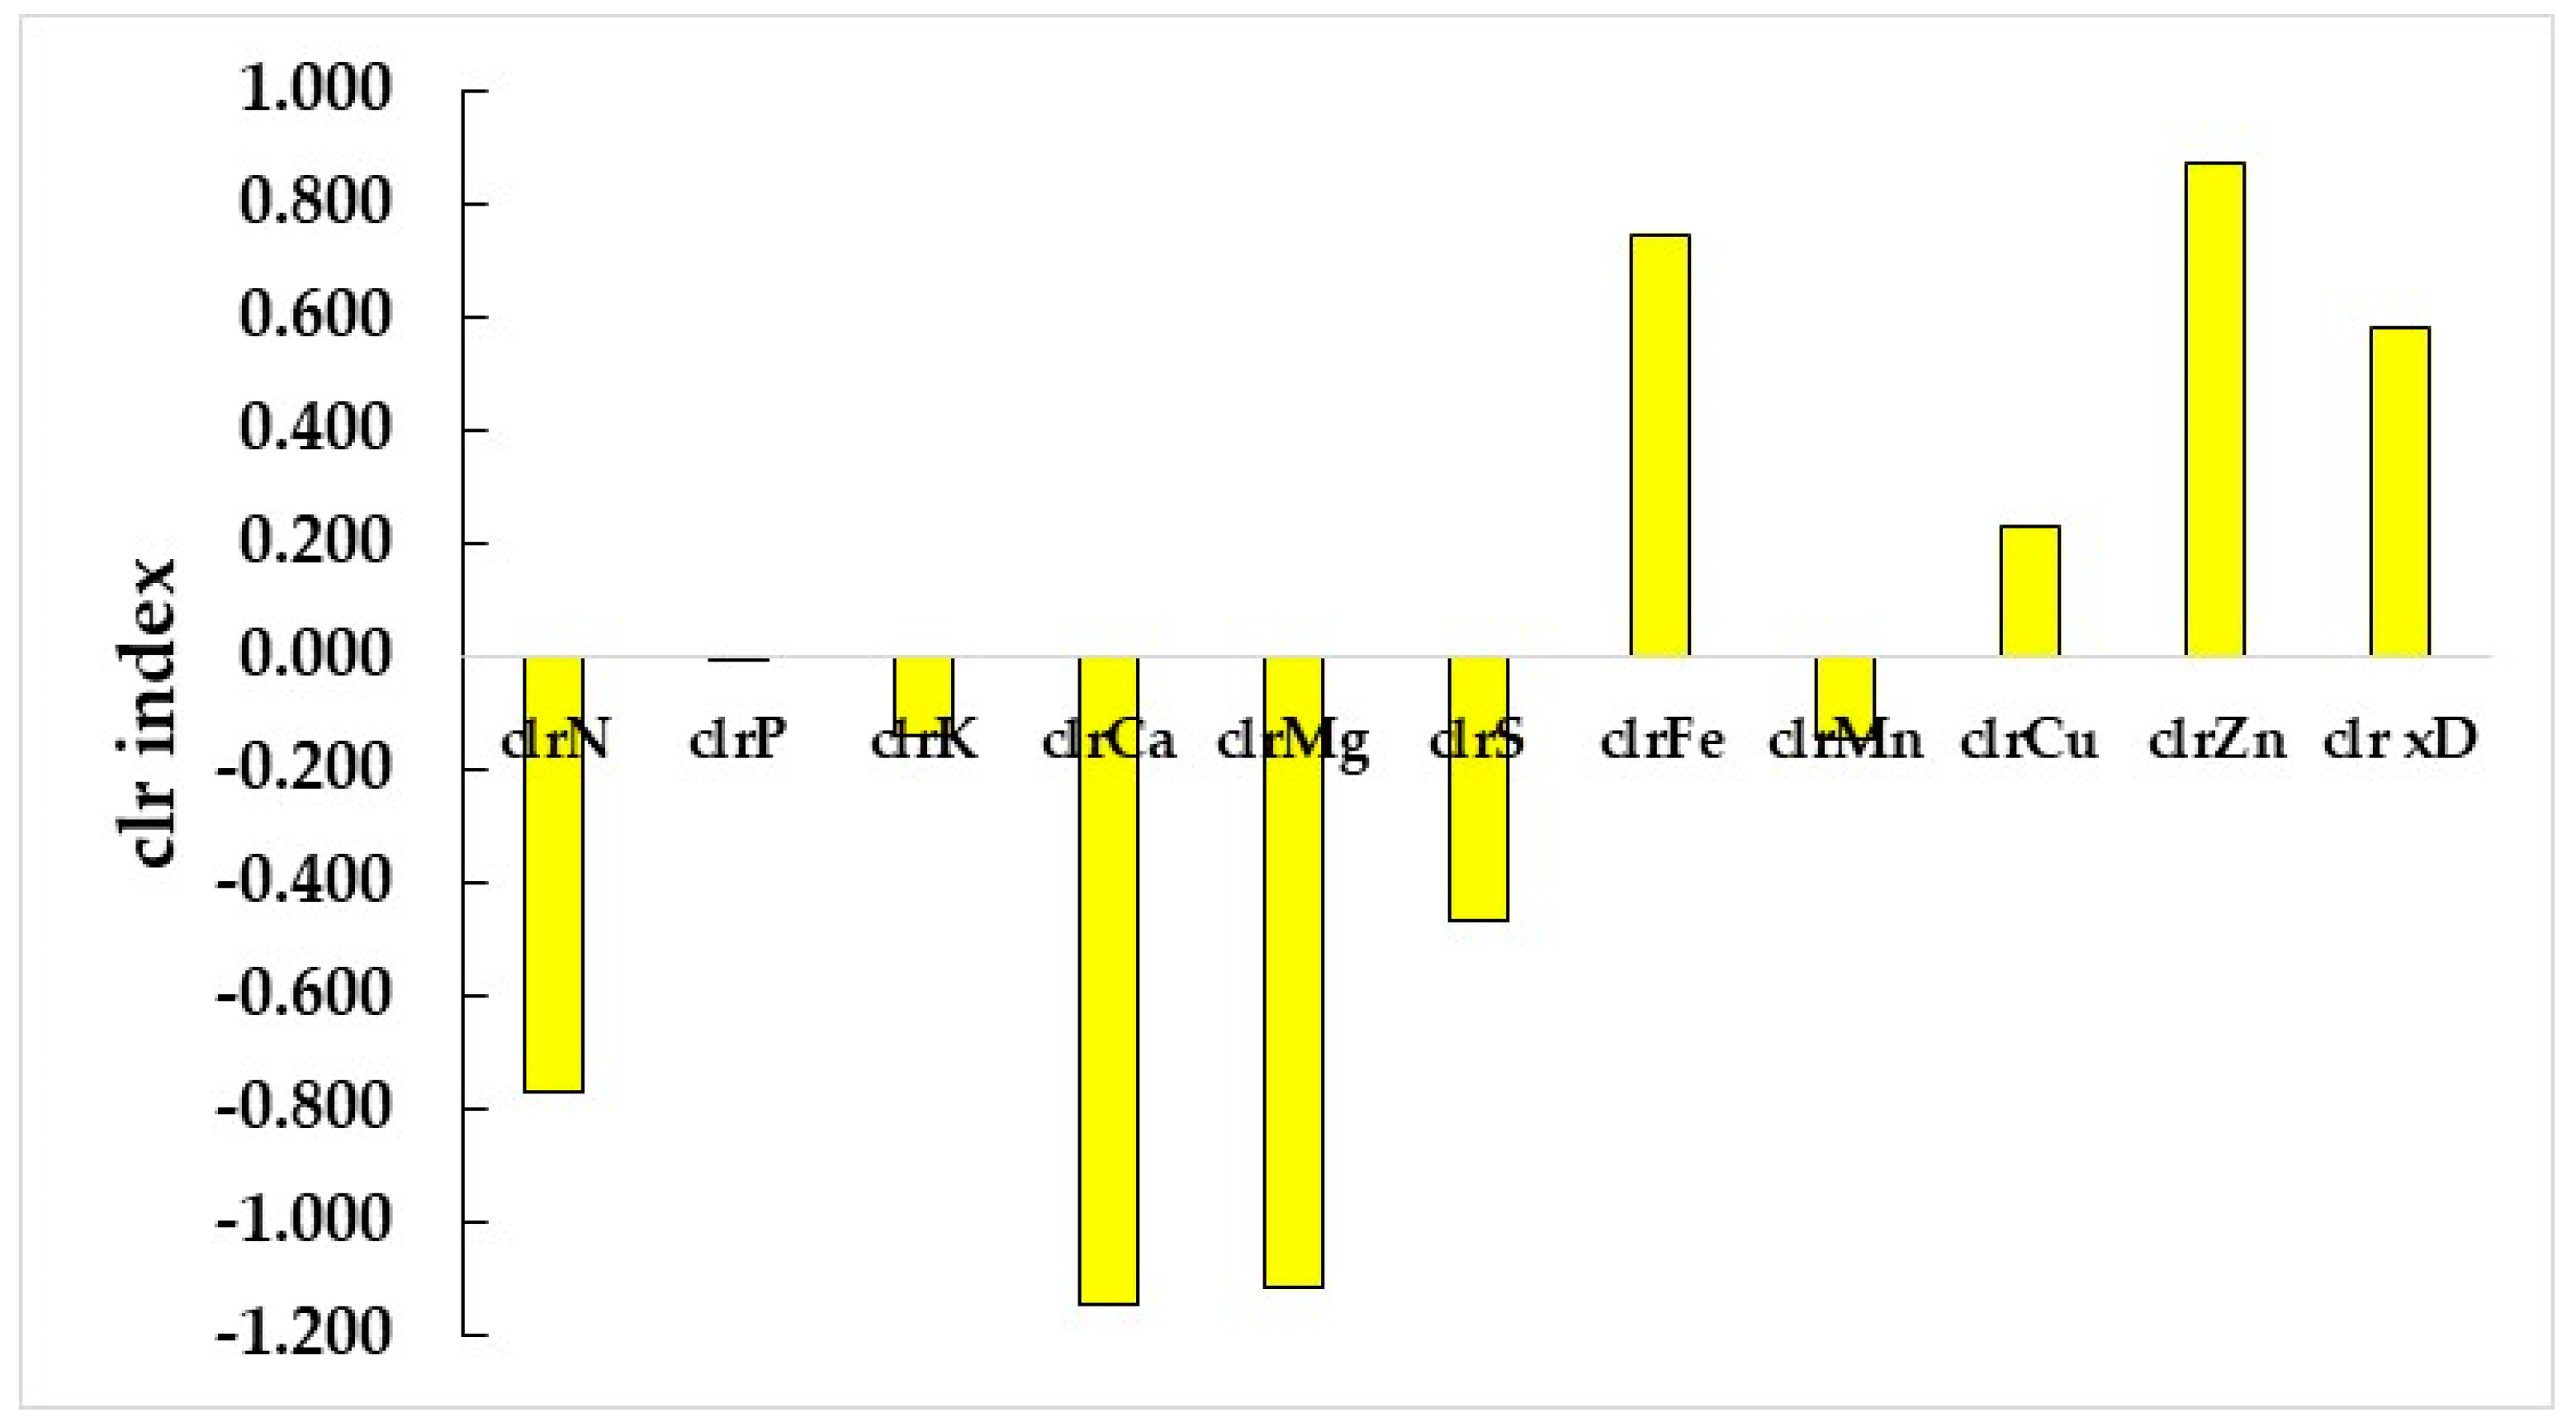
3.4. Nutrient Diagnosis

The median clr values of ‘Kinnow’ TP specimens (low-yielding and nutritionally imbalanced) were diagnosed using the ‘Kinnow’ clr and wlr means and standard deviations (Figure 2). The N, Ca, Mg, and S were in the highest relative shortage while Fe, Zn, and the filling value were in relative excess. Both diagnoses were similar.

4. Discussion

4.1. Model Accuracy

The tissue raw concentration data should be transformed into log ratios because nutrient interactions and nutrient dilution in the biomass that cause ‘resonance’ in the mandarin tissues were not accounted for. Some interaction effects could be handled by the machine learning models [36,37]. Nevertheless, the importance of each nutrient dual log ratio on crop performance may differ widely depending on crop and growing conditions.
The compositional tissue data are linearized using clr variables that are averages of dual log ratios [27]. The clrs are mathematically correct but physiologically uncertain. The concept of wlr [14] used gain ratios as coefficients to differentially weight the dual log ratios in the clr expression. In the present study, unequal weights only slightly improved model accuracy because weights were insufficiently contrasted across dual log ratios.

4.2. Key Nutrients

As shown by the gain ratios associated with their dual log ratios, tissue N and S were shown to be the most important nutrients for the yield classification of mandarins. While deficient N weakens the plant, excess N may reinforce the problem of damage by pests and diseases by enhancing crops’ nutritional quality and attractiveness [38]. On the other hand, S regulates the absorption of cationic micronutrients through cross-talks [20] and interacts with N in the synthesis of amino acids [39]. Nutrients including K, P, Mn, Zn, B, Cl, and Si also contribute to plant defense mechanisms [36,37], impacting crop yield. Interplays between nutrients were shown by multi-nutrient diagnosis (Figure 2).
While nutrient deficiencies could be assessed visually or using web-based images as complementary information, the visual diagnosis is not straightforward because several nutrients are involved simultaneously in the leaf pigment content that affect photosynthesis and crop performance [40]. Indeed, visual symptoms capture a combination of nutrient effects on leaf pigments on a weak nominal scale that may inject error in the predictive ML models. Tissue analytical data have a strong ratio scale often used to confirm uncertain visual assessments.

4.3. Additional Diagnostic Tools

At a regional scale, universality tests [41] could be conducted to verify the capacity of the clr and wlr indices to diagnose nutrient problems reliably from the response to the fertilization of mandarin groves unseen by the ML model. At a local scale, the clr also allows comparing two compositions of equal length (those of abnormal vs. normal plants) under the ceteris paribus assumption on a histogram [27], supporting the interpretation of nutrient imbalance assessed by visual symptoms, spectral analysis, or web-based images.

5. Conclusions

Machine learning classification models were combined with nutrient dual log ratios to diagnose the nutrient status of mandarin groves in India. Gain ratios were combined with dual log ratios to reflect their differential importance on the performance of mandarins. In contrast with raw concentrations, the wlr and clr variables account for nutrient interactions and dilution in the tissue biomass.
The Gradient Boosting classification model was the most performing ML classification model about cultivar-specific yield cutoffs. The accuracy of the Gradient Boosting classification model was only slightly enhanced using wlr compared to clr.
Nutrient balance standards were proposed for mandarin cultivars in relation with yield classification. In a case study, clr and wlr diagnoses returned similar results and showed the multidimensional nature of nutrient imbalance. Indeed, nutrients should not be diagnosed in isolation. Although not part of this study, universality tests could be conducted at a field scale to verify models’ capacity to generalize.
The present paper focused on tissue analysis in relation to crop productivity. Nutrient standards elaborated from the database were compared to the nutrient standards commonly used in India. Missing nutrient standards were documented. In future studies, the challenge will be to combine HLB management and crop fertilization of mandarin concomitantly to reduce fertilizer applications while maintaining high yields in a sustainable manner through the reinforcement of structural and chemical defense mechanisms. It remains to be a matter of future strategic research whether such nutrient standards developed for HLB-free orchards are equally effective when implemented under HLB-infected mandarin orchards. Adding more features will require more resources and more observational and experimental data to solve the complexity of crop nutrition.

Supplementary Materials

The following supporting information can be downloaded at: https://www.mdpi.com/article/10.3390/horticulturae11030254/s1.

Author Contributions

Conceptualization, A.H. and L.-E.P.; resources, V.Z.; data curation, A.K.S. and A.H.; writing—original draft preparation, A.K.S., L.-E.P. and S.K.M.; writing—review and editing, A.K.S., L.-E.P., S.K.M., V.Z. and L.K.B.; visualization, A.K.S.; supervision, A.K.S.; project administration, A.K.S. All authors have read and agreed to the published version of the manuscript.

Funding

The work was carried out by ICAR-Central Citrus Research Institute, Nagpur, Maharashtra, India, through in-house projects without any external funding.

Data Availability Statement

The original contributions presented in the study are included in the article and supplementary material, further inquiries can be directed to the corresponding author.

Acknowledgments

Authors are thankful to the Indian Council of Agricultural Research, New Delhi, India, and Central Institute of Citrus Research, Nagpur, Maharashtra, India, for facilitating this study during the implementation of in-house projects.

Conflicts of Interest

The authors declare no competing interests.

References

  1. Uzun, A.; Yesiloglu, T. Genetic Diversity in Citrus. Chap 11. In Genetic Diversity in Plants; Çalişkan, M., Ed.; InTech: Rijeka, Croatia, 2012. [Google Scholar]
  2. FAO. Statistical Year Book of Food and Agricultural Organization; FAO: Rome, Italy, 2023; pp. 108–113. [Google Scholar]
  3. Malik, S.K.; Rohini, M.R.; Kumar, S.; Choudhary, R.; Par, D.; Chaudhury, R. Assessment of Genetic Diversity in Sweet Orange [Citrus sinensis (L.) Osbeck] Cultivars of India Using Morphological and RAPD Markers. Agric. Res. 2012, 1, 317–324. [Google Scholar] [CrossRef]
  4. Dubey, A.; Singh, A. Evaluation of rootstocks of different mandarins (Citrus reticulata) under foot-hills conditions of Arunachal Pradesh. J. Agric. Sci. 2003, 73, 527–529. [Google Scholar]
  5. Singh, S.; Singh, J.; Mirza, A. Evaluation of mandarin cultivars on different rootstocks-a review. Int. J. Curr. Microbiol. Appl. Sci. 2019, 8, 1213–1222. [Google Scholar] [CrossRef]
  6. Bhatnagar, P.; Singh, J.; Singh, Y. Biodiversity of Citrus Fruits. Nat. Sem. Smart Horti. 2020, 329–334. [Google Scholar]
  7. Srivastava, A.K.; Singh, S. Citrus nutrition in India: Current status and future strategies. Indian J. Agric. Sci. 2008, 78, 3–16. [Google Scholar]
  8. Srivastava, A.K.; Singh, S. DRIS norms and their validation in Nagpur mandarin (Citrus reticulata Blanco). J. Plant Nutri. 2008, 31, 1091–1107. [Google Scholar] [CrossRef]
  9. Srivastava, A.K.; Singh, S.; Albrigo, L.G. Diagnosis and remediation of nutrient constraints in citrus. Hort. Rev. 2008, 34, 277–363. [Google Scholar]
  10. Srivastava, A.K.; Singh, S. Soil analysis based diagnostic norms for Indian Citrus cultivars. Commun. Soil Sci. Plant Anal. 2002, 33, 1689–1706. [Google Scholar] [CrossRef]
  11. Ahmad, N.; Hussain, S.; Ali, M.A.; Minhas, A.; Waheed, W.; Danish, S.; Fahad, S.; Ghafoor, U.; Baig, K.S.; Sultan, H.; et al. Correlation of soil characteristics and citrus leaf nutrients contents in current scenario of Lyyah district. Horticulturae 2022, 8, 61. [Google Scholar] [CrossRef]
  12. Raghupathi, H.B.; Ganeshamurthy, A.N.; Ravishankar, H. Comparison of DRIS ratio norms of selected fruit crops. Indian J. Hort. 2014, 71, 168–175. [Google Scholar]
  13. Rymbai, H.; Deshmukh, N.A.; Ramesh, T.; Verma, V.K.; Baiswar, P.; Mawlein, J.; Talang, H.D.; Dutta, S.K.; Choudhury, B.U.; Hazarika, S.; et al. DRIS standards for identifying yield-limiting nutrients in Khasi Mandarin and their relationship with fruit yield on acidic soil of the eastern Himalayas, India. J. Plant Nutri. 2024, 47, 1331–1346. [Google Scholar] [CrossRef]
  14. Parent, L.E. Compositional and machine learning tools to model plant nutrition: Overview and perspectives. Horticulturae 2025, 11, 161. [Google Scholar] [CrossRef]
  15. Yamane, D.R.; Parent, S.-É.; Natale, W.; Cecílio Filho, A.B.; Rozane, D.E.; Nowaki, R.H.D.; Mattos Junior, D.d.; Parent, L.E. Site-Specific Nutrient Diagnosis of Orange Groves. Horticulturae 2022, 8, 1126. [Google Scholar] [CrossRef]
  16. Ulrich, A.; Hills, F.J. Principles and practices of plant analysis. In Soil Testing and Plant Analysis, Part II; Stelly, M., Hamilton, H., Eds.; Soil Science Society of America: Madison, WI, USA, 1967; pp. 359–387. [Google Scholar]
  17. Sharma, L.D.; Singh, S.K.; Oinam, N.; Das, H.; Sarkar, A.; Singh, L.B.; Choudhury, R.; Anal, H.J.; Bhupenchandra, I.; Sadhukhan, R. Citrus nutrition in India-A snapshot of up-to-date progress. Anal. Plant Soil Res. 2024, 26, 372–386. [Google Scholar] [CrossRef]
  18. Wilkinson, S.R.; Grunes, D.L.; Sumner, M.E. Nutrient interactions in soil and plant nutrition. In Handbook of Soil Science; Sumner, M.E., Ed.; CRC Press: Boca Raton, FL, USA, 2000; pp. D89–D112. [Google Scholar]
  19. Fageria, N.K.; Baligar, V.C. Improving nutrient use efficiency of annual crops in Brazilian acid soils for sustainable crop. Commun. Soil Sci. Plant Anal. 2001, 32, 1303–1319. [Google Scholar] [CrossRef]
  20. Courbet, G.; Gallardo, K.; Vigani, G.; Brunel-Muguet, S.; Trouverie, J.; Salon, C.; Qurry, A. Disentangling the complexity and diversity of crosstalk between sulfur and other mineral nutrients in cultivated plants. J. Expt. Bot. 2019, 70, 4183–4196. [Google Scholar] [CrossRef]
  21. Parent, S.É. Why We should use balances and machine learning to diagnose ionomes. Authorea 2020, 10. [Google Scholar] [CrossRef]
  22. Parent, S.E. Compositional and machine learning tools to manage plant nutrition: A reiew with examples. Horticulturae, 2025; in review. [Google Scholar]
  23. Reetika; Rana, G.S.; Komal; Kumar, S.; Saini, P. Influence of foliar sprays of nutrients on yields and yield-accrediting characters of kinnow mandarin; a review. Agric. Rev. 2020, 41, 297–302. [Google Scholar]
  24. Huchche, A.D.; Ram, L.; Srivastava, A.K.; Kohli, R.R.; Dass, H.C. Evaluation of the nutritional status of Nagpur mandarin (Citrus reticulata Blanco ) by foliar sampling. Trop. Agric. 1999, 72, 93–98. [Google Scholar]
  25. Chapman, H.D.; Pratt, P.F. Methods of Analysis of Soils, Plants, and Waters; University of California, Division of Agriculture Sciences: Oakland, CA, USA, 1978; pp. 82–96. [Google Scholar]
  26. Greenacre, M. Compositional data analysis. Annu. Rev. Stat. Its Appl. 2021, 8, 271–299. [Google Scholar] [CrossRef]
  27. Aitchison, J. The Statistical Analysis of Compositional Data; Chapman and Hall: London, UK, 1986. [Google Scholar]
  28. Jarrel, W.M.; Beverly, R.B. The dilution effect in plant nutrition studies. Adv. Agron. 1981, 34, 197–223. [Google Scholar]
  29. Chayes, F. Correlation between variables of constant sum. J. Geophys. Res. 1960, 65, 4185–4193. [Google Scholar] [CrossRef]
  30. Steel, R.G.D.; Torrie, J.H. Principles and Procedures of Statistics. A Biometricla Approach; McGraw-Hill: New-York, NY, USA, 1997. [Google Scholar]
  31. Kenworthy, A.L. Plant analysis and interpretation of analysis for horticultural crops. In Soil Testing and Plant Analysis, Part II; Stelly, M., Hamilton, H., Eds.; Soil Science Society of America: Madison, WI, USA, 1967; pp. 59–75. [Google Scholar]
  32. Greenacre, M.; Gunsky, E.; Bacon-Shone, J.; Erb, I.; Quinn, T. Aitchison’s Compositional Data Analysis 40 Years On: A Reappraisal. Stat. Sci. 2023, 38, 386–410. [Google Scholar] [CrossRef]
  33. Lagatu, H.; Maume, L. Le diagnostic foliaire de la pomme de terre. Ann. L’Ecole Natl. D’Agronomie Montp. 1934, 22, 50–158. [Google Scholar]
  34. Beaufils, E.R. Diagnosis and recommendation integrated system (DRIS). In Soil Science Bulletin 132; University of Natal: Pietermaritzburg, South Africa, 1973. [Google Scholar]
  35. Walworth, J.L.; Sumner, M.E. The Diagnosis and Recommendation Integrated System (DRIS). Adv. Soil Sci. 1987, 6, 149–188. [Google Scholar] [CrossRef]
  36. Chlningaryan, A.; Sukkarieh, S.; Whelan, B. Machine learning approaches for crop yield prediction and nitrogen status estimation in precision agriculture: A review. Comput. Electron. Agric. 2018, 151, 61–69. [Google Scholar] [CrossRef]
  37. Huynh-Thu, V.A.; Geurts, P. Unsupervised Gene Network Inference with Decision Trees and Random Forests. In Gene Regulatory Networks; Methods in Molecular Biology; Sanguinetti, G., Huynh-Thu, V., Eds.; Humana Press: New York, NY, USA, 2019; Volume 1883. [Google Scholar]
  38. Martinez, D.A.; Loening, U.E.; Graham, M.C.; Gathorne-Hardy, A. When the medicine feeds the problem; Do nitrogen fertilizers and pesticides enhance the nutritional quality of crops for their pests and pathogens? Front. Sustain. Food Syst. 2021, 5, 701310. [Google Scholar] [CrossRef]
  39. Marschner, H. Mineral Nutrition of Higher Plants; Academic Press: Boston, MA, USA, 1986. [Google Scholar]
  40. Liu, S.; Yang, X.; Guan, Q.; Lu, Z.; Lu, J. An ensemble modeling framework for distinguishing nitrogen, phosphorous and potassium deficiencies in winter oilseed Rape (Brassica napus L.) using hyperspectral data. Remote Sens. 2020, 12, 4060. [Google Scholar] [CrossRef]
  41. Sinclair, T.R.; Seligman, N. Criteria for publishing papers on crop modeling. Field Crops Res. 2000, 8, 165–172. [Google Scholar] [CrossRef]
Figure 1. Mandarin belts along a south (humid tropical) to north (arid) climatic gradient in India. AERs stand for agroecological regions.
Horticulturae 11 00254 g001
Figure 2. Histogram of clr indices for the median clr values of ‘Kinnow’ true positive specimens. The N, K, Ca, Mg, S, and Mn were in relative excess while Fe and Zn as well as the filling value were in relative shortage.
Horticulturae 11 00254 g002aHorticulturae 11 00254 g002b
Table 1. Gain ratio for dual log nutrient ratios in the Mandarin database from India. xD = filling value to the measurement unit.
Log RatioGain RatioLog RatioGain RatioLog RatioGain RatioLog RatioGain RatioLog RatioGain Ratio
N/P0.072P/Ca0.054K/Fe0.052Ca/xD0.044S/xD0.080
N/K0.042P/Mg0.059K/Mn0.048Mg/S0.056Fe/Mn0.057
N/Ca0.051P/S0.082K/Cu0.059Mg/Fe0.046Fe/Cu0.058
N/Mg0.050P/Fe0.073K/Zn0.055Mg/Mn0.062Fe/Zn0.056
N/S0.080P/Mn0.074K/xD0.037Mg/Cu0.075Fe/xD0.061
N/Fe0.066P/Cu0.078Ca/Mg0.048Mg/Zn0.054Mn/Cu0.063
N/Mn0.089P/Zn0.062Ca/S0.085Mg/xD0.053Mn/Zn0.056
N/Cu0.076P/xD0.062Ca/Fe0.064S/Fe0.070Mn/xD0.087
N/Zn0.059K/Ca0.053Ca/Mn0.058S/Mn0.085Cu/Zn0.055
N/xD0.086K/Mg0.049Ca/Cu0.081S/Cu0.072Cu/xD0.079
P/K0.058K/S0.059Ca/Zn0.061S/Zn0.062Zn/xD0.060
Table 2. Gain ratio for nutrient expressions as raw concentrations, clr and wlr.
FeatureConcentrationclrwlr
Gain ratio
N0.0460.0090.009
P0.0090.0030.003
K0.0100.0110.011
Ca0.0090.0020.002
Mg0.0130.0070.007
S0.0170.0060.006
Fe0.0160.0170.017
Mn0.0140.0040.004
Cu0.0150.0030.003
Zn0.0030.0000.000
xD0.0190.0210.021
Table 3. Performance of the machine learning classification models.
ModelConcentrationclrwlr
AUC-ROCAccuracyAUC-ROCAccuracyAUC-ROCAccuracy
K-Nearest Neighbors (KNNs)0.7700.8120.7360.7530.7360.753
Support Vector Machine (SVM)0.7450.7960.7210.7960.7170.796
Random Forest0.7880.7980.7430.7750.7450.796
Naïve Bayes0.7400.7390.6800.7040.6800.704
Gradient Boosting0.7860.7810.7780.8000.7780.802
Table 4. Nutrient ranges as clr or wlr variables between lower and upper quarters for nutritionally balanced mandarins.
Component‘Nagpur’‘Khasi’‘Kinnow’‘Nagpur’‘Khasi’‘Kinnow’
Number of Specimens463940463940
Centered Log-Ratio (clr) StandardsWeighted Log-Ratio (wlr) Standards
N2.755 ± 0.2142.874 ± 0.1282.895 ± 0.1943.024 ± 0.2353.161 ± 0.1403.184 ± 0.213
P−0.177 ± 0.242−0.577 ± 0.522−0.277 ± 0.381−0.199 ± 0.266−0.635 ± 0.574−0.305 ± 0.419
K2.265 ± 0.4382.402 ± 0.1552.036 ± 0.5322.512 ± 0.4812.643 ± 0.1702.240 ± 0.586
Ca2.627 ± 0.4082.382 ± 0.4112.955 ± 0.1422.885 ± 0.2022.620 ± 0.4523.251 ± 0.156
Mg0.591 ± 0.2180.313 ± 0.5370.895 ± 0.1980.641 ± 0.2390.344 ± 0.5910.985 ± 0.217
S0.931 ± 0.5300.635 ± 0.2810.753 ± 0.2971.032 ± 0.5830.699 ± 0.3100.828 ± 0.326
Fe−2.745 ± 0.488−2.203 ± 0.215−3.088 ± 0.547−3.009 ± 0.537−2.423 ± 0.237−3.375 ± 0.602
Mn−3.632 ± 0.444−3.068 ± 0.193−3.275 ± 0.528−4.002 ± 0.488−3.375 ± 0.212−3.603 ± 0.581
Cu−4.858 ± 0.394−5.195 ± 0.320−4.804 ± 0.972−5.370 ± 0.434−5.714 ± 0.352−5.284 ± 1.069
Zn−4.211 ± 0.331−4.128 ± 0.213−4.494 ± 0.934−4.591 ± 0.364−4.541 ± 0.234−4.944 ± 1.027
xD6.453 ± 0.1256.565 ± 0.0936.384 ± 0.1677.098 ± 0.1377.221 ± 0.1027.023 ± 0.183
Average variance0.1370.0990.2760.1660.1200.334
Table 5. Nutrient concentrations (g kg−1) between lower and upper quarters for nutritionally balanced specimens of mandarin oranges.
ComponentBack-Transformed clr MeansLiterature
‘Nagpur’‘Khasi’‘Kinnow’‘Nagpur’ §‘Khasi’ §‘Kinnow’ †
N23.226.126.617–2819.6–25.622.8–25.3
P1.20.81.10.8–1.50.8–1.01.1–1.5
K14.216.311.310.1–25.99.8–19.313.4–15.7
Ca20.415.928.317.9–32.819.6–24.9-
Mg2.72.03.64.2–9.22.3–4.8-
S3.72.83.1---
Fe0.0950.1630.0680.075–0.1130.084–0.2490.082–0.103
Mn0.0390.0680.0560.055–0.0850.042–0.0880.038–0.041
Cu0.0110.0080.0120.010–0.0180.002–0.0140.005–0.010
Zn0.0220.0240.0160.014–0.0300.016–0.0270.015–0.022
§ Sharma et al. [17]; Srivastava and Singh [7,8]; † Srivastava et al. [9].
Disclaimer/Publisher’s Note: The statements, opinions and data contained in all publications are solely those of the individual author(s) and contributor(s) and not of MDPI and/or the editor(s). MDPI and/or the editor(s) disclaim responsibility for any injury to people or property resulting from any ideas, methods, instructions or products referred to in the content.

