
Quality Characteristics and Color Formation Mechanism of Low Chilling Requirement Sweet Cherry (Prunus avium L.) Cultivars in Southeast China


Abstract
:1. Introduction
2. Materials and Methods
2.1. Plant Materials
2.2. Fruit Color, Weight and Size
2.3. Total Soluble Solids, VC and Total Protein Content, Gibberellin and Brassinolide
2.4. Contents of Soluble Sugar and Organic Acid
2.5. Extraction and Analysis of Anthocyanin Components
2.6. Real-Time Quantitative PCR Analysis of Gene Expression
2.7. Analysis of WGCNA
2.8. Statistical Analysis
3. Results
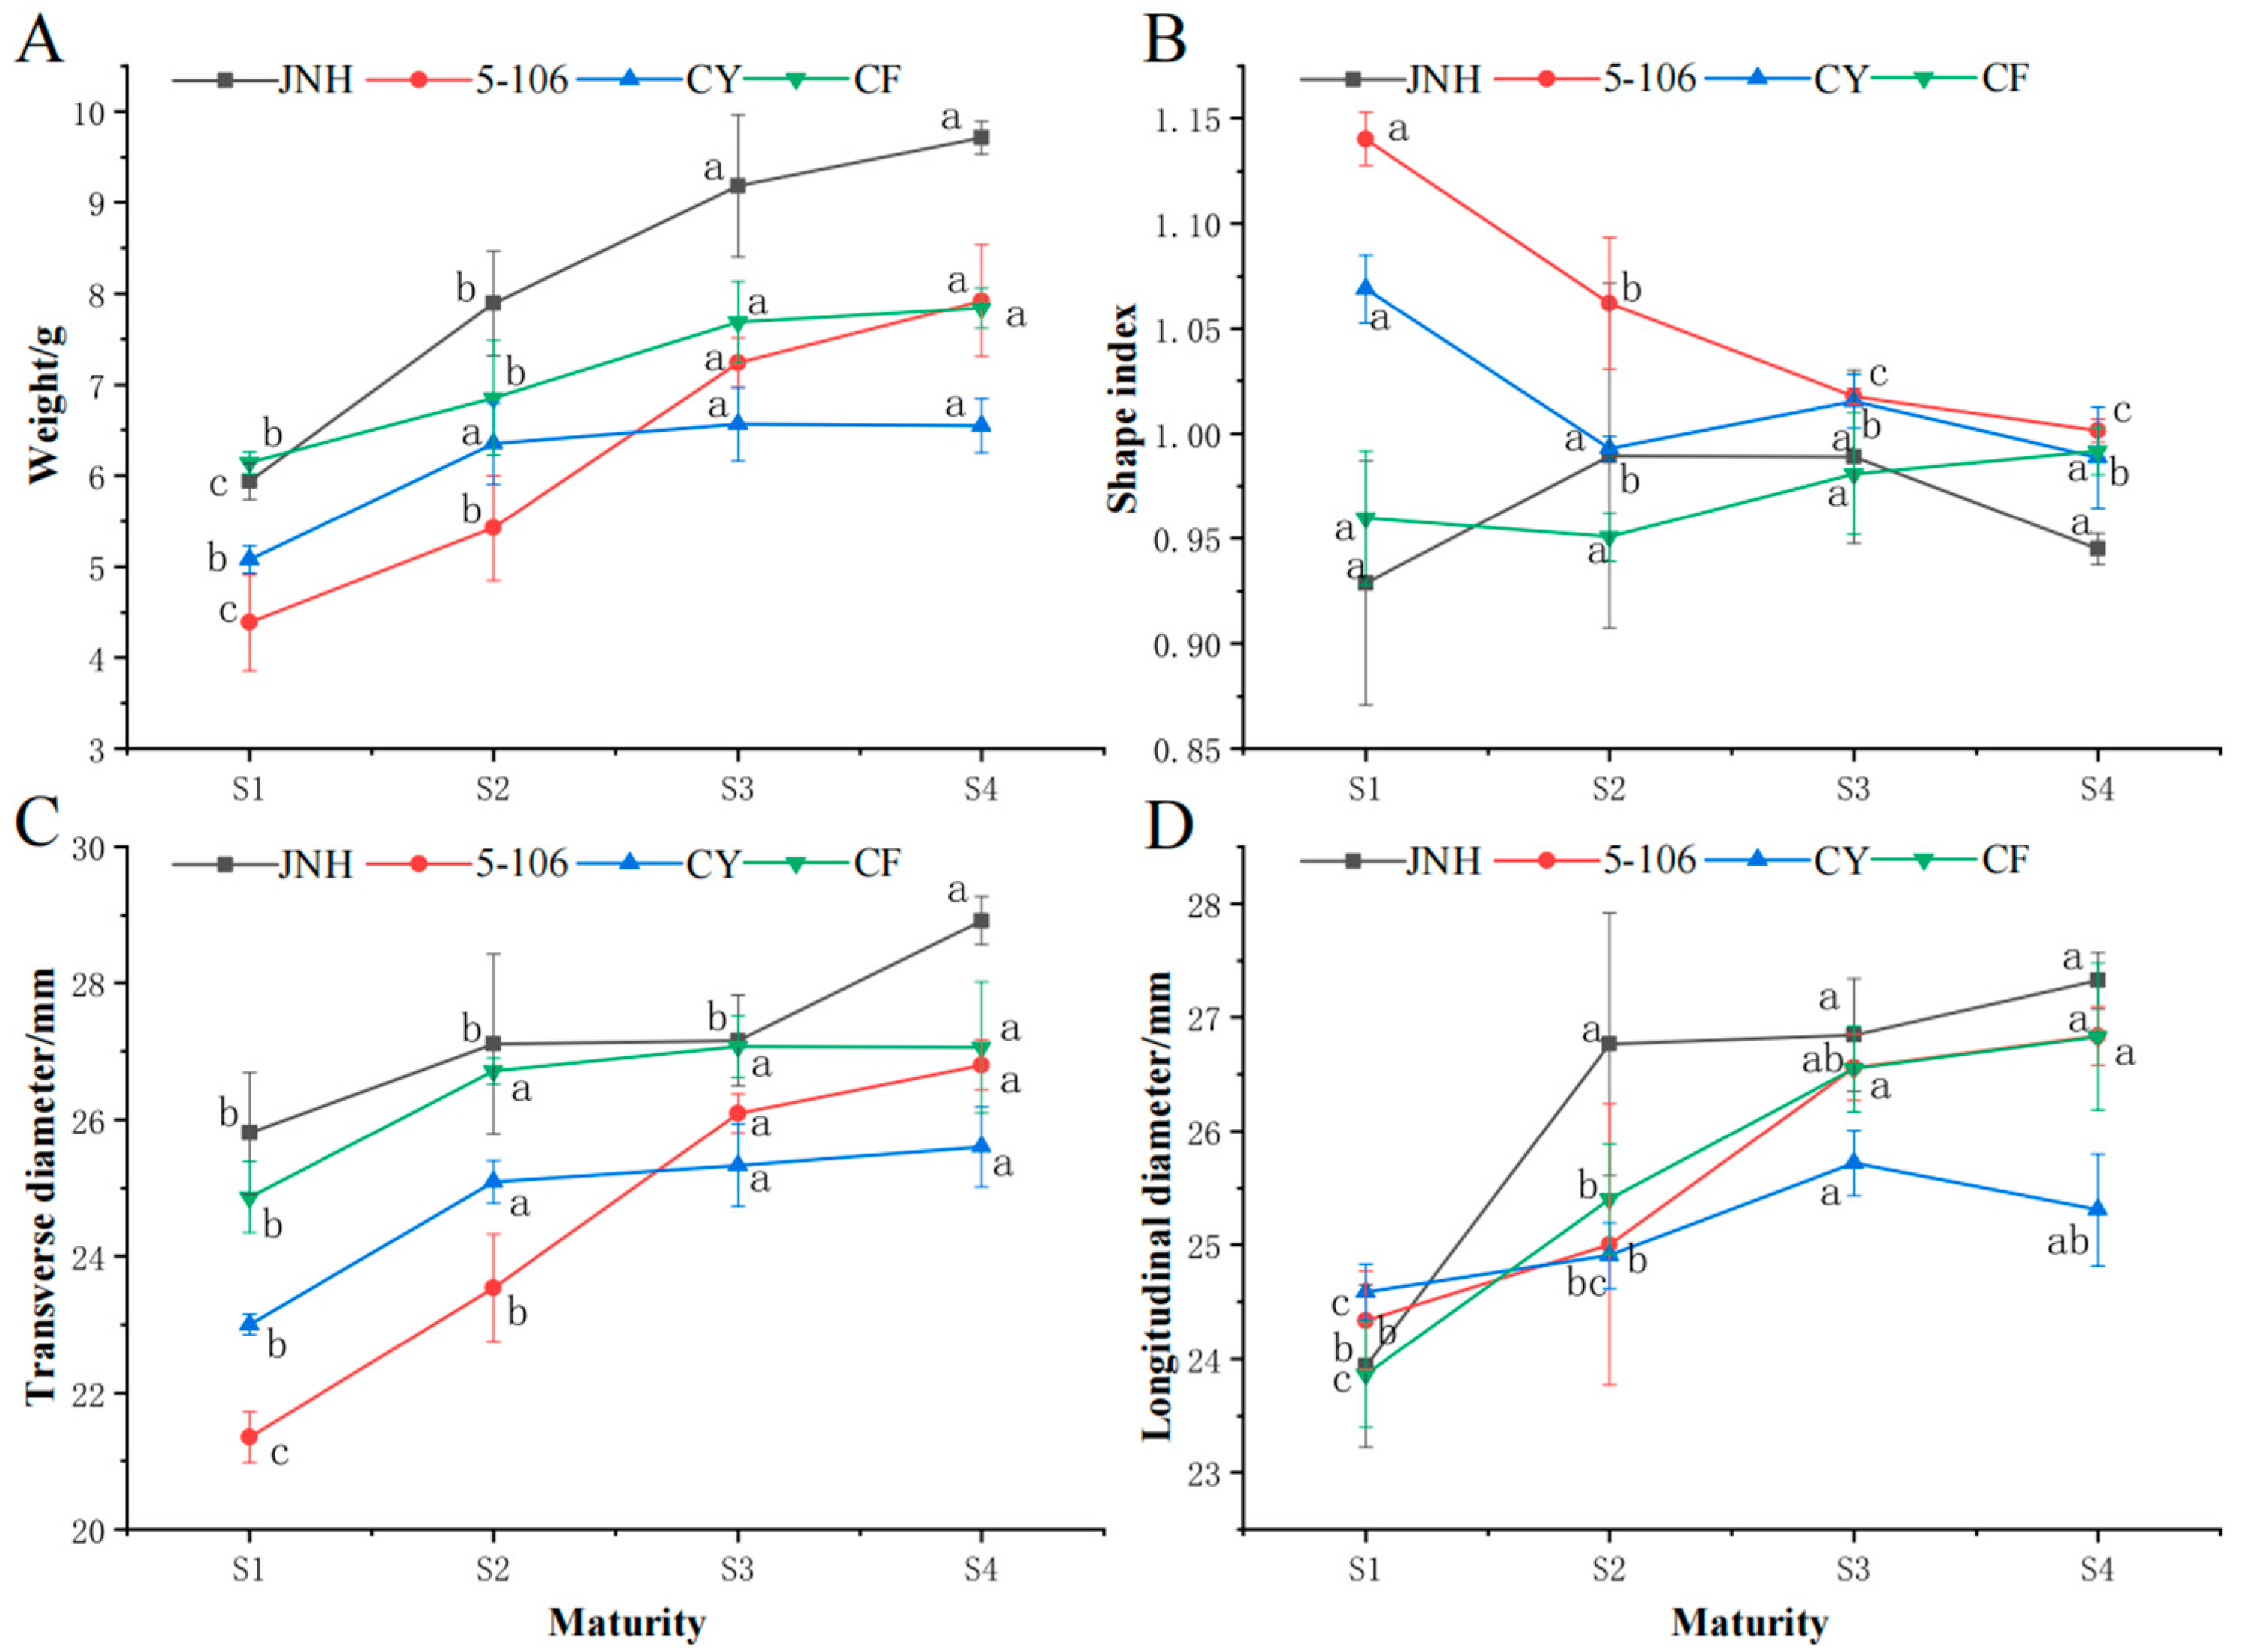
3.1. Fruits Shape
3.2. Fruits Color
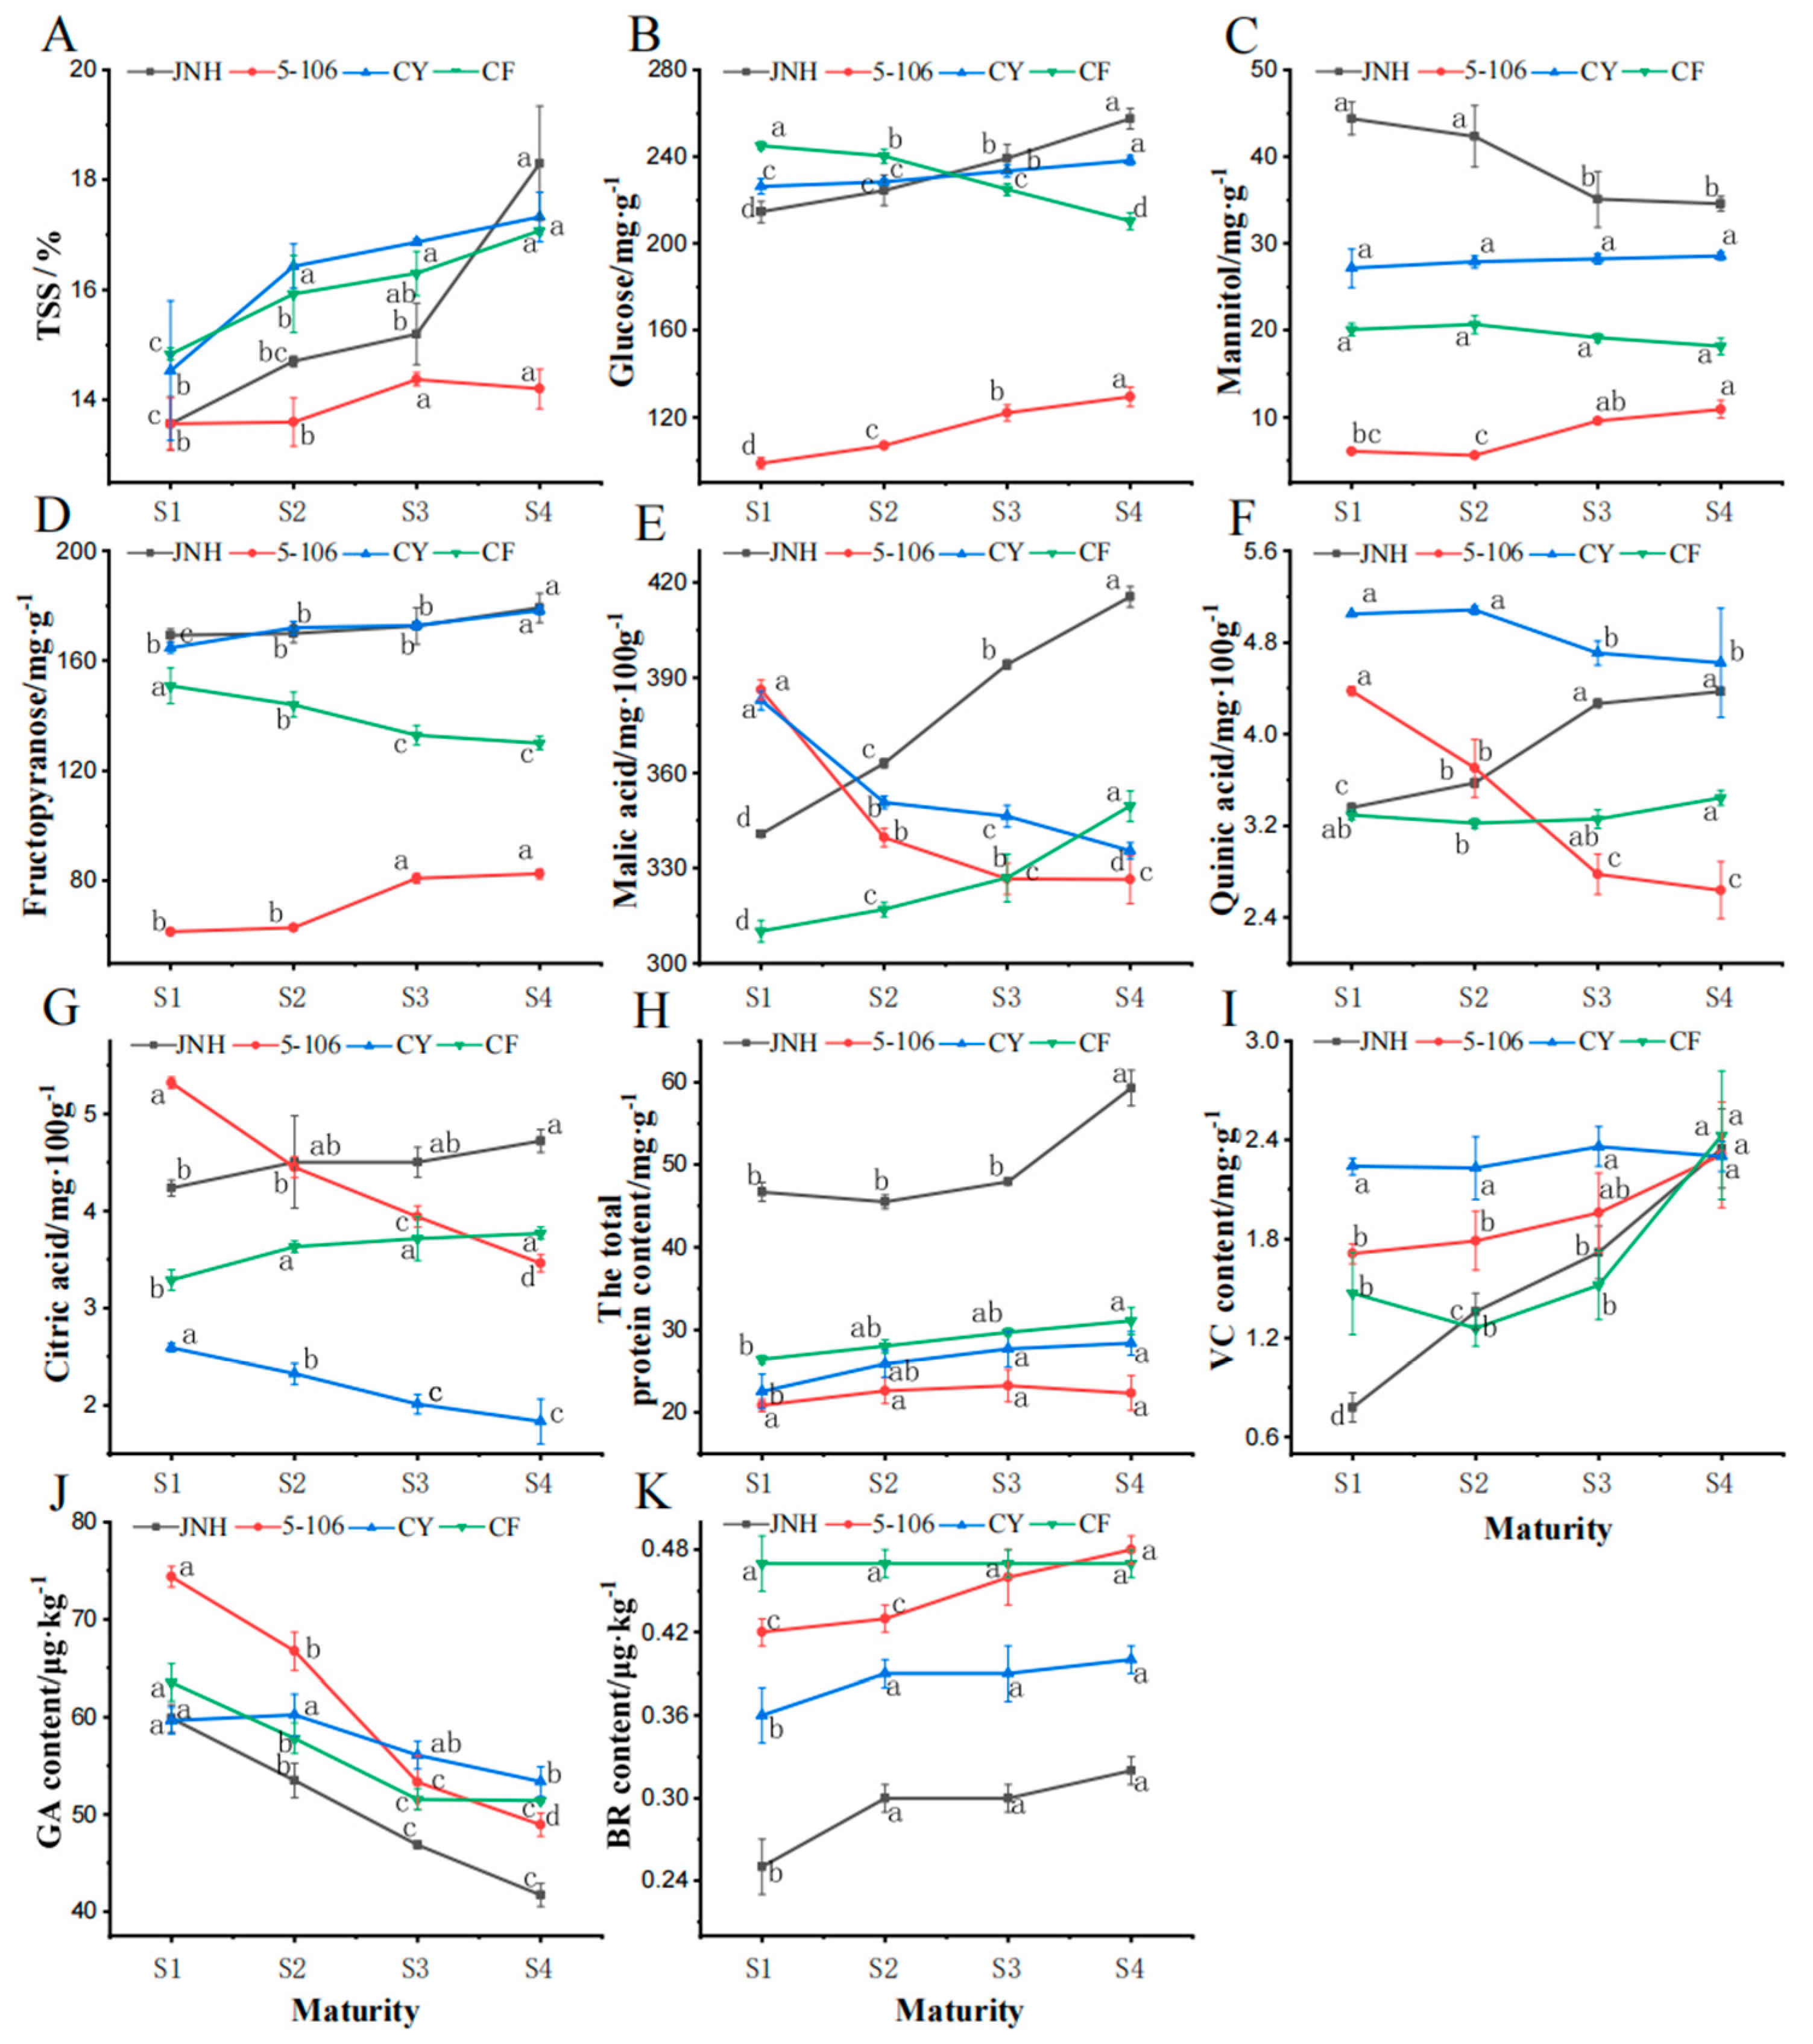
3.3. Fruits Quality
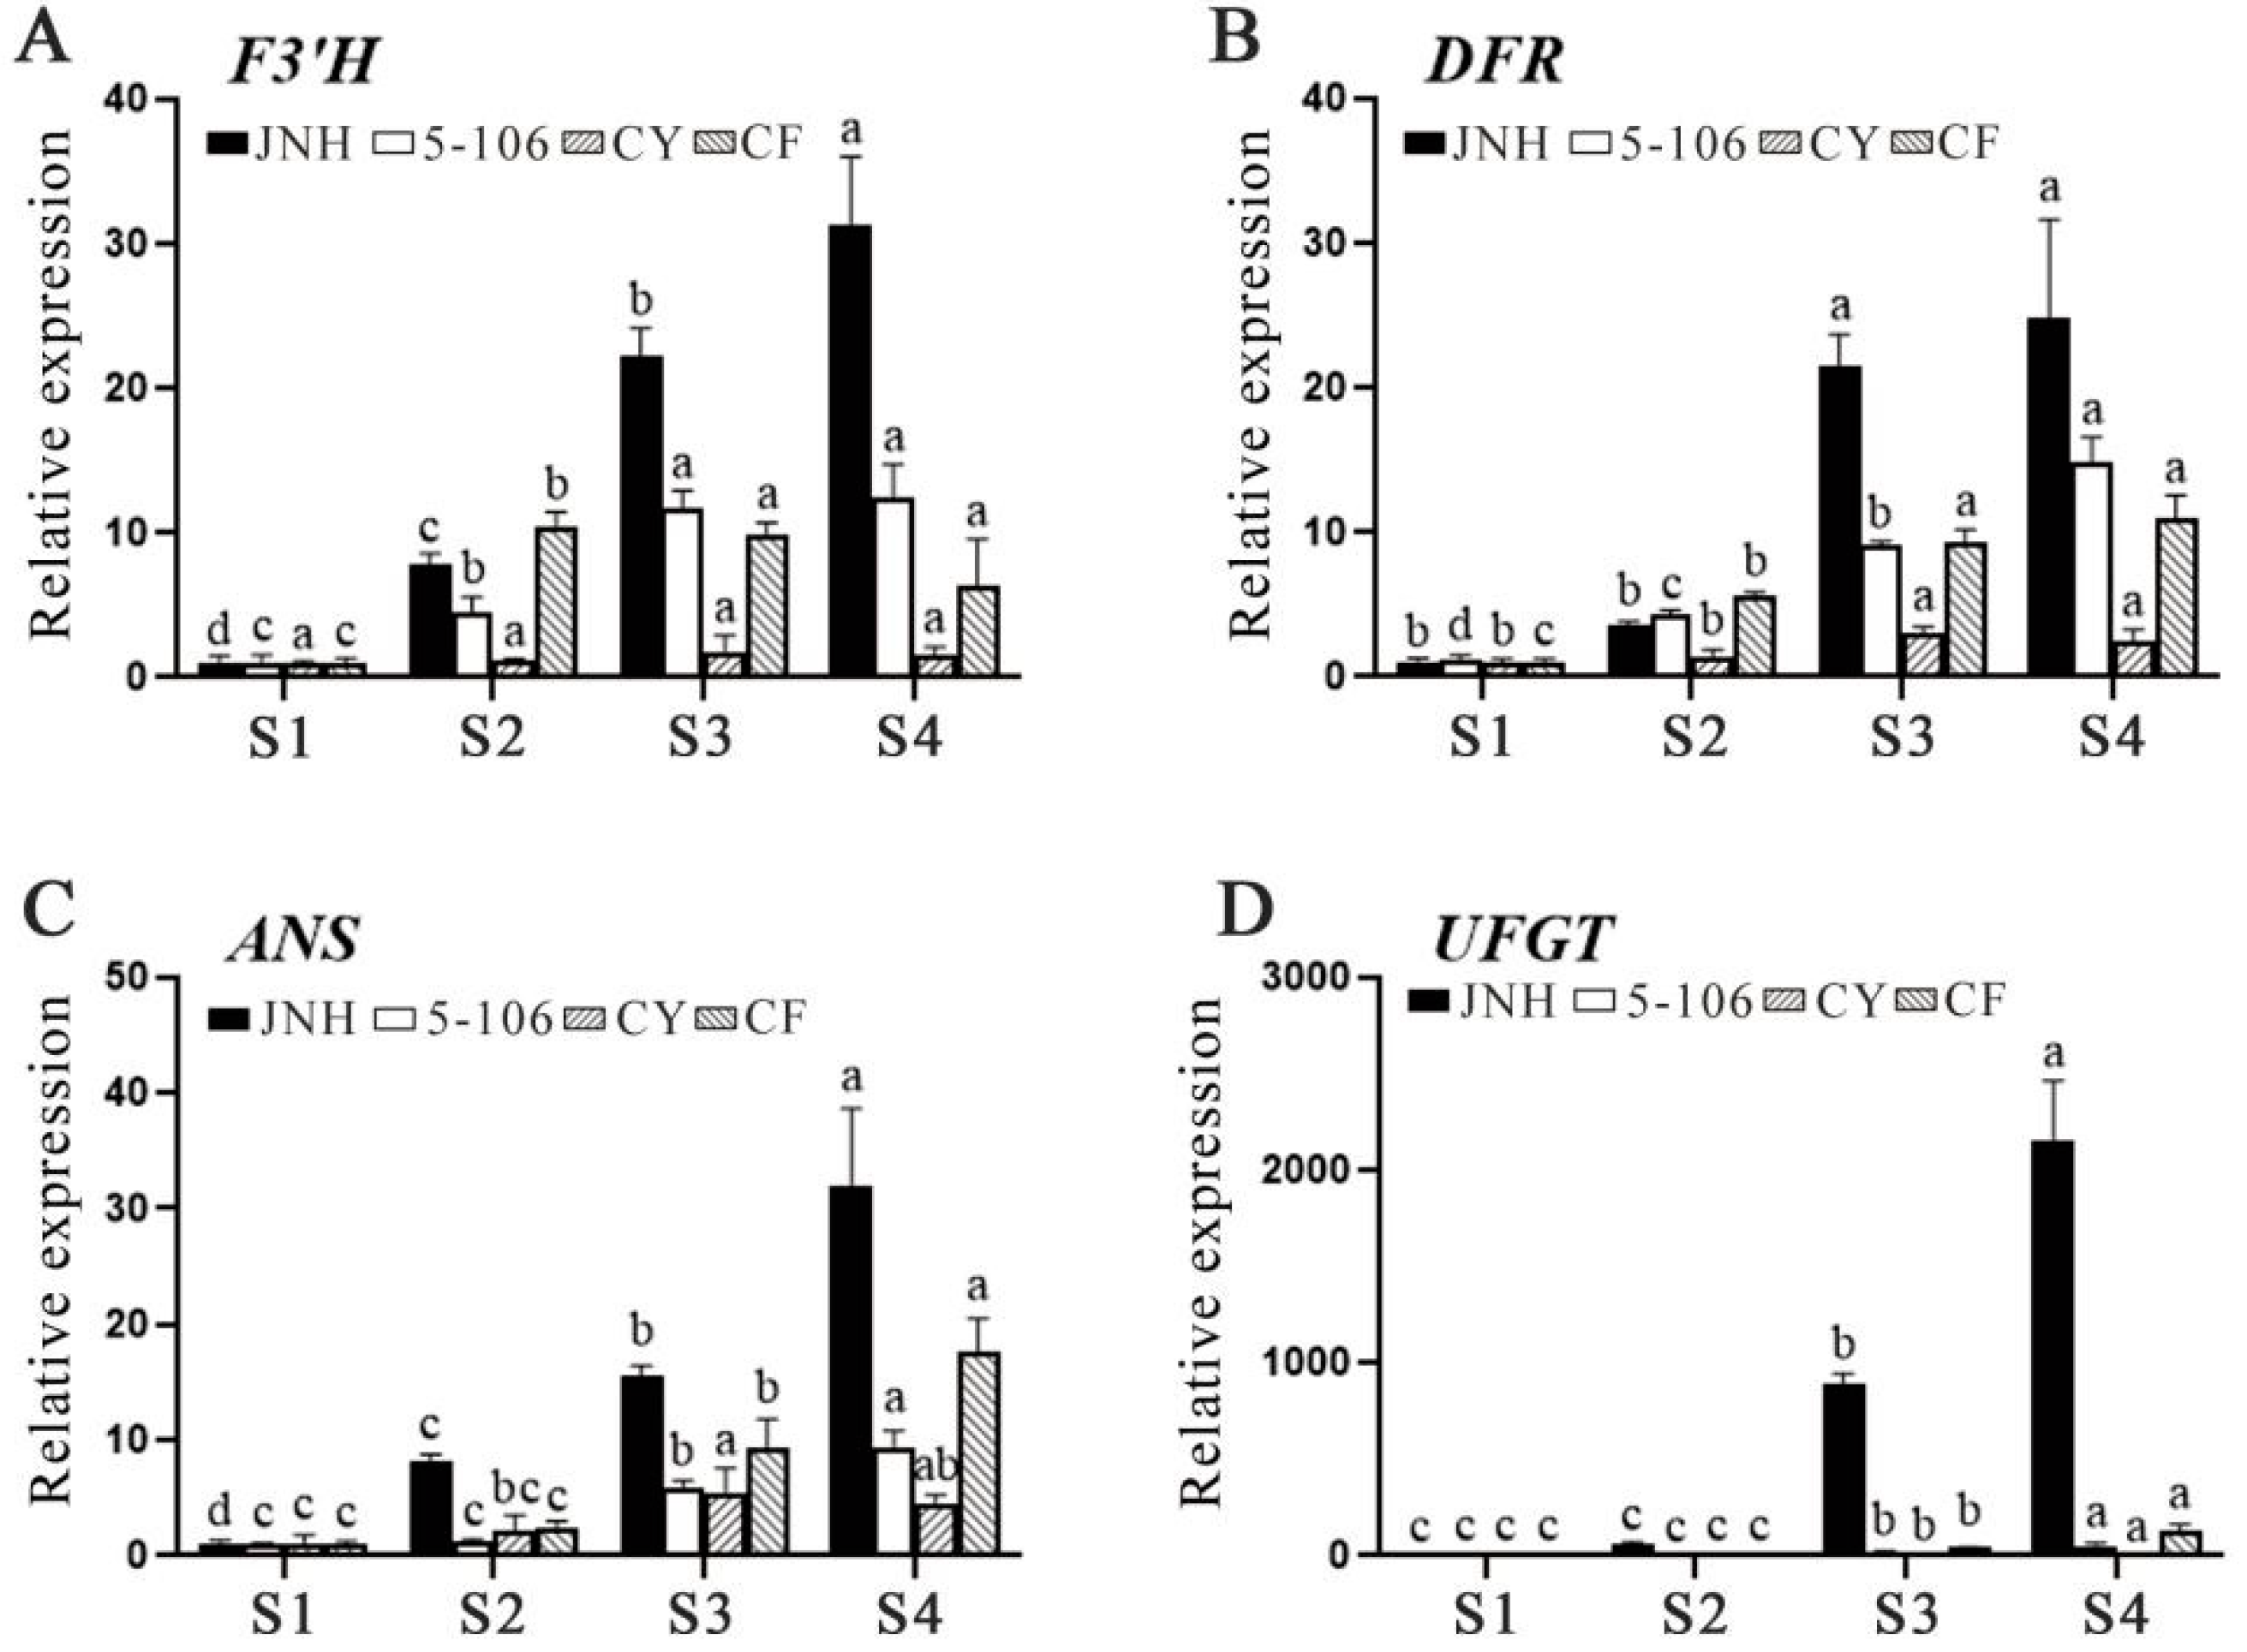
3.4. Determination of Anthocyanin Components
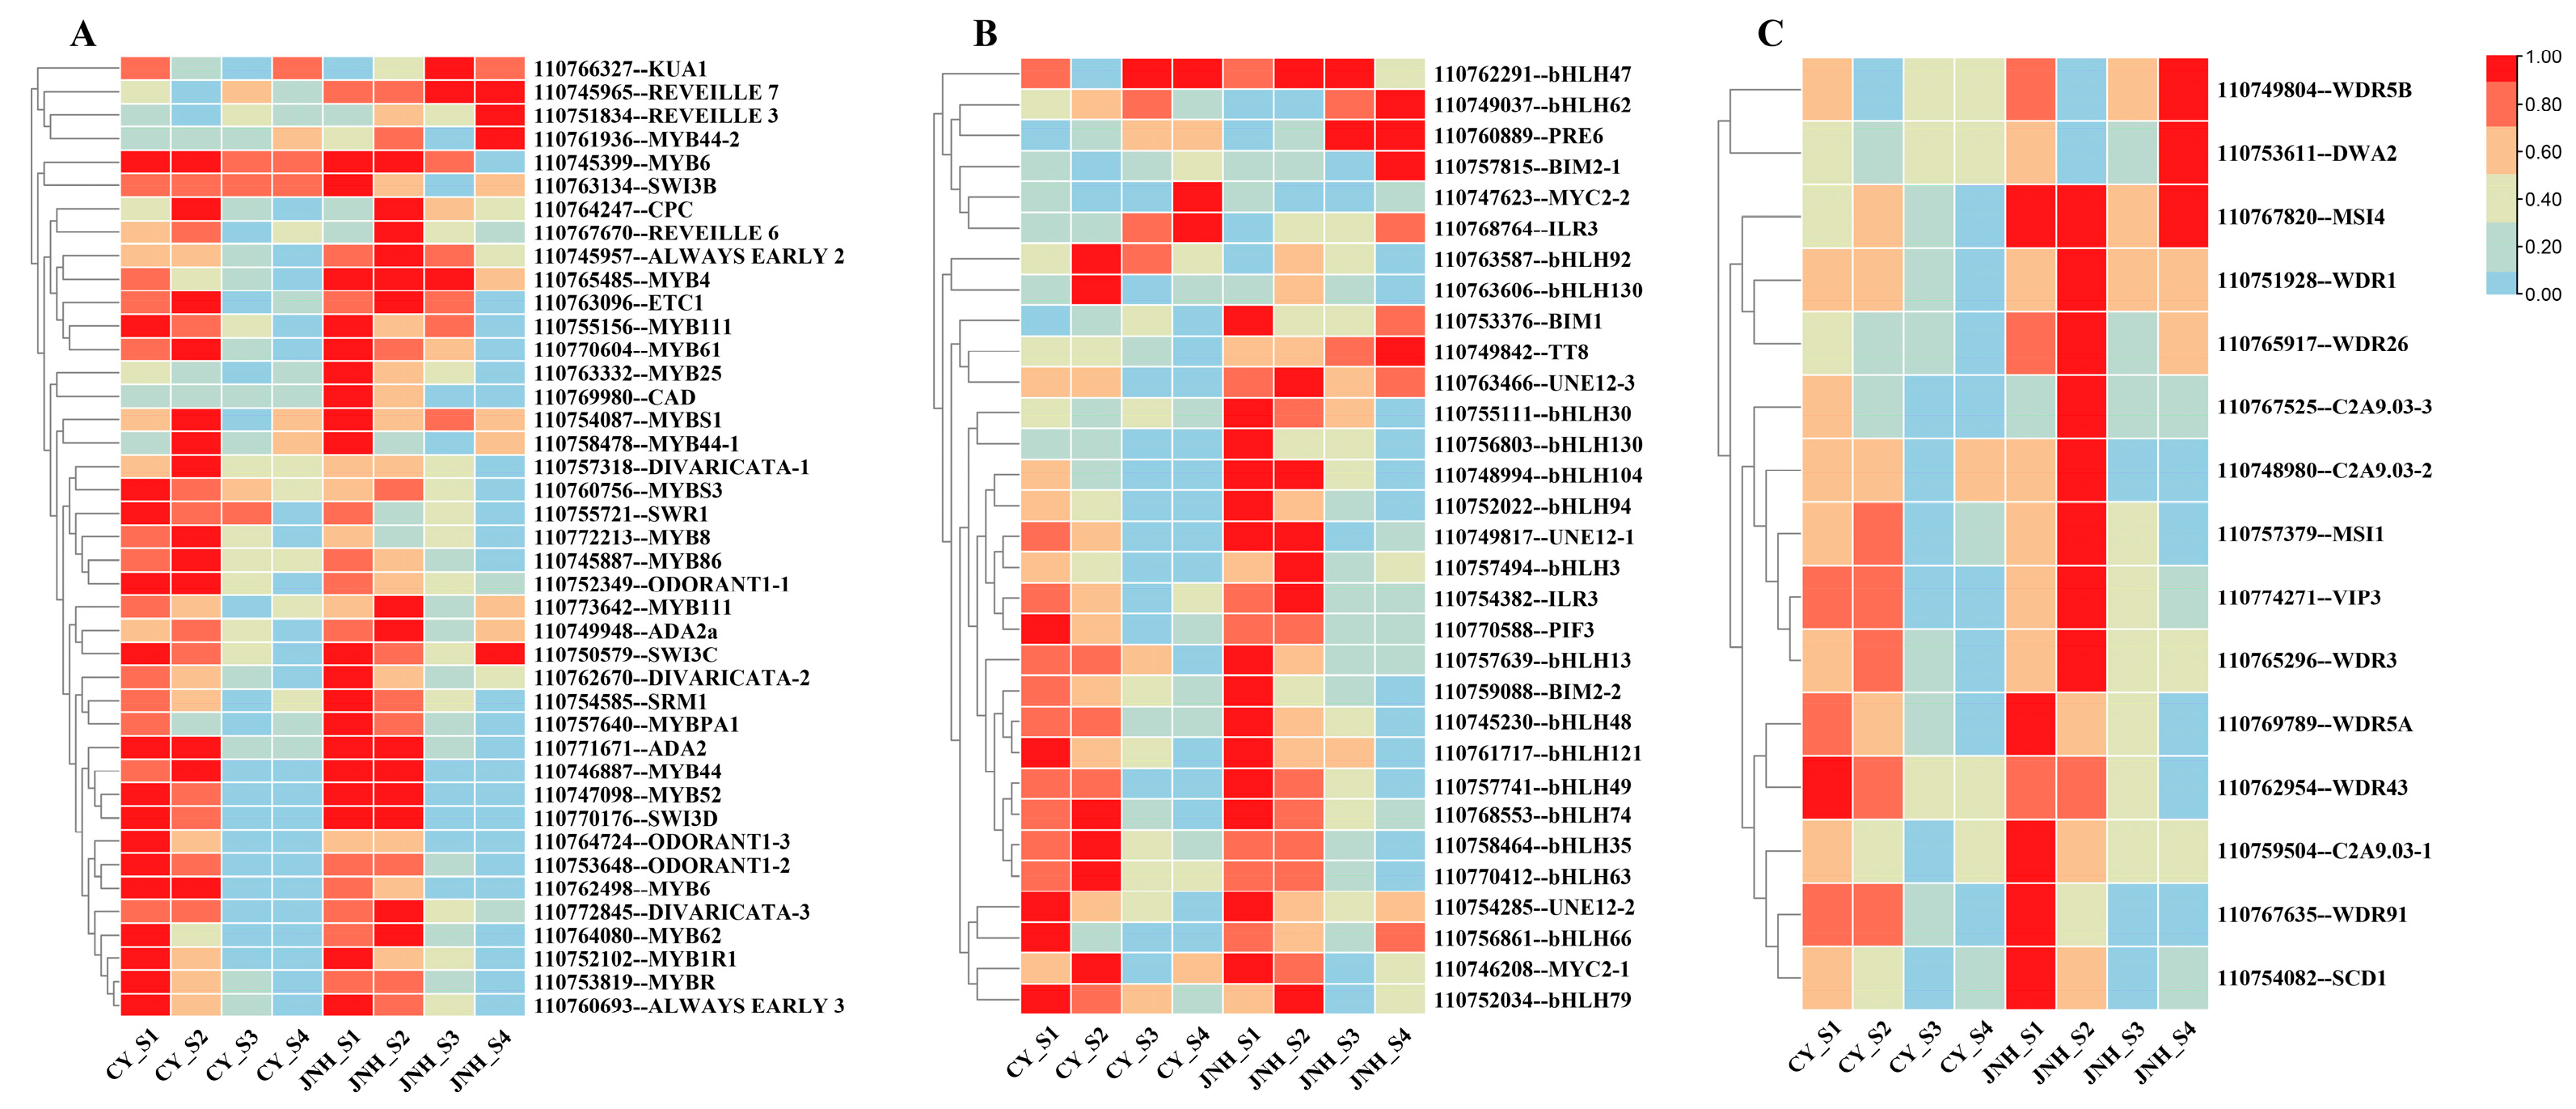
3.5. Differential Transcription Factor of Sweet Cherry Fruit
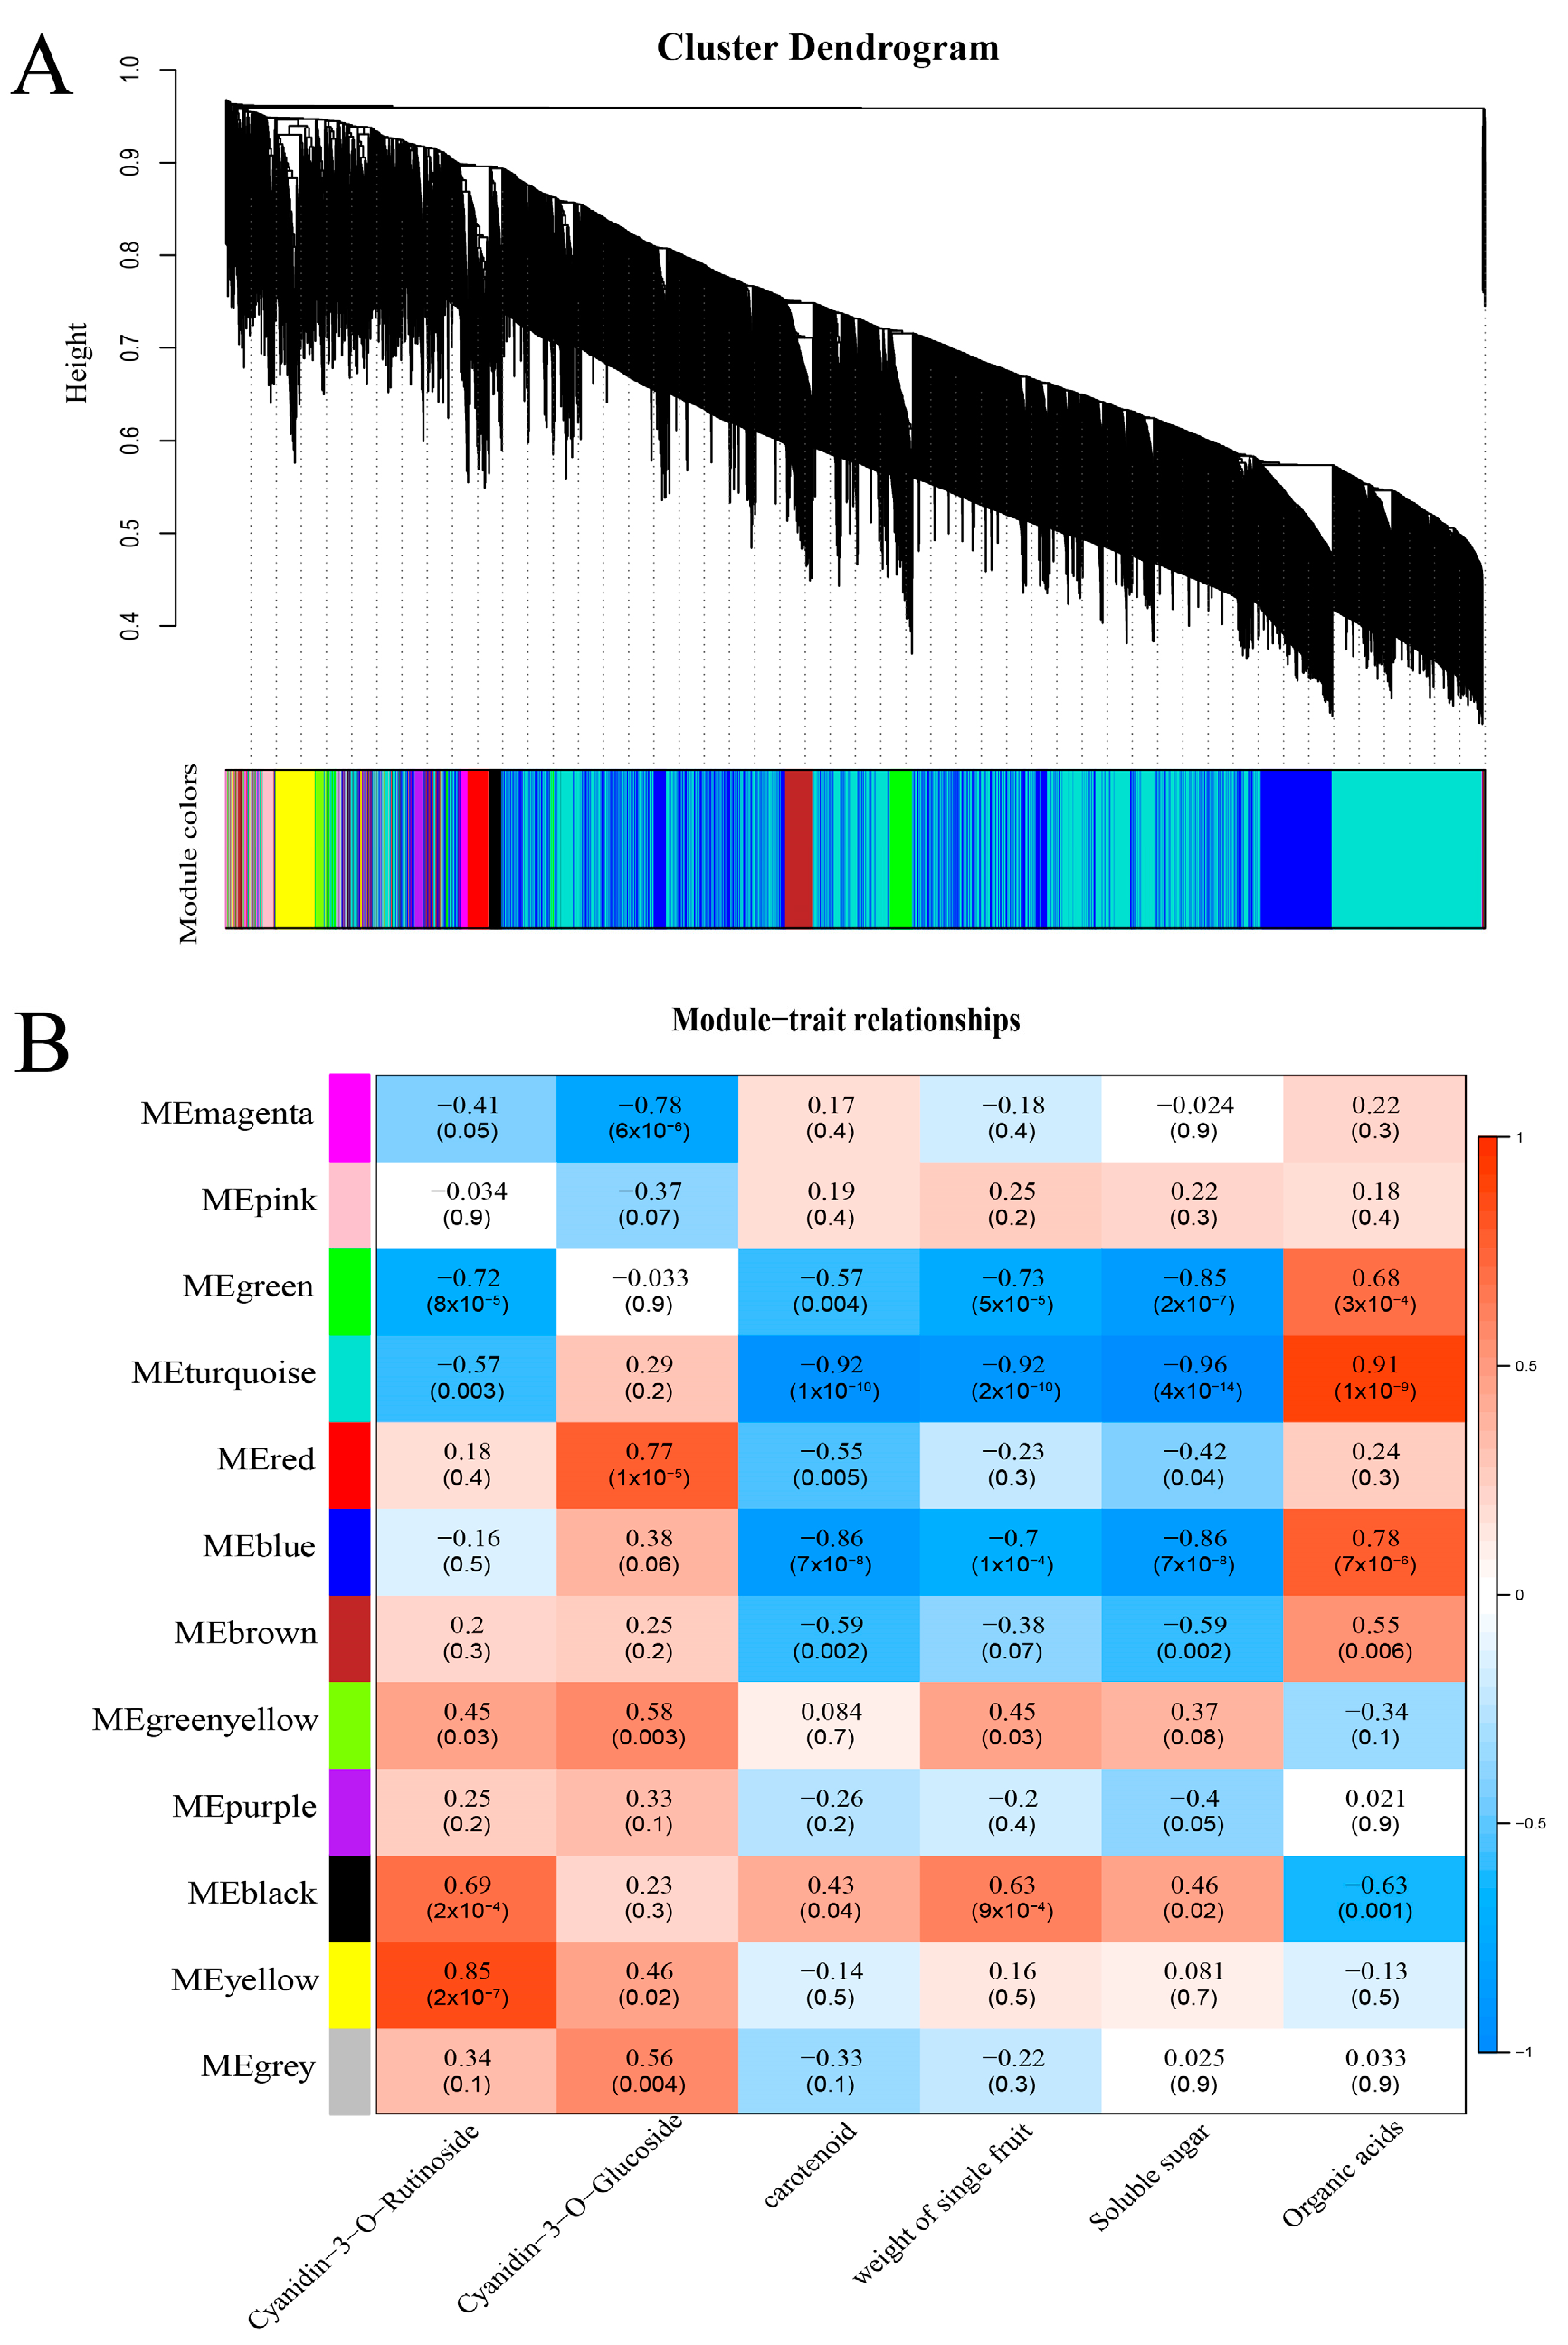
3.6. Screening Key Candidate Genes Based on WGCNA
4. Discussion
4.1. Difference in Fruit Quality Between Red and Yellow Cultivars
4.2. Quality Indexes During the Development of Sweet Cherry Fruit
4.3. PaMYB, PabHLH and PaWD40 Candidate Involved in Fruit Quality
5. Conclusions
Supplementary Materials
Author Contributions
Funding
Data Availability Statement
Conflicts of Interest
References
- Irfan, A.S.; Liu, X.J.; Jiu, S.T.; Matthew, W.; Zhang, C.X. Plant growth regulators modify fruit set, fruit quality, and return bloom in sweet cherry. HortScience 2021, 56, 922–931. [Google Scholar]
- Eda, H.; Mehmet, S.A. The effect of different electrolyzed water treatments on the quality and sensory attributes of sweet cherry during passive atmosphere packaging storage. Postharvest Biol. Technol. 2015, 102, 32–41. [Google Scholar]
- Byers, T.; Perry, G. Dietary carotenes, vitamin C, and vitamin E as protective antioxidants in human cancers. Annu. Rev. Nutr. 1992, 12, 139–159. [Google Scholar] [CrossRef]
- Leong, S.Y.; Oey, I. Effects of processing on anthocyanins, carotenoids and vitamin C in summer fruits and vegetables. Food Chem. 2012, 133, 1577–1587. [Google Scholar] [CrossRef]
- Leong, S.Y.; Burritt, D.J.; Hocquel, A.; Penberthy, A.; Oey, I. The relationship between the anthocyanin and vitamin C contents of red-fleshed sweet cherries and the ability of fruit digests to reduce hydrogen peroxide-induced dxidative stress in Caco-2 cells. Food Chem. 2017, 227, 404–412. [Google Scholar] [CrossRef] [PubMed]
- Wang, L.; Zhang, C.X.; Huang, J.C.; Zhu, L.N.; Yu, X.M.; Li, J.F.; Ma, C. Hydrogen cyanamide improves endodormancy release and blooming associated with endogenous hormones in ‘Summit’ sweet cherry trees. N. Z. J. Crop Hortic. Sci. 2017, 45, 14–18. [Google Scholar] [CrossRef]
- Lv, J.H.; Dong, T.Y.; Zhang, Y.P.; Ku, Y.; Zheng, T.; Jia, H.F.; Fang, J.G. Metabolomic profiling of brassinolide and abscisic acid in response to high-temperature stress. Plant Cell Rep. 2022, 41, 935–946. [Google Scholar] [CrossRef]
- Colaric, M.; Veberic, R.; Stampar, F.; Hudina, M. Evaluation of peach and nectarine fruit quality and correlations between sensory and chemical attributes. J. Sci. Food Agric. 2005, 85, 2611–2616. [Google Scholar] [CrossRef]
- Cho, Y.H.; Yoo, S.D. Signaling role of fructose mediated by FINS1/FBP in Arabidopsis thaliana. PLoS Genet. 2011, 7, e1001263. [Google Scholar] [CrossRef]
- Adamczak, A.; Ożarowski, M.; Karpiński, T.M. Antibacterial activity of some flavonoids and organic acids widely distributed in plants. J. Clin. Med. 2019, 9, 109. [Google Scholar] [CrossRef]
- Liu, R.; Wang, Y.; Qin, G.; Tian, S. Molecular basis of 1-methylcyclopropene regulating organic acid metabolism in apple fruit during storage. Postharvest Biol. Technol. 2016, 117, 57–63. [Google Scholar] [CrossRef]
- He, J.; Giusti, M.M. Anthocyanins: Natural colorants with health-promoting properties. Annu. Rev. Food Sci. Technol. 2010, 1, 163–187. [Google Scholar] [CrossRef] [PubMed]
- Liu, H.M.; Liu, Z.J.; Wu, Y.; Zheng, L.M.; Zhang, G.F. Regulatory mechanisms of anthocyanin biosynthesis in apple and pear. Int. J. Mol. Sci. 2021, 22, 8441. [Google Scholar] [CrossRef] [PubMed]
- Wei, H.R.; Chen, X.; Zong, X.J.; Shu, H.R.; Gao, D.S.; Liu, Q.Z. Comparative transcriptome analysis of genes involved in anthocyanin biosynthesis in the red and yellow fruits of sweet cherry (Prunus avium L.). PLoS ONE 2015, 10, e0121164. [Google Scholar] [CrossRef]
- Li, L.Z.; He, Y.J.; Ge, H.Y.; Liu, Y.; Chen, H.Y. Functional characterization of SmMYB86, a negative regulator of anthocyanin biosynthesis in eggplant (Solanum melongena L.). Plant Sci. 2020, 302, 110696. [Google Scholar] [CrossRef]
- Gonzalez-Gomez, D.; Lozano, M.; Fernandez-Leon, M.F.; Bernalte, M.J.; Ayuso, M.C.; Rodriguez, A.B. Sweet cherry phytochemicals: Identification and characterization by HPLC-DAD/ESI-MS in six sweet-cherry cultivars grown in Valle del Jerte (Spain). J. Food Compos. Anal. 2010, 23, 533–539. [Google Scholar] [CrossRef]
- Qi, X.L.; Liu, C.L.; Song, L.L.; Dong, Y.X.; Chen, L.; Li, M. A sweet cherry glutathione S-transferase gene, PavGST1, plays a central role in fruit skin coloration. Cells 2022, 11, 1170. [Google Scholar] [CrossRef]
- Antonio, M.; Federica, I.; Petronia, C.; Loredana, F.C.; Pasqualina, W.; Amodio, F. Metabolic characterization and antioxidant activity in sweet cherry (Prunus avium L.) campania accessions: Metabolic characterization of sweet cherry accessions. Food Chem. 2018, 240, 559–566. [Google Scholar]
- Karagiannis, E.; Sarrou, E.; Michailidis, M.; Tanou, G.; Ganopoulos, I.; Bazakos, C.; Kazantzis, K.; Martens, S.; Xanthopoulou, A.; Molassiotis, A. Fruit quality trait discovery and metabolic profiling in sweet cherry genebank collection in Greece. Food Chem. 2021, 342, 128315. [Google Scholar] [CrossRef]
- Erez, A. Chemical control of budbreak. HortScience 1987, 22, 1240–1243. [Google Scholar] [CrossRef]
- Oukabli, A.; Mahhou, A. Dormancy in sweet cherry (Prunus avium L.) under Mediterranean climatic conditions. Biotechnol. Agron. Soc. Environ. 2007, 11, 133–139. [Google Scholar]
- Wang, L.; Zhang, L.; Ma, C.; Xu, W.; Liu, Z.; Zhang, C.; Mat-Thew, W.D.; Wang, S. Plmpact of chilling accumulation and hydrogen cyanamide on floral organ development of sweet cherry in a warm region. J. Integr. Agric. 2016, 15, 2529–2538. [Google Scholar] [CrossRef]
- Zhang, H.M.; Yan, H.G.; Li, Q.; Lin, H.; Wen, X.P. Identification of VOCs in essential oils extracted using ultrasound- and microwave-assisted methods from sweet cherry flower. Sci. Rep. 2021, 11, 1167. [Google Scholar] [CrossRef]
- Wu, Z.F.; Tu, M.M.; Yang, X.P.; Xu, J.H.; Yu, Z.F. Effect of cutting and storage temperature on sucrose and organic acids metabolism in postharvest melon fruit. Postharvest Biol. Technol. 2020, 161, 111081. [Google Scholar] [CrossRef]
- Fan, Y.T.; Li, C.Y.; Zhu, J.; Sun, L.; Huang, R.; Guo, M.; Ge, Y.H. Organic acids metabolism and GABA shunt involved in maintaining quality of Malus domestica by methyl jasmonate treatment. Food Res. Int. 2022, 160, 111741. [Google Scholar] [CrossRef] [PubMed]
- Wei, H.R.; Yi, X.B.; Tan, Y.; Zong, X.J.; Wang, J.W.; Xu, L.; Liu, Q.Z. Determination of anthocyanins in the peel of sweet cherry by ultra performance liquid chromatography-tandem mass spectrometry. Chromatography 2015, 33, 577–582. [Google Scholar] [CrossRef]
- Esti, M.; Cinquanta, L.; Sinesio, F.; Moneta, E.; Matteo, M.D. Physicochemical and sensory fruit characteristics of two sweet cherry cultivars after cool storage. Food Chem. 2002, 76, 399–405. [Google Scholar] [CrossRef]
- Jin, W.M.; Wang, H.; Li, M.F.; Wang, J.; Yang, Y.; Zhang, X.M.; Yan, G.H.; Zhang, H.; Liu, J.S.; Zhang, K.C. The R2R3 MYB transcription factor PavMYB10.1 involves in anthocyanin biosynthesis and determines fruit skin colour in sweet cherry (Prunus avium L.). Plant Biotechnol. J. 2016, 14, 2120–2133. [Google Scholar] [CrossRef] [PubMed]
- Montefiori, M.; Espley, R.V.; Stevenson, D.; Cooney, J.; Datson, P.M.; Saiz, A.; Allan, A.C. Identification and characterisation of F3GT1 and F3GGT1, two glycosyltransferases responsible for anthocyanin biosynthesis in red-fleshed kiwifruit (Actinidia chinensis). Plant J. 2011, 65, 106–118. [Google Scholar] [CrossRef]
- Wei, H.R.; Tan, Y.; Zong, X.J.; Zhu, D.Z.; Chen, X.; Xu, L.; Liu, Q.Z. Relationship between anthocyanin accumulation and the activities of anthocyanin biosynthesis enzymes in different color of sweet cherry fruits. Plant Physiol. J. 2017, 53, 429–436. [Google Scholar]
- García-Macías, P.; Ordidge, M.; Vysini, E.; Waroonphan, S.; Battey, N.H.; Gordon, M.H.; Wagstaffe, A. Changes in the flavonoid and phenolic acid contents and antioxidant activity of red leaf lettuce (Lollo Rosso) due to cultivation under plastic films varying in ultraviolet transparency. J. Agric. Food Chem. 2007, 55, 10168–10172. [Google Scholar] [CrossRef] [PubMed]
- Smirnoff, N. Botanical briefing: The function and metabolism of ascorbic acid in plants. Ann. Bot. 1996, 78, 661–669. [Google Scholar] [CrossRef]
- Zhang, C.X.; Whiting, M. Plant growth regulators improve sweet cherry fruit quality without reducing endocarp growth. Sci. Hortic. 2013, 150, 73–79. [Google Scholar] [CrossRef]
- Chen, C.; Chen, H.; Yang, W.; Li, J.; Tang, W.; Gong, R. Transcriptomic and Metabolomic Analysis of Quality Changes during Sweet Cherry Fruit Development and Mining of Related Genes. Int. J. Mol. Sci. 2022, 23, 7402. [Google Scholar] [CrossRef] [PubMed]
- Tang, W.; Chen, C.; Zhang, Y.; Chu, Y.; Yang, W.; Cui, Y.; Kou, G.; Chen, H.; Song, H.; Gong, R. Effect of Low-Light Stress on Sugar and Acid Accumulation during Fruit Development and Ripening of Sweet Cherry. Horticulturae 2023, 9, 654. [Google Scholar] [CrossRef]
- Piotr, C.; Ireneusz, O.; Pawel, F. Sweet cherry skin colour measurement as an non-destructive indicator of fruit maturity. Food Technol. 2019, 13, 157–166. [Google Scholar]
- Jeong, S.T.; Goto-Yamamoto, N.; Kobayashi, S.; Esaka, M. Effects of plant hormones and shading on the accumulation of anthocyanins and the expression of anthocyanin biosynthetic genes in grape berry skins. Plant Sci. 2004, 167, 247–252. [Google Scholar] [CrossRef]
- Kumar, R.; Khurana, A.; Sharma, A.K. Role of plant hormones and their interplay in development and ripening of fleshy fruits. J. Exp. Bot. 2014, 65, 4561–4571. [Google Scholar] [CrossRef]
- Jiang, C.F.; Gao, X.H.; Liao, L.L.; Harberd, N.P.; Fu, X.D. Phosphate starvation root architecture and anthocyanin accumulation responses are modulated by the gibberellin-DELLA signaling pathway in Arabidopsis. Plant Physiol. 2007, 145, 1460–1470. [Google Scholar] [CrossRef]
- Xie, Y.; Tan, H.J.; Ma, Z.X.; Huang, J.R. DELLA proteins promote anthocyanin biosynthesis via sequestering MYBL2 and JAZ suppressors of the MYB/bHLH/WD40 complex in Arabidopsis thaliana. Mol. Plant 2016, 9, 711–721. [Google Scholar] [CrossRef]
- Liu, Y.; Liu, X.Y.; Zhong, F.; Tian, R.R.; Zhang, K.C.; Zhang, X.M.; Li, T.H. Comparative study of phenolic compounds and antioxidant activity in different species of cherries. J. Food Sci. 2011, 76, 633–638. [Google Scholar] [CrossRef] [PubMed]
- Muhammad, N.; Luo, Z.; Zhao, X.; Yang, M.; Liu, Z.; Liu, M. Transcriptome-wide expression analysis of MYB gene family leads to functional characterization of flavonoid biosynthesis in fruit coloration of Ziziphus Mill. Front. Plant Sci. 2023, 14, 1171288. [Google Scholar] [CrossRef] [PubMed]
- Wu, Z.Q.; Li, X.S.; Zeng, Y.Y.; Cai, D.B.; Teng, Z.J.; Wu, Q.X.; Sun, J.X.; Bai, W.B. Color stability enhancement and antioxidation improvement of Sanhua plum wine under circulating ultrasound. Foods 2022, 11, 2435. [Google Scholar] [CrossRef]
- Song, J.H.; Guo, C.K.; Shi, M. Anthocyanin biosynthesis and transcriptional regulation in plant. Mol. Plant Breed. 2021, 19, 3612–3620. [Google Scholar]
- Chen, D.Z.; Chen, H.D.; Dai, G.Q.; Zhang, H.M.; Liu, Y.; Shen, W.J.; Zhu, B.; Cui, C.; Tan, C. Genome-wide identification of R2R3-MYB gene family and association with anthocyanin biosynthesis in Brassica species. BMC Genom. 2022, 23, 441. [Google Scholar] [CrossRef]
- Wang, L.; Deng, R.; Bai, Y.; Wu, H.; Li, C.; Wu, Q.; Zhao, H. Tartary Buckwheat R2R3-MYB Gene FtMYB3 Negatively Regulates Anthocyanin and Proanthocyanin Biosynthesis. Int. J. Mol. Sci. 2022, 23, 2775. [Google Scholar] [CrossRef]
- Gonzalez, A.; Zhao, M.Z.; Leavitt, J.M.; Lloyd, A.M. Regulation of the anthocyanin biosynthetic pathway by the TTG1/bHLH/Myb transcriptional complex in Arabidopsis seedlings. Plant J. 2008, 53, 814–827. [Google Scholar] [CrossRef]
- Bac-Molenaar, J.A.; Fradin, E.F.; Rienstra, J.A.; Lloyd, A.M. GWAS mapping of anthocyanin accumulation reveals balancing selection of MYB90 in Arabidopsis thaliana. PLoS ONE 2015, 10, e0143212. [Google Scholar] [CrossRef]
- Aharoni, A.; De Vos, C.H.; Wein, M.; Sun, Z.; Greco, R.; Kroon, A.; Mol, J.N.; O’Connell, A.P. The strawberry FaMYB1 transcription factor suppresses anthocyanin and flavonol accumulation in transgenic tobacco. Plant J. 2001, 28, 319–332. [Google Scholar] [CrossRef]
- Cavallini, E.; Matus, J.T.; Finezzo, L.; Zenoni, S.; Loyola, R.; Guzzo, F.; Schlechter, R.; Ageorges, A.; Arce-Johnson, P.; Tornielli, G.B. The phenylpropanoid pathway is controlled at different branches by a set of R2R3-MYB C2 repressors in Grapevine. Plant Physiol. 2015, 167, 1448–1470. [Google Scholar] [CrossRef]
- Wang, Q.; Jing, L.; Xu, Y.; Zheng, W.; Zhang, W. Transcriptomic Analysis of Anthocyanin and Carotenoid Biosynthesis in Red and Yellow Fruits of Sweet Cherry (Prunus avium L.) during Ripening. Horticulturae 2023, 9, 516. [Google Scholar] [CrossRef]
- An, J.P.; Yao, J.F.; Xu, R.R.; You, C.X.; Wang, X.F.; Hao, Y.J. Apple bZIP transcription factor MdbZIP44 regulates abscisic acid-promoted anthocyanin accumulation. Plant Cell Environ. 2018, 41, 2678–2692. [Google Scholar] [CrossRef] [PubMed]
- Zhang, S.Y.; Chen, Y.X.; Zhao, L.L.; Li, C.Q.; Yu, J.Y.; Li, T.T.; Yang, W.Y.; Zhang, S.G.; Su, H.Y.; Wang, l. A novel NAC transcription factor, MdNAC42, regulates anthocyanin accumulation in red-fleshed apple by interacting with MdMYB10. Tree Physiol. 2020, 40, 413–423. [Google Scholar] [CrossRef] [PubMed]
- Fang, X.; Zhang, L.Z.; Wang, L.J. The transcription factor MdERF78 is involved in ALA-induced anthocyanin accumulation in apples. Front. Plant Sci. 2022, 13, 915197. [Google Scholar] [CrossRef]

| Cultivar | Sprouting (MM/DD) | Initial Flowering (MM/DD) | Full Flowering (MM/DD) | Final Flowering (MM/DD) | Spring Fruiting (MM/DD) | Spring Foliage Color (MM/DD) | Ripening |
|---|---|---|---|---|---|---|---|
| Jiangnanhong | 2/14 | 3/10 | 3/25 | 4/05 | 4/08 | 4/15 | 5/07 |
| 5-106 | 2/15 | 3/08 | 3/19 | 4/01 | 4/12 | 4/12 | 5/07 |
| Chaoyang 1 | 2/15 | 3/10 | 3/20 | 4/10 | 4/04 | 4/14 | 5/08 |
| Changfeng 1 | 2/16 | 3/12 | 3/21 | 3/31 | 4/05 | 4/16 | 5/10 |
| Cultivar | Color Parameter | S1 | S2 | S3 | S4 |
|---|---|---|---|---|---|
| Jiangnanhong | L* | 48.50 ± 3.68 a | 36.63 ± 3.24 b | 27.31 ± 2.17 c | 22.10 ± 2.12 d |
| a* | 36.98 ± 3.21 b | 40.74 ± 2.01 a | 30.94 ± 3.17 c | 13.97 ± 2.21 d | |
| b* | 24.33 ± 2.18 a | 20.07 ± 2.01 b | 11.88 ± 1.43 c | 2.72 ± 1.31 d | |
| 5-106 | L* | 64.35 ± 3.65 a | 51.95 ± 1.37 b | 45.63 ± 1.60 c | 36.86 ± 3.30 d |
| a* | 21.20 ± 5.62 c | 39.59 ± 1.25 b | 42.61 ± 1.35 a | 42.89 ± 2.06 a | |
| b* | 34.44 ± 3.31 a | 26.43 ± 0.30 b | 22.77 ± 1.86 bc | 21.05 ± 2.66 c | |
| Chaoyang 1 | L* | 72.44 ± 0.77 a | 69.17 ± 2.14 b | 62.07 ± 2.55 bc | 58.89 ± 1.44 c |
| a* | 3.73 ± 0.84 c | 7.31 ± 0.98 b | 13.82 ± 1.68 a | 14.75 ± 1.02 a | |
| b* | 39.29 ± 1.60 a | 39.22 ± 1.48 a | 39.68 ± 1.65 a | 39.73 ± 0.85 a | |
| Changfeng 1 | L* | 71.67 ± 2.67 a | 56.76 ± 3.52 b | 40.77 ± 1.78 c | 30.03 ± 2.67 d |
| a* | 24.61 ± 1.48 d | 32.14 ± 2.86 c | 44.06 ± 2.40 a | 36.84 ± 2.21 b | |
| b* | 31.74 ± 2.97 a | 27.18 ± 2.94 b | 23.82 ± 1.85 c | 14.59 ± 1.46 d |
| Cultivar | Maturity | Cyanidin-3-O-Rutinoside (μg·g−1 FW) | Cyanidin-3-O-Glucoside (μg·g−1 FW) | Pelargonidin 3-Glucoside (μg·g−1 FW) |
|---|---|---|---|---|
| Jiangnanhong | S1 | 111.07 ± 5.17 d | 1.13 ± 0.04 d | ud |
| S2 | 837.70 ± 15.12 c | 1.70 ± 0.02 c | ud | |
| S3 | 1424.16 ± 7.56 b | 4.29 ± 0.05 b | 0.09 ± 0.01 b | |
| S4 | 3909.32 ± 112.67 a | 13.54 ± 0.28 a | 0.23 ± 0.01 a | |
| 5-106 | S1 | 19.64 ± 1.22 d | 0.83 ± 0.09 d | ud |
| S2 | 185.10 ± 19.25 c | 1.16 ± 0.07 c | ud | |
| S3 | 239.80 ± 34.48 b | 1.46 ± 0.05 b | ud | |
| S4 | 354.08 ± 32.94 a | 1.67 ± 0.03 a | ud | |
| Chaoyang 1 | S1 | 1.35 ± 0.23 c | 0.94 ± 0.03 ab | ud |
| S2 | 1.44 ± 0.12 c | 1.07 ± 0.16 a | ud | |
| S3 | 6.25 ± 0.44 b | 0.74 ± 0.11 b | ud | |
| S4 | 7.63 ± 0.44 a | 0.83 ± 0.06 b | ud | |
| Changfeng 1 | S1 | 182.20 ± 7.04 d | 1.22 ± 0.09 d | ud |
| S2 | 367.59 ± 8.39 c | 1.61 ± 0.08 c | ud | |
| S3 | 798.92 ± 36.69 b | 1.96 ± 0.03 b | ud | |
| S4 | 1247.53 ± 18.65 a | 2.14 ± 0.02 a | 0.11 ± 0.01 a |
Disclaimer/Publisher’s Note: The statements, opinions and data contained in all publications are solely those of the individual author(s) and contributor(s) and not of MDPI and/or the editor(s). MDPI and/or the editor(s) disclaim responsibility for any injury to people or property resulting from any ideas, methods, instructions or products referred to in the content. |
© 2025 by the authors. Licensee MDPI, Basel, Switzerland. This article is an open access article distributed under the terms and conditions of the Creative Commons Attribution (CC BY) license (https://creativecommons.org/licenses/by/4.0/).
Share and Cite
Xu, Y.; Jing, Y.; Guo, Y.; Zhang, W. Quality Characteristics and Color Formation Mechanism of Low Chilling Requirement Sweet Cherry (Prunus avium L.) Cultivars in Southeast China. Horticulturae 2025, 11, 269. https://doi.org/10.3390/horticulturae11030269
Xu Y, Jing Y, Guo Y, Zhang W. Quality Characteristics and Color Formation Mechanism of Low Chilling Requirement Sweet Cherry (Prunus avium L.) Cultivars in Southeast China. Horticulturae. 2025; 11(3):269. https://doi.org/10.3390/horticulturae11030269
Chicago/Turabian StyleXu, Yue, Yonglin Jing, Yanfei Guo, and Wangshu Zhang. 2025. "Quality Characteristics and Color Formation Mechanism of Low Chilling Requirement Sweet Cherry (Prunus avium L.) Cultivars in Southeast China" Horticulturae 11, no. 3: 269. https://doi.org/10.3390/horticulturae11030269
APA StyleXu, Y., Jing, Y., Guo, Y., & Zhang, W. (2025). Quality Characteristics and Color Formation Mechanism of Low Chilling Requirement Sweet Cherry (Prunus avium L.) Cultivars in Southeast China. Horticulturae, 11(3), 269. https://doi.org/10.3390/horticulturae11030269