Article

The Effect of Light Intensity and Polyethylene-Glycol-Induced Water Stress on the Growth, Mitragynine Accumulation, and Total Alkaloid Content of Kratom (Mitragyna speciosa)

by
Nisa Leksungnoen
1,
Tushar Andriyas
2,3,*,
Yongkriat Ku-Or
1,
Suthaporn Chongdi
1,
Rossarin Tansawat
2,3,
Attawan Aramrak
4,
Chatchai Ngernsaengsaruay
5,
Suwimon Uthairatsamee
1,
Weerasin Sonjaroon
6,
Phatthareeya Thongchot
4,
Sirinapa Ardsiri
4 and
Pichaya Pongchaidacha
2,3
1
Department of Forest Biology, Faculty of Forestry, Kasetsart University, Bangkok 10900, Thailand
2
Department of Food and Pharmaceutical Chemistry, Faculty of Pharmaceutical Science, Chulalongkorn University, Bangkok 10330, Thailand
3
Metabolomics for Life Sciences Research Unit, Chulalongkorn University, Bangkok 10330, Thailand
4
Department of Biochemistry, Faculty of Science, Kasetsart University, Bangkok 10900, Thailand
5
Department of Botany, Faculty of Science, Kasetsart University, Bangkok 10900, Thailand
6
Department of Horticulture, Faculty of Agriculture, Kasetsart University, Bangkok 10900, Thailand
*
Author to whom correspondence should be addressed.
Horticulturae 2025, 11(3), 272; https://doi.org/10.3390/horticulturae11030272
Submission received: 5 January 2025 / Revised: 23 February 2025 / Accepted: 26 February 2025 / Published: 3 March 2025
(This article belongs to the Section Biotic and Abiotic Stress)

Abstract

:
The cultivation of Mitragyna speciosa (kratom) has gained significant interest due to its diverse alkaloid profile, increasing its commercial and medicinal demand. Using controlled hydroponic techniques, this study investigates the effects of varying light intensity and water potential on kratom growth, mitragynine (MG) accumulation, and total alkaloid content (TAC). While the interaction between light and water potential was generally not significant, water potential emerged as the dominant factor affecting plant growth and alkaloid accumulation. The highest MG accumulation (0.63% w/w) was recorded under moderate water potential (−0.4 MPa). In contrast, the highest TAC (8.37 mg alkaloid equivalent per gram dry weight) was observed under the combined effect of low light and mild water potential (−0.4 MPa). Leaf age also played a key role, with younger leaves (second and third pairs) accumulating significantly higher MG levels (0.74% w/w) than older leaves (0.40% w/w). Additionally, leaf thickness was positively associated with MG levels, suggesting a potential link between plant morphology and alkaloid biosynthesis. However, low water potential (−0.7 MPa) significantly reduced both growth and MG content, highlighting the importance of optimizing environmental conditions for sustained bioactive compound production. These findings demonstrate the physiological adaptability of kratom to variable environmental stresses and their influence on alkaloid accumulation. This knowledge can be applied to precision cultivation strategies to enhance the sustainability of kratom farming while optimizing the production of bioactive compounds for pharmaceutical and agricultural applications.

1. Introduction

Mitragyna speciosa (Korth.) Havil., commonly known as kratom, belongs to the Rubiaceae family and is an evergreen tree that thrives in wet, humid conditions with moderate to high sunlight exposure. It is widely distributed across Southeast Asia, including Thailand, Indonesia, Malaysia, the Philippines, and Borneo [1,2]. Kratom holds significant traditional and medicinal importance due to its alkaloid-rich leaves, primarily containing mitragynine (MG) [3]. Phytochemical analyses have revealed a rich metabolomic profile, with MG, 7-hydroxymitragynine, quercetin, and rutin identified as the major bioactive compounds, MG being the primary contributor to its therapeutic effects [4]. This has increased global interest in kratom’s medicinal potential, furthering its widespread cultivation [5]. Traditionally, due to taste preferences, kratom consumption is limited to the second and third leaf pairs, which correlate with higher MG accumulation compared to older leaves [6,7].
Kratom grows naturally in southern Thailand, particularly along riverbanks and in national forests, where it is exposed to abiotic factors including high light intensity and saturated soils [2]. Plant physiology and metabolism are often influenced by multiple environmental stressors, including temperature fluctuations, water potential changes, alkalinity, salinity, and light radiation. These factors can enhance the biosynthesis, accumulation, and overproduction of valuable phytochemicals [8,9], leading to an increased antioxidant activity in plants [10]. Plants synthesize primary metabolites (PMs), which are essential for growth and development, including carbohydrates, tricarboxylic acid (TCA) cycle intermediates, and amino acids. Hormones like abscisic acid, jasmonic acid, salicylic acid, and ethylene regulate growth, development, and stress responses, enabling plants to adapt to varying environmental conditions [11]. Additionally, they produce secondary metabolites (SMs), such as phenolics, terpenes, and nitrogen-containing compounds, which help to mediate interactions with the environment [12].
Abiotic factors such as high light intensity and water availability are linked to higher metabolite yields and photosynthetic efficiency. In contrast, moderate environmental stress can stimulate SM accumulation as part of a plant’s defense response [8,13]. In medicinal plants, fluctuations in water availability and light intensity can significantly influence the composition and levels of both PMs [10] and SMs [14]. For example, reductions in both light and water availability have been shown to alter the SM profile of Ligustrum vulgare [14]. Similarly, variations in total alkaloid content (TAC) across different plant organs reflect an adaptive response to environmental conditions, functioning as a defense and survival mechanism [15]. These nitrogen-rich metabolites, which help deter herbivores and pathogens, are often upregulated under abiotic stresses such as high light intensity and reduced water availability [16].
Variations in light conditions can enhance the accumulation of various SMs essential for plant growth and defense [13,17,18]. These include alkaloids, flavonoids, terpenoids, polyphenols, carotenoids, and capsaicinoids [19,20]. Plants adapt to water stress through physiological responses such as reduced leaf area or induced abscission. Osmotic shifts due to water loss can also trigger the biosynthesis of purine alkaloids [21,22]. In several plant species, phytochemical accumulation is influenced by water availability, with compounds such as α-tocopherol (Rosmarinus officinalis), artemisinin (Artemisia), and flavonols (quercetin and rutin in Hypericum brasiliense) showing increased levels under specific conditions, particularly limited water availability [23,24].
Inconsistent global regulations have created a legal gray area, complicating both research and public policy [25]. In Thailand, the recent reclassification of kratom from a controlled substance to a medicinal plant highlights a shift toward regulated medicinal use [26]. In contrast, Malaysia, where kratom has been traditionally consumed, imposes restrictions under narcotics control laws due to its psychoactive effects [27]. Regulatory uncertainty also persists in Western countries, where kratom is either unregulated or banned, hindering legitimate research efforts [28]. In the United States, kratom has been at the center of regulatory debates, as the Drug Enforcement Administration’s attempt to classify kratom as a Schedule I substance has been met with resistance from advocacy groups citing its therapeutic potential related to self-management of opioid withdrawal and pain [29]. In Sweden, although MG was classified as a narcotic in 2011, possession of kratom (or crude plant materials), despite its containing MG, is legal, but its consumption, processing, or packing in portion doses remains illegal [25].
The cultivation of kratom has gained considerable interest following its reclassification from a controlled substance to a medicinal plant in Thailand. However, uncertainty remains regarding whether the plant can sustain high yields of MG and TAC under varying light conditions and water potentials. This study examined the effects of light intensity and water potential on key growth traits and alkaloid production in kratom seedlings grown under controlled hydroponic conditions. Specifically, we tested whether a combination of light intensity and water potential could modulate MG and TAC accumulation while supporting optimal growth. Additionally, we investigated the differences in MG accumulation between younger (second and third pair) and older leaves, as younger leaves exhibit higher metabolite concentrations [30,31]. By identifying optimal environmental conditions for growth and alkaloid accumulation, this study aims to provide insights that can inform cultivation practices to maximize MG yield and the commercial adoption of kratom.

2. Materials and Methods

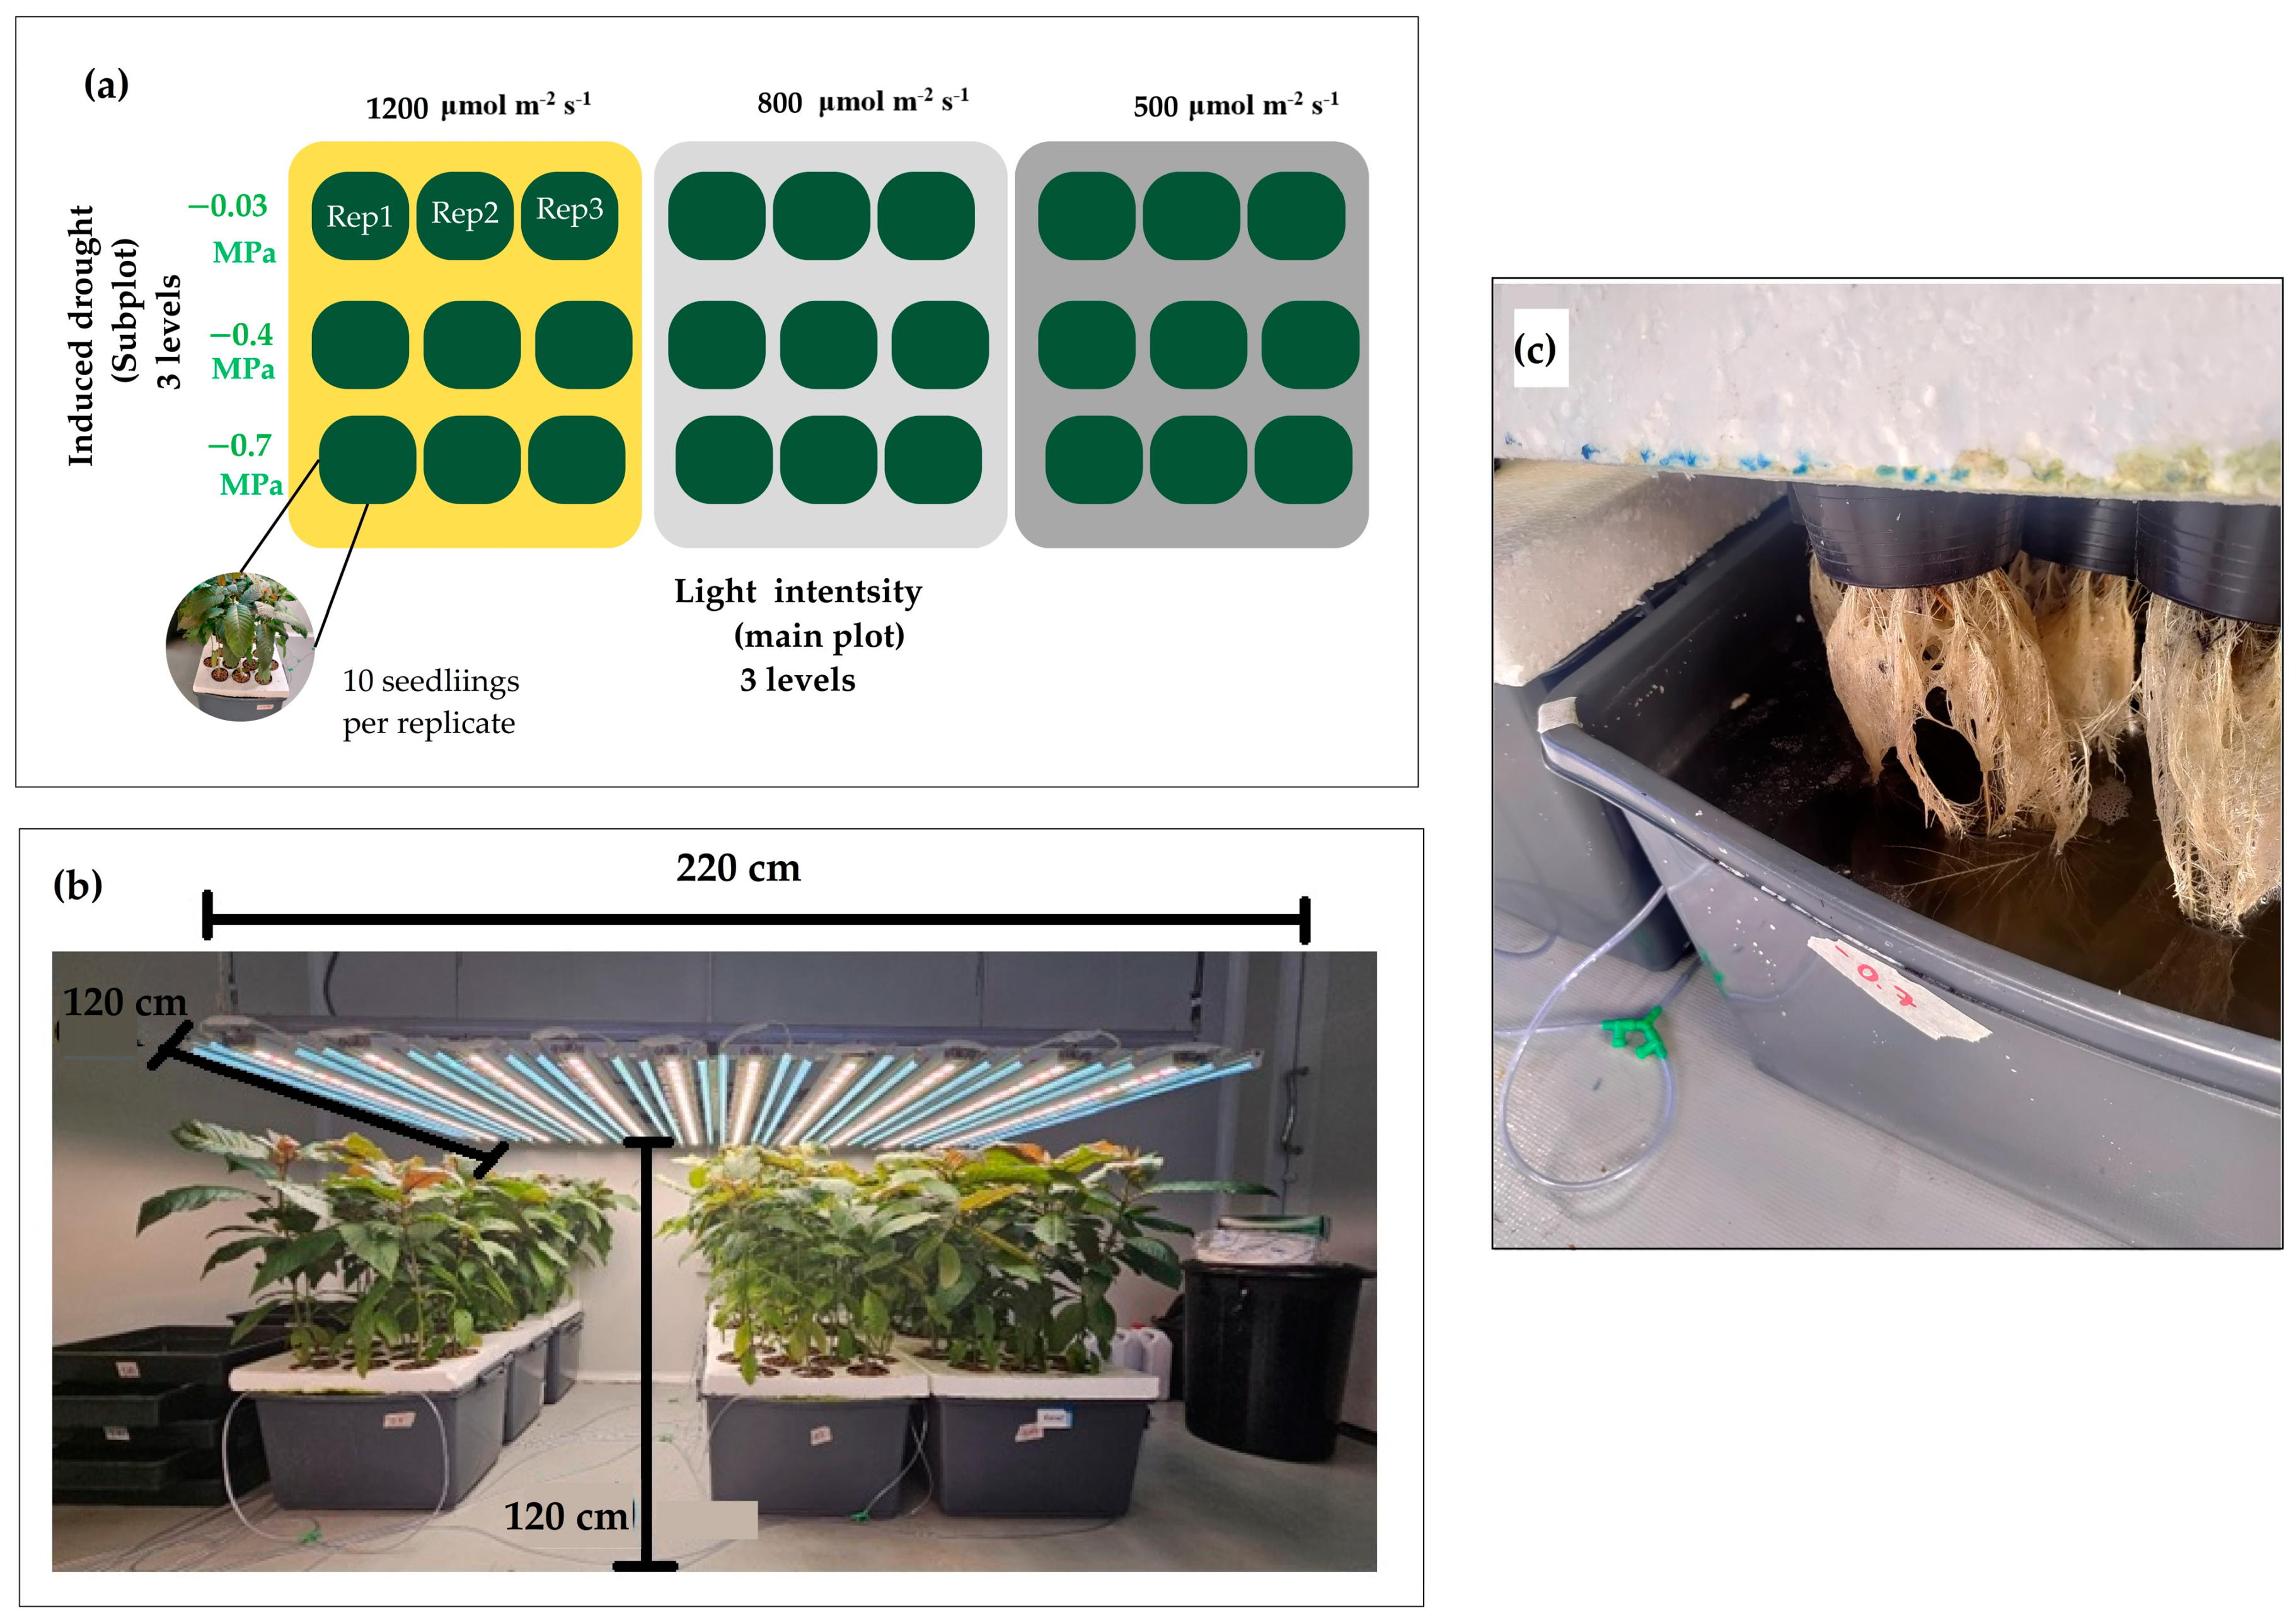
2.1. Seedling Preparation and Treatments

Kratom seedlings were grown from seeds in Phattalung province (N 07°36′18.0500″, E 100°03′22.1875″) in Thailand for six months, reaching a height of 30 cm, before being transported to a hydroponics nursery at Kasetsart University in Bangkok. They were placed in a Resh Tropical (dry summer) solution [32] with an electrical conductivity of 1.2 mS cm−1 and a pH between 5.0 and 5.5. The ambient environment was controlled at temperatures between 25 and 27 °C, relative humidity at 60–70%, and carbon dioxide at 400 ppm. The seedlings were placed in 2-inch pots filled with baked clay balls of diameters between 8 and 16 mm (size XL). These pots were placed in a panel made of 2-inch-thick foam perforated with 10 holes, allowing the roots to float in the solution within a box measuring 55 cm × 39 cm × 28 cm.
After a one-month adaptation period to the controlled environment, seedlings were subjected to a split-plot experimental design, with main plots assigned varying light intensities and subplots with three replicates assigned varying levels of water potential (in terms of low, medium, and high). Each replicate of the main × subplot combination contained 10 seedlings (total in 27 boxes: 270 seedlings) (Figure 1a). Three levels of light intensity (500, 800, and 1200 μmol m−2s−1) were applied using LED lights. The light intensity was monitored using LED light meters with photosynthetic photon flux density (PPFD) sensors placed 120 cm above the containers (Figure 1b). Such LED systems have been reported to produce spectral irradiance distributions similar to ground-level sunlight, with adjustable intensity and stability, ensuring controlled and reproducible experimental conditions [33]. A light intensity of 1200 μmol m−2s−1 is approximately equivalent to 100% of sunlight in Thailand, as reported by Leksungnoen et al. [3], while a light intensity of 500 μmol m−2s−1 (around 25% of full sunlight) was identified as optimal for kratom seedlings grown in the USA, according to Zhang et al. [34]. This value was used as a comparative reference point to investigate whether similar trends were observed in the controlled hydroponic setup. The 800 μmol m−2s−1 treatment served as an intermediate intensity between the low and high levels. Light intensity was measured using a quantum meter (LI-190R Quantum Sensor, LI-COR Corporate, Lincoln, NE, USA) to ensure the targeted intensity. The experiment was conducted under a 12 h light and 12 h dark photoperiod, simulating a day–night cycle to study photosynthetic efficiency and metabolite biosynthesis [35].
Polyethylene glycol (PEG 6000) was used to modulate the levels of water potential (WP) to simulate drought-like conditions while maintaining control over nutrient availability [36]. Three levels of water potential were used: −0.03 MPa, −0.4 MPa (mild stress; 25% of the permanent wilting point), and −0.7 MPa (high stress; 50% of the permanent wilting point). The PEG 6000 concentration was calculated using the adapted equation of Michel and Kaufmann [37]:
WP (MPa) = [−(1.18 × 10⁻²) C − (1.18 × 10⁻⁴) C2 + (2.67 × 10⁻⁴) CT + (8.39 × 10⁻⁷) C2T] × 0.1,
where C is the concentration of polyethylene glycol (PEG) (g/L), and T is the temperature (°C). A 40 L solution was used in each box, with PEG amounts of 1.41, 7.13, and 9.74 kg per box to achieve water potentials of −0.03, −0.4, and −0.7 MPa, respectively. Seedlings were subjected to these treatments for two months before leaf harvesting. After mixing PEG with the Resh Tropical solution, water potential was measured using a dew point potentiometer (WP4C, Labcell Ltd., Hants, UK) to ensure the three designated levels. Roots were made to float in the solution, with oxygen supplied through tubes to facilitate root respiration and nutrient uptake (Figure 1c) [38].

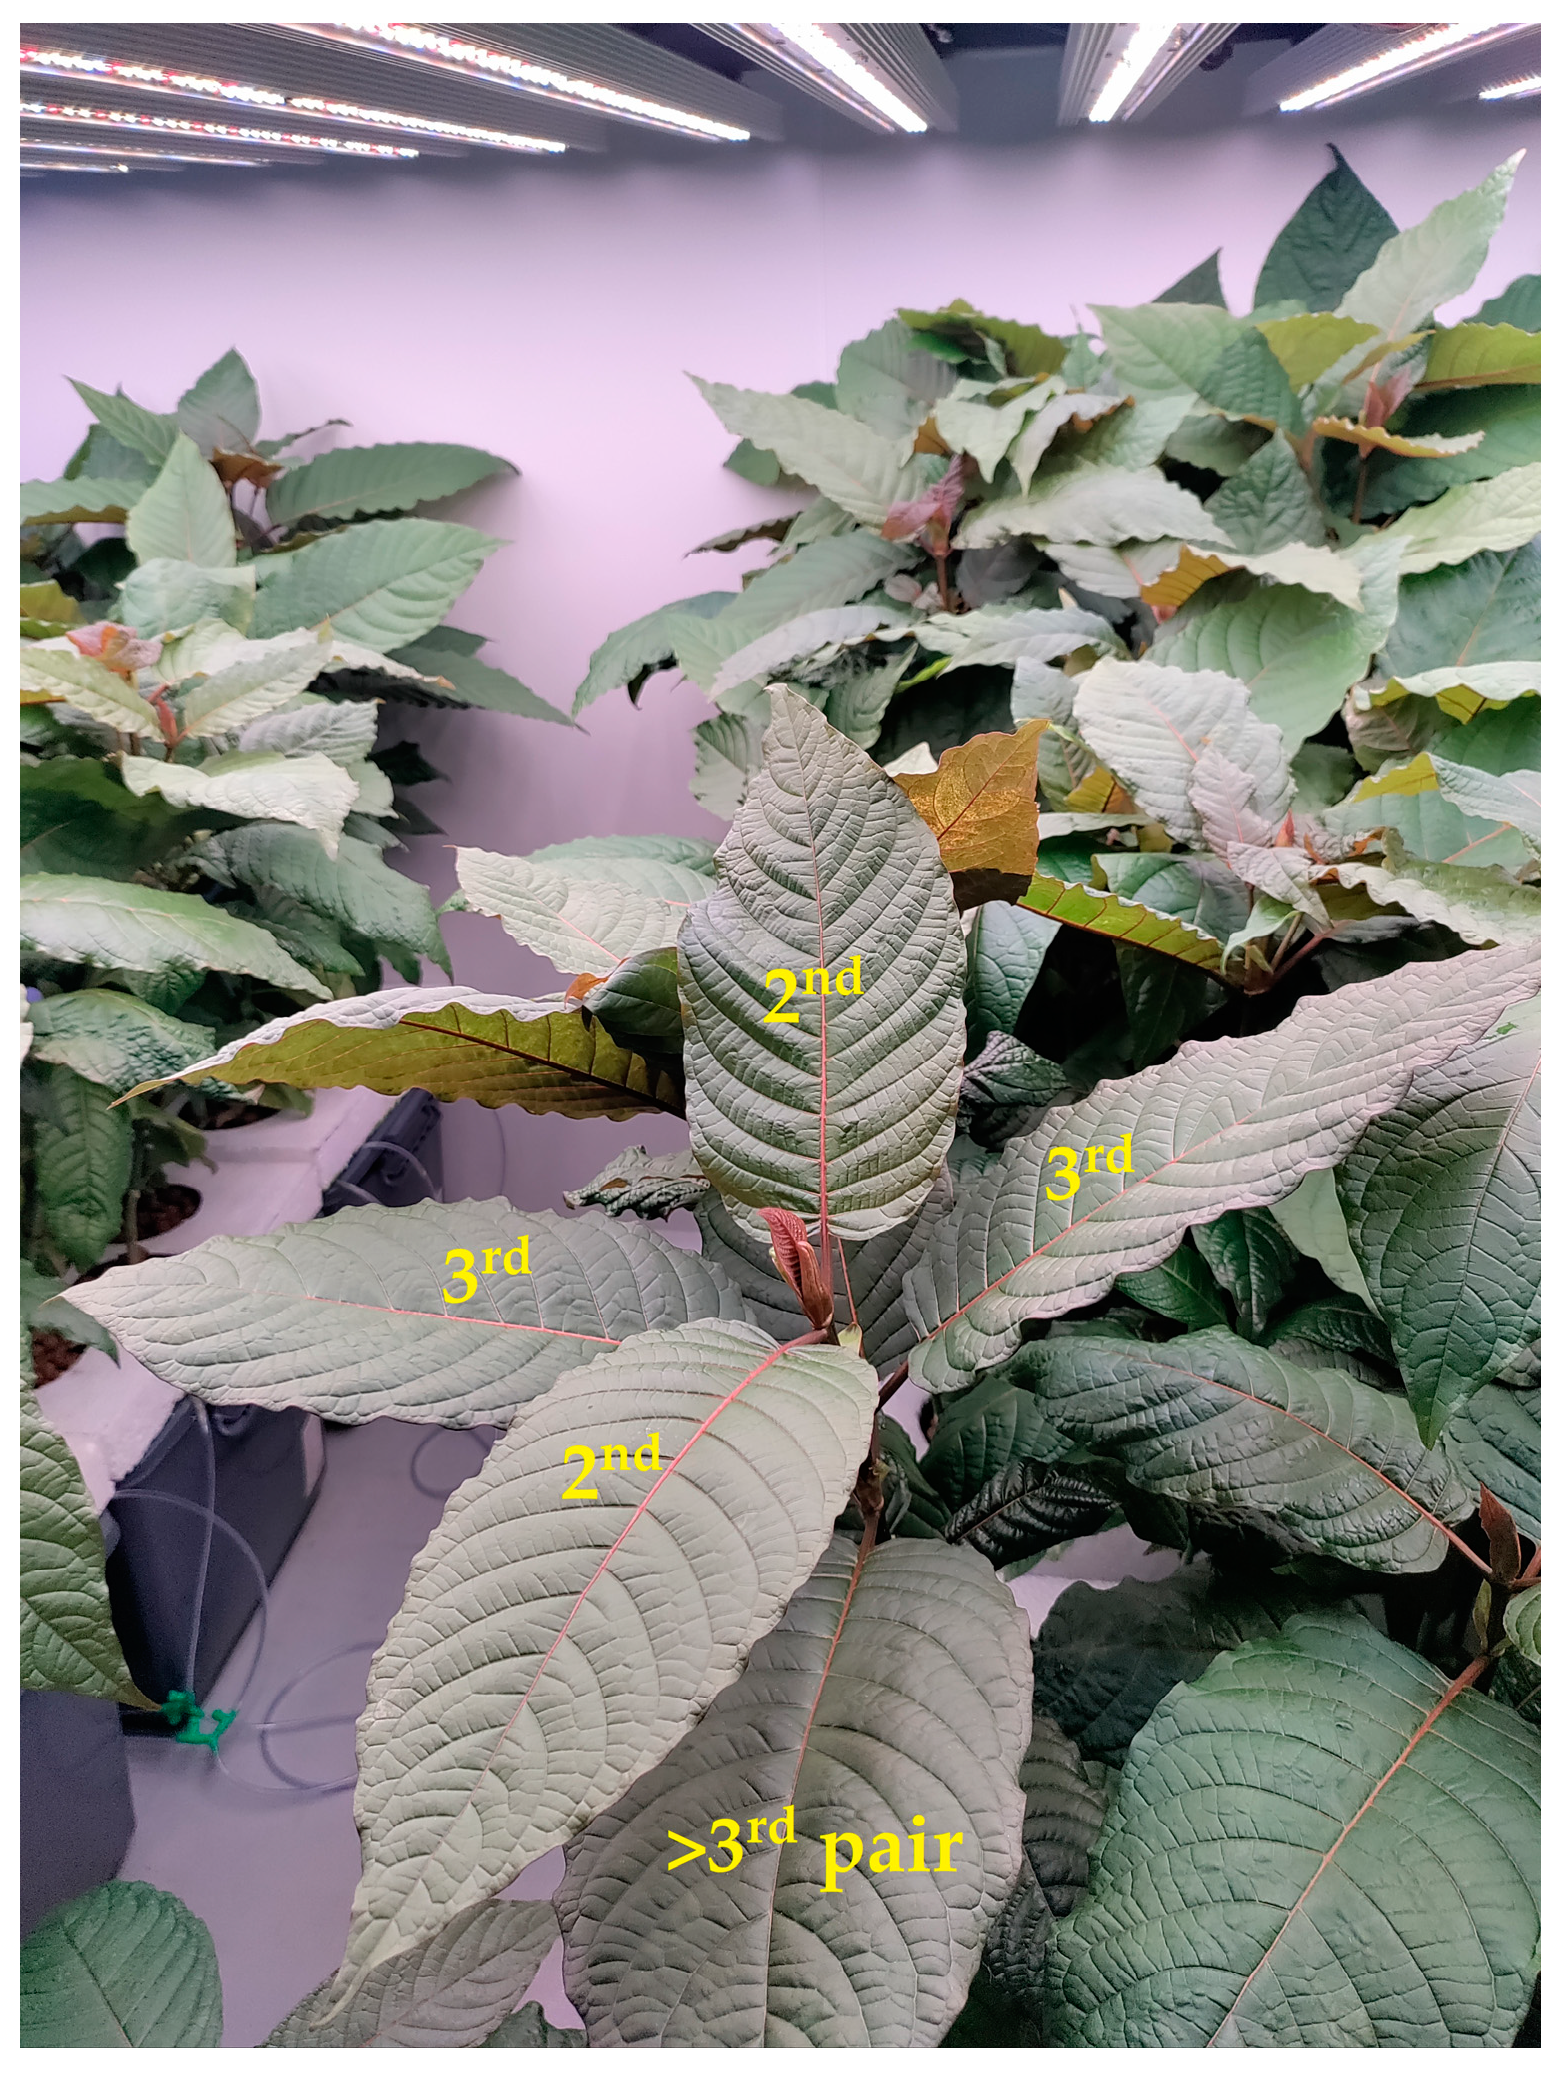
2.2. Growth and Leaf Trait Measurements

After two months of treatment, growth and physiological characteristics were measured prior to harvesting by randomly selecting five seedlings per box for each treatment combination, following the standard protocol for determining functional traits [39]. Seedling growth was assessed by measuring stem diameter at the root collar (Do) and plant height. Physiological traits measured included leaf area (LA), relative water content (RWC), specific leaf area (SLA), leaf thickness (Th), chlorophyll content (SPAD), and water use efficiency (WUE). One leaf from each selected seedling was randomly harvested and immediately weighed to obtain its wet weight (W). The LA of the same leaf was then measured using ImageJ (version 1.38e) (Rasband, W.S., ImageJ, U.S. National Institutes of Health, Bethesda, MD, USA). Subsequently, the leaf was immersed in water and stored in a dark room for 24 h before measuring its turgid weight (T). It was then oven-dried at 80 °C for 48 h and weighed to determine its dry mass (D). RWC, expressed as a percentage, was calculated using the formula (W − D)/(T − D) × 100, while SLA was calculated as the ratio of LA to D and expressed in cm2 g−1.
Leaf thickness was measured using a Digimatic thickness gauge (precision up to six digits) (Model 547, Mitutoyo Corporation, Kawasaki, Japan) on the lamina, avoiding the midrib and veins. A SPAD meter (SPAD-502, Konica Minolta Sensing Europe, London, UK) was used to determine chlorophyll content. WUE was measured using a portable photosynthesis system (Li-6800, LI-COR Corporate, Lincoln, NE, USA). The system measured the assimilation (A) and transpiration (E) rates under controlled temperature of 30 °C, relative humidity of 60%, an airflow rate of 500 μmol s−1, and a CO2 concentration of 400 ppm. WUE was then calculated as the ratio of A to E and expressed as a unitless value.

2.3. Seedling Harvesting

Seedlings were harvested to determine the stem dry mass (SDM), leaf dry mass (LDM), and root dry mass (RDM), the sum of which was the total dry mass (TDM). Additionally, the root-to-shoot ratio (RSR), root diameter (Droot), length of the longest root (Lroot), and specific root length (SRL) were also measured. Seedlings were harvested by separating them into leaf, stem, and root parts, with Droot randomly measured for 10 roots per seedling. Total root length was measured as the distance from the root collar to the longest root. Subsequently, all the parts were oven-dried at 80 °C for 48 h to determine dry mass using an analytical scale with a precision of up to four digits (Mettler Toledo, LLC, Columbus, OH, USA). RSR was calculated using the equation root dry mass/(stem + leaf dry mass), while SRL was calculated as the ratio of Lroot and RDM.

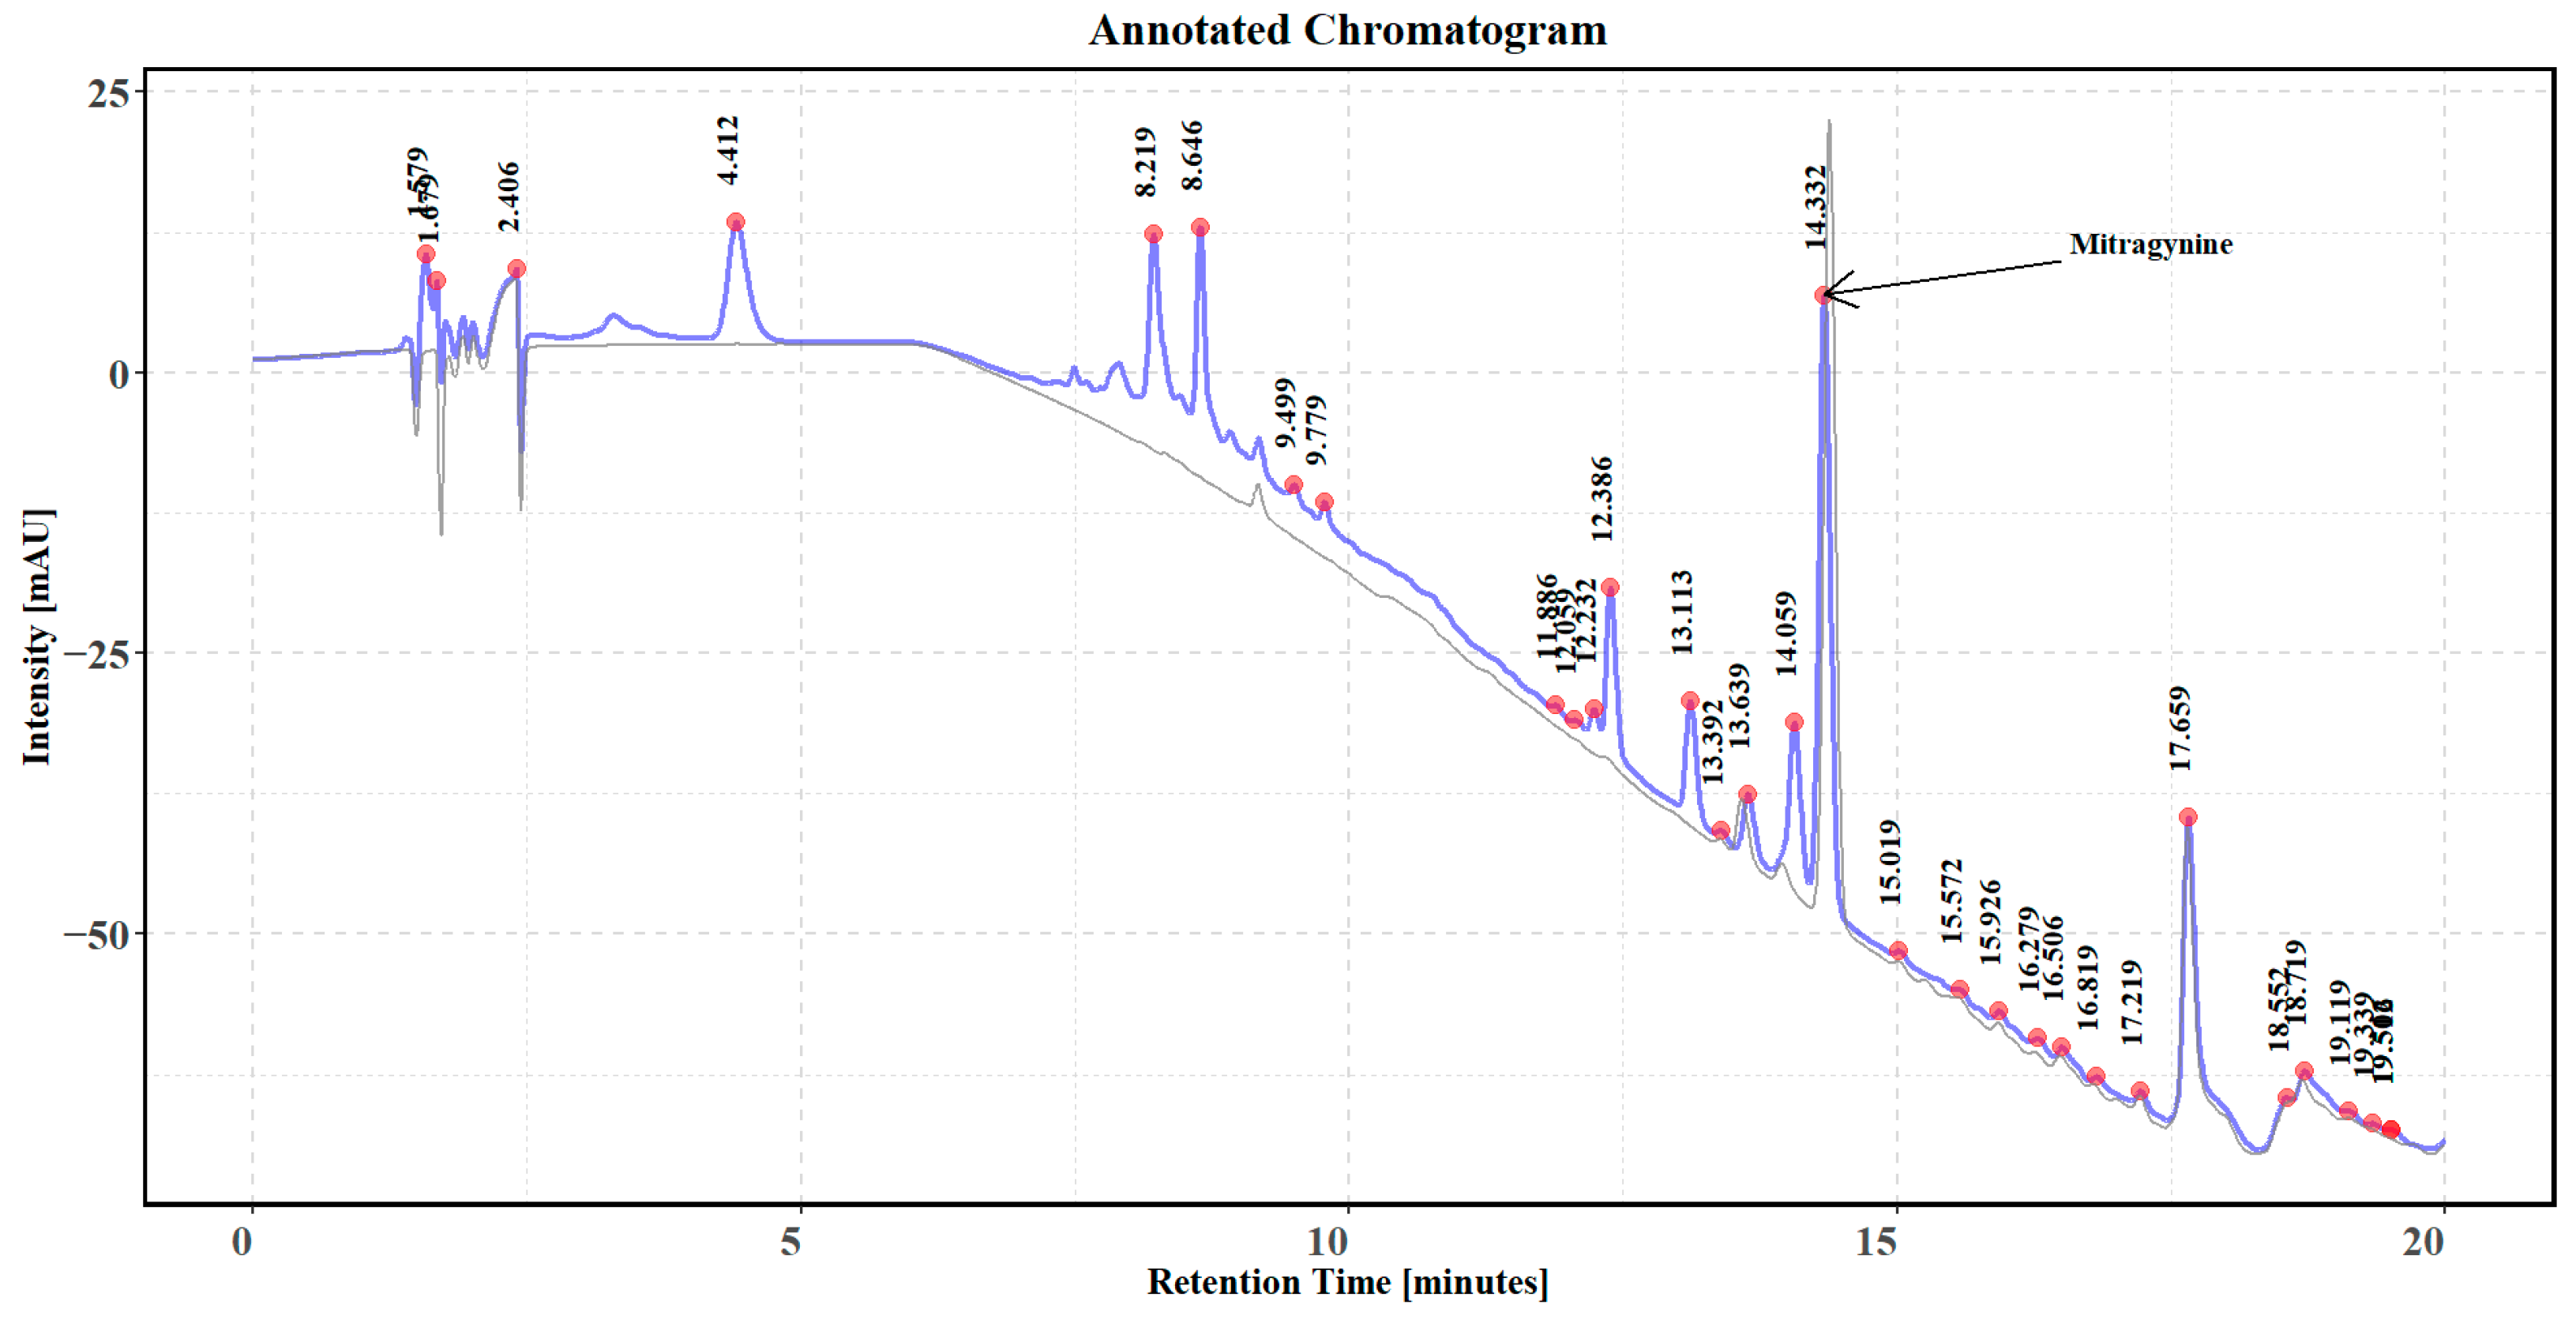
2.4. Determination of Mitragynine Content

In each treatment combination box, the 2nd and 3rd leaf pairs (Figure 2) were harvested to represent the leaves preferred for local consumption, to compare with the older pairs (>3rd pairs), which are typically not consumed by local people due to taste and texture. The kratom leaf samples were air-dried, ground, and filtered through a mesh with a size of less than 0.5 mm, and MG content was quantified using the procedure briefly outlined below.
Fifty milligrams of the ground samples were weighed into a 15 mL Falcon tube, soaked in 5 mL methanol, sonicated for 10 min, and incubated for 24 h. The mixture was sonicated again before being centrifuged at 25 °C and 4500 rpm for 5 min. After centrifugation, the supernatant was diluted with methanol (1:10). A diluted sample was filtered using a 0.22 μm polytetrafluoroethylene (PTFE) syringe filter into a high-performance liquid chromatography (HPLC) vial. The sample was then injected into an HPLC system (Agilent 1260 Liquid Chromatograph, Agilent Technologies, Santa Clara, CA, USA) equipped with an Inertsil ODS-3 HPLC column (5 µm, 150 × 4.6 mm). The HPLC system was operated at a wavelength of 226 nm (4 nm bandwidth) and a column temperature of 27 °C. The MG standard (procured from Applied Chemical and Instrument Co., Ltd., Bangkok, Thailand, with 97.2% purity) was prepared to construct the calibration curve. Ten µL of all samples and standards were injected into the HPLC instrument, and the entire process was conducted at a flow rate of 1 mL min−1.

2.5. Determination of Total Alkaloid Content

Three replicates of kratom leaves (2nd and 3rd pair only) per treatment combination were dried in a hot air oven at 60 °C for 3 h and ground into a fine powder. Leaves from each treatment were extracted by pooling together 1 g of powder from each replicate. Thereafter, 3 g of leaf powder was sequentially extracted at room temperature with 5 mL of methanol as the solvent for 24 h [40]. Liquid phase from the solvent was collected, filtered, evaporated, and freeze-dried. Crude extracts were weighed and re-dissolved in ethanol at a concentration of 1 mg mL−1 before the quantification of TAC.
TAC was determined using a bromocresol green colorimetric assay with a minor modification [41]. Extraction was performed using a separatory funnel. One mL of extract (1 mg mL−1) was transferred into the funnel, followed by the addition of 5 mL of phosphate buffer (pH 4.7) and bromocresol green solution. The mixture was shaken, and chloroform was added sequentially in steps of 1, 2, 3, and 4 mL. After each addition, the mixture was shaken again to release any gas. After the third addition, 6 mL of the lower layer (yellow-colored complex) was collected in a tube covered with aluminum foil to prevent photodegradation. After the final addition, 3 mL of the complex was collected and combined with the previously collected solution. The absorbance of the yellow-colored complex was measured at a wavelength of 470 nm. Atropine, at concentrations ranging from 0 to 60 μg mL−1 in distilled water, was used to generate a standard curve. Each sample was analyzed in triplicates, and the resulting TAC was expressed as milligrams of atropine equivalent per gram of dry weight mg alkaloid equivalent g−1 dry weight (mg AE g−1 DW).

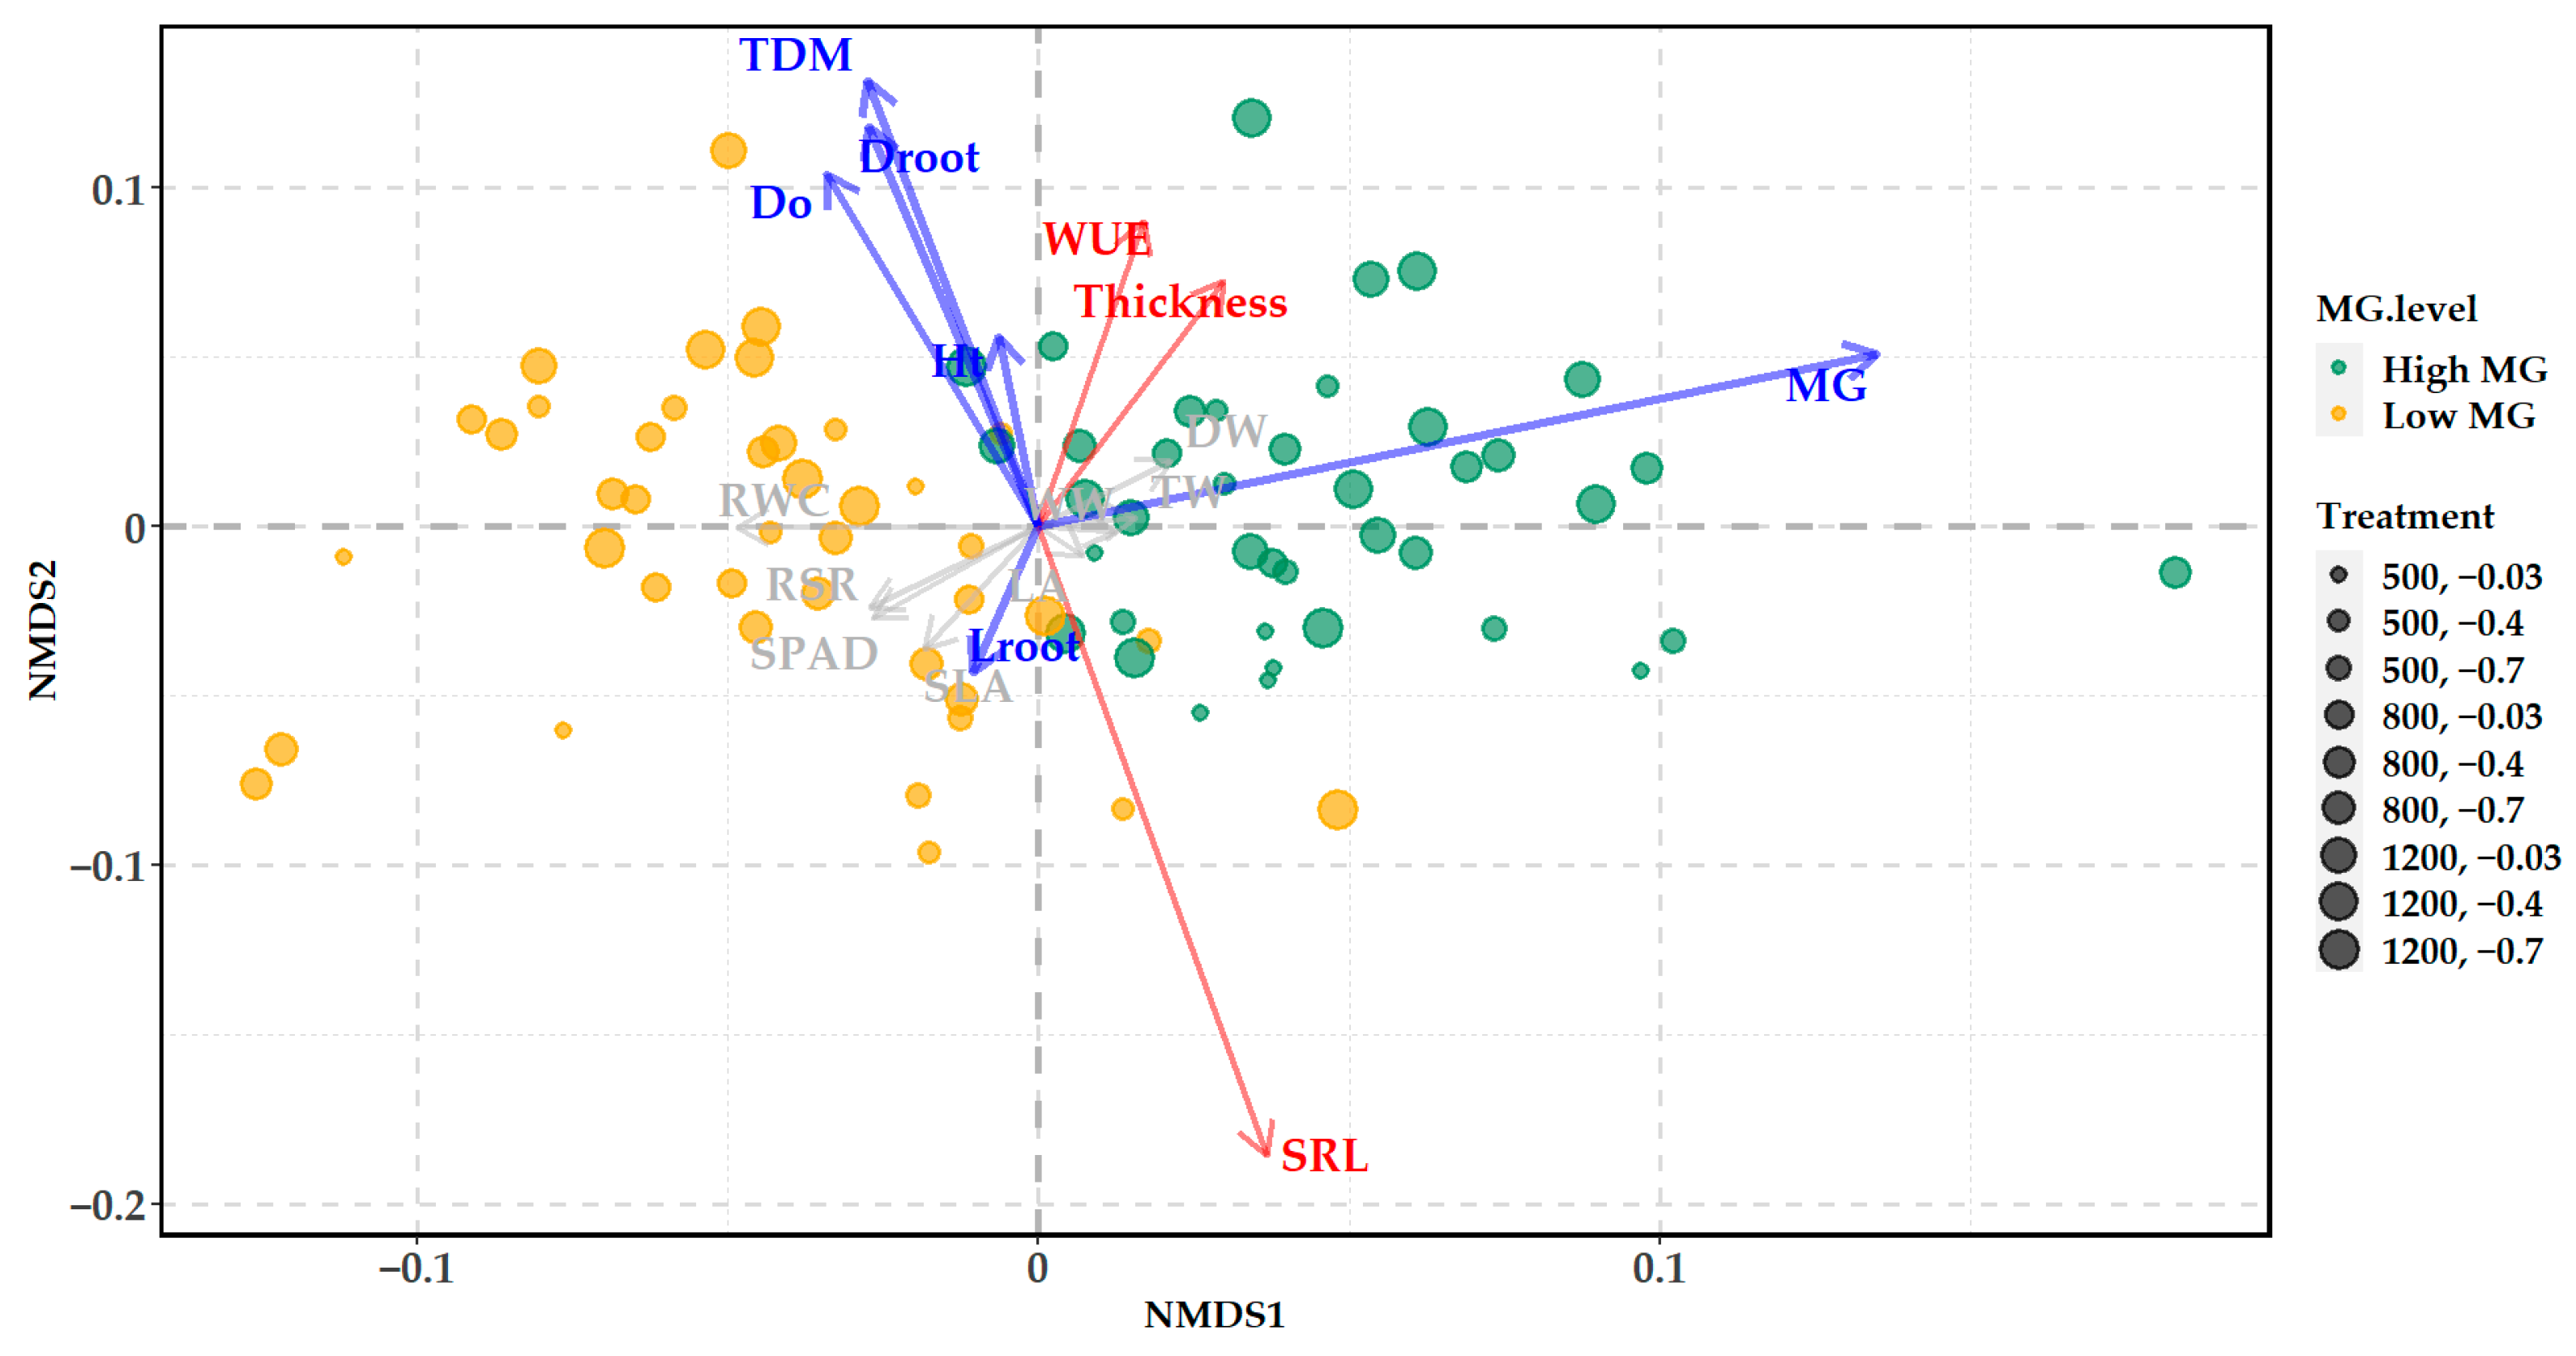
2.6. Constrained Ordination Analysis

Non-metric multidimensional scaling (NMDS) explores the relationships within multivariate data by representing the similarities or dissimilarities among samples in a lower-dimensional space. This constrained ordination technique is particularly useful when dealing with data with underlying non-linear and complex relationships [42]. Samples are placed in a multidimensional space so that the rank order of pairwise dissimilarities in the original high-dimensional space is preserved as faithfully as possible in the reduced space through iterative optimization, by minimizing the stress function. Results of the analysis can be used to identify patterns that might not be obvious through univariate analyses [43].
In the present study, NMDS was used to model the relationship between growth parameters (Do, plant height, TDM, Droot, Lroot, and MG accumulation) and various physiological and morphological traits, including leaf thickness, leaf wet weight, leaf turgid weight, leaf dry weight, LA, RWC, SLA, RSR, SRL, WUE, and chlorophyll content measured through SPAD. The ordination was performed using Bray–Curtis dissimilarity, as it can handle the scales observed in the measured variables. The results were presented as tri-plots to indicate clustering patterns based on high or low MG accumulation. All analyses were conducted in R (version 4.4.2) [44] using the vegan package (version 2.6-4) [45].

2.7. Mean Comparison Through Analysis of Variance

Mean differences among treatment combinations of the various growth parameters, physiological characteristics, and MG content were tested by ANOVA using R [44] (Supplementary File). To identify potential outliers in the dataset, studentized residuals were calculated, with values exceeding ±3 considered potential outliers and removed from further examination. Least significant difference (LSD) was used as a post hoc analysis with the agricolae package (version 1.3-7) [46]. A schematic of the overall workflow employed in the study is shown in Figure S1 of the Supplementary Materials.

3. Results

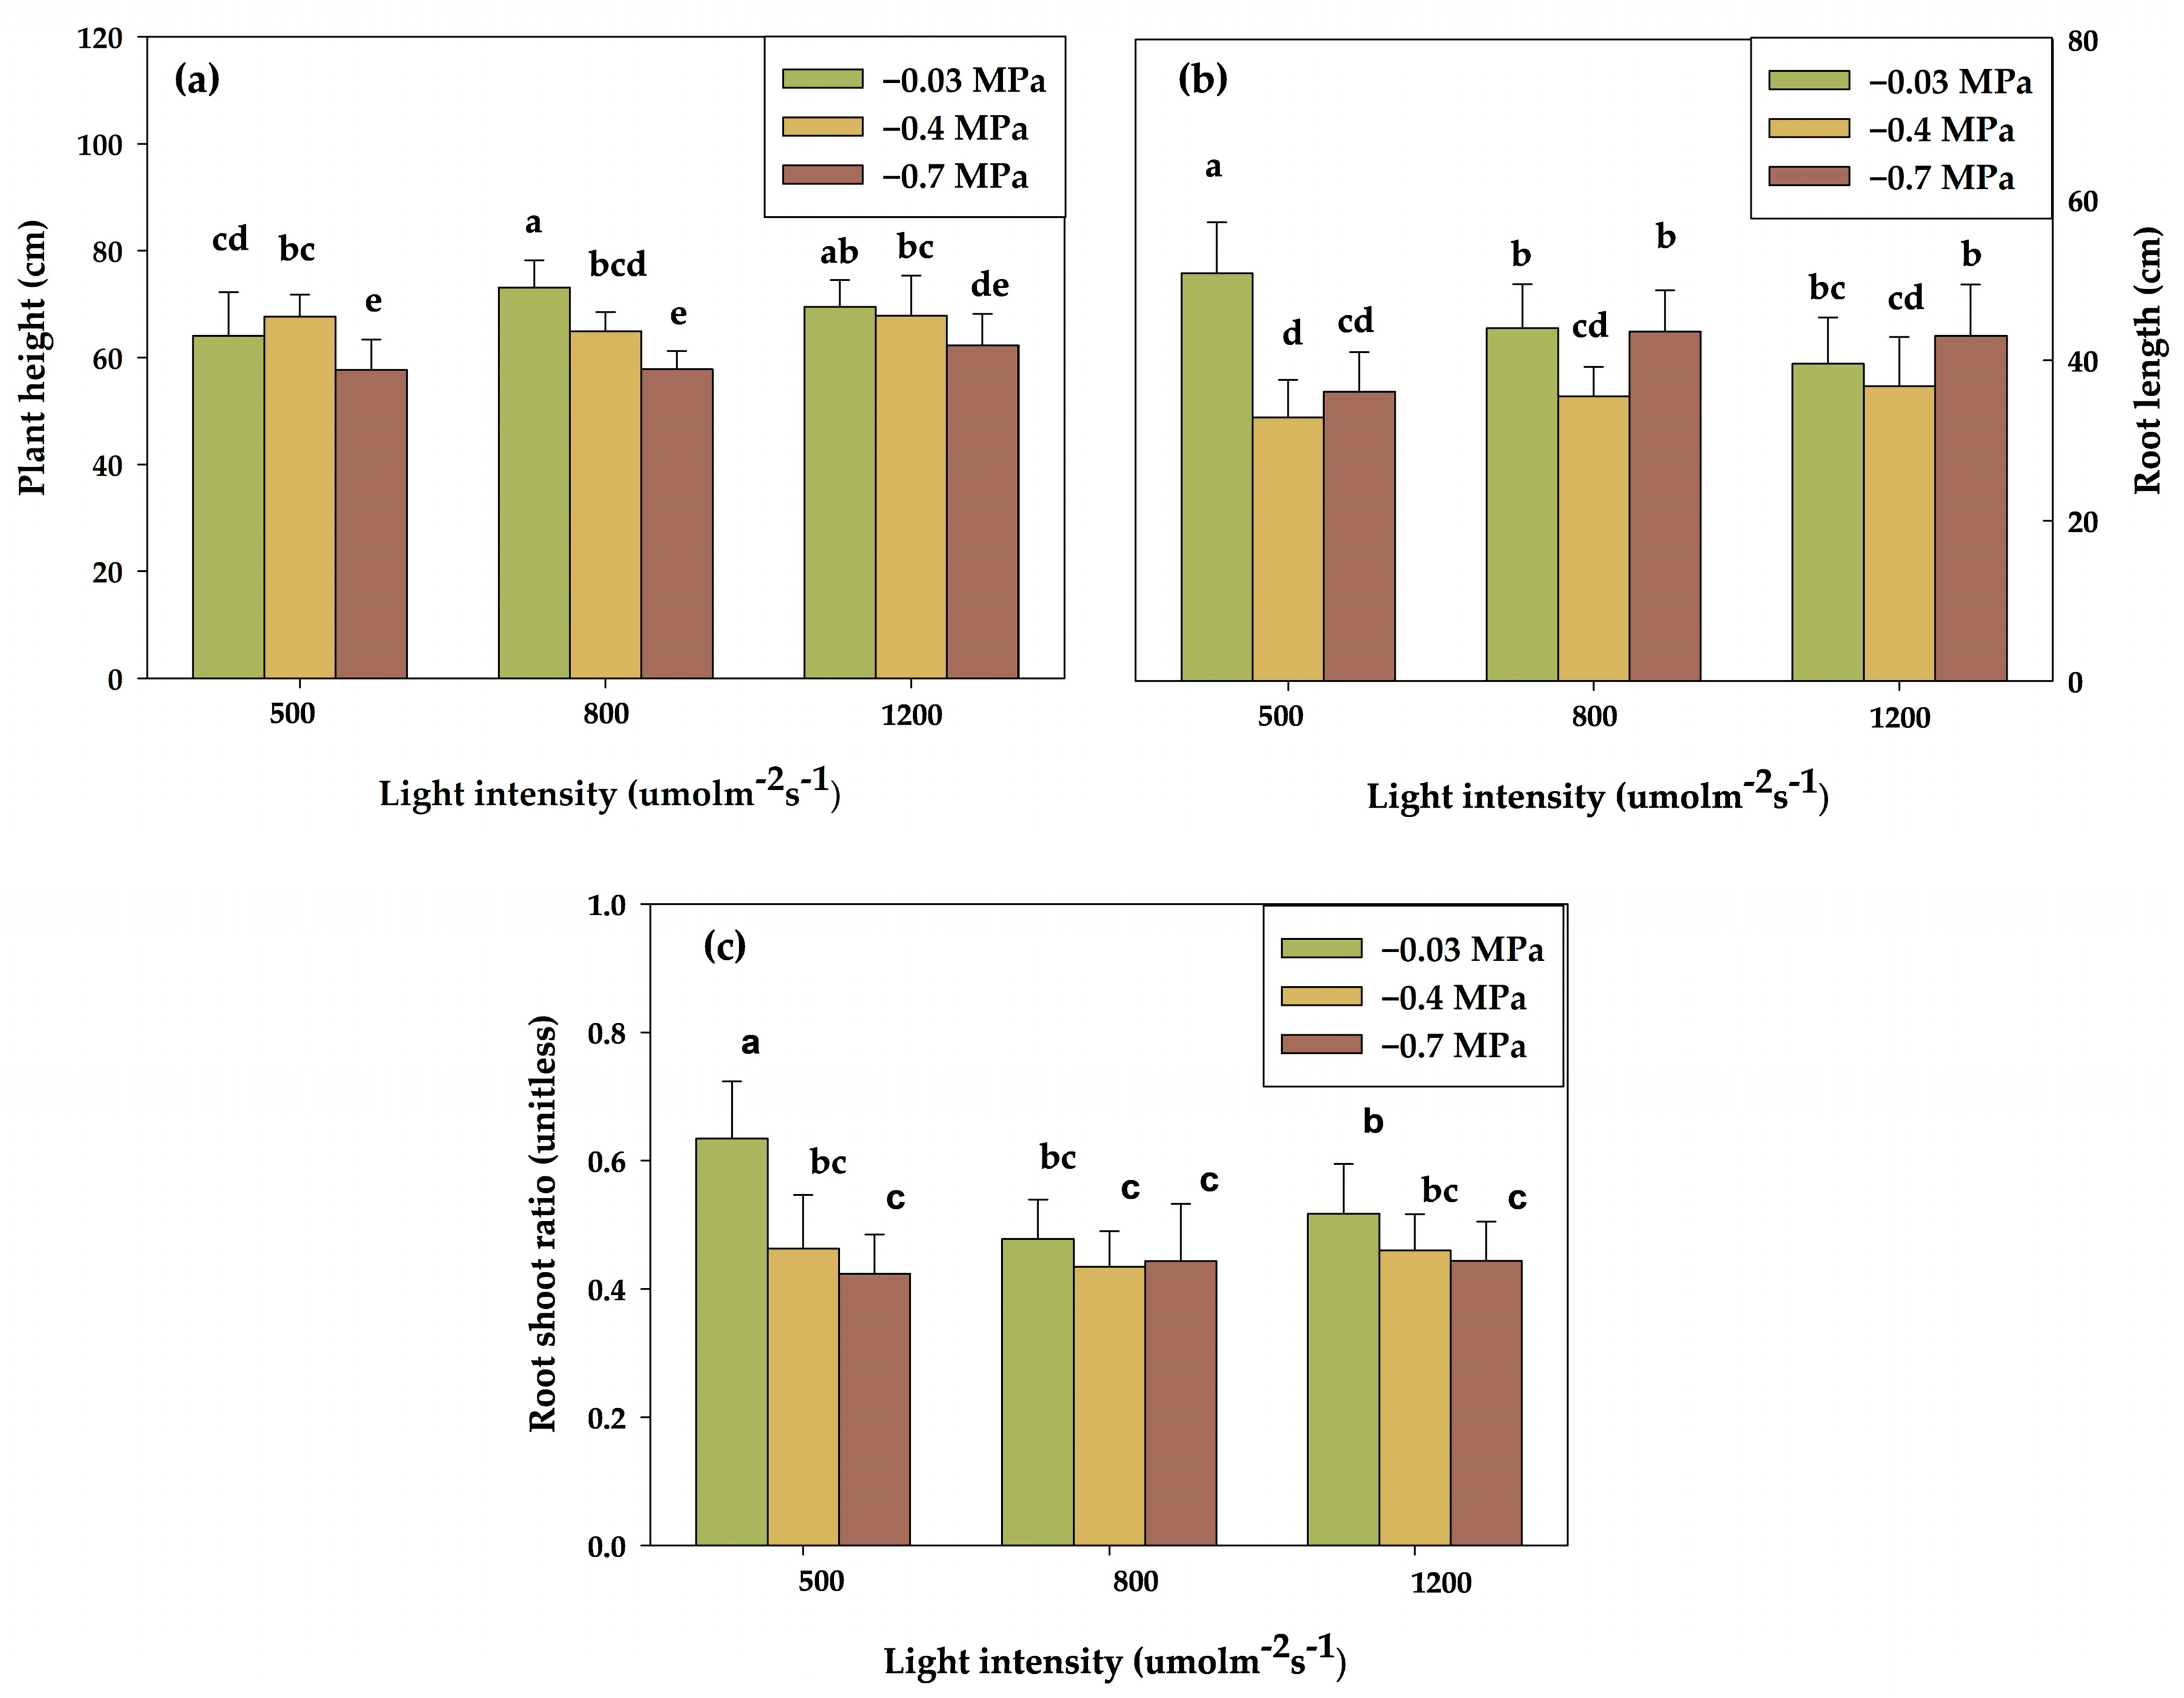
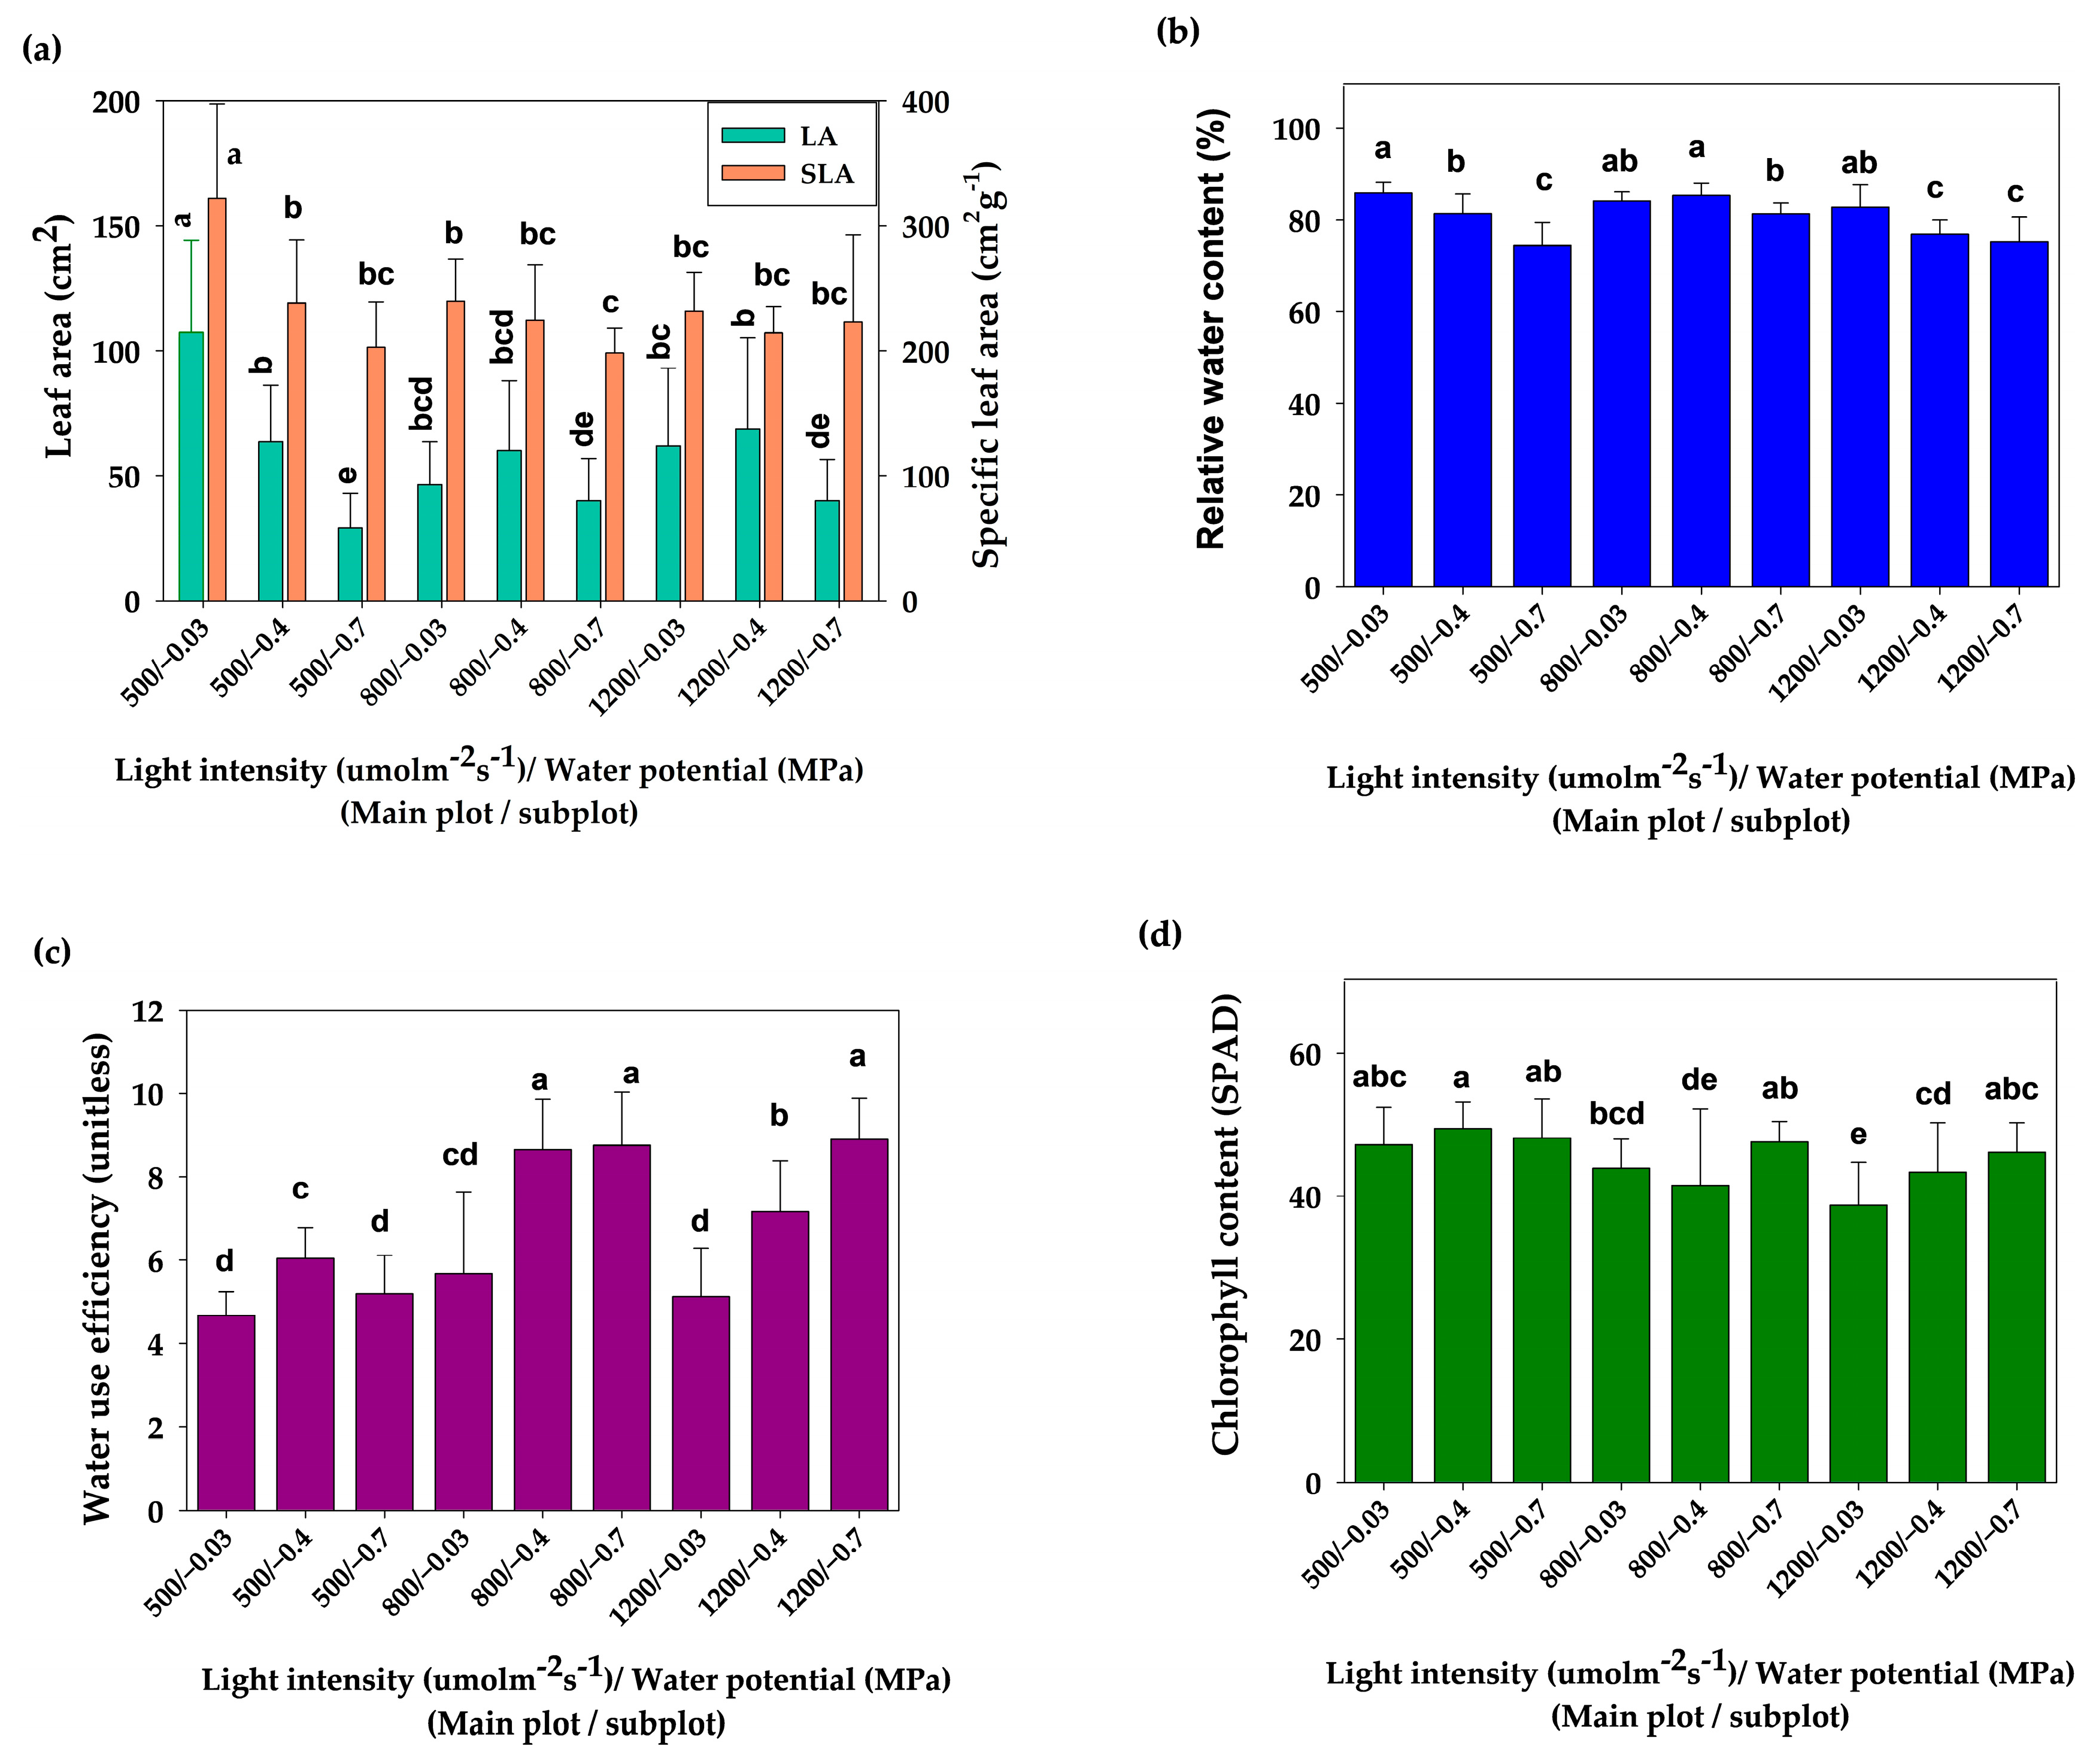
3.1. Effect of Light and Water Potential on Growth and Physiological Parameters

Table 1 shows the influence of light intensity and polyethylene-glycol-induced water stress at different growth stages on the morphological characteristics of kratom seedlings. Figure S2 indicates that the residuals for all traits exhibited homoscedasticity, as shown by the residuals vs. fitted values plot, while the Q–Q plot confirmed that the residuals followed a normal distribution. The effect of either light intensity (main effect) or water potential (sub-effect) was significantly different on dry mass (total, stem, leaf, and root) as well as stem and root diameter, with plants under high light and water potential of −0.03 MPa exhibiting the highest values. Specifically, low light intensity (500 μmol m−2s−1) and low water potential (−0.7 MPa) led to a significant reduction in growth, as indicated by total dry mass (p < 0.0001), which decreased by approximately 49% relative to high light (1200 μmol m−2s−1) and moderate water potential (−0.4 MPa). Stem dry mass followed a similar trend, with the highest value measured under high light (23.83 ± 6.92 g) and high to moderate water potential (−0.4 MPa) (ranged of 21.29–21.95 g).
Only plant height (p = 0.030), root length (p < 0.0001), and root shoot ratio (p = 0.015), exhibited any significant differences in interaction between light intensity and water potential (Figure 3). Under high light, plant height was not statistically different between water potential of −0.03 MPa (69.52 ± 5.01 cm) and moderate water potential (−0.4 MPa, 67.84 ± 7.5 cm). However, seedlings under low light and low water potential were the shortest (57.72 ± 5.67 cm), representing a 21.1% decrease (Figure 3a). Root length was significantly affected by the interaction between low light (500 μmol m−2s−1) and water potential of −0.03 MPa (Figure 3b). The longest root length was measured under low light and water potential of −0.03 MPa (50.87 ± 6.36 cm), whereas the shortest root length (32.87 ± 4.72 cm) was recorded under moderate water potential (−0.4 MPa) and low light, a reduction of over 35%. Plants under stress typically allocate more resources to root development than shoot growth, resulting in a higher root-to-shoot ratio. However, under −0.7 MPa, extensive root mortality was observed, leading to a reduced root-to-shoot ratio (Figure 3c).
The interaction between light and water potential had a significant influence on most traits (p < 0.05) (Figure 4), apart from thickness (p = 0.349) (Table 1). Leaves were thicker under high light intensity (0.20 ± 0.03 mm). The largest leaves (in terms of LA) were observed in seedlings growing under water potential of −0.03 MPa and low light intensity. SLA, which is a key indicator of growth, followed the same trend as that of LA. Seedlings growing under water potential of −0.03 MPa and low light conditions had the largest leaves (107.34 ± 36.89 cm2), while the smallest leaves were measured under low water potential and low light (29.13 ± 13.75 cm2), representing a decline of over 70%. SLA, a key indicator of growth, followed a similar trend to LA, a reduction of more than 35% under very low water potential (−0.7 MPa) and moderate light availability (800 μmol m−2s−1) (Figure 4a). RWC varied between 75 and 85% and was significantly lower at −0.4 MPa and −0.7 MPa compared to −0.03 MPa. (Figure 4b). There was an increase of 70% in WUE (Figure 4c) and a decrease of over 20% in chlorophyll content (measured through SPAD) (Figure 4d) under high light (1200 μmol m−2s−1) and water potential of −0.03 MPa. These findings imply a complex interplay between water conservation mechanisms, photosynthetic capacity, and resource use efficiency, highlighting the strategies through which kratom seedlings optimize growth and survival under environmental stress.

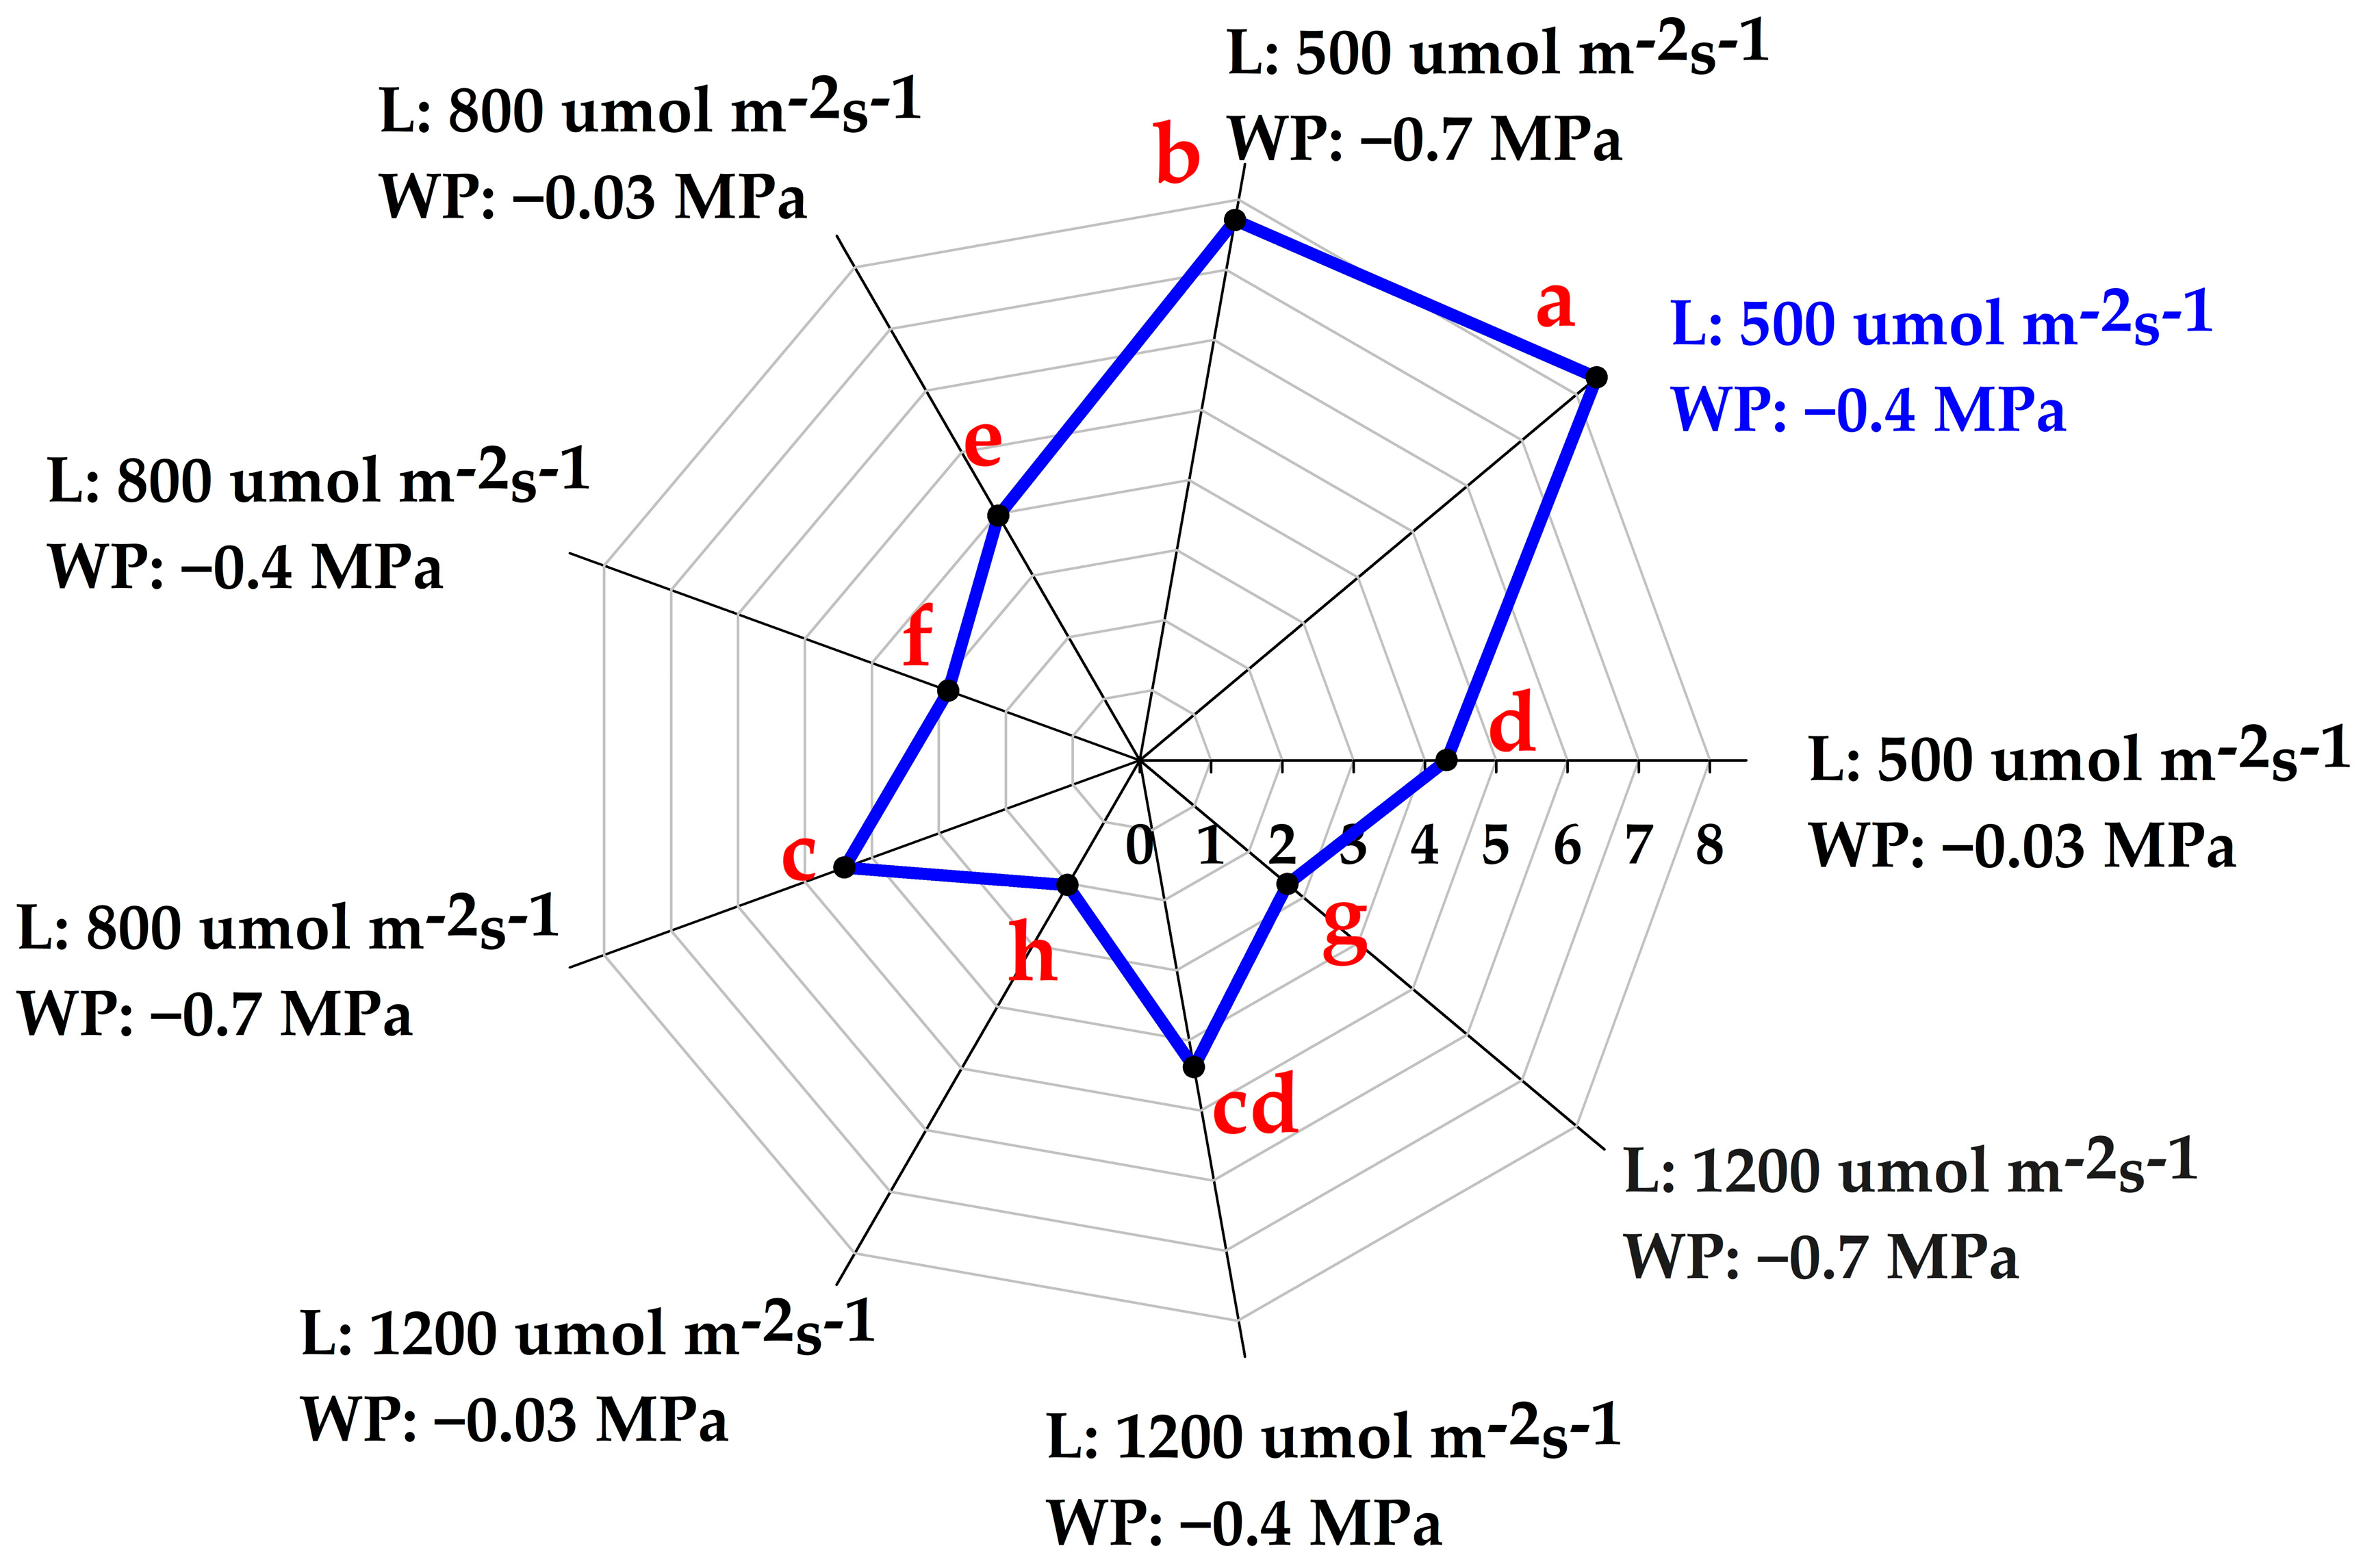
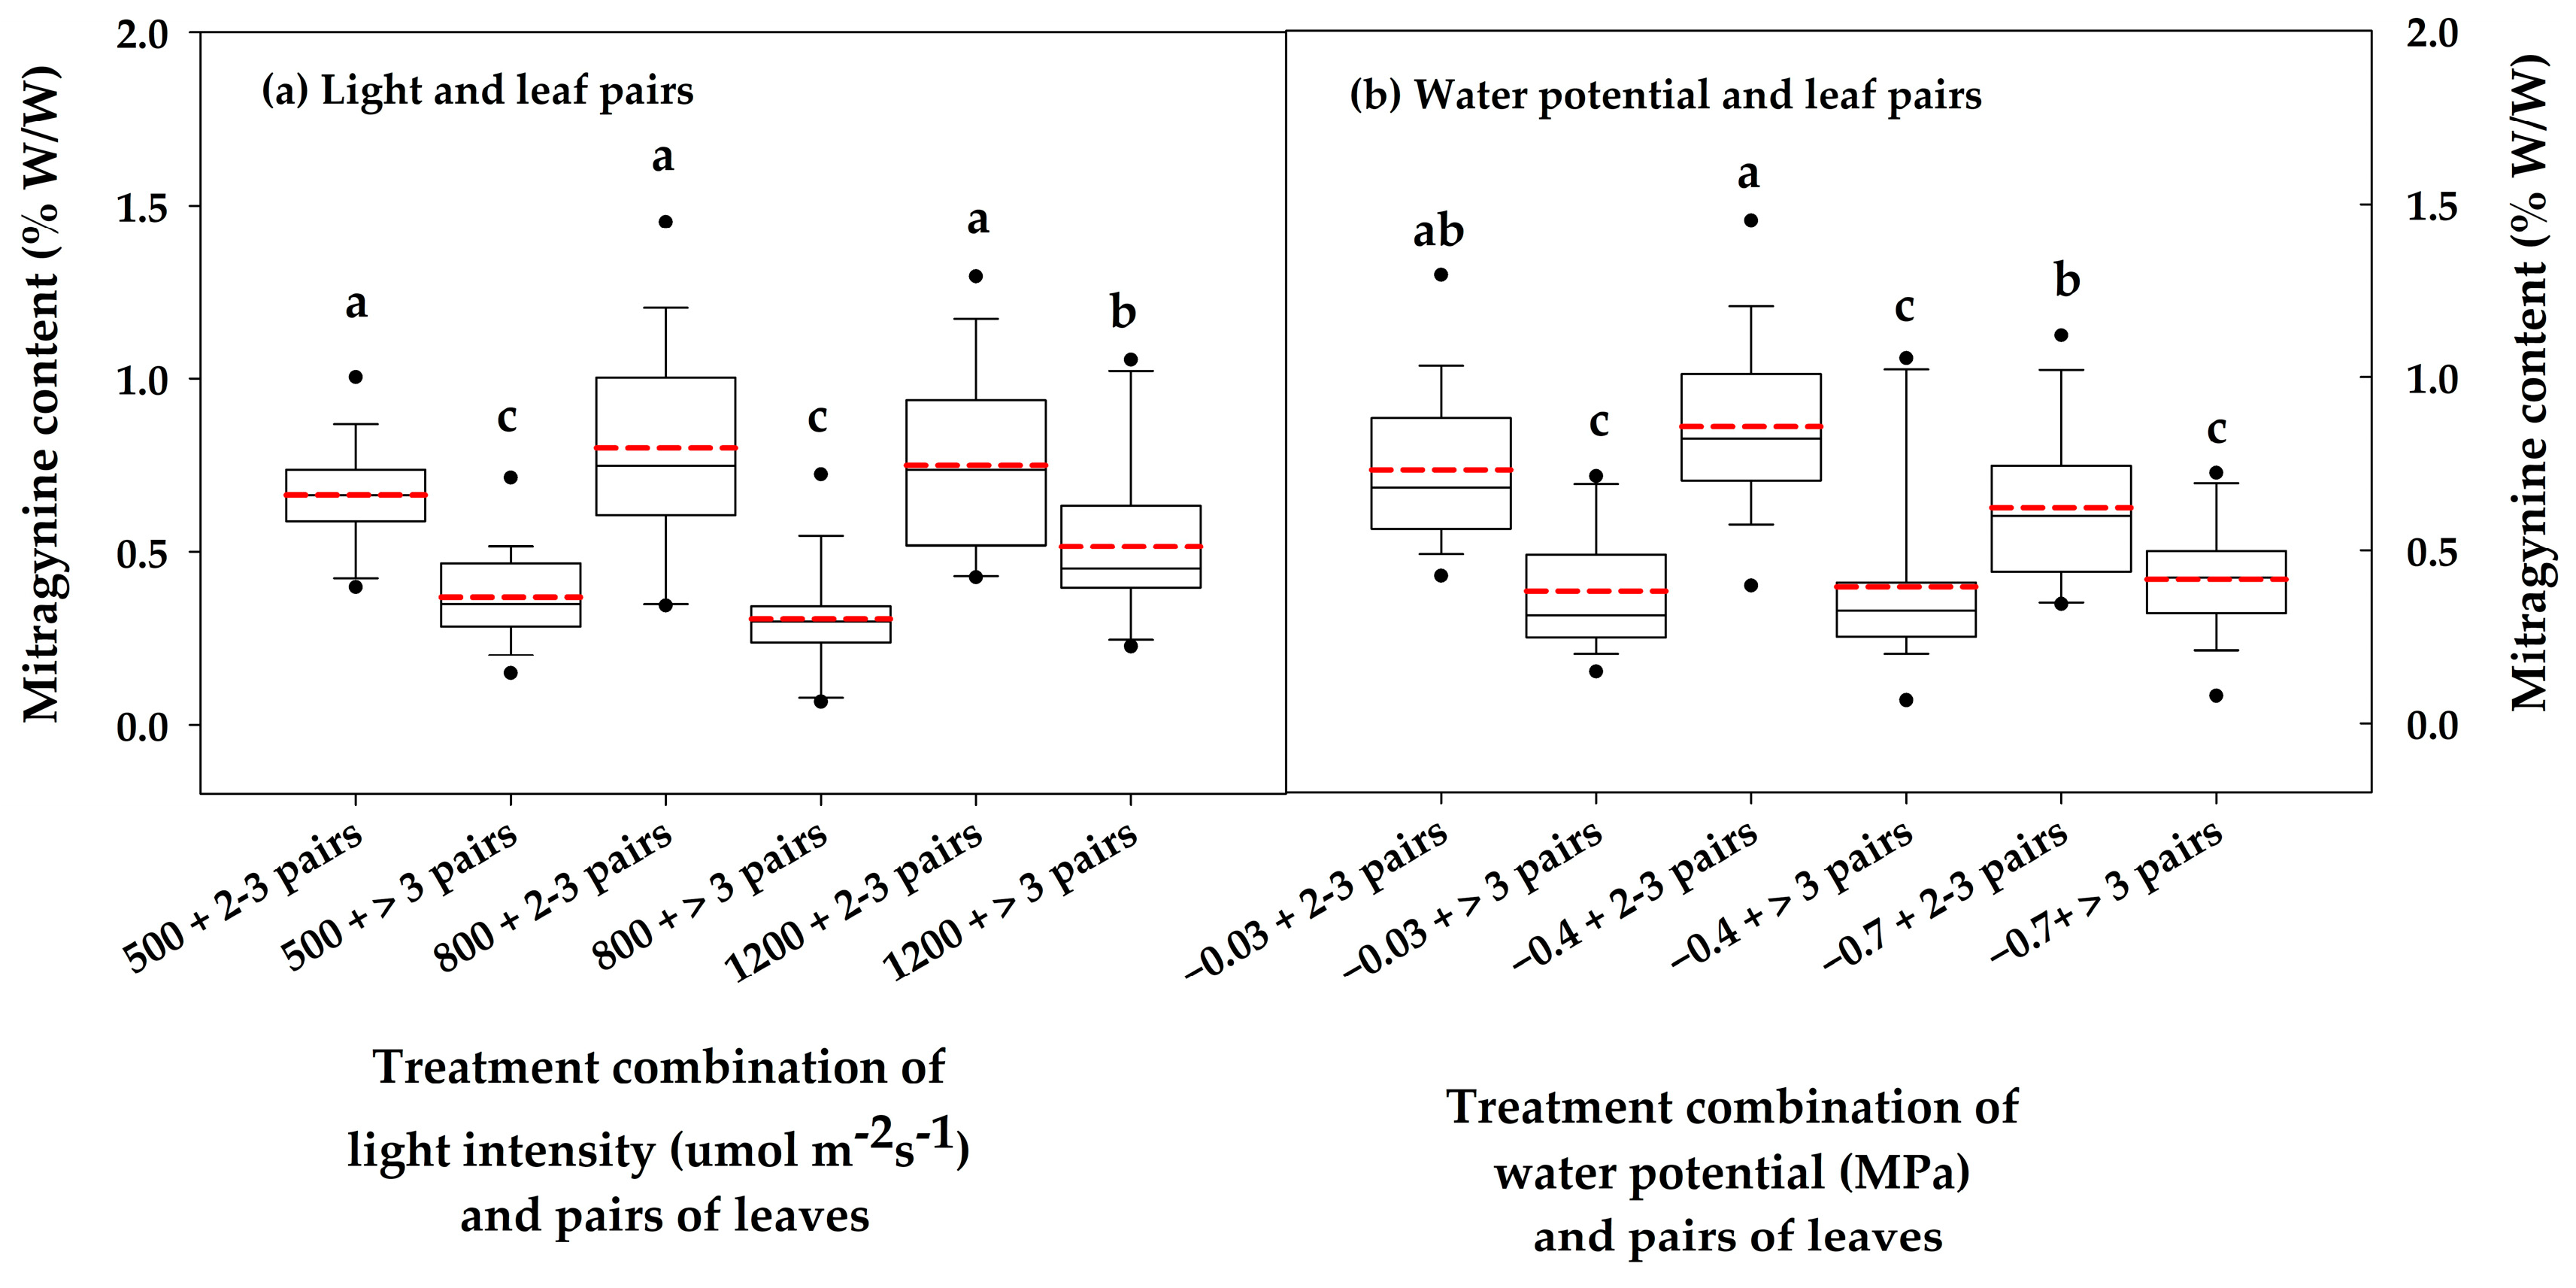
3.2. Variation in Total Alkaloid Content and Mitragynine Levels

The total crude yield of TAC extracted using methanol as a solvent was approximately 32.15 ± 10.38 mg g−1 DW. However, the extraction efficiency varied across treatments, with relatively higher levels extracted under low-light conditions. As seen in Figure 5, relatively higher levels observed under low-light conditions (500 μmol m−2s−1) and moderate to high reductions in water potential (ranging from 7.0 to over 8.0 mg g−1 DW) suggest an increased alkaloid biosynthesis under reduced water potential. In contrast, TAC accumulation was suppressed under high light intensity (1200 μmol m−2s−1) across all water potentials.
As the primary chemical of interest in kratom, MG accumulation was quantified under different light intensities, water potentials, and leaf ages (second and third pairs vs. >third pairs) to determine whether MG content was influenced by leaf maturity. Figure 6 presents the chromatogram detecting various compounds, with a peak at 14.3 min corresponding to the MG standard (gray line), confirming the presence of MG in the analyzed extract. The ANOVA results (Table S3) indicate that interactions between light and leaf age (F = 4.478, p = 0.014), as well as between water potential and leaf age (F = 4.016, p = 0.021), had a significant effect on MG accumulation, suggesting that younger leaf pairs accumulated significantly higher MG content than older pairs. Additionally, there were significant interactions of leaf age with light intensity (F = 4.478, p = 0.014) and water potential (F = 4.016, p = 0.021), but no significant three-way interaction among light intensity, water potential, and age was observed. This implies that the influences of light and water potential on the MG accumulation were independent of each other and primarily based on leaf maturity, rather than through a combined effect.
The overall MG content was significantly higher in younger leaves (second and third pairs) compared to older leaves (>third pairs), with an average of 0.74 ± 0.24% and 0.40 ± 0.19%, respectively (Figure 7). Light intensity did not significantly influence the accumulation of MG in younger leaves across the three light levels (500, 800, and 1200 μmol m−2s−1) (Figure 7a), with the highest MG yield obtained under higher light intensity. However, in the older leaves (>third pairs), MG content was highest (~0.65%) under high light intensity (1200 μmol m−2s−1), while the lowest was observed under low light (500 μmol m−2s−1) (~0.38%), representing an increase of over 40% in MG accumulation under higher light levels. In contrast, the older pairs showed no significant difference in MG yield across the three water potentials (Figure 7b).
Figure 8 exhibits an ordination tri-plot of the leaf samples (colored circles) based on physiological and morphological traits (red vectors) as well as growth parameters and MG content (blue vectors), with samples colored according to high or low MG and the size of the samples indicating the treatment (Figure 5). Distinct separation between the low and high MG levels can be seen in correspondence with the underlying traits associated with these two levels of alkaloid accumulation (plotted in vectors). The vectors plotted in gray (RWC, SLA, SPAD, RSR, etc.) were found to be statistically insignificant (p > 0.01), while vectors in blue indicate significant traits. Leaf thickness, SRL, and WUE (indicated by red vectors) were found as significant traits, with leaf thickness being closely associated with MG accumulation (as also seen in the contour plot in Figure 5). SRL was anti-correlated with all growth-related variables, which might indicate a trade-off between above-ground growth and MG accumulation.
Figure 9 contains NMDS ordination plots with contour gradients of the most significant plant traits (leaf thickness, SRL, and WUE) overlaid. Thicker leaves (yellow-filled contours) are associated with higher MG accumulation, while thinner leaves (purple-filled contours) were aligned along lower MG levels (Figure 9a). Furthermore, the association of thicker leaves with traits such as TDM, Droot, Do, and plant height suggests that this trait could be linked to robust growth. Variations in SRL are not aligned with MG accumulation, but its higher values (yellow-filled contours) could be associated with lower values of other growth traits like TDM, Droot, Do, and plant height (Figure 9b). Higher WUE (yellow-filled contours) is strongly associated with both high MG accumulation and enhanced growth traits, such as TDM, Droot, Do, and plant height (Figure 9c). This suggests that plants with optimized water use may be able to direct resources towards MG accumulation.

4. Discussion

The cultivation of Mitragyna speciosa (kratom) has garnered significant attention due to its rich chemical profile, resulting in both commercial and medicinal demand [3,26]. As such, an understanding of how environmental conditions can influence the accumulation of its bioactive compounds is important. This study quantified the effects of various combinations of light and water potential on kratom seedlings grown in a controlled hydroponic system, focusing on growth traits, MG accumulation, TAC levels, and variations in accumulation with leaf maturity. Growth was suppressed under high water potential and low light intensity, indicating the limitation of photosynthetic carbon gain and resource allocation efficiency in seedlings under elevated stress conditions [47]. However, the observed variability in TDM and stem diameter across treatments suggests that a mild reduction in water potential, combined with sufficient light, may optimize carbon partitioning between shoot and root biomass or promote strategic resource allocation to aboveground tissues under favorable conditions. This, in turn, can enhance competitive aboveground traits such as canopy expansion and light capture [48].
Physiological parameters such as RWC and SPAD were modulated by water potential and photosynthetic efficiency. The observed reduction in SPAD values at high light intensities, despite high water potential, could indicate photodamage or oxidative stress [49,50] or suggest a light tolerance threshold beyond which photosynthetic efficiency declines. This observation, therefore, points to a trade-off between maximizing light utilization and avoiding photoinhibition [51]. A significant increase in WUE under moderate to low water potential and light intensity suggests that kratom seedlings balanced water conservation with growth demands, ensuring survival under stress, while potentially enhancing resource use efficiency [51].
Plants avoid sub-optimal light conditions through changes in their morpho-anatomical, physiological, and biochemical status [52]. Morpho-anatomical strategies include thicker leaves, lower SLA, and fewer grana [52]. As previously observed [53], thicker leaves with lower SLA under high light and reduced water potential may indicate a shift toward structural adaptations aimed at enhancing water retention and minimizing water loss through transpiration [54], combined with physiological enhancements such as a significant increase in WUE under these conditions. Moreover, traits like smaller leaf area, larger leaf thickness, and higher leaf tissue density are recognized as strategies of adaptation to low water potential [55]. Significant reductions in LA observed under low water potential, with little to no effect of light intensity, contrast with reports of higher LA under shade alone, highlighting that water potential may have a relatively stronger influence in determining such trait adaptations [56].
The highest TAC was accumulated under moderate water potential (−0.4 MPa) and low light intensity (500 μmol m−2s−1), indicating that enhanced alkaloid production is a defensive mechanism against oxidative stress [57]. Drought stress has been reported to influence the production and accumulation of several classes of bioactive compounds [58], including alkaloids in medicinal plants [59], as evidenced by elevated levels of alkaloids in Plectranthus amboinicus [60]. Variations in light have also been linked to accumulation of a broad range of SMs, including alkaloids [61,62]. The observed variations in the content of bioactive compounds highlight the interactive effects of water potential and light intensity on the foliar accumulation of these compounds in kratom. Combined effects of water availability and light have been reported to modify response patterns, depending on species, intensity, and the duration of exposure [63,64].
Under moderate light (800 μmol m−2s−1) and water potential, relatively similar TAC accumulation was observed. Moderate water potential likely promotes a shift in metabolic allocation from growth to secondary metabolite synthesis, a mechanism commonly observed in medicinal plants under controlled abiotic stress [65]. Very low TAC under high light intensity (1200 μmol m−2s−1), particularly under low water potential (−0.7 MPa), may cause metabolic exhaustion, reduced carbon assimilation, and impaired photosynthetic efficiency due to oxidative damage and stomatal closure [66]. This reduced accumulation suggests that under these stress levels, kratom seedlings prioritized survival over metabolite production. Hazrati et al. [56] had previously indicated that lowering light intensity could alleviate the detrimental effects of water deficit by modulating both primary and secondary metabolism in Aloe vera, helping to maintain productivity and reduce yield losses under water-limiting conditions. Furthermore, enhanced accumulation or suppression under various abiotic stresses has been reported across multiple medicinal plant species. For instance, moderate drought led to enhanced TAC in Catharanthus roseus and Nicotiana tabacum, through a diversion of nitrogen metabolism from primary growth to secondary metabolism [67,68]. Brechner et al. [69] demonstrated that moderate UV-B radiation and drought stress increased TAC accumulation in Hypericum perforatum, but extreme stress conditions led to metabolic disturbances that reduced metabolite accumulation.
Several studies have also noted that reduced light availability increased the concentrations of SMs such as glycyrrhizic acid and liquiritin in Glycyrrhiza uralensis [70], methylxanthines in Ilex paraguariensis [71], and aloin (barbaloin) in Aloe mutabilis [72]. It has been reported that a reduction in light intensity lowered the yields of ursolic and oleanolic acid in Gentiana longituba (an extremely shade-tolerant species) [52]. However, significant accumulation has been observed under low light in shade-tolerant species such as Tabernaemontana pachysiphon [73], compared to light-demanding species like Rauvolfia vomitoria [74]. Under drought conditions, both the quality and quantity of SMs produced by medicinal plants are generally higher than under optimal conditions [75]. Moderate drought stress induced the accumulation of osmolytes and bioactive SMs in Saposhnikovia divaricata, while severe drought stress reduced the relative content of certain compounds [76]. The interaction between drought and radiation led to increased levels of salicylic acid in barley leaves and higher proline content in lettuce, but reduced quercetin levels in lettuce compared to the effect of treatments acting alone [77,78].
Variations in TAC and specific bioactive compounds often do not follow similar trends, as their accumulation is highly alkaloid- and species-specific [79]. The interactions between light stress and water potential indicate a complex metabolic adjustment as an adaptive response to environmental pressures. In general, the accumulation of nitrogen-containing SMs, such as alkaloids, tends to increase under reduced light intensity [71]. Patterns in MG accumulation and associated traits were determined through NMDS (Figure 8 and Figure 9), indicating trait-related mechanisms employed by kratom to optimize resource use under variable environmental conditions. The MG accumulation followed the same trend as growth and physiological traits, with mild water potential (25% of the permanent wilting point; −0.4 MPa) promoting greater MG accumulation, while light intensity had a relatively weaker effect (Figure 7). Zhang et al. [34] similarly reported the highest MG content in shade, but at a much lower accumulation of 0.021 ± 0.001% (w/w), whereas in our study, the MG content ranged widely from 0.07% to 1.45% (w/w).
MG levels were consistently higher in younger leaves, while light intensity alone did not have a significant effect, diverging from the findings of Zhang et al. [34]. This suggests that the age of kratom seedlings and leaves can play a significant role in determining the MG content. Phromchan et al. [7] also quantified MG content across various leaf ages in 10-year-old kratom trees, finding that the first to third leaf pairs accumulated the highest concentrations, at 5–6% (w/w), while the older pairs accumulated significantly lower levels, averaging 4% (w/w). These results indicate two key points: first, older plants tend to have higher overall MG content, and second, mature leaves (second to third pairs) accumulate higher MG levels than older leaf pairs, which aligns with both the current study and the findings of Laforest et al. [6].
Previous reports of variations in bioactive compound accumulation with leaf age have indicated that younger leaves often exhibit higher concentrations of SMs for rapid growth and protection against biotic [80] and abiotic [81] stresses. Campa et al. [82] noted significant differences in the levels of alkaloids, xanthonoids, and flavonoids across juvenile, growing, and mature coffee leaves, attributing these variations to specific leaf developmental stages. In the present study, variations in light intensity did not elicit a response in MG levels of younger leaves, while the light sensitivity of older leaves indicates the adaptive role of tissue age in responding to various light stresses through SMs, previously observed in other Rubiaceae species [83]. Moreover, a previous observation reported higher MG and lower speciociliatine levels in stipules as a defensive chemical, with changes occurring as leaves mature [6].
Safety concerns regarding kratom are often tied to potential for its misuse and the presence of unregulated products in the market. Cases of toxicity and adverse effects, particularly cardiovascular complications and liver damage, have been reported, often in association with adulterated products or concurrent use with other substances [84]. Extremely rare events, including seizures [85] and death [86], have also been reported. Furthermore, MG itself has been identified as a cause of dependence and withdrawal symptoms, raising questions about its safety profile when consumed in higher doses [87].
The potential for kratom abuse and its role in polypharmacy settings remains significant. MG concentrations in commercial products are often inconsistent, posing risks of overdose or unintended toxicity [88]. This highlights the urgent need for regulatory oversight to standardize product quality and ensure public safety. As such, public awareness campaigns and clinical studies on long-term effects are critical to mitigate associated risks and in promoting informed use. To ensure ethical integrity, this research was conducted solely for the advancement of scientific understanding related to kratom and its alkaloids under controlled environmental conditions. The objective was to present the physiological responses of the plant and the factors influencing the accumulation of bioactive compounds like mitragynine. Importantly, this research is not intended to encourage unregulated use of kratom or its derivatives. Rather, the study aims to provide evidence-based research to inform sustainable cultivation and regulatory frameworks that ensure safe and ethical use. We emphasize that the role of this scientific investigation is to guide the responsible use of kratom as a medicinal plant, addressing both its potential benefits and associated risks [89].

5. Conclusions

This study quantified the growth and MG content of kratom seedlings under varying light intensity and water potential in a controlled hydroponic setting. The findings indicated that seedlings could tolerate mild reductions in water potential despite kratom’s native swamp habitat, but water potential of −0.7 MPa negatively impacted both growth and MG content. Complex interactions between stressors highlight the importance of moderate stress levels in enhancing plant defense mechanisms without compromising metabolic functions, promoting the accumulation of valuable secondary metabolites. Carefully managing environmental stressors can optimize the yield of pharmacologically important compounds, demonstrating the potential of precision agriculture to conserve water while sustaining alkaloid production. These findings are particularly relevant given the rising interest in kratom cultivation following its reclassification as a medicinal plant in Thailand, and can inform evidence-based cultivation practices to enhance its viability as a high-value medicinal crop.
Genetic variability from seed propagation may have influenced the observed responses, and tissue culture methods could help eliminate this factor. Future research would investigate MG accumulation in genetically identical seedlings, such as clonal propagates, to improve reproducibility and assess metabolite distribution across different plant organs. Additionally, the LED system used may not fully replicate natural sunlight, particularly in the UV and far-red spectrum, potentially affecting photomorphogenic responses. The setup of the split-plot design was such that the independent effects of light and water potential could not be isolated, which future factorial experiments could address. Expanding the analysis to include root metabolites would further clarify metabolic allocation under varying stress conditions.

Supplementary Materials

The following supporting information can be downloaded at: https://www.mdpi.com/article/10.3390/horticulturae11030272/s1, Figure S1: Workflow outlining the experimental scheme from seedling preparation to data analysis. Kratom seedlings were grown from seeds collected from native habitat in the southern part of Thailand, transplanted into a hydroponic setup, and subjected to environmental stress under split-plot design for five weeks. Key parameters including growth, physiological traits, total alkaloid content (TAC), and mitragynine (MG) accumulation were measured. Statistical analysis, including mean comparisons (ANOVA) and ordination analysis (NMDS), was conducted to interpret the effects of light and water potential on plant traits and metabolite accumulation; Figure S2: Diagnostic plots to check the normality and homoscedasticity of residuals using ANOVA. The Q-Q plot (left) evaluates the normality of residuals, showing how closely they follow a theoretical normal distribution. The residuals vs. fitted values plot (right) assesses homoscedasticity, indicating whether residual variance remains constant across fitted values; Table S1: ANOVA table for split plot design with main plot as light intensity (3 levels) subplot as water potential (WP; 3 levels) and 3 block as replicates.; Table S2: Summary of P-values obtained from ANOVA comparisons for growth and physiological parameters of kratom. P-values in bold and asterisks (*) indicate statistically significant differences at a confidence level of 95%; Table S3: ANOVA table of MG content in split-split-plot design with light as whole plot (3 levels), water potential (WP) as subplot (3 levels), and age of the leaf (2 levels; 2nd and 3rd pairs vs. >3rd pairs). Significant main effect of age (p-value < 0.001) and interactions were observed light with age and water potential with age indicates roles in MG accumulation [90].

Author Contributions

N.L.: writing—review and editing, writing—original draft, visualization, validation, supervision, investigation, funding acquisition, conceptualization, resources, methodology, and data curation. T.A.: writing—review and editing, writing—original draft, visualization, validation, investigation, conceptualization, resources, methodology, and data curation. Y.K.-O.: investigation and data curation. S.C.: investigation and data curation. R.T.: conceptualization, resources, methodology, and data curation. A.A.: investigation and writing—original draft. C.N.: funding acquisition and conceptualization. S.U.: funding acquisition and conceptualization. W.S.: resources, methodology, and data curation. P.T.: investigation and data curation. S.A.: investigation and data curation. P.P.: investigation and data curation. All authors have read and agreed to the published version of the manuscript.

Funding

This work was financed by the Research and Innovation Promotion Fund of Thailand Science Research and Innovation (TSRI) through Kasetsart University Research and Development Institute (KURDI) Project No. FF(KU) 25.67.

Data Availability Statement

The raw data supporting the conclusions of this article will be made available by the authors on request.

Acknowledgments

We would like to thank the Research and Innovation Promotion Fund of Thailand Science Research and Innovation (TSRI) through Kasetsart University Research and Development Institute (KURDI) Project No. FF(KU) 25.67 for financial support.

Conflicts of Interest

The corresponding author, on behalf of all authors, confirms that there are no conflicts of interest that may influence the objectivity of the research presented in this manuscript.

Abbreviations

Ht = plant height; Droot = root diameter; Do = diameter at the root collar; LA = leaf area; LDM = leaf dry mass; MG = mitragynine; MPa = Megapascal; PEG = polyethylene glycol; PMs = primary metabolites; RDM = root dry mass; RSR = root:shoot ratio; RWC = relative water content; SDM = stem dry mass; SLA = specific leaf area; SMs = secondary metabolites; SPAD = chlorophyll content; TAC = total alkaloid content; TDM = total dry mass; Th = leaf thickness; WP = water potential; WUE = water use efficiency

References

  1. Cinosi, E.; Martinotti, G.; Simonato, P.; Singh, D.; Demetrovics, Z.; Roman-Urrestarazu, A.; Bersani, F.S.; Vicknasingam, B.; Piazzon, G.; Li, J.-H.; et al. Following “the Roots” of Kratom (Mitragyna speciosa): The Evolution of an Enhancer from a Traditional Use to Increase Work and Productivity in Southeast Asia to a Recreational Psychoactive Drug in Western Countries. Biomed. Res. Int. 2015, 2015, 968786. [Google Scholar] [CrossRef]
  2. Ngernsaengsaruay, C.; Leksungnoen, N.; Boonthasak, W.; Utharatsamee, S.; Racharak, P.; Leetanasakskul, K.; Pongamorn, P.; Saengbuapuean, A. Additional Knowledge on the Genus mitragyna (Rubiaceae) in Thailand. Thai For. Bull. 2022, 50, 20–39. [Google Scholar] [CrossRef]
  3. Leksungnoen, N.; Andriyas, T.; Ngernsaengsaruay, C.; Uthairatsamee, S.; Racharak, P.; Sonjaroon, W.; Kjelgren, R.; Pearson, B.J.; McCurdy, C.R.; Sharma, A. Variations in Mitragynine Content in the Naturally Growing Kratom (Mitragyna speciosa) Population of Thailand. Front. Plant Sci. 2022, 13, 1028547. [Google Scholar] [CrossRef]
  4. Limcharoen, T.; Pouyfung, P.; Ngamdokmai, N.; Prasopthum, A.; Ahmad, A.R.; Wisdawati, W.; Prugsakij, W.; Warinhomhoun, S. Inhibition of α-Glucosidase and Pancreatic Lipase Properties of Mitragyna speciosa (Korth.) Havil. (Kratom) Leaves. Nutrients 2022, 14, 3909. [Google Scholar] [CrossRef]
  5. Grundmann, O.; Garcia-Romeu, A.; McCurdy, C.R.; Sharma, A.; Smith, K.E.; Swogger, M.T.; Weiss, S.T. Not All Kratom Is Equal: The Important Distinction between Native Leaf and Extract Products. Addiction 2024, 119, 202–203. [Google Scholar] [CrossRef] [PubMed]
  6. Laforest, L.C.; Kuntz, M.A.; Kanumuri, S.R.R.; Mukhopadhyay, S.; Sharma, A.; O’Connor, S.E.; McCurdy, C.R.; Nadakuduti, S.S. Metabolite and Molecular Characterization of Mitragyna speciosa Identifies Developmental and Genotypic Effects on Monoterpene Indole and Oxindole Alkaloid Composition. J. Nat. Prod. 2023, 86, 1042–1052. [Google Scholar] [CrossRef]
  7. Phromchan, W.; Defri, I.; Saensano, C.; Chookaew, A.; Chiarawipa, R.; Sriwiriyajan, S. Morphological and Physiological Properties of Kratom (Mitragyna speciosa) Leaves: Macronutrients, Phytochemicals, Antioxidants, and Mitragynine Content. Plant Sci. Today 2024, 11, 762–770. [Google Scholar] [CrossRef]
  8. Liu, Y.; Singh, S.K.; Pattanaik, S.; Wang, H.; Yuan, L. Light Regulation of the Biosynthesis of Phenolics, Terpenoids, and Alkaloids in Plants. Commun. Biol. 2023, 6, 1055. [Google Scholar] [CrossRef]
  9. Zandalinas, S.I.; Balfagón, D.; Gómez-Cadenas, A.; Mittler, R. Plant Responses to Climate Change: Metabolic Changes under Combined Abiotic Stresses. J. Exp. Bot. 2022, 73, 3339–3354. [Google Scholar] [CrossRef]
  10. Akula, R.; Ravishankar, G.A. Influence of Abiotic Stress Signals on Secondary Metabolites in Plants. Plant Signal. Behav. 2011, 6, 1720–1731. [Google Scholar] [CrossRef]
  11. Erb, M.; Kliebenstein, D.J. Plant Secondary Metabolites as Defenses, Regulators, and Primary Metabolites: The Blurred Functional Trichotomy. Plant Physiol. 2020, 184, 39–52. [Google Scholar] [CrossRef]
  12. Fang, C.; Fernie, A.R.; Luo, J. Exploring the Diversity of Plant Metabolism. Trends Plant Sci. 2019, 24, 83–98. [Google Scholar] [CrossRef]
  13. Siddiqui, M.W.; Prasad, K. Plant Secondary Metabolites, Volume One; Biological and Therapeutic Significance; Apple Academic Press: Palm Bay, FL, USA, 2016. [Google Scholar] [CrossRef]
  14. Tattini, M.; Galardi, C.; Pinelli, P.; Massai, R.; Remorini, D.; Agati, G. Differential Accumulation of Flavonoids and Hydroxycinnamates in Leaves of Ligustrum Vulgare under Excess Light and Drought Stress. New Phytol. 2004, 163, 547–561. [Google Scholar] [CrossRef]
  15. Czepiel, K.; Krajewski Pawełand Wilczura, P.; Bielecka, P.; Święcicki, W.; Kroc, M. Expression Profiles of Alkaloid-Related Genes across the Organs of Narrow-Leafed Lupin (Lupinus angustifolius L.) and in Response to Anthracnose Infection. Int. J. Mol. Sci. 2021, 22, 2676. [Google Scholar] [CrossRef]
  16. Al-Khayri, J.M.; Rashmi, R.; Toppo, V.; Chole, P.B.; Banadka, A.; Sudheer, W.N.; Nagella, P.; Shehata, W.F.; Al-Mssallem, M.Q.; Alessa, F.M.; et al. Plant Secondary Metabolites: The Weapons for Biotic Stress Management. Metabolites 2023, 13, 716. [Google Scholar] [CrossRef]
  17. Schumann, T.; Paul, S.; Melzer, M.; Dörmann, P.; Jahns, P. Plant Growth under Natural Light Conditions Provides Highly Flexible Short-Term Acclimation Properties toward High Light Stress. Front. Plant Sci. 2017, 8, 681. [Google Scholar] [CrossRef]
  18. Herrmann, H.A.; Schwartz, J.-M.; Johnson, G.N. From Empirical to Theoretical Models of Light Response Curves-Linking Photosynthetic and Metabolic Acclimation. Photosynth. Res. 2020, 145, 5–14. [Google Scholar] [CrossRef]
  19. Darko, E.; Hamow, K.A.; Marček, T.; Dernovics, M.; Ahres, M.; Galiba, G. Modulated Light Dependence of Growth, Flowering, and the Accumulation of Secondary Metabolites in Chilli. Front. Plant Sci. 2022, 13, 801656. [Google Scholar] [CrossRef]
  20. Liu, Z.-Q.; Wang, Y.; Wang, X.; Peng, N.; Yang, S.-S.; Shao, H.-H.; Jiao, X.-L.; Gao, W.-W. Effect of Light Intensity on Growth, Accumulation of Ginsenosides, and Expression of Related Enzyme Genes of Panax Quinquefolius. China J. Chin. Mater. Medica 2022, 47, 4877–4885. [Google Scholar] [CrossRef]
  21. Godoy-Hernández, G.; Loyola-Vargas, V.M. Effect of Fungal Homogenate, Enzyme Inhibitors and Osmotic Stress on Alkaloid Content of Catharanthus roseus Cell Suspension Cultures. Plant Cell Rep. 1991, 10, 537–540. [Google Scholar] [CrossRef]
  22. Ashihara, H.; Sano, H.; Crozier, A. Caffeine and Related Purine Alkaloids: Biosynthesis, Catabolism, Function and Genetic Engineering. Phytochemistry 2008, 69, 841–856. [Google Scholar] [CrossRef]
  23. Keleş, Y.; Öncel, I. Response of Antioxidative Defence System to Temperature and Water Stress Combinations in Wheat Seedlings. Plant Sci. 2002, 163, 783–790. [Google Scholar] [CrossRef]
  24. Zobayed, S.M.A.; Afreen, F.; Kozai, T. Phytochemical and Physiological Changes in the Leaves of St. John’s Wort Plants under a Water Stress Condition. Environ. Exp. Bot. 2007, 59, 109–116. [Google Scholar] [CrossRef]
  25. Helander, A.; Rylski, A. Drug Testing for Mitragynine and Kratom: Analytical Challenges and Medico-Legal Considerations. Drug Test. Anal. 2023, 15, 213–219. [Google Scholar] [CrossRef]
  26. Charoenratana, S.; Anukul, C.; Aramrattana, A. Attitudes towards Kratom Use, Decriminalization and the Development of a Community-Based Kratom Control Mechanism in Southern Thailand. Int. J. Drug Policy 2021, 95, 103197. [Google Scholar] [CrossRef]
  27. Khalil, S.; Abdullah, S.A.J.; Ahmad, R. Enforcement Status of the Poison Act 1952 against Offences Related to Kratom (Mitragyna speciosa Korth) Misuse in Malaysia. UUM J. Leg. Stud. 2020, 11, 75–93. [Google Scholar] [CrossRef]
  28. Henningfield, J.E.; Grundmann, O.; Huestis, M.A.; Smith, K.E. Kratom Safety and Toxicology in the Public Health Context: Research Needs to Better Inform Regulation. Front. Pharmacol. 2024, 15, 1403140. [Google Scholar] [CrossRef]
  29. Prozialeck, W.C. Update on the Pharmacology and Legal Status of Kratom. J. Osteopath. Med. 2016, 116, 802–809. [Google Scholar] [CrossRef]
  30. Talamond, P.; Mondolot, L.; Gargadennec, A.; de Kochko, A.; Hamon, S.; Fruchier, A.; Campa, C. First Report on Mangiferin (C-Glucosyl-Xanthone) Isolated from Leaves of a Wild Coffee Plant, Coffea pseudozanguebariae (Rubiaceae). Acta Bot. Gall. 2008, 155, 513–519. [Google Scholar] [CrossRef]
  31. Campa, C.; Mondolot, L.; Rakotondravao, A.; Bidel, L.P.R.; Gargadennec, A.; Couturon, E.; La Fisca, P.; Rakotomalala, J.-J.; Jay-Allemand, C.; Davis, A.P. A Survey of Mangiferin and Hydroxycinnamic Acid Ester Accumulation in Coffee (Coffea) Leaves: Biological Implications and Uses. Ann. Bot. 2012, 110, 595–613. [Google Scholar] [CrossRef]
  32. Resh, H.M. Hydroponic Food Production: A Definitive Guidebook for the Advanced Home Gardener and the Commercial Hydroponic Grower; CRC Press: Boca Raton, FL, USA, 2022. [Google Scholar] [CrossRef]
  33. Fujiwara, K.; Kubo, S.; Eijima, K.; Matsuda, R.; Yano, A. Improved LED Artificial Sunlight Source System Available for Sunlight-Effect Research in Plant Sciences. J. Agric. Meteorol. 2022, 78, 101–112. [Google Scholar] [CrossRef]
  34. Zhang, M.; Sharma, A.; León, F.; Avery, B.; Kjelgren, R.; McCurdy, C.R.; Pearson, B.J. Plant Growth and Phytoactive Alkaloid Synthesis in Kratom [Mitragyna speciosa (Korth.)] in Response to Varying Radiance. PLoS ONE 2022, 17, 4. [Google Scholar] [CrossRef]
  35. Maggini, R.; Kiferle, C.; Guidi, L.; Pardossi, A.; Raffaelli, A. Growing Medicinal Plants in Hydroponic Culture. Acta Hortic. 2011, 952, 697–704. [Google Scholar] [CrossRef]
  36. Koriesh, E.M.; Abo El-Soud, I.H. Medicinal Plants in Hydroponic System under Water-Deficit Conditions—A Way to Save Water. In Technological and Modern Irrigation Environment in Egypt; Best Management Practices & Evaluation; Springer: Berlin/Heidelberg, Germany, 2020; pp. 131–153. [Google Scholar] [CrossRef]
  37. Michel, B.E.; Kaufmann, M.R. The Osmotic Potential of Polyethylene Glycol 6000. Plant Physiol. 1973, 51, 914–916. [Google Scholar] [CrossRef]
  38. Atherton, H.R.; Li, P. Hydroponic Cultivation of Medicinal Plants—Plant Organs and Hydroponic Systems: Techniques and Trends. Horticulturae 2023, 9, 349. [Google Scholar] [CrossRef]
  39. Perez-Harguindeguy, N.; Diaz, S.; Garnier, E.; Lavorel, S.; Poorter, H.; Jaureguiberry, P.; Bret-Harte, M.S.; Cornwell, W.K.; Craine, J.M.; Gurvich, D.E.; et al. Corrigendum to: New Handbook for Standardised Measurement of Plant Functional Traits Worldwide. Aust. J. Bot. 2016, 64, 715–716. [Google Scholar] [CrossRef]
  40. Mustafa, R.R.; Sukor, R.; Nor, S.M.M.; Saari, N.; Azri, F.A. Enhancing Extraction Yield and Purity of Mitragynine from Mitragyna speciosa through Sequential Solvent Extraction and Characterisation Using NMR Technique. Int. J. Sci. Technol. Res. 2020, 9, 3846–3854. [Google Scholar]
  41. Shamsa, F.; Monsef, H.; Ghamooshi, R.; Verdian-Rizi, M. Spectrophotometric Determination of Total Alkaloids in Some Iranian Medicinal Plants. Thai J. Pharm. Sci. 2008, 32, 17–20. [Google Scholar] [CrossRef]
  42. McCune, B.P.; Grace, J. Analysis of Ecological Communities. J. Exp. Marine Bio. Ecol. 2002, 289, 303–305. [Google Scholar] [CrossRef]
  43. Clarke, K.R. Non-Parametric Multivariate Analyses of Changes in Community Structure. Aust. J. Ecol. 1993, 18, 117–143. [Google Scholar] [CrossRef]
  44. Team, R.C. R: A Language and Environment for Statistical Computing; R Foundation for Statistical Computing: Vienna, Austria, 2022. [Google Scholar]
  45. Oksanen, J.; Kindt, R.; Legendre, P.; O’Hara, B.; Stevens, M.H.H.; Oksanen, M.J.; Suggests, M. The Vegan Package. Community Ecology Package, Version 10; R Foundation for Statistical Computing: Vienna, Austria, 2007; p. 719. [Google Scholar]
  46. de Mendiburu, F.; de Mendiburu, M.F. Package ‘Agricolae’. R Package, Version 1; R Foundation for Statistical Computing: Vienna, Austria, 2019; pp. 1143–1149. [Google Scholar]
  47. Johnson, D.M.; Smith, W.K. Limitations to Photosynthetic Carbon Gain in Timberline Abies Lasiocarpa Seedlings during Prolonged Drought. Can. J. For. Res. 2007, 37, 568–579. [Google Scholar] [CrossRef]
  48. Irving, L.J. Carbon Assimilation, Biomass Partitioning and Productivity in Grasses. Agriculture 2015, 5, 1116–1134. [Google Scholar] [CrossRef]
  49. Nishiyama, Y.; Yamamoto, H.; Allakhverdiev, S.I.; Inaba, M.; Yokota, A.; Murata, N. Oxidative Stress Inhibits the Repair of Photodamage to the Photosynthetic Machinery. EMBO J. 2001, 20, 5587–5594. [Google Scholar] [CrossRef]
  50. Urban, L.; Aarrouf, J.; Bidel, L.P.R. Assessing the Effects of Water Deficit on Photosynthesis Using Parameters Derived from Measurements of Leaf Gas Exchange and of Chlorophyll a Fluorescence. Front. Plant Sci. 2017, 8, 2068. [Google Scholar] [CrossRef]
  51. Yang, Y.-J.; Bi, M.-H.; Nie, Z.-F.; Jiang, H.; Liu, X.-D.; Fang, X.-W.; Brodribb, T.J. Evolution of Stomatal Closure to Optimize Water-Use Efficiency in Response to Dehydration in Ferns and Seed Plants. New Phytol. 2021, 230, 2001–2010. [Google Scholar] [CrossRef]
  52. Zhang, L.X.; Guo, Q.S.; Chang, Q.S.; Zhu, Z.B.; Liu, L.; Chen, Y.H. Chloroplast Ultrastructure, Photosynthesis and Accumulation of Secondary Metabolites in Glechoma Longituba in Response to Irradiance. Photosynthetica 2015, 53, 144–153. [Google Scholar] [CrossRef]
  53. Fanourakis, D.; Hyldgaard, B.; Giday, H.; Aulik, I.; Bouranis, D.; Körner, O.; Ottosen, C.-O. Stomatal Anatomy and Closing Ability Is Affected by Supplementary Light Intensity in Rose (Rosa hybrida L.). Hortic. Sci. 2019, 46, 81. [Google Scholar] [CrossRef]
  54. Ali, Z.; Merrium, S.; Habib-ur-Rahman, M.; Hakeem, S.; Saddique, M.A.B.; Sher, M.A. Wetting Mechanism and Morphological Adaptation; Leaf Rolling Enhancing Atmospheric Water Acquisition in Wheat Crop—A Review. Environ. Sci. Pollut. Res. 2022, 29, 30967–30985. [Google Scholar] [CrossRef] [PubMed]
  55. Werner, C.; Correia, O.; Beyschlag, W. Two Different Strategies of Mediterranean Macchia Plants to Avoid Photoinhibitory Damage by Excessive Radiation Levels during Summer Drought. Acta Oecologica 1999, 20, 15–23. [Google Scholar] [CrossRef]
  56. Hazrati, S.; Tahmasebi-Sarvestani, Z.; Nicola, S.; Kashkooli, A.B.; Habibzadeh, F.; Mohammadi, H.; Mokhtassi-Bidgoli, A. Effect of Light and Water Deficiency on Growth and Concentration of Various Primary and Secondary Metabolites of Aloe vera L. J. Agric. Sci. Technol. 2020, 22, 1343–1358. [Google Scholar]
  57. Macáková, K.; Afonso, R.; Saso, L.; Mladěnka, P. The Influence of Alkaloids on Oxidative Stress and Related Signaling Pathways. Free Radic. Biol. Med. 2019, 134, 429–444. [Google Scholar] [CrossRef]
  58. Selmar, D.; Kleinwächter, M. Stress Enhances the Synthesis of Secondary Plant Products: The Impact of Stress-Related over-Reduction on the Accumulation of Natural Products. Plant Cell Physiol. 2013, 54, 817–826. [Google Scholar] [CrossRef]
  59. Shil, S.; Dewanjee, S. Impact of Drought Stress Signals on Growth and Secondary Metabolites (SMs) in Medicinal Plants. J. Phytopharm. 2022, 11, 371–376. [Google Scholar] [CrossRef]
  60. Hiba, H.; Janeeshma, E.; Puthur, J.T. Dynamic Alterations of Metabolites in Plectranthus amboinicus (Lour.) Spreng. to Encounter Drought and Zn Toxicity. Braz. J. Bot. 2021, 44, 587–599. [Google Scholar] [CrossRef]
  61. Jansen, M.A.K.; Hectors, K.; O’Brien, N.M.; Guisez, Y.; Potters, G. Plant Stress and Human Health: Human Consumers Benefit from UV-B Acclimated Crops? Plant Sci. 2008, 175, 449–458. [Google Scholar] [CrossRef]
  62. Mewis, I.; Schreiner, M.; Nguyen, C.N.; Krumbein, A.; Ulrichs, C.; Lohse, M.; Zrenner, R. UV-B Irradiation Changes Specifically the Secondary Metabolite Profile in Broccoli Sprouts: Induced Signaling Overlaps with Defense Response to Biotic Stressors. Plant Cell Physiol. 2012, 53, 1546–1560. [Google Scholar] [CrossRef]
  63. Bandurska, H.; Niedziela, J.; Chadzinikolau, T. Separate and Combined Responses to Water Deficit and UV-B Radiation. Plant Sci. 2013, 213, 98–105. [Google Scholar] [CrossRef]
  64. Ncise, W.; Daniels, C.W.; Nchu, F. Effects of Light Intensities and Varying Watering Intervals on Growth, Tissue Nutrient Content and Antifungal Activity of Hydroponic Cultivated Tulbaghia violacea L. under Greenhouse Conditions. Heliyon 2020, 6, e03906. [Google Scholar] [CrossRef]
  65. Kleinwächter, M.; Selmar, D. New Insights Explain That Drought Stress Enhances the Quality of Spice and Medicinal Plants: Potential Applications. Agron. Sustain. Dev. 2015, 35, 121–131. [Google Scholar] [CrossRef]
  66. Haghpanah, M.; Hashemipetroudi, S.; Arzani, A.; Araniti, F. Drought Tolerance in Plants: Physiological and Molecular Responses. Plants 2024, 13, 2962. [Google Scholar] [CrossRef] [PubMed]
  67. Jaleel, C.A.; Gopi, R.; Manivannan, P.; Panneerselvam, R. Antioxidative Potentials as a Protective Mechanism in Catharanthus roseus (L.) G. Don. Plants under Salinity Stress. Turk. J. Bot. 2007, 31, 245–251. [Google Scholar]
  68. Cao, S.; Shi, L.; Shen, Y.; He, L.; Meng, X. Ecological Roles of Secondary Metabolites of Saposhnikovia Divaricata in Adaptation to Drought Stress. PeerJ 2022, 10, e14336. [Google Scholar] [CrossRef]
  69. Brechner, M.L.; Albright, L.D.; Weston, L.A. Effects of UV-B on Secondary Metabolites of St. John’s Wort (Hypericum perforatum L.) Grown in Controlled Environments. Photochem. Photobiol. 2011, 87, 680–684. [Google Scholar] [CrossRef] [PubMed]
  70. Hou, J.; Li, W.; Zheng, Q.; Wang, W.; Xiao, B.; Xing, D. Effect of Low Light Intensity on Growth and Accumulation of Secondary Metabolites in Roots of Glycyrrhiza Uralensis Fisch. Biochem. Syst. Ecol. 2010, 38, 160–168. [Google Scholar] [CrossRef]
  71. Coelho, G.C.; Rachwal, M.F.G.; Dedecek, R.A.; Curcio, G.R.; Nietsche, K.; Schenkel, E.P. Effect of Light Intensity on Methylxanthine Contents of Ilex paraguariensis A. St. Hil. Biochem. Syst. Ecol. 2007, 35, 75–80. [Google Scholar] [CrossRef]
  72. Chauser-Volfson, E.; Gutterman, Y. Content and Distribution of Anthrone C-Glycosides in the South African Arid Plant SpeciesAloe Mutabilisgrowing in Direct Sunlight and in Shade in the Negev Desert of Israel. J. Arid Environ. 1998, 40, 441–451. [Google Scholar] [CrossRef]
  73. Höft, M.; Verpoorte, R.; Beck, E. Growth and Alkaloid Patterns of Roots of Tabernaemontana Pachysiphon and Rauvolfia Mombasiana as Influenced by Environmental Factors. Bot. Acta 1998, 111, 222–230. [Google Scholar] [CrossRef]
  74. Cai, Z.Q.; Wang, W.H.; Yang, J.; Cai, C.T. Growth, Photosynthesis and Root Reserpine Concentrations of Two Rauvolfia Species in Response to a Light Gradient. Ind. Crops Prod. 2009, 30, 220–226. [Google Scholar] [CrossRef]
  75. Idris, A.; Linatoc, A.C.; Muhammad, S.M.; Aliyu, A.M.; Bakar, M.F.A. Effect of Light Intensity on the Total Flavonoid and Total Phenolic Contents of Mikania Micrantha and Tridax Procumbens. J. Sci. Technol. 2018, 10, 1–7. [Google Scholar] [CrossRef]
  76. Men, Y.; Wang, D.; Li, B.; Su, Y.; Chen, G. Effects of Drought Stress on the Antioxidant System, Osmolytes and Secondary Metabolites of Saposhnikovia Divaricata Seedlings. Acta Physiol. Plant. 2018, 40, 191. [Google Scholar] [CrossRef]
  77. Bandurska, H.; Cieślak, M. The Interactive Effect of Water Deficit and UV-B Radiation on Salicylic Acid Accumulation in Barley Roots and Leaves. Environ. Exp. Bot. 2013, 94, 9–18. [Google Scholar] [CrossRef]
  78. Rajabbeigi, E.; Eichholz, I.; Beesk, N.; Ulrichs, C.; Kroh, L.W.; Rohn, S.; Huyskens-Keil, S. Interaction of Drought Stress and UV-B Radiation-Impact on Biomass Production and Flavonoid Metabolism in Lettuce (Lactuca sativa L.). J. Appl. Bot. Food Qual. 2013, 86, 190–197. [Google Scholar] [CrossRef]
  79. Savickiene, N.; Raudone, L. Trends in Plants Phytochemistry and Bioactivity Analysis. Plants 2024, 13, 3173. [Google Scholar] [CrossRef]
  80. Reifenrath, K.; Müller, C. Species-Specific and Leaf-Age Dependent Effects of Ultraviolet Radiation on Two Brassicaceae. Phytochemistry 2007, 68, 875–885. [Google Scholar] [CrossRef]
  81. Wahid, A. Physiological Implications of Metabolite Biosynthesis for Net Assimilation and Heat-Stress Tolerance of Sugarcane (Saccharum officinarum) Sprouts. J. Plant Res. 2007, 120, 219–228. [Google Scholar] [CrossRef]
  82. Campa, C.; Urban, L.; Mondolot, L.; Fabre, D.; Roques, S.; Lizzi, Y.; Aarrouf, J.; Doulbeau, S.; Breitler, J.-C.; Letrez, C.; et al. Juvenile Coffee Leaves Acclimated to Low Light Are Unable to Cope with a Moderate Light Increase. Front. Plant Sci. 2017, 8, 1126. [Google Scholar] [CrossRef]
  83. Porto, D.D.; Matsuura, H.N.; Henriques, A.T.; Rosa, L.M.G.; Fett, J.P.; Fett-Neto, A.G. The Alkaloid Brachycerine Contributes to Protection against Acute UV-B Damage in Psychotria. Ind. Crops Prod. 2020, 147, 112216. [Google Scholar] [CrossRef]
  84. Leong Bin Abdullah, M.F.I.; Singh, D. The Adverse Cardiovascular Effects and Cardiotoxicity of Kratom (Mitragyna speciosa Korth.): A Comprehensive Review. Front. Pharmacol. 2021, 12, 726003. [Google Scholar] [CrossRef]
  85. Hasnain, A.; Esang, M.; Sabreen, R. A Case of Kratom-Induced Seizures. Cureus 2020, 12, e6588. [Google Scholar]
  86. Neerman, M.F.; Frost, R.E.; Deking, J. A Drug Fatality Involving Kratom. J. Forensic Sci. 2013, 58, S278–S279. [Google Scholar] [CrossRef]
  87. Yusoff, N.H.M.; Suhaimi, F.W.; Vadivelu, R.K.; Hassan, Z.; Rümler, A.; Rotter, A.; Amato, D.; Dringenberg, H.C.; Mansor, S.M.; Navaratnam, V.; et al. Abuse Potential and Adverse Cognitive Effects of Mitragynine (Kratom). Addict. Biol. 2016, 21, 98–110. [Google Scholar] [CrossRef] [PubMed]
  88. Papsun, D.; Schroeder, W.; Brower, J.; Logan, B. Forensic Implications of Kratom: Kratom Toxicity, Correlation with Mitragynine Concentrations, and Polypharmacy. Curr. Addict. Rep. 2023, 10, 272–281. [Google Scholar] [CrossRef]
  89. Swogger, M.T.; Smith, K.E.; Garcia-Romeu, A.; Grundmann, O.; Veltri, C.A.; Henningfield, J.E.; Busch, L.Y. Understanding Kratom Use: A Guide for Healthcare Providers. Front. Pharmacol. 2022, 13, 801855. [Google Scholar] [CrossRef] [PubMed]
  90. Oehlert, G.W. A First Course in Design and Analysis of Experiments; W. H. Freeman and Company: New York, NY, USA, 2010; ISBN 0716735105. [Google Scholar]
Figure 1. (a) A split-plot design, with three light intensities assigned to the main plots and subplots through three levels of water potential. Each subplot included three replicates, with 10 seedlings per replicate. (b) The experimental setup featured light sources positioned 1.20 m above the containers; (c) the seedlings were maintained in floating root systems with oxygenation tubes to ensure aerobic conditions.
Horticulturae 11 00272 g001
Figure 2. Leaves designated as the 2nd and 3rd pair chosen for harvesting, as well as relatively older pairs (>3rd pairs) to determine their mitragynine content.
Horticulturae 11 00272 g002
Figure 3. The effect of interaction between the main plot (light intensity) and subplot (water potential) on the growth characteristics for (a) total height, (b) root length, and (c) root shoot ratio. Lowercase letters above each bar represent significant differences at a level of 95%.
Horticulturae 11 00272 g003
Figure 4. The effect of interaction between the main plot (light intensity) and subplot (water potential) on the physiological characteristics for (a) leaf area (LA) and specific leaf area (SLA), (b) relative water content, (c) water use efficiency (WUE), and (d) chlorophyll content (SPAD). Lowercase letters above each bar represent significant differences at a significance level of 95%.
Horticulturae 11 00272 g004
Figure 5. Mean total alkaloid content (TAC; measured in mgAE g−1 DW) extracted from the leaves of Mitragyna speciosa (n = 9), treated under various combinations of light intensities (L) of 500 μmol m−2s−1 (low), 800 μmol m−2s−1 (medium), and 1200 μmol m−2s−1 (high) and water potentials (WP) of −0.03 MPa, −0.4 MPa (25% of permanent wilting point), and −0.7 MPa (50% of permanent wilting point). The different lowercase red letters indicate significant differences in mean extracted amount among the various treatment combinations, with the highest accumulation highlighted in blue.
Horticulturae 11 00272 g005
Figure 6. Chromatogram showing the retention times (minutes) and intensity (mAU) of the analyzed samples in blue and the mitragynine (MG) standard in gray lines. The peak annotated at 14.3 min corresponds to MG.
Horticulturae 11 00272 g006
Figure 7. Differences in mean MG accumulation related to combinations of light intensity and leaf pairs (a) and water potential and leaf pairs (b) of kratom seedlings as determined by ANOVA (Table S3). The red dashed lines inside the boxplots indicate the mean MG levels, while the black lines indicate the median values. The different lowercase letters above the boxplots indicate significant differences in the accumulation level as indicated by ANOVA (at a level of 95%). The black filled circles above or below the boxplots indicate the respective outliers.
Horticulturae 11 00272 g007
Figure 8. NMDS ordination plot of samples categorized by MG level, with vectors representing physiological and morphological traits. The blue vectors are the response variables (TDM is the total dry mass; Droot is the root diameter; Do is the diameter at the root collar; Ht is the plant height; and Lroot is the length of the longest root), while the ones in red are the significant traits (WUE is water use efficiency; Thickness is leaf thickness; and SRL is specific root length), with traits in gray being the non-significant traits at a level of 99%. As indicated in the legend, samples with high or low MG are plotted in green and orange circles, while the size of the circles is representative of the combined light and water potentials.
Horticulturae 11 00272 g008
Figure 9. NMDS contour plot illustrating the relationship between MG levels (designated by either green circles (high) or triangles (low)) and significant growth parameters (black vectors), with contour gradients representing (a) leaf thickness, (b) specific root length (SRL), and (c) water use efficiency (WUE). The black vectors indicate the response variables (where TDM is the total dry mass; Droot is the root diameter; Do is the diameter at the root collar; Ht is the total height; and Lroot is the length of the longest root).
Horticulturae 11 00272 g009
Table 1. Growth and physiological characteristics presented as mean ± standard deviation under light intensity (main plot) and water potential (subplot). Values in bold indicate significant differences between the main and subplot parameters with different lowercase letters at a 95% confidence level. The details of ANOVA are provided in Tables S1 and S2 of the Supplementary Materials.
TraitsWater PotentialLight Intensity (μmol m−2 s−1)
5008001200Avg
Total dry mass (g)−0.03 MPa31.84 ± 7.4442.55 ± 9.1543.1 ± 9.9239.16 ± 10.05 a
−0.40 MPa32.57 ± 11.2232.47 ± 9.345.98 ± 13.3237.00 ± 12.72 a
−0.70 MPa23.36 ± 9.7630.61 ± 7.7532.16 ± 11.3228.71 ± 10.12 b
Avg29.26 ± 10.16 b35.21 ± 9.97 a40.41 ± 12.7 a
Stem dry mass (g)−0.03 MPa16.04 ± 4.0023.30 ± 6.2224.53 ± 5.2121.29 ± 6.30 a
−0.40 MPa19.31 ± 6.3019.27 ± 5.4927.25 ± 7.0021.95 ± 7.16 a
−0.70 MPa14.63 ± 5.5718.16 ± 3.8419.71 ± 6.8417.50 ± 5.76 b
Avg16.66 ± 5.54 c20.24 ± 5.55 b23.83 ± 6.92 a
Leaf dry mass (g)−0.03 MPa5.71 ± 1.587.87 ± 1.835.89 ± 2.336.49 ± 2.11 a
−0.40 MPa4.41 ± 2.424.92 ± 1.816.08 ± 2.505.13 ± 2.29 b
−0.70 MPa2.50 ± 1.814.24 ± 1.233.78 ± 1.913.51 ± 1.77 c
Avg4.21 ± 2.32 b5.68 ± 2.25 a5.25 ± 2.42 ab
Root dry mass (g)−0.03 MPa10.09 ± 2.4111.38 ± 2.8312.68 ± 3.3011.39 ± 2.96 a
−0.40 MPa8.84 ± 3.098.27 ± 2.1712.65 ± 4.079.92 ± 3.66 b
−0.70 MPa6.23 ± 2.618.21 ± 3.038.67 ± 2.967.70 ± 2.97 c
Avg8.39 ± 3.09 b9.29 ± 3.01 b11.34 ± 3.85 a
Stem diameter (mm)−0.03 MPa13.31 ± 1.5314.41 ± 1.7314.76 ± 1.7914.16 ± 1.74 a
−0.40 MPa12.48 ± 1.5113.06 ± 1.6414.5 ± 1.5513.35 ± 1.74 a
−0.70 MPa11.12 ± 1.8612.58 ± 1.3612.44 ± 1.9712.04 ± 1.81 b
Avg12.3 ± 1.83 b13.35 ± 1.72 a13.9 ± 2.01 a
Root diameter (mm)−0.03 MPa14.02 ± 1.2615.54 ± 1.8717.74 ± 5.0815.77 ± 3.46 a
−0.40 MPa12.98 ± 1.9313.72 ± 2.0516.03 ± 1.8014.24 ± 2.28 b
−0.70 MPa11.36 ± 1.6413.24 ± 1.1814.33 ± 2.3512.98 ± 2.13 c
Avg12.79 ± 1.93 c14.17 ± 1.95 b16.03 ± 3.56 a
Specific root length
(cm g−1)
−0.03 MPa5.35 ± 1.54.05 ± 0.993.32 ± 1.024.24 ± 1.43 b
−0.40 MPa4.30 ± 2.244.63 ± 1.483.16 ± 1.094.03 ± 1.73 b
−0.70 MPa6.53 ± 2.235.80 ± 1.685.42 ± 1.655.92 ± 1.86 a
Avg5.39 ± 2.15 a4.83 ± 1.55 a3.97 ± 1.62 b
Leaf thickness (mm)−0.03 MPa0.17 ± 0.030.18 ± 0.020.21 ± 0.020.18 ± 0.03
−0.40 MPa0.19 ± 0.030.19 ± 0.020.20 ± 0.030.19 ± 0.03
−0.70 MPa0.17 ± 0.030.18 ± 0.020.18 ± 0.030.18 ± 0.03
Avg0.18 ± 0.03 b0.18 ± 0.02 b0.20 ± 0.03 a
Disclaimer/Publisher’s Note: The statements, opinions and data contained in all publications are solely those of the individual author(s) and contributor(s) and not of MDPI and/or the editor(s). MDPI and/or the editor(s) disclaim responsibility for any injury to people or property resulting from any ideas, methods, instructions or products referred to in the content.

