Article

Transmission Route of Airborne Fungal Spores for Cucumber Downy Mildew

1
School of Agricultural Engineering, Jiangsu University, Zhenjiang 212013, China
2
School of Science and Technology, Shanghai Open University, Shanghai 200433, China
3
School of Electrical and Information Engineering, Jiangsu University, Zhenjiang 212013, China
4
College of Biological and Agricultural Engineering, Jilin University, Changchun 130022, China
5
Department of Soil and Water Sciences, Faculty of Environmental Agricultural Sciences, Arish University, North Sinai 45516, Egypt
*
Authors to whom correspondence should be addressed.
Horticulturae 2025, 11(3), 336; https://doi.org/10.3390/horticulturae11030336
Submission received: 27 February 2025 / Revised: 17 March 2025 / Accepted: 19 March 2025 / Published: 20 March 2025

Abstract

:
Analyzing the transmission dynamics of airborne disease spores is crucial for advancing early warning and control strategies for crop diseases. This study introduces a novel approach utilizing the HYSPLIT-5 model to investigate the spore transmission patterns and pathways of airborne crop diseases. By employing the Lagrangian particle trajectory method of HYSPLIT-5 in conjunction with MeteInfoMap 3.5, the spatiotemporal frequency of cucumber downy mildew spore trajectories over extended periods was examined. The results indicate that the transmission trajectory of cucumber downy mildew spores is heavily influenced by atmospheric circulation, with spores spreading along air currents to surrounding areas. These trajectories frequently intersect, resulting in a broad transmission range, and the observed transmission patterns exhibit a degree of universality. Which provided a basis for the subsequent study of a large-scale prediction model of cucumber downy mildew.

1. Introduction

At present, the protected cultivation area in China is more than 4.2 million hectares, and it is widely distributed, ranking first in the world in total area. It is the main support of the China vegetable basket project and one of the important ways to increase farmers’ income [1,2]. Cucumber is deeply loved by consumers because of its rich taste and nutritional value. The cultivation area for cucumbers occupies a significant portion of the total cultivation area in China, ranking second only to that of tomatoes [3,4]. Cucumber is inevitably exposed to abiotic stresses (such as salt, drought, high temperature, low temperature, UV-B stress, etc.) and biological stresses (such as bacterial and fungal diseases) during growth. The temperature and humidity conditions in the greenhouse environment are more conducive to the prevalence and spread of airborne fungal diseases [5,6]. The infection of Pseudoperonospora cubensis causes cucumber downy mildew. After its occurrence, the disease mainly affects the leaves and stems of cucumber plants and the inflorescences of cucumber plants. The disease can affect cucumbers from the seedling to the mature growth stages, with its impact being most severe during the cucumber harvesting phase. Once the disease manifests, it can lead to the rapid deterioration of cucumber plants, causing most leaves to die within one to two weeks [7,8]. With the expansion of cultivation area and the increase in planting years, the incidence of cucumber downy mildew will increase year by year. In severe cases, it can lead to yield loss of 20–50% or even no harvest [9,10]. Therefore, it is of great significance to study the air transmission route of cucumber downy mildew for developing early warning technology of cucumber downy mildew in the future [11,12].
In recent years, researchers have conducted similar studies on crop diseases. Such as Berdugo et al. [13] inoculated cucumber leaves with cucumber mosaic virus, cucumber green mottle mosaic virus, and powdery mildew bacteria, respectively, under greenhouse conditions and tested the spatial-temporal changes in leaf temperature, photosynthetic activity, and vegetation index of healthy and diseased cucumber leaves. Through the multi-sensor data fusion method, the effects of each pathogen on the physiology and vitality of cucumber plants were studied. Granke et al. [14] studied the effect of the number of disease spores on the incidence and severity of cucumber downy mildew and found that the number of sporangium in the air, planting time, planting number, temperature, and leaf humidity were positively correlated with the incidence degree, while solar radiation was negatively correlated with the disease degree. The concentration of sporangium in the air is one of the most important factors affecting the incidence and severity of cucumber downy mildew. Neufeld et al. [15] used night temperature, daytime temperature, cumulative hours with daily relative humidity >80%, and daily leaf wetting time as input factors to build a model to predict downy mildew infection risk. Although the above methods can predict airborne cucumber diseases, they are limited to specific areas. In order to predict the disease in a wider area, it is necessary to combine the atmospheric circulation model to simulate the influence of airflow on the transmission route of cucumber downy mildew. Additionally, integrating local topographical and geomorphological features, along with disease occurrence time series, will enhance the accuracy of disease monitoring and provide early warnings for the spread and incidence of diseases in a given region.
Based on the atmospheric circulation technology, Tao et al. [16] developed an atmospheric circulation model for predicting the risk of soybean rust in Minnesota. The model mainly consists of the long-distance transmission and sedimentation module of airborne disease spores and the leaf humidity module, and the forecast data of the National Weather Service of the United States was used for prediction. Soybean rust can be predicted one week in advance, and the DNA sequencing analysis of soybean rust spores in atmospheric deposition samples in Minnesota showed that the consistency between the model prediction results and the DNA test results of samples was more than 65%. The Hybrid Single-Particle Lagrangian Integrated Trajectory model (HYSPLIT) is a professional model used to calculate and analyze atmospheric pollutants’ transport, diffusion, and sedimentation. Some scholars also began using it to predict airborne disease spores’ transmission trajectory. Olsen et al. [17] used the HYSPLIT to study the law of transmission of pathogen spores in the air. Their research confirmed that many plants fungal diseases spread from short distances to long distances in the form of spores through atmospheric circulation. Pan et al. [18] established a comprehensive climate pathogen model system based on the HYSPLIT-4 model and MM5 model, which could be used to study the intercontinental transmission process of soybean rust disease. The model correctly predicted the transmission process of soybean rust spores from southern South America to Colombia and then to the United States in 2004, one month in advance. Although the above method based on atmospheric circulation technology can simulate the long-distance propagation path of diseases in high-altitude areas, it cannot be directly used to predict the propagation process of cucumber downy mildew. On this basis, the HYSPLIT-5 model was used to simulate the long-distance propagation of cucumber downy mildew spores, and the temporal and spatial dynamic changes in spores were analyzed, which provided a basis for the subsequent study of the large-scale prediction model of cucumber downy mildew.

2. Materials and Methods

2.1. Experimental Data

The Global Data Assimilation System (GDAS) of the National Weather Service’s National Centers for Environmental Prediction (NCEP) was used in this study. Meteorological Data of Global Data Assimilation System. The data were collected four times at 00:00, 06:00, 12:00, and 18:00 UTC every day, mainly including the observation data of temperature, humidity, air pressure, wind speed and direction, cloud image, water vapor distribution, precipitation, and wind field on the vertical profile of the atmosphere. The NECP stored the data in binary format with an accuracy of 360 × 181 grid points of 1° latitude and longitude. An ftp server was used to obtain meteorological data from 2017 to 2020. The map data were a 1:0.4 million Chinese border map and provincial administrative map, using the Mercator map projection method.
The infection process of cucumber downy mildew after transmission depends on the existence of the host plant, so there is an important relationship between the simulated source point and locus diffusion and the growing area of cucumber [19,20]. Cucumber is widely planted in China as the most important part of the “vegetable basket” project [21,22]. To find out the long-term transmission trajectory of cucumber downy mildew spores, the long-distance transmission trajectory was simulated and analyzed. In this study, simulation experiments were conducted using three starting locations: Xinxian County in Shandong Province, Pingquan City in Hebei Province, and Huaiyin District in Huaian, Jiangsu Province. The simulations were carried out from October to November 2017, with trajectory calculations performed at ground heights of 100 m and 1000 m. Simulations were initiated at four time points daily—00:00, 06:00, 12:00, and 18:00 UTC—and each simulation ran for 48 h. For each source point, 120 trajectories were simulated at each height, and cluster analysis was performed on all trajectories to determine the distribution patterns at varying altitudes for each simulated location.
According to the result of vegetable disease research in 2017–2020 (https://www.agridata.cn/data.html#/datadetail?id=288418 (accessed on 23 February 2023)), this study determined the Shen County of Shandong Province and the city of Hebei Province, Hiraizumi, Huaian, Jiangsu Province, and Huaiyin District to simulate the bacterium source point. The simulation period and initial height of the experiment were determined according to the planting period and topography of each planting area. Shen County is located in the Yellow Pan Plain with flat terrain and an altitude of 35 m to 50 m. Therefore, a layer with a starting height of 100 m is selected, which is a near-surface airflow and a hollow airflow with high spore density. Pingquan City is located in the hilly area of Yanshan Mountain in northern Hebei Province, with numerous mountains and an altitude of about 500 m, so the airflow level is set to 1000 m. The terrain of Huaiyin District is mostly plain depression, and its elevation is about 10 m, so it is set at the 100 m level. The specific simulation information is shown in Table 1.

2.2. Calculation Method of Airflow Trajectory

HYSPLIT-5 is a commonly used atmospheric propagation and diffusion model, which can be used to predict the propagation and settlement of pollutants and harmful substances in the atmosphere [23]. It has been widely used in related fields and has become one of the important tools for studying air pollution and environmental protection. HYSPLIT-5 uses the combination of the Lagrange method and the Euler method to accurately describe the advection and motion characteristics of pollutants in the atmosphere so as to calculate the concentration distribution. This calculation method makes HYSPLIT-5 show very high accuracy and reliability in predicting the diffusion of air pollution. In this study, the HYSPLIT-5 model was used to calculate the trajectory of airborne disease spores [24]. Suppose a particle moving with an air stream is located at P(t) at time t, and the velocity vector is linearly interpolated in both space and time. The first guess position is as follows:
P ( t + Δ t ) = P ( t ) + V ( P , t ) Δ t
The particle position after the integral time step Δt is P (t + Δt)). The advection of the particle is calculated from the average of the three-dimensional velocity vectors of the initial position P(t) and the first guess P’(t + Δt), and the final position of the particle is as follows:
P ( t + Δ t ) = P ( t ) + 0.5 V ( P , t ) + V P , t + Δ t Δ t
where V is the wind speed and Δt is the time step. The horizontal and vertical diffusion of the particles is determined by the turbulent field, and the trajectory calculation is continued along the surface if the particles reach the surface and terminated if the particles exceed the upper boundary of the model.
Cluster analysis is a multivariate statistical analysis method that divides samples into several categories by finding a statistic that can objectively reflect the distance between samples [25,26]. In the TrajStat plugin, the start time and position, vertical height, running time, top height of the model, raw meteorological data, and output path are set; the time of the forward track to positive is set; and the track program “hymodelt.exe” automatically processes the above data. Then, each individual data is converted into a “.tgs” file, and all the files are merged to obtain a month’s forward track file. Track frequency refers to the ratio of airflow tracks passing through the grid to the total number of airflow tracks. The volume and mass of spores are very small, and they are completely transmitted with airflow in the air [27,28]. Therefore, in this study, the trajectory frequency is regarded as the probability of spores spreading with wind.
Trajectory clustering patterns can be divided into two types: Eulerian clustering and angle–distance clustering [29,30]. The following formula calculates Euler clustering:
d 12 = i = 1 n X 1 ( i ) X 2 ( i ) 2 + Y 1 ( i ) Y 2 ( i ) 2
where d12 is the distance between two points; (X1, Y1) and (X2, Y2) are the forward trajectory coordinates; and i is the category of clustering trajectories. The angular distance calculation formula is as follows:
d 12 = 1 n i = 1 n cos 1 0.5 A i + B i C i A i B i
A i = X 1 ( i ) X 0 2 + Y 1 ( i ) Y 0 2
B i = X 2 ( i ) X 0 2 + Y 2 ( i ) Y 0 2
C i = X 2 ( i ) X 1 ( i ) 2 + Y 2 ( i ) Y 1 ( i ) 2
The variables X0 and Y0 define the location of the simulated point. d12 varies between 0 and π. When two trajectories are in the same and opposite directions, respectively, two extreme values occur. d12 is the average angle between the two forward trajectories as seen from the simulated location. For the two types of clustering methods, if the direction of the wind field is considered, the angular distance clustering method is used. The Euler clustering method is used to study the length of the airflow trajectory of clustering calculation. The number of endpoints of all trajectories is the same, so first, the checkpoint number module is selected to check the most frequent number of endpoints of all trajectories, and then it is determined whether the number of endpoints of all trajectories is the same.
In this study, the global spatial minimum variance cluster analysis method was used to classify and group the multiple trajectories of cucumber downy mildew spores according to the principle of closest proximity to represent the main transmission direction [31]. Where the sum of the squares of the distance between each trajectory in the class and the corresponding point of the average trajectory of the class is the spatial variance (SV) of the class, and the total spatial variance (TSV) is the sum of the variances of various types, and the class corresponding to the minimum increase in the total variance is the result. During clustering, the spatial variance (SV) is calculated between each endpoint (k) along the locus (j) within its cluster (i) as follows:
S V i , j = k P j , k M i , k 2
where k is the number of endpoints along the trajectory and P and M are the position vectors of individual trajectories and their clustering mean trajectories, respectively.
Cluster spatial variance (CSV) is simply the sum of the spatial variances of all trajectories within its cluster.
C S V i = j S V i , j
The total spatial variance (TSV) is the sum of CSV for all clusters.
T S V = i C S V j , k
Clustering first assigns each locus to its own cluster so that in each cluster, there are i clusters with traces j = 1. In each iteration, when two clusters are merged, the number of clusters is reduced by 1. So, after the second iteration, there will be an i − 1 cluster, which consists of one cluster with two tracks and the rest with one track. This process continues until there is only one cluster left [32].
At each iteration, the TSV is calculated for each cluster merge combination; that is, the trajectories in cluster 1 are added to the trajectories in cluster 2, cluster 3, and so on, until the TSV is calculated for all remaining cluster combinations, resulting in each iteration (i2i)/2 calculations. The combination with the smallest TSV is passed to the next iteration. This process continues until there is only one cluster. Large trace groups may take quite a long time to complete the clustering process [33].

3. Results and Analysis

3.1. Cluster Analysis Results

As can be seen from Figure 1, the TSV rises sharply at first and then tends to be stable in the remaining iterations until the end of the calculation. At this time, the different clusters start to merge, and the TSV rises again. The ideal final cluster number should be before the rise point. The basic principle is to run a cluster of tracks composed of N tracks, add each track in turn, and match similar tracks until all tracks are in the same class. At the end of each iteration, according to the TSV change curve and TSV change rate, the number of percentage clusters of TSV change at the end of the last iteration is calculated. On the horizontal axis of the number of clusters, TSV changes greatly, indicating that the degree of similarity between clusters is not high, and there are often multiple significant rising points. The number of clusters before the TSV increases significantly is the last number of clusters selected. For example, cluster analysis was conducted on the spore propagation trajectory of cucumber downy mildew in Xinxian County, Shandong Province, in October 2017. Through the analysis of the TSV curve (as shown in Figure 1), the optimal cluster number was 4.

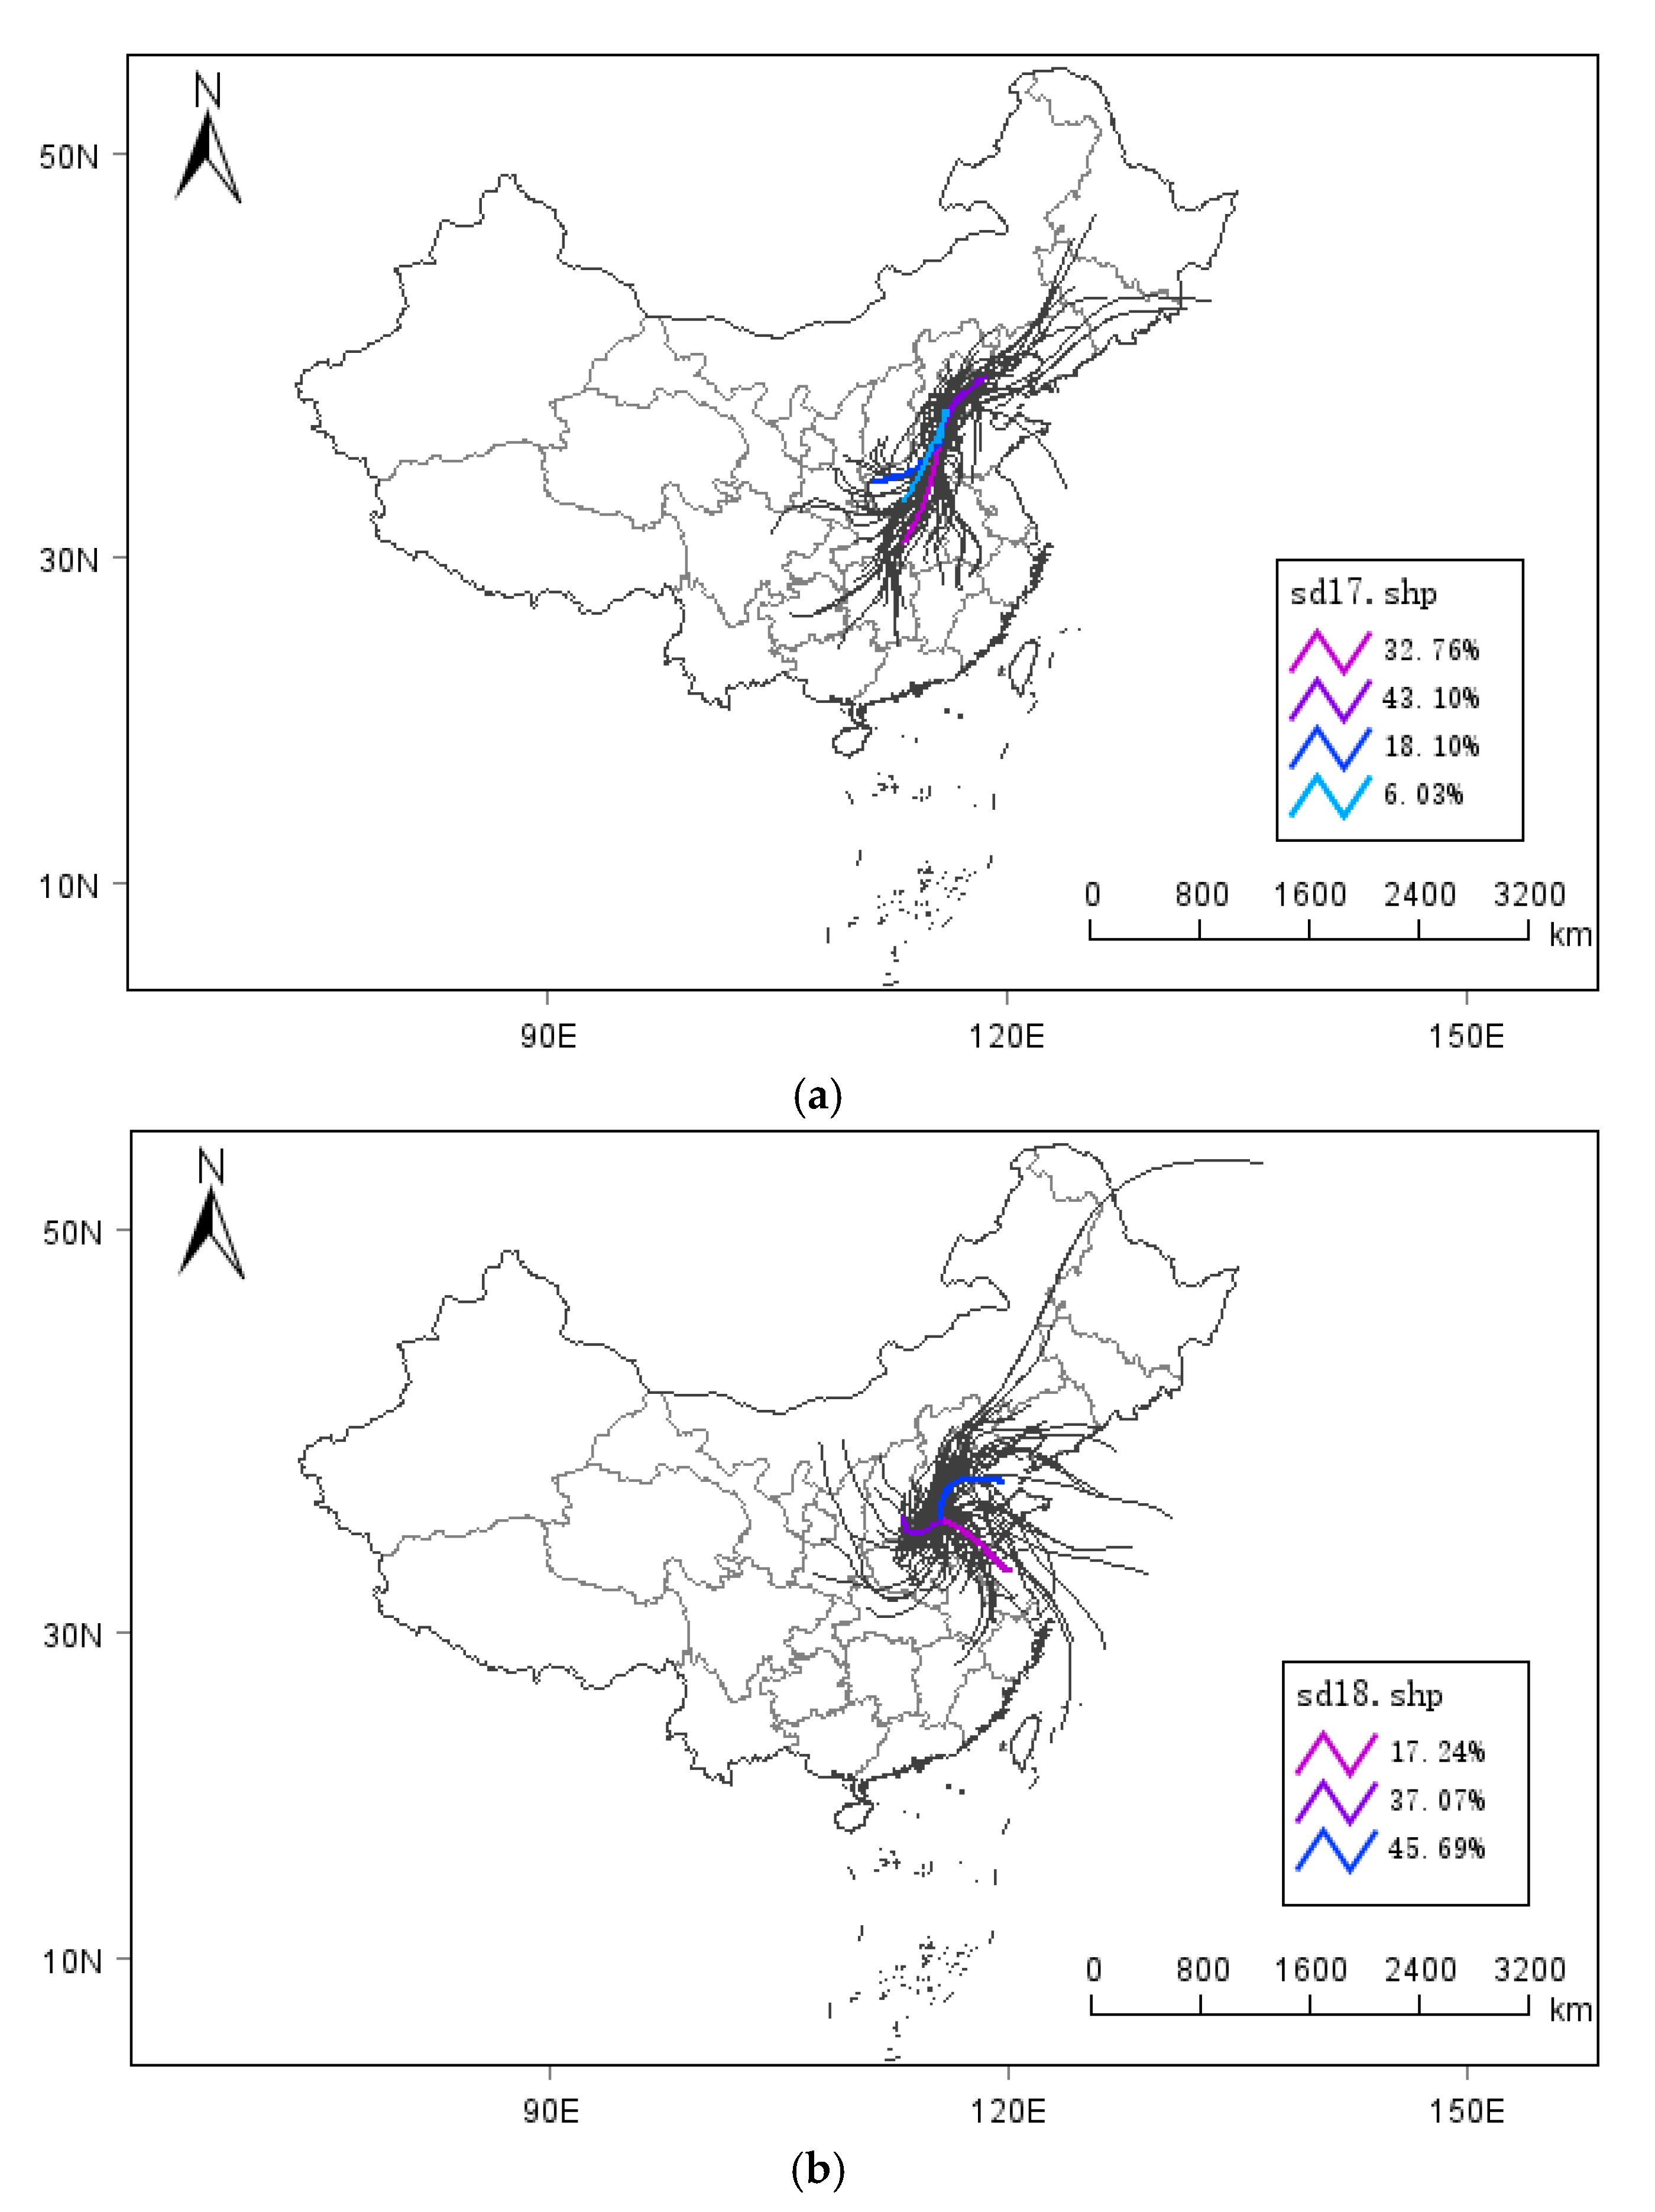
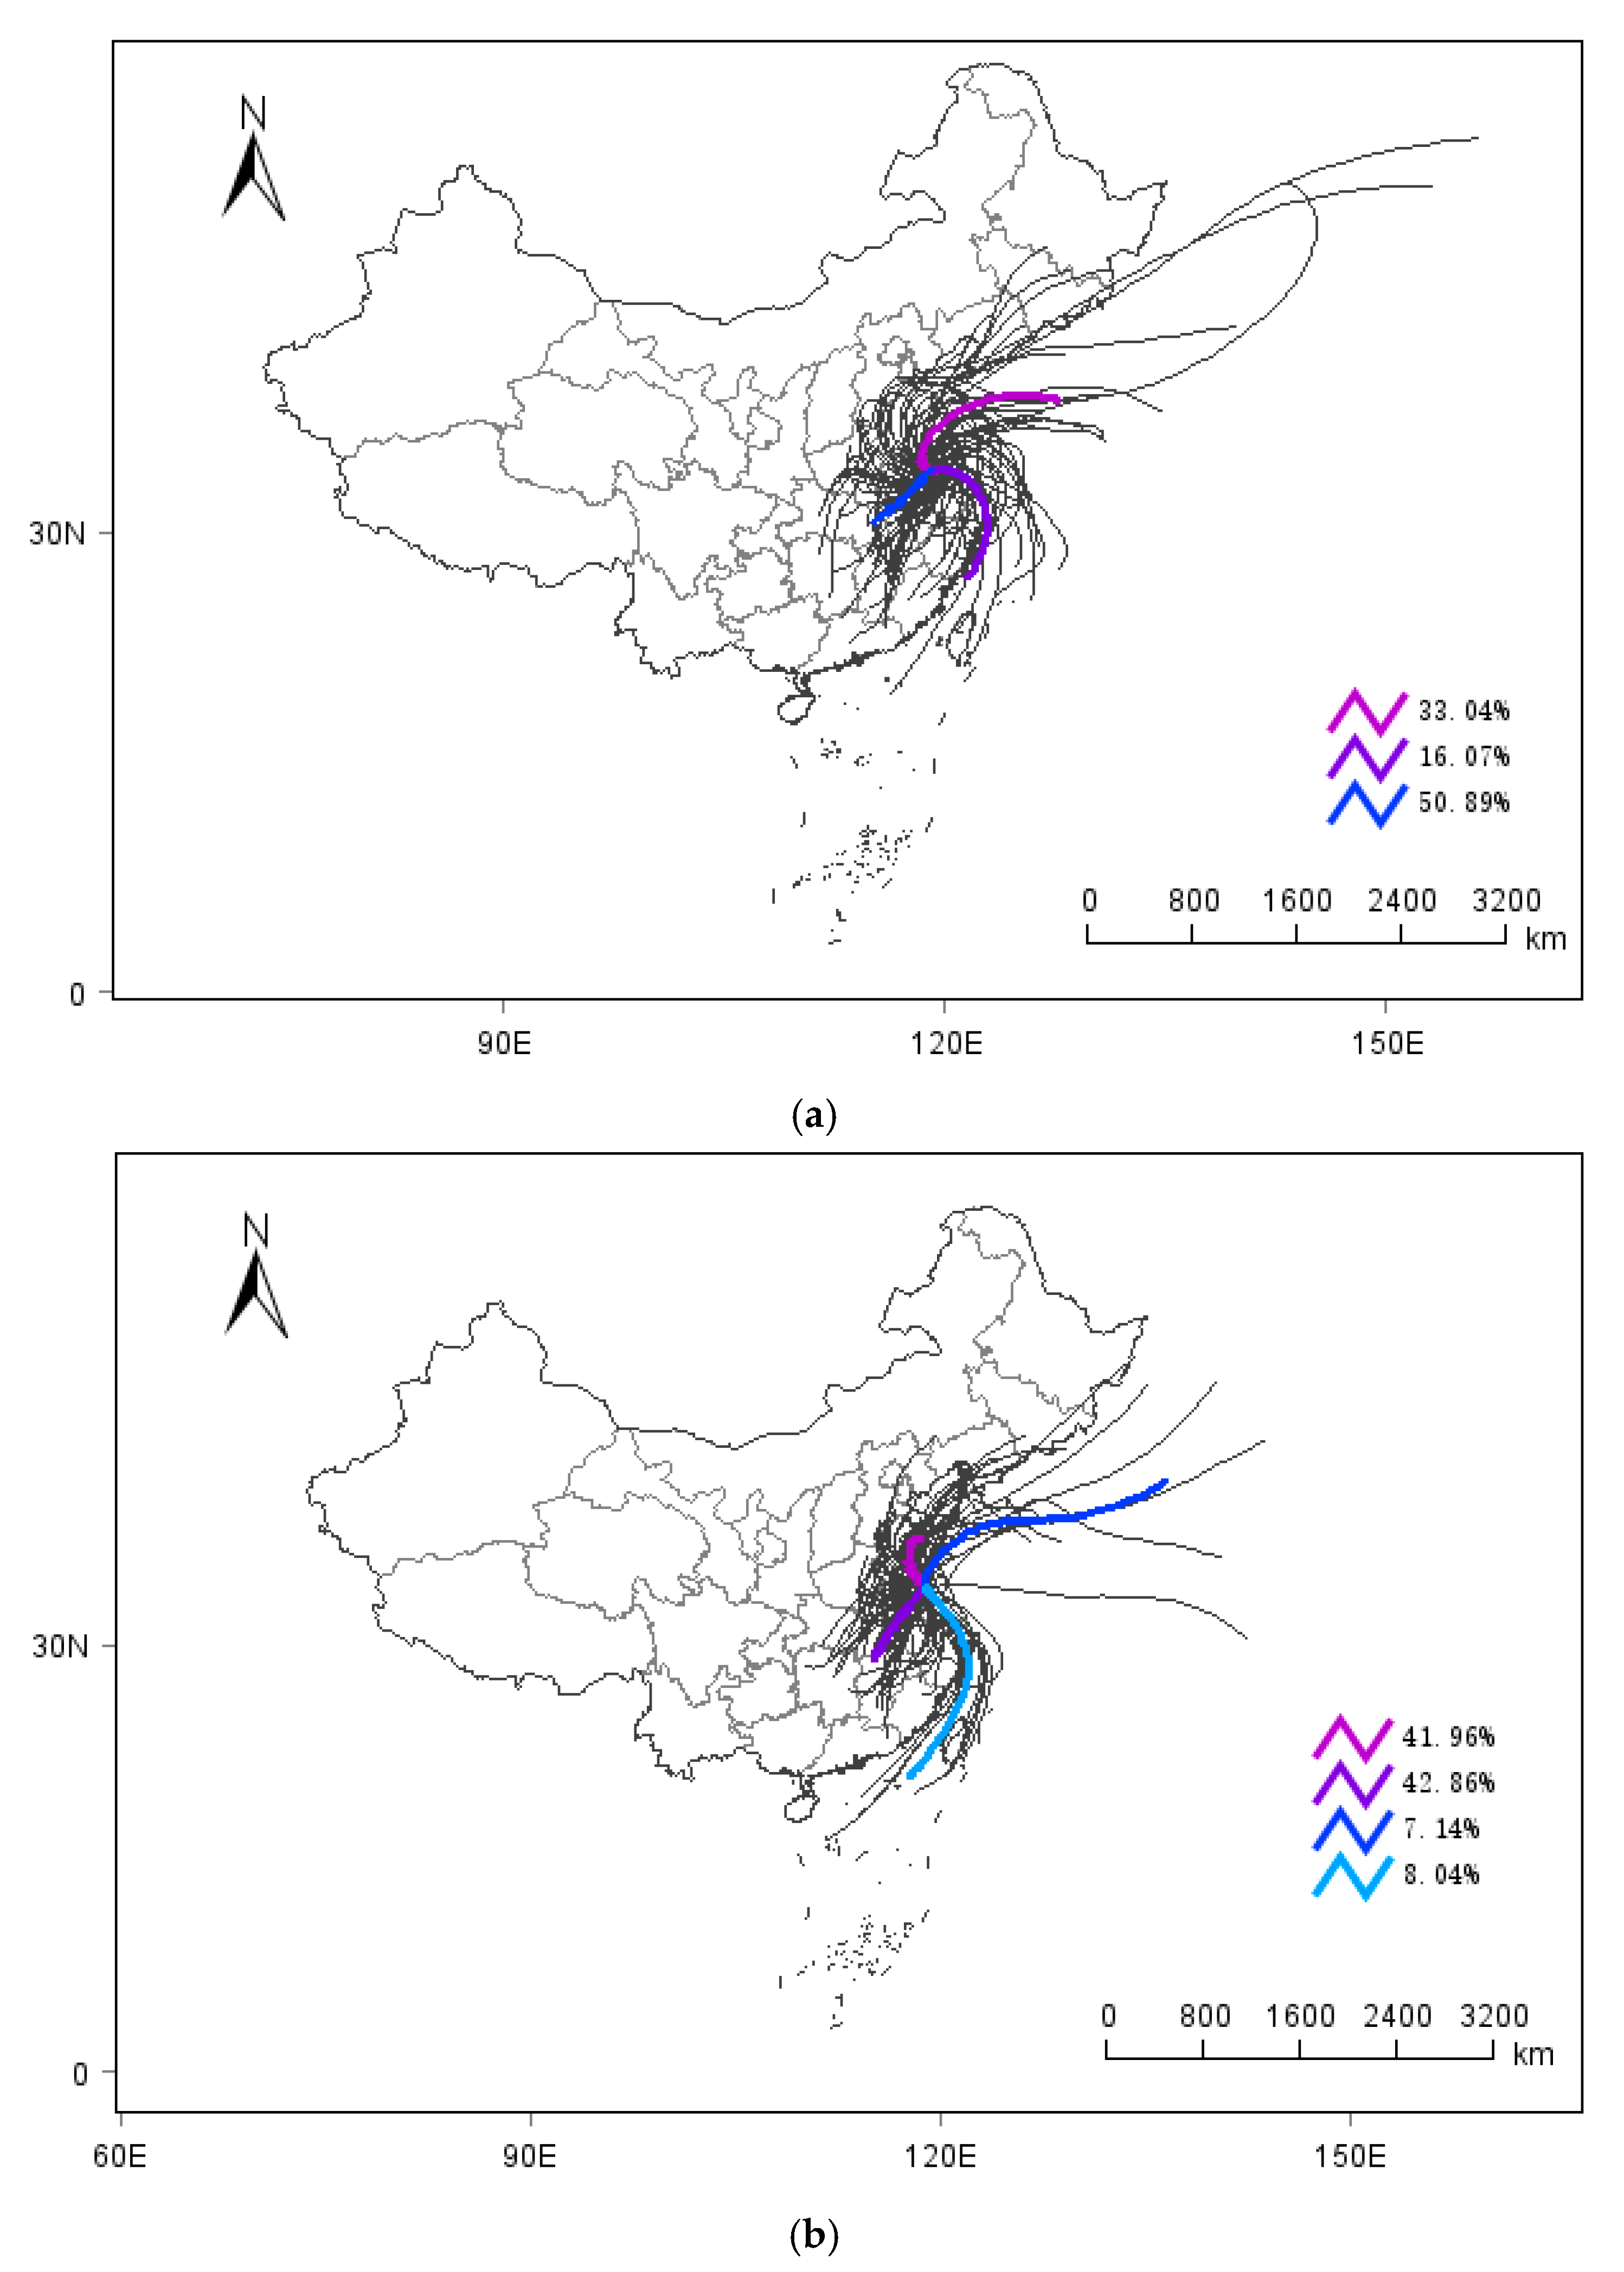
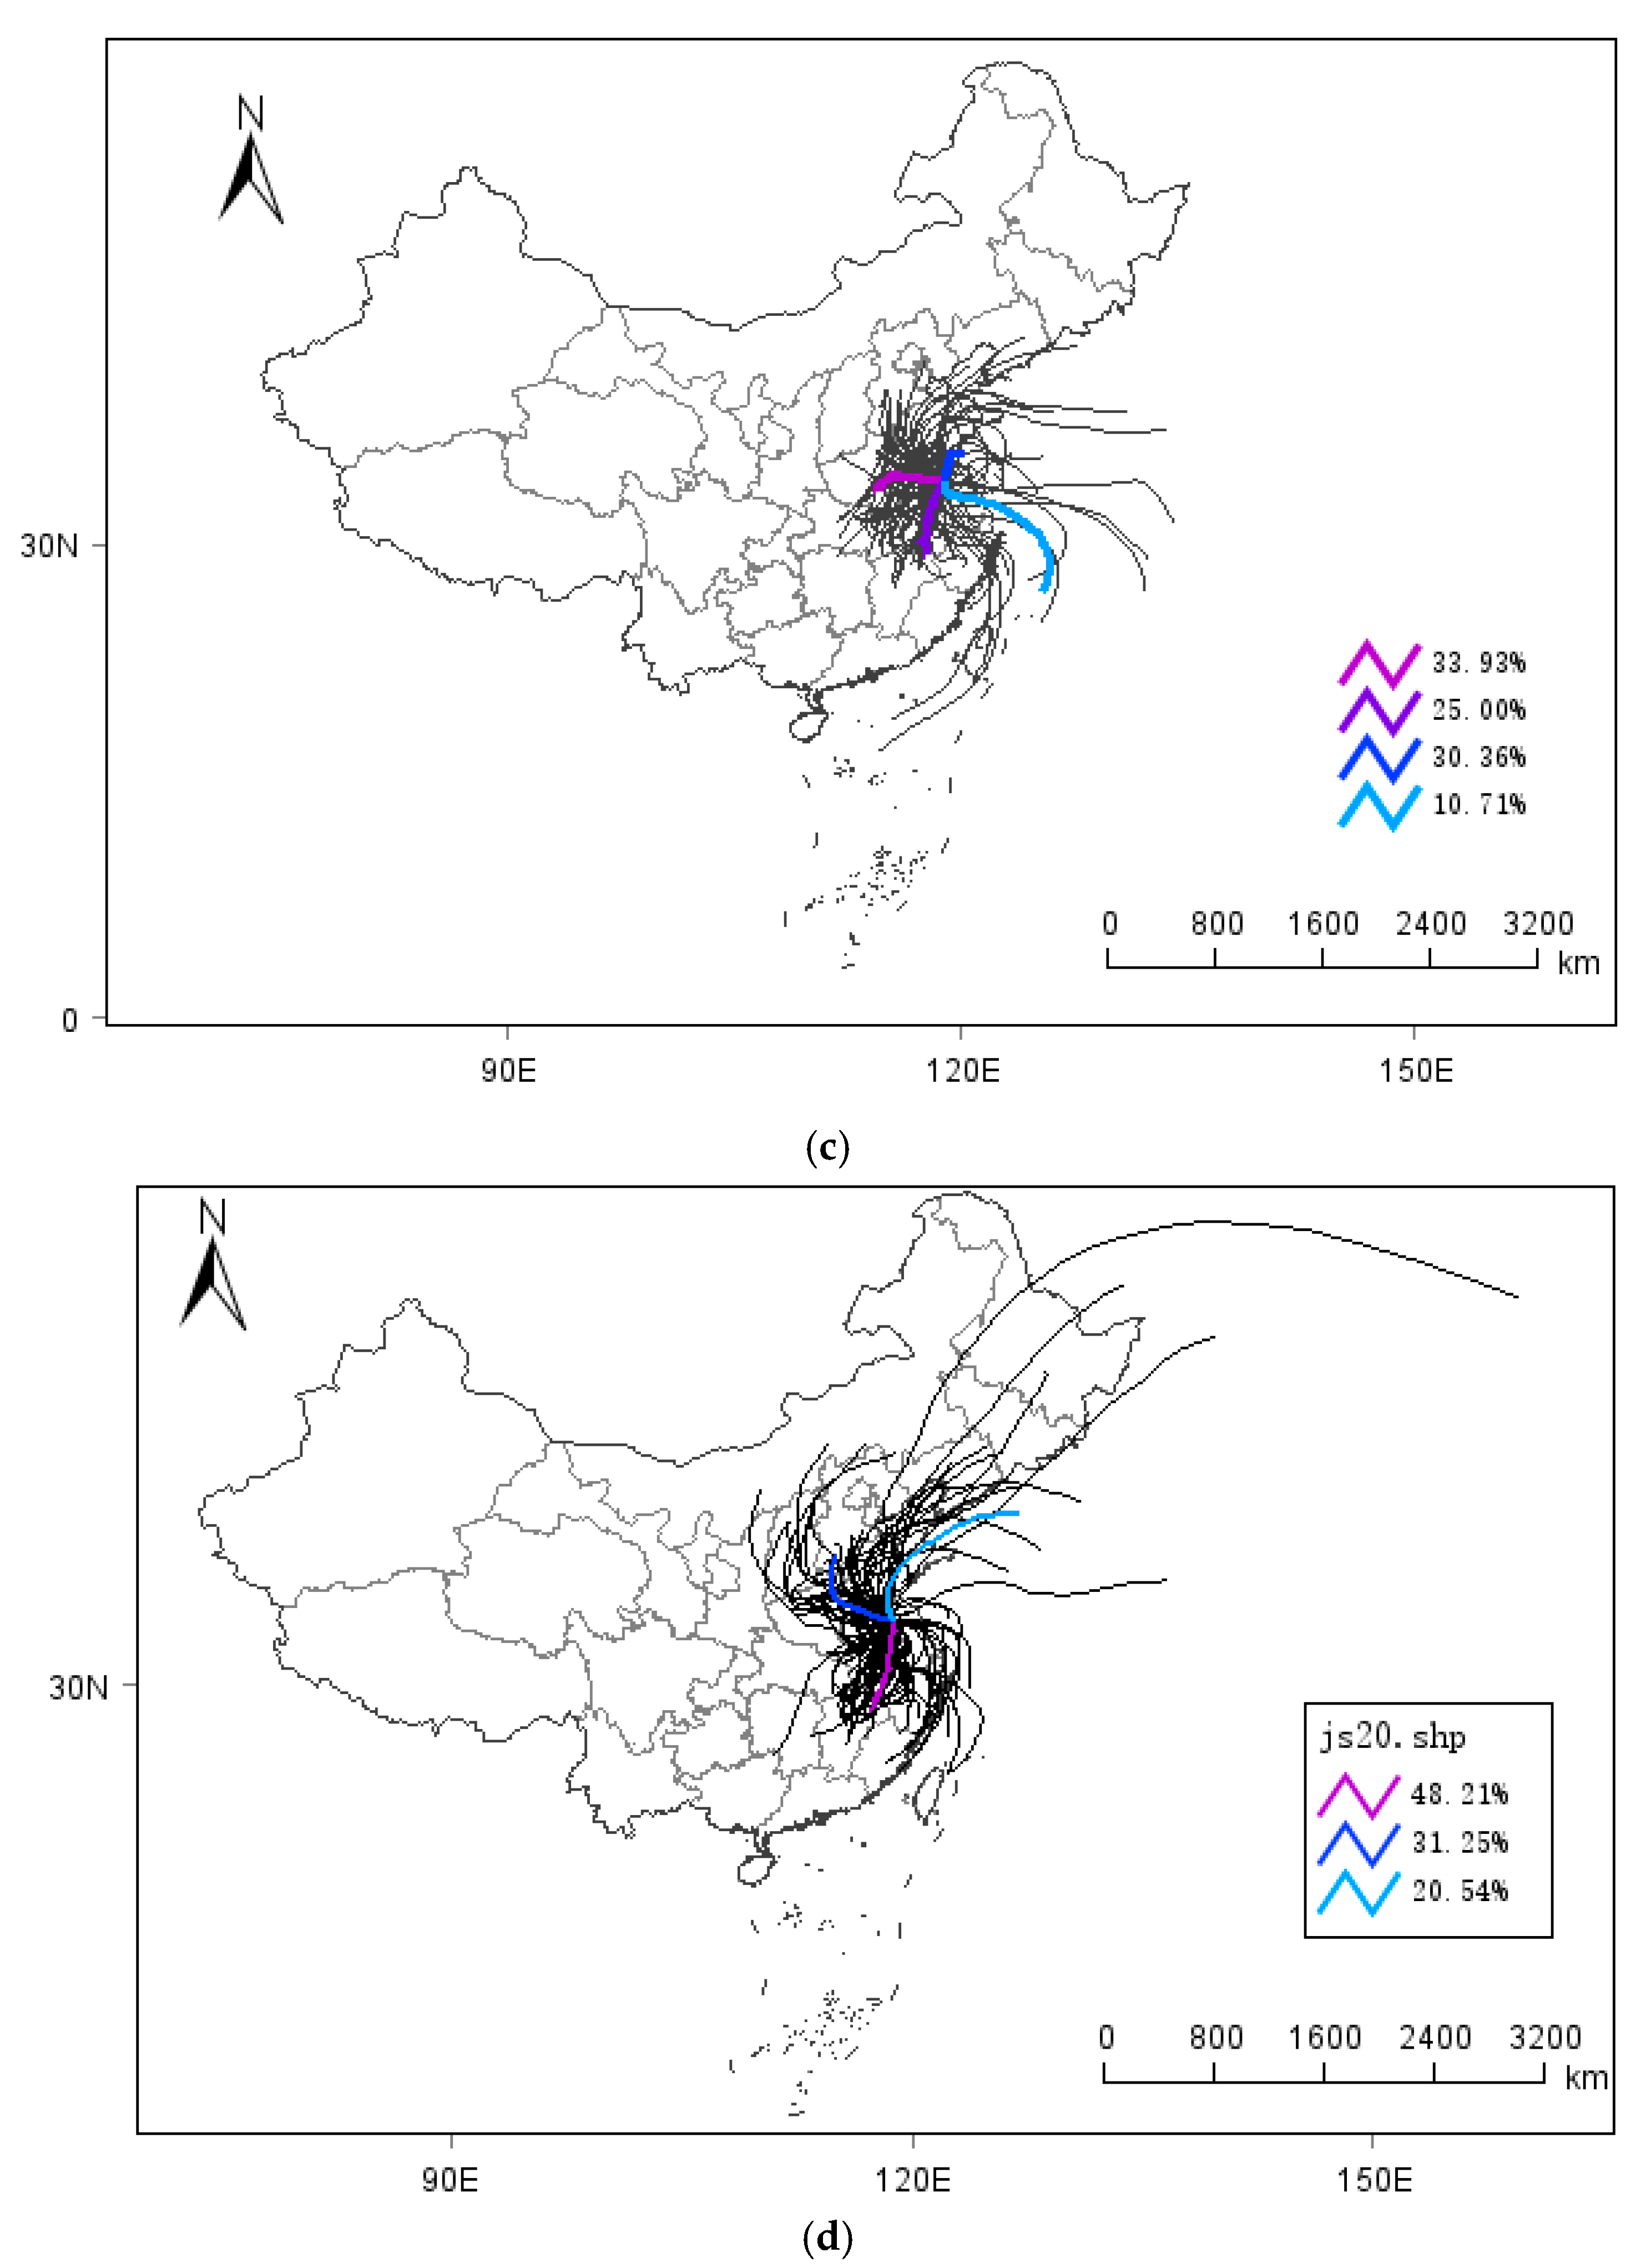
3.2. Trajectory Simulation Results and Analysis

Figure 2 illustrates the transmission trajectories of cucumber downy mildew spores at a height of 100 m from October 2017 to 2020 in Xinxian County, Shandong Province. The figure reveals a variety of transmission paths influenced by airflow, including both local spore transmission and widespread dispersal across multiple provinces and cities, particularly in Pingquan City, Hebei Province, and Huaiyin District, Jiangsu Province. In Figure 2a, 120 trajectories originating from Xinxian County in October 2017 exhibit a broad range of transmission. Cluster analysis shows that 43.10% of the trajectories spread to the northeast, primarily affecting eastern Hebei, Tianjin, and Liaoning. Additionally, 32.76%, 18.10%, and 6.02% of the trajectories propagated southwestward, with variations in transmission distance and altitude, impacting regions such as Henan, Anhui, and Hubei. Figure 2b shows the transmission tracks for October 2018, where 45.69% of the trajectories spread northeastward, impacting the eastern regions of Hebei Province, Tianjin, and surrounding areas. Another 37.07% of the tracks spread southwestward, affecting southern Hebei, northern Anhui, and Shanxi, while 17.24% spread southeast, influencing southern Shandong and Jiangsu Provinces. Figure 2c for October 2019 shows that 39.66% of the tracks spread northward, primarily affecting nearby areas in southern Hebei. Another 33.62% moved southwest to Henan and Hubei, while 26.72% followed a northeastern path, crossing the Bohai Sea into Liaoning and other areas. Figure 2d shows the transmission tracks for October 2020, with 41.38% of trajectories spreading southwestward, affecting northeastern Henan. A further 37.07% spread to the northeast, impacting eastern Hebei, Tianjin, and western Liaoning. Lastly, 21.55% of the tracks propagated southwest, primarily affecting eastern Henan and Hubei. Comparing the transmission patterns across these years reveals that downy mildew spores predominantly spread in the northeast and southwest directions. This is consistent with the prevailing north–south winds in the region, which are influenced by airflow patterns obstructed by the Taihang Mountains, creating two distinct air masses moving in these two directions. Disease investigation results confirm that the incidence of cucumber downy mildew is particularly severe in these regions.
Figure 3 shows the trajectory diagram of cucumber downy mildew spores in Pingquan City, Hebei Province, during October 2017–2020, along with airflow at 1000 m altitude. It can be seen from the diagram that the trajectory trends of these four years are roughly the same, with most of them spreading to the east and some of them spreading to the southwest because Pingquan is located at the gap between the Taihang Mountains and the Greater Hinggan Mountains. Northwest winds prevail in October. Figure 3a shows the transmission track of downy mildew spores in Pingquan City in October 2017. It can be seen from Figure 3a that 36.21% and 25.00% of the tracks spread in the northeast direction, affecting Liaoning, Jilin, and other places; 13.79% of the trace passed into the Bohai Sea along the southeast direction, mainly affecting Tangshan, Qinhuangdao, and other areas; and 25.00% of the tracks spread along the southwest direction, mainly affecting Hebei. Figure 3b illustrates the transmission pathways of downy mildew spores in Pingquan City during October 2018. Figure 3b reveals that 57.76% of the trajectories spread southeastward into the Bohai Sea, primarily affecting regions such as Tangshan and Qinhuangdao. Additionally, 20.69% of the tracks propagated eastward, impacting Liaoning Province, while 21.55% of the tracks spread in the northeast direction, predominantly affecting eastern Inner Mongolia, northwestern Jilin, and northwestern Heilongjiang. Figure 3c depicts the transmission tracks for October 2019. In this case, 39.66% of the tracks spread northeastward, primarily affecting Liaoning, Jilin, Heilongjiang, and neighboring areas. Meanwhile, 28.45% of the tracks also spread northeastward, but these mainly impacted the southeastern region of Inner Mongolia. Additionally, 31.90% of the trace spread southwest and passed through the Bohai Sea into the Shandong region. Figure 3d shows the transmission track of downy mildew spores in Pingquan City in October 2020. It can be seen from Figure 3d that 21.55% of the tracks spread along the northeast direction, mainly affecting the northwestern Jilin and Heilongjiang Provinces. 39.66% of the tracks spread east, mainly affecting Liaoning and the southern part of Jilin. 38.79% of the trace spread in the southeast direction and passed through the Bohai Sea into the Jiaodong Peninsula of Shandong Province.
Figure 4 shows the trajectory diagram of cucumber downy mildew spores in Huaiyin District, Huaian, Jiangsu Province, from November 2017 to 2020, at a height of 100 m with airflow. Due to its location in the coastal plain area affected by sea airflow, the trajectory of spores mostly spreads inland, and the trajectory frequency is relatively average. Figure 4a shows the transmission track of downy mildew spores in Huaiyin District in November 2017. It can be seen from Figure 4a that 50.89% of the tracks spread along the southwest direction, mainly affecting Anhui; 33.04% of the tracks spread northeast, mainly affecting northern Jiangsu and eastern Shandong; and 16.07% of the trace passed into the East China Sea along the southeast direction, mainly affecting southern Jiangsu and other areas. Figure 4b shows the transmission track of downy mildew spores in Huaiyin District in November 2018. It can be seen from Figure 4b that 33.93% of the tracks spread westward, mainly affecting northern Anhui and eastern Henan; 25.00% of the tracks spread southwest, mainly affecting southern Anhui and eastern Hubei; 30.36% of the tracks spread along the northeast, mainly affecting northern Jiangsu and other areas; and 10.71% of the tracks spread in the southeast direction, mainly affecting southern Jiangsu and other areas. Figure 4c shows the transmission track of downy mildew spores in Huaiyin District in November 2018. It can be seen from Figure 4c that 41.96% of the tracks spread northward, mainly affecting northern Jiangsu and Shandong; 42.86% of the tracks spread southwest, mainly affecting Anhui, eastern Hubei, and northern Jiangxi; 7.14% of the trace spread along the northeast direction and spread into the Yellow Sea, mainly affecting the northeast of Jiangsu; and 8.04% of the track spread in the southeast direction, mainly affecting southern Jiangsu and Zhejiang. Figure 4d shows the transmission track of downy mildew spores in Huaiyin District in November 2018. It can be seen from Figure 4d that 48.21% of the tracks spread along the southwest direction, mainly affecting Anhui, southern Jiangsu, northern Jiangxi, and Zhejiang; 31.25% of the tracks spread northwest, mainly affecting northwest Jiangsu, northern Anhui, western Shandong, and eastern Henan; and 20.54% of the tracks spread northeast, mainly affecting northeast Jiangsu and eastern Shandong.
Based on the above analysis, the overall trend of the spread trajectory of cucumber downy mildew spores in the three disease sources was not different in each year and had a certain universality. Compared with Xinxian County of Shandong Province and the Huaian Huaiyin District of Jiangsu Province, the spread range of downy mold spores in the Pingquan City of Hebei Province is wider, and the spread distance is longer, indicating that the spreading path of spores is more significantly affected by upper airflow. Spores in different places of disease origin have a widespread track, and the track range is cross-linked with each other, resulting in a large-scale outbreak of cucumber downy mildew and aggravating the degree of cucumber downy mildew disease, which can provide a theoretical basis for the early prediction of cucumber downy mildew transmission.

4. Conclusions

This study proposes a method based on the HYSPLIT-5 model to analyze the transmission patterns and pathways of airborne disease spores in crops. Utilizing the Lagrangian particle trajectory approach of HYSPLIT-5 in conjunction with MeteInfoMap3.5, the trajectory frequency of cucumber downy mildew spores was examined over a long time series. The results indicate that the transmission trajectory of cucumber downy mildew spores is heavily influenced by atmospheric circulation, with spores spreading along air currents to surrounding areas. These trajectories frequently intersect, resulting in a broad transmission range, and the observed transmission patterns exhibit a degree of universality.

Author Contributions

Conceptualization, Y.W. and H.M.; methodology, Y.W., G.X. and N.Y.; software, Y.W., Q.S. and T.C.; validation, Y.W., Q.S., G.X., N.Y. and T.C.; formal analysis, Y.W.; investigation, H.M.; resources, Y.W.; data curation, Y.W. and Q.S.; writing—original draft preparation, Y.W., Q.S. and M.F.T.; writing—review and editing, Y.W. and M.F.T.; visualization, Y.W.; supervision, H.M.; project administration, H.M.; funding acquisition, H.M. All authors have read and agreed to the published version of the manuscript.

Funding

This work was partially supported by the National Natural Science Foundation of China (Grant No. 32201686, 32071905 and 3217895). Shanghai Oriental Talent Program Youth Project (QNJY2024095).

Data Availability Statement

Data are contained within the article.

Acknowledgments

Acknowledgement for the data support from the National Data Center for Agricultural Scientific, National Science and Technology Infrastructure of China (http://www.agridata.cn).

Conflicts of Interest

The authors declare no conflicts of interest.

References

  1. Yan, H.F.; Acquah, S.J.; Zhang, J.Y.; Wang, G.Q.; Zhang, C.; Darko, R.O. Overview of modelling techniques for greenhouse microclimate environment and evapotranspiration. Int. J. Agric. Biol. Eng. 2021, 14, 1–8. [Google Scholar] [CrossRef]
  2. Rasool, G.; Guo, X.P.; Wang, Z.C.; Ali, M.U.; Chen, S.; Zhang, S.X.; Wu, Q.; Ullah, M.S. Coupling fertigation and buried straw layer improves fertilizer use efficiency, fruit yield, and quality of greenhouse tomato. Agric. Water Manag. 2020, 239, 106239. [Google Scholar] [CrossRef]
  3. Yan, H.F.; Zhang, C.; Gerrits, M.C.; Acquah, S.J.; Zhang, H.N.; Wu, H.M.; Zhao, B.S.; Huang, S.; Fu, H.W. Parametrization of aerodynamic and canopy resistances for modeling evapotranspiration of greenhouse cucumber. Agric. For. Meteorol. 2018, 262, 370–378. [Google Scholar] [CrossRef]
  4. Zhang, C.; Li, X.Y.; Yan, H.F.; Ullah, I.; Zuo, Z.Y.; Li, L.L.; Yu, J.J. Effects of irrigation quantity and biochar on soil physical properties, growth characteristics, yield and quality of greenhouse tomato. Agric. Water Manag. 2020, 241, 106263. [Google Scholar] [CrossRef]
  5. Rasool, G.; Guo, X.P.; Wang, Z.C.; Chen, S.; Hamoud, Y.A.; Javed, Q. Response of Fertigation Under Buried Straw Layer on Growth, Yield, and Water-fertilizer Productivity of Chinese Cabbage Under Greenhouse Conditions. Commun. Soil Sci. Plant Anal. 2019, 50, 1030–1043. [Google Scholar] [CrossRef]
  6. Xu, Y.H.; Ma, Y.; Luz, C.M.; Angel, S.M.M.; Wang, Q.J. Compost biochemical quality mediates nitrogen leaching loss in a greenhouse soil under vegetable cultivation. Geoderma 2020, 358, 113984. [Google Scholar] [CrossRef]
  7. Yan, H.F.; Acquah, S.J.; Zhang, C.; Wang, G.Q.; Huang, S.; Zhang, H.N.; Zhao, B.S.; Wu, H.M. Energy partitioning of greenhouse cucumber based on the application of Penman-Monteith and Bulk Transfer models. Agric. Water Manag. 2019, 217, 201–211. [Google Scholar] [CrossRef]
  8. Mao, H.P.; Wang, Y.F.; Yang, N.; Liu, Y.; Zhang, X.D. Effects of nutrient solution irrigation quantity and powdery mildew infection on the growth and physiological parameters of greenhouse cucumbers. Int. J. Agric. Biol. Eng. 2022, 15, 68–74. [Google Scholar] [CrossRef]
  9. Rasool, G.; Guo, X.P.; Wang, Z.C.; Hassan, M.; Aleem, M.; Javed, Q.; Chen, S. Effect of Buried Straw Layer Coupled with Fertigation on Florescence and Yield Parameters of Chinese Cabbage Under Greenhouse Environment. J. Soil Sci. Plant Nutr. 2020, 20, 598–609. [Google Scholar] [CrossRef]
  10. Huang, S.; Yan, H.F.; Zhang, C.; Wang, G.Q.; Acquah, S.J.; Yu, J.J.; Li, L.L.; Mam, J.M.; Darko, R.O. Modeling evapotranspiration for cucumber plants based on the Shuttleworth-Wallace model in a Venlo-type greenhouse. Agric. Water Manag. 2020, 228, 105861. [Google Scholar] [CrossRef]
  11. Gokulnath, B.V.; Devi, U.G. A Survey on Plant Disease Prediction using Machine Learning and Deep Learning Techniques. Intel. Artif.-Iberoamerical J. Artif. Intell. 2020, 23, 136–154. [Google Scholar] [CrossRef]
  12. Zhu, W.D.; Sun, J.; Wang, S.M.; Shen, J.F.; Yang, K.F.; Zhou, X. Identifying Field Crop Diseases Using Transformer-Embedded Convolutional Neural Network. Agriculture 2022, 12, 1083. [Google Scholar] [CrossRef]
  13. Berdugo, C.A.; Zito, R.; Paulus, S.; Mahlein, A.-K. Fusion of sensor data for the detection and differentiation of plant diseases in cucumber. Plant Pathol. 2014, 63, 1344–1356. [Google Scholar] [CrossRef]
  14. Granke, L.L.; Morrice, J.J.; Hausbeck, M.K. Relationships between airborne pseudoperonospora cubensis sporangia environmental conditions, and cucumber downy mildew severity. Plant Dis. 2014, 98, 674–681. [Google Scholar] [CrossRef]
  15. Neufeld, K.N.; Keinath, A.P.; Ojiambo, P.S. A model to predict the risk of infection of cucumber by Pseudoperonospora cubensis. Microb. Risk Anal. 2017, 6, 21–30. [Google Scholar] [CrossRef]
  16. Tao, Z.N.; Malvick, D.; Claybrooke, R.; Floyd, C.; Bernacchi, C.J.; Spoden, G.; Kurle, J.; Gay, D.; Bowersox, V.; Krupa, S. Predicting the risk of soybean rust in Minnesota based on an integrated atmospheric model. Int. J. Biometeorol. 2009, 53, 509–521. [Google Scholar] [CrossRef]
  17. Olsen, Y.; Begovic, T.; Skjoth, C.A.; Rasmussen, K.; Gosewinkel, U.; Hertel, O.; Sigsgaard, T. Grain harvesting as a local source of Cladosporium spp. in Denmark. Aerobiologia 2019, 35, 373–378. [Google Scholar] [CrossRef]
  18. Pan, Z.; Yang, X.B.; Pivonia, S.; Xue, L.; Pasken, R.; Roads, J. Long-term prediction of soybean rust entry into the continental United States. Plant Dis. 2006, 90, 840–846. [Google Scholar] [CrossRef]
  19. Xu, Y.F.; Zhang, X.L.; Sun, X.J.; Wang, J.Z.; Liu, J.Z.; Li, Z.G.; Guo, Q.; Li, P.P. Tensile mechanical properties of greenhouse cucumber cane. Int. J. Agric. Biol. Eng. 2016, 9, 1–8. [Google Scholar] [CrossRef]
  20. Abubaker, B.A.; Yan, H.F.; Hong, L.; You, W.Y.; Elshaikh, N.A.; Hussei, G.; Pandab, S.; Hassan, S. Enhancement of Depleted Loam Soil as Well as Cucumber Productivity Utilizing Biochar Under Water Stress. Commun. Soil Sci. Plant Anal. 2019, 50, 49–64. [Google Scholar] [CrossRef]
  21. Xu, Y.F.; Zhang, X.L.; Wu, S.; Chen, C.; Wang, J.Z.; Yuan, S.Q.; Chen, B.; Li, P.P.; Xu, R.J. Numerical simulation of particle motion at cucumber straw grinding process based on EDEM. Int. J. Agric. Biol. Eng. 2020, 13, 227–235. [Google Scholar] [CrossRef]
  22. Ali, A.B.; Elshaikh, N.A.; Hussien, G.; Abdallah, F.E.; Hassan, S. Biochar Addition For Enhanced Cucumber Fruit Quality Under Deficit Irrigation. Biosci. J. 2020, 36, 1930–1937. [Google Scholar] [CrossRef]
  23. Hsiao, T.C.; Chen, W.N.; Ye, W.C.; Lin, N.H.; Tsay, S.C.; Lin, T.H.; Lee, C.T.; Chuang, M.T.; Pantina, P.; Wang, S.H. Aerosol optical properties at the Lulin Atmospheric Background Station in Taiwan and the influences of long-range transport of air pollutants. Atmos. Environ. 2017, 150, 366–378. [Google Scholar] [CrossRef]
  24. Putero, D.; Cristofanelli, P.; Laj, P.; Marinoni, A.; Villani, P.; Broquet, A.; Alborghetti, M.; Bonafe, U.; Calzolari, F.; Duchi, R.; et al. New atmospheric composition observations in the Karakorum region: Influence of local emissions and large-scale circulation during a summer field campaign. Atmos. Environ. 2014, 97, 75–82. [Google Scholar] [CrossRef]
  25. Tahir, H.E.; Zou, X.B.; Huang, X.W.; Shi, J.Y.; Mariod, A.A. Discrimination of honeys using colorimetric sensor arrays, sensory analysis and gas chromatography techniques. Food Chem. 2016, 206, 37–43. [Google Scholar] [CrossRef]
  26. Wu, X.H.; Zhou, J.; Wu, B.; Sun, J.; Dai, C.X. Identification of tea varieties by mid-infrared diffuse reflectance spectroscopy coupled with a possibilistic fuzzy c-means clustering with a fuzzy covariance matrix. J. Food Process Eng. 2019, 42, e13298. [Google Scholar] [CrossRef]
  27. Wang, Y.F.; Yang, N.; Ma, G.X.; Taha, M.F.; Mao, H.P.; Zhang, X.D.; Shi, Q. Detection of spores using polarization image features and BP neural network. Int. J. Agric. Biol. Eng. 2024, 17, 213–221. [Google Scholar] [CrossRef]
  28. Wang, Y.F.; Shi, Q.; Ren, S.J.; Li, T.Z.; Yang, N.; Zhang, X.D.; Ma, G.X.; Taha, M.F.; Mao, H.P. Application of a spore detection system based on diffraction imaging to tomato gray mold. Int. J. Agric. Biol. Eng. 2024, 17, 212–217. [Google Scholar] [CrossRef]
  29. Zhou, H.X.; Fu, H.J.; Wu, X.H.; Wu, B.; Dai, C.X. Discrimination of tea varieties based on FTIR spectroscopy and an adaptive improved possibilistic c-means clustering. J. Food Process. Preserv. 2020, 44, e14795. [Google Scholar] [CrossRef]
  30. Wu, X.H.; Zhou, H.X.; Wu, B.; Fu, H.J. Determination of apple varieties by near infrared reflectance spectroscopy coupled with improved possibilistic Gath-Geva clustering algorithm. J. Food Process. Preserv. 2020, 44, e14561. [Google Scholar] [CrossRef]
  31. Li, Q.L.; Wu, X.H.; Zheng, J.; Wu, B.; Jian, H.; Sun, C.Z.; Tang, Y.B. Determination of Pork Meat Storage Time Using Near-Infrared Spectroscopy Combined with Fuzzy Clustering Algorithms. Foods 2022, 11, 2101. [Google Scholar] [CrossRef] [PubMed]
  32. Hu, C.P.; Xu, H.J.; Fu, Z.M.; Wu, B.; Zhang, R.; Zhi, C.H. Non-destructive Identification of the geographical origin of red jujube by near-infrared spectroscopy and fuzzy clustering methods. Int. J. Food Prop. 2023, 26, 3275–3290. [Google Scholar] [CrossRef]
  33. He, L.L.; Chen, R.; Lan, F.; Yang, H.; Gao, R.C.; Jin, W.A. Analysis of VOCs in Lueyang Black Chicken Breast Meat during the Steaming Process with GC-IMS and Stoichiometry. J. Food Qual. 2024, 2024, 6663167. [Google Scholar] [CrossRef]
Figure 1. Clustering TSV curve of spore transmission locus of cucumber downy mildew in Xin County, Shandong Province, in October 2017.
Horticulturae 11 00336 g001
Figure 2. The trajectory cluster diagram of cucumber downy mildew spores in Xinxian County, Shandong Province, in October from 2017 to 2020: (a) from 1 October to 30 October 2017; (b) from 1 October to 30 October 2018; (c) from 1 October to 30 October 2019; (d) from 1 October to 30 October 2020.
Horticulturae 11 00336 g002aHorticulturae 11 00336 g002b
Figure 3. The trajectory cluster diagram of cucumber downy mildew spores in Pingquan City, Hebei Province, in October from 2017 to 2020: (a) from 1 October to 30 October 2017; (b) from 1 October to 30 October 2018; (c) from 1 October to 30 October 2019; (d) from 1 October to 30 October 2020.
Horticulturae 11 00336 g003aHorticulturae 11 00336 g003b
Figure 4. The trajectory cluster diagram of cucumber downy mildew spores in Huaiyin District, Huai’an City, Jiangsu Province, from November 2017 to 2020: (a) from 1 November to 30 November 2017; (b) from 1 November to 30 November 2018; (c) from 1 November to 30 November 2019; (d) from 1 November to 30 November 2020.
Horticulturae 11 00336 g004aHorticulturae 11 00336 g004b
Table 1. Simulated source geographic information, time period, and height in 2017 and 2020.
Simulated Source PointLongitude and LatitudeSimulation PeriodSimulated Height/m
Xinxian County, Shandong Province36.18° N, 115.61° EFrom 1 October to 30 October100
Pingquan City, Hebei Province41.11° N, 118.75° EFrom 1 October to 30 October1000
Huaiyin District, Huaian, Jiangsu33.58° N, 118.86° EFrom 1 November to 30 November100
Disclaimer/Publisher’s Note: The statements, opinions and data contained in all publications are solely those of the individual author(s) and contributor(s) and not of MDPI and/or the editor(s). MDPI and/or the editor(s) disclaim responsibility for any injury to people or property resulting from any ideas, methods, instructions or products referred to in the content.

