Article

Comparative Transcriptome Analysis Reveals the Mechanism by Ethylene and 1-Methylcyclopropene Treatment on the Vase Life of Cut Oncidium hybridumHoney Angle

1
School of Breeding and Multiplication, Sanya Institute of Breeding and Multiplication, Hainan University, Sanya 572025, China
2
Key Laboratory for Quality Regulation of Tropical Horticultural Crops of Hainan Province, School of Tropical Agriculture and Forestry, Hainan University, Haikou 570228, China
*
Authors to whom correspondence should be addressed.
These authors contributed equally to this work.
Horticulturae 2025, 11(4), 386; https://doi.org/10.3390/horticulturae11040386 (registering DOI)
Submission received: 28 February 2025 / Revised: 18 March 2025 / Accepted: 1 April 2025 / Published: 4 April 2025
(This article belongs to the Section Postharvest Biology, Quality, Safety, and Technology)

Abstract

:
The cut flowers of the Oncidium hybridum cultivar ‘Honey Angle’ are highly regarded for their vibrant floral display, excellent flower quality, and broad commercial applications. However, its postharvest vase life is significantly challenged by wilting, water loss, and color fading, primarily due to ethylene exposure. To clarify the underlying mechanism, we performed treatments with ethylene and ethylene action inhibitor 1-Methylcyclopropene (1-MCP). The petal changes, vase life, and transcriptomic analysis after treatments were investigated. The results revealed that the 1-MCP treatment significantly extended the vase life by upregulating the genes involved in carotenoid synthesis, suppressing the genes related to cell wall degradation and the ethylene signaling pathways. In contrast, the ethylene treatment accelerated senescence by activating the senescence-related genes and increasing ethylene production. Transcriptome analysis identified 960 transcription factors, predominantly from the NAC, WRKY, ERF, bHLH, and MYB families, which were crucial in regulating quality changes during the vase life. A total of 5203 differentially expressed genes (DEGs) were assigned to 19 KEGG pathways including carbohydrate and energy metabolism as well as plant hormone signal transduction. Weighted gene co-expression network analysis (WGCNA) indicated that these DEGs were primarily associated with weight loss, flowering ratio, lightness, maximum petal diameter, and respiration intensity. This research provided valuable insights into the molecular mechanisms of floral senescence and practical guidance for extending the vase life of ‘Honey Angle’ cut flowers.

1. Introduction

Oncidium hybridumHoney Angle’ is a widely utilized cut flower in commercial applications, valued for its vibrant blooms and exceptional qualities. However, its business potential is compromised by ethylene-induced senescence, which significantly shortens its vase life. Postharvest losses for Oncidium cut flowers could reach up to 40–50%, especially in ethylene-sensitive varieties, due to inadequate postharvest handling. These losses are further aggravated by rapid declines in petal color, moisture content, and fragrance, which diminish the overall flower quality and restrict long-distance transport. Vase life is a critical determinant of commercial value, making the study of the accelerated senescence mechanism caused by ethylene in cut flowers essential.
Ethylene, a key regulator of flower senescence, accelerates petal wilting, color fading, and dehydration. In Oncidium cut flowers, ethylene production initiates a cascade of physiological and biochemical changes that lead to senescence [1]. The vase life can extend up to 12 days under optimal conditions (11 °C) but averages only 10 days under typical conditions. Petals exhibit dehydration, discoloration, wilting, and significantly reduced marketability by days 6 to 7 [2]. Transcriptomic studies on Oncidium ‘Huangjin 2’ have revealed the EIL3 gene as a potential regulator of ethylene signaling, although its precise role remains unclear [3]. The molecular mechanisms underlying ethylene biosynthesis, signaling, and metabolism during Oncidium senescence were not fully elucidated. The role of ethylene in flower senescence was well documented across other species [4]. In roses, increased sensitivity to ethylene directly shortened the vase life by accelerating petal wilting [5]. Similarly, in carnations, treatments such as sucrose solutions and nano-silver preservatives mitigated the ethylene effects by suppressing the expression of key ethylene synthesis genes (DcACS1, DcACO1) and inhibiting ethylene action [6,7]. Additionally, the CRISPR-based editing of ethylene synthesis genes (PhACO3, PhACO4) in petunias has demonstrated the potential to extend vase life [8].
1-Methylcyclopropene (1-MCP), an ethylene action inhibitor, has emerged as an effective tool for extending vase life. It delays senescence by blocking ethylene receptors and suppressing ethylene biosynthesis [9,10]. In ethylene-sensitive peonies, 1-MCP treatment reduced ethylene release and downregulated ethylene synthesis (PsACS1, PsACO1) and signaling genes (Ps-ETR1-1, PsERS1, PsEIN4, PsCTR1~3, PsEIL1~3, PsERF1), effectively delaying flower senescence [11]. Similar effects have been observed in carnations, with a 1-MCP-containing cyclodextrin sponge preserving petal color and reducing ethylene release [12]. Preharvest applications of 1-MCP in lilies and dahlias have also been shown to extend vase life by regulating the energy balance and delaying petal wilting [13]. However, the molecular mechanisms by which 1-MCP influenced Oncidium senescence remain poorly understood. The current preservation strategies for Oncidium cut flowers rely on a combination of physical and chemical methods, with 1-MCP emerging as a promising agent for delaying senescence, as evidenced by its effectiveness in related species like Dendrobium [14]. Comprehensive studies on Oncidium are still limited, particularly regarding the interactions between ethylene; 1-MCP; and other phytohormones such as gibberellins, brassinosteroids, salicylic acid, and cytokinins [3].
In this study, we focused on the cut flowers of the Oncidium hybridum cultivar ‘Honey Angle’ to elucidate the molecular of ethylene-induced senescence and the protective effects of 1-MCP. Our objective was to identify the key regulatory genes and pathways that influence the varying responses of Oncidium cut flowers to these treatments. By comparative transcriptomics, we analyzed the gene expression patterns associated with carotenoid metabolism, reactive oxygen species (ROS) metabolism, cell wall degradation, and phytohormone signaling. This study aims to provide critical insights into the molecular mechanisms underlying oncidium senescence and to emphasize the potential of 1-MCP as an effective postharvest treatment for extending the vase life of ‘Honey Angle’ cut flowers, contributing to a better understanding of postharvest handling practices.

2. Materials and Methods

2.1. Plant Materials

Cut flowers of ‘Honey Angle’ were obtained from a commercial grower in Sanya, Hainan Province. Flowers were harvested in the early morning and quickly placed in a bucket filled with deionized water and then transported to the postharvest laboratory at Hainan University within three hours. During transit, the flowers were submerged in water and given a slanted cut at their stems. The bucket was covered with plastic wrap to minimize water evaporation. Only flowers in a uniform blooming stage were selected and trimmed to a length of approximately 46.5 cm, ensuring that half-open buds remained at the top alongside fully-opened flowers. Withered flowers at the base of the inflorescence, along with any excess buds and pedicels, were removed for later use.

2.2. Ethylene and 1-MCP Treatments

Cut flowers of ‘Honey Angle’ were randomly assigned to nine 80 L airtight plastic boxes, with three cut flowers per box (27 in total). Each box contained a 9 cm × 9 cm fan to ensure adequate air circulation. The boxes were categorized into three replicates for each of the postharvest treatments: control (air), 1-MCP (Smart Fresh™, Agrofresh Inc., Philadelphia, USA; 1 μL), and ethylene (Shengli Chemical Co., Ltd., Shanghai, China; 2 μL). The cut flowers were subjected to a treatment for 12 h with water retention cotton in the end at 23 °C with 70% relative humidity. After treatment, cut flowers were removed from the plastic boxes, and the water retention cotton was discarded. Groups with three cut flowers were placed in vases under cold white fluorescent light (10 μmol m−2 s−1) for a 12 h photoperiod daily (23 °C, 70% RH) in tap water (150 mL). The water was changed daily to simulate commercial sales. Daily assessments of the flower condition and vase life were recorded.

2.3. Vase Life Evaluation

The vase life of the flowers was defined as the period from the initial placement of fresh flowers in a vase (day 0) until more than 50% of the inflorescence displayed signs of discoloration, curling, and wilting, indicating the end of their vase life.

2.4. Opened and Unopened Flower Numbers

This began with the treatment on day 0, when the ratio of open flowers to buds on each stem was recorded, excluding wilted flowers from the count. Each treatment group included three replicates, and the mean ratio was calculated.

2.5. Fresh Weight Measurements

Before the experiment, cut flowers with consistent flowering ratios were carefully selected and marked for each group with three replicates. The cut flowers were removed from the vase and quickly dried with absorbent paper. The initial fresh weight was rapidly and accurately measured using an electronic balance. After treatment, the fresh weight of the cut flowers was recorded daily at a designated time, and the relative weight loss rate was calculated using the appropriate formula: Weight Loss Rate = 100% × (Initial Fresh Weight—Current Fresh Weight)/Initial Fresh Weight.

2.6. Lightness Determination

In each group, fully bloomed petals exhibiting consistent growth conditions were selected and marked. The lightness of the petals was measured daily at fixed times using a colorimeter (CR-10 Plus, Konica Minolta Optics Inc., Tokyo, Japan) with three replicates for each group.

2.7. Maximum Petal Diameter Determination

In each group, fully bloomed petals with identical growth conditions were selected and marked. The maximum diameter of the petals was measured using a vernier caliper (Yantai Greenery Tools Co., Ltd., 0–200 mm), and the results were reported in millimeters.

2.8. Respiratory Intensity Determination

The determination employed nine 7.5 L airtight boxes, with three boxes allocated to each treatment group, serving as replicates. Two uniformly grown flower stems were weighed, sealed in an airtight box, and left undisturbed for 1 h. The O2 and CO2 levels were then measured using a headspace gas analyzer (DK-190, Jinan Saicheng Electronic Technology Co., Ltd., Jinan, China). The results were presented as mg CO2 kg−1 h−1.

2.9. Odor Measurements

The electronic nose (ISENSO INTELLIGENT, Shanghai, China) was preheated for 30 min and equipped with 18 sensors (SN-1 to SN-18) for odor measurements. Five flower stems were selected from each treatment group. From the inflorescence of each group, six uniformly sized flowers (weighed 8 g ± 0.1 g) were detached and placed into a clean sealed bottle (40 mL). The bottles were left undisturbed at room temperature for 30 min to allow for the collection of headspace gases, with three replicates for each group. The measurement conditions included a cleaning time of 120 s, a sample interaction time of 60 s, and a gas flow rate of 1 L/min.

2.10. RNA Extraction and Gene Annotation

Flower samples (weighing 10 g each) were collected from the 1-MCP, ETH, and control groups on days 0 and 5 with three replicates for each time point. The samples were immediately frozen in liquid nitrogen, ground into a fine powder, and stored at −80 °C. Total RNA was extracted and purified using the RNAprep Pure Plant Kit (DP441, Tiangen Biotech Co., Ltd., Beijing, China,). mRNA was enriched with mRNA Capture Beads, fragmented at a high temperature, and reverse-transcribed into cDNA using a reverse transcriptase mix. cDNA was purified, and target fragments were selected with Hieff NGS® DNA Selection Beads. Finally, the cDNA library was amplified via PCR and sequenced on the Illumina Novaseq6000 platform by Gene Denovo Biotechnology Co. (Guangzhou, China).

2.11. Transcriptome Data and WGCNA Analysis

We quantified assembled the unigenes using RSEM software (version 1.2.19) with the method of FPKMs (fragments per kilobase of transcript per million mapped reads). The FPKM formula is as follows: FPKM = 106C/(NL/103). In the formula, the FPKM value for gene X’s expression level is calculated where C is the number of fragments mapped to gene X, N is the total number of fragments mapped to the reference genome, and L is the length of gene X in bases. For differential gene expression analysis, read counts from the gene expression analysis served as the input data and were analyzed with edgeR software (version 4.4.2). The genes were identified as significantly differentially expressed if they had an FDR (False Discovery Rate) less than 0.05 and an absolute log2 fold change greater than 1. Hierarchical clustering was performed on the expression patterns of these differentially expressed genes, with results visualized using heatmaps. The validation (qRT-PCR) of the selected differentially expressed genes is shown in Figure S1. For network analysis, we used the WGCNA package in R. The physiological data were imported to construct a gene clustering tree based on expression correlations. The modules were defined by clustering genes with similar expression patterns, with each module represented by a distinct color and unassigned genes marked in gray. The initial modules were dynamically cut and then merged based on eigengene similarity, resulting in the final merged dynamic modules. The analysis set a similarity threshold of 0.9 and required a minimum of 50 genes per module.

2.12. Statistical Analysis

In all the experiments, inflorescences were arranged in a completely randomized design. Measurements were taken in triplicate, providing both qualitative and quantitative results. The data were presented as the mean ± standard deviation for three replicates per group (n = 9). For graphical representation and data analysis, we utilized GraphPad Prism 10.1.1 (GraphPad Software, San Diego, CA, USA) and SPSS 27.0 (IBM SPSS Statistics, Chicago, IL, USA). Statistical analyses were performed using analysis of variance (ANOVA) and t-tests. The means were compared using the least significant difference (LSD) test, with significance set at p < 0.05.

3. Results and Discussion

3.1. Vase Life Under Treatments

The 1-MCP treatment significantly prolonged the vase life of ‘Honey Angle’, while the ethylene treatment exerted the opposite effect. This difference can be attributed to the sensitivity of Oncidium cut flowers to ethylene and the regulations of endogenous hormones. By day 16, all the groups of Oncidium had concluded their vase life. The control group (CK) averaged a vase life of 11.33 days, while the ethylene group (ETH) averaged 9.33 days, and the 1-MCP group achieved an impressive of 15.00 days (Figure 1A). The t-tests revealed that the vase life of the ETH group was significantly shorter than that of the CK, while the 1-MCP group displayed a markedly longer vase life than that of both the CK and ETH groups. These findings indicated that the 1-MCP (1 μL/L) treatment greatly extended the vase life of Oncidium cut flowers, while the ethylene (2 μL/L) treatment significantly reduced it. Hassan and Ali [15] showed that 1-MCP (0.2 and 0.4 g/m3) increased the vase life of gladiolus ‘White Prosperity.’ The ethylene-sensitive tulip ‘Apeldoorn’ had higher flower abortion rates with the ethylene (10 μL/L) treatment, while the 1-MCP (1 μL/L) treatment protected ‘Apeldoorn’ bulbs from ethylene damage [16]. Additionally, the 1-MCP (0.25 μL/L, 3.3%) treatment reduced endogenous ethylene in carnation cut flowers and extended the vase life [17]. These findings supported our results, showing that the vase life of ‘Honey Angle’ cut flowers was related positively to endogenous ethylene release, as the 1-MCP treatment suppressed ethylene levels and extended the vase life.

3.2. Numbers of Opened and Unopened Florets

The ethylene treatment was more effective than 1-MCP in promoting flowering. Exogenous ethylene accelerated senescence in Oncidium, while 1-MCP helped preserve flower opening and extended the vase life. In the spikes of Oncidium treated with 1-MCP, the ratio of opened to unopened flowers slightly increased compared to that of the control, whereas the ethylene treatment showed a significant rise (Figure 1C). This indicated that both 1-MCP (1 μL/L) and ethylene (2 μL/L) promoted blooming. Supporting our findings, it was reported that 1-MCP enhanced flower opening in gladiolus [15] and tulips [16] at concentrations of 0.2 g/m3 and 0.4 g/m3 or 1 μL/, respectively.

3.3. Maximum Petal Diameter Determination

The maximum flower diameter was a key indicator for evaluating wilting in Oncidium cut flowers, which was directly correlated with their vase life. The results showed that the 1-MCP treatment extended the opening duration of cut flowers compared to that of the CK and ETH treatments. The 1-MCP treatment effectively controlled the fresh weight of ‘Honey Angle’, thus delaying water loss, wilting, and reductions in the average maximum bloom diameter. Wilting in Oncidium occurred when the petal aperture fell below 15 mm. For the CK and ETH treatments, the maximum petal aperture gradually declined from day 3, sharply decreasing to a wilted state between days 9 and 11. In contrast, the flowers treated by 1-MCP showed a significant delay in this decline, with noticeable differences starting from day 9 (Figure 1F). In the study of In et al. [18], the authors reported that the petals of ‘Moonstone’ (Dianthus caryophyllus L.) treated with ethylene (5 μL/L) showed a decrease in maximum diameter on day 6, coinciding with a spike in ethylene release, and they were fully wilted by day 7. However, the petals treated with 1-MCP (0.1 μL/L) maintained their diameter and lifespan for over 7 days. Similarly, Ha et al. [19] found that treating the ethylene-sensitive rose cultivar ‘All for love’ with 1-MCP (1 μL/L) significantly increased the maximum bloom diameter and extended its vase life.

3.4. Fresh Weight Changes and Respiration Intensity

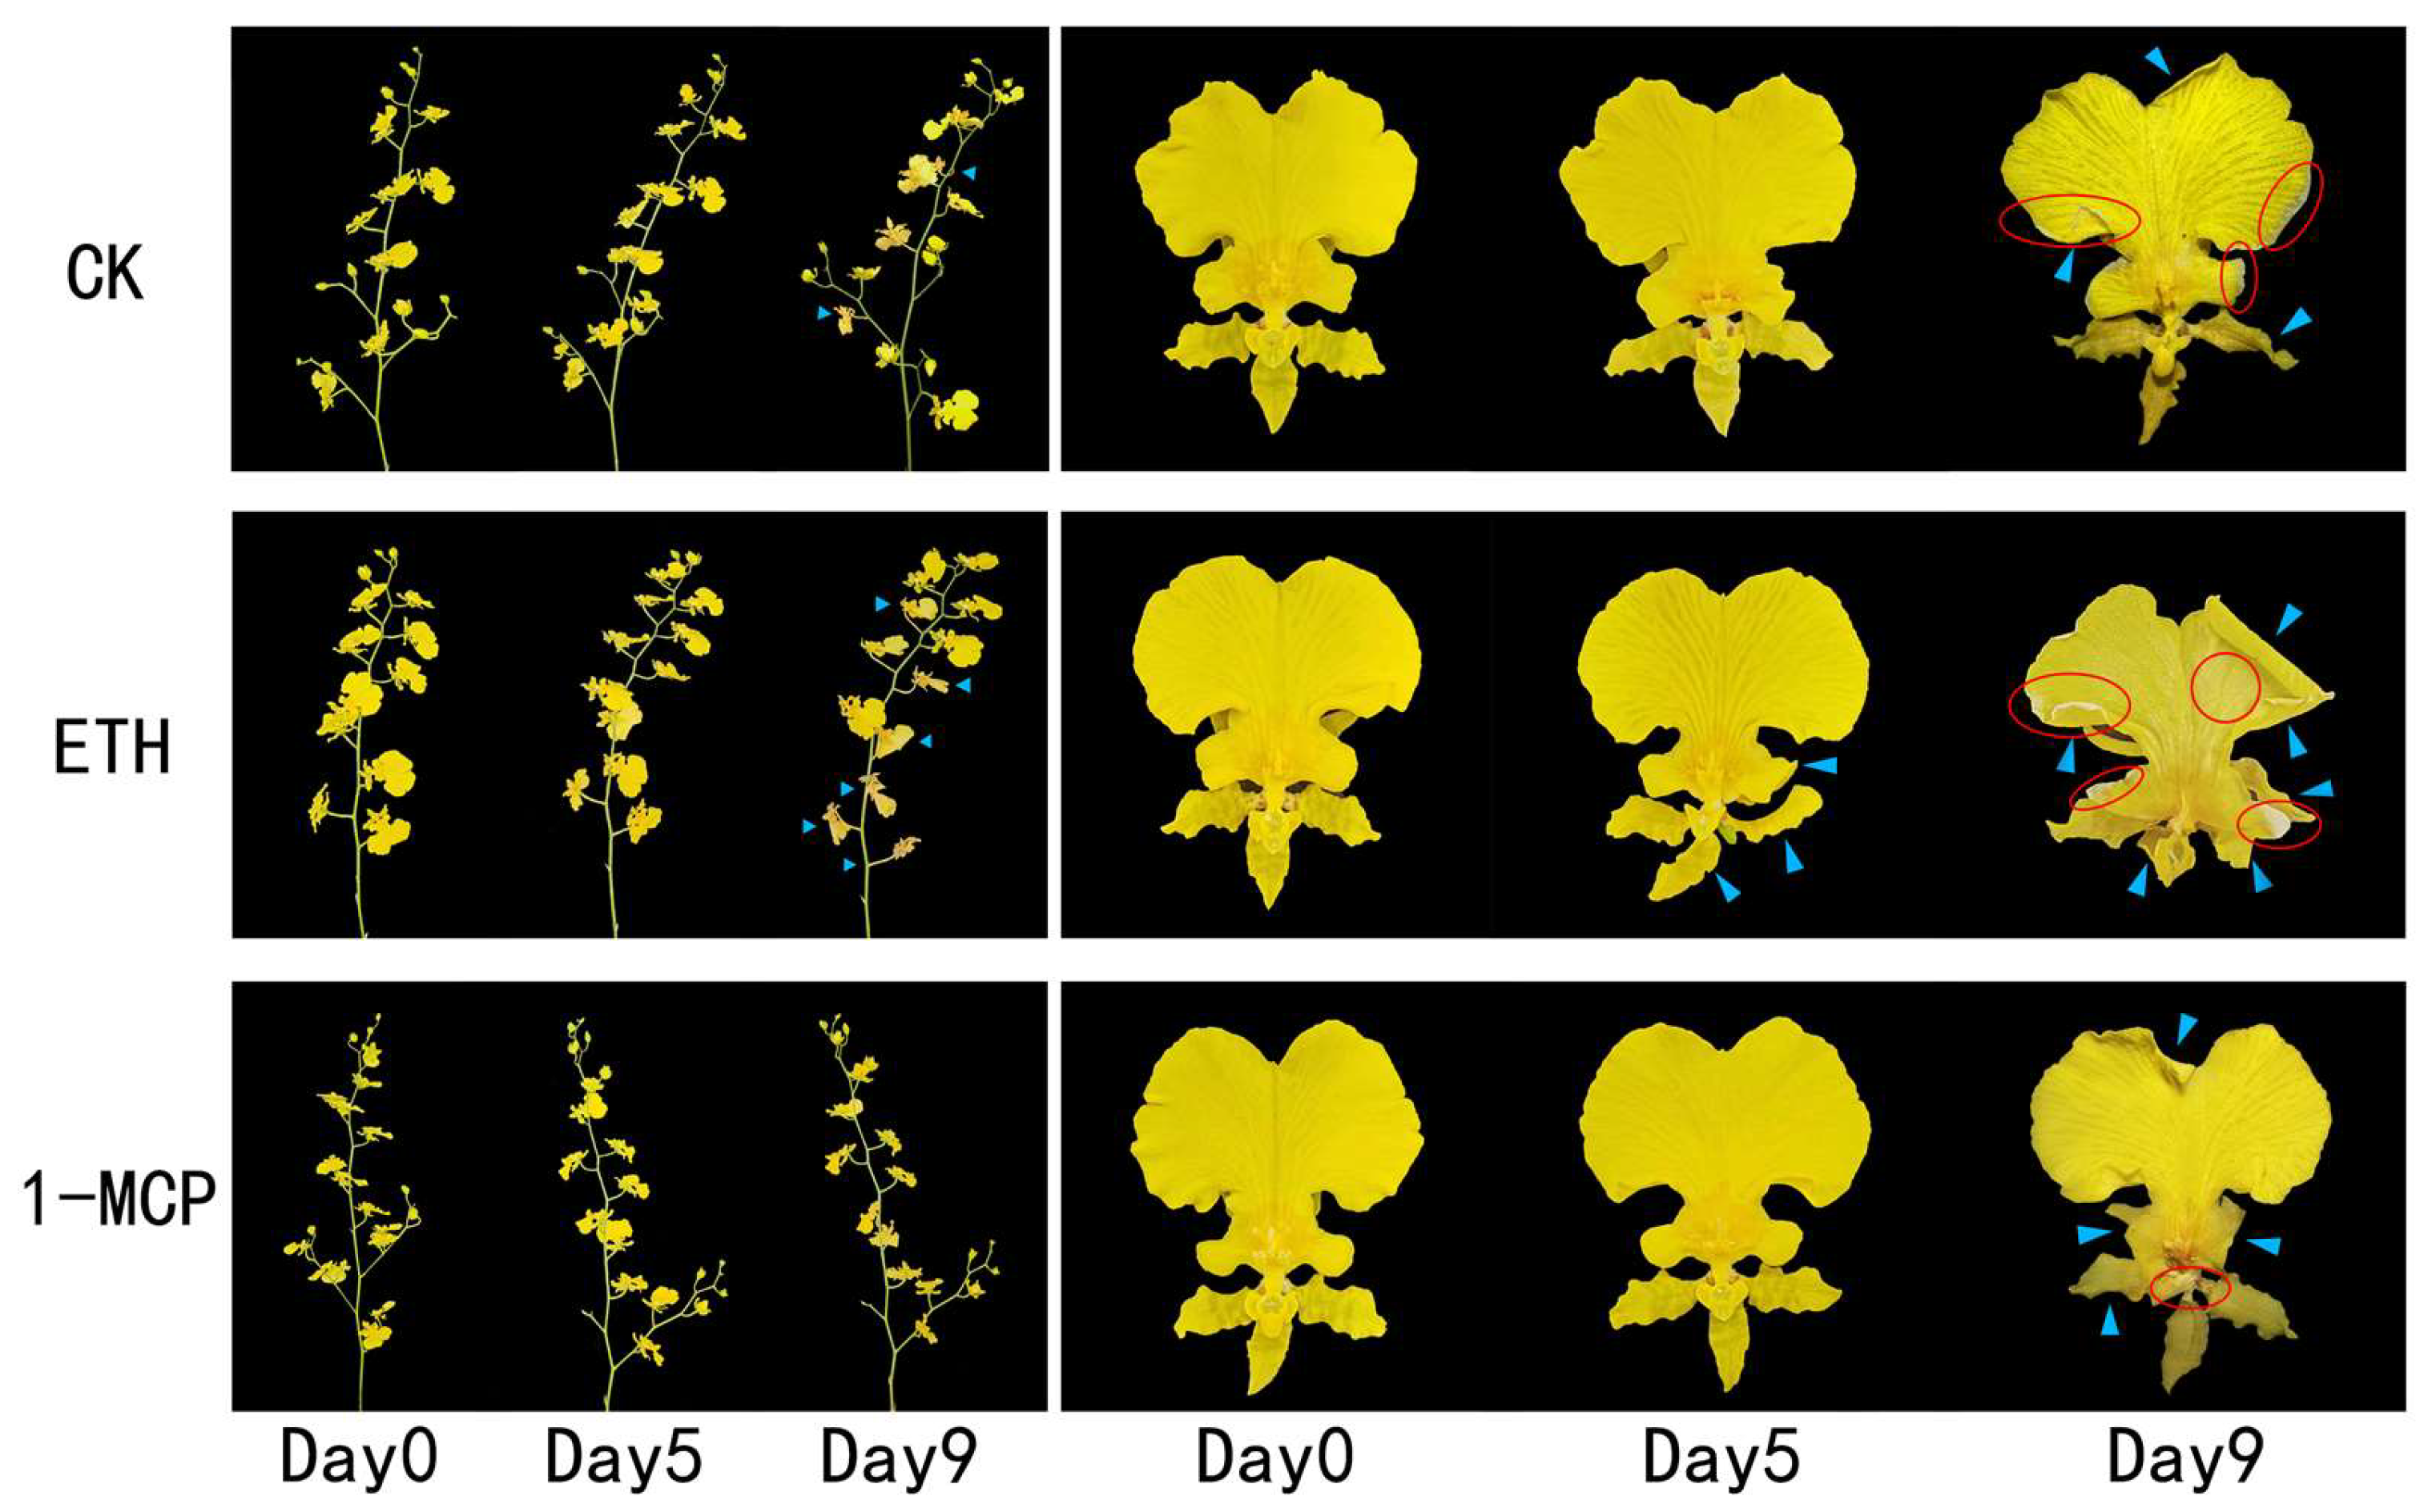
The Oncidium cut flowers initially increased in fresh weight and then declined over their vase life (Figure 1E). The CK flowers absorbed water for 6 days, and the ETH-treated flowers for 5 days, while the 1-MCP-treated flowers continued to gain weight for 8 days. The ETH treatment exhibited the highest weight loss rate in the first 7 days, while the CK displayed the most significant loss from day 9, sharply contrasting with the 1-MCP treatment. By day 5, the ETH-treated petals exhibited visible dehydration signs, including surface grooves and slight curling (Figure 2). By day 9, all the groups showed symptoms of dehydration, such as wrinkling, curling, and petal paling. The ETH treatment experienced the most severe senescence, whereas the 1-MCP treatment effectively delayed aging. Mattiuz et al. [20] found that 1-MCP (1000 ppm) significantly extended the vase life by maintaining the fresh weight of Oncidium varicosumSamurai’. Similarly, Hassan and Gerzson [21] showed that 1-MCP (0.3, 0.5, and 0.7 g/m3) reduced the weight loss in Chrysanthemum morifolium RAM cv. Suny Reagan, with 0.5 g/m3 for six hours being the most effective. Ali et al. [22] reported that 1-MCP (400 mg/m3) minimized the weight loss and extended the vase life of Rosa damascena Mill. var. Trigintipetala at both 4 °C and 20 °C. This suggested a strong correlation between water retention, weight loss, and petal senescence, indicating that the 1-MCP treatment extended the vase life of Oncidium by enhancing fresh weight retention.
On day 15, the respiratory intensity of the cut flowers treated with CK, 1-MCP, and ETH was lower than at the beginning (Figure 1B). On day 0, the ETH treatment led to significantly higher respiratory intensity compared to that of the CK and 1-MCP. By day 5, the ETH-treated flowers maintained the highest respiratory intensity, while the 1-MCP-treated flowers showed the lowest. Gong et al. [23] found that 1-MCP (10 μL/L) reduced the respiratory intensity and extended the vase life of cut roses ‘Carola’, while ethylene (0.5 g/L) increased both the respiratory intensity and ethylene production. Chang et al. [24] found that 1-MCP (0.1 μL/L) protected ‘Phalaenopsis amabilis’ from high ethylene damage, significantly lowered respiratory intensity, and extended vase life.

3.5. Lightness Changes Under Treatments

The initial luminance of the ‘Honey Angle’ cut flowers was 86.35 cd/m2, dropping to 67.76 cd/m2 by day 15 when all the flowers wilted. Fluctuations in petal luminance occurred in all treatment groups before a decline. The ETH group showed a sharp decrease starting on day 5, while the CK and 1-MCP group decreased on days 6 and 9, respectively (Figure 1D). Buanong et al. [25] found that 10 μL/L ethylene caused petal discoloration in ‘Sansai Blue’ orchids. Khunmuang et al. [26] reported that 1-MCP restored the petal color and anthocyanin levels in ‘Sansai Blue’ Oncidium after ethylene exposure, supporting our results. Conversely, Mattiuz et al. [20] found no significant fluctuations in the luminance for Oncidium varicosum ‘Samurai’ treated with 1000 ppm 1-MCP, where the initial luminance dropped from 90.73 cd/m2 to 78.24 cd/m2, showing no difference from the CK group. These inconsistencies may arise from variations in the data collection timing, flower variety, and experimental settings. Additionally, the brownish pigmentation of ‘Samurai’ anthers, which is absent in ‘Honey Angle’, could influence luminance readings and affect different studies.

3.6. Odor Changes Under Treatments

The olfactory profiles of ‘Honey Angle’ were assessed using electronic nose sensor responses at various treatment intervals (Figure 3, with associated volatiles listed in Table S1). Sensors SN_7, SN_8, SN_11, SN_12, and SN_13 were particularly responsive, indicating that short-chain alkanes and alkenes were the main volatiles. Meanwhile, sensors SN_2, SN_3, SN_10, and SN_15 showed consistent readings, yet other sensors exhibited variable responses over time. On day 0, the 1-MCP group showed the highest olfactory response, surpassing both the CK and ETH groups in sensitivity to short-chain compounds. The 1-MCP group also reacted significantly to sulfides, organic amines, nitrogen oxides, aromatics, and alcohols/aldehydes. By day 5, the olfactory impact of the 1-MCP and CK groups decreased compared to that of the ETH group, but the 1-MCP group still showed the highest readings. By day 9, the odor profiles stabilized, with the ETH group showing strong responses on sensors SN_1, SN_2, SN_4, SN_5, SN_15, SN_16, and SN_17, corresponding to compounds like propane, natural gas, formaldehyde, hydrogen sulfide, ammonia, and isobutane, many of which were malodorous. This pattern coincided with a higher degree of flower wilting and spoilage under the ETH treatment compared to that of the CK and 1-MCP groups, suggesting a potential correlation between the olfactory profiles and flower senescence.

3.7. Transcriptome Analysis of Oncidium ‘Honey Angle’ in Vase Life

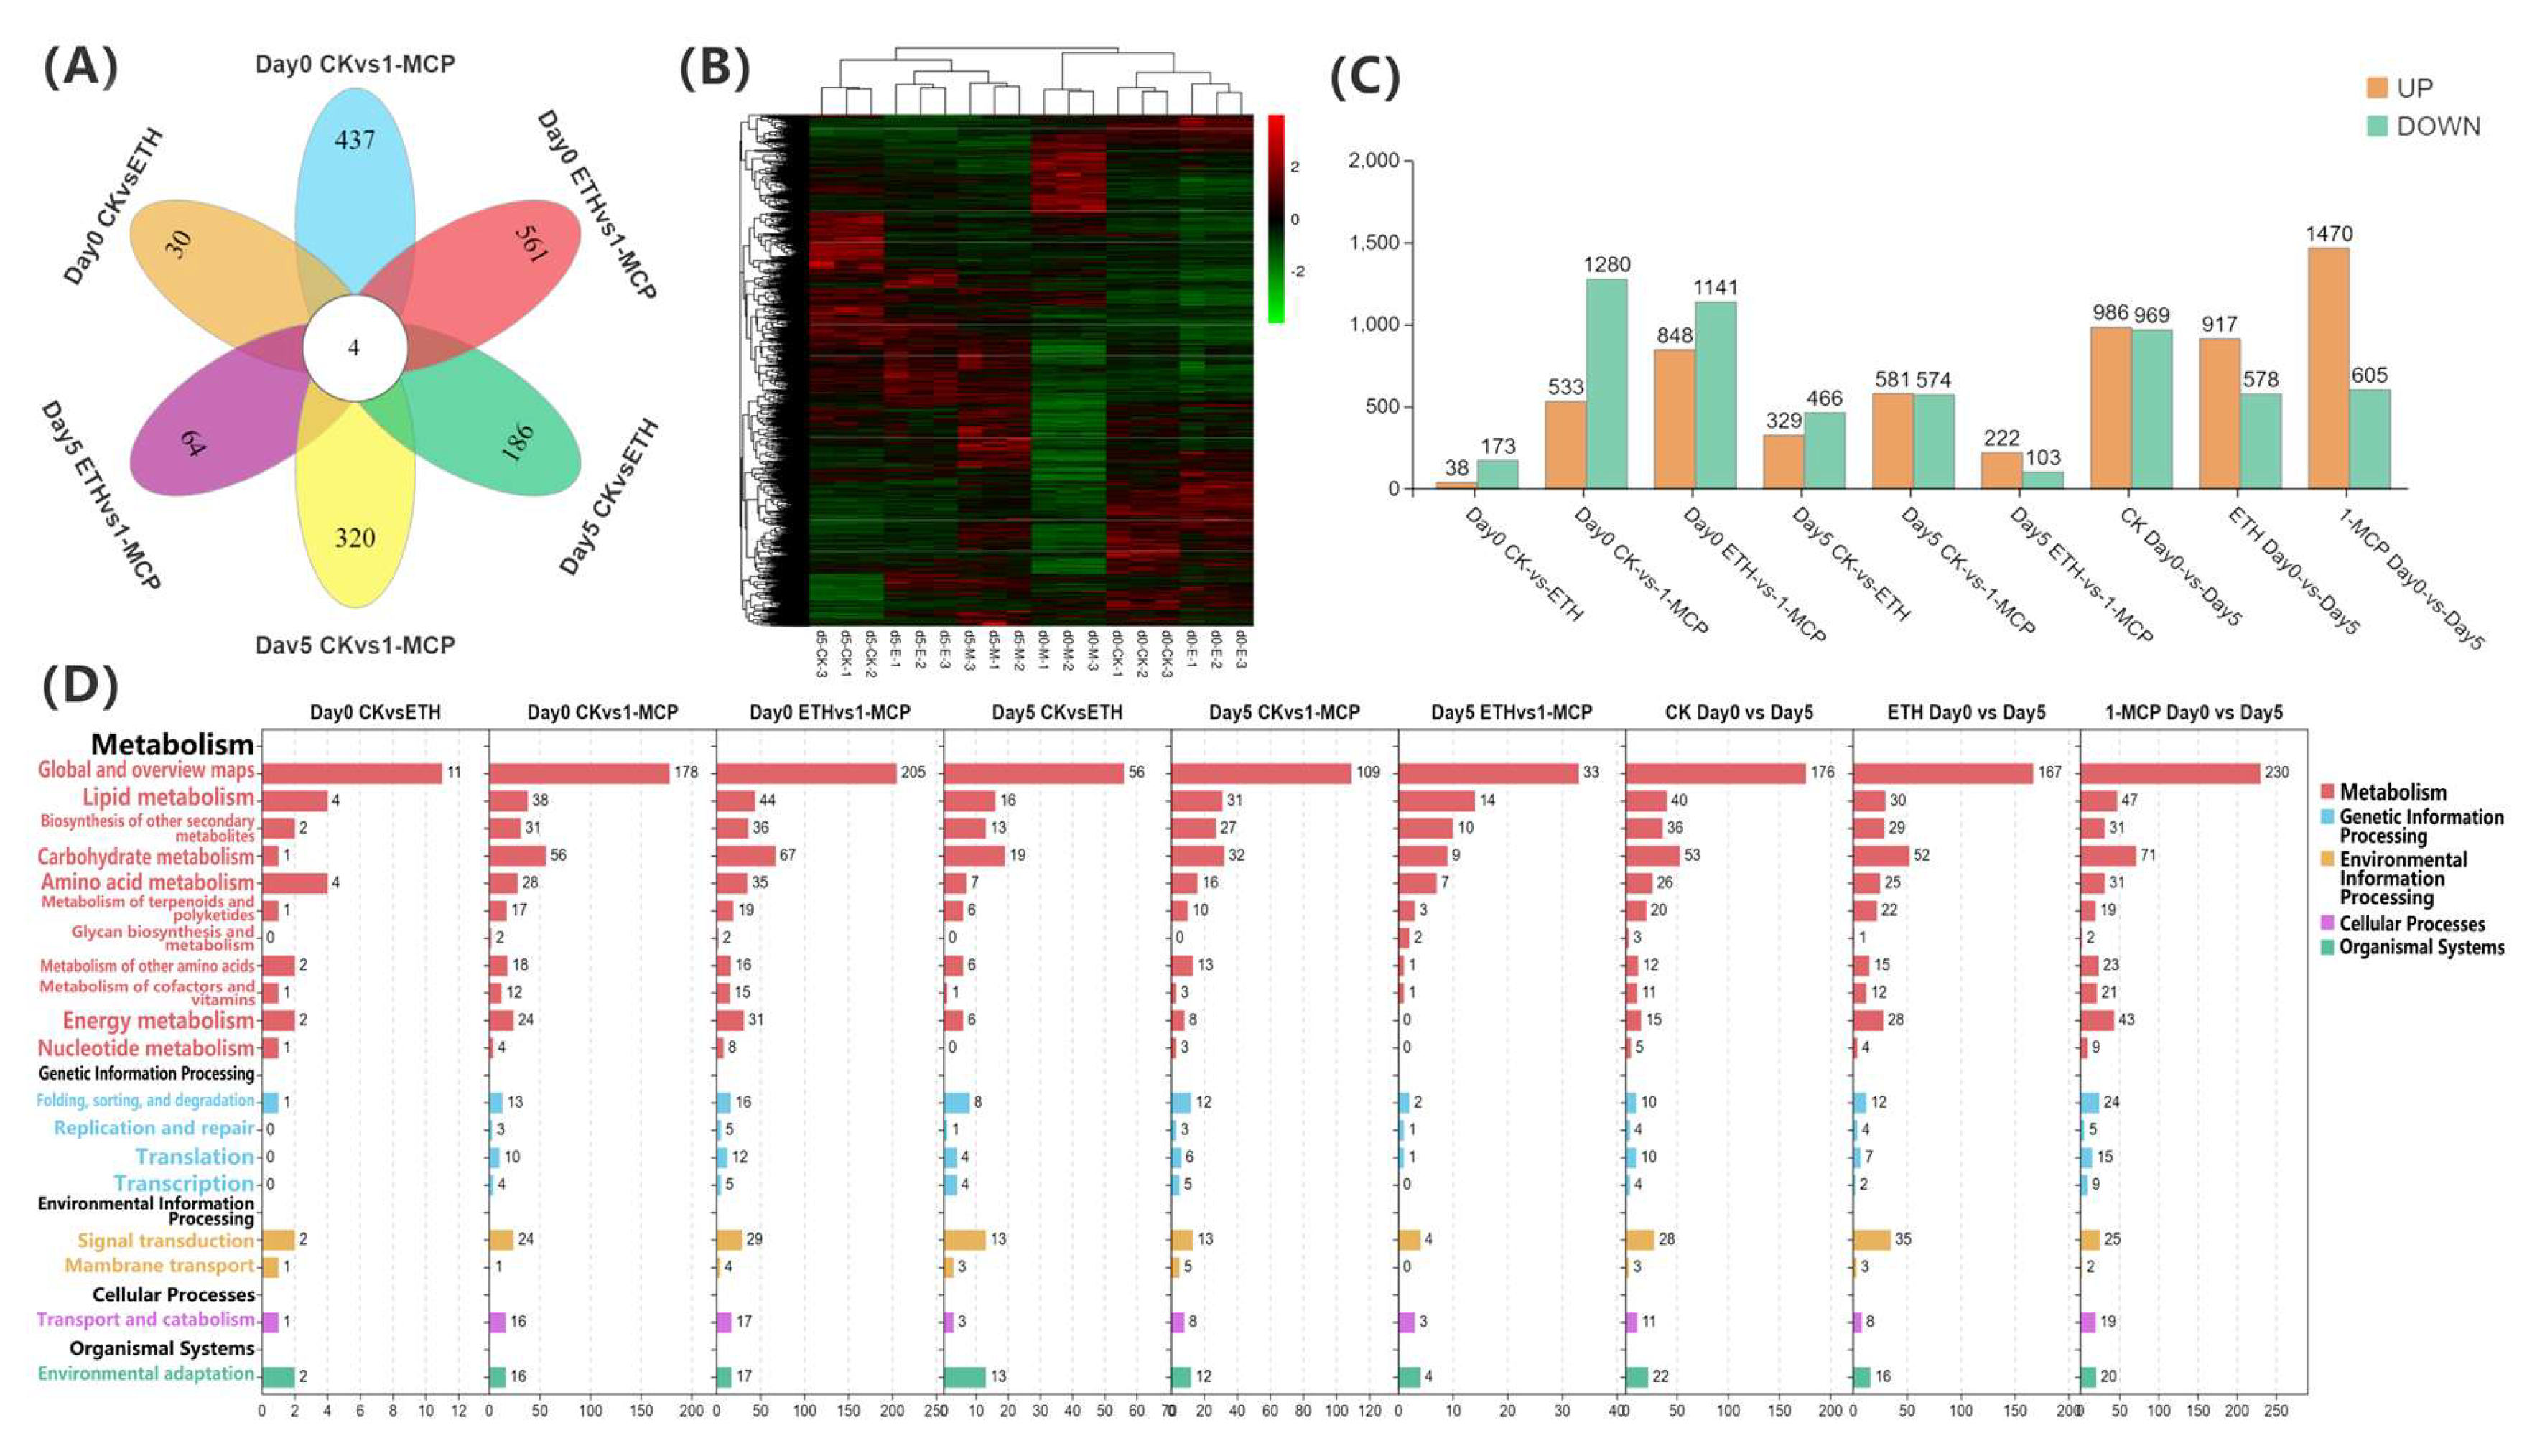
We identified 5203 significantly differentially expressed genes (DEGs) in the various treatment groups, as determined by Venn analysis (Figure 4A). A total of four genes were commonly differentially expressed in comparisons between day 0 CK vs. ETH, day 0 CK vs. 1-MCP, day 0 ETH vs. 1-MCP, day 5 CK vs. ETH, day 5 CK vs. 1-MCP, and day 5 ETH vs. 1-MCP. Specifically, 30 genes were differentially expressed between day 0 CK vs. ETH, 437 genes between day 0 CK vs. 1-MCP, 561 genes between day 0 ETH vs. 1-MCP, 186 genes between day 5 CK vs. ETH, 320 genes between day 5 CK vs. 1-MCP, and 64 genes between day 5 ETH vs. 1-MCP.
The hierarchical clustering of DEGs was performed at day 0 and 5 under the CK, 1-MCP, and ETH treatments to analyze the transcriptome sequence data (Figure 4B) and revealed distinct treatment effects. DEGs were filtered based on a fold change > 5 and an FDR < 0.05. A bar chart comparing the gene expression changes among treatment groups is shown in Figure 4C, with orange indicating upregulated (UP) genes and green indicating downregulated (DOWN) genes. The key results include 38 upregulated and 173 downregulated genes between day 0 CK vs. ETH, 533 upregulated and 1280 downregulated genes between day 0 CK vs. 1-MCP, and 848 upregulated and 1141 downregulated genes between day 0 ETH vs. 1-MCP. At day 5, the comparisons revealed 329 upregulated and 466 downregulated genes between CK vs. ETH, 581 upregulated and 574 downregulated genes between CK vs. 1-MCP, and 222 upregulated and 103 downregulated genes between ETH vs. 1-MCP. Additionally, 986 upregulated and 969 downregulated genes were observed between CK day 0 and day 5, 917 upregulated and 578 downregulated genes between ETH day 0 and day 5, and 1470 upregulated and 605 downregulated genes between 1-MCP day 0 and day 5. Overall, the data indicated that different treatment methods significantly influence the gene expressions in Oncidium, with these differentially expressed genes being closely associated with the plant’s physiological responses to the treatments.
Pathway enrichment analysis in various treatments and time points revealed a diversity of enriched pathways, primarily focusing on metabolic processes, including carbohydrate, amino acid, lipid, and energy metabolism, which were consistently enriched. Additionally, the pathways related to signal transduction and environmental adaptation were significantly enriched, especially in comparisons between day 0 and day 5, and between the ETH and 1-MCP treatments (Figure 4D). These findings suggested that the treatments influenced gene expression and triggered complex physiological and metabolic responses in Oncidium, further elucidating the underlying mechanisms of flower vase life extension.

3.8. Analysis of WGCNA

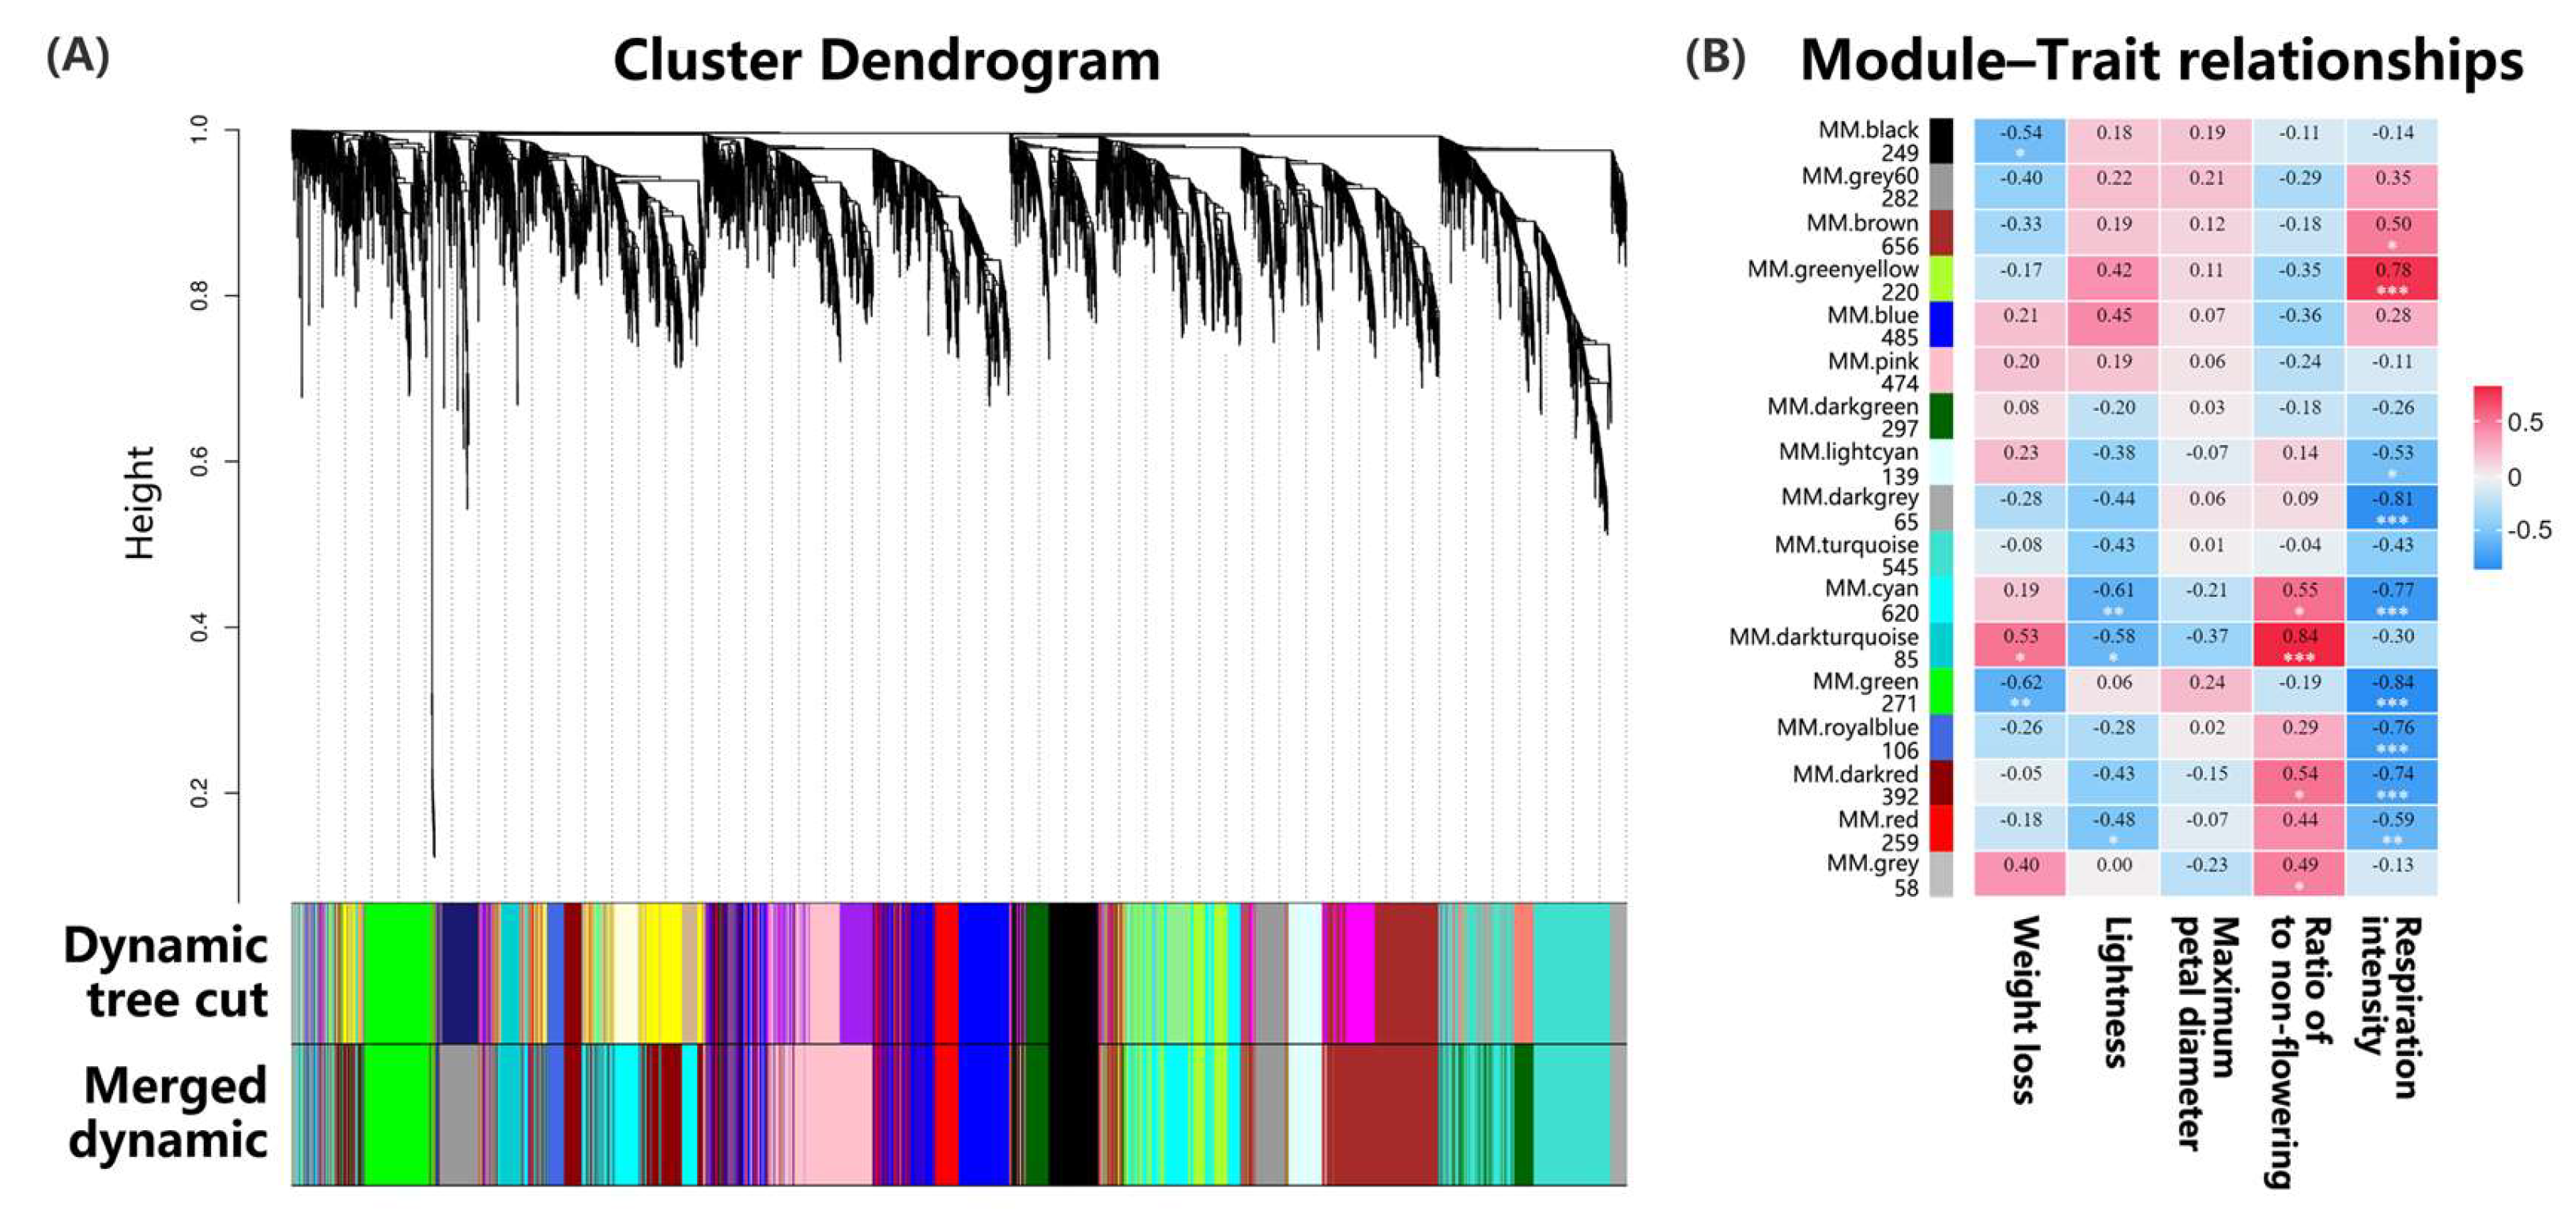
Weighted gene co-expression network analysis (WGCNA) effectively identified highly correlated gene modules by analyzing their connections and phenotypic associations, facilitating the identification of candidate genes. This method was widely used in various species, revealing numerous genes that regulated specific traits. When combined with transcriptome sequencing, WGCNA became a standard tool for exploring multiple aspects of plant biology, including flower vase life [27]. In this study, we applied WGCNA to a dataset of 5203 differentially expressed genes, identifying 17 distinct modules (Figure 5A). The brown module was the largest, containing 656 genes, and it exhibited negative correlations with weight loss and flowering ratios while positively correlating with lightness, maximum petal diameter, and respiration intensity (Figure 5B). The dark-turquoise module showed the highest expression levels associated with the flowering ratio, while the green-yellow module had the highest levels for respiration intensity. These findings indicated a significant relationship between the genes in these modules and the key physiological metrics in Oncidium.

3.9. Key Transcription Factors in Differential Treatment

Transcription factors (TFs) were essential regulatory elements that controlled the spatiotemporal expression of structural genes [28]. The analysis of the Oncidium petal transcriptome following the CK, 1-MCP, and ETH treatments identified 960 TFs from over 25 families, with NAC, WRKY, ERF, bHLH, and MYB being the most prevalent. We focused on the differential regulation of TFs at days 0 and 5. On day 0, we identified 18 DEGs in the CK_vs_ETH comparisons, mainly involving ERF, NAC, and bHLH. The CK_vs_1-MCP comparisons revealed 65 DEGs, primarily NAC, MYB, and ERF, while ETH_vs_1-MCP showed 83 DEGs, predominantly NAC, ERF, and MYB (Table 1). By day 5, we detected 32 DEGs, mainly WRKY and NAC; followed by 49 DEGs involving NAC, WRKY, and ERF; and 22 DEGs largely consisting of ERF and NAC (Table 1). Further analysis included a comparative comparison of TFs encoding in various treatment time points and Venn diagram analysis to identify the specific and shared TFs (Figure 6). These findings indicated that Oncidium senescence was associated with time-dependent TFs, which regulated structural gene expression and activated various biological pathways. The ERF genes were identified as key players in the ethylene response pathways, as corroborated by multiple studies [29,30]. Additionally, the MYB and WRKY genes were important in jasmonic acid (JA) signaling [31], and NAC significantly contributed to plant immunity as the most abundant type of TFs [32].

3.10. Gene Regulatory Network Associated with Phytohormones

Plant hormones and signaling molecules were key regulators of floral senescence, with specific hormones or signals initiating the aging process at various postharvest stages [33]. This study analyzed changes in hormone signaling and gene expression during the senescence of Oncidium cut flowers treated with CK, ETH, and 1-MCP.
Between days 0 and 5, we identified 10 genes in the ABA signaling pathway. A PYL gene was upregulated in all treatments, with the ETH group showing the largest increase. Seven PP2C genes were upregulated in the CK and ETH groups but downregulated in the 1-MCP group. An SnPK2 gene was downregulated in the 1-MCP group, while an ABF gene transitioned from low to high expression in the 1-MCP group, remaining highly expressed in the CK and ETH groups (Figure 7A). Previous studies supported ABA’s role in modulating senescence in ethylene-sensitive flowers, indicating a synergistic interaction with ethylene signaling. Trivellini [34] observed that ABA levels peaked at blooming and decreased with aging in Hibiscus flowers, while Kumar et al. [35] found that ABA and ethylene accelerated senescence in roses under water stress. Research on carnations indicated that ABA promoted floral senescence by influencing ethylene production [36].
Jasmonic acid (JA), another important growth regulator, was known to promote flower senescence. Its derivative, methyl jasmonate (JA-Me), enhanced ethylene production, hastening the aging of petunias and dendrobium orchids [37]. JA signaling and biosynthetic genes also contributed to petal abscission [38]. MYC2, part of the JA target gene network, amplified the JA response, while JASMONATE-ZIM DOMAIN (JAZ) proteins inhibited JA signaling by repressing the TFs that activate JA target genes [39]. In this study, three JAZ genes were identified, all of which were upregulated in the 1-MCP treatment group, with Unigene0006766 showing the most significant increase. Conversely, the CK and ETH groups exhibited the downregulation of the TIFY6B gene and the upregulation of TIFY10B, with no significant changes in Unigene0006766 expression. Additionally, two MYC2 genes were significantly upregulated in all treatment groups, maintaining relatively high expression levels (Figure 7B).
Cytokinins (CTKs) played vital roles in various plant functions, including cell division, organogenesis, regeneration, senescence, apical dominance, vascular development, and pathogen responses [40]. Previous studies indicated that CTKs delayed senescence in cut flowers [41,42]. In this study, we identified four CRE1 genes and one APH gene in the CTK signaling pathway. Three CRE1 genes were upregulated in all treatments, while one was upregulated in the CK and ETH groups but downregulated in the 1-MCP group. The APH gene was upregulated in all treatments, with the highest expression levels observed under the ETH treatment (Figure 7C).
Brassinosteroids (BRs) were crucial for various biological and cellular processes, including stem elongation, pollen tube growth, fruit ripening, ethylene synthesis, proton pump activity, and chlorophyll levels [43]. This study identified one BRI1/BAK1 gene, three BZR1/2 genes, and seven TCH4 genes in the BR signaling pathway. The BRI1/BAK1 gene was downregulated in all treatments but the three BZR1 genes exhibited high expression. Among the TCH4 genes, XTH22 was upregulated in all groups. Four out of five XTH1 genes were upregulated in the 1-MCP group, with varying expressions in the CK and ETH groups (Figure 7E). Ji et al. [44] noted that BRs inhibited fruit ripening and senescence, with levels decreasing as the fruits matured.
In the auxin pathway, we identified six AUX/IAA genes, one GH3 gene, and eleven SAUR genes. The AUX/IAA genes IAA6, IAA7, and IAA31 were consistently upregulated in all the treatments, while IAA8, IAA21, and AUX22D were upregulated after the 1-MCP treatment but downregulated after the CK and ETH treatments. The GH3 gene was upregulated only after the CK treatment. Among the SAUR genes, seven were downregulated and four upregulated after the CK treatment, six were downregulated and five upregulated after the ETH treatment, and three were downregulated and eight upregulated after the 1-MCP treatment (Figure 7F). Zhu et al. [45] observed significant differences in auxin-related gene expression in ‘Guangfen No.1’ bananas treated with 450 nl/L 1-MCP, showing that 1-MCP delayed ripening by upregulating 32 AUX/IAA genes. Our findings indicated that 1-MCP also enhanced auxin-responsive gene expression in ‘Honey Angle’, contributing to delayed senescence.
Salicylic acid (SA) was essential for plant immune [46]. The NPR1 gene acted as a coactivator in SA-mediated gene expression [47]. Pathogenesis-related (PR) proteins boosted plant pathogen resistance with PR1 showing its defensive role through transgenic expression in various plants [48]. We identified three NPR1 and six PR1 genes in the SA pathway. Unigene0008220 was significantly upregulated under the CK treatment while Unigene0013506 and Unigene0013507 were consistently downregulated. The substantial upregulation of PR1 genes occurred only in the 1-MCP treatment on day 0. The Unigene0087342 gene showed modest upregulation in the CK on day 5, while PR1 expression in the ETH group remained low (Figure 7G). The 1-MCP treatment enhanced PR1 and NPR1 expression in ‘Honey Angle’, potentially extending vase life. Veselova et al. [49] reported that 2 mM 1-MCP increased resistance in Triticum aestivum L. seedlings against Septoria nodorum by upregulating PR1 and PR2. In contrast, the 1.5 mM ethephon treatment reduced wheat disease resistance, with PR1 and PR2 transcript levels being lower than in the control and 1-MCP groups, suggesting antagonistic effects from SA, ethylene, and cytokinins.
In the gibberellin (GA) pathway, we detected one DELLA gene and one TF gene. The DELLA gene was upregulated in all the treatments, while the TF gene had high expression in the CK and ETH groups and moderate expression in the 1-MCP group (Figure 7H). DELLA genes, which are negative regulators of GA, induced GA2ox (GA deactivation) genes [50]. Their expressions increased in treatments, peaking in the 1-MCP group on day 0 and dropping in the ETH group on day 5. This indicated that ETH treatment enhanced the ‘Honey Angle’ response to GA by partially inhibiting DELLA gene expression and accelerated flower senescence.
ERF1 is a member of the ethylene response factor family [51], and it activated the expressions of secondary-response genes essential for plant survival and defense [52]. The upregulation of ERF genes promoted downstream senescence gene expression. The downregulation of ERF5, ERF034, and ERF053 after 1-MCP treatment contributed to delayed senescence in ‘Honey Angle’. We identified one ETR gene and 18 ERF1/2 genes. The ETR2 gene was upregulated in the CK and ETH treatments but downregulated in the 1-MCP group. In total, 15 ERF genes were upregulated in all the three treatments, while ERF5, ERF034, and ERF053 were downregulated in the 1-MCP group and upregulated in CK group. Notably high expression was observed in Unigene0037247, Unigene0037248, Unigene0044659, Unigene0044660, Unigene0084560, and Unigene0007702 (Figure 7D). Thongkum et al. [53] found that ethylene and 1-MCP treatments affected ethylene production during durian ripening, with 1-MCP inhibiting it, suggesting that ethylene induced ripening by acting on DzETR2 through EIL and other TFs.
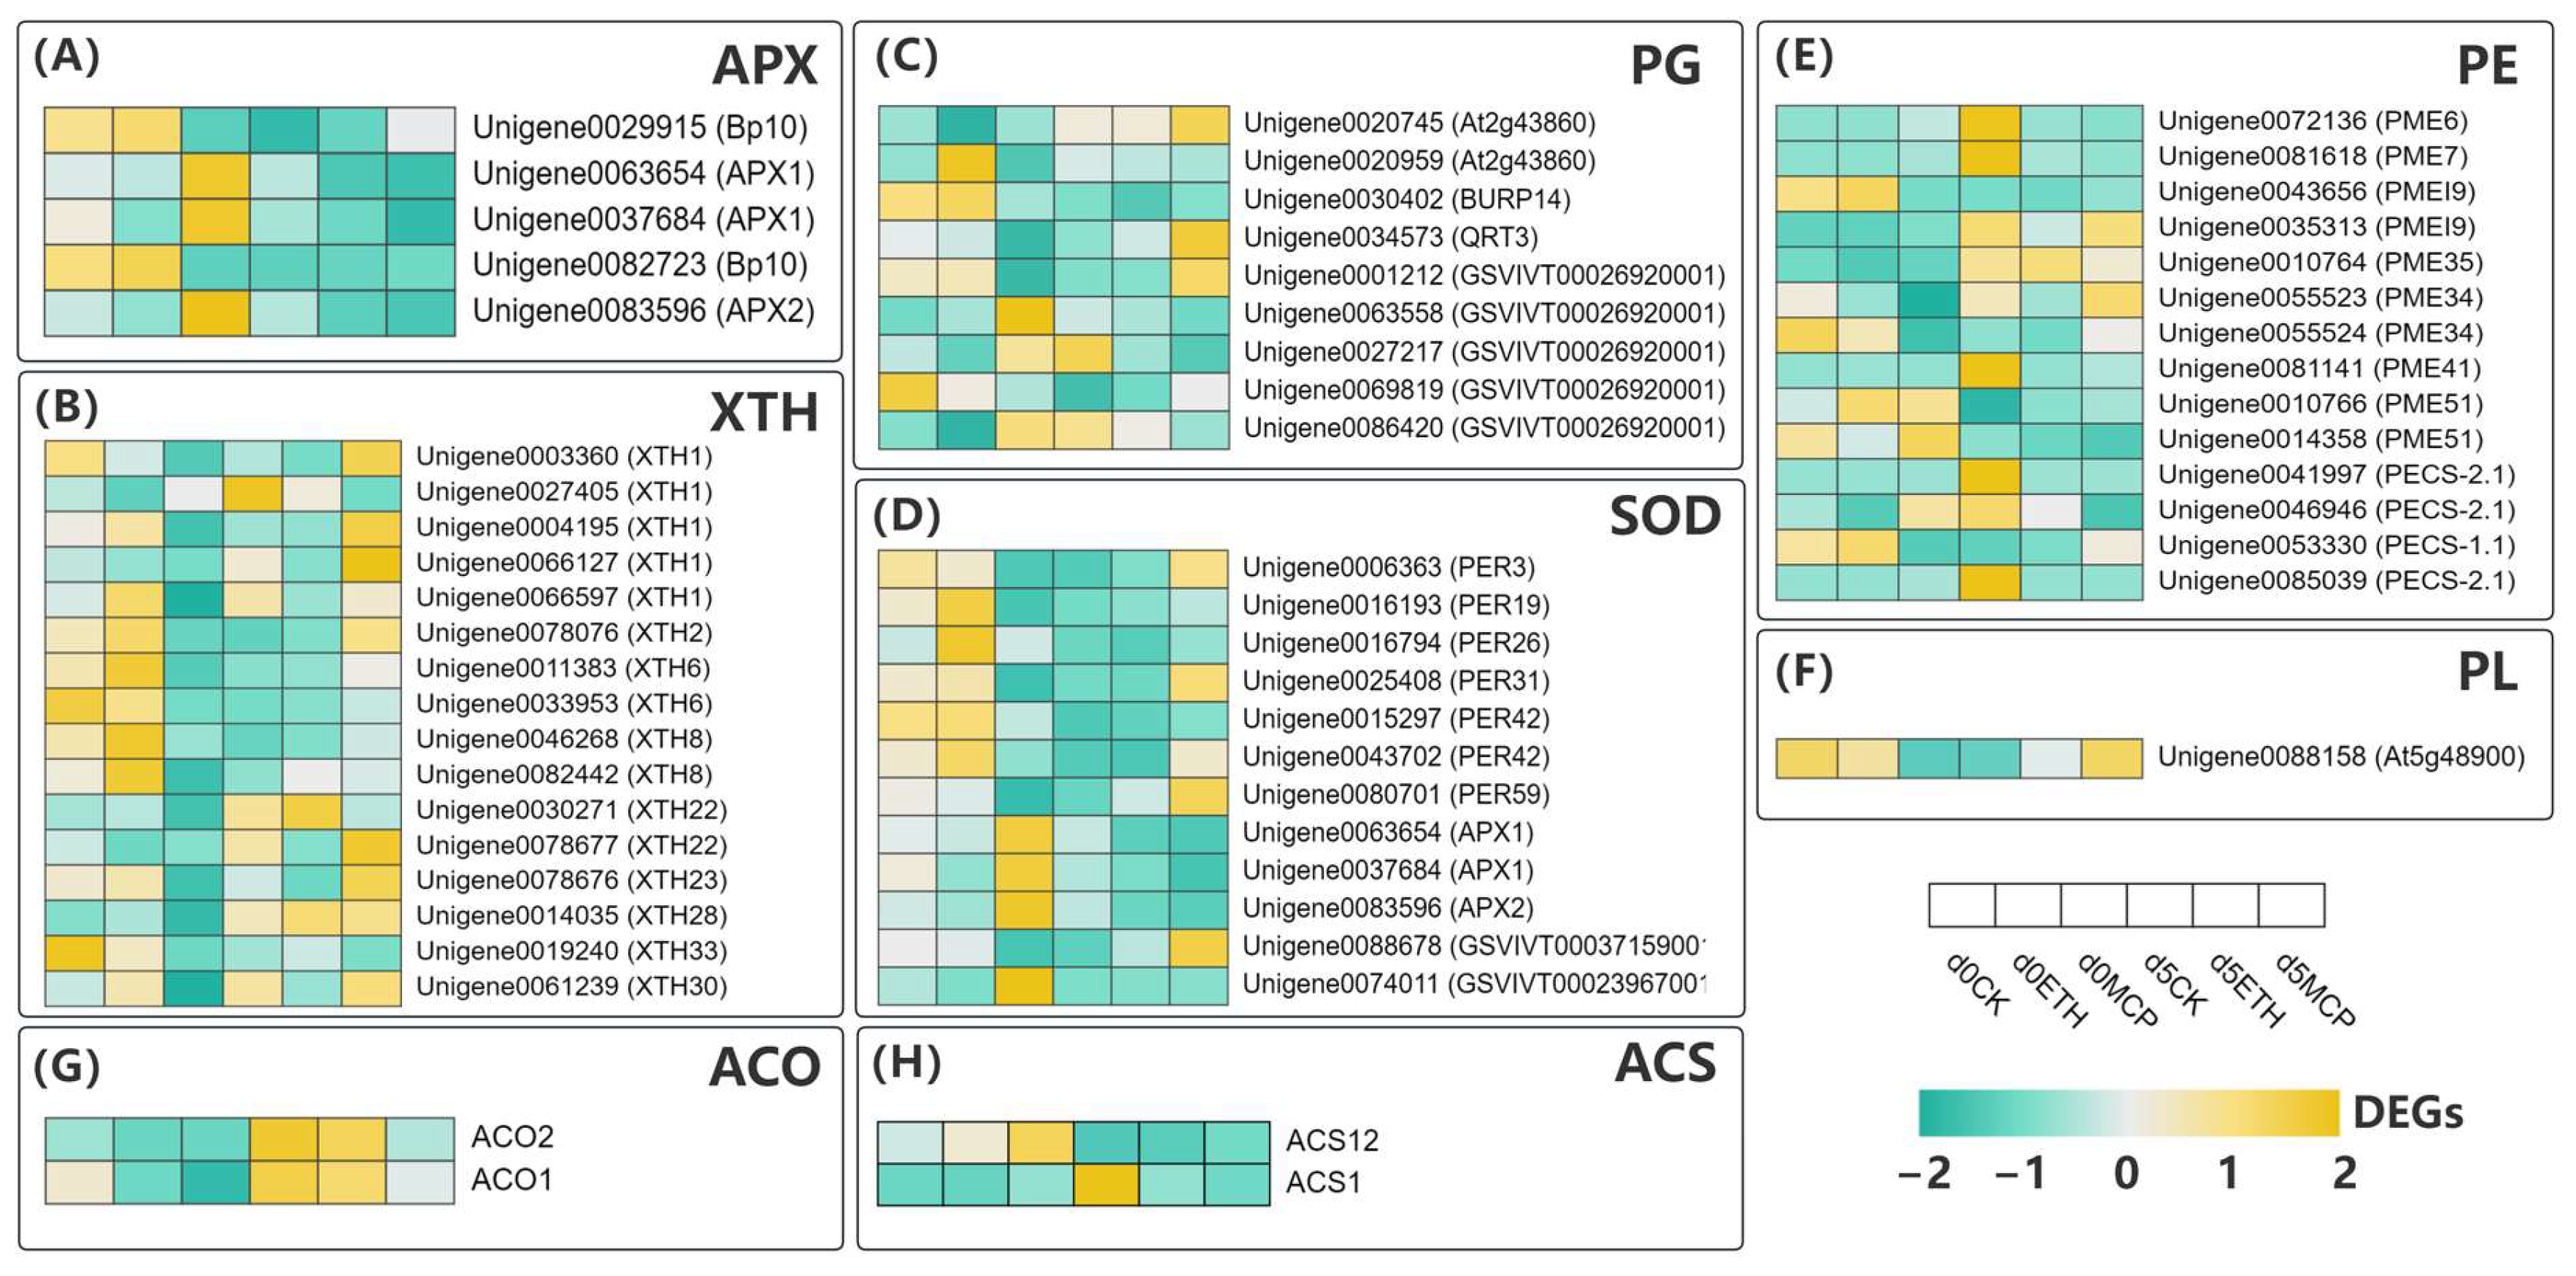
The ethylene biosynthesis pathway involved two key transformations catalyzed by ACS and ACO [54]. The 1-MCP treatment primarily inhibited the ethylene biosynthesis pathway in Oncidium cut flowers by suppressing ACO gene expression, blocking the conversion of ACC to ethylene, and downregulating ACS gene expression, which reduced ACC synthesis from SAM. This indicated that 1-MCP inhibited endogenous ethylene production and the plant’s response to ethylene, delaying petal senescence. We detected the differential expression of two ACS and two ACO genes (Figure 8G,H). ACO1 and ACO2 were slightly upregulated but remained low in the 1-MCP treatment, while they significantly increased after the CK and ETH treatments. The ACS1 gene was significantly upregulated after the CK treatment but showed little change in the other groups. The ACS12 gene was downregulated in all groups, with the most significant reduction after the 1-MCP treatment.

3.11. Gene Regulatory Network Associated with Active Oxygen Metabolism

The 1-MCP treatment primarily regulated ascorbate peroxidase (APX) in the ascorbate–glutathione cycle by downregulating the APX1/2 genes, in contrast to ETH’s effect on the Bp10 gene. We identified 12 differentially expressed superoxide dismutase (SOD)-related genes. Seven peroxidase (PER) genes were significantly downregulated after the CK and ETH treatments, while five were upregulated after the 1-MCP treatment. Three APX genes were downregulated, with GSVIVTO0037159001 upregulated and GSVIVTO0023967001 downregulated following the 1-MCP treatment.
These results indicated diverse SOD-related gene expression patterns under different treatments, impacting the active oxygen metabolism in cut flowers. Reactive oxygen species (ROS), including singlet oxygen, superoxide anions, hydroxyl radicals, and hydrogen peroxide, are integral components of plant aerobic metabolism [55]. ROS can damage cellular membranes and accelerate senescence through oxidative stress. Enzymes like SOD, catalase (CAT), and peroxidase (POX) provide protection against this stress. [56]. APX, crucial for H2O2 removal [57], showed the significant downregulation of APX1 and APX2 from high levels on day 0 after the 1-MCP treatment, while Bp10 was downregulated after the CK and ETH treatments (Figure 8A,D). Research on Arabidopsis by Li [57] demonstrated that the S-nitrosylation of the Cys32 site in APX1 enhanced its H2O2 removal activity, with APX1 and APX2 localized in the cytoplasm to resist oxidative stress. [55]. Bp10 is a homolog of L-ascorbate oxidase [58].

3.12. Cell Wall-Related Genes in Vase Life

The plant cell wall was a complex structure composed of various polysaccharides, proteins, and pectins, with multiple enzymes playing a key role in cell wall degradation [59]. Key enzymes included polygalacturonase (PG), pectin methylesterase (PE), pectate lyase (PL), and xyloglucan endotransglycosylase/hydrolase (XTH). In this study, we investigated the expression of cell wall-modifying enzymes treated with CK, 1-MCP, and ETH on days 0 and 5 (Figure 8B).
In total, 11 of the 16 XTH genes were downregulated after the CK and ETH treatments, while 14 XTH genes were upregulated in the 1-MCP treatment. A previous study by Luo et al. [60] found that XTH1 expression increased with the petal opening, and its inhibition prevented full bloom. In our experiment, all the XTH genes in the 1-MCP group were low on day 0, but by day 5, XTH1, XTH2, XTH22, XTH23, XTH28, and XTH30 genes significantly increased. Most XTH genes in the CK and ETH groups were high on day 0 but downregulated by day 5, suggesting that 1-MCP effectively delayed the XTH gene expression and bud blooming in cut flowers. The vase life correlated with the bud number and the ratio of open to senescent flowers, indicating that promoting bud blooming could extend the vase life. Li et al. [61] showed that cherimoya fruit treated with 500 nL/L 1-MCP delayed ethylene production and fruit softening, reducing acXET1 (XTH1) expression. Our results confirmed that 1-MCP not only delayed but inhibited the expression of XTH family genes. The only differentially expressed gene for pectate lyase (PL) identified in this study was At5g48900 (Figure 8F). This gene was significantly downregulated from day 0 to day 5 under the CK and ETH treatments but markedly upregulated after the 1-MCP treatment. PL was crucial for cell wall degradation, promoting pectin depolymerization in the presence of Ca2+. Zhao et al. [62] found that 1 µL/L 1-MCP reduced the expression of the PL1, PL2, and PL3 genes in peaches, maintaining pectin softening from chilling injury. Zhang et al. [63] reported that 1 µL/L 1-MCP decreased respiration rates, ethylene release, and the activity and expression of PL in melons, preserving fruit firmness. Although the relationship between PL gene expression and enzyme activity in ‘Honey Angle’ remains unclear, the upregulation of PL genes after the 1-MCP treatment is significant.
Nine differentially expressed PG genes were identified, but the expressions displayed no clear patterns or correlations in the treatments and time points (Figure 8C). Except the ETH group, the At2g43860 gene was upregulated after the CK and 1-MCP treatments, and it exhibited high expression only in the 1-MCP group. By day 5, softening was more pronounced in the CK and ETH groups, contrary to the heatmap results. QRT3, a key gene for cell wall degradation, supported pectin breakdown, and it was classified as a PG-related gene that supported pectin degradation [64,65,66]. Despite its upregulation in the 1-MCP group, its impact on cut flower senescence was unclear. Although research on PG genes in cut flower preservation was limited, their roles in fruit softening were documented. Zhu et al. [67] reported that 1-MCP (400 nL/L) gas inhibited four PG genes in papayas, delaying ripening. Choi et al. [68] found higher PG expression in kiwifruit treated with ethylene (1000 mL) compared to with 1-MCP (1.4 mL), indicating a link between PG upregulation and fruit softening. Our results did not support a correlation between PG expression and petal softening in ‘Honey Angle’, highlighting the need for further investigation.
Pectin, a major component of the primary cell wall, includes homogalacturonan (HG), which was methylated in the Golgi apparatus and later demethylated by pectin methylesterase (PME) [69]. This demethylation influenced cell wall properties [70,71] and was regulated by pectin methylesterase inhibitors (PMEI) [72]. PME gene expression likely preserved the petal shape, with more upregulation in the 1-MCP group, while PMEI inhibited PME, reducing cell wall rigidity and accelerating wilting. Salazar et al. [73] reported that ethylene treatment upregulated pectin esterase and polygalacturonase genes in apricots. We identified 14 differentially expressed PE-related genes including PME, PMEI, and PECS (Figure 8E). PME6, PME7, and PME41 were upregulated in the CK group but low in the ETH and 1-MCP treatments. Unigene0010764 (PME35) and Unigene0055523 (PME34) were upregulated in all the treatments, while PME51 was downregulated in all the groups. Unigene0043656 (PMEI9) showed downregulation in the CK and ETH but remained low in 1-MCP. Unigene0035313 (PMEI9) was upregulated in all the groups, which was significantly so in the CK and 1-MCP. Other genes showed varying expression patterns across treatments.

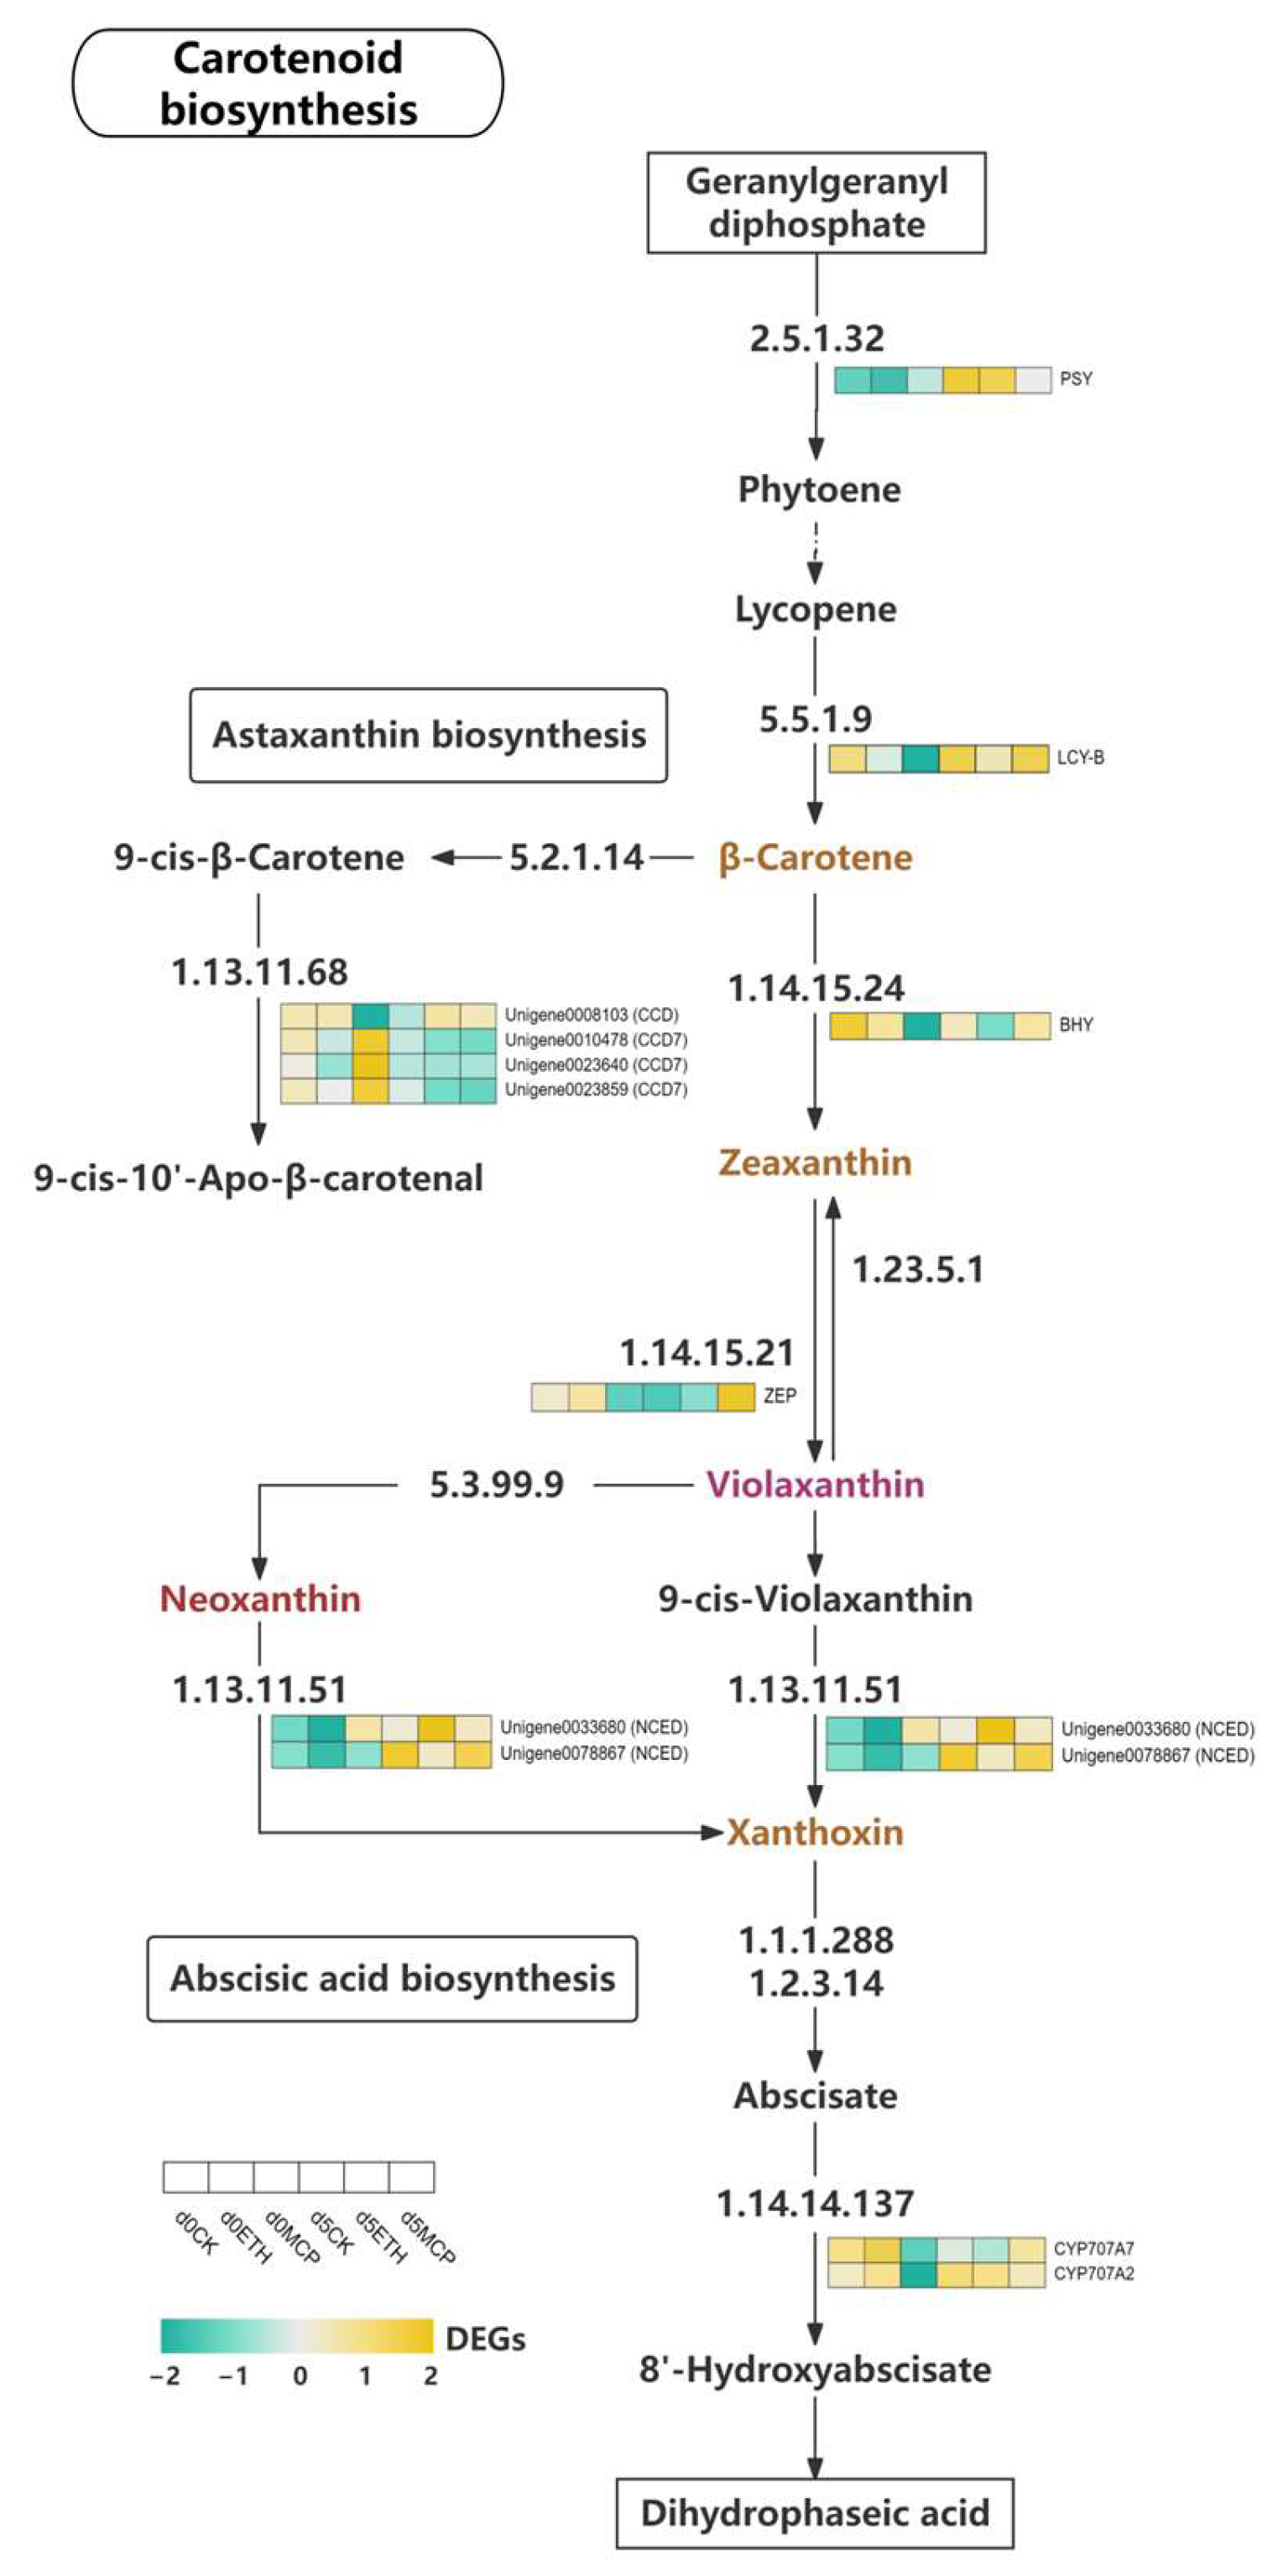
3.13. Gene Regulatory Network Associated with Carotenoid Metabolism

Carotenoids are C40 isoprenoid pigments in plants that serve as the structural components of photosynthetic systems [74]. Their biosynthesis, regulated by various enzymes and genes, results in both colorless and colored carotenoids, including yellow pigments like lutein and β-carotene, and red pigments like lycopene and astaxanthin [75]. Phytoene, a colorless carotenoid, acts as a precursor [76]. The biosynthesis begins with geranylgeranyl diphosphate (GGPP), which is converted to phytoene by phytoene synthase (PSY) and then transformed into lycopene and β-carotene by lycopene β-cyclase (LCY-B) [77]. In our study, PSY and lycopene β-cyclase (LCY-B) expression in ‘Honey Angle’ varied in treatments and time points. PSY expression was low on day 0 in the CK and ETH groups but increased significantly by day 5. In contrast, PSY showed slight upregulation in the 1-MCP group. LCY-B expression increased in all the groups, with the CK group maintaining high levels and the 1-MCP group rising significantly (Figure 9). Kishimoto et al. [78] found that in yellow chrysanthemum, PSY and LCY-B expression increased during petal development, correlating with higher carotenoid levels, while this trend was reversed in white varieties. Similar results were found in marigold and Sandersonia petals where carotenoid accumulation was linked to a pale-yellow color [79,80]. Our findings indicated that 1-MCP inhibited senescence and preserved petal color by upregulating LCY-B and promoting carotenoid accumulation, which was closely linked to petal color.
β-carotene, a precursor for chromophores like lutein and zeaxanthin, highlights the need to analyze downstream enzymes, as the petal color in various plants is linked to carotenoid content. Hieber et al. [81] showed that in Oncidium ‘Gower Ramsey’, petal chromophores were concentrated in the adaxial epidermis, mainly as mixtures of all-trans and 9-cis violaxanthin, followed by all-trans and 9-cis neoxanthin, with minor quantities of lutein and carotenes. Carotenoid cleavage dioxygenases (CCDs) were key degradative enzymes in the carotenoid biosynthetic pathway, converting 9-cis-β-carotene to 9-cis-10′-apo-β-carotenal [82]. In higher plants, β-carotene was converted to zeaxanthin through a pathway mediated by β-carotene 3,3′-hydroxylase (BHY) and β-Ring 3,3′-hydroxylase [83]. The interconversion of zeaxanthin and violaxanthin involved zeaxanthin epoxidase (ZEP), which oxidizes zeaxanthin to violaxanthin, and violaxanthin de-epoxidase (VDE) [84]. We identified the differential expression of one CCD and three CCD7 genes. Unigene0008103 (CCD) was downregulated in the CK group, remained low in the ETH group, but increased in the 1-MCP group. Three CCD7 genes were highly expressed in the 1-MCP group on day 0 but decreased by day 5 across all the groups. BHY expression was high in the CK and ETH group on day 0 but low in 1-MCP, which showed upregulation by day 5. Hieber et al. [81] recognized zeaxanthin as a minor chromophore in Phalaenopsis petals, while Park et al. [85] found that deep-yellow chrysanthemum cultivar ‘Il Weol’ had significantly higher lutein and zeaxanthin levels, and the green-petaled ‘Anastasia’ cultivar showed elevated all-trans, 9-cis and 13-cis β-carotene. Similarly, research on sweet osmanthus revealed decreasing zeaxanthin levels with flower opening [86]. This suggested that ethylene inhibited BHY expression and zeaxanthin synthesis, while 1-MCP enhanced CCD7 and BHY expression, accelerated the degradation of 9-cis-β-carotene, and promoted zeaxanthin synthesis. Since zeaxanthin levels declined with flowering, our results suggested that 1-MCP helped maintain the lemon-green petal color by upregulating BHY. Alós et al. [87] found that in loquat, 10 µL/L ethylene accelerated β-carotene accumulation and gene expression (e.g., PSY, PDS, ZDS, CYCB, BCH), while 1 µL/L 1-MCP delayed carotenoid accumulation with little effect on the total levels. We also found that the LCY-B, BHY, and ZEP genes were initially highly expressed in the CK and ETH groups, with upregulation in the 1-MCP group by day 5. The ETH treatment accelerated the expression of some carotenoid biosynthetic genes, while 1-MCP delayed LCY-B, BHY, and ZEP expression and controlled the synthesis of β-carotene, zeaxanthin, and neoxanthin, which slowed the petal color fading in ‘Honey Angle’. ZEP expression decreased in the CK and ETH groups from days 0 and 5 but significantly increased in the 1-MCP group. Since violaxanthin was a major contributor to the petal color, ZEP upregulation likely boosted vio-laxanthin levels by enhancing enzyme activity, directly affecting the petal color on day 5.
The carotenoid biosynthetic pathway intersected with the abscisic acid (ABA) pathway, which was confirmed in organisms like Arabidopsis thaliana, maize, and tomatoes [88]. It began with zeaxanthin and was oxidized by zeaxanthin epoxidase (ZEP) to form violaxanthin, which was then converted to neoxanthin by violaxanthin de-epoxidase-like protein (VDL). Both compounds underwent isomerization, producing 9-cis-violaxanthin and 9′-cis-neoxanthin, which were cleaved by NCEDs to yield xanthoxin, the ABA precursor [89]. We did not observe the differential expression of the VDL gene but found that NCED expression increased across all treatment groups from day 0 to day 5. Unigene0078867 (NCED) showed significant upregulation in CK and 1-MCP groups, while Unigene0033680 (NCED) was more upregulated in ETH. This indicated that 1-MCP influenced 9′-cis-epoxy carotenoid metabolism by regulating NCED expression. These results suggested that THE 1-MCP treatment influenced the metabolism of 9′-cis-epoxy carotenoids, such as violaxanthin and neoxanthin, by regulating NCED gene expression. The CYP707A gene family was crucial for ABA catabolism, with ABA upregulating THE CYP707A genes, which inactivated phaseic acid (PA) [90]. We found differential expressions of CYP707A7 and CYP707A2, which both showed high expression on day 0 in the CK and ETH but decreased by day 5, while 1-MCP had low expression on day 0 that increased significantly by day 5. This suggested that 1-MCP affected CYP707A expression, inhibiting ABA production and delaying cut flower senescence.
Overall, differential gene expression revealed the distinct effects of ETH and 1-MCP on ‘Honey Angle’ cut flowers. ETH upregulated the PSY gene, enhancing phytoene synthesis, but it had limited impact on β-carotene due to modest LCY-B upregulation. In contrast, 1-MCP significantly increased LCY-B expression on day 5, promoting β-carotene accumulation and upregulating BHY and ZEP, which maintained chromogenic compound levels and delayed petal color fading. Additionally, 1-MCP modulated NCED and CYP707A gene expression, influencing 9′-cis-epoxy carotenoid metabolism and ABA synthesis, which delayed cut flower senescence. This contrasted with ethylene’s effects on fruit carotenoid synthesis. Alós et al. [87] found that ethylene affected carotenoid accumulation in loquat flesh but had minimal impact on peel carotenoids. Similarly, in papayas, 100 µL/L ethylene initially caused a decline in carotenoids, while 100 nL/L 1-MCP led to a continuous decrease [91]. Overall, ethylene stimulated chromogenic carotenoid gene expression in ‘Honey Angle’ petals, while 1-MCP delayed the peak expression of violaxanthin and zeaxanthin, slowing petal color fading.

3.14. Gene Regulatory Network Associated with Starch and Sucrose Metabolism

The expression of key enzymes in the sucrose and starch metabolic pathways of Oncidium under all treatments were studied (Figure 10). Our findings showed that both the 1-MCP and ETH treatments upregulated numerous genes associated with sucrose metabolism, starch synthesis, and cellulose production, reflecting changes in hormone levels and energy storage. Some genes were downregulated, indicating a strategic reduction in specific metabolic pathways. These treatments significantly affected the sucrose and starch pathways in Oncidium, modulating key enzyme gene expression to adapt to environmental changes. The increased metabolic activities suggested improved plant stress resistance and growth performance. Further research is needed to understand the implications of these gene expression changes on plant physiology and development.

3.15. Gene Regulatory Network Associated with Wax Keratin Metabolism

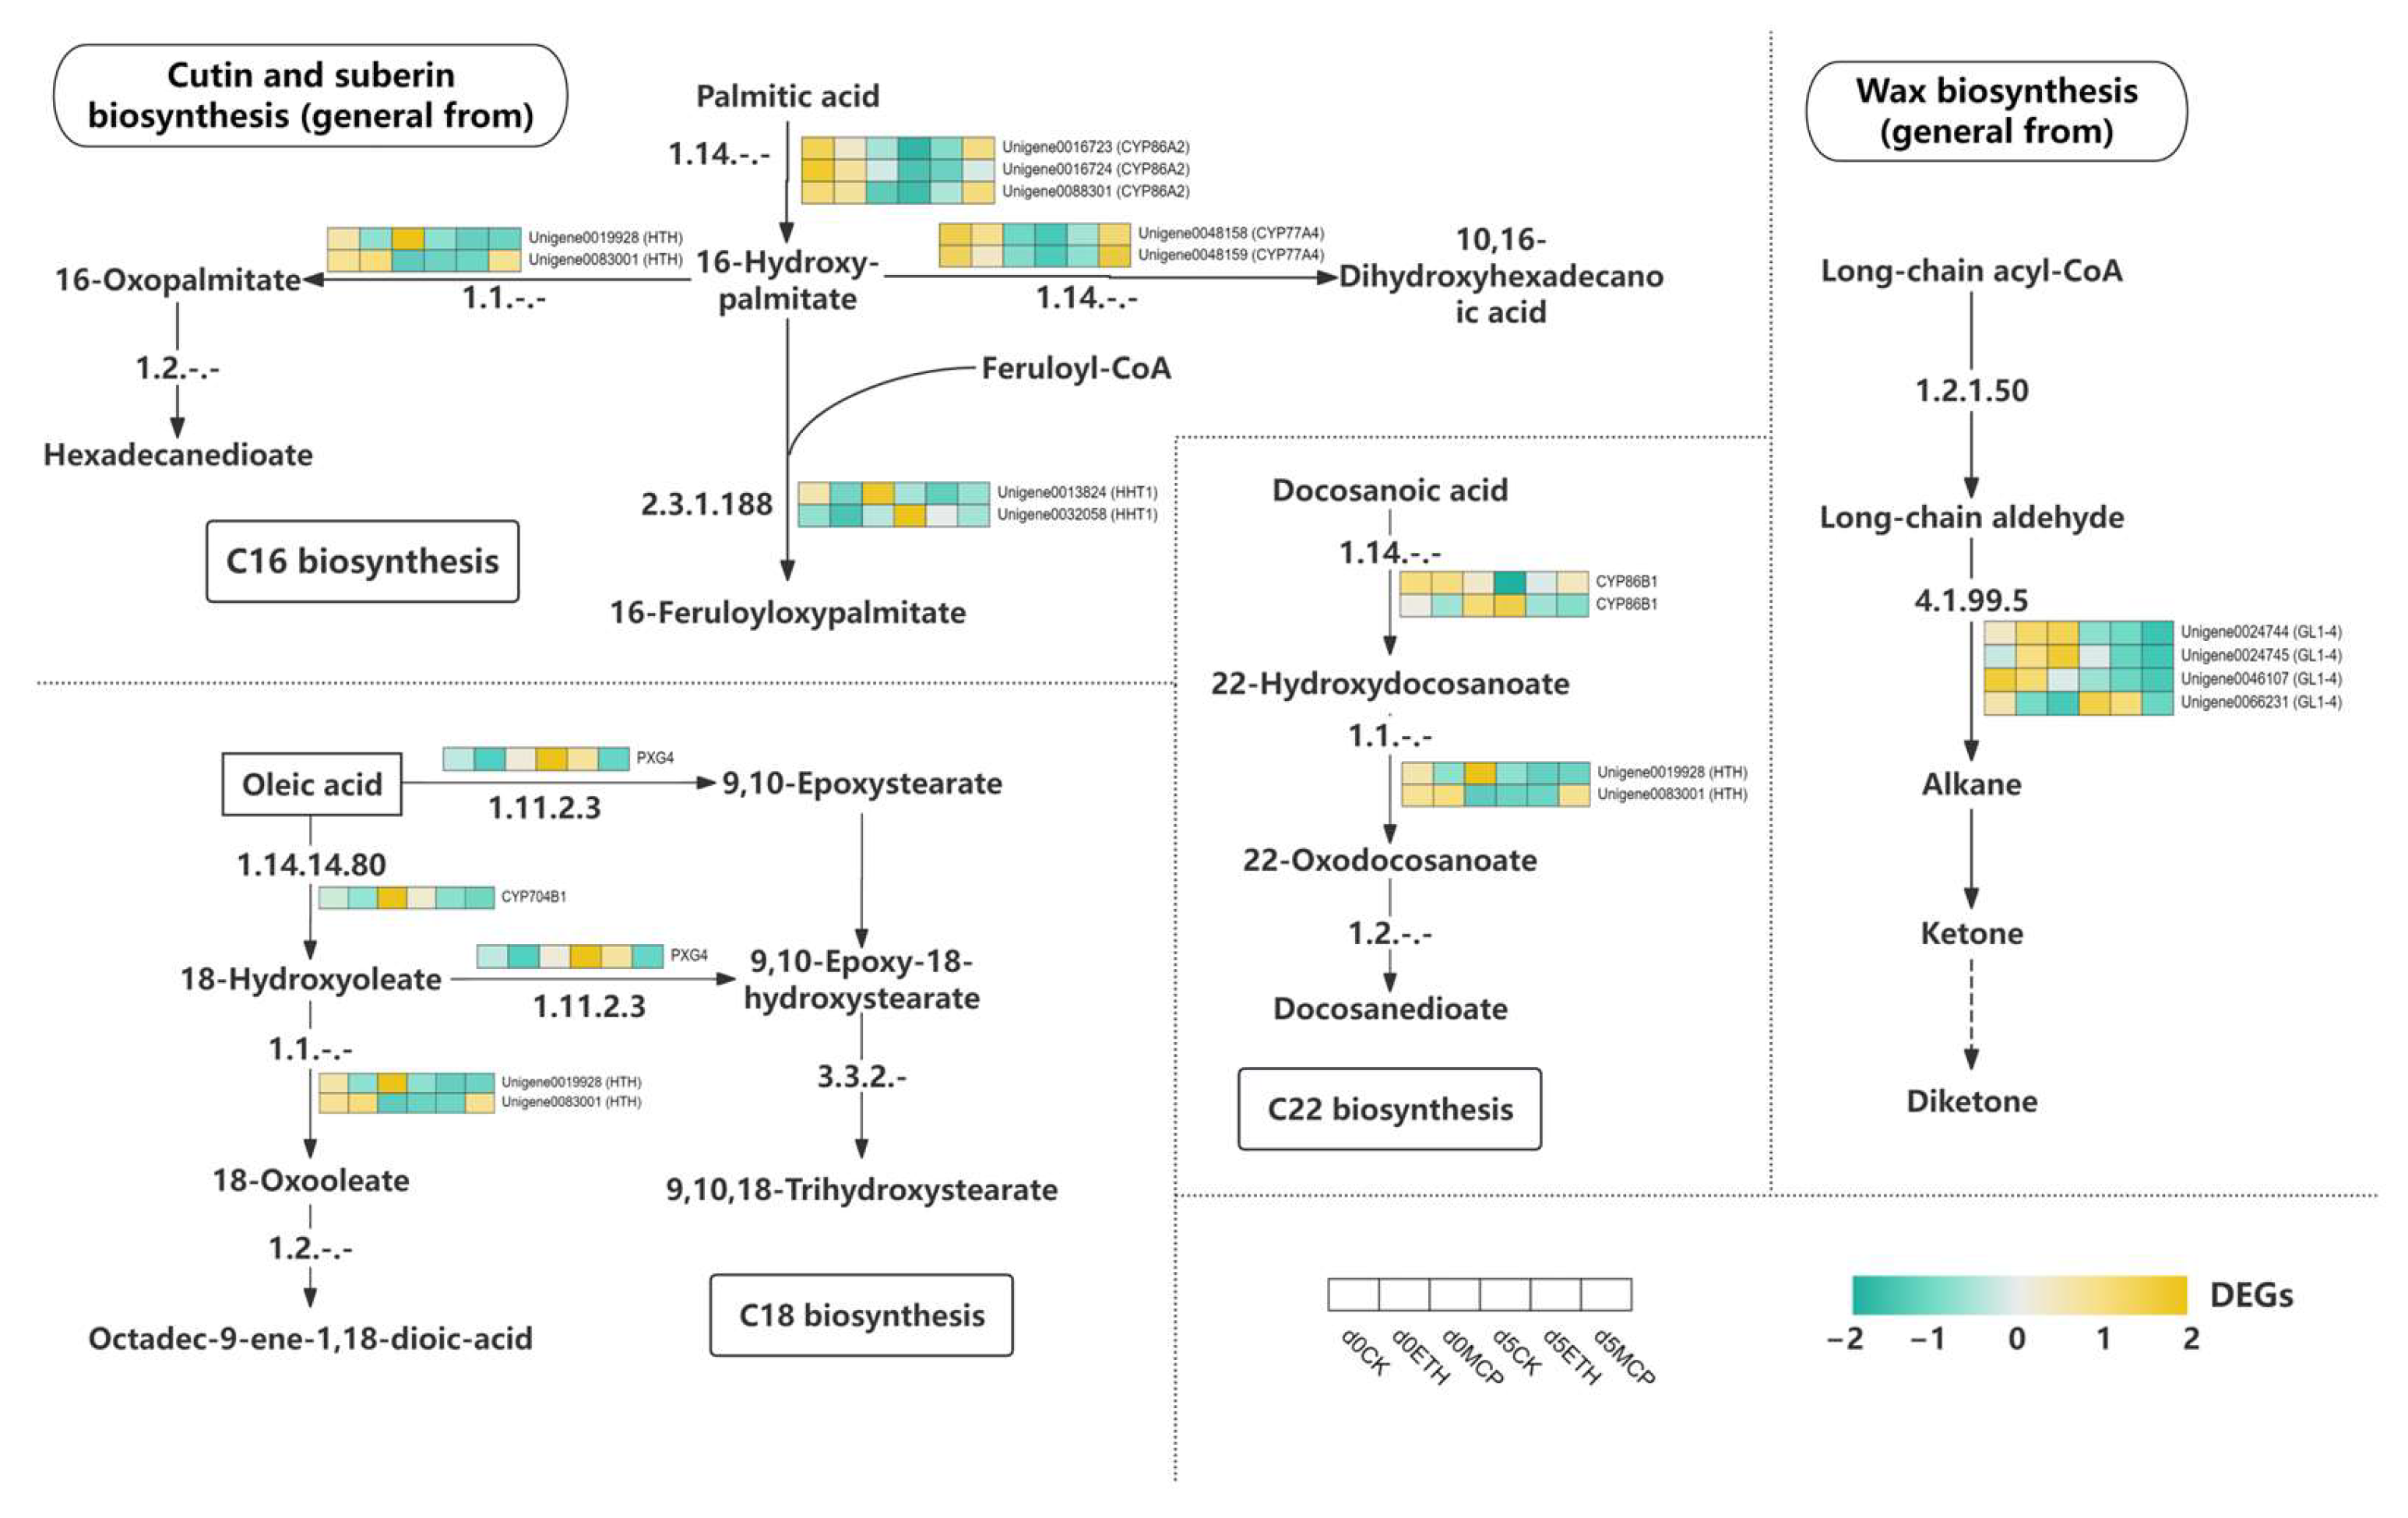
The wax biosynthesis pathway began with long-chain acyl-CoA, which produced alkanes and ketones, with the GL-14 gene identified as essential [92]. Cuticular wax levels on rose epidermal cells influenced the longevity of fresh-cut petals. Under the ETH treatment, the GL-14-associated genes were downregulated, while the 1-MCP treatment further reduced these genes, enhancing wax synthesis. These components were transported to the Oncidium epidermal cell membrane via the endoplasmic reticulum and Golgi apparatus. Cutin and suberin provided essential protection against water loss and pathogens. In C16 fatty acid synthesis, palmitic acid converted to 16-hydroxypalmitic acid and then to 16-oxopalmitate, a precursor for hexadecane-dioate. The HHT1 enzyme catalyzed the formation of 16-feruloyloxy-palmitate, a key intermediate for cutin and suberin. Additionally, 16-hydroxypalmitic acid was converted to 10,16-dihydroxyhexadecanoic acid for cutin biosynthesis. The CYP86A2 gene, crucial for 16-hydroxypalmitic acid synthesis, was significantly upregulated after five days of 1-MCP treatment, promoting wax production and preserving Oncidium’s protective layer (Figure 11).
C18 fatty acid synthesis began with oleic acid, which was converted into 18-hydroxyoleate through enzymes like PXG4 and CYP701B1. This was further transformed into 18-oxoleate and octadec-9-ene-1,18-dioic acid, key precursors for cutin and suberin. Oleic acid also produced 9,10-epoxystearic acid, which was oxidized to form 9,10-epoxy-18-hydroxystearic acid and then converted into 9,10,18-trihydroxystearic acid, involved in cutin and suberin synthesis. After five days of the 1-MCP treatment, genes such as PXG4, CYP7041, and HTH were significantly downregulated, promoting C18 fatty acid intermediates that enhanced Oncidium’s protective layer and resistance to stress. C22 fatty acid synthesis started with docosaenoic acid, which underwent hydroxylation and oxidation to produce 22-hydroxydocosanoic acid and 22-oxydocosanoic acid. In the 1-MCP and ETH treatments, genes like CYP86B1, PXG4, and HTH were continuously downregulated, sustaining the formation of suberin synthesis intermediates. This contributed significantly to wax synthesis and strengthened the protective layer of Oncidium, aiding moisture retention and stress resistance.

4. Conclusions

This study studied the molecular mechanisms of how ethylene and 1-MCP influenced the vase life of Oncidium hybridum cultivar ‘Honey Angle’ cut flowers. The comparative transcriptome analysis revealed significant changes in gene expressions associated with carotenoid metabolism, reactive oxygen species metabolism, cell wall degradation, and phytohormone signaling pathways. The results confirmed that the 1-MCP treatment effectively extended the vase life by upregulating carotenoid synthesis genes, which were crucial for flower color and visual quality, while suppressing genes involved in cell wall degradation and ethylene signaling, thus delaying senescence. In contrast, ethylene accelerated senescence by activating senescence-related genes and increasing ethylene production. Additionally, 1-MCP influenced genes related to starch and sucrose metabolism, as well as the biosynthesis of wax, cutin, and suberin, enhancing the protective layer of Oncidium flowers and improving stress resistance during the vase life. This research provided valuable insights into the molecular basis of Oncidium cut flower senescence and emphasized the importance of understanding regulatory networks for improving the postharvest handling of ‘Honey Angle’, extending the vase life and increasing the commercial value. Future studies should explore specific interactions between these pathways and additional treatments to further optimize postharvest performance.

Supplementary Materials

The following supporting information can be downloaded at https://www.mdpi.com/article/10.3390/horticulturae11040386/s1, Table S1: Response substances corresponding to the 18 sensors of the electronic nose. Supplementary data of the transcriptome can be found online at https://ngdc.cncb.ac.cn/, accessed on 25 February 2025.

Author Contributions

Conceptualization, J.K.; Methodology, X.Z., G.W. and B.W.; Software, G.W.; Formal analysis, G.W.; Investigation, Z.M., B.W. and G.Z.; Data curation, X.Z. and Z.M.; Writing—original draft, X.Z.; Writing—review & editing, J.K.; Supervision, Z.M.; Project administration, B.W.; Funding acquisition, J.K. and G.Z. All authors have read and agreed to the published version of the manuscript.

Funding

This research was funded by the Hainan Provincial Natural Science Foundation of China (322QN251), the National Natural Science Foundation of China (32260443), the Project of Sanya Yazhou Bay Science and Technology City (SKJC-JYRC-2024-20), the Earmarked Fund for CARS-10-Sweetpotato, the National Tropical Plants Germplasm Resource Center, the Specific Research Fund of the Innovation Platform for Academicians of Hainan Province (YSPTZX202206), and the Scientific Research Start-up Fund Project of Hainan University (KYQD(ZR)22125).

Institutional Review Board Statement

Not applicable.

Informed Consent Statement

Not applicable.

Data Availability Statement

The original contributions presented in this study are included in the article/Supplementary Materials. Further inquiries can be directed to the corresponding author.

Conflicts of Interest

The authors declare no conflicts of interest.

References

  1. Khatami, F.; Najafi, F.; Yari, F.; Khavari-nejad, R.; Takaki, K.; Okumura, T.; Takahashi, K. Ethylene induced flower opening, expression of receptor genes, and antioxidant defensive responses in cut roses. Russ. J. Plant Physiol. 2020, 67, 715–723. [Google Scholar] [CrossRef]
  2. Tian, X.; Shi, Y.; Hu, J.; Yan, B.; Gong, X.; Zhuang, Y.; Pan, Y.; Liu, J. Effects of preservatives applied at different flowering stages on cut flower senescence of Oncidium gower Ramsey. J. Trop. Biol. 2017, 8, 48–57. [Google Scholar] [CrossRef]
  3. Yang, C.P.; Xia, Z.Q.; Hu, J.; Zhuang, Y.F.; Pan, Y.W.; Liu, J.P. Transcriptome analysis of oncidium petals provides new insights into the initiation of petal senescence. J. Hortic. Sci. Biotech. 2019, 94, 12–23. [Google Scholar] [CrossRef]
  4. Woodson, W.R.; Lawton, K.A. Ethylene-induced gene-expression in carnation petals-relationship to autocatalytic ethylene production and senescence. Plant Physiol. 1988, 87, 498–503. [Google Scholar] [CrossRef]
  5. In, B.C.; Ha, S.T.; Lee, Y.S.; Lim, J. Relationships between the longevity, water relations, ethylene sensitivity, and gene expression of cut roses. Postharvest Biol. Technol. 2017, 131, 74–83. [Google Scholar] [CrossRef]
  6. Pun, U.K.; Yamada, T.; Azuma, M.; Tanase, K.; Yoshioka, S.; Shimizu-Yumoto, H.; Satoh, S.; Ichimura, K. Effect of sucrose on sensitivity to ethylene and enzyme activities and gene expression involved in ethylene biosynthesis in cut carnations. Postharvest Biol. Technol. 2016, 121, 151–158. [Google Scholar] [CrossRef]
  7. Liu, J.P.; Zhang, Z.Q.; Li, H.M.; Lin, X.H.; Lin, S.Q.; Joyce, D.; He, S.G. Alleviation of effects of exogenous ethylene on cut ‘Master’ carnation flowers with nano-silver and silver thiosulfate. Postharvest Biol. Technol. 2018, 143, 86–91. [Google Scholar] [CrossRef]
  8. Xu, J.P.; Naing, A.H.; Bunch, H.; Jeong, J.; Kim, H.; Kim, C.K. Enhancement of the flower longevity of petunia by CRISPR/Cas9-mediated targeted editing of ethylene biosynthesis genes. Postharvest Biol. Technol. 2021, 174, 111460. [Google Scholar] [CrossRef]
  9. Sisler, E.C.; Dupille, E.; Serek, M. Effect of 1-methylcyclopropene and methylenecyclopropane on ethylene binding and ethylene action on cut carnations. Plant Growth Regul. 1996, 18, 79–86. [Google Scholar] [CrossRef]
  10. Sisler, E.C.; Reid, M.S.; Yang, S.F. Effect of antagonists of ethylene action on binding of ethylene in cut carnations. Plant Growth Regul. 1986, 4, 213–218. [Google Scholar] [CrossRef]
  11. Wu, F.; Zhang, C.; Wang, X.; Guo, J.; Dong, L. Ethylene-influenced development of tree peony cut flowers and characterization of genes involved in ethylene biosynthesis and perception. Postharvest Biol. Technol. 2017, 125, 150–160. [Google Scholar] [CrossRef]
  12. Seglie, L.; Martina, K.; Devecchi, M.; Roggero, C.; Trotta, F.; Scariot, V. The effects of 1-MCP in cyclodextrin-based nanosponges to improve the vase life of Dianthus caryophyllus cut flowers. Postharvest Biol. Technol. 2011, 59, 200–205. [Google Scholar] [CrossRef]
  13. Serek, M.; Sisler, E.C. Efficacy of inhibitors of ethylene binding in improvement of the postharvest characteristics of potted flowering plants. Postharvest Biol. Technol. 2001, 23, 161–166. [Google Scholar] [CrossRef]
  14. Uthaichay, N.; Ketsa, S.; van Doorn, W.G. 1-MCP pretreatment prevents bud and flower abscission in Dendrobium orchids. Postharvest Biol. Technol. 2007, 43, 374–380. [Google Scholar] [CrossRef]
  15. Hassan, F.A.S.; Ali, E.F. Protective effects of 1-methylcyclopropene and salicylic acid on senescence regulation of gladiolus cut spikes. Sci. Hortic. 2014, 179, 146–152. [Google Scholar] [CrossRef]
  16. Liou, S.; Miller, W.B. Factors affecting ethylene sensitivity and 1-MCP response in tulip bulbs. Postharvest Biol. Technol. 2011, 59, 238–244. [Google Scholar] [CrossRef]
  17. Seglie, L.; Spadaro, D.; Trotta, F.; Devecchi, M.; Gullino, M.L.; Scariot, V. Use of 1-methylcylopropene in cyclodextrin-based nanosponges to control grey mould caused by Botrytis cinerea on Dianthus caryophyllus cut flowers. Postharvest Biol. Technol. 2012, 64, 55–57. [Google Scholar] [CrossRef]
  18. In, B.C.; Strable, J.; Patterson, S.E. Effects of 1-methylcyclopropene on flower senescence and petal abscission in Dianthus caryophyllus L. J. Korean Soc. Hortic. Sci. 2015, 56, 786–792. [Google Scholar] [CrossRef]
  19. Ha, S.T.T.; Lim, J.H.; In, B.C. Simultaneous inhibition of ethylene biosynthesis and binding using AVG and 1-MCP in two rose cultivars with different sensitivities to ethylene. J. Plant Growth Regul. 2019, 39, 553–563. [Google Scholar] [CrossRef]
  20. MattiuzI, C.F.M.; Mattiuzi, B.H.; Rodrigues, T.d.J.D.; PietroI, J.d.; Martins, R.N.; Grossi, S.d.F. Longevity of Oncidium varicosum (Orchidaceae) inflorescences treated with 1-methylciclopropene. Cienc. Rural 2012, 42, 987–992. [Google Scholar] [CrossRef]
  21. Hassan, F.A.S.; Gerzson, L. Effect of 1-MCP (1-methylcyclopropene) on the vase life of Chrysanthemum and Carnation cut flowers. Int. J. Hortic. Sci. Technol. 2002, 8, 29–32. [Google Scholar] [CrossRef]
  22. Ali, E.F.; Issa, A.A.; Al-Yasi, H.M.; Hessini, K.; Hass, F.A.S. The efficacies of 1-methylcyclopropene and chitosan nanoparticles in preserving the postharvest quality of damask rose and their underlying biochemical and physiological mechanisms. Biology 2022, 11, 242. [Google Scholar] [CrossRef] [PubMed]
  23. Gong, B.; Huang, S.; Ye, N.; Yuan, X.; Ma, H. Pre-harvest ethylene control affects vase life of cut rose “Carola” by regulating energy metabolism and antioxidant enzyme activity. Hortic. Environ. Biotechnol. 2018, 59, 835–845. [Google Scholar] [CrossRef]
  24. Chang, Y.C.A.; Lin, W.L.; Hou, J.Y.; Yen, W.Y.; Lee, N. Concentration of 1-methylcyclopropene and the duration of its application affect anti-ethylene protection in Phalaenopsis. Sci. Hortic. 2013, 153, 117–123. [Google Scholar] [CrossRef]
  25. Buanong, M.; Khunmuang, S.; Wongs-Aree, C.; Meir, S.; Philosoph-Hadas, S. Quality analysis of cut Vanda ‘Sansai Blue’ orchid flowers during vase life in response to exogenous ethylene, 1-MCP and sucrose. Sci. Hortic. 2024, 335, 113245. [Google Scholar] [CrossRef]
  26. Khunmuang, S.; Kanlayanarat, S.; Wongs-Aree, C.; Meir, S.; Philosoph-Hadas, S.; OrenShamir, M.; Ovadia, R.; Buanong, M. Ethylene induces a rapid degradation of petal anthocyanins in cut Vanda ‘Sansai Blue’ orchid flowers. Front. Plant Sci. 2019, 10, 1004. [Google Scholar] [CrossRef]
  27. Liu, N.; Cheng, F.; Zhong, Y.; Guo, X. Comparative transcriptome and coexpression network analysis of carpel quantitative variation in Paeonia rockii. BMC Genom. 2019, 20, 683. [Google Scholar] [CrossRef]
  28. Koukounaras, A.; Sfakiotakis, E. Effect of 1-MCP prestorage treatment on ethylene and CO2 production and quality of “Hayward” kiwifruit during shelf-life after short, medium and long term cold storage. Postharvest Biol. Technol. 2007, 46, 174–180. [Google Scholar] [CrossRef]
  29. Bleecker, A.B. Ethylene perception and signaling: An evolutionary perspective. Trends Plant Sci. 1999, 4, 269–274. [Google Scholar] [CrossRef]
  30. Liu, S.; Chen, H. Ethylene signaling facilitates plant adaption to physical barriers. Front. Plant Sci. 2021, 12, 697988. [Google Scholar] [CrossRef]
  31. Huang, T.H.; Hsu, W.H.; Mao, W.T.; Yang, C.H. The oncidium ethylene synthesis gene oncidium 1-Aminocyclopropane-1 carboxylic acid synthase 12 and ethylene receptor gene oncidium ETR1 affect GA-DELLA and jasmonic acid signaling in regulating flowering time, anther dehiscence, and flower senescence in arabidopsis. Front. Plant Sci. 2022, 13, 785441. [Google Scholar] [CrossRef]
  32. Yuan, X.; Wang, H.; Cai, J.; Li, D.; Song, F. NAC transcription factors in plant immunity. Phytopathol. Res. 2019, 1, 3. [Google Scholar] [CrossRef]
  33. Rogers, H.J. Programmed cell death in floral organs: How and why do flowers die? Ann. Bot. 2006, 97, 309–315. [Google Scholar] [CrossRef]
  34. Trivellini, A.; Ferrante, A.; Vernieri, P.; Mensuali-Sodi, A.; Serra, G. Effects of Promoters and Inhibitors of Ethylene and ABA on Flower Senescence of Hibiscus rosa-sinensis L. J. Plant Growth Regul. 2010, 30, 175–184. [Google Scholar] [CrossRef]
  35. Kumar, N.; Srivastava, G.C.; Dixit, K. Hormonal regulation of flower senescence in roses (Rosa hybrida L.). Plant Growth Regul. 2008, 55, 65–71. [Google Scholar] [CrossRef]
  36. Ronen, M.; Mayak, S. Interrelationship between abscisic acid and ethylene in the control of senescence processes in carnation flowers. J. Exp. Bot. 1981, 32, 759–765. [Google Scholar]
  37. Porat, R.; Borochov, A.; Halevy, A.H. Enhancement of petunia and dendrohium flower senescence by jasmonic acid methyl ester is via the promotion of ethylene prodtiction. Plant Growth Regul. 1993, 13, 297–301. [Google Scholar] [CrossRef]
  38. Niederhuth, C.E.; Patharkar, O.R.; Walker, J.C. Transcriptional profiling of the Arabidopsis abscission mutant hae hsl2 by RNA-Seq. BMC Genom. 2013, 14, 37. [Google Scholar] [CrossRef]
  39. Katsir, L.; Chung, H.S.; Koo, A.J.K.; Howe, G.A. Jasmonate signaling: A conserved mechanism of hormone sensing. Curr. Opin. Plant Biol. 2008, 11, 428–435. [Google Scholar] [CrossRef]
  40. Higuchi, M.; Pischke, M.S.; Mahonen, A.P.; Miyawaki, K.; Hashimoto, Y.; Seki, M.; Kakimoto, T. In planta functions of the Arabidopsis cytokinin receptor family. Proc. Natl. Acad. Sci. USA 2004, 101, 8821–8826. [Google Scholar] [CrossRef]
  41. Van Staden, J.; Upfold, S.J.; Bayley, A.D.; Drewes, F.E. Cytokinins in cut carnation flowers. IX. Transport and metabolism of iso-pentenyladenine and the effect of its derivatives on flower longevity. Plant Growth Regul. 1990, 9, 255–261. [Google Scholar] [CrossRef]
  42. Van Doorn, W.G.; Çelikel, F.G.; Pak, C.; Harkema, H. Delay of Iris flower senescence by cytokinins and jasmonates. Physiol. Plant. 2013, 148, 105–120. [Google Scholar] [CrossRef] [PubMed]
  43. Ahmad, R.; Anjum, M.A. Mineral nutrition management in fruit trees under salt stress: A review. Erwerbs-Obstbau 2023, 65, 397–405. [Google Scholar] [CrossRef]
  44. Ji, Y.; Qu, Y.; Jiang, Z.; Yan, J.; Chu, J.; Xu, M.; Su, X.; Yuan, H.; Wang, A. The mechanism for brassinosteroids suppressing climacteric fruit ripening. Plant Physiol. 2021, 185, 1875–1893. [Google Scholar] [CrossRef]
  45. Zhu, X.; Song, Z.; Li, Q.; Li, J.; Chen, W.; Li, X. Physiological and transcriptomic analysis reveals the roles of 1-MCP in the ripening and fruit aroma quality of banana fruit (Fenjiao). Food Res. Int. 2020, 130, 108968. [Google Scholar] [CrossRef] [PubMed]
  46. Qi, G.; Chen, J.; Chang, M.; Chen, H.; Hall, K.; Korin, J.; Liu, F.; Wang, D.; Fu, Z.Q. Pandemonium breaks out: Disruption of salicylic acid-mediated defense by plant pathogens. Mol. Plant 2018, 11, 1427–1439. [Google Scholar] [CrossRef] [PubMed]
  47. Wu, Y.; Zhang, D.; Chu, J.Y.; Boyle, P.; Wang, Y.; Brindle, I.D.; Luca, V.D.; Després, C. The Arabidopsis NPR1 protein is a receptor for the plant defense hormone salicylic acid. Cell Rep. 2012, 1, 639–647. [Google Scholar] [CrossRef]
  48. Wang, Y.; Tan, L.X.; Xu, Z.Q.; Jiao, Y.X.; Zhu, D.X.; Yang, Y.S.; Wei, J.F.; Sun, J.L.; Tian, M. Identification and characterization of natural PR-1 protein as major allergen from Humulus japonicus pollen. Mol. Immunol. 2023, 153, 170–180. [Google Scholar] [CrossRef]
  49. Veselova, S.V.; Burkhanova, G.F.; Nuzhnaya, T.V.; Maksimov, I.V. Roles of ethylene and cytokinins in development of defense responses in Triticum aestivum plants infected with Septoria nodorum. Russ. J. Plant Physiol. 2016, 63, 609–619. [Google Scholar] [CrossRef]
  50. Hedden, P. The current status of research on gibberellin biosyn thesis. Plant Cell Physiol. 2020, 61, 1832–1849. [Google Scholar] [CrossRef]
  51. Wang, K.L.C.; Li, H.; Ecker, J.R. Ethylene biosynthesis and signaling networks. Plant Cell 2002, 14 (Suppl. S1), S131–S151. [Google Scholar] [CrossRef] [PubMed]
  52. Yoo, S.D.; Cho, Y.H.; Sheen, J. Emerging connections in the ethylene signaling network. Trends Plant Sci. 2009, 14, 270–279. [Google Scholar] [CrossRef]
  53. Thongkum, M.; Imsabai, W.; Burns, P.; McAtee, P.A.; Schaffer, R.J.; Allan, A.C.; Ketsa, S. The effect of 1-methylcyclopropene (1-MCP) on expression of ethylene receptor genes in durian pulp during ripening. Plant Physiol. Biochem. 2018, 125, 232–238. [Google Scholar] [CrossRef] [PubMed]
  54. van Doorn, W.G.; Woltering, E.J. Physiology and molecular biology of petal senescence. J. Exp. Bot. 2008, 59, 453–480. [Google Scholar] [CrossRef]
  55. Wang, Y.; Hecker, A.G.; Hauser, B.A. The APX4 locus regulates seed vigor and seedling growth in Arabidopsis thaliana. Planta 2014, 239, 909–919. [Google Scholar] [CrossRef]
  56. Zhou, Q.; Ma, C.; Cheng, S.; Wei, B.; Liu, X.; Ji, S. Changes in antioxidative metabolism accompanying pitting development in stored blueberry fruit. Postharvest Biol. Technol. 2014, 88, 88–95. [Google Scholar] [CrossRef]
  57. Li, S. Novel insight into functions of ascorbate peroxidase in higher plants: More than a simple antioxidant enzyme. Redox Biol. 2023, 64, 102789. [Google Scholar] [CrossRef] [PubMed]
  58. Wu, H.; Wang, F.; Yang, Q.; Tang, J.; Chen, L.; Shi, Z.; He, X.; Deng, J. Carboxymethyl chitosan different durations induces disease resistance of grapefruit by modulating ascorbate-glutathione cycle and cell wall metabolism. Postharvest Biol. Technol. 2024, 211, 112845. [Google Scholar] [CrossRef]
  59. Giovannoni, J.J.; DellaPenna, D.; Bennett, A.B.; Fischer, R.L. Polygalacturonase and tomato fruit ripening. Hortic. Rev. 1992, 13, 67–103. [Google Scholar] [CrossRef]
  60. Luo, J.; Ma, N.; Pei, H.; Chen, J.; Li, J.; Gao, J. A DELLA gene, RhGAI1, is a direct target of EIN3 and mediates ethylene-regulated rose petal cell expansion via repressing the expression of RhCesA2. J. Exp. Bot. 2013, 64, 5075–5084. [Google Scholar] [CrossRef]
  61. Li, C.; Shen, W.; Lu, W.; Jiang, Y.; Xie, J.; Chen, J. 1-MCP delayed softening and affected expression of XET and EXP genes in harvested cherimoya fruit. Postharvest Biol. Technol. 2009, 52, 254–259. [Google Scholar] [CrossRef]
  62. Zhao, Y.; Song, C.; Lin, Q.; Duan, Y. Exploring the Effects of Different 1-MCP Concentration Treatment on Chilling Injury of Postharvest Peach Fruit. J. Food Biochem. 2024, 1, 9917257. [Google Scholar] [CrossRef]
  63. Zhang, Q.; Dai, W.; Jin, X.; Li, J. Calcium chloride and 1-methylcyclopropene treatments delay postharvest and reduce decay of New Queen melon. Sci. Rep. 2019, 9, 13563. [Google Scholar] [CrossRef]
  64. Rhee, S.Y.; Osborne, E.; Poindexter, P.D.; Somerville, C.R. Microspore separation in the quartet 3 mutants of Arabidopsis is impaired by a defect in a developmentally regulated polygalacturonase required for pollen mother cell wall degradation. Plant Physiol. 2003, 133, 1170–1180. [Google Scholar] [CrossRef]
  65. Preuss, D.; Rhee, S.Y.; Davis, R.W. Tetrad analysis possible in Arabidopsis with mutation of the QUARTET (QRT) genes. Science 1994, 264, 1458–1460. [Google Scholar] [CrossRef]
  66. Francis, K.E.; Lam, S.Y.; Copenhaver, G.P. Separation of Arabidopsis pollen tetrads is regulated by QUARTET1, a pectin methylesterase gene. Plant Physiol. 2006, 142, 1004–1013. [Google Scholar] [CrossRef]
  67. Zhu, X.; Ye, L.; Ding, X.; Gao, Q.; Xiao, S.; Tan, Q.; Huang, J.; Chen, W.; Li, X. Transcriptomic analysis reveals key factors in fruit ripening and rubbery texture caused by 1-MCP in papaya. BMC Plant Biol. 2019, 19, 309. [Google Scholar] [CrossRef]
  68. Choi, D.; Choi, J.H.; Park, K.; Kim, C.M.; Lim, J.; Kim, D. Transcriptomic analysis of effects of 1-methylcyclopropene (1-MCP) and ethylene treatment on kiwifruit (Actinidia chinensis) ripening. Front. Plant Sci. 2023, 13, 1084997. [Google Scholar] [CrossRef]
  69. Sterling, J.D.; Quigley, H.F.; Orellana, A.; Mohnen, D. The catalytic site the pectin biosynthetic enzyme alpha-1,4 galacturonosyltransferase is located in the lumen of the Golgi. Plant Physiol. 2001, 127, 360–371. [Google Scholar] [CrossRef]
  70. Hongo, S.; Sato, K.; Yokoyama, R.; Nishitani, K. Demethylesterification of the primary wall by PECTIN METHYLESTERASE35 provides mechanical support to the Arabidopsis stem. Plant Cell 2012, 24, 2624–2634. [Google Scholar] [CrossRef]
  71. Willats, W.G.; Orfila, C.; Limberg, G.; Buchholt, H.C.; van Alebeek, G.J.; Voragen, A.G.; Marcus, S.E.; Christensen, T.M.; Mikkelsen, J.D.; Murray, B.S.; et al. Modulation of the degree and pattern of methyl-esterification of pectic homogalacturonan in plant cell walls. Implications for pectin methyl esterase action, matrix properties, and cell adhesion. J. Biol. Chem. 2001, 276, 19404–19413. [Google Scholar] [PubMed]
  72. Balestrieri, C.; Castaldo, D.; Giovane, A.; Quagliuolo, L.; Servillo, L. A glycoprotein inhibitor of pectin methylesterase in kiwi fruit (actinidia-chinensis). Eur. J. Biochem. 1990, 193, 183–187. [Google Scholar] [CrossRef] [PubMed]
  73. Salazar, J.A.; Ruiz, D.; Zapata, P.; Martínez-García, P.J.; Martínez-Gómez, P. Whole Transcriptome Analyses of Apricots and Japanese Plum Fruits after 1-MCP (Ethylene-Inhibitor) and Ethrel (Ethylene-Precursor) Treatments Reveal New Insights into the Physiology of the Ripening Process. Int. J. Mol. Sci. 2022, 23, 11045. [Google Scholar] [CrossRef]
  74. Niyogi, K. Safety valves for photosynthesis. Curr. Opin. Plant Biol. 2000, 3, 455–460. [Google Scholar] [CrossRef]
  75. Li, T.; Deng, Y.J.; Liu, J.X.; Duan, A.Q.; Liu, H.; Xiong, A.S. DcCCD4 catalyzes the degradation of α-carotene and β-carotene to affect carotenoid accumulation and taproot color in carrot. Plant J. 2021, 108, 1116–1130. [Google Scholar] [CrossRef] [PubMed]
  76. Mapelli-Brahm, P.; Meléndez-Martínez, A.J. The colourless carotenoids phytoene and phytofluene: Sources, consumption, bioavailability and health effects. Curr. Opin. Food Sci. 2021, 41, 201–209. [Google Scholar] [CrossRef]
  77. Cunningham, F.X.; Gantt, E. Genes and enzymes of carotenoid biosynthesis in plants. Annu. Rev. Plant Physiol. Plant Mol. Biol. 1998, 49, 557–583. [Google Scholar] [CrossRef]
  78. Kishimoto, S.; Maoka, T.; Nakayama, M.; Ohmiya, A. Carotenoid composition in petals of chrysanthemum (Dendranthema grandiflorum (Ramat.) Kitamura). Phytochemistry 2004, 65, 2781–2787. [Google Scholar] [CrossRef]
  79. Moehs, C.P.; Tian, L.; Osteryoung, K.W.; DellaPenna, D. Analysis of carotenoid biosynthetic gene expression during marigold petal development. Plant Mol. Biol. 2001, 45, 281–293. [Google Scholar] [CrossRef]
  80. Nielsen, K.M.; Lewis, D.H.; Morgan, E.R. Characterization of carotenoid pigments and their biosynthesis in two yellow flowered lines of Sandersonia aurantiaca (Hook). Euphytica 2003, 130, 25–34. [Google Scholar] [CrossRef]
  81. Hieber, A.D.; Mudalige-Jayawickrama, R.G.; Kuehnle, A.R. Color genes in the orchid Oncidium Gower Ramsey: Identification, expression, and potential genetic instability in an interspecific cross. Planta 2005, 223, 521–531. [Google Scholar] [CrossRef] [PubMed]
  82. Al-Babili, S. A dirigent of the ring for strigolactone stereochemistry. Proc. Natl. Acad. Sci. USA 2024, 121, e2410953121. [Google Scholar] [CrossRef] [PubMed]
  83. Takemura, M.; Maoka, T.; Misawa, N. Biosynthetic routes of hydroxylated carotenoids (xanthophylls) in Marchantia polymorpha, and production of novel and rare xanthophylls through pathway engineering in Escherichia coli. Planta 2014, 241, 699–710. [Google Scholar] [CrossRef]
  84. Lee, S.Y.; Jang, S.J.; Jeong, H.B.; Lee, S.Y.; Venkatesh, J.; Lee, J.H.; Kwon, J.K.; Kang, B.C. A mutation in Zeaxanthin epoxidase contributes to orange coloration and alters carotenoid contents in pepper fruit (Capsicum annuum). Plant J. 2021, 106, 1692–1707. [Google Scholar] [CrossRef] [PubMed]
  85. Park, C.H.; Chae, S.C.; Park, S.Y.; Kim, J.K.; Kim, Y.J.; Chung, S.O.; Arasu, M.V.; Al-Dhabi, N.A.; Park, S.U. Anthocyanin and carotenoid contents in different cultivars of chrysanthemum (Dendranthema grandiflorum Ramat.) flower. Molecules 2015, 20, 11090–11102. [Google Scholar] [CrossRef]
  86. Wang, Y.; Zhang, C.; Dong, B.; Fu, J.; Hu, S.; Zhao, H. Carotenoid accumulation and its contribution to flower coloration of Osmanthus fragrans. Front. Plant Sci. 2018, 9, 1499. [Google Scholar] [CrossRef]
  87. Alós, E.; Martínez-Fuentes, A.; Reig, C.; Mesejo, C.; Zacarías, L.; Agustí, M.; Rodrigo, M.J. Involvement of ethylene in color changes and carotenoid biosynthesis in loquat fruit (Eriobotrya japonica Lindl. cv. Algerie). Postharvest Biol. Technol. 2019, 149, 129–138. [Google Scholar] [CrossRef]
  88. Xiong, L.; Lee, H.; Ishitani, M.; Zhu, J.K. Regulation of osmotic stress-responsive gene expression by the LOS6/ABA1 locus in Arabidopsis. J. Biol. Chem. 2002, 277, 8588–8596. [Google Scholar] [CrossRef]
  89. Dong, T.; Park, Y.; Hwang, I. Abscisic acid: Biosynthesis, inactivation, homoeostasis and signalling. Essays Biochem. 2015, 58, 29–48. [Google Scholar] [CrossRef]
  90. Mizutani, M.; Todoroki, Y. ABA 8′-hydroxylase and its chemical inhibitors. Phytochem. Rev. 2006, 5, 385–404. [Google Scholar]
  91. Barreto, G.P.; Fabi, J.P.; Rosso, V.V.; Cordenunsi, B.R.; Lajolo, F.M.; Nascimento, J.R.; Mercadante, A.Z. Influence of ethylene on carotenoid biosynthesis during papaya postharvesting ripening. J. Food Compos. Anal. 2011, 24, 620–624. [Google Scholar] [CrossRef]
  92. Hao, X.; Lv, J.; Zhao, Z.; Tong, Y.; Deng, M.; Wen, J. Compositional variances in petal cuticular wax of eight rose species and their impacts on vase life under water-loss stress. Front. Plant Sci. 2024, 15, 1412617. [Google Scholar] [CrossRef] [PubMed]
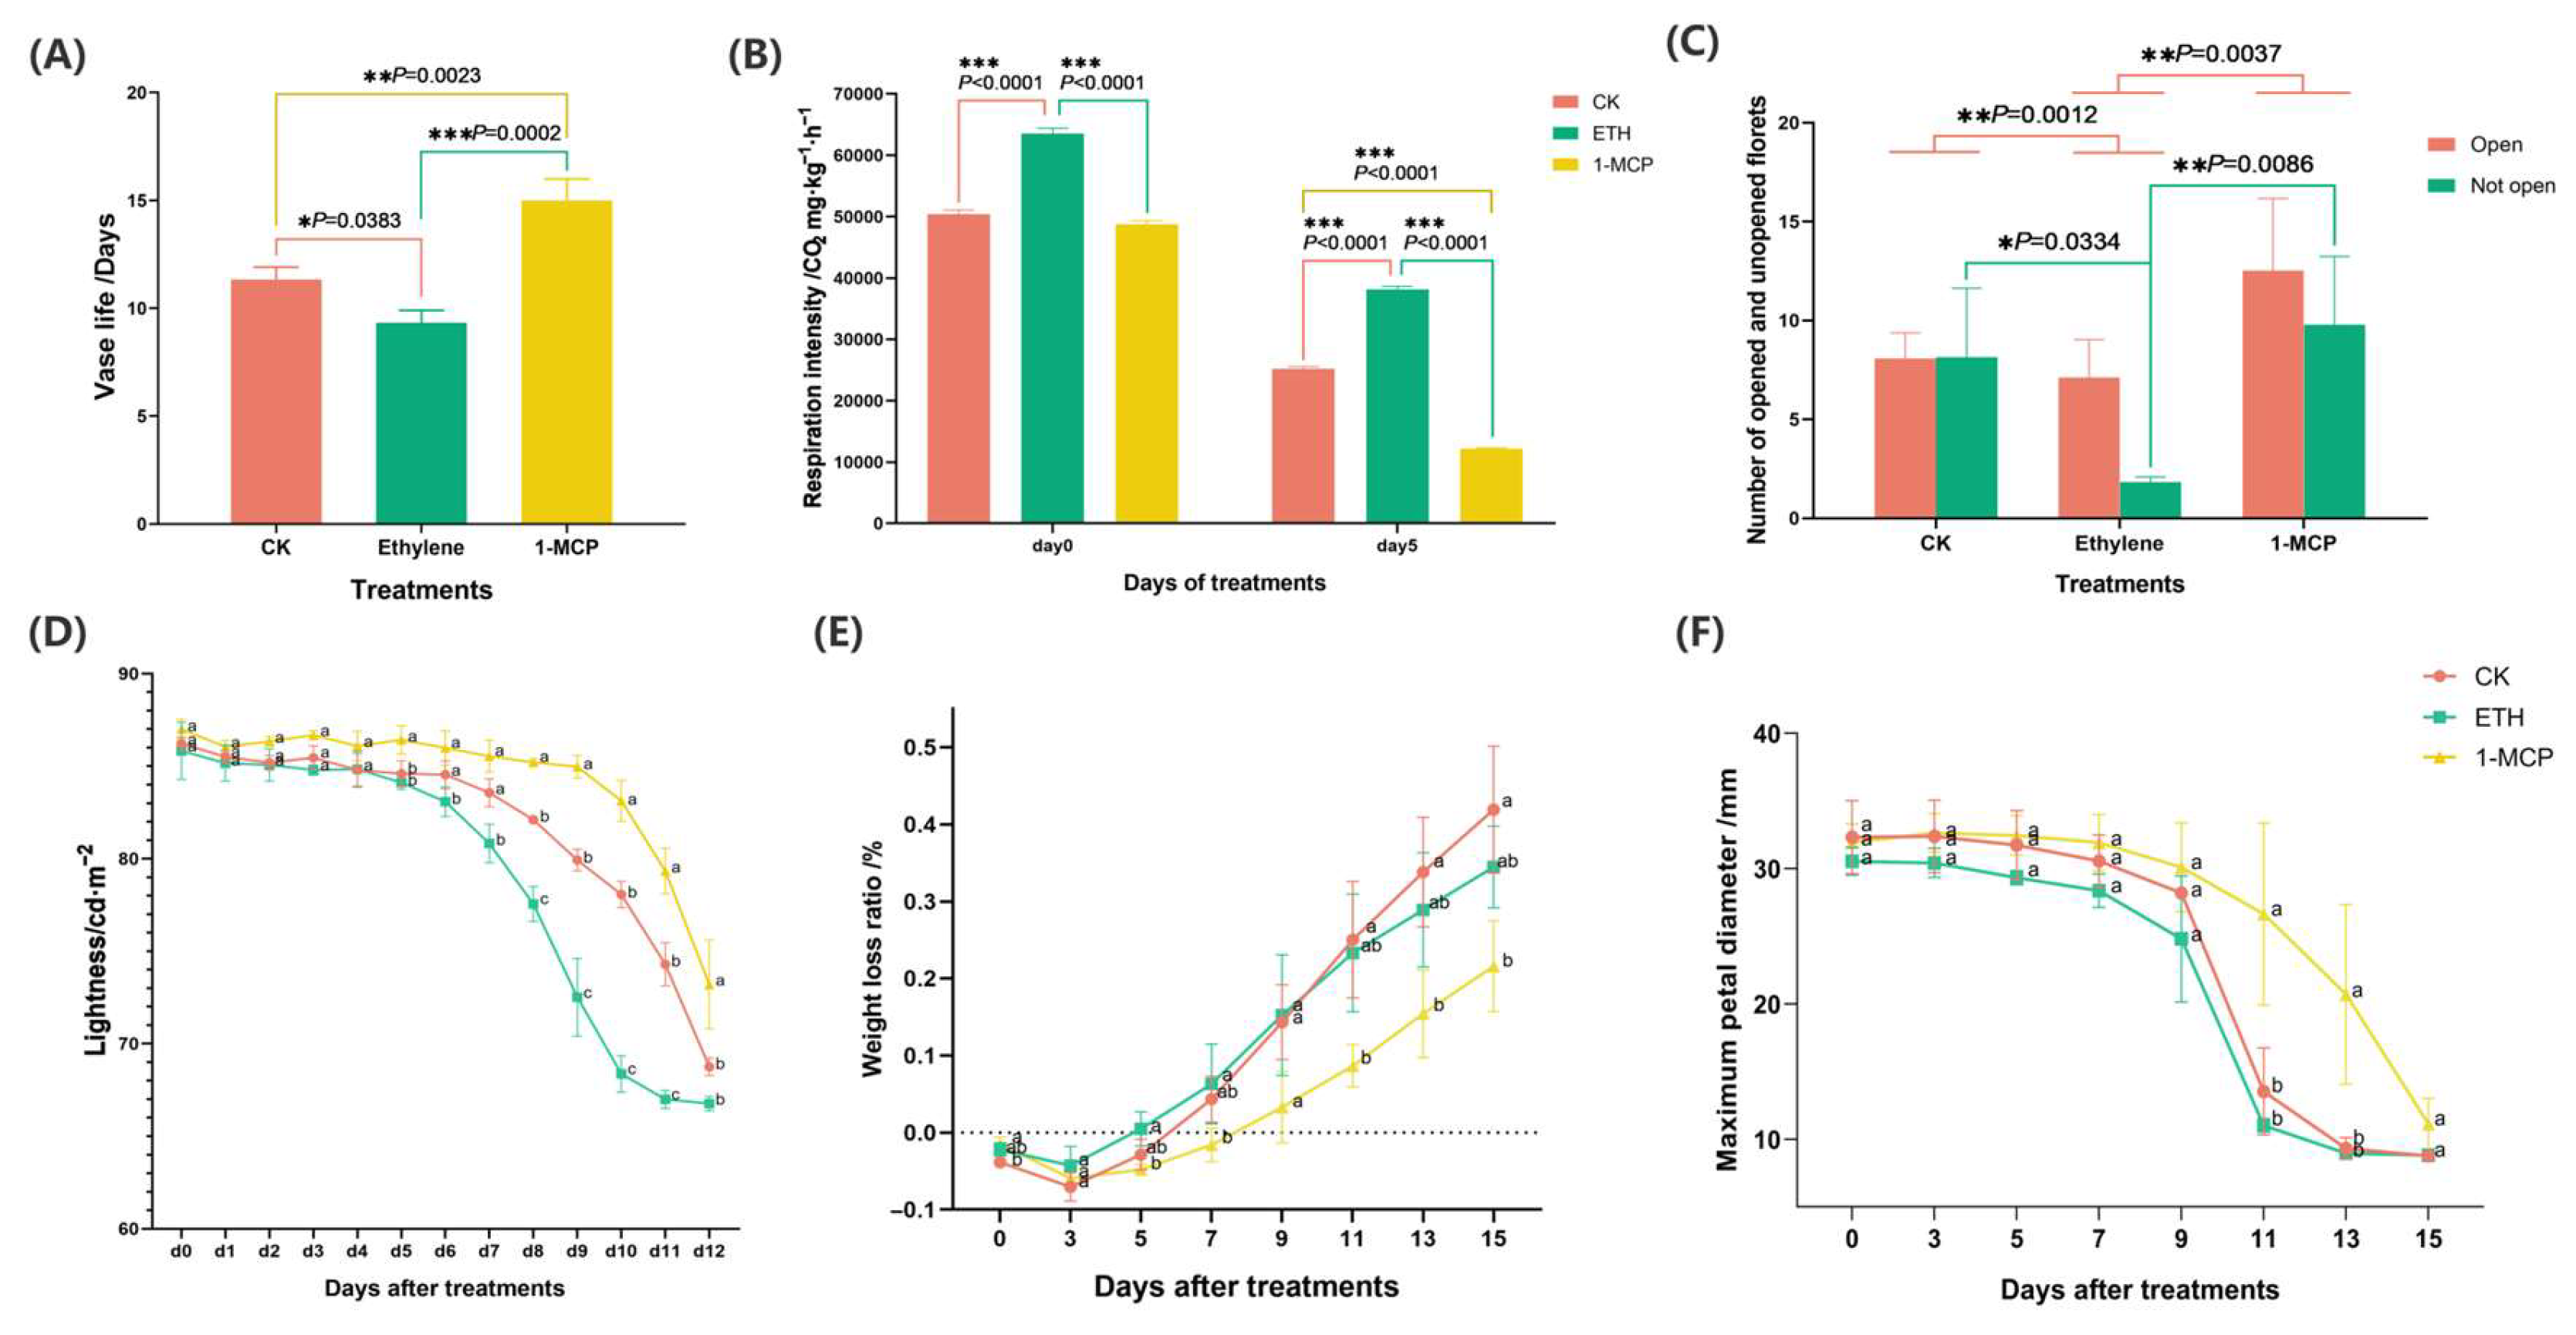
Figure 1. The (A) vase life, (B) respiration intensity, (C) number of opened and not-opened flowers, (D) lightness, (E) weight loss, and (F) maximum petal diameter of Oncidium hybridumHoney Angle’ subjected to different treatments: air (CK), ETH, and 1-MCP. Each data point was a mean of three replicates. According to one-way analysis of variance (ANOVA), different numbers of * above the values at the same sampling point indicated different levels of statistical significance, with p values as follows: 0.01 ≤ p * <0.05, 0.001 ≤ p ** < 0.01, *** p < 0.001. The means followed by different letters at the same sampling point indicated statistical differences according to Tukey’s test (p < 0.05).
Horticulturae 11 00386 g001
Figure 2. Effects of the air (CK), ethylene, and 1-MCP treatments on the visual appearance of the cut flowers of Oncidium hybridumHoney Angle’ during their vase life. The blue marks indicate curled or wilted petals; the red circles show areas where the tissues have faded and turned whitish.
Horticulturae 11 00386 g002
Figure 3. (A) Radar chart of electronic nose results of Oncidium hybridumHoney Angle’ under treatments (CK, ETH, and 1-MCP) during vase life on day 0, day 3, day 5, day 7, and day 9. Radar chart of CK, ETH, and 1-MCP treatments on day 0 (B), day 5 (C), and day 9 (D) during vase life. Values were the means of three replicates.
Horticulturae 11 00386 g003
Figure 4. Transcriptome analysis of the Oncidium hybridumHoney Angle’ cut flowers during their vase life: (A) a Venn diagram for the gene expression analysis under different treatments, (B) a heat map of the DEGs, (C) the numbers of DEGs in the pair-wise comparisons, and (D) the KEGG pathway analysis of the clustered DEGs in 19 categories. The X-axis indicates the numbers of DEGs, and the Y-axis indicates the KEGG classification.
Horticulturae 11 00386 g004
Figure 5. WGCNA during the storage of fresh-cut Oncidium hybridumHoney Angle’: (A) The clustering dendrogram of 5203 DEGs, with the color rows providing a simple visual comparison of module assignments based on the dynamic hybrid branch-cutting method. (B) The number of genes contained in each module and the correlation coefficient between phenotypic traits and module eigengenes presented with a color scale, with red and blue representing positive and negative correlations, respectively. According to one-way analysis of variance (ANOVA), different numbers of * under the values at the heatmap indicated different levels of statistical significance, with p values as follows: 0.01≤ p * < 0.05, 0.001 ≤ p ** < 0.01, *** p < 0.001.
Horticulturae 11 00386 g005
Figure 6. Venn diagrams that show the numbers of shared and specific differentially expressed genes encoding for transcription factors under the (A) CK and 1-MCP (B) CK and ethylene (ETH) (C) ethylene (ETH) and 1-MCP treatments during vase lives on day 0 and day 5.
Horticulturae 11 00386 g006
Figure 7. Expression profiles of DEGs associated with different plant hormones’ signal transduction, including (A) Abscisic Acid (ABA), (B) Jasmonic acid (JA), (C) Cytokinin (CTK), (D) Ethylene (ETH), (E) Brassinosteroid (BR), (F) Auxin, (G) Salicylic Acid (SA), and (H) Gibberellin GA. The rows in the heat map represent screened DEGs, and the columns indicate different samples (Day 0_CK, Day 0_ETH, Day 0_1-MCP, Day 5_CK, Day 5_ETH, Day 5_1-MCP). The color gradient, ranging from green through white to yellow, represents low, middle, and high values of the FPKM value. The denser the green color, the more expression is upregulated, while the denser the yellow color, the more expression is downregulated.
Horticulturae 11 00386 g007
Figure 8. Analysis of the expression patterns of DEGs encoding enzymes involved in cell wall modifications in Oncidium hybridumHoney Angle’ under CK, ETH and 1-MCP treatments on d 0 and d 5 during vase life. (A) APX: ascorbate peroxidase; (B) XTH: xyloglucan transglycosylase/hydrolase; (C) PG: polygalacturonase; (D) SOD: superoxide dismutase; (E) PE: pectinesterase; (F) PL: pectate lyase; (G) ACO: 1-Aminocyclopropane-1-Carboxylate Oxidase; (H) ACS: 1-Aminocyclopropane-1-Carboxylate Synthase.
Horticulturae 11 00386 g008
Figure 9. Heat map of the expression levels of DEGs involved in carotenoid metabolism.
Horticulturae 11 00386 g009
Figure 10. Heat map of the expression levels of DEGs involved in starch and sucrose metabolism.
Horticulturae 11 00386 g010
Figure 11. Heat map of the expression levels of DEGs involved in wax keratin metabolism.
Horticulturae 11 00386 g011
Table 1. Transcription factors differentially expressed (up and down) between d 0 and d 5 in Oncidium hybridumHoney Angle’ cut flowers under treatments (CK, ETH, and 1-MCP) during their vase life.
d0_CK_vs_ETHd0_CK_vs_1-MCPd0_ETH_vs_1-MCP
TF_FamilyNumber of GenesUpDownTF_FamilyNumber of GenesUpDownTF_FamilyNumber of GenesUpDown
ERF606NAC12111NAC13130
NAC505MYB1037ERF1275
bHLH202ERF826MYB1257
MYB202NF-YB624bHLH743
MIKC202bHLH514NF-YB615
bZIP110TCP303WRKY440
Total18 bZIP312G2-like413
G2_like303TCP404
Trihelix211NF-YC312
GRAS220bZIP312
NF-YA110Trihelix303
WRKY101E2F/DP202
MIKC101GRAS220
GeBP110NF-YA110
SAP101ZF-HD110
NF-YC101Nin-like110
MICK101GeBP110
M_type101SAP101
LBD101M_type101
E2F/DP101LBD101
DBB101DBB101
Total65 Total83
d5_CK_vs_ETHd5_CK_vs_1-MCPd5_ETH_vs_1-MCP
TF_FamilyNumber of GenesUpDownTF_FamilyNumber of GenesUpDownTF_FamilyNumber of GenesUpDown
WRKY10010NAC16115ERF972
NAC615WRKY606NAC716
ERF303ERF532WRKY110
MYB220TCP330TCP110
bHLH211MYB211MYB110
Trihelix110LBD211bZIP110
TCP110G2-like211ZF-HD101
SBP110bZIP211B3101
bZIP110B3211Total22
B3110ZF-HD202
SAP101Trihelix110
MIKC101SBP110
GRAS101E2F/DP110
G2-like101DBB110
Total32 ARF110
SAP101
MIKC101
Total49
Disclaimer/Publisher’s Note: The statements, opinions and data contained in all publications are solely those of the individual author(s) and contributor(s) and not of MDPI and/or the editor(s). MDPI and/or the editor(s) disclaim responsibility for any injury to people or property resulting from any ideas, methods, instructions or products referred to in the content.