Article

Preparation of Tea Tree Oil Microcapsules and Their Effects on Strawberry Preservation During Storage

1
College of Tea and Food Science and Technology, Jiangsu Vocational College of Agriculture and Forestry, Zhenjiang 212400, China
2
Tea Research Institution, College of Horticulture, Ministry of Agriculture and Rural Affairs Key Laboratory of Biology and Germplasm Enhancement of Horticultural Crops in East China, Nanjing Agricultural University, Nanjing 210095, China
3
State Key Laboratory of Crop Genetics & Germplasm Enhancement and Utilization, Nanjing Agricultural University, Nanjing 210095, China
*
Author to whom correspondence should be addressed.
Horticulturae 2025, 11(4), 389; https://doi.org/10.3390/horticulturae11040389
Submission received: 6 March 2025 / Revised: 2 April 2025 / Accepted: 4 April 2025 / Published: 6 April 2025
(This article belongs to the Section Biotic and Abiotic Stress)

Abstract

:
This study used an embedding technique to prepare microcapsules with tea tree oil as the core material and a composite of β-cyclodextrin and nano-montmorillonite as the wall material. The prepared microcapsules were analyzed for their morphological characteristics, thermal stability, and major components. Additionally, the microcapsules’ effect on the quality of and active substances contained in refrigerated strawberries was investigated. The results revealed that the optimal preparation conditions for the microcapsules were a montmorillonite addition of 2% (m/v), a core-to-wall ratio of 1:12 (m/m), an encapsulation temperature of 70 °C, and an encapsulation time of 90 min. Under these conditions, the microcapsules achieved an encapsulation efficiency of 77.67%. The capsules emitted a noticeable aroma of tea tree oil, and their primary components, specifically terpinen-4-ol, 1,8-cineole, p-cymene, and terpinolene, were consistent with those of tea tree oil. The release rate of the microcapsules at 60 °C and 90 °C was significantly lower than that of liquid tea tree oil (p < 0.05). A suitable treatment with tea tree oil microcapsules preserved the appearance and quality of the strawberries, inhibited spoilage during refrigeration, reduced weight loss, maintained firmness, delayed declines in soluble solid contents and acidity in later storage stages, and enhanced the activity of the superoxide dismutase, catalase, and ascorbate peroxidase. The prepared microcapsules also suppressed increases in anthocyanins and inhibited the further maturation of the stored strawberries. The optimal preservative effect was achieved with the placement of 5.0 g of tea tree oil microcapsules per 1.2 L of storage space.

1. Introduction

Strawberries (Fragaria ananassa Duch.) are perennial herbaceous plants in the Rosaceae family. The fruit is rich in nutrition, such as vitamins, minerals, carotenoids, and anthocyanins [1]. Because of their delicate tissue structure and high water content (90–95%), strawberries rapidly lose edibility and processing quality after harvesting; this phenomenon primarily occurs because of strawberries’ physiological metabolism, mechanical damage, or microbial spoilage [2]. Preservation methods comprise cold storage, modified atmosphere storage, chemical preservatives, and coating techniques [3]. However, these methods increase production costs and may leave chemical residues that pose health risks to consumers [4]. Consequently, developing a safe, convenient, and effective natural preservative is a critical focus of strawberry preservation research [5].
Tea tree oil is a colorless-to-pale-yellow essential oil that is distilled from the leaves and branch tips of Melaleuca alternifolia, a plant in the Myrtaceae family and Melaleuca genus [6]. Tea tree oil is one of the most active natural antibacterial agents discovered to date. It is also highly valued for its high concentration of antioxidants, which can protect organisms from oxidative damage [7,8]. Widely applied in the daily chemical, pharmaceutical, and food industries [9], tea tree oil exhibits poor water solubility, a low boiling point, poor stability, and high volatility [10]. To slow the release of its active components, tea tree oil is often processed into microspheres, microcapsules, nanoemulsions, and liposomes [11]. Among these, microcapsules are particularly advantageous because they enable the controlled release of antimicrobial components, extending preservative effects [12]. Additionally, microcapsule preparation is straightforward and scalable, rendering microcapsules widely applicable in the food, pharmaceutical, and tobacco industries [13]. Various methods have been employed to prepare microcapsules, such as ionic gelation, complex coacervation, and molecular embedding [14,15]. For example, studies such as those of Li et al. [16], Deng et al. [9], and Jiang et al. [10] have used complex coacervation to enhance the stability of tea tree oil.
β-Cyclodextrin is a cyclic oligosaccharide that possesses a unique cavity structure capable of forming stable inclusion complexes with various hydrophobic substances in aqueous solutions. β-Cyclodextrin is produced through the enzymatic hydrolysis and cyclization of starch and is safe, nontoxic, highly stable, and inexpensive to produce, and is widely used in the food, pharmaceutical, and textile industries [17]. Derived from montmorillonite ore and processed into nano-sized materials, nano-montmorillonite possesses several desirable properties, such as high specific surface area, adsorption capacity, and thermal stability. When the montmorillonite layers are uniformly dispersed in macromolecular materials at the nanoscale, the resulting composite material forms a three-dimensional network structure, enhancing mechanical strength, moisture and temperature resistance, and barrier properties [18].
This study embedded microcapsules with cores of tea tree oil and walls of a composite of β-cyclodextrin and nano-montmorillonite. The preparation process of the tea tree oil/β-cyclodextrin/nano-montmorillonite microcapsules was investigated through single-factor experiments and orthogonal tests. The thermal stability, morphology, and major components of the prepared microcapsules were also analyzed. Additionally, the microcapsules were applied to refrigerated strawberries to evaluate their ability to preserve strawberry quality and active substances during storage. The findings provide a reference for the preparation of tea tree oil microcapsules and theoretical and practical foundations for the development of novel oil-based strawberry preservatives.

2. Materials and Methods

2.1. Experimental Materials and Reagents

This study used handpicked Hongyan strawberries from the Jiangsu Agricultural Expo Park strawberry base. After harvest, the strawberries were transported by cold chain and stored in the laboratory refrigerator at 4 °C before processing. Fully ripened fruits (90% ripe, based on the fruit color) of uniform size that were free of mechanical damage, decay, or disease were selected for the experiments.
The reagents used in the study were tea tree oil, β-cyclodextrin, nano-montmorillonite (montmorillonite K-10), and ethanol (Shanghai Macklin Biochemical Co., Shanghai, China); Tween-80, potassium chloride, anhydrous sodium acetate, and hydrochloric acid sourced from China National Pharmaceutical Group, China; and superoxide dismutase (SOD), ascorbate peroxidase (APX), and catalase (CAT) assay kits (Nanjing Jiancheng Bioengineering Institute, Nanjing, China).

2.2. Instruments and Equipment

The instruments used in this study were a ME203E electronic balance (Mettler-Toledo Instruments, Shanghai, China), a GM-0.33A diaphragm vacuum pump (Jinteng Experimental Equipment, Tianjin, China), an NR10QC colorimeter (3NH Technology, Shenzhen, China), a GY-4 fruit sclerometer (Yueqing Aidebao Instruments, Wenzhou, China), a PAL-BXI ACID4 Brix–acidity meter for strawberries (Atago Technology, Tokyo, Japan), a T6 UV–visible spectrophotometer (Purkinje General Instruments, Beijing, China), a G-26 tabletop high-speed refrigerated centrifuge (Sartorius, Goettingen, Germany), a 905GP ultra-low-temperature freezer (Thermo Fisher Scientific, Waltham, MA, USA), a pHS-3C pH meter (Yoke Instruments and Meters, Shanghai, China), a JSM-5610LV scanning electron microscope (JEOL, Akishima, Japan), and an 8890-7000D gas chromatography–mass spectrometry (GC–MS) system (Agilent Technologies, Santa Clara, CA, USA) equipped with a DB-5MS capillary column (30 m × 0.25 mm × 0.25 µm) and extraction head (120 µm DVB/CWR/PDMS).

2.3. Experimental Methods

2.3.1. Preparation of Tea Tree Oil Microcapsules

A total of 10.0 g β-cyclodextrin was dissolved in distilled water at 70 °C to form a saturated solution. A measured amount of montmorillonite was gradually added to the β-cyclodextrin solution and stirred for 30 min to produce a homogeneous mixture. Tea tree oil was dissolved in ethanol at a volume ratio of 1:1 and slowly added dropwise to the mixture. Subsequently, 2–3 drops of Tween-80 were added, and the mixture was stirred and heated to achieve embedding. After cooling to room temperature, the mixture was refrigerated at 4 °C for 24 h. The solid materials were filtered using a vacuum pump, washed once or twice with ethanol, and dried in an oven at 35 °C to a constant weight to obtain the microcapsules.
The montmorillonite concentration (2%, 4%, 6%, 8%, 10%, 12%, 30%, m/v), core-to-wall ratio (1:5, 1:8, 1:10, 1:12, 1:20, m/m), encapsulation temperature (40 °C, 50 °C, 60 °C, 70 °C, 80 °C, 90 °C), and encapsulation time (30 min, 60 min, 90 min, 120 min) were varied [19] (Table 1). Encapsulation efficiency was evaluated, and single-factor experiments were conducted to prepare the microcapsules.
According to the results of the single-factor experiments, the following parameters were selected for the subsequent orthogonal experiments: montmorillonite addition (A: 2%, 4%, 6%, m/v), core-to-wall ratio (B: 1:8, 1:10, 1:12, m/m), encapsulation temperature (C: 70 °C, 80 °C, 90 °C), and encapsulation time (D: 30 min, 60 min, 90 min). The orthogonal experiments were designed using the L9(34) layout.

2.3.2. Experiment Preserving Strawberries Using Tea Tree Oil Microcapsules

Tea tree oil microcapsules prepared using the optimal formula determined by the orthogonal experiments were placed into sealed cotton gauze bags (6 cm × 8 cm). The bag openings were tied securely, and the bags were placed into strawberry packaging boxes. The boxes were transparent and made of polyethylene terephthalate, with dimensions of 25 cm × 17 cm × 5.7 cm and a volume of approximately 1.2 L. A foam pad with 15 grooved holes was placed at the bottom of the box. The central hole of the foam pad was used for the bag containing the tea tree oil microcapsules, and the remaining 14 holes each held one strawberry.
The experiment involved five treatments: each treatment, which consisted of six boxes of strawberries (14 fruits in each box), contained either 2.5 g, 5.0 g, 7.5 g, or 10.0 g of tea tree oil microcapsules per box, with the exception of the control group bag (CK), which contained no microcapsules. Strawberry samples from each treatment group were packed into large plastic bags and stored in a refrigerator at 4 °C. Each treatment was performed in triplicate. Random sampling was conducted every 3 days to measure strawberry quality and antioxidant enzyme activity indicators.

2.4. Measurement Indicators

2.4.1. Encapsulation Efficiency Measurement

A precise amount of microcapsules m1 (g) was weighed and soaked in 35 mL of ethanol for 24 h to fully release the encapsulated tea tree oil. The soaked microcapsules were subsequently heated in an oven at 130 °C to a constant weight, and the final weight of the heated microcapsules m2 (g) was recorded. The encapsulation efficiency was calculated using the following formula:
encapsulation efficiency = m 1 m 2 m 0 × 100 %
where m0 is the total amount of tea tree oil added (g) and m1 and m2 are the initial and final weights of the microcapsules.

2.4.2. Slow-Release Measurement

A precise amount of tea tree oil and microcapsules m1 (g) was separately placed into pre-weighed containers m0, which were subsequently placed in a drying oven with the blower on to simulate dynamic release at 60 °C and 90 °C. The weight m2 was measured every 30 min, and the evaporation rate of the tea tree oil and microcapsules was calculated using the following formula:
evaporation rate = m 1 ( m 2 m 0 ) m 1 × 100 %

2.4.3. Scanning Electron Microscopy

A small quantity of the tea tree oil microcapsules was fixed onto a copper column. The samples were coated with a gold layer for 60 s using a sputter coater. The surface microstructures of the samples were subsequently observed using a JSM-5610LV scanning electron microscope.

2.4.4. Major Component Analysis

Sample Preparation

In total, 2.0 g tea tree oil and 2.0 g microcapsules were placed into 20 mL headspace vials, respectively, and immediately sealed. The vials were immersed in a water bath maintained at a constant temperature, and an aged solid-phase microextraction needle was inserted into the sealed vials. The extraction head was extended into the vial and maintained in the 50 °C water bath for 1 h. After extraction, the needle was removed, and the extraction head was immediately inserted into the inlet of a GC–MS system for thermal desorption for 2 min. Before each sample extraction, the extraction head was aged at 250 °C for 5 min to minimize memory effects.

GC–MS Analysis

Gas chromatography conditions were as follows: a TG-5MS (30 m × 0.25 mm × 0.25 µm) elastic quartz capillary column was used. The carrier gas was high-purity (99.999%) helium with a flow rate of 1.2 mL/min. The splitless injection mode was used, and the injection port temperature was set to 250 °C. The temperature program was as follows: the initial temperature was set to 40 °C and maintained for 2 min, then increased at a rate of 3 °C/min to 100 °C and maintained for 1 min, increased at a rate of 5 °C/min to 160 °C and maintained for 1 min, and finally increased at a rate of 10 °C/min to 280 °C and maintained for 1 min.
Mass spectrometry conditions were as follows: an electron ionization source was used. The transfer line temperature was 280 °C, and the ion source temperature was set to 300 °C. The electron energy was 70 eV. The full-scan acquisition mode was employed with a scan range of 40–550 amu.

Data Processing

Qualitative Analysis: The chemical components of the tea tree oil and microcapsules were identified by comparing the results of the GC–MS analysis with standard mass spectra from the National Institute of Standards and Technology (NIST)105 and Wiley 7.0 mass spectral libraries using computer-based search algorithms.
Quantitative Analysis: The relative content of each chemical component in the volatile fractions of the tea tree oil and microcapsules was calculated using a peak area normalization method; the normalized peak areas were obtained from the NIST spectral library workstation data processing system.

2.4.5. Appearance, Weight Loss Rate, and Decay Index

The weight loss rate was measured by weighing the materials using a balance (Sartorius BSA124S, precision 0.0001 g). The weight loss rate was calculated as the percentage of weight after storage intervals against the weight before storage. The decay index was scored using five levels on the basis of the decayed area. Specifically, level 0 (1 point) indicated no decay; level 1 (2 points) indicated decay covering 0% to 25% of the surface area; level 2 (3 points) indicated decay covering 25% to 50% of the surface area; level 3 (4 points) indicated decay covering 50% to 75% of the surface area; and level 4 (5 points) indicated decay covering 75% to 100% of the surface area.
The decay index was calculated using the following formula:
d e c a y   i n d e x = decay level × number of fruits at the decay level Highest decay level × total number of fruits × 100 %

2.4.6. Color and Firmness

Color was measured using a colorimeter (TS7036, 3nh Technology Co., Ltd., Shenzhen, China) [20]. Three points along the equator of the strawberries were selected to measure the surface brightness value (L*), redness value (a*), yellowness value (b*), and hue angle (H). H = arctan(b*/a*). The fruit color index (CI) was calculated using the following formula: CI = (180 − H)/{L* + [(a*)2 + (b*)2] 0.5}.
Firmness was measured using a GY-4 fruit sclerometer (TUOKE Instruments Co., Ltd., Qingdao, China). Near the equatorial region of the strawberries, a probe with a diameter of 11 mm was inserted to a depth of 5 mm at a uniform speed. The measurement was repeated three times, and the average value was recorded.

2.4.7. Acidity-to-Brix Ratio

The acidity-to-Brix ratio was measured using a Brix and acidity meter (PAL-1, Atago Co., Ltd., Saitama, Japan). After the strawberries were crushed, the juice was filtered through four layers of gauze to determine the soluble solid content (SSC). The juice was then mixed with distilled water at a ratio of 1:50 (V:V), and the titratable acid content was measured [21].

2.4.8. Anthocyanin Content

Anthocyanin content was measured by assessing pH differentials [22]. First, strawberry juice was filtered through four layers of gauze. Second, 1.0 mL of the sample was mixed with 9.0 mL of a potassium chloride/hydrochloric acid buffer solution (pH 1.0) to obtain Solution 1. Another 1.0 mL of the sample was mixed with 9.0 mL of a sodium acetate/hydrochloric acid buffer solution (pH 4.5) to obtain Solution 2. The absorbance of Solutions 1 and 2 was measured at 510 nm and 700 nm, respectively, and the anthocyanin content was calculated using the Fuleki formula:
a n t h o c y a n i n   c o n t e n t m g   C 3 G   e q u i v a l e n t L   o f   s t r a w b e r r y   j u i c e = Δ A × 449.2 × 1000 × D F ε     1
where ΔA is (A510 nm–A700 nm) in Solution 1 and (A510 nm–A700 nm) in Solution 2;
M is 449.2 g/mol (molar mass of cyanidin-3-glucoside [C3G]);
DF is the dilution factor;
ε is the molar extinction coefficient of C3G (26,900 L/mol·cm).

2.4.9. SOD, CAT, and APX Activity in Strawberries

The strawberries were cut into pieces using sterile surgical blades wrapped in aluminum foil, treated with liquid nitrogen, and stored at −80 °C in an ultra-low-temperature freezer until analysis. For measurement, the strawberries were placed in an ice-water bath and ground into a homogenate. A 1 g sample of homogenate was added to a 50 mL centrifuge tube with 9 mL of phosphate buffer (pH 7.8). The tube was centrifuged at 2348× g for 10 min at 4 °C, and the supernatant was collected as the crude enzyme extract. The activities of SOD, CAT, and APX were measured using assay kits from Nanjing Jiancheng Bioengineering Institute following the manufacturer’s instructions. The results were expressed as U/g FW (units per gram of fresh weight).

2.5. Data Processing

The results of the statistical analysis are expressed as means ± standard deviations. A one-way analysis of variance and Duncan’s multiple comparisons between groups were evaluated using SPSS 26.0 software, with significance set at p < 0.05. The significance between the two groups of data was analyzed by Student’s t-test. Graphs were created using Origin 2022 software.

3. Results and Discussion

3.1. Study on Preparation Process of Tea Tree Oil Microcapsules

3.1.1. Single-Factor Experiments

When the quantity of montmorillonite wall material was increased, the encapsulation efficiency of the tea tree oil microcapsules initially increased before declining (Figure 1a). Specifically, when the montmorillonite concentration was 4%, the encapsulation efficiency reached a maximum of 76.9%, after which it gradually declined, although the differences between groups were nonsignificant (p > 0.05). Therefore, to maximize encapsulation efficiency and cost, the optimal montmorillonite concentration was set to 4%.
The encapsulation efficiency also initially increased before declining as the core-to-wall ratio was adjusted. When the core-to-wall ratio reached 1:12, the encapsulation efficiency peaked at 82.3%, with significant differences observable between groups (p < 0.05; Figure 1b). Therefore, the encapsulation efficiency may be strongly affected by a suitable core-to-wall ratio.
As the encapsulation temperature increased, the encapsulation efficiency of the tea tree oil microcapsules increased before declining, reaching a maximum at 80 °C (Figure 1c). This trend is attributable to the increased solubility of β-cyclodextrin and the accelerated movement of tea tree oil molecules at high temperatures, which facilitated the formation of a stable microcapsule structure. However, when the temperature exceeded the 80 °C threshold, the accelerated volatilization of the tea tree oil reduced encapsulation efficiency.
As the encapsulation time increased, the encapsulation efficiency of the tea tree oil microcapsules also increased before declining. The highest encapsulation efficiency was observed at 60 min (Figure 1d). When the encapsulation time was below the 60 min threshold, insufficient contact between tea tree oil and the mixture of β-cyclodextrin and montmorillonite prevented the tea tree oil from fully entering the β-cyclodextrin structure, reducing encapsulation efficiency. By contrast, when the encapsulation time exceeded the 60 min threshold, the tea tree oil became volatile, reducing encapsulation efficiency.

3.1.2. Optimization of Orthogonal Experiments

An L9(34) orthogonal experimental design was used to optimize the preparation conditions for the tea tree oil microcapsules by evaluating four factors, namely the montmorillonite concentration, core-to-wall ratio, encapsulation temperature, and encapsulation time. To assess experimental errors, each trial was repeated thrice. The orthogonal design and the results of a visual analysis are presented in Table 2, and the orthogonal experiment results of a variance analysis are presented in Table 3. The influence of the four factors on the encapsulation efficiency in descending order of magnitude was the core-to-wall ratio (B) > encapsulation time (D) > encapsulation temperature (C) > montmorillonite concentration (A). On the basis of the K-values for each factor, the optimal configuration for preparing the tea tree oil microcapsules was determined to be A2B3C3D3, corresponding to a montmorillonite concentration of 4%, a core-to-wall ratio of 1:12, an encapsulation temperature of 90 °C, and an encapsulation time of 90 min.
The core-to-wall ratio and encapsulation time considerably affected the encapsulation efficiency of the tea tree oil microcapsules, whereas the encapsulation temperature and montmorillonite concentration did not (Table 3). After accounting for cost factors, the optimal configuration for the tea tree oil microcapsules was determined to be A1B3C1D3, corresponding to a montmorillonite concentration of 2%, a core-to-wall ratio of 1:12, an encapsulation temperature of 70 °C, and an encapsulation time of 90 min.
To verify the specifications and reliability of the configuration, three trials were conducted under conditions of a 2% montmorillonite concentration, a core-to-wall ratio of 1:12, an encapsulation temperature of 70 °C, and an encapsulation time of 90 min. The encapsulation efficiencies obtained were 78.00%, 76.39%, and 78.62% for the three trials, with an average of 77.67%.
Yang et al. [23] investigated the preparation of tea tree oil inclusion complexes using β-cyclodextrin as the wall material. The optimal conditions were a β-cyclodextrin-to-tea-tree-oil ratio of 11:1 (g/g), a temperature of 67 °C, and an encapsulation time of 60 min. The inclusion complexes retained approximately 67% of the tea tree oil after 1 month of storage at room temperature. In the present study, β-cyclodextrin and nano-montmorillonite were employed as the wall materials to prepare tea tree oil microcapsules using molecular embedding. The results obtained from this preparation process were consistent with those of Lu et al. [24]. Furthermore, the addition of nano-montmorillonite substantially increased encapsulation efficiency, demonstrating that nano-montmorillonite possesses excellent adsorption capacity and thermal stability.

3.2. Analysis of Tea Tree Oil Microcapsule Characteristics

3.2.1. Morphological Analysis of Tea Tree Oil Microcapsules

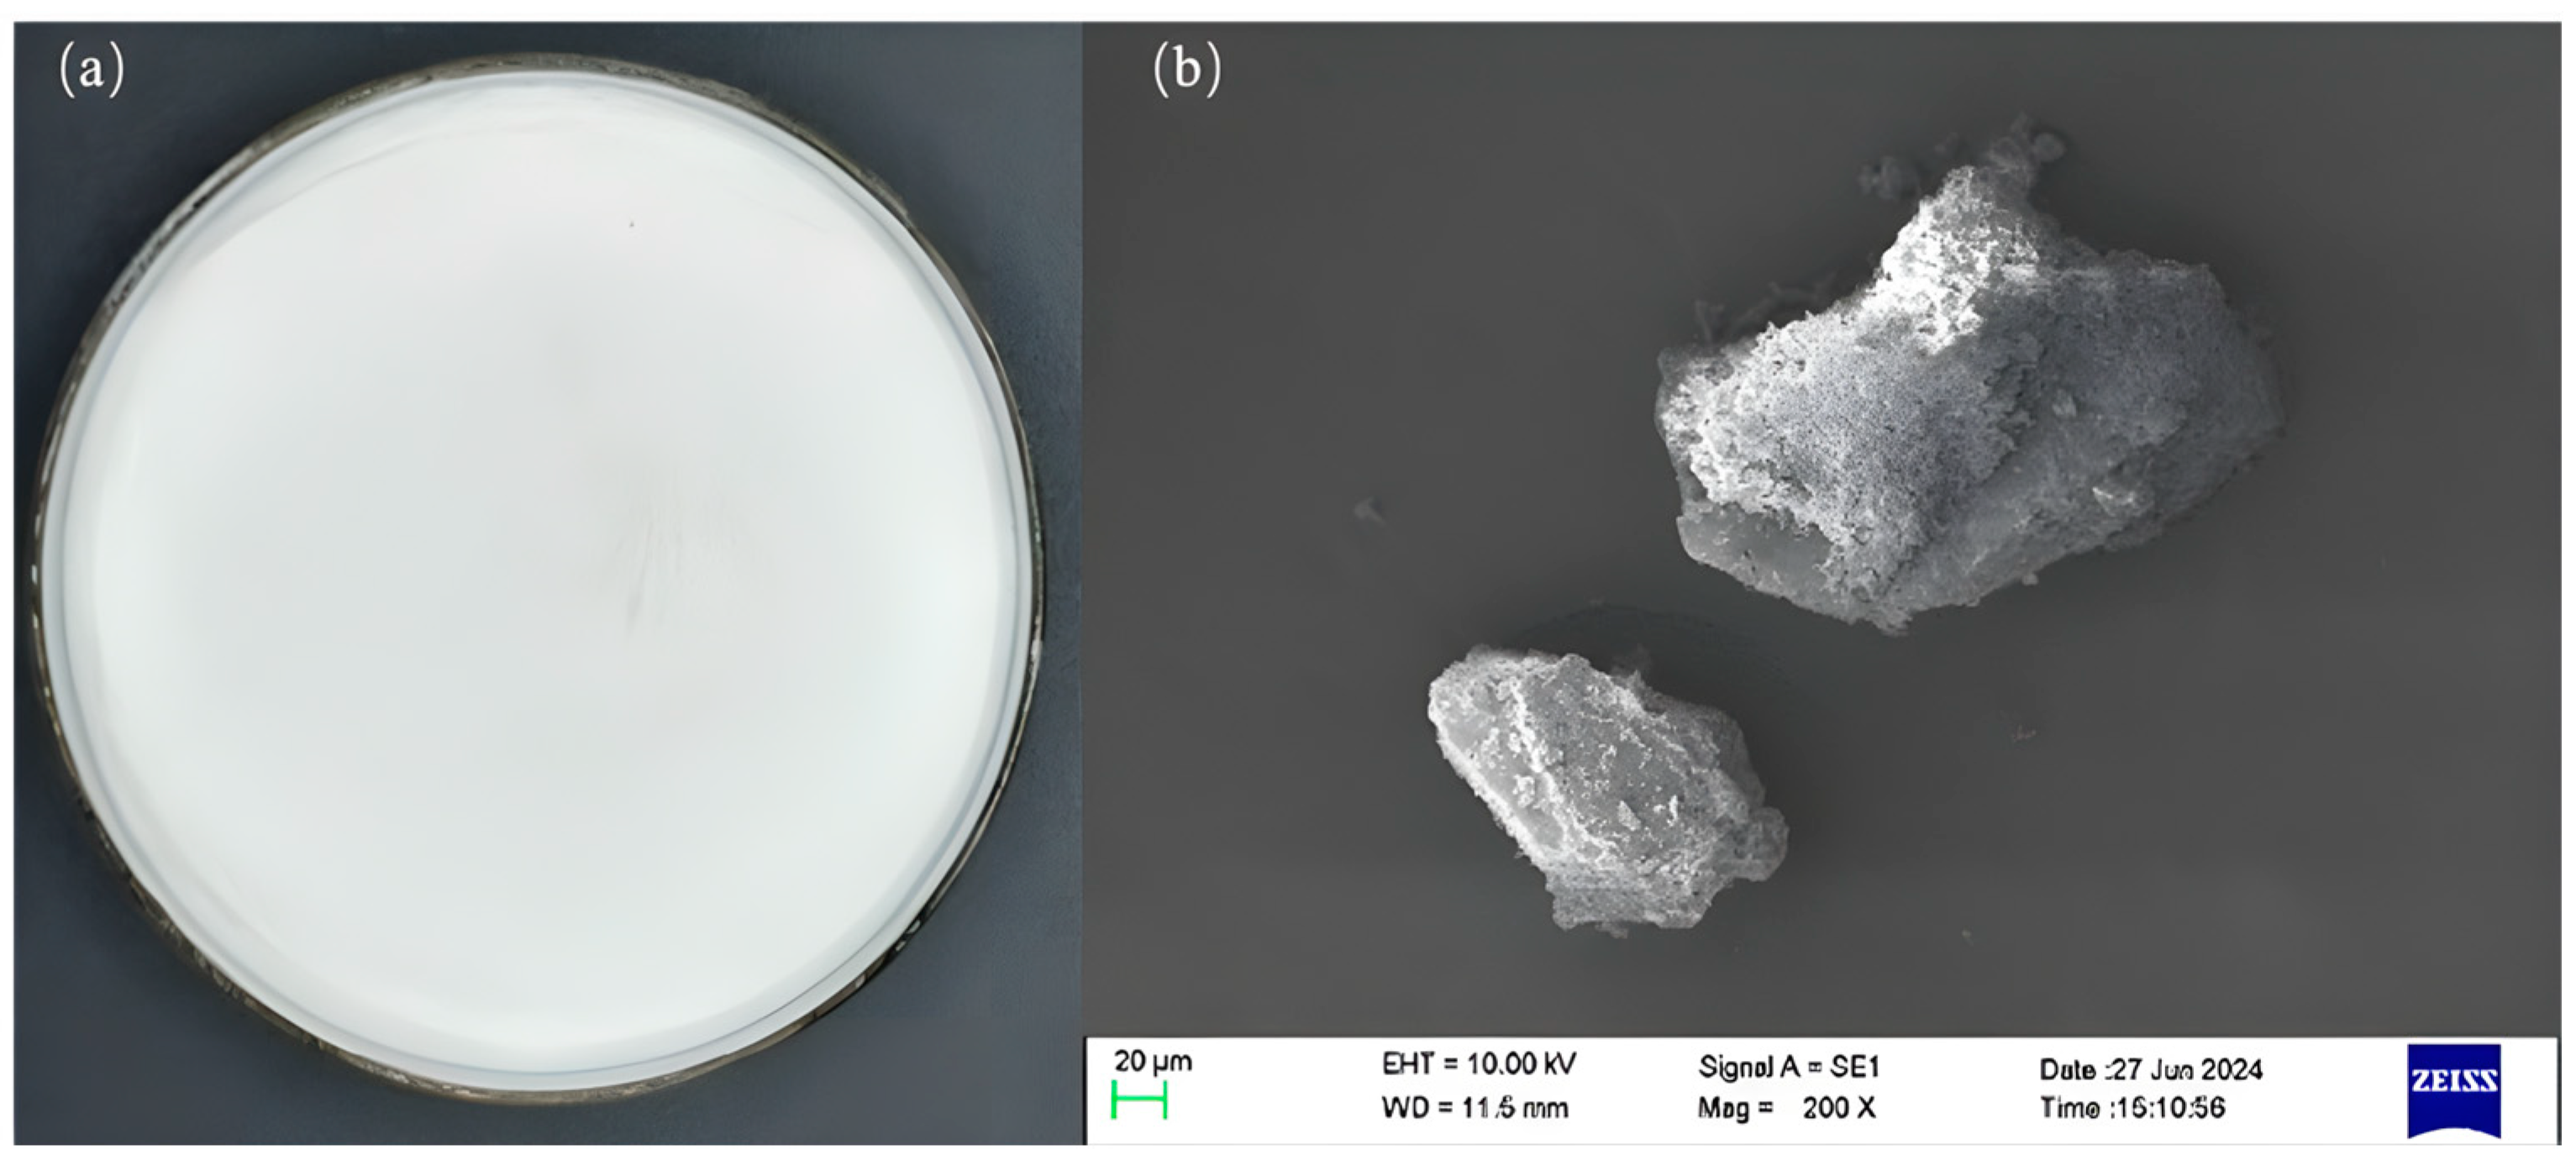
The prepared tea tree oil microcapsules had an opaque, milky-white appearance (Figure 2a). The microcapsule particles varied in size and had irregular shapes, with raised granules on the surface. The microcapsules also emitted a noticeable tea tree oil aroma.
The microcapsules exhibited a smooth, block-like crystalline structure at the base, with irregularly shaped granules of varying sizes covering the surface (Figure 2b). No cavities or cracks were observed, indicating excellent structural integrity.

3.2.2. Slow-Release Analysis of Tea Tree Oil Microcapsules

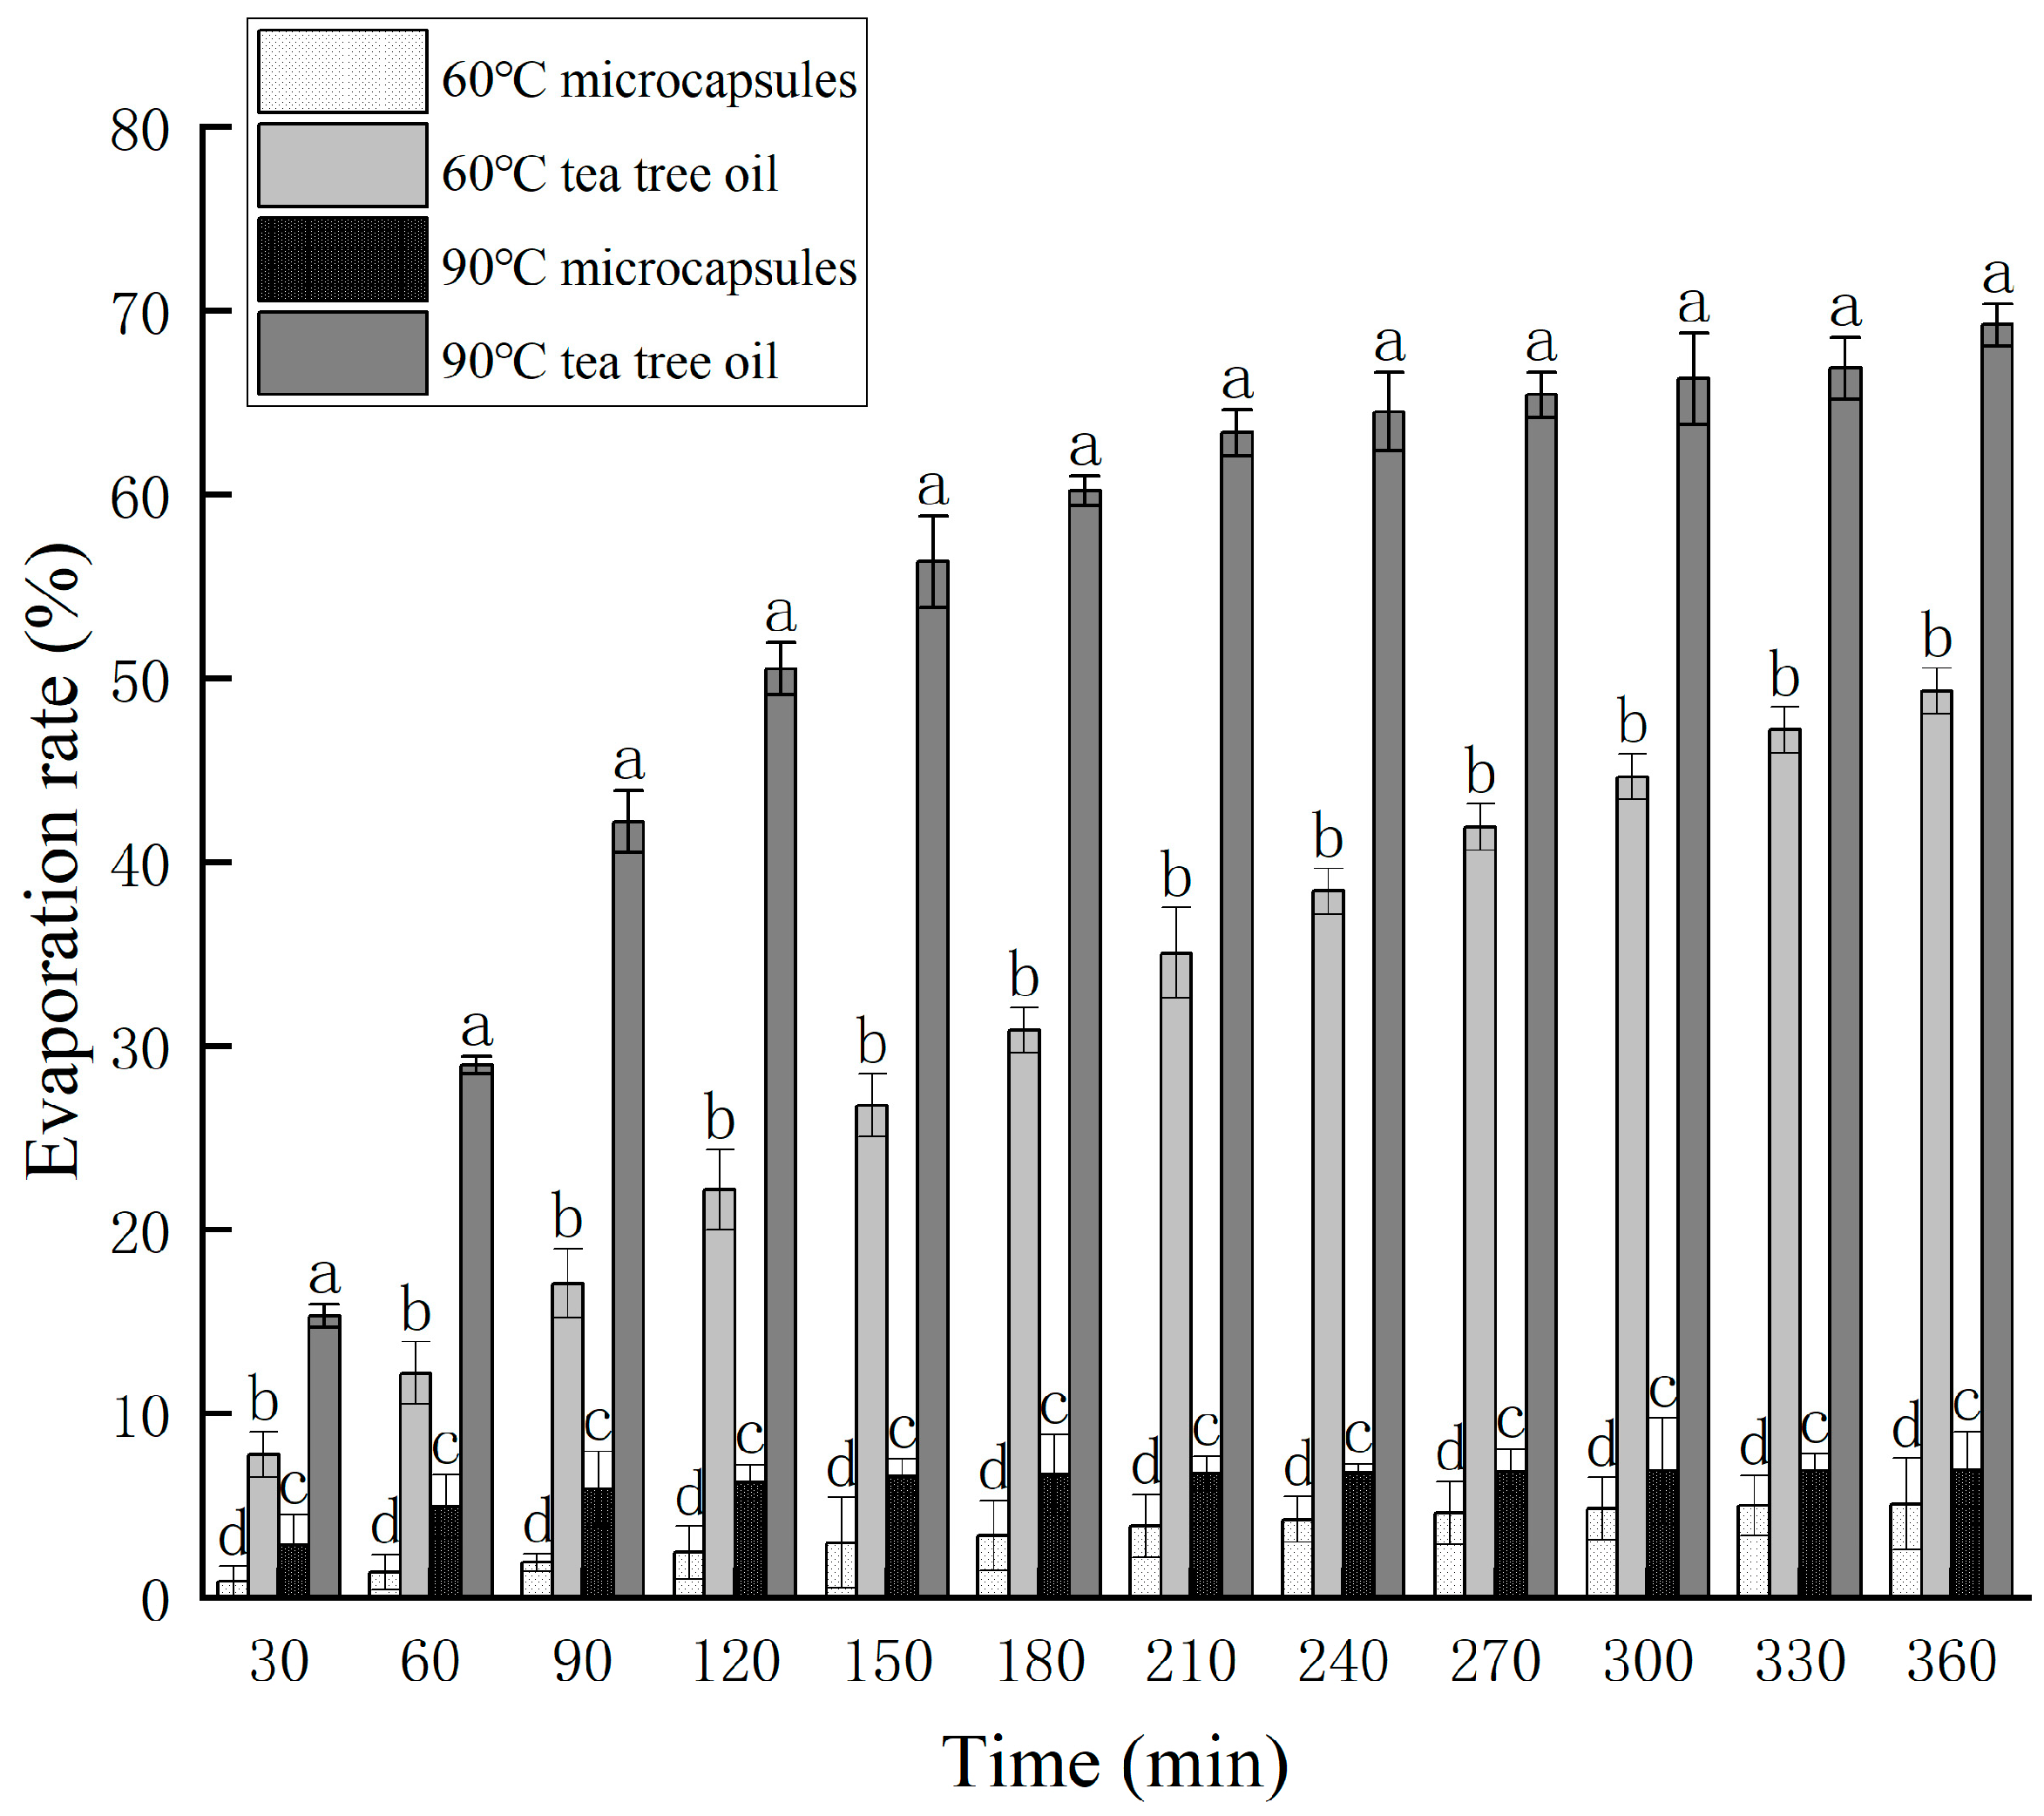
The slow release of the microcapsules was evaluated by measuring the evaporation rate of the tea tree oil. Figure 3 presents the slow-release profiles of tea tree oil microcapsules and pure tea tree oil at 60 °C and 90 °C. At both 60 °C and 90 °C, the evaporation rate of the tea tree oil microcapsules was significantly lower than that of pure tea tree oil (p < 0.05). This finding verified that the tea tree oil microcapsules prepared with β-cyclodextrin and nano-montmorillonite delayed the release of tea tree oil at high temperatures.

3.2.3. Component Analysis of Tea Tree Oil Microcapsules

Tea tree oil has a complex chemical composition that primarily consists of terpinen-4-ol, 1,8-cineole, α-pinene, and γ-terpinene. Terpinen-4-ol and 1,8-cineole have notable antimicrobial and anti-inflammatory properties [25]. The primary components of tea tree oil identified in this study were terpinen-4-ol, p-cymene, terpinolene, 1,8-cineole, 3-carene, terpinene, α-pinene, α-terpineol, and γ-terpinene (Table 4), which are consistent with those reported in the literature [9]. The composition of the tea tree oil microcapsules closely matched that of the pure tea tree oil, although the concentrations of each component in the microcapsules except (+)-Limonene were slightly lower (p > 0.05). This result indicates that the tea tree oil microcapsules developed in this study effectively preserved the essential components of tea tree oil.

3.3. Effects of Tea Tree Oil Microcapsules on Preservation of Strawberries

3.3.1. Effects of Tea Tree Oil Microcapsules on Appearance, Weight Loss Rate, and Decay Index of Strawberries

The color of the strawberries on day 6 of refrigerated storage slightly deepened compared with before storage, but their overall appearance remained largely unchanged (Figure 4). By day 12, the strawberries in the CK and the group of 10 g microcapsules per box exhibited skin shrinkage and a further deepening of color, with slight signs of decay. By contrast, the strawberries in the three microcapsule-treated groups exhibited less decay. By day 18, the strawberries in the CK and the groups of 2.5 g, 7.5 g, and 10 g microcapsules per box exhibited enlarged decay spots and more severe rotting, with the calyx in the CK and the group of 5.0 g microcapsules per box exhibiting considerable shrinkage and yellowing. By contrast, the strawberries in the group (5.0 g per box) remained plump and exhibited the least decay, indicating that the treatment of 5.0 g per box exerted the optimal preservative effects.
The decay index is a key indicator for assessing the freshness of strawberries. The decay index values of the strawberries evaluated in this study gradually increased over time, with a sharper increase observed during the later stages of storage (Figure 5). In the early stages of storage, the CK group consistently had a higher decay index value than the treatment groups. In the later storage stages, the decay index value of the treatment of 10.0 g per box gradually increased and approximated that of the CK group (p > 0.05). By Day 18, the decay index value of the CK group was 26.1%, and that of the group (10.0 g per box) was 27.4%. The (5.0 g per box) group had the lowest decay index value at 20.0%, significantly lower than those of the other groups (p < 0.05). Therefore, applying suitable quantities of tea tree oil microcapsules inhibited the decay of strawberries, whereas excessive quantities of tea tree oil microcapsules accelerated decay. The treatment of 5.0 g per box most effectively inhibited decay in the refrigerated strawberries.
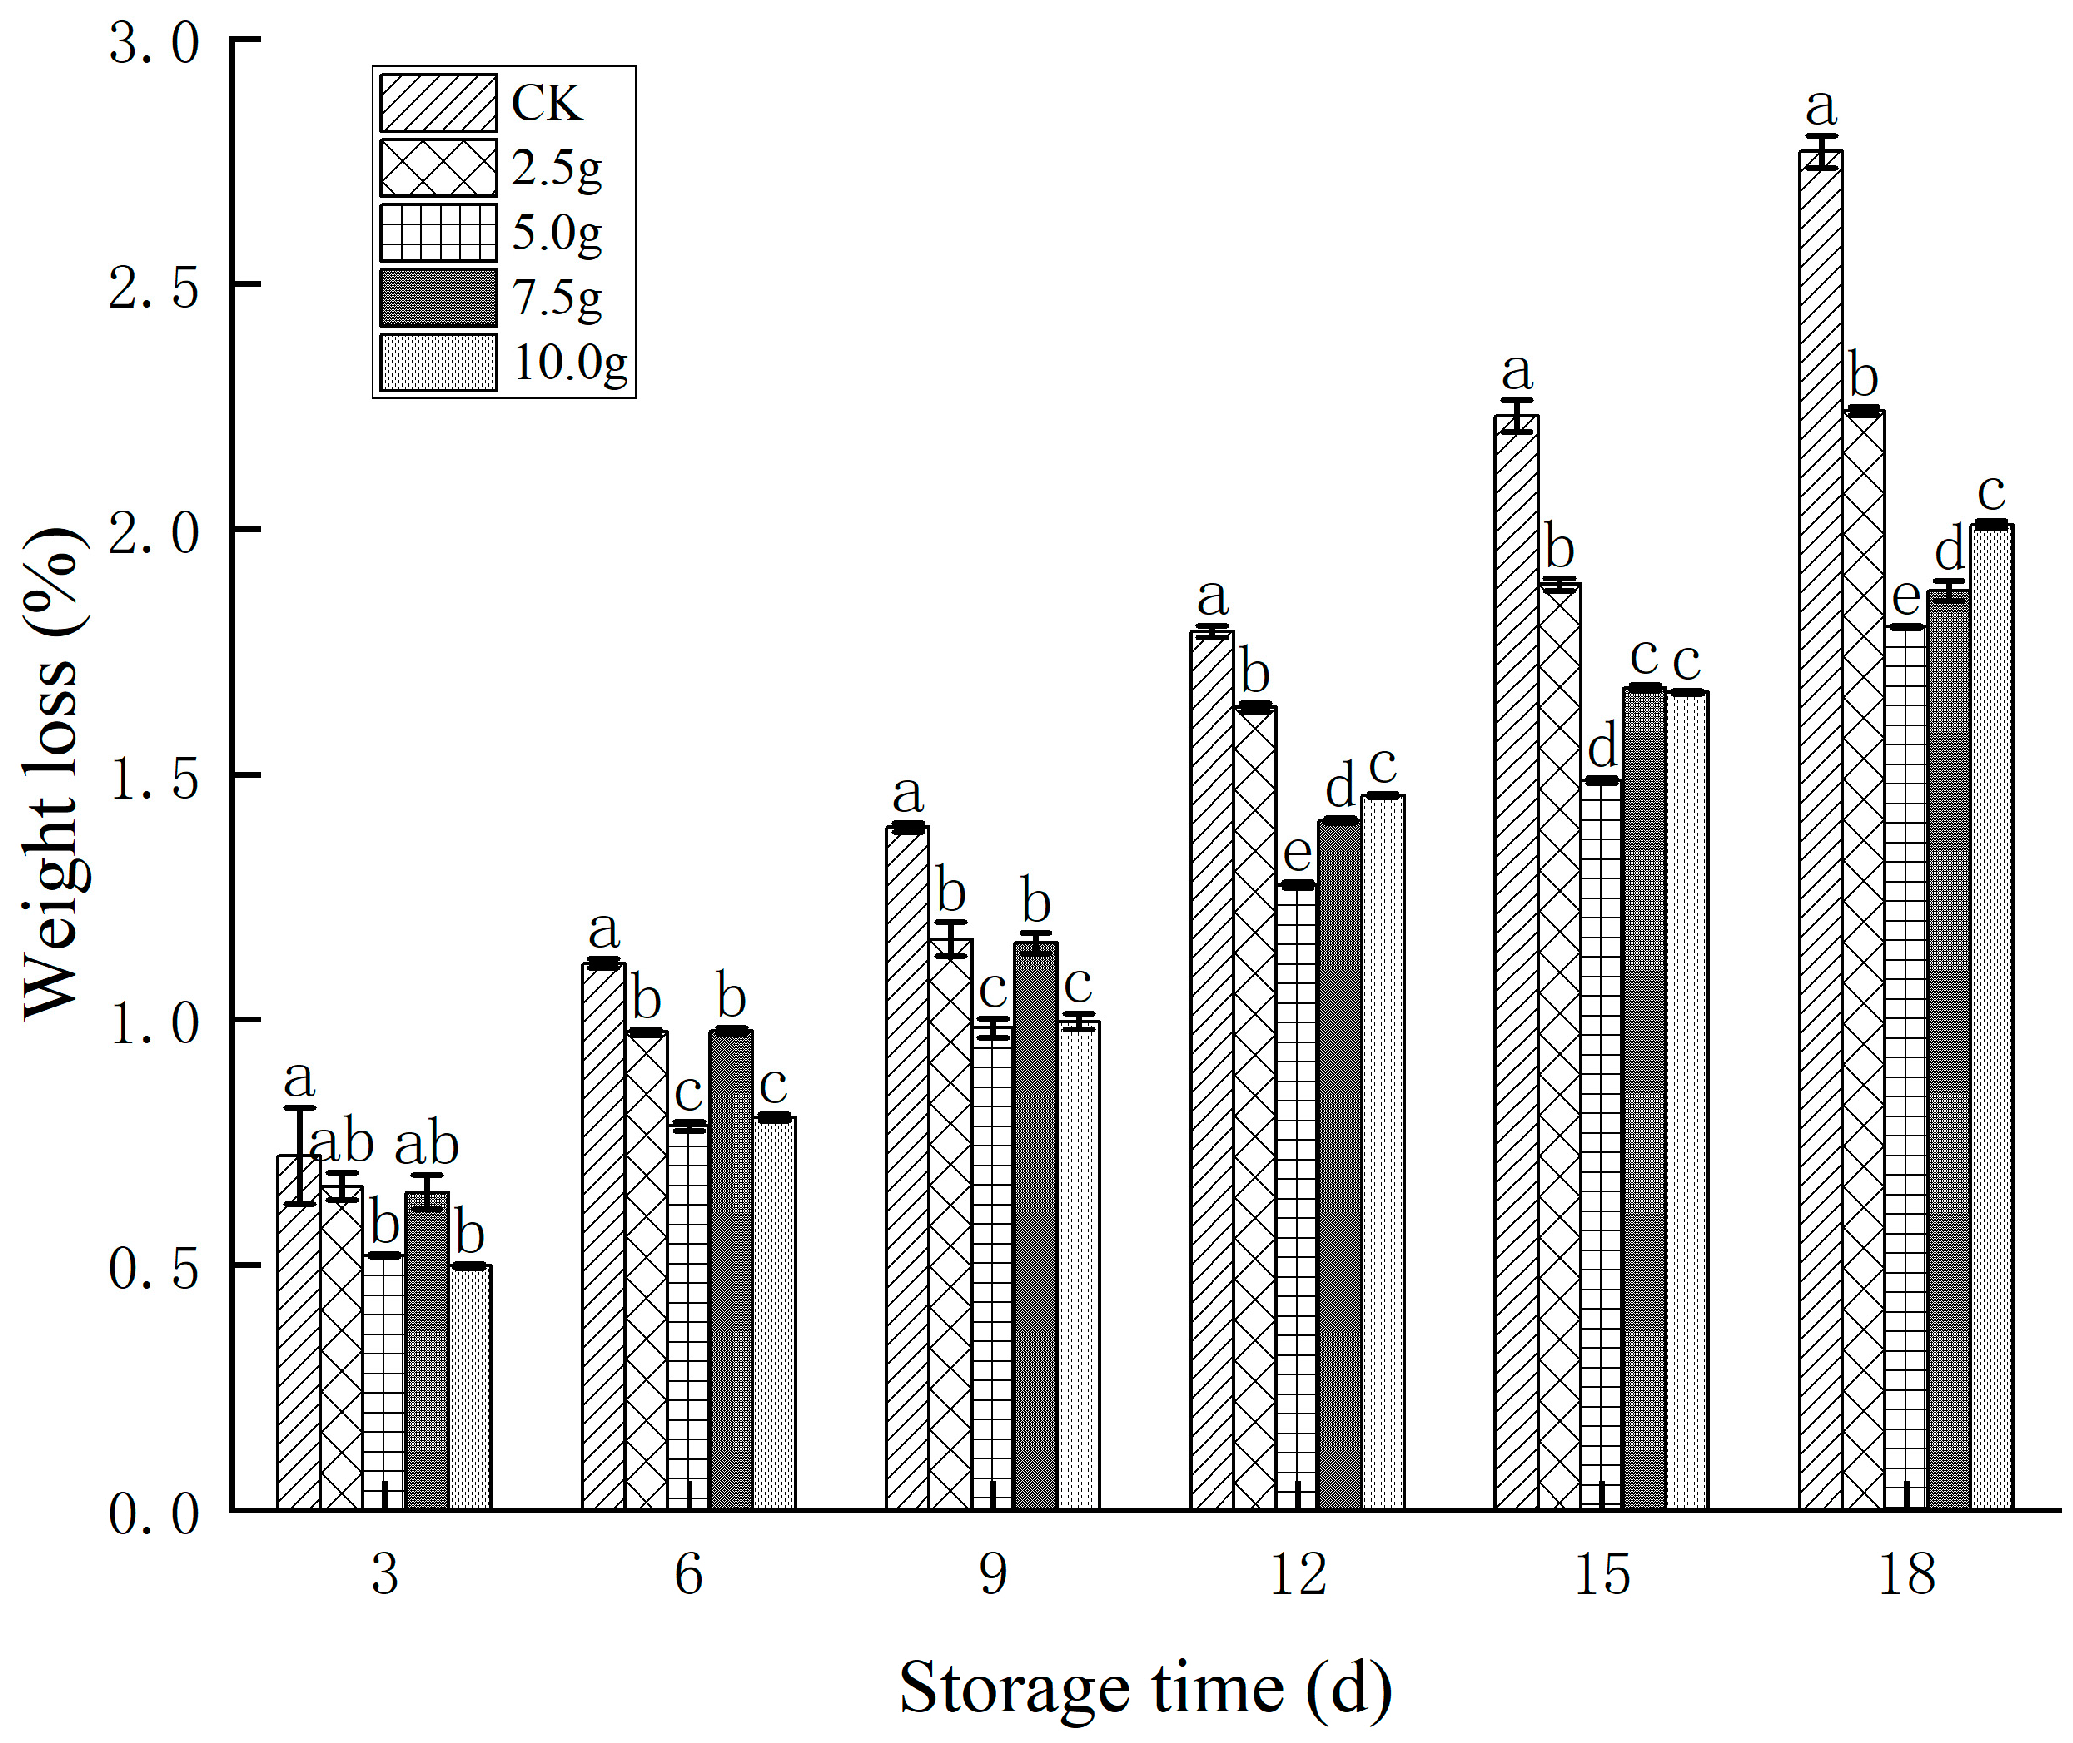
The weight loss rate is another crucial indicator for evaluating the quality of strawberries during storage. Due to respiration and transpiration, the weight loss rate of strawberries gradually increases during storage, leading to a decline in quality. The weight loss rate of the strawberries in the present study increased with storage time (Figure 6). Additionally, at each storage period, the CK group exhibited the highest weight loss rate. In the later storage stages, the group of 5.0 g microcapsules per box exhibited the lowest (and therefore optimal) weight loss rate.

3.3.2. Effects of Tea Tree Oil Microcapsules on Color and Firmness of Strawberries

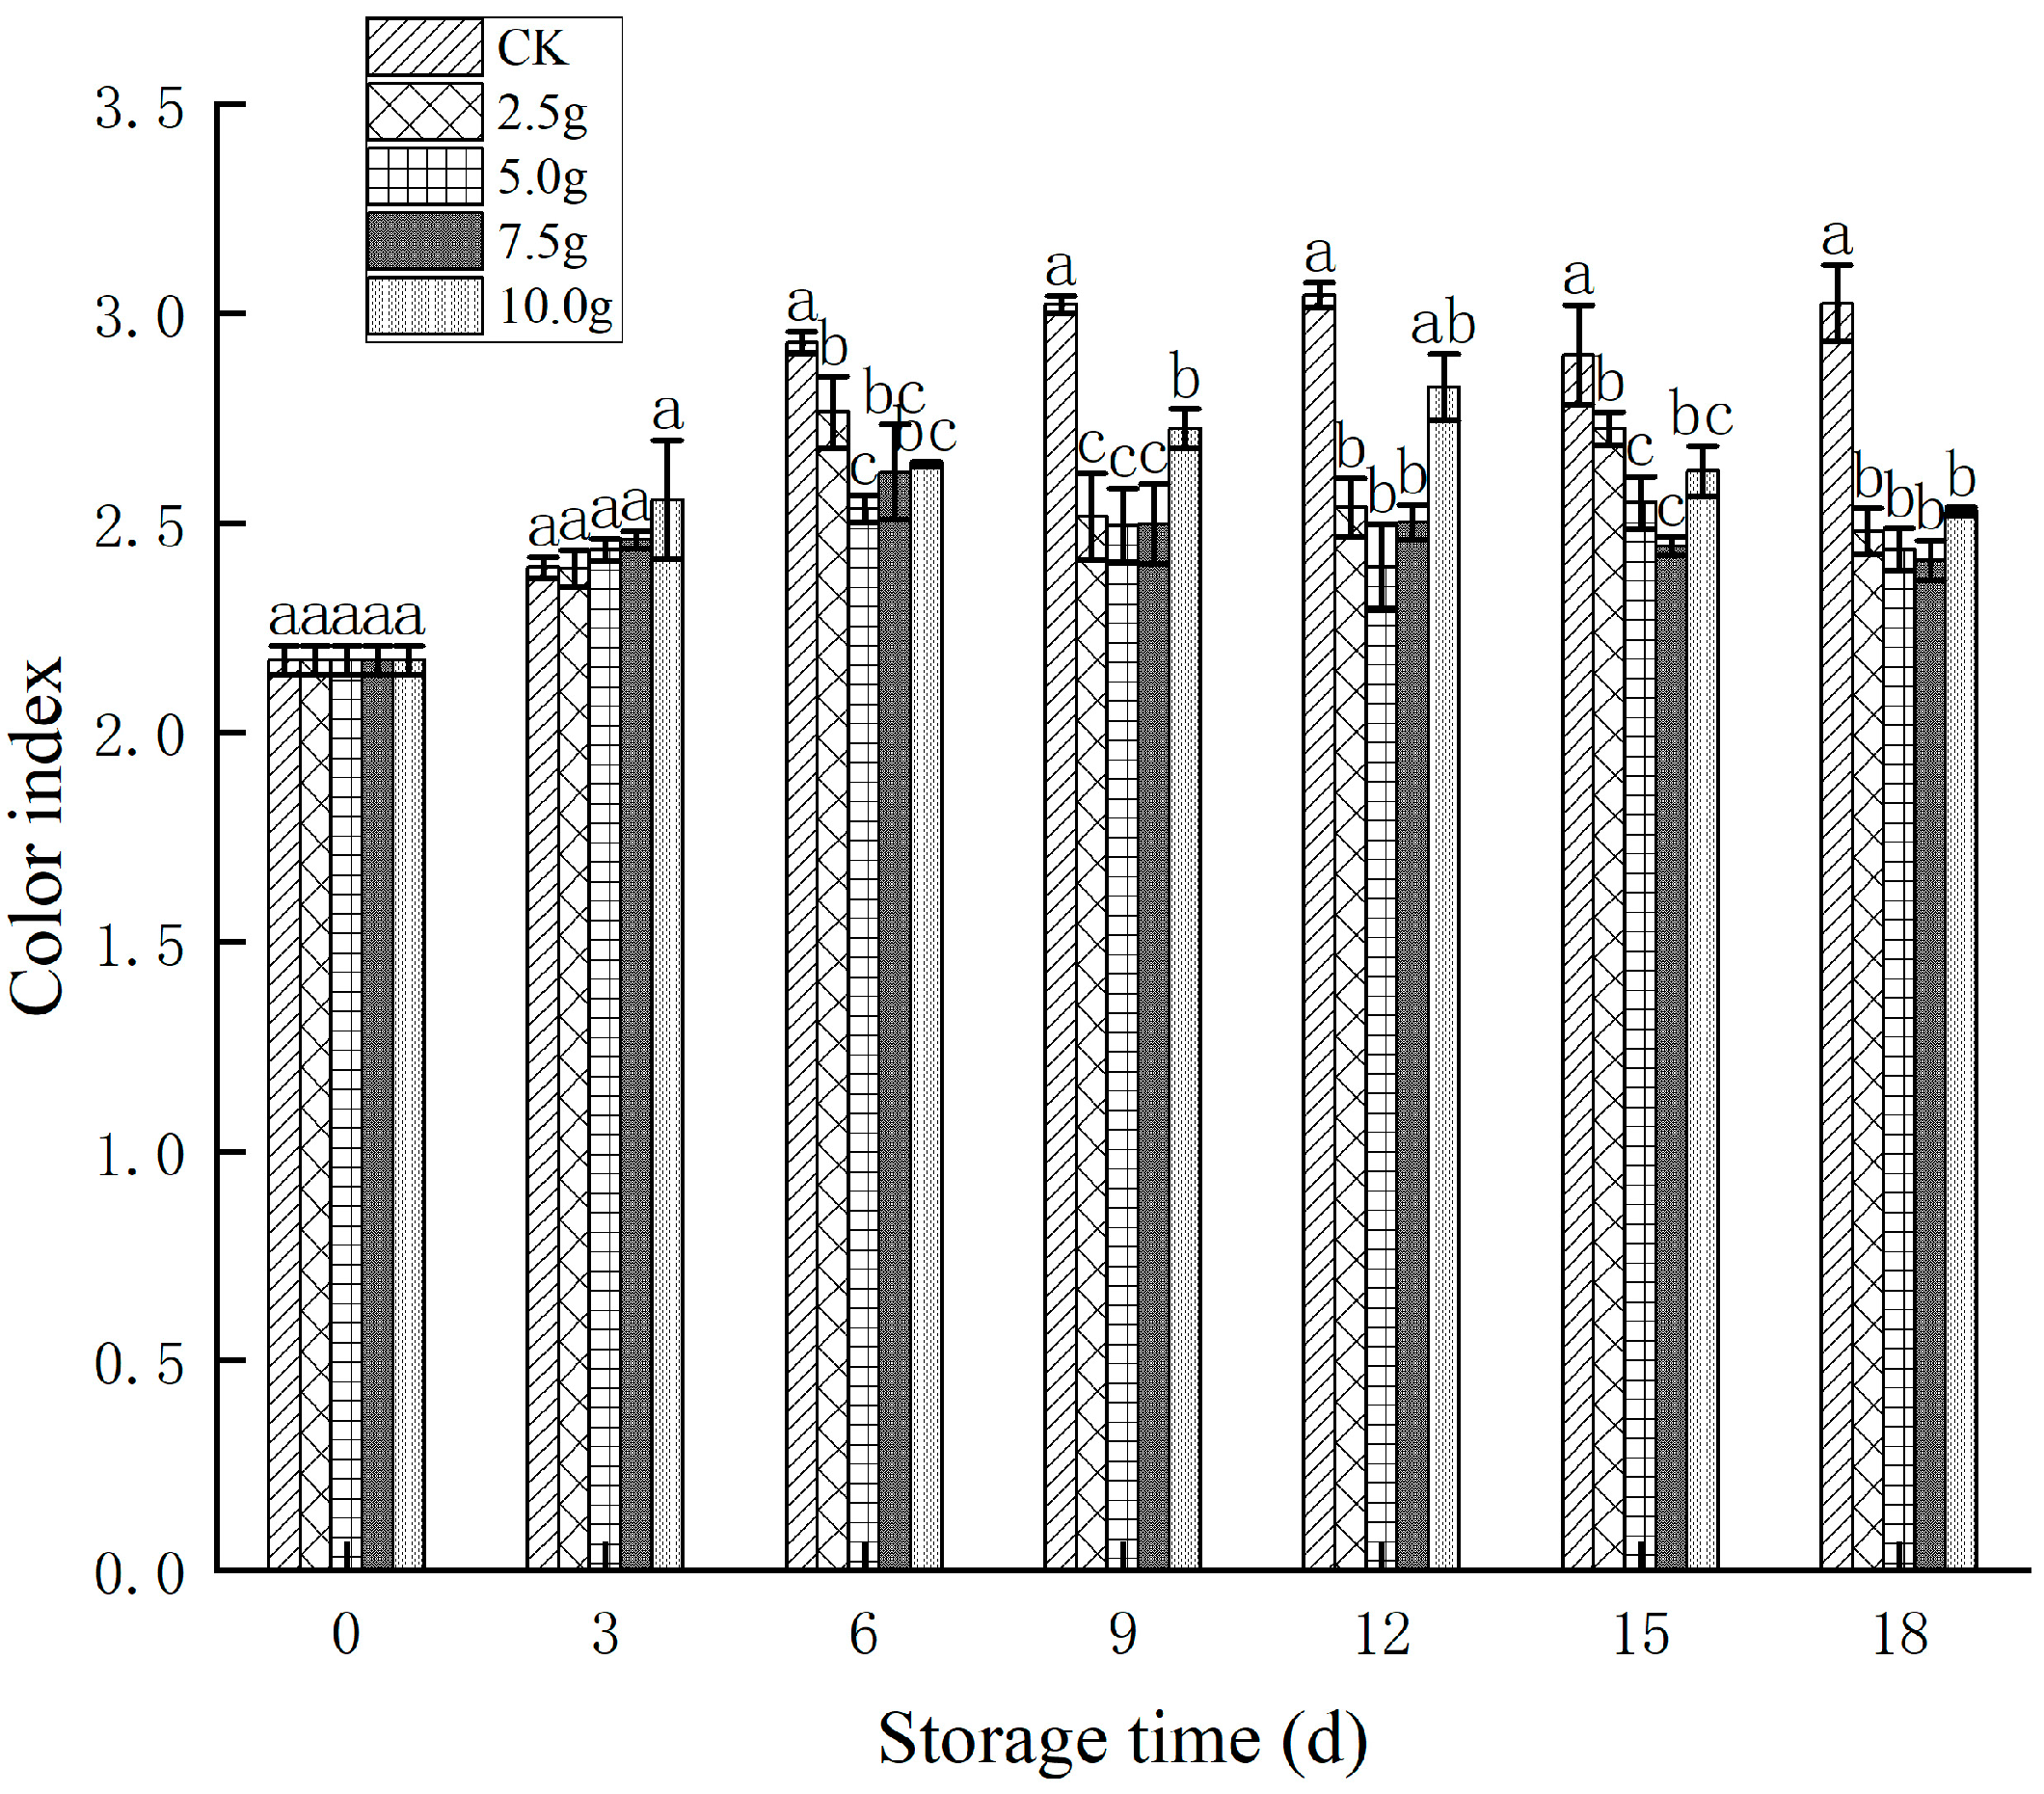
The color index is a key indicator for assessing the maturity and quality of strawberries. A high color index value corresponds to high maturity and a deep red hue [26]. The color index value of the CK group increased progressively during refrigerated storage, with the largest increase observed on day 6 (Figure 7). Throughout the storage period, the color index value of the CK group was significantly higher than that of the treatment groups (p < 0.05). Additionally, except on day 18, the 10.0 g group had a noticeably higher color index value than the other treatment groups. By contrast, the 5.0 g group exhibited the lowest color index value, indicating that the tea tree oil microcapsules delayed color changes most effectively in the strawberries.
Firmness is an essential indicator of the storability and quality of strawberries. During storage, the breakdown of pectin by pectinase leads to softening. The firmness of the strawberries declined gradually throughout the refrigeration period, with the CK group exhibiting the largest decline (Figure 8). During the first 6 days of storage, the decline in firmness for both the CK group and the treatment groups was slow, with no significant differences observed between groups. As the storage time progressed, the difference between the CK group and the treatment groups became significant. By Day 18, the firmness of the CK group had decreased by 36.5%. By contrast, the strawberries treated with tea tree oil microcapsules exhibited a slower decline in firmness, and nonsignificant differences were observed between the treatment groups. This finding indicates that the tea tree oil microcapsules maintained strawberry firmness.

3.3.3. Effects of Tea Tree Oil Microcapsules on Soluble Solid Content and Acidity of Strawberries

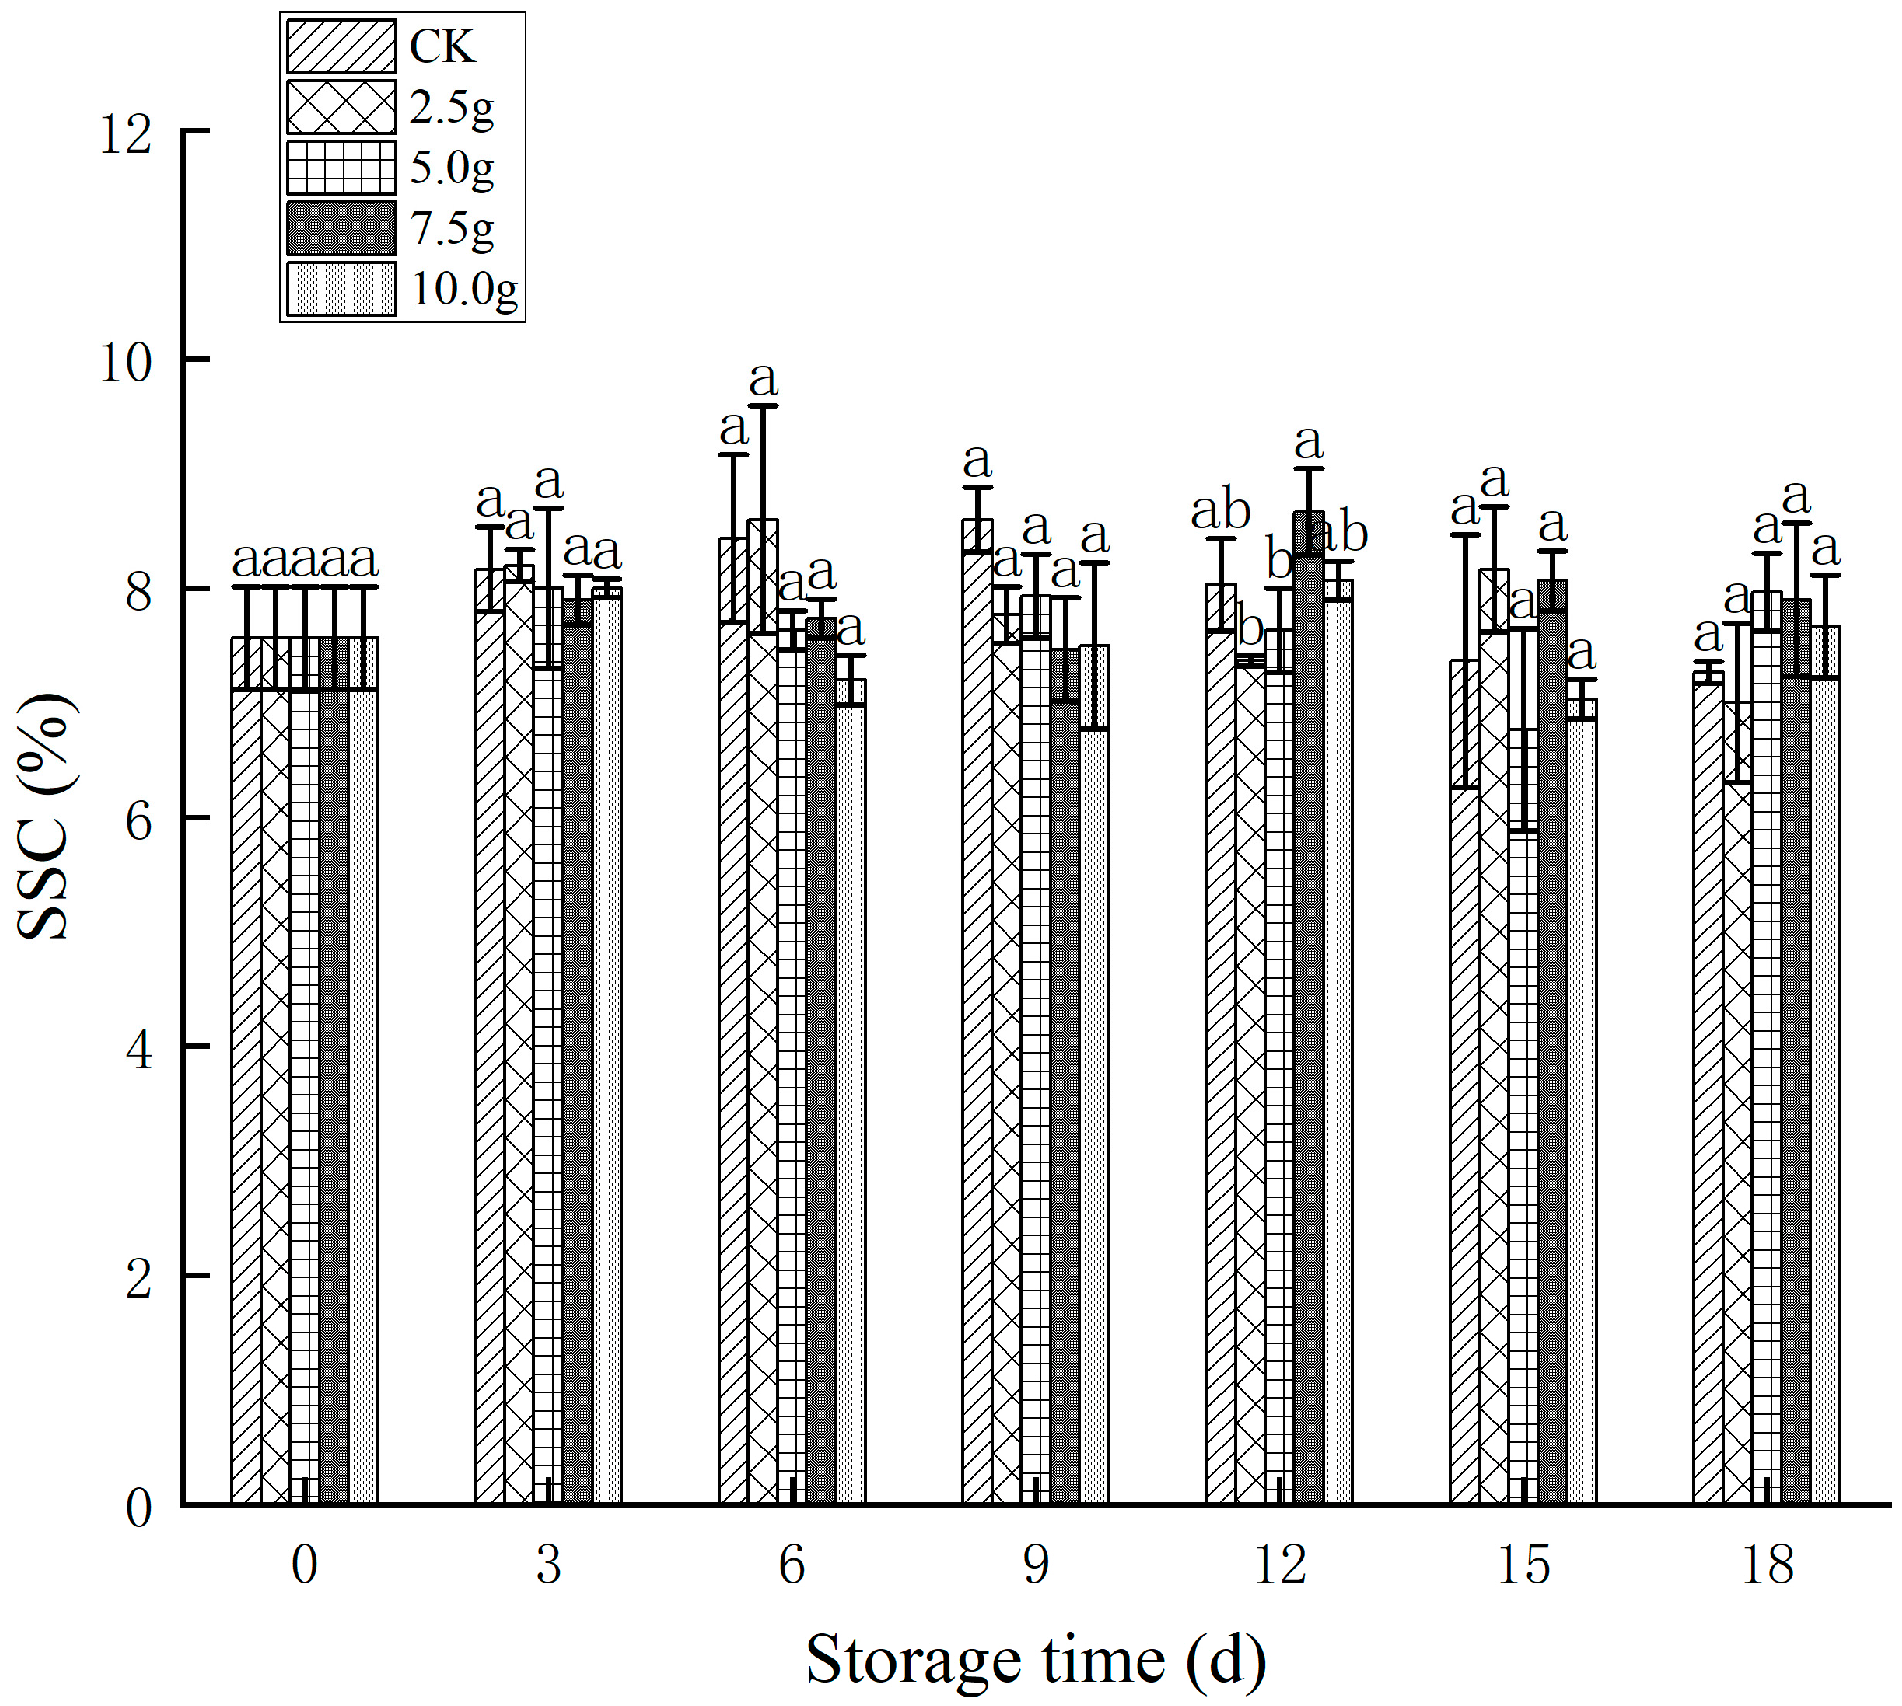
The SSC of strawberries is a crucial indicator of strawberry quality and maturity. During the early stages of storage, the water loss caused the SSC to increase. As the storage time progressed, the strawberries respired, consuming sugars as a respiratory substrate and leading to a decline in SSC and a reduction in quality (Figure 9). The peak SSC for the CK group occurred on day 9, the peak for the 2.5 g group was on day 6, the peak for the 7.5 g and 10.0 g groups was on day 12, and the peak for the 5.0 g group was on day 15. After reaching their respective peaks, the SSC of both the control and treatment groups gradually decreased. On days 15 and 18, the SSC of the CK group was lower than that of the treatment groups. This finding indicates that suitable treatment with tea tree oil microcapsules delayed the peak in SSC and maintained strawberry quality.
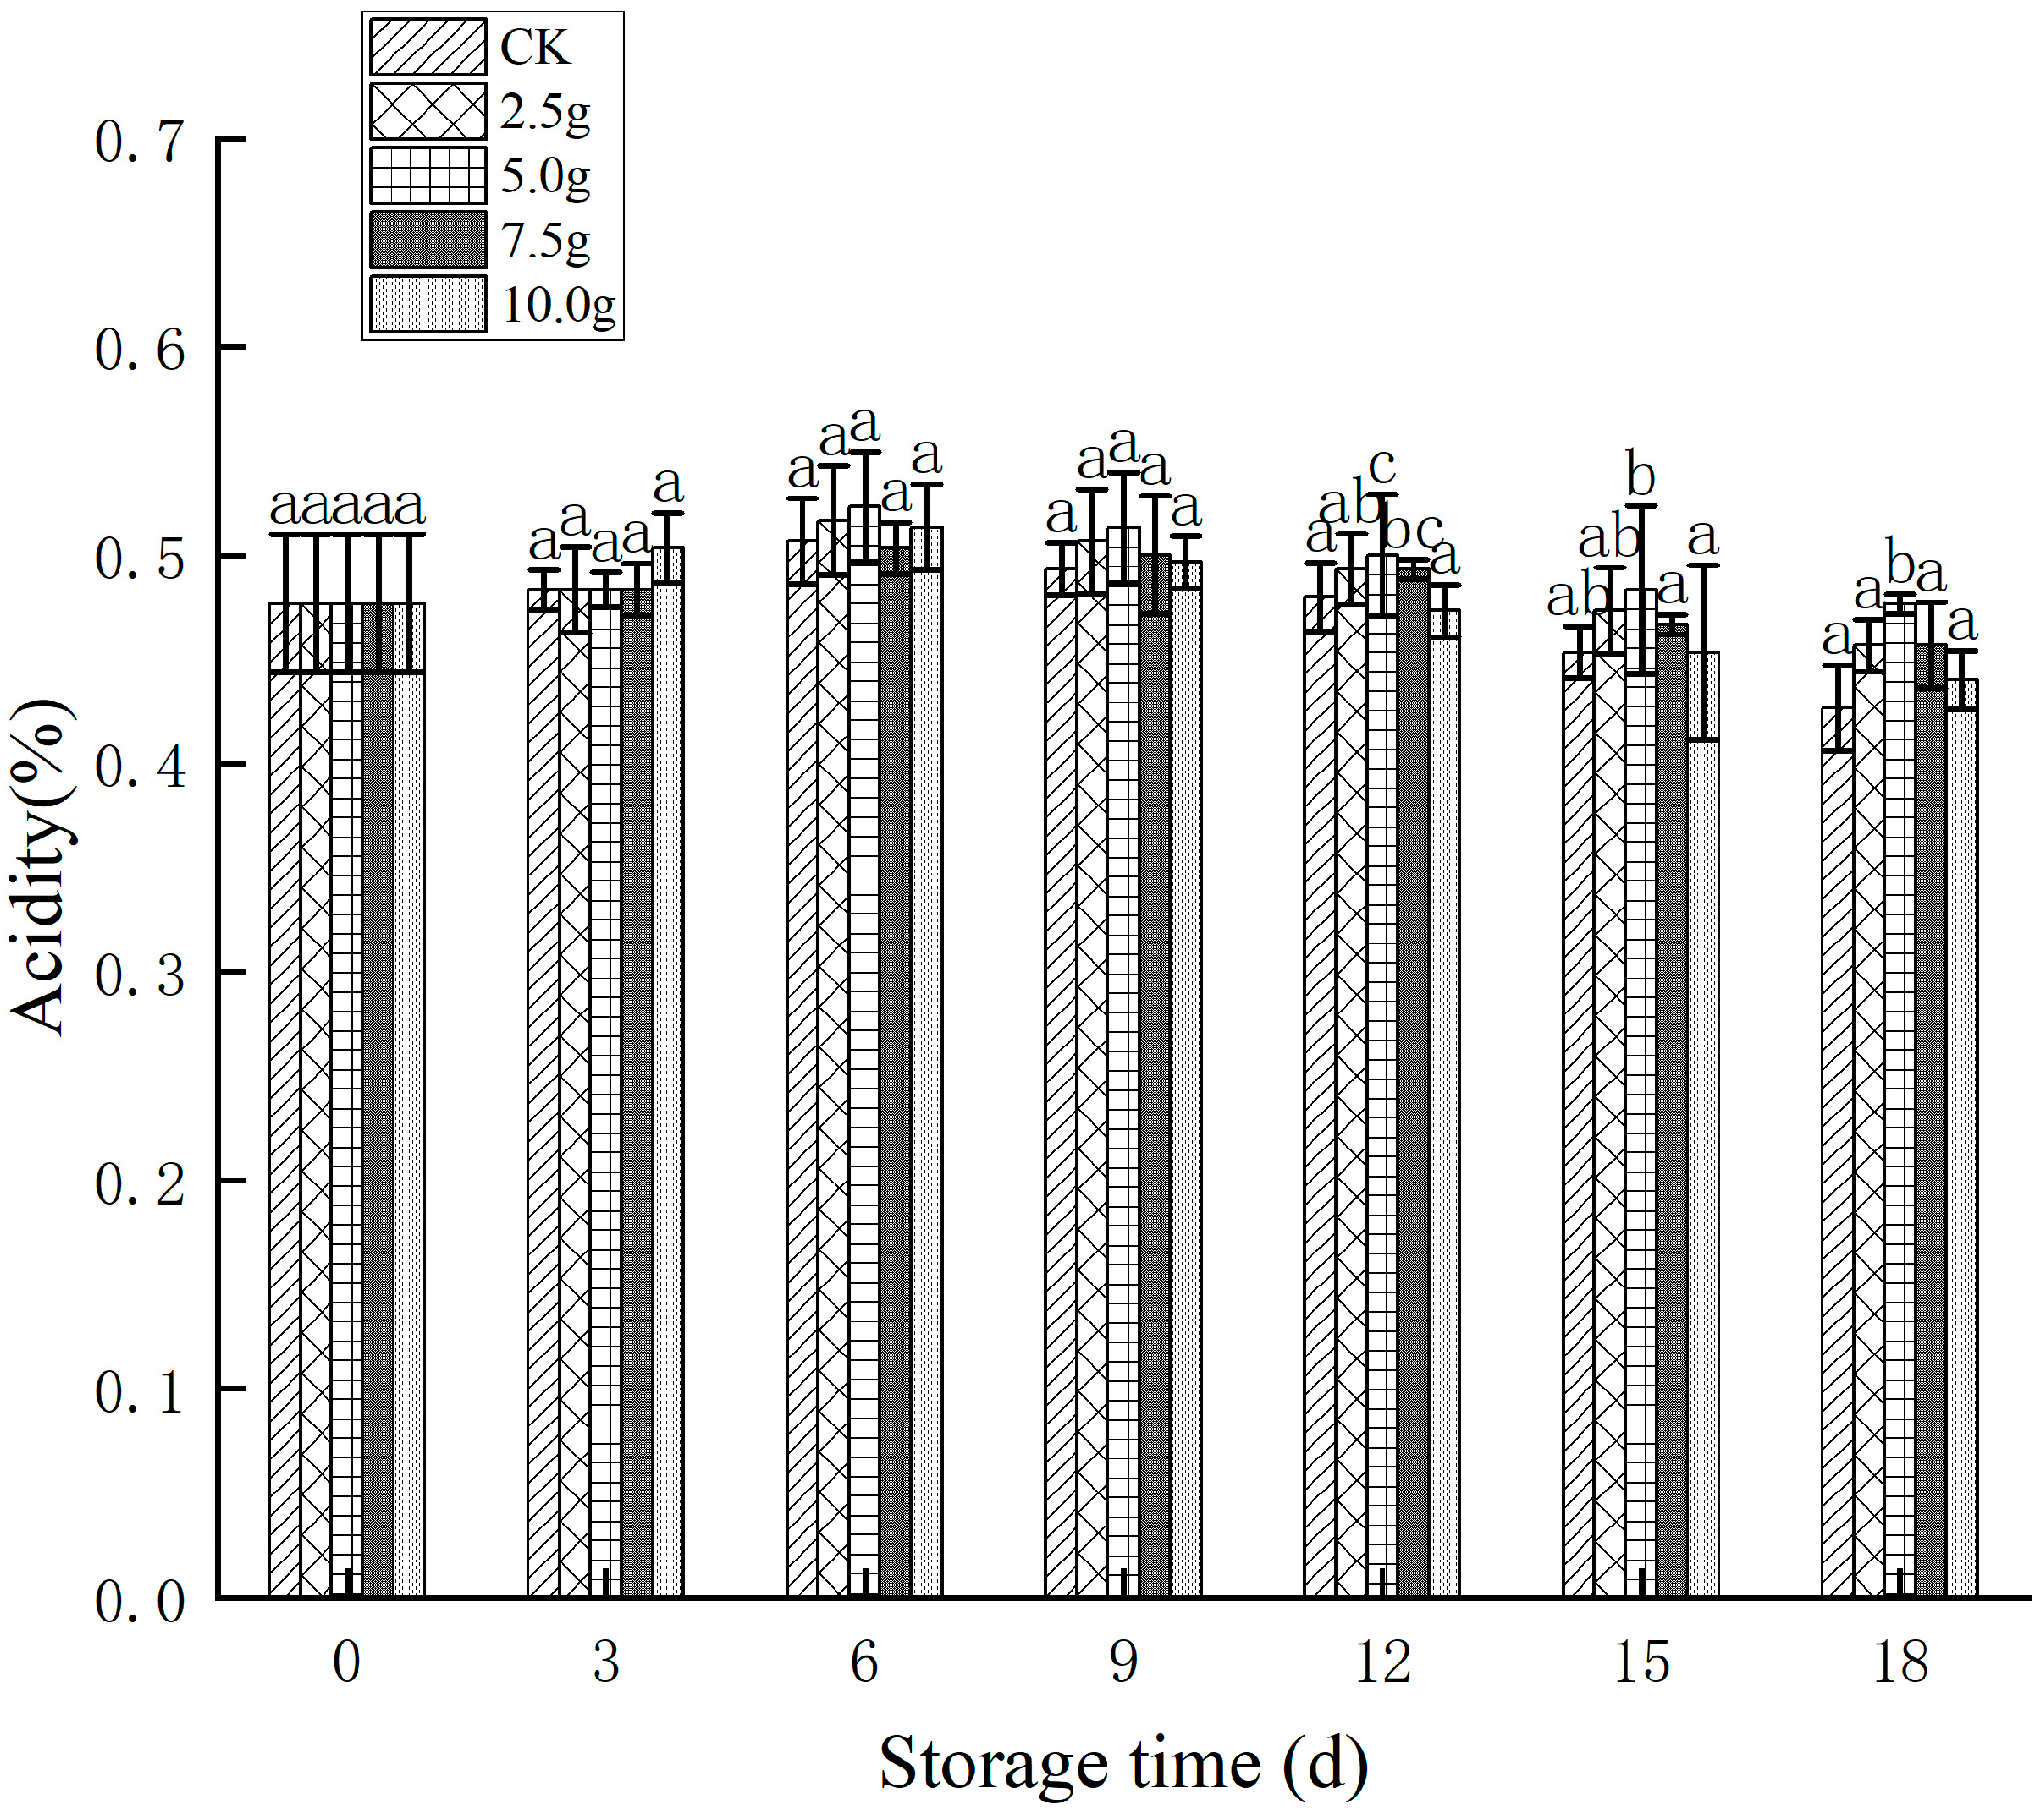
During storage, the acidity of the strawberries increased before declining. This phenomenon is attributable to moisture evaporation during the early storage period, which led to an increase in acidity. In the later stages of storage, organic acids were gradually consumed through respiration, reducing acidity. The acidity of the CK group and the treatment groups peaked on day 6 before gradually declining (Figure 10). By day 9, the difference in acidity between the CK and treatment groups was nonsignificant. However, between days 12 and 18, the acidity of the CK group was lower than that of the treatment groups. As the storage time increased, this intergroup difference increased significantly. This finding indicates that treatment with tea tree oil microcapsules reduced the consumption of organic acids in the strawberries during the later stages of storage, maintaining quality.
Overall, suitable treatment with tea tree oil microcapsules maintained the appearance and quality of strawberries, inhibited decay during storage, reduced weight loss, prevented excessive deepening of color, preserved firmness, and delayed the peak and decline in sugar content. This preservative effect is consistent with the results obtained in studies of other preservation methods, such as preharvest spraying [27], postharvest fumigation [28], and postharvest coating [29] with tea tree oil. These methods considerably inhibit the occurrence of natural diseases in strawberries and maintain their quality.

3.3.4. Effects of Tea Tree Oil Microcapsules on Anthocyanin Content of Strawberries

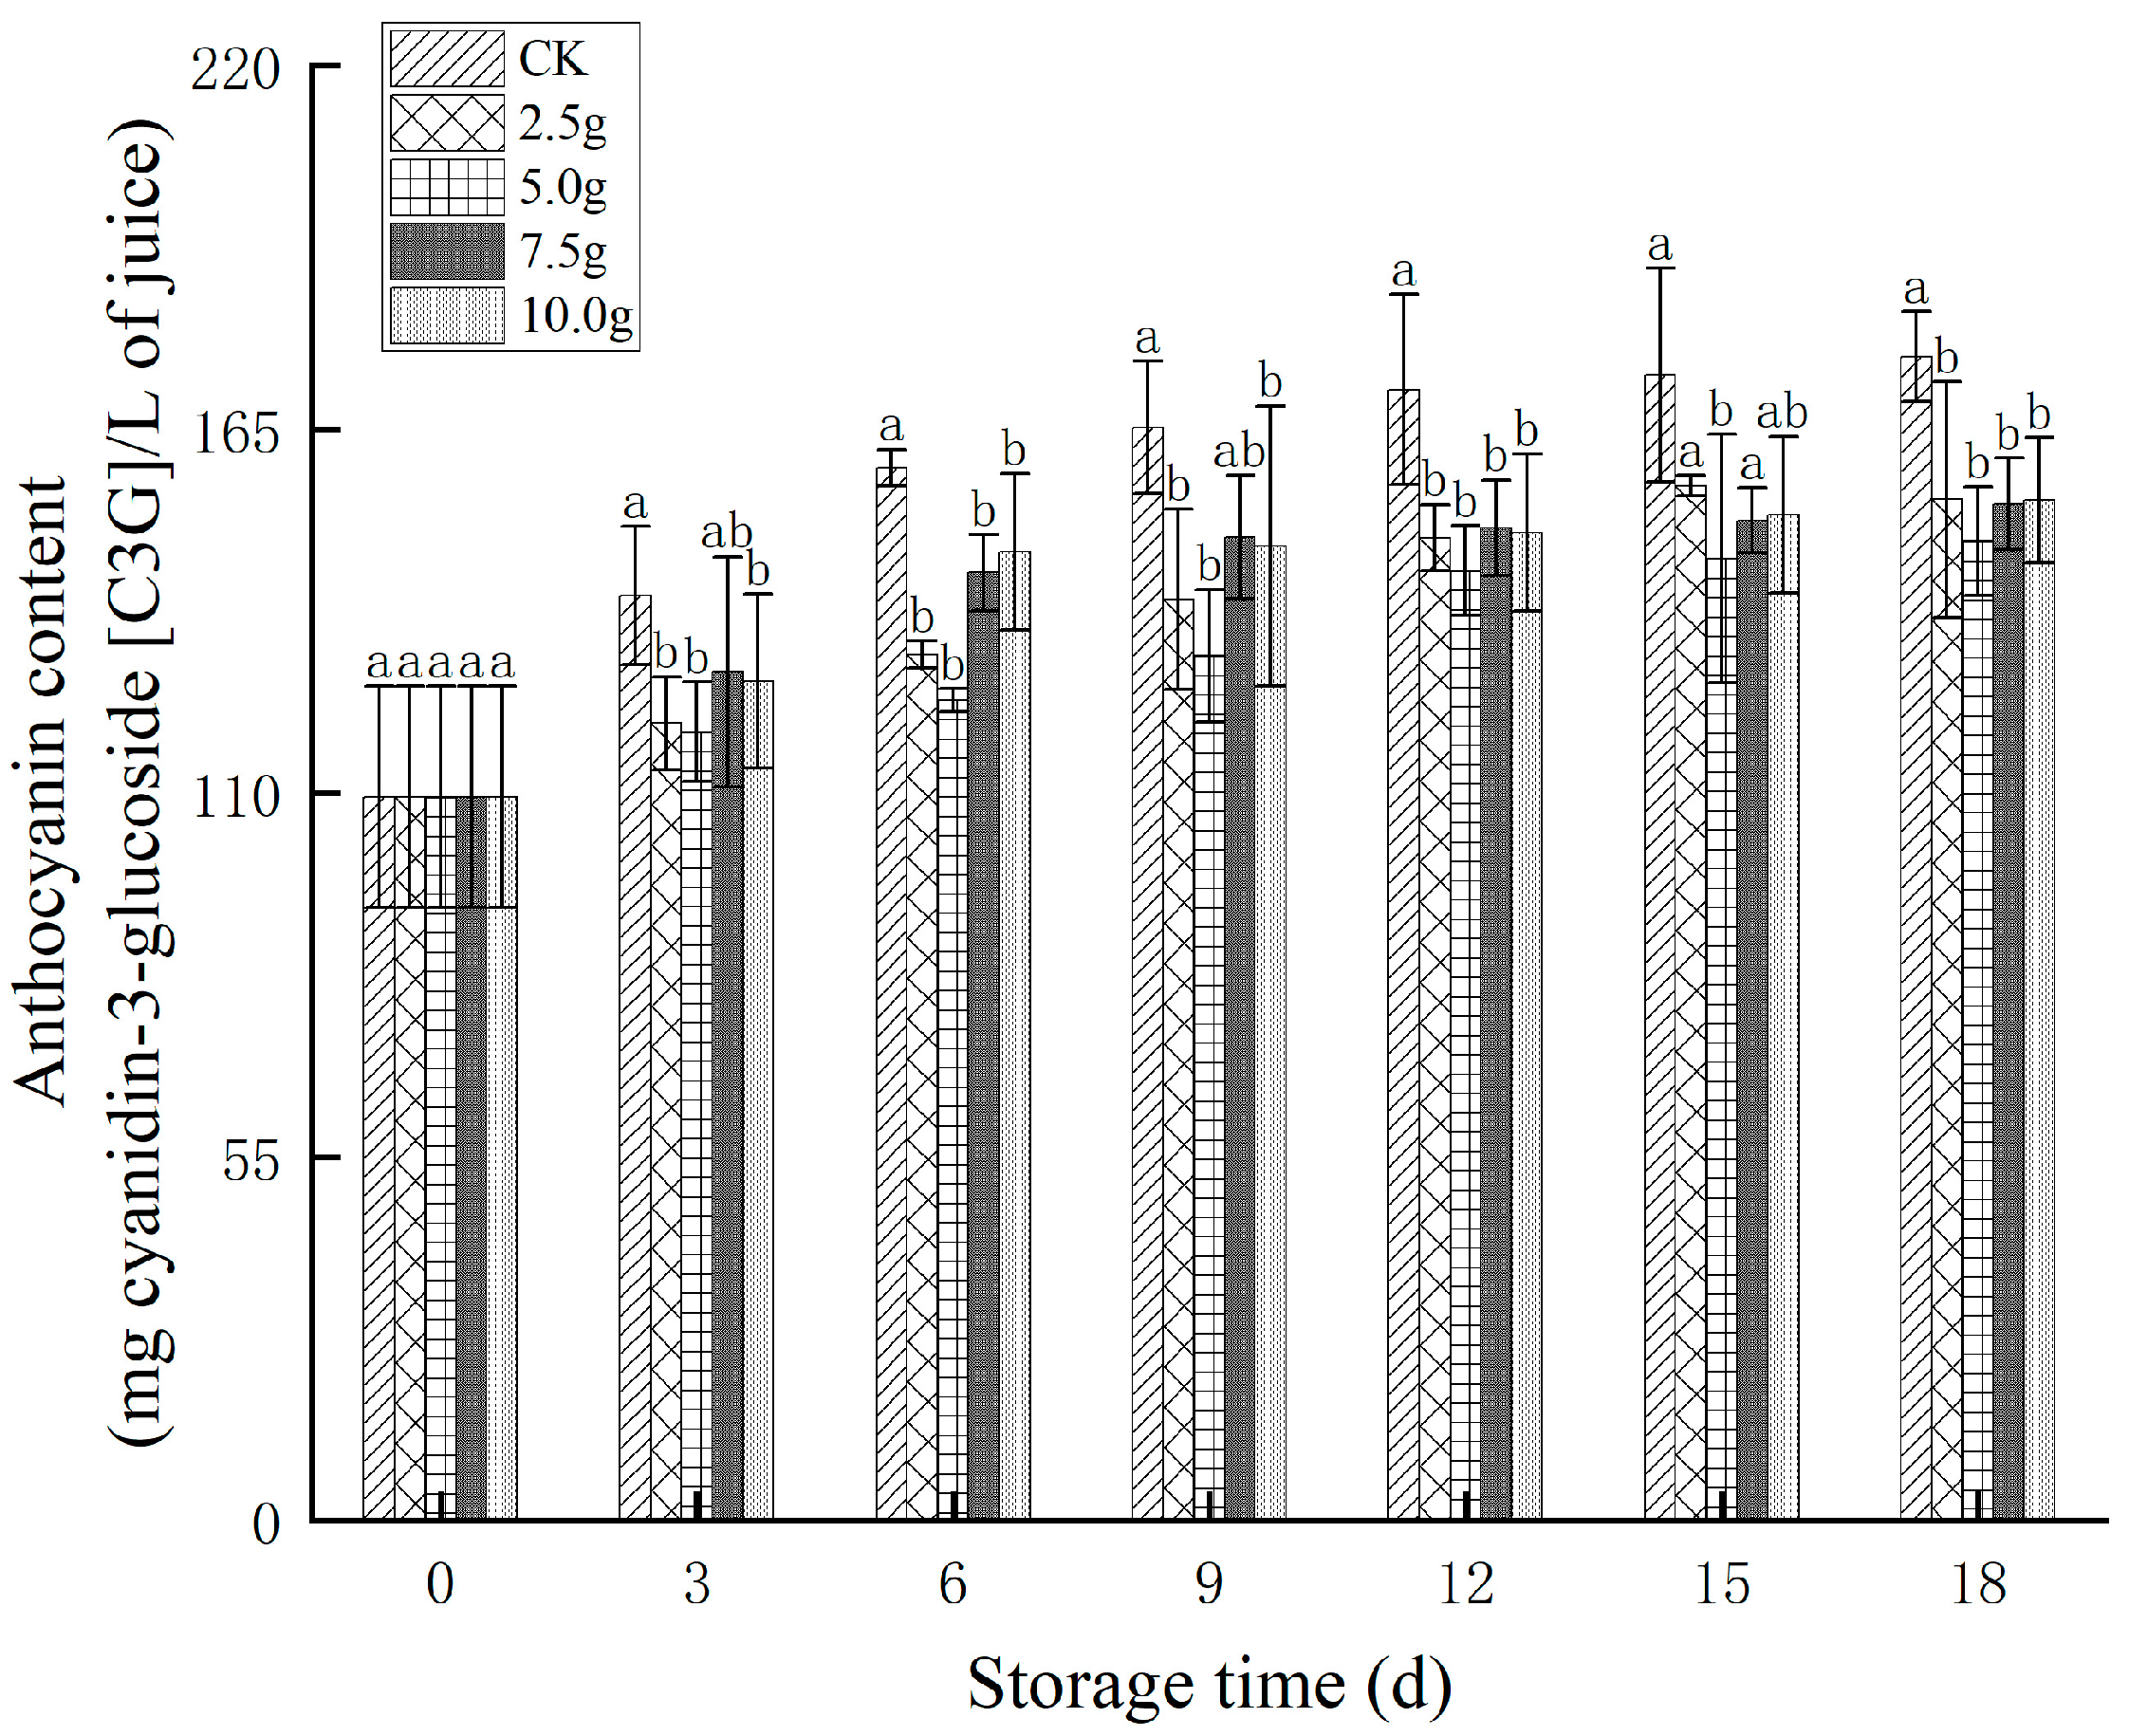
As strawberries mature, their anthocyanin content gradually increases, with higher anthocyanin levels indicating a greater degree of maturity. The anthocyanin content of the strawberries evaluated in this study increased gradually during storage (Figure 11). The rate of increase was high during the early storage period but declined between days 12 and 18; this trend was consistent with the changes observed in the color index. In the CK group, the anthocyanin content increased most substantially on day 3, whereas in the treatment groups, the most substantial increase occurred on day 6. As the storage time progressed, the anthocyanin content of the strawberries in all treatment groups increased at a slower rate. Throughout the storage period, the anthocyanin content in the treated groups was significantly lower than that in the CK group, with the 5.0 g group exhibiting the lowest anthocyanin content. This finding indicates that tea tree oil microcapsule treatment inhibited the synthesis of anthocyanins and delayed the peak in anthocyanin content, preserving the color of the strawberries during storage, with the 5.0 g treatment exerting the optimal preservative effect.

3.3.5. Effects of Tea Tree Oil Microcapsules on Antioxidant Enzyme Activity in Strawberries

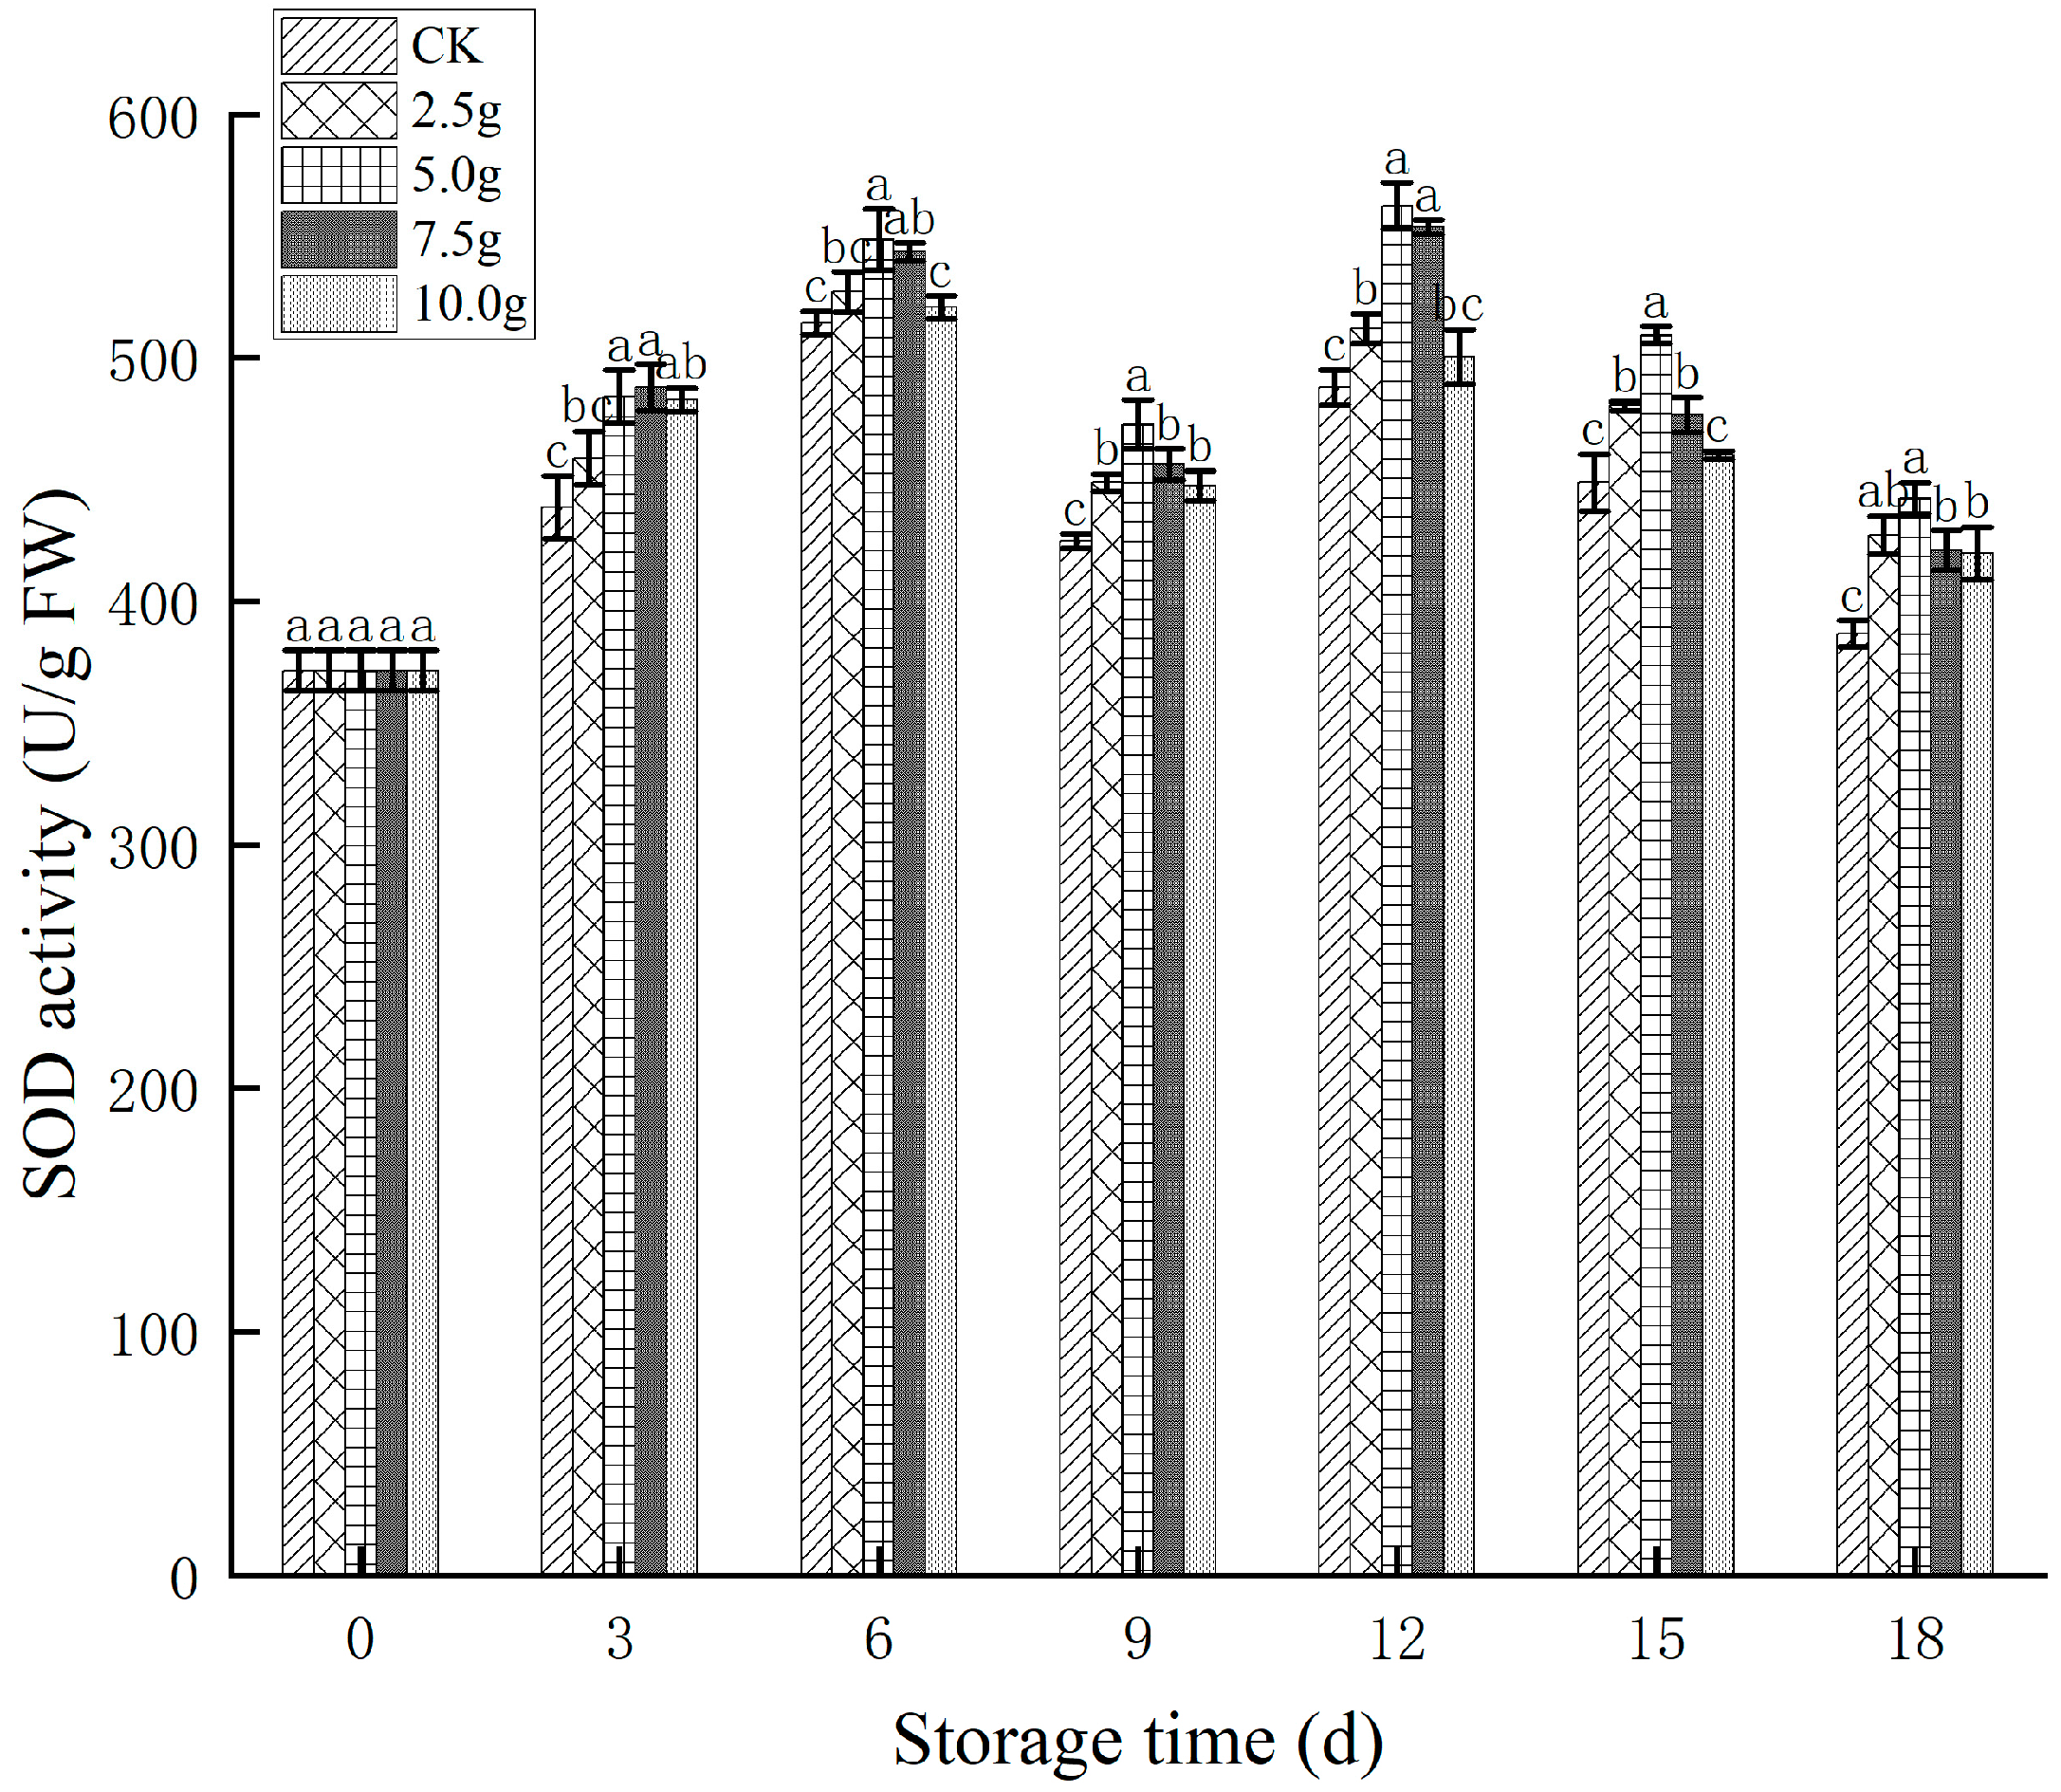
The changes in SOD activity during strawberry refrigeration are depicted in Figure 12. In the early stages of storage, SOD activity increased, followed by a decline after day 9, a further increase on day 12, and a decline thereafter. The SOD activity of the treatment groups was higher than that of the CK group, indicating that the tea tree oil microcapsule treatment enhanced SOD activity in the strawberries during cold storage. Of the four treatment groups, the 5.0 g group consistently exhibited the highest SOD activity. The SOD activity in the 2.5 g and 7.5 g groups was similar but lower than that in the 5.0 g group, and the 10.0 g group exhibited the lowest SOD activity.
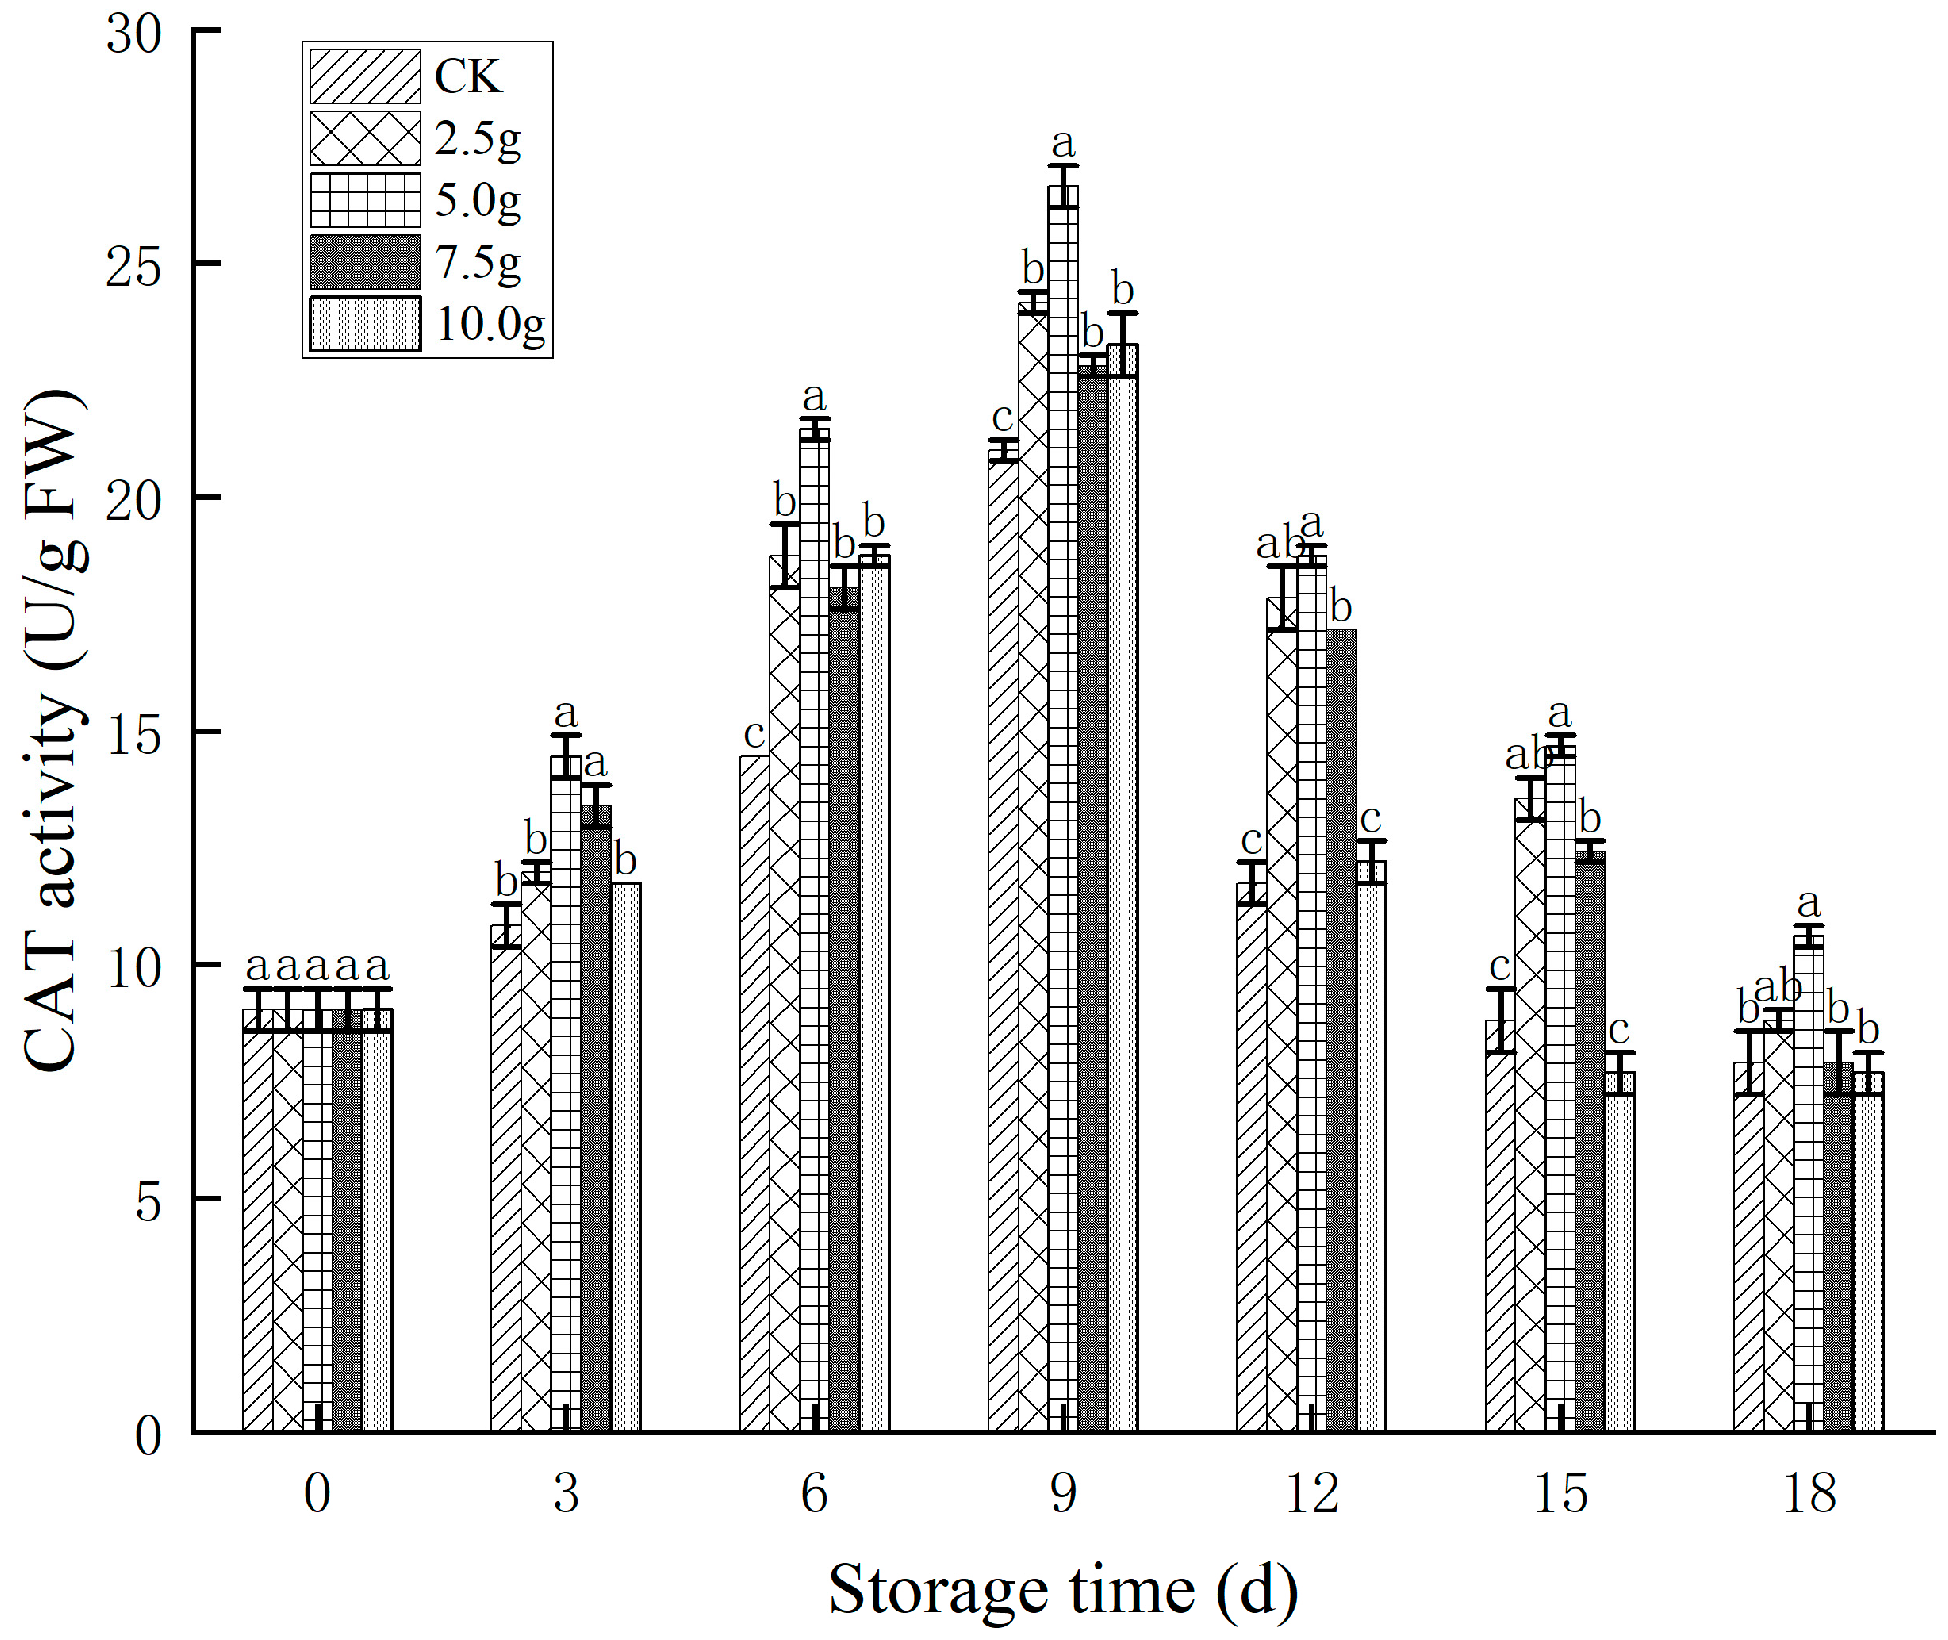
CAT activity in the strawberries increased initially before declining during cold storage (Figure 13). The CAT activity of the CK group and the tea tree oil microcapsule treatment groups peaked on day 9 and then rapidly declined. The decline in CAT activity was more pronounced in the CK group and the 10.0 g group, and a nonsignificant difference was observed between these groups (p > 0.05). By contrast, the decline in CAT activity was less pronounced in the 2.5 g, 5.0 g, and 7.5 g groups, with the 5.0 g group exhibiting the highest CAT activity. This finding indicates that applying suitable quantities of tea tree oil microcapsules maintained high CAT activity during storage, preserving the antioxidant capacity of the strawberries.
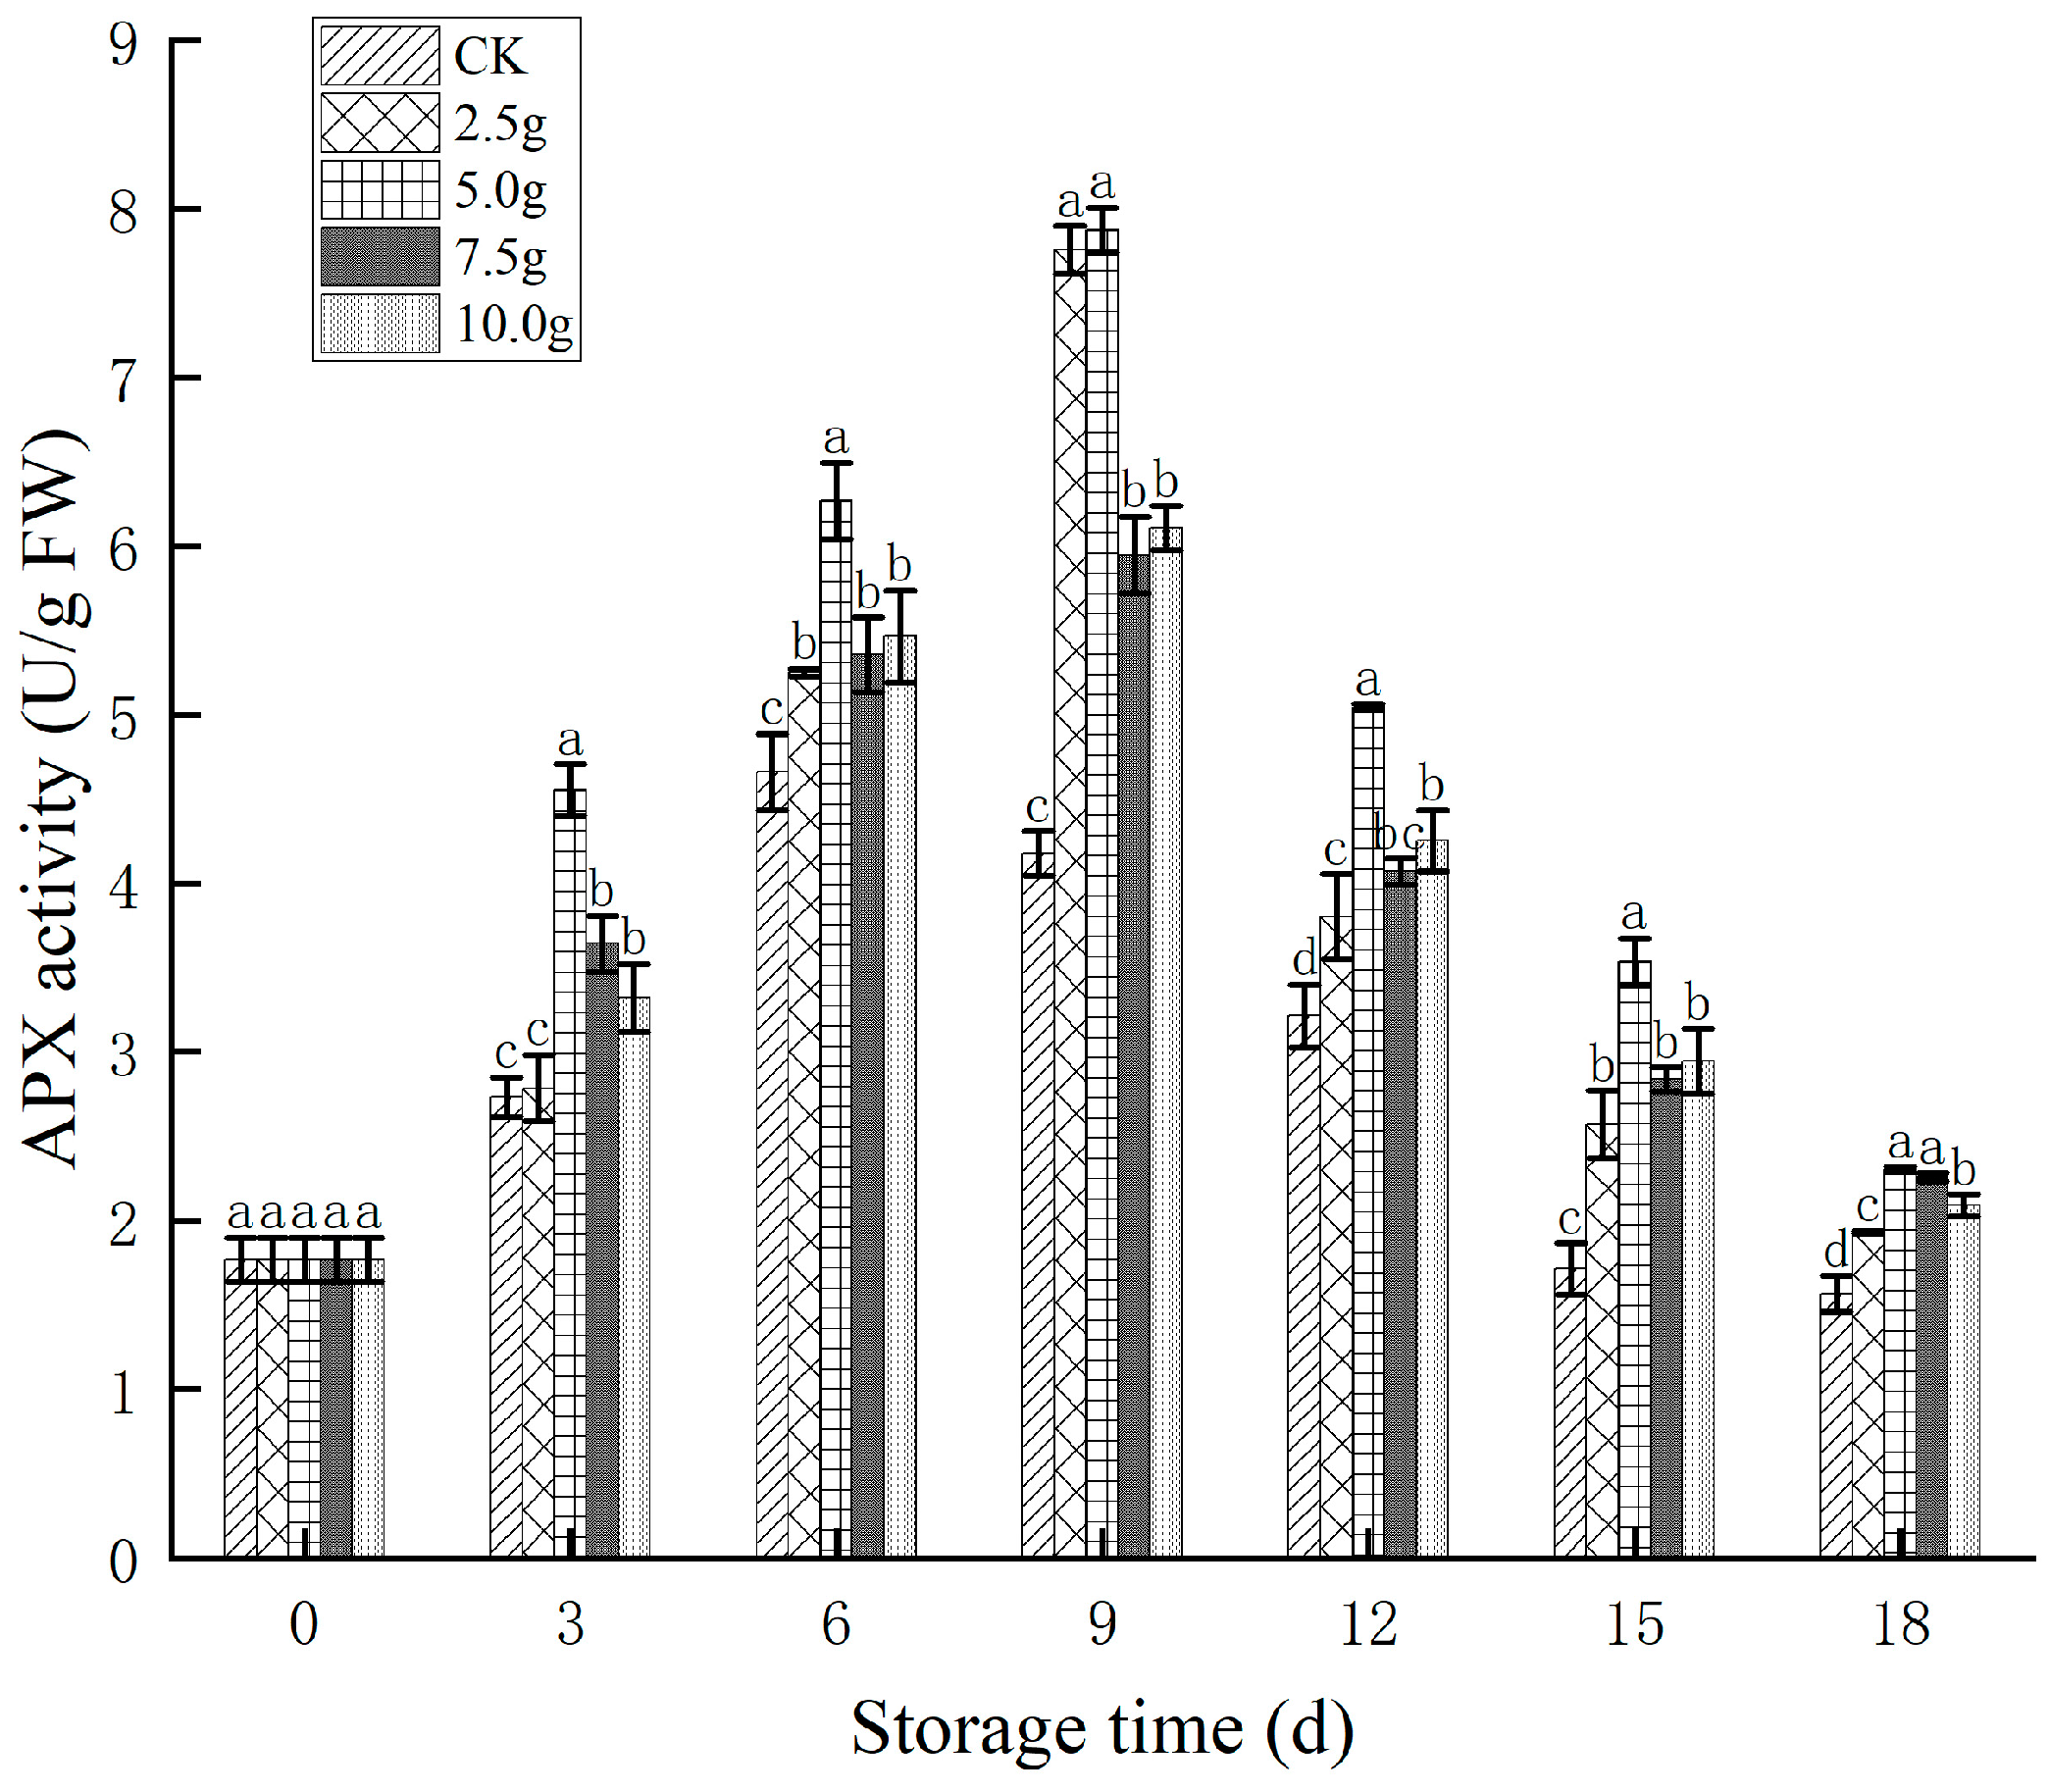
The changes in APX activity during the refrigeration of the strawberries are presented in Figure 14. The APX activity in the CK group peaked on day 6, whereas the treatment groups exhibited the maximum APX activity on day 9. As the storage time progressed, the APX activity in both the CK and treatment groups gradually declined. In the early and middle stages of storage, the 5.0 g group exhibited significantly higher APX activity than the other groups (p < 0.05). By day 18, the differences in APX activity between the treatment groups were minimal. This finding indicates that tea tree oil microcapsule treatment induced higher APX activity during the early and middle stages of storage, maintaining strawberry quality.
SOD, CAT, and APX are antioxidant enzymes that are crucial to scavenging free radicals and maintaining the redox balance in biological systems. Superoxide radicals (O2⁻) are efficiently converted into hydrogen peroxide (H2O2) by SOD. This H2O2 is subsequently broken down by APX and CAT [30]. APX is particularly critical to maintaining the ascorbate–glutathione cycle balance and the antioxidant capacity of fruits [31]. In this study, tea tree oil microcapsule treatment promoted the activity of SOD, CAT, and APX during the cold storage of strawberries. The increased activity of these enzymes converted excess reactive oxygen species and free radicals into harmless substances, protecting cells from oxidative damage and maintaining the antioxidant ability and quality of the strawberries [32,33].

4. Conclusions

In this study, microcapsules were prepared using embedding, with β-cyclodextrin and nano-montmorillonite serving as the wall material and tea tree oil as the core material. The optimal preparation conditions were determined to be a montmorillonite concentration of 2% (m/v), a core-to-wall ratio of 1:12 (m/m), an encapsulation temperature of 70 °C, and an encapsulation time of 90 min. Under these conditions, the encapsulation efficiency of the tea tree oil microcapsules reached 77.67%. The prepared microcapsules were spherical or near-spherical, with uniform fine particles in appearance. The primary components of the microcapsules matched those of tea tree oil, specifically terpinen-4-ol, 1,8-cineole, p-cymene, and terpinolene. The release rate of the microcapsules under high temperatures was significantly lower than that of liquid tea tree oil.
Suitable treatment with tea tree oil microcapsules maintained the appearance and quality of strawberries, inhibited decay during cold storage, reduced weight loss, prevented excessive deepening of color, and preserved firmness. The microcapsule treatments delayed the peaking of SSC and slowed the decline in sugar content. The treatments also delayed the decline in acidity during the later stages of storage. However, the effect of the treatments on acidity in the early storage period was minimal. Among the treatments, the group (5.0 g of microcapsules per 1.2 L of storage space) achieved the optimal preservative effect.
Tea tree oil microcapsule treatment also promoted the activity of SOD, CAT, and APX during strawberry cold storage, suppressing the increase in anthocyanins and exerting strong antioxidant effects. Therefore, the microcapsule treatment described in this study maintained the quality of the strawberries and inhibited their further maturation during storage.

Author Contributions

Conceptualization, Y.-L.H., C.C. and Y.-Y.W.; methodology, Y.-M.Y., M.-Y.W., Y.X. and D.-Y.W.; validation, C.C., Y.-Y.W., Y.-M.Y., M.-Y.W., Y.X. and D.-Y.W.; formal analysis, Y.-M.Y. and M.-Y.W.; resources, Y.-L.H.; writing—original draft preparation, Y.-L.H., Z.-H.H., A.-S.X., J.Z. and C.C.; writing—review and editing, Y.-H.W.; visualization, C.C.; supervision, Y.-H.W.; project administration, C.C.; funding acquisition, Y.-L.H. and Y.-H.W. All authors have read and agreed to the published version of the manuscript.

Funding

The research was supported by the Jiangsu Vocational College of Agriculture and Forestry general grant (2023kj31) and the Jiangsu Natural Sciences grant (BK20211125).

Institutional Review Board Statement

Not applicable.

Informed Consent Statement

Not applicable.

Data Availability Statement

The data presented in this study are available upon request from the corresponding author.

Conflicts of Interest

The authors declare no conflicts of interest.

References

  1. Chu, Y.F.; Gao, C.C.; Liu, X.Y.; Zhang, N.; Xu, T.; Feng, X.; Yang, Y.L.; Shen, X.C.; Tang, X.Z. Improvement of storage quality of strawberries by pullulan coatings incorporated with cinnamon essential oil nanoemulsion. LWT 2020, 122, 109054. [Google Scholar] [CrossRef]
  2. Hajji, S.; Younes, I.; Affes, S.; Boufi, S.; Nasri, M. Optimization of the formulation of chitosan edible coatings supplemented with carotenoproteins and their use for extending strawberries postharvest life. Food Hydrocoll. 2018, 83, 375–392. [Google Scholar] [CrossRef]
  3. Chang, L.; Xu, L.; Yang, Z.; Yang, Z.; Liu, L.; Qiu, D. Antibacterial and antioxidative biogenic films for room-temperature strawberry preservation. Food Chem. 2023, 405, 134893. [Google Scholar] [CrossRef]
  4. Shahbazi, Y. Application of carboxymethyl cellulose and chitosan coatings containing Mentha spicata essential oil in fresh strawberries. Int. J. Biol. Macromol. 2018, 112, 264–272. [Google Scholar] [CrossRef]
  5. Priya, K.; Thirunavookarasu, N.; Chidanand, D.V. Recent advances in edible coating of food products and its legislations: A review. J. Agric. Food Res. 2023, 12, 100623. [Google Scholar] [CrossRef]
  6. Borotová, P.; Galovičová, L.; Vukovic, N.; Vuki, M.D.; Tvrdá, E.; Kaániováet, M. Chemical and biological characterization of Melaleuca alternifolia essential oil. Plants 2022, 11, 558. [Google Scholar] [CrossRef] [PubMed]
  7. Ren, J.; Wang, Y.M.; Zhang, S.B.; Lv, Y.Y.; Zhai, H.C.; Wei, S.; Ma, P.A.; Hu, Y.S. Terpinen-4-ol from tea tree oil prevents Aspergillus flavus growth in postharvest wheat grain. Int. J. Food Microbiol. 2024, 418, 110741. [Google Scholar] [PubMed]
  8. Isman, M.B. Commercial development of plant essential oils and their constituents as active ingredients in bioinsecticides. Phytochem. Rev. 2020, 19, 235–241. [Google Scholar]
  9. Deng, X.Z.; Wei, Y.Y.; Jiang, S.; Ye, J.F.; Chen, Y.; Xu, F.; Chen, J.H.; Shao, X.F. Recent advances in the application of tea tree oil in the storage of fruit and vegetables. Postharvest Biol. Technol. 2025, 219, 113260. [Google Scholar] [CrossRef]
  10. Jiang, S.; Zhao, T.T.; Wei, Y.Y.; Cao, Z.D.; Xu, Y.Y.; Wei, J.Y.; Xu, F.; Wang, H.F.; Shao, X.F. Preparation and characterization of tea tree oil/ hydroxypropyl-β-cyclodextrin inclusion complex and its application to control brown rot in peach fruit. Food Hydrocoll. 2021, 121, 107037. [Google Scholar]
  11. Maiti, T.K.; Parvate, S.; Dixit, P.; Singh, J.; Reddy, V.J.; Bhuvanesh, E.; Chattopadhyay, S. Liposome for encapsulation of essential oil and fatty acids. In Liposomal Encapsulation in Food Science and Technology; Taylor & Francis: Oxford, UK, 2023; pp. 113–124. [Google Scholar]
  12. Wang, Y.S.; Wu, C.; Yang, W.; Gong, Y.X.; Zhang, X.Y.; Li, J.L.; Wu, D.M. Dual cross-linking with tannic acid and transglutaminase improves microcapsule stability and encapsulates lemon essential oil for food preservation. Food Chem. 2025, 465 Pt 2, 142173. [Google Scholar] [CrossRef] [PubMed]
  13. Niu, Y.W.; Wu, J.H.; Kang, Y.X.; Zhao, Q.X.; Xiao, Z.B.; Zhao, D. Encapsulation technique and application progress of mechanical stimuli-responsive microcapsules. Prog. Org. Coat. 2023, 176, 107390. [Google Scholar]
  14. Benegra, M.; Couto, G.H.; Pangoncellim, G.B. Preparation and evaluation of w/o/w type emulsions for encapsulation of citronella essential oil by inverse ionic gelation. Colloid Polym. Sci. 2023, 301, 1159–1170. [Google Scholar] [CrossRef]
  15. Zong, X.Y.; Li, H.; Tang, Q.; Wang, X.; Li, Y.; Li, L. Preparation and characterization of glucoamylase microcapsules prepared by W/O/W type complex coacervation freeze drying. J. Food Sci. 2023, 88, 795–809. [Google Scholar] [CrossRef] [PubMed]
  16. Li, Z.A.; Jiang, L.W.; Wang, Y.Y.; Li, M.; Liu, T.T.; Liu, Y.Z. Chitosan—gellan gum polyelectrolyte hydrogel beads containing tea tree oil microcapsules: Preparation, characterization and application. Food Hydrocoll. 2024, 157, 110464. [Google Scholar] [CrossRef]
  17. Hădărugă, N.G.; Szakal, R.N.; Chirilă, C.A.; Lukinich-Gruia, A.T.; Păunescu, V.; Muntean, C.; Rusu, G.; Bujancă, G.; Hădărugă, D.I. Complexation of Danube common nase (Chondrostoma nasus L.) oil by β-cyclodextrin and 2-hydroxypropyl-β-cyclodextrin. Food Chem. 2020, 303, 125419. [Google Scholar] [CrossRef]
  18. Deng, C.Y.; Cao, C.; Zhang, Y.Y.; Hu, J.W.; Gong, Y.Q.; Zheng, M.M.; Zhou, Y.B. Formation and stabilization mechanism of β-cyclodextrin inclusion complex with C10 aroma molecules. Food Hydrocoll. 2022, 123, 107013. [Google Scholar] [CrossRef]
  19. Kong, P.; Abe, J.P.; Masuo, S.; Enomae, T. Preparation and characterization of tea tree oil-β-cyclodextrin microcapsules with super-high encapsulation efficiency. J. Bioresour. Bioprod. 2023, 8, 224–234. [Google Scholar] [CrossRef]
  20. Esteve-Redondo, P.; Heras-Mozos, R.; López-Carballo, G.; López-Carballo, G.; López-de-Dicastillo, C.; Gavara, R.; Hernández-Muñoz, P. Efficacy of methyl anthranilate vapour against Botrytis cinerea in packaged strawberries. Food Packag. Shelf Life 2024, 45, 101349. [Google Scholar]
  21. Zhang, Y.; Lin, B.; Tang, G.; Chen, Y.; Deng, M.; Lin, Y.; Li, M.; He, W.; Zhang, Y.; Luo, Y.; et al. Application of γ-aminobutyric acid improves the postharvest marketability of strawberry by maintaining fruit quality and enhancing antioxidant system. Food Chem. X 2024, 21, 101252. [Google Scholar]
  22. Li, Z.B.; Wei, Y.Y.; Xu, Y.Y.; Han, P.P.; Jiang, S.; Xu, F.; Wang, H.F.; Tao, N.G.; Shao, X.F. Terpinen-4-ol treatment maintains quality of strawberry fruit during storage by regulating sucrose-induced anthocyanin accumulation. Postharvest Biol. Technol. 2021, 174, 111461. [Google Scholar] [CrossRef]
  23. Yang, Z.; Li, M.; Zhai, X.; Zhao, L.; Elrasheid Tahir, H.; Shi, J.; Zou, X.; Huang, X.; Li, Z.; Xiao, J. Development and characterization of sodium alginate/tea tree essential oil nanoemulsion active film containing TiO2 nanoparticles for banana packaging. Int. J. Biol. Macromol. 2022, 213, 145–154. [Google Scholar] [CrossRef]
  24. Lu, M.; Yang, H.; Li, C.; Zhang, Z.; Zhang, L.; Xiong, C.; Wang, L.; Xie, Y.; Xu, J. Preparation of tea tree essential oil and β-cyclodextrin inclusion complex and analysis of its storage stability. Packag. Food Mach. 2019, 37, 31–36. (In Chinese) [Google Scholar]
  25. An, P.; Yang, X.; Yu, J.; Qi, J.; Ren, X.; Kong, Q. α-terpineol and terpene-4-ol, the critical components of tea tree oil, exert antifungal activities in vitro and in vivo against Aspergillus niger in grapes by inducing morphous damage and metabolic changes of fungus. Food Control 2019, 98, 42–53. [Google Scholar] [CrossRef]
  26. Wigati, L.P.; Wardana, A.A.; Jothi, J.S.; Leonard, S.; Thi Van, T.; Yan, X.; Tanaka, F.; Tanaka, F. Biochemical and color stability preservation of strawberry using edible coatings based on jicama starch/calcium propionate/agarwood bouya essential oil during cold storage. J. Stored Prod. Res. 2024, 107, 102324. [Google Scholar] [CrossRef]
  27. Catanzano, O.; Straccia, M.C.; Miro, A.; Ungaro, F.; Romano, I.; Mazzarella, G.; Santagata, G.; Quaglia, F.; Laurienzo, P.; Malinconico, M. Spray-by-spray in situ cross-linking alginate hydrogels delivering a tea tree oil microemulsion. Eur. J. Pharm. Sci. 2015, 66, 20–28. [Google Scholar] [CrossRef] [PubMed]
  28. Huang, Y.; Liao, M.; Yang, Q.Q.; Xiao, J.J.; Hu, Z.Y.; Zhou, L.J.; Cao, H.Q. Transcriptome profiling reveals differential gene expression of detoxification enzymes in Sitophilus zeamais responding to terpinen-4-ol fumigation. Pestic. Biochem. Physiol. 2018, 149, 44–53. [Google Scholar] [CrossRef] [PubMed]
  29. Sathiyaseelan, A.; Saravanakumar, K.; Mariadoss, A.V.A.; Ramachandran, C.; Hu, X.; Oh, D.H.; Wang, M.H. Chitosan-tea tree oil nanoemulsion and calcium chloride tailored edible coating increase the shelf life of fresh cut red bell pepper. Prog. Org. Coat. 2021, 151, 106010. [Google Scholar] [CrossRef]
  30. Chen, Y.; Xing, M.Y.; Chen, T.; Tian, S.P.; Li, B.Q. Effects and mechanisms of plant bioactive compounds in preventing fungal spoilage and mycotoxin contamination in postharvest fruits: A review. Food Chem. 2023, 30, 135787. [Google Scholar] [CrossRef]
  31. Huan, C.; Han, S.; Jiang, L.; An, X.; Yu, M.; Xu, Y.; Ma, R.; Yu, F. Postharvest hot air and hot water treatments affect the antioxidant system in peach fruit during refrigerated storage. Postharvest Biol. Technol. 2017, 126, 1–14. [Google Scholar] [CrossRef]
  32. Li, D.; Ye, Q.; Lei, J.; Luo, Z. Effects of nano-TiO2-LDPE packaging on postharvest quality and antioxidant capacity of strawberry (Fragaria ananassa Duch) stored at refrigeration temperature. J. Sci. Food Agric. 2017, 97, 1116–1123. [Google Scholar] [CrossRef] [PubMed]
  33. Wei, Y.; Shao, X.; Wei, Y.; Xu, F.; Wang, H. Effect of preharvest application of tea tree oil on strawberry fruit quality parameters and possible disease resistance mechanisms. Sci. Hortic. 2018, 241, 18–28. [Google Scholar] [CrossRef]
Figure 1. (a) Effect of montmorillonite concentration on encapsulation efficiency. (b) Effect of core-to-wall ratio on encapsulation efficiency. (c) Effect of encapsulation temperature on encapsulation efficiency. (d) Effect of encapsulation time on encapsulation efficiency. The error lines are three independently repeated standard errors for each group, with different lowercase letters above the error lines indicating statistically significant differences (p < 0.05).
Horticulturae 11 00389 g001
Figure 2. (a) Morphology and (b) scanning electron microscopy imaging of a tea tree oil microcapsule.
Horticulturae 11 00389 g002
Figure 3. Release profiles of tea tree oil microcapsules and pure tea tree oil. The error lines are three independently repeated standard errors for each group, with different lowercase letters above the error lines indicating statistically significant differences (p < 0.05).
Horticulturae 11 00389 g003
Figure 4. Effect of microcapsules on strawberry appearance. CK represents strawberry fruits without any treatment. The 2.5 g, 5.0 g, 7.5 g, and 10.0 g in the drawing represent strawberry fruits treated with 2.5 g, 5.0 g, 7.5 g, and 10.0 g of tea tree oil microcapsules per box, respectively.
Horticulturae 11 00389 g004
Figure 5. Effect of microcapsules on strawberry decay. CK represents strawberry fruits without any treatment. The 2.5 g, 5.0 g, 7.5 g, and 10.0 g in the drawing represents strawberry fruits treated with 2.5 g, 5.0 g, 7.5 g, and 10.0 g of tea tree oil microcapsules per box, respectively. The error lines are three independently repeated standard errors for each group, with different lowercase letters above the error lines indicating statistically significant differences (p < 0.05).
Horticulturae 11 00389 g005
Figure 6. Effect of microcapsules on strawberry weight loss. CK represents strawberry fruits without any treatment. The 2.5 g, 5.0 g, 7.5 g, and 10.0 g in the drawing represents strawberry fruits treated with 2.5 g, 5.0 g, 7.5 g, and 10.0 g of tea tree oil microcapsules per box, respectively. The error lines are three independently repeated standard errors for each group, with different lowercase letters above the error lines indicating statistically significant differences (p < 0.05).
Horticulturae 11 00389 g006
Figure 7. Effect of microcapsules on strawberry color. CK represents strawberry fruits without any treatment. The 2.5 g, 5.0 g, 7.5 g, and 10.0 g in the drawing represents strawberry fruits treated with 2.5 g, 5.0 g, 7.5 g, and 10.0 g of tea tree oil microcapsules per box, respectively. The error lines are three independently repeated standard errors for each group, with different lowercase letters above the error lines indicating statistically significant differences (p < 0.05).
Horticulturae 11 00389 g007
Figure 8. Effect of microcapsules on strawberry firmness. CK represents strawberry fruits without any treatment. The 2.5 g, 5.0 g, 7.5 g, and 10.0 g in the drawing represents strawberry fruits treated with 2.5 g, 5.0 g, 7.5 g, and 10.0 g of tea tree oil microcapsules per box, respectively. The error lines are three independently repeated standard errors for each group, with different lowercase letters above the error lines indicating statistically significant differences (p < 0.05).
Horticulturae 11 00389 g008
Figure 9. Effect of microcapsules on soluble solid content (SSC). CK represents strawberry fruits without any treatment. The 2.5 g, 5.0 g, 7.5 g, and 10.0 g in the drawing represents strawberry fruits treated with 2.5 g, 5.0 g, 7.5 g, and 10.0 g of tea tree oil microcapsules per box, respectively. The error lines are three independently repeated standard errors for each group, with different lowercase letters above the error lines indicating statistically significant differences (p < 0.05).
Horticulturae 11 00389 g009
Figure 10. Effect of microcapsules on strawberry acidity. CK represents strawberry fruits without any treatment. The 2.5 g, 5.0 g, 7.5 g, and 10.0 g in the drawing represents strawberry fruits treated with 2.5 g, 5.0 g, 7.5 g, and 10.0 g of tea tree oil microcapsules per box, respectively. The error lines are three independently repeated standard errors for each group, with different lowercase letters above the error lines indicating statistically significant differences (p < 0.05).
Horticulturae 11 00389 g010
Figure 11. Effect of microcapsules on anthocyanin content. CK represents strawberry fruits without any treatment. The 2.5 g, 5.0 g, 7.5 g, and 10.0 g in the drawing represents strawberry fruits treated with 2.5 g, 5.0 g, 7.5 g, and 10.0 g of tea tree oil microcapsules per box, respectively. The error lines are three independently repeated standard errors for each group, with different lowercase letters above the error lines indicating statistically significant differences (p < 0.05).
Horticulturae 11 00389 g011
Figure 12. Effect of microcapsules on superoxide dismutase (SOD) activity. CK represents strawberry fruits without any treatment. The 2.5 g, 5.0 g, 7.5 g, and 10.0 g in the drawing represents strawberry fruits treated with 2.5 g, 5.0 g, 7.5 g, and 10.0 g of tea tree oil microcapsules per box, respectively. The error lines are three independently repeated standard errors for each group, with different lowercase letters above the error lines indicating statistically significant differences (p < 0.05).
Horticulturae 11 00389 g012
Figure 13. Effect of microcapsules on catalase (CAT) activity. CK represents strawberry fruits without any treatment. The 2.5 g, 5.0 g, 7.5 g, and 10.0 g in the drawing represents strawberry fruits treated with 2.5 g, 5.0 g, 7.5 g, and 10.0 g of tea tree oil microcapsules per box, respectively. The error lines are three independently repeated standard errors for each group, with different lowercase letters above the error lines indicating statistically significant differences (p < 0.05).
Horticulturae 11 00389 g013
Figure 14. Effect of microcapsules on ascorbate peroxidase (APX) activity. CK represents strawberry fruits without any treatment. The 2.5 g, 5.0 g, 7.5 g, and 10.0 g in the drawing represents strawberry fruits treated with 2.5 g, 5.0 g, 7.5 g, and 10.0 g of tea tree oil microcapsules per box, respectively. The error lines are three independently repeated standard errors for each group, with different lowercase letters above the error lines indicating statistically significant differences (p < 0.05).
Horticulturae 11 00389 g014
Table 1. Orthogonal experimental design.
LevelA. Montmorillonite Addition (%)B. Core-to-Wall RatioC. Encapsulation Temperature (°C)D. Encapsulation Time (min)
12%1:87030
24%1:108060
36%1:129090
The prepared tea tree oil microcapsules were analyzed to determine their slow-release properties, surface microstructure, and major components.
Table 2. Visual analysis of orthogonal experiments.
FactorA. Montmorillonite Concentration/%B.
Core-to-Wall Ratio
C.
Encapsulation Temperature/°C
D.
Encapsulation Time/min
Encapsulation Efficiency/%
Trial I Trial II Trial III
12%1:8703049.3948.6048.17
22%1:10806062.6464.4465.97
32%1:12909077.6575.2378.94
44%1:8906051.2652.9251.26
54%1:10709067.5071.3769.21
64%1:12803073.7974.2672.60
76%1:8809052.4250.5454.43
86%1:10903064.8966.3368.85
96%1:12706073.5474.7371.60
K1 63.4551.0063.7962.99
K264.9166.8063.4563.15
K3 64.1574.7065.2666.37
R1.4623.701.813.38
Table 3. Variance analysis of orthogonal experiments.
SourceType 3 Sum of SquaresDegree of FreedomMean SquareFSignificance
Adjusted Models2713.532 8339.192136.2180.000
Intercept111,173.3701111,173.37044,646.8100.000
A9.61124.8061.9300.174
B2621.97821310.989526.4880.000 **
C16.60028.3003.3330.059
D65.342232.67113.1210.000 **
Error44.821182.490
Total113,931.72427
Adjusted Total2758.35326
Statistically significant differences were marked with * (p < 0.05) or ** (p < 0.01).
Table 4. Major components of tea tree oil microcapsules and pure tea tree oil.
Major ComponentContent in Pure Tea Tree Oil (%)Content in Microcapsules (%)
Terpinen-4-ol35.61 ± 5.85 a29.76 ± 3.13 a
p-Cymene12.69 ± 1.01 a11.78 ± 0.67 a
Terpinolene12.21 ± 0.73 a10.49 ± 1.55 a
1,8-Cineole10.53 ± 0.21 a10.11 ± 0.48 a
3-Carene8.28 ± 1.12 a7.80 ± 0.98 a
Terpinene6.70 ± 0.31 a5.45 ± 1.57 a
α-Pinene3.59 ± 0.05 a3.62 ± 0.16 a
α-Terpineol3.55 ± 0.36 a3.02 ± 0.17 a
γ-Terpinene2.74 ± 0.51 a2.24 ± 0.22 a
(+)-Limonene2.22 ± 0.03 a0.91 ± 0.01 b
Values are means ± SD of three biological replicates. Different lowercase letters in the same line indicate significant differences according to Student’s t-test (p < 0.05).
Disclaimer/Publisher’s Note: The statements, opinions and data contained in all publications are solely those of the individual author(s) and contributor(s) and not of MDPI and/or the editor(s). MDPI and/or the editor(s) disclaim responsibility for any injury to people or property resulting from any ideas, methods, instructions or products referred to in the content.