Article

Fruit Quality and Antioxidant Content in Durian (Durio zibethinus Murr.) cv. ‘Monthong’ in Different Maturity Stages

1
Department of Horticulture, Faculty of Agriculture, Khon Kaen University, Khon Kaen 40002, Thailand
2
Department of Entomology and Plant Pathology, Faculty of Agriculture, Chiangmai University, Chiangmai 50200, Thailand
3
Department of Entomology and Plant Pathology, Faculty of Agriculture, Khon Kaen University, Khon Kaen 40002, Thailand
4
Department of Agricultural Engineering, Faculty of Engineering, Khon Kaen University, Khon Kaen 40002, Thailand
*
Author to whom correspondence should be addressed.
Horticulturae 2025, 11(4), 432; https://doi.org/10.3390/horticulturae11040432
Submission received: 14 March 2025 / Revised: 14 April 2025 / Accepted: 14 April 2025 / Published: 18 April 2025
(This article belongs to the Special Issue Fruit Tree Physiology, Sustainability and Management)

Abstract

:
Durian (Durio zibethinus Murr.) is a major economic crop in Thailand, with the ‘Monthong’ cultivar being particularly valued for its commercial significance and extensive cultivation in northern Thailand. However, the thick, hard shell of durian complicates ripeness assessment based on external appearance, often leading to premature harvesting and unripe fruit sales. Variations in consumer preferences for different ripeness stages present challenges in meeting market demands. Due to the absence of a definitive harvest index for ‘Monthong’ durian, this study aims to (1) evaluate the potential of fruit shell color composition as an indicator of maturation stage and (2) assess the impact of harvest maturity on fruit quality and antioxidant content. A completely randomized design (CRD) was employed in the experiment. Fruits were collected at intervals of 15 days from 15 to 135 days after full bloom (DAFB). The results showed that fruit circumference and length increased progressively with age, with maximum fruit size observed at 90–135 DAFB. Fruit weight, firmness, dry matter, total phenolics, flavonoids, β-carotene, lycopene, and antioxidant activity peaked at 120 DAFB. The values recorded at this stage were: fruit weight (3652.30 g), firmness (42.08 N/cm2), dry matter (37.13%), total phenolics (43.98 mg/100 g fresh weight (FW)), flavonoids (8.33 mg catechin/100 g FW), β-carotene (1.35 mg/100 g FW), lycopene (53.98 mg/100 g FW), and antioxidant activity (6.32 mg TE/100 g FW). The highest total soluble solids (TSS) content was observed at 135 DAFB, with a value of 25 °Brix. These findings indicate that: (1) maturation stages can be effectively differentiated using shell color; (2) ‘Monthong’ durians reach their maximum size at 90 DAFB; (3) fruits harvested at 90–105 DAFB exhibit high firmness and low sweetness, making them suitable for markets prioritizing texture; (4) fruits harvested at 105–120 DAFB exhibit lower firmness and higher sweetness, making them preferable for direct consumption; and (5) total soluble solids, acidity, phenolics, flavonoids, β-carotene, lycopene, and antioxidant activity increase with maturation. These insights provide a valuable reference for optimizing harvest timing to meet specific market and consumer preferences.

1. Introduction

Durian (Durio zibethinus Murr.), belonging to the Bombaceae family and often referred to as the ‘King of Tropical Fruits’, is a high-value economic crop and a significant export commodity for Thailand [1]. It is predominantly cultivated in Southeast Asian countries, including Thailand, Indonesia, Malaysia, and the Philippines. In the 2023 growing season, Thailand’s total productive durian plantation area covered approximately 1,050,625 rai, yielding 1,475,978 tons of fruit. By 2023, durian exports generated a total revenue of THB 164.787 billion [2]. Among the various durian cultivars, the ‘Monthong’ cultivar holds particular economic significance in Sisaket Province, northern Thailand, where it has been recognized as a geographical indication (GI) product under the name ‘Lava Durian Sisaket’. This designation highlights its unique agricultural identity, characterized by a smooth, soft texture, dry flesh, and uniformly yellow color. The outer shell is crisp, while the inner flesh is creamy, mildly aromatic, and not overly sweet [3]. ‘Monthong’ durian is primarily cultivated in the Khun Han, Kantharalak, and Si Rattana districts of Sisaket Province [4].
Harvest timing plays a critical role in determining durian fruit quality. For export purposes, harvesting is typically conducted when the fruit reaches approximately 75–85% maturity, corresponding to 110–115 DAFB [5]. However, naturally ripened durians, harvested at 90% maturity, exhibit superior antioxidant levels and overall quality compared to those harvested earlier [6]. Previous studies indicate that durians harvested at 114 DAFB have optimal sensory attributes, including higher levels of soluble solids, sucrose, and fat, which contribute to enhanced flavor and texture [7]. Additionally, durian is recognized for its high nutritional value, being rich in bioactive compounds such as polyphenols (e.g., flavonoids, phenolic acids, and tannins), carotenoids, ascorbic acid, carbohydrates, calcium, phosphorus, thiamin, riboflavin, and niacin [8,9].
Despite its economic significance, assessing durian ripeness remains challenging due to its thick outer shell, which obscures external indicators of maturity [1]. Currently, there is no standardized harvest index for ‘Monthong’ durian, and local farmers predominantly rely on traditional expertise to determine optimal harvesting time. For instance, they determine durian maturity using a combination of visual, tactile, and auditory cues. One common method is observing changes in the fruit’s skin color and the drying of the stem near the fruits, which indicate ripeness. Farmers also assess fruit maturity by gently tapping it with a wooden stick and listening to the resulting sound. A dull, hollow tone typically signifies ripeness, while a high-pitched sound indicates immaturity. Additionally, they examine the spatial distribution of the fruit’s spines, observing that mature durians exhibit slightly wider gaps between spines [10]. This subjective approach often results in inconsistent fruit quality, with unripe durians entering the market and diminishing consumer confidence. Early harvesting can compromise flavor and texture, negatively impacting the fruit’s marketability and export potential. To address these challenges, this study aims to investigate the influence of harvest maturity on the fruit quality and antioxidant content of ‘Monthong’ durian. The findings will contribute to establishing a clear harvest maturity index, providing scientific guidelines for optimal harvest timing, export quality assurance, and improved post-harvest management practices.

2. Materials and Methods

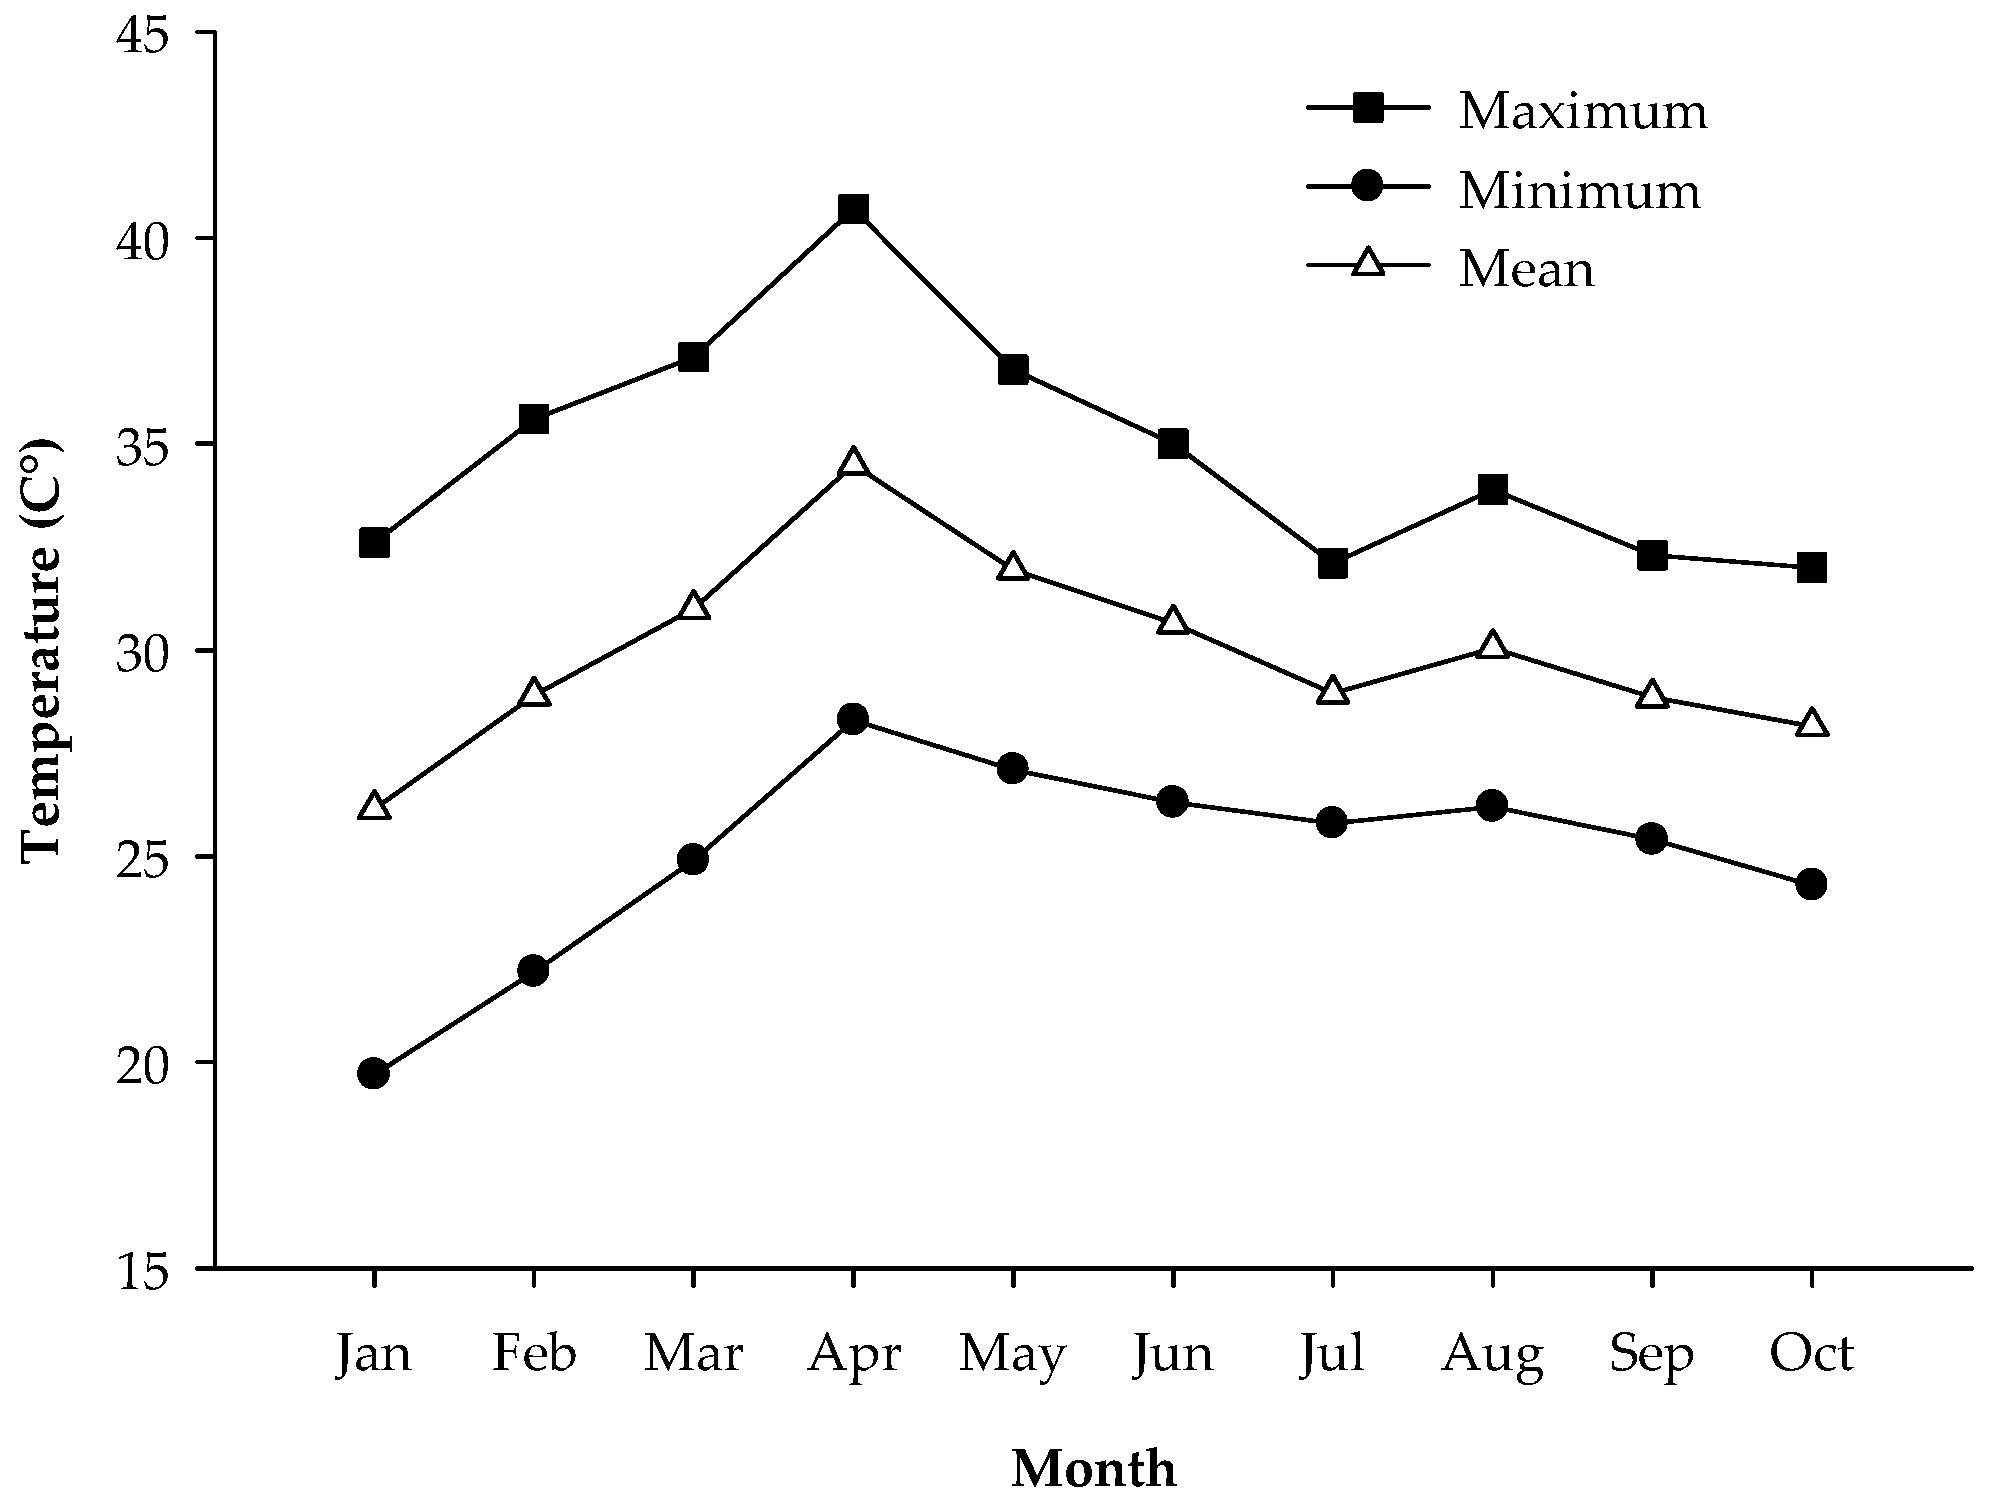
2.1. Plant Materials

Durian samples were harvested at nine distinct maturity stages, determined by days after full bloom (15, 30, 45, 60, 75, 90, 105, 120, and 135 days). The fruits were collected from an orchard in Baan Sam Khilek, Khun Han District, Sisaket Province, northeastern Thailand (14°32′49.4″ N, 104°29′11.9″ E). Healthy fruits were randomly selected during the 2024 growing season from four 8-year-old durian trees of similar size, cultivated at an 8 × 8 m spacing in silty clay Chok Chai and Sisaket soil types. Planting area covered with red soil derived from ancient volcanic rocks, particularly weathered basalt rich in minerals. The experiment followed a completely randomized design (CRD). Fruit samples were collected at 15-day intervals, yielding 144 fruits across the nine maturity stages (16 fruits per stage, with 4 replications). The samples were then transported to the laboratory at Khon Kaen University and acclimatized overnight at 25 ± 2 °C and 80 ± 5% relative humidity.
Following the physical assessment, the same fruits from each maturity stage—16 fruits per measurement date, with 4 fruits per replicate—were used to analyze the content of biologically active compounds. The fruits were chopped and homogenized in liquid nitrogen using a high-speed blender for 1 min. A weighed portion (100–150 g) was lyophilized for 48 h, after which the dry weight was recorded. The lyophilized samples were then ground to pass through a 0.5 mm sieve and stored at −20 °C until further analysis. Each chemical analysis in the biological samples was performed in triplicate using a 5 g sample, except for the determinations of lycopene and beta-carotene, which required only 1.5 g.
Climate data for the study period (January–October 2024) indicated that minimum temperatures ranged from 19.7 °C to 27.1 °C, while maximum temperatures varied between 32.0 °C and 40.7 °C. The lowest average temperatures were recorded in January, whereas April exhibited the highest average temperatures (Figure 1). The highest rainfall levels occurred in June, with peak rainfall reaching 431.7 mm from June to July. Following a dry period, rainfall increased again in September, reaching 421.5 mm. In addition, relative humidity fluctuated between 54 and 85% throughout the study period (Figure 2).

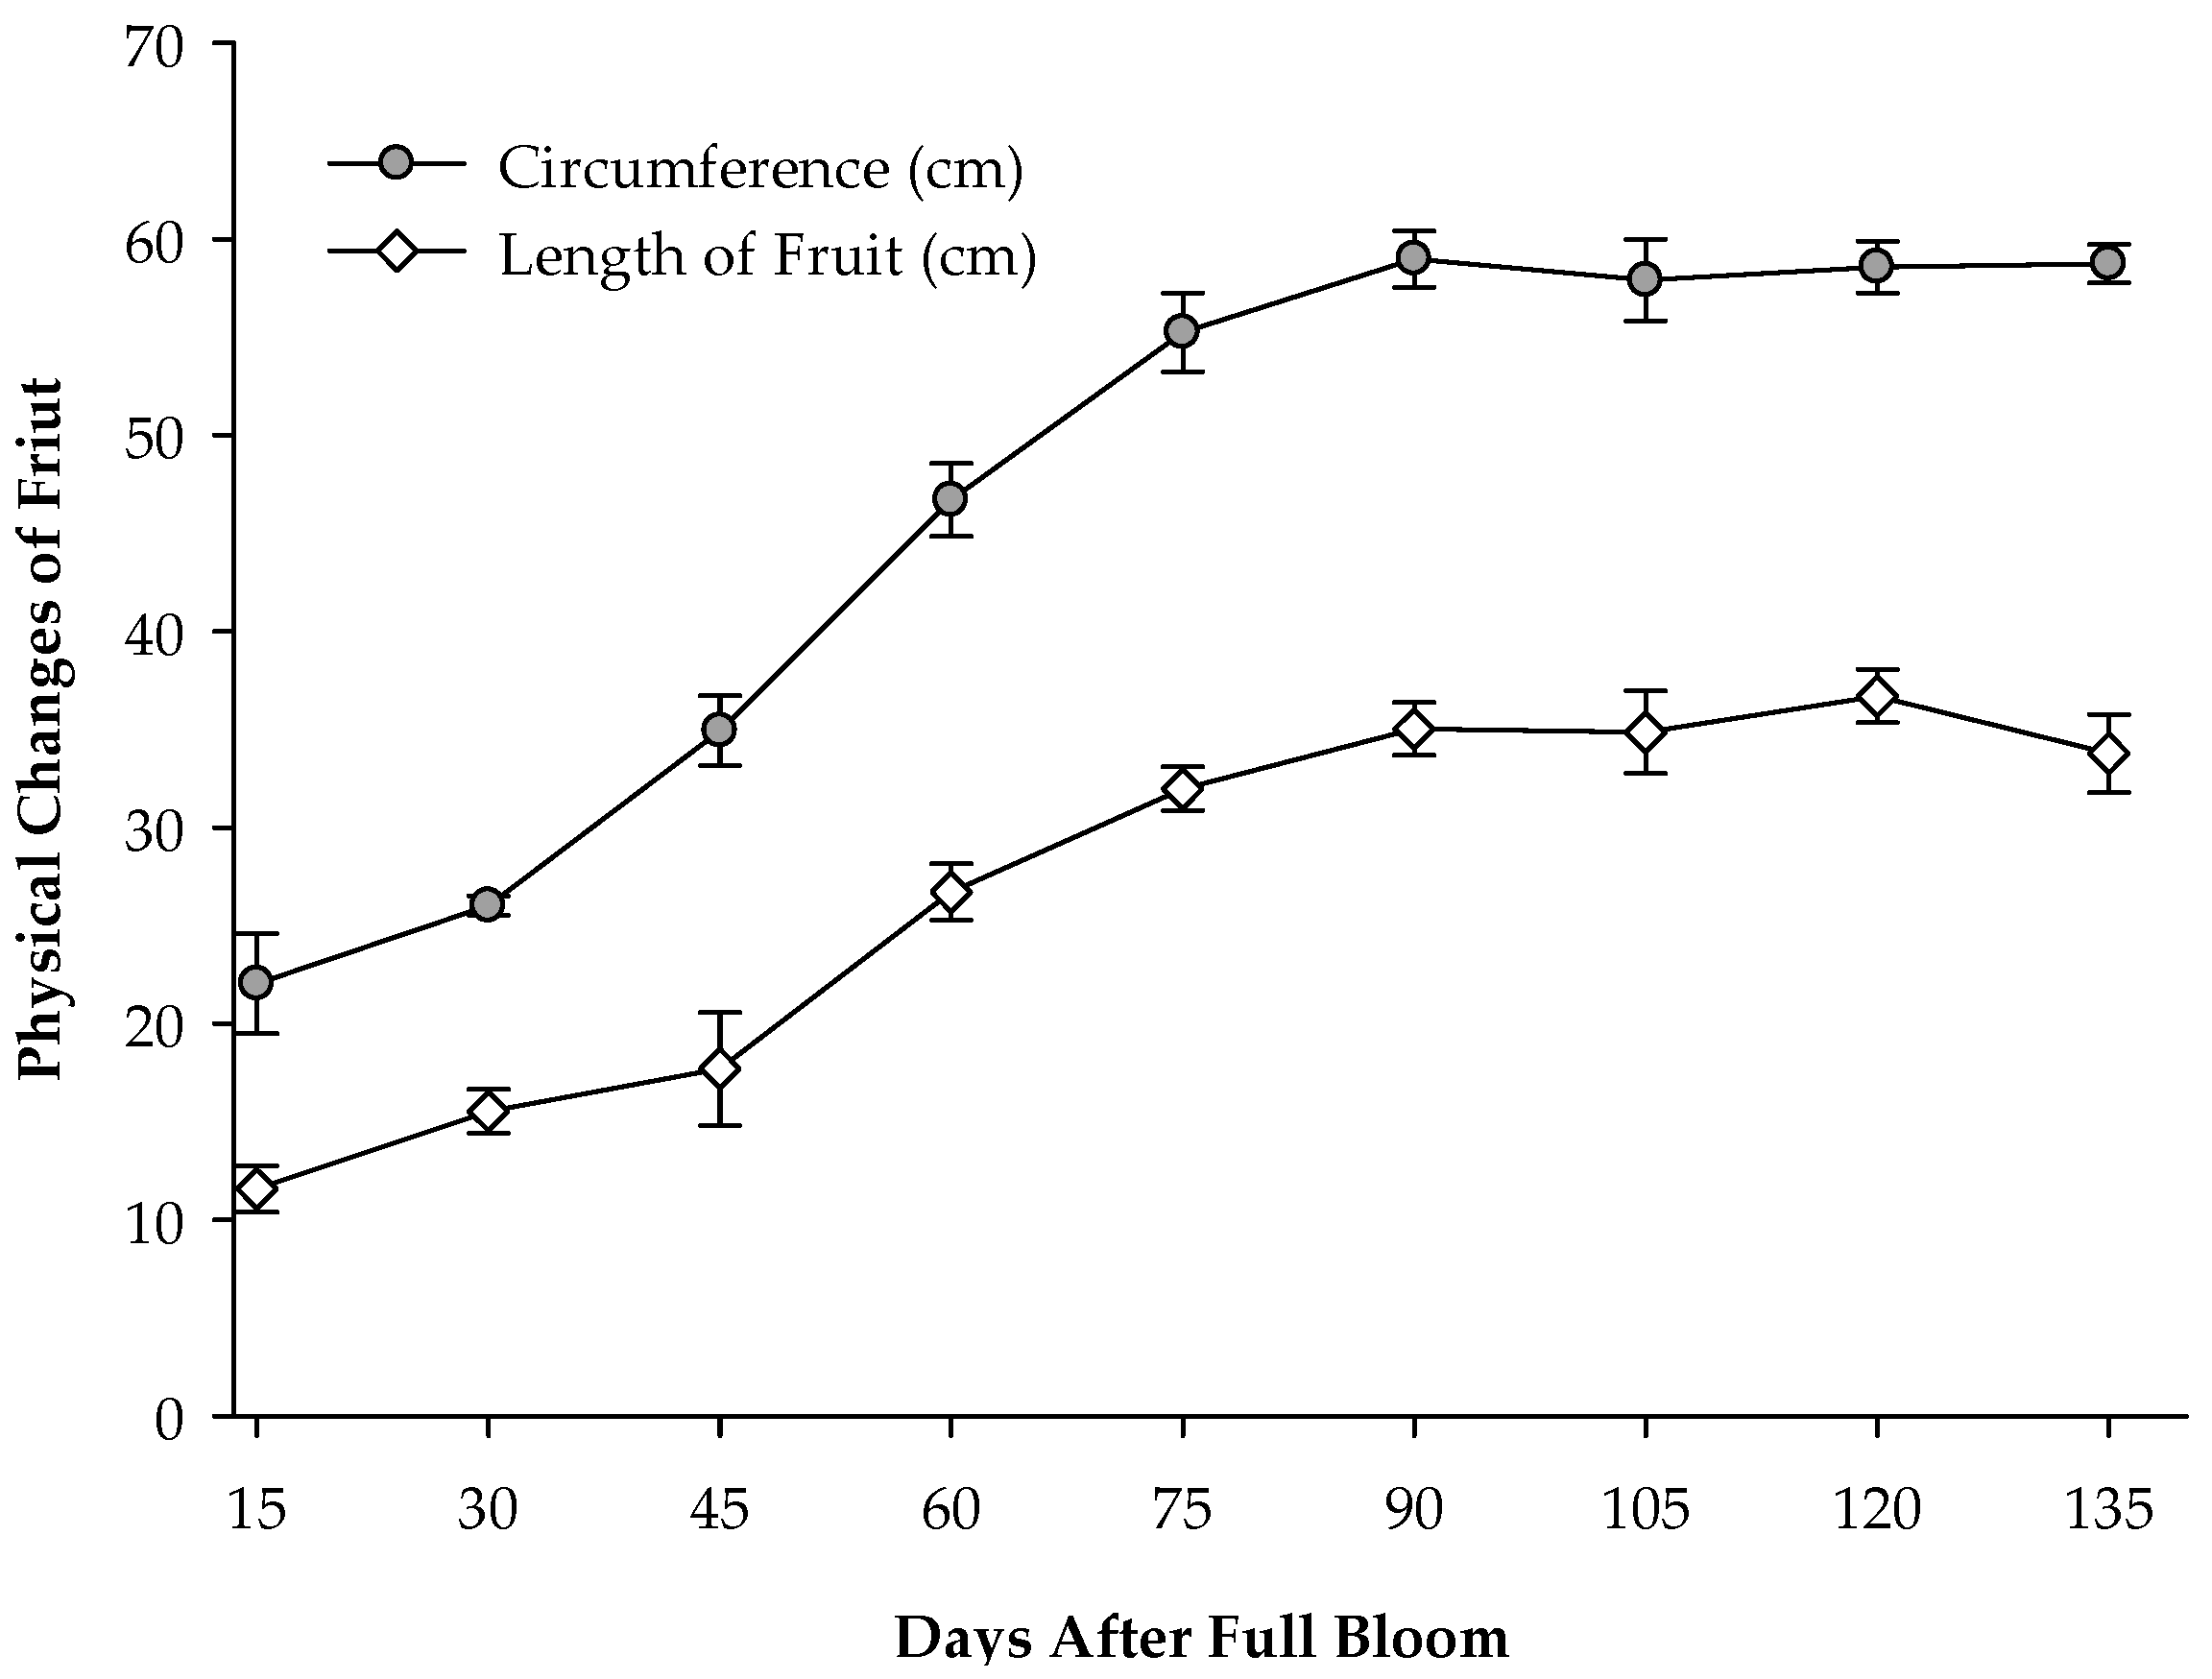
2.2. Determination of Fruit Growth

Fruit growth was assessed based on fruit circumference, length, and fresh weight. Circumference was measured at the widest part of each fruit, while length was determined as the distance from the stylar end to the stem end, both recorded in centimeters (cm). Fresh weight was measured individually using a digital balance (AND, Tokyo, Japan) and recorded in grams (g).

2.3. Determination of Color Change, Pulp Firmness, Dry Matter, TSS, and TA

The color properties of fruit peel and pulp were measured in terms of L*, a*, and b* values using a color meter (HunterLab MiniScan EZ 1043, Hunter Associates Laboratory Inc., Reston, VA, USA). Hue and chroma values were calculated using the respective equations by Kalra et al. and Bouzayen et al. [11,12]. Pulp firmness was measured using a penetrometer (Daiichi-FG 520K, Osaka, Japan) equipped with a 0.5 cm diameter cylindrical plunger. The force exerted (N/cm2) was recorded as the plunger penetrated the fruit pulp to a depth of 0.5 cm. A pulp sample was taken from the middle of two major lobes after removing the rind. The pulp was then chopped, thoroughly mixed, and a 20 g sample was dried in a hot-air oven at 70 °C for 48 h or until a constant weight was achieved [13]. The percentage of dry matter was computed based on (w1/w2) × 100, where w1 is the weight prior to drying and w2 is the weight following complete drying. That calculation followed the method described by Sulaiman et al. [13]. The durian samples from each fruit (four replicates per treatment) were homogenized for the analysis of total soluble solids (TSS) and titratable acidity (TA). A 20 g fresh pulp sample was oven-dried at 70 °C for 48 h until a constant weight was achieved. The total soluble solids (TSS) content of the filtered juice was measured using a digital hand-held pocket refractometer (ATAGO, PAL-1, Tokyo, Japan). The results were recorded in °Brix. Titratable acidity (TA) was determined by titrating 5 mL of juice with 0.1 N NaOH, using 1% phenolphthalein as an indicator. The results of the titratable acidity (TA) analysis are expressed as a percentage of malic acid, as it is the primary organic acid found in durian arils. The values were recorded as a percentage.

2.4. Determination of Vitamin C Content

The vitamin C content was determined according to the method described by Mouhannad et al. [14]. A 5 g sample of homogenized fruit pulp was collected for analysis. To prepare 0.005 mol L⁻1 iodine solution, a total of 2.0 g of potassium iodide (KI) and 1.3 g of iodine were weighed and placed in a beaker. A small volume of distilled water was added, and the mixture was swirled until the iodine was completely dissolved. The resulting solution was transferred to a 1 L volumetric flask, ensuring that all traces of the solution were rinsed into the flask with distilled water. The volume was then adjusted to the mark with distilled water. To prepare starch indicator solution (0.5%), a total of 0.50 g of soluble starch was dissolved in 100 mL of near-boiling distilled water in a 250 mL beaker while stirring continuously. The solution was then allowed to cool to room temperature before use. For titration, a 20 mL aliquot of the sample solution was pipetted into a 250 mL conical flask, followed by the addition of approximately 150 mL of distilled water and 1 mL of the starch indicator solution. The endpoint of the titration was identified by the first persistent appearance of a dark blue-black color, indicating the formation of the starch–iodine complex.

2.5. Determination of Total Phenolic Content

The quantification of the total phenolic content of durian extracts used the Folin–Ciocalteu assay, following the method described by Sulaiman et al. [13]. A 5 g sample was mixed with 7 mL of 50% ethanol and incubated for 30 min before centrifugation at 2500 rpm for 20 min at 25 °C. Subsequently, 0.1 mL of the extract was added to 0.75 mL of Folin–Ciocalteu reagent (diluted 1:10 in deionized water) and incubated for 3 min. Then, 0.75 mL of 7.5% sodium carbonate and 8.4 mL of distilled water were added. After a 30 min incubation in the dark, absorbance was measured at 765 nm.

2.6. Determination of Total Flavonoid Content

The total flavonoid content of the durian extract was determined following the method described by Marinova et al. [15], with slight modifications. Briefly, 5 g of the sample was mixed with 7 mL of 50% ethanol and incubated for 30 min. The mixture was then centrifuged at 2500 rpm for 20 min at 25 °C. An aliquot of the extract (1 mL) was added to 4 mL of distilled water, followed by the addition of 0.3 mL of 5% sodium nitrite. After 5 min of incubation, 0.3 mL of 10% aluminum chloride was added. One minute later, 2 mL of 1 M sodium hydroxide and 2.4 mL of distilled water were added. The mixture was vortexed thoroughly, and the absorbance was measured at 510 nm to quantify the total flavonoid content.

2.7. Determination of Beta-Carotene Content

The beta-carotene content in durian extracts was determined using the method described by Volker et al. [16], with modifications to ensure consistency and reproducibility. A 1.5 g sample of durian extract was accurately weighed using an analytical balance and transferred into a clean, dry test tube. Care was taken to ensure that all samples were prepared under identical conditions to minimize variability. To facilitate the extraction of beta-carotene, a solvent mixture consisting of 1.5 mL of hexane, 0.75 mL of ethanol, and 0.75 mL of acetone was added to the sample. The selection of these solvents was based on their ability to dissolve beta-carotene efficiently while preventing oxidation. The mixture was then vortexed at a high speed for 1 min to ensure thorough homogenization of the sample and solvent system. Following vortexing, the sample was subjected to centrifugation at 5000 rpm for 10 min at a controlled temperature of 25 °C. The centrifugation process facilitated the separation of the solvent-extracted beta-carotene from solid residues, ensuring a clear upper phase for subsequent analysis. After centrifugation, 0.3 mL of the clear upper phase was carefully pipetted out and transferred into a clean test tube. To ensure accurate absorbance readings, the extract was diluted with 2.7 mL of hexane, resulting in a total volume of 3.0 mL. The dilution step helped in maintaining the absorbance values within the linear range of the spectrophotometer, thereby preventing deviations due to high analyte concentrations. The absorbance of the diluted extract was then measured at 449 nm using a UV-Vis spectrophotometer. A blank solution consisting of pure hexane was used to calibrate the spectrophotometer before each measurement to eliminate background interference.

2.8. Determination of Lycopene Content

The lycopene content in durian extracts was determined following the method described by Volker et al. [16]. In this procedure, a 1.5 g sample of durian pulp or extract was carefully weighed and placed into a suitable container. To this sample, 1.67 mL of hexane, 1 mL of ethanol, and 0.33 mL of distilled water were added. The hexane serves as a non-polar solvent to extract the lipophilic lycopene, while ethanol and water assist in breaking down any emulsions and help to maintain phase separation during the extraction process. Once the solvents were added, the mixture was vortexed vigorously for 1 min to ensure thorough mixing and extraction of lycopene from the sample matrix. After vortexing, the sample was subjected to centrifugation at 5000 rpm for 10 min at 25 °C. This step facilitates the separation of the mixture into two distinct phases: the upper hexane layer containing the extracted lycopene and other non-polar compounds, and the lower aqueous phase, which contains polar substances. Following centrifugation, the upper hexane phase was carefully separated using a micropipette or syringe, ensuring that the lower aqueous phase was not disturbed. A 0.3 mL aliquot of this upper hexane phase was then transferred into a clean vial and combined with 2.7 mL of hexane. This dilution was necessary to bring the extract into a concentration range suitable for spectrophotometric analysis. The prepared sample was analyzed using a spectrophotometer set to a wavelength of 472 nm, which corresponds to the absorption maximum of lycopene. The absorbance value obtained at this wavelength is directly proportional to the concentration of lycopene present in the extract. A standard calibration curve of known lycopene concentrations was used to quantify the lycopene content in the durian extract, allowing for accurate measurement of the compound’s concentration based on the recorded absorbance.

2.9. Determination of DPPH Radical-Scavenging Activity

The determination of DPPH radical-scavenging activity in durian extracts followed the method described by Kubola and Siriamornpun [17], with slight modifications. Briefly, 5 g of the sample was mixed with 10 mL of methanol for 30 min and subsequently centrifuged at 2500 rpm at 25 °C for 20 min. The resulting supernatant was collected and evaporated at 40 °C until approximately 2 mL remained or until complete dryness. The residue was rinsed, transferred into a 5 mL volumetric flask, and adjusted to a final volume of 5 mL with methanol. For the DPPH assay, 0.2 mL of the extract was added to 3 mL of a 0.0001 M DPPH solution in methanol. The mixture was incubated in the dark for 30 min, and absorbance was measured at 517 nm.

2.10. Determination of ABTS Radical-Scavenging Activity

The ABTS radical-scavenging activity of durian extracts was assessed following the method described by Montelongo et al. [18]. Briefly, 5 g of the sample was mixed with 10 mL of methanol and allowed to extract for 30 min. The mixture was then centrifuged at 2500 rpm at 25 °C for 20 min. The resulting supernatant was collected and evaporated at 40 °C until approximately 2 mL remained or until complete dryness. The residue was subsequently rinsed and transferred into a 5 mL volumetric flask, with the final volume adjusted to 5 mL using methanol. A 0.1 mL aliquot of the aqueous extract was then added to 1 mL of the pre-formed ABTS+ radical solution. After incubation in the dark for 30 min, absorbance was measured at 734 nm.

2.11. Statistical Analysis

The data were analyzed using a one-way analysis of variance (ANOVA) in the STATISTIX 10 software. A one-way ANOVA with the least significant difference (LSD) test was conducted to determine significant treatment differences (p ≤ 0.01) at each maturity stage. Additionally, correlation coefficients were calculated to assess the relationship between maturity stages and dry matter content.

3. Results

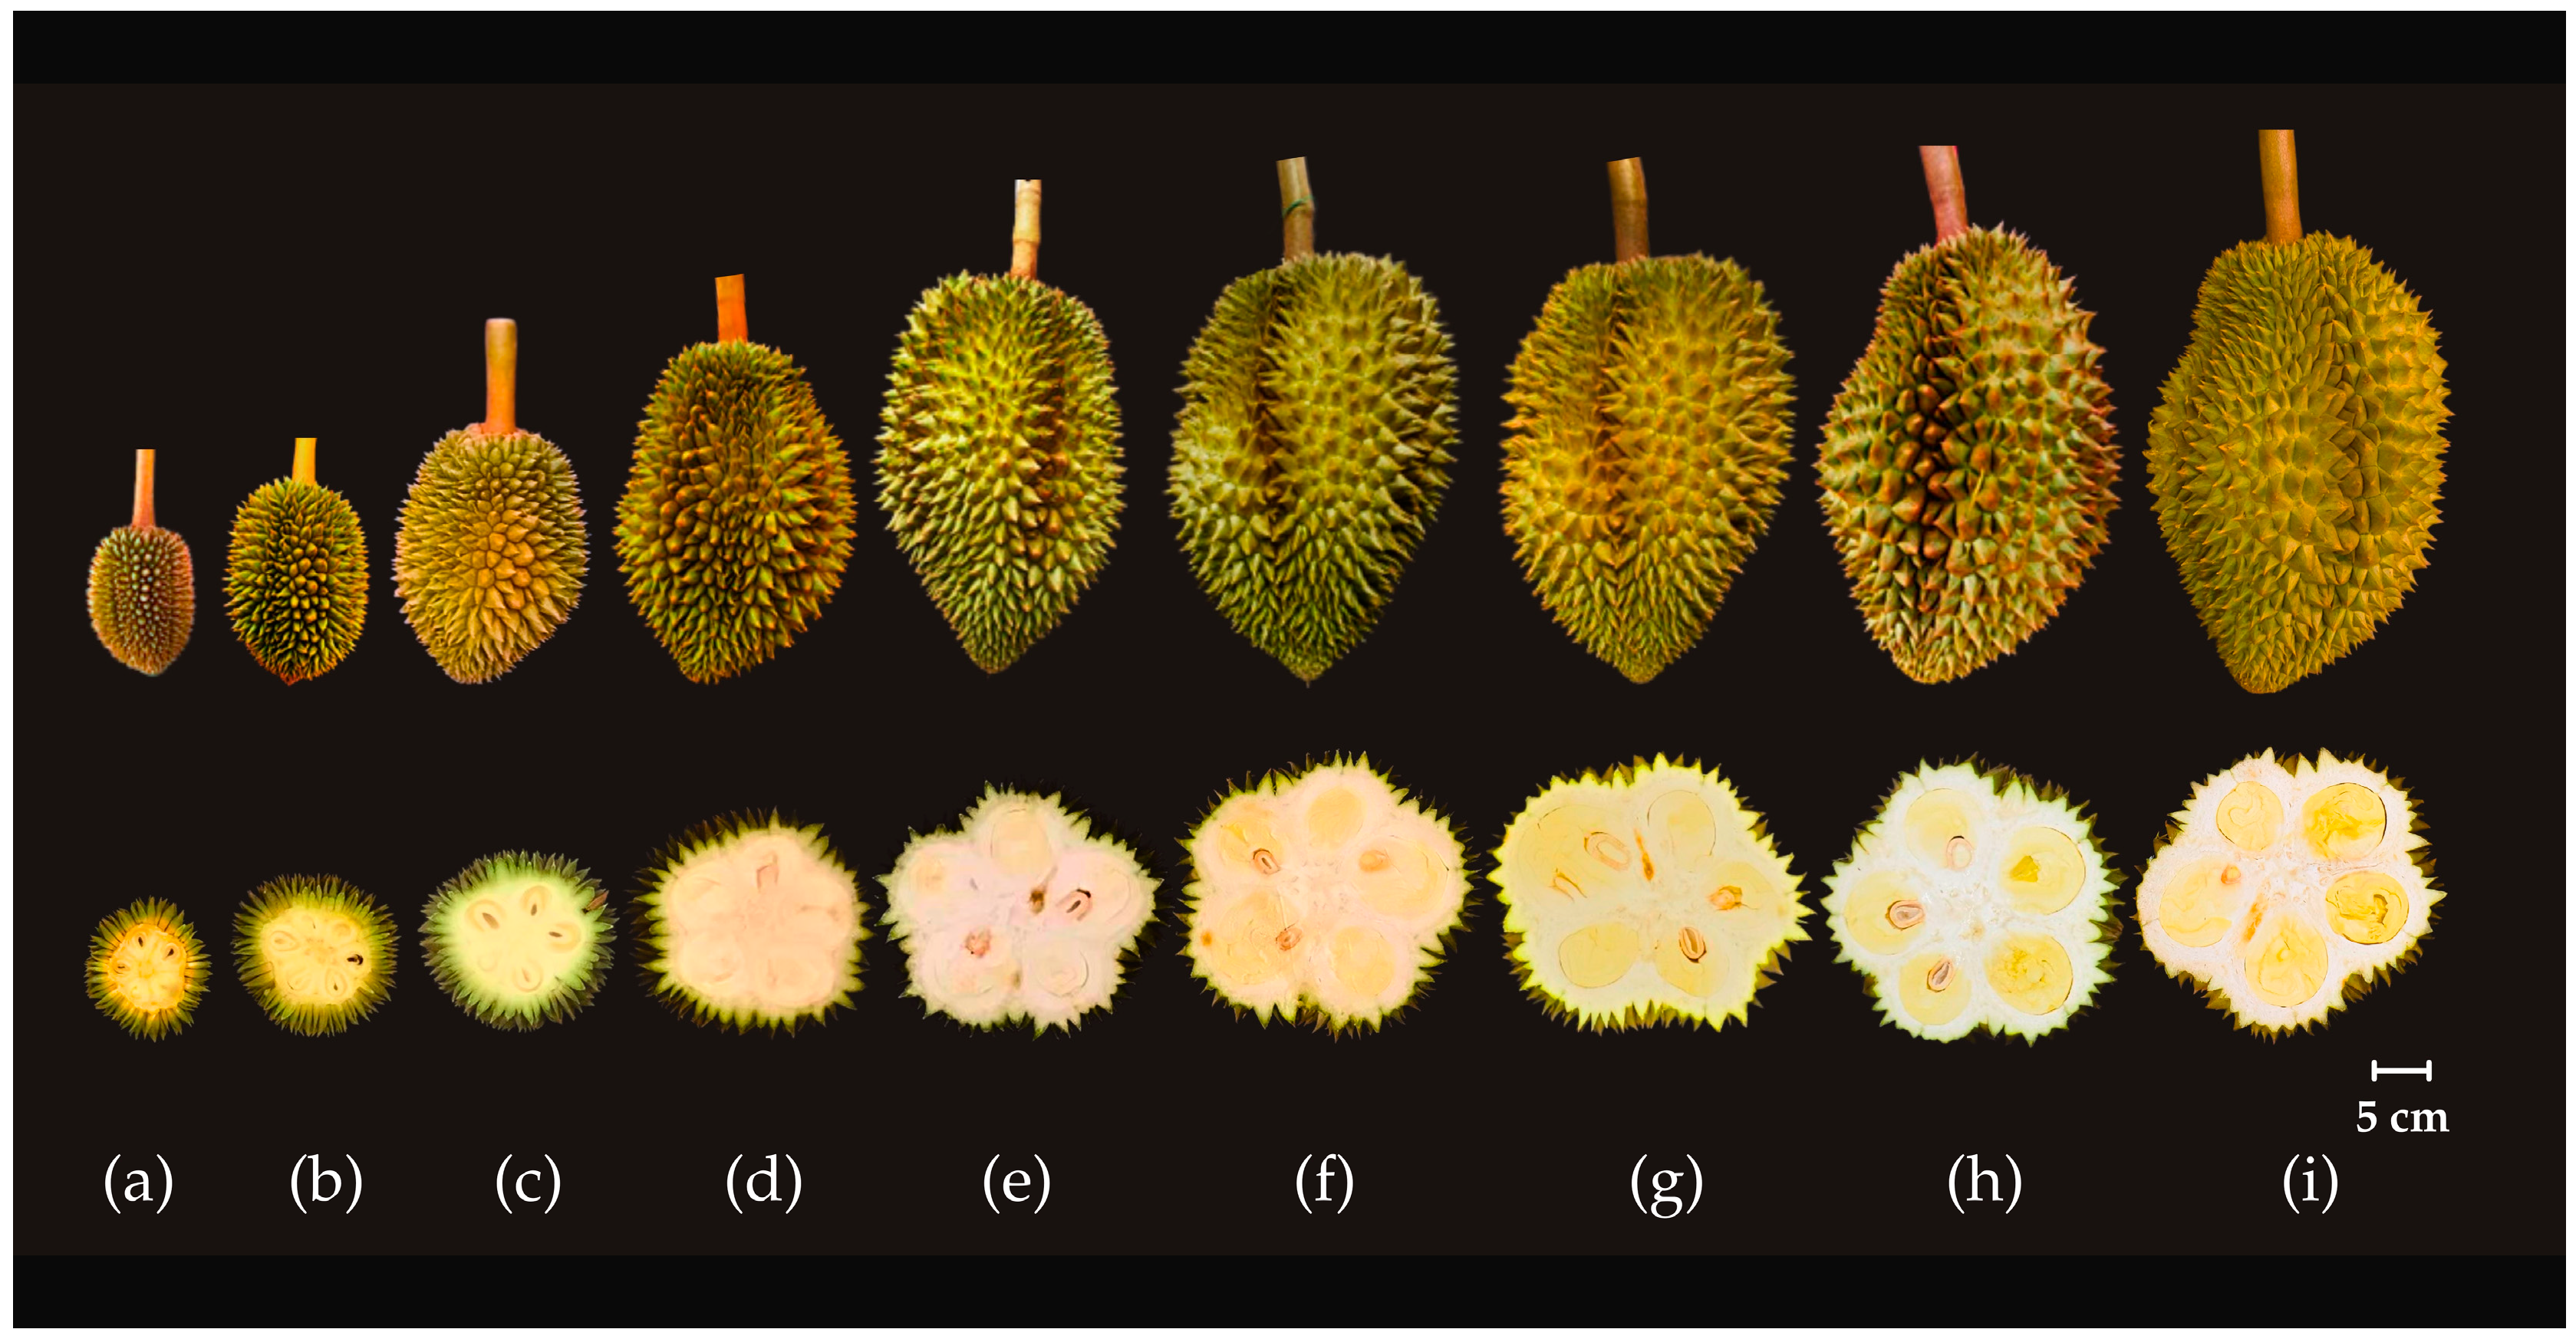
3.1. Growth and Development of ‘Monthong’ Durian Fruit from 15 to 135 Days After Full Bloom

A marked and consistent increase in fruit circumference was observed (Figure 3 and Figure 4). Starting at approximately 20 cm at 15 DAFB, the circumference expanded rapidly, reaching around 55 cm by 60 DAFB, indicating vigorous growth during early fruit development. Thereafter, growth decelerated, plateauing at approximately 60 cm. From 90 DAFB onward, circumference values remained relatively stable, suggesting that the fruit had attained its maximum girth.
Likewise, fruit length exhibited a gradual increase, rising from approximately 12 cm at 15 DAFB to about 28 cm by 75 DAFB (Figure 3 and Figure 4). Continued but slower elongation was recorded, peaking at roughly 35 cm by 105 DAFB. A slight decline in length was noted after this point, potentially attributable to post-maturity shrinkage.
These findings suggested that ‘Monthong’ durian underwent rapid dimensional growth—particularly in girth—during the first 60 days post-bloom. Between 90 and 105 DAFB, growth rates stabilized, signaling the transition toward physiological maturity. Notably, circumferential growth was more pronounced than longitudinal growth, underscoring a dominant lateral expansion pattern.

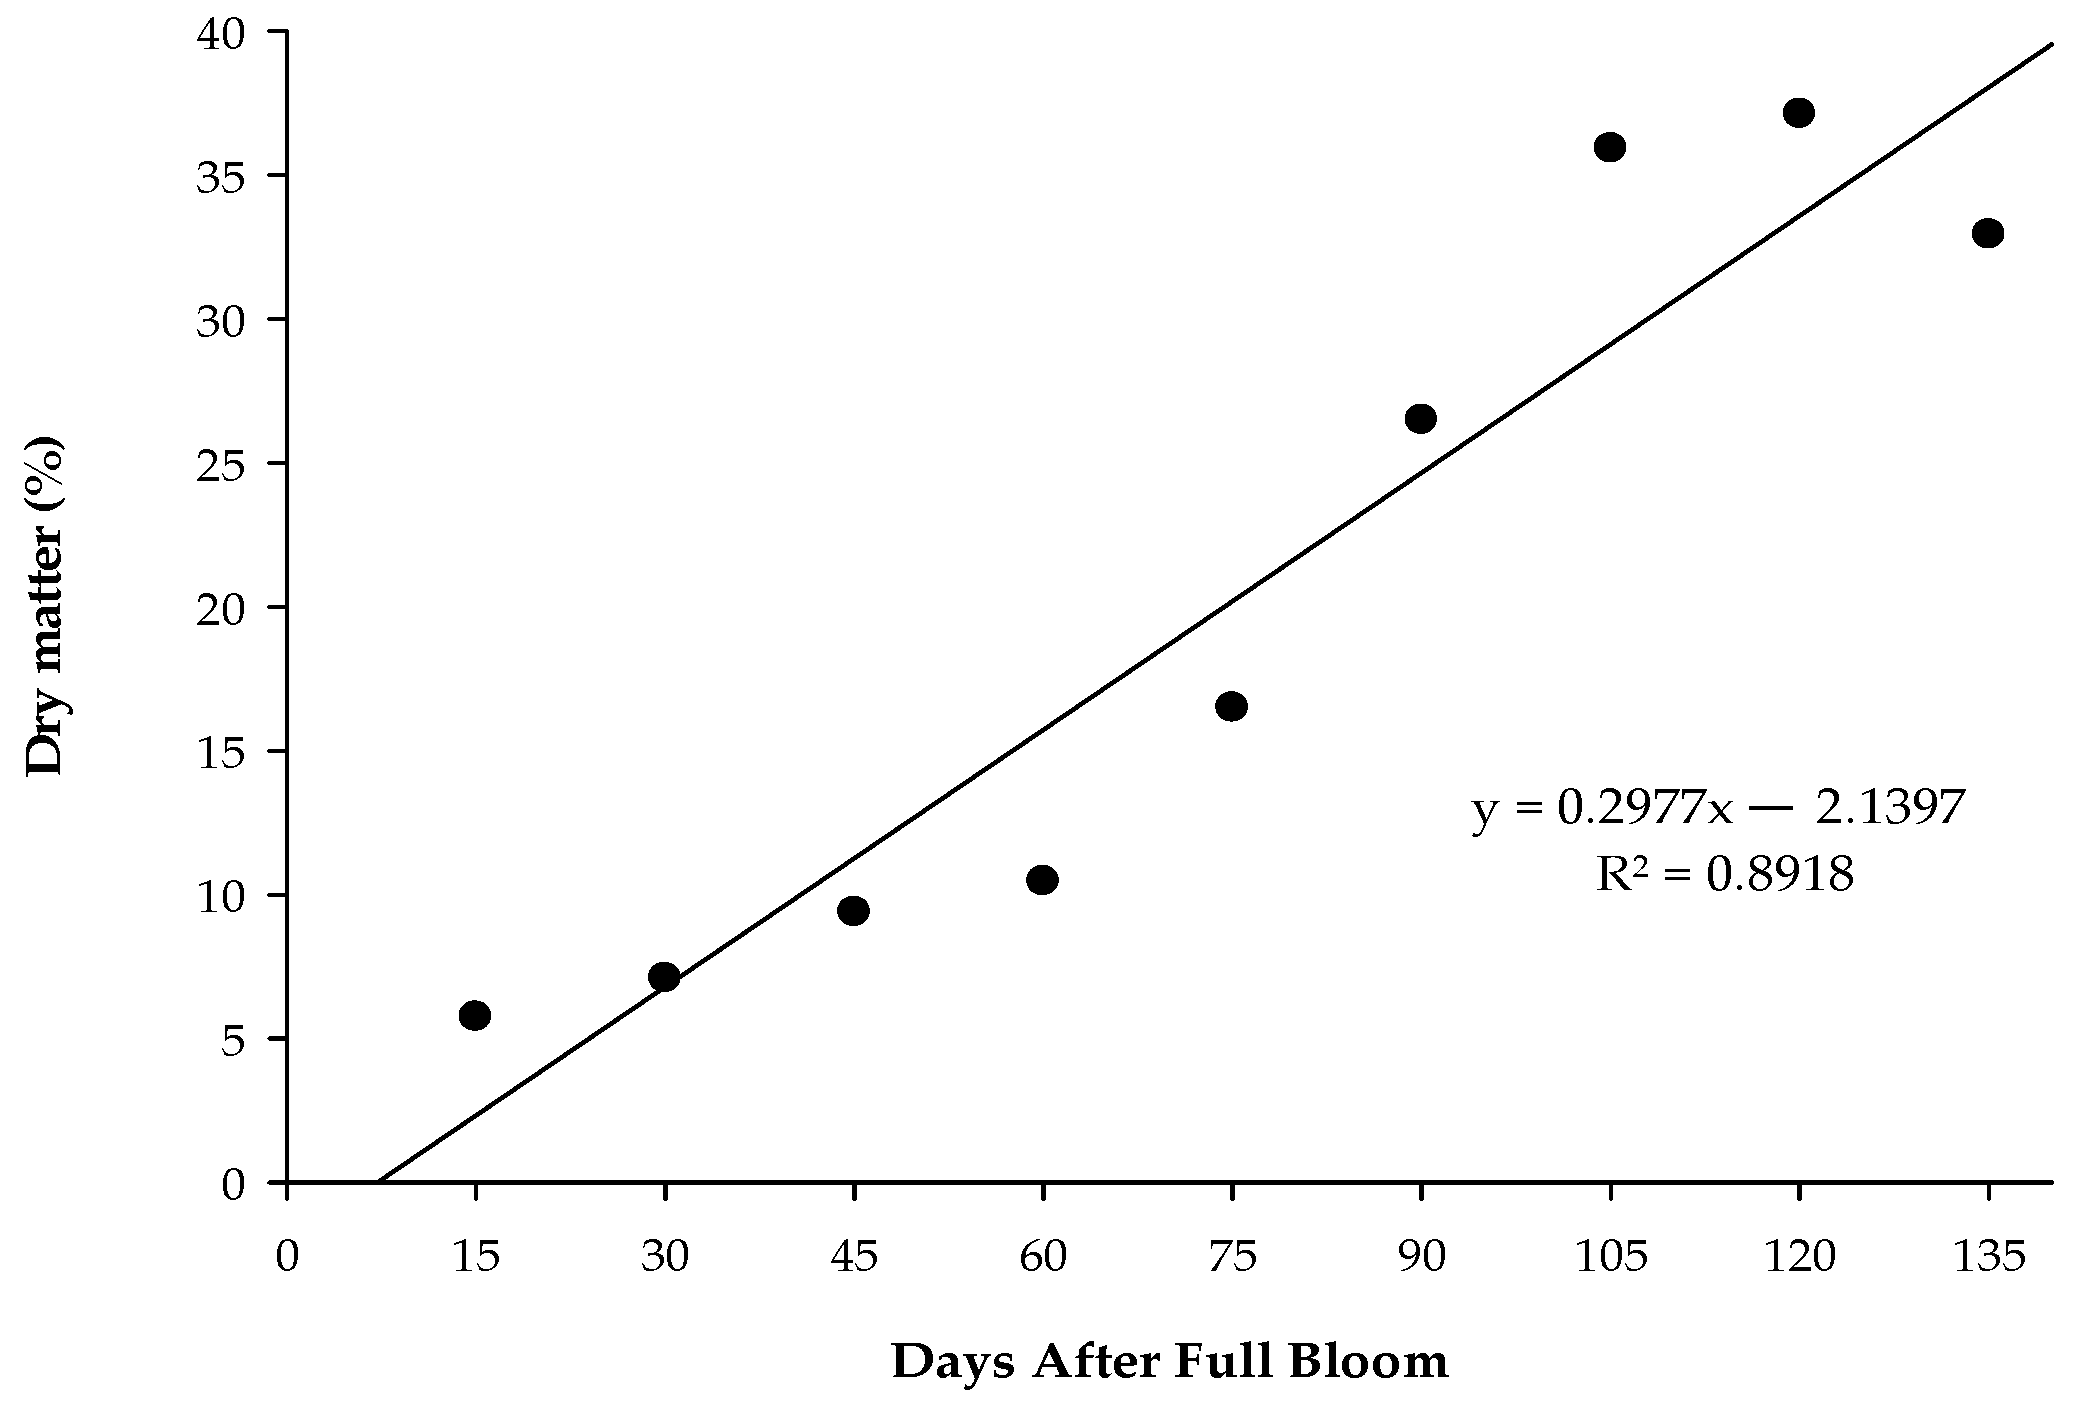
3.2. Dry Matter Accumulation, Fruit Weight, and Firmness Dynamics in ‘Monthong’ Durian Across Different Maturity Stages

The scatter plot (Figure 5) revealed a strong positive linear relationship between days after full bloom (DAFB) and dry matter (DM) content. As DAFB increased, the percentage of DM also rose, indicating progressive maturation and the accumulation of solids such as sugars and fibers in the fruit or plant tissue. During the initial growth phase (15–60 DAFB), DM content remained relatively low. A marked increase was observed between 75 and 120 DAFB, after which the rate of accumulation began to plateau around 135 DAFB.
Fruit weight increased steadily with days after full bloom (DAFB) (Table 1). Specifically, it rose from 137.35 g at 15 DAFB to a maximum of 3652.30 g at 120 DAFB. The highest fruit weight was recorded between 105 and 135 DAFB. Fruit firmness also increased during early and mid-development stages, reflecting structural maturation, but declined markedly by 135 DAFB—indicative of softening associated with full ripeness. Dry matter content, a critical parameter for evaluating durian quality, showed a continuous upward trend from 15 to 135 DAFB, increasing from 5.75% to 37.31%. A statistically significant peak was observed at 120 DAFB, where dry matter content reached 37.13%.
These findings suggest that the optimal harvest window lies between 105 and 120 DAFB, offering a favorable balance among fruit weight, firmness, and dry matter content. Harvesting at 90–105 DAFB may preserve maximal firmness, which is advantageous for storage and transport. In contrast, fruit harvested at 135 DAFB—although suitable for immediate consumption due to peak ripeness—exhibits diminished firmness and dry matter content, rendering it less ideal for post-harvest handling.

3.3. Color Changes in ‘Monthong’ Durian Peel and Pulp at Different Harvest Maturity Stages

Peel color exhibited marked changes throughout fruit development, as reflected by variations in brightness (L*), green–red (a*), and blue–yellow (b*) color parameters (Table 2). The L* value followed a non-linear trend, reaching a maximum of 29.36 at 45 days after full bloom (DAFB), followed by a consistent decline. This pattern indicates progressive darkening of the peel, particularly after 60 DAFB. The a* value remained low and relatively stable (generally below 1.5) between 15 and 75 DAFB, then increased sharply to a peak of 1.92 at 135 DAFB. This suggests a gradual reduction in green hue and an onset of red pigmentation during later stages of maturity, especially after 105 DAFB. Meanwhile, the b* value increased steadily from 15 to 120 DAFB, peaking at 18.37, and then slightly declined. This trend indicates an intensification of yellow coloration with ripening, with the most pronounced color development occurring near full maturity.
Pulp color exhibited marked changes throughout fruit maturation, as reflected in the brightness (L*), green–red (a*), and blue–yellow (b*) color parameters (Table 2). The L* value increased from 74.31 at 15 days after full bloom (DAFB) to 82.78 at 105 DAFB, followed by minor fluctuations, suggesting a progressive brightening of the pulp during ripening—potentially indicative of increased moisture content and reduced cellular opacity. The a* value declined consistently from 6.41 at 15 DAFB to 0.26 at 60 DAFB, before rising slightly, indicating a transition from green to a more neutral or yellow tone, consistent with chlorophyll degradation and carotenoid development. The b* value showed a pronounced increase from 27.27 at 15 DAFB to a peak of 49.90 at 135 DAFB, signifying an intensification of yellow pigmentation—a characteristic commonly associated with ripening-related biochemical changes, including sugar accumulation.

3.4. Fruit Quality Dynamics in ‘Monthong’ Durian Across Different Maturity Stages

Total soluble solids (TSS) exhibited a progressive increase with fruit maturation, rising from 2.80 °Brix at 15 days after full bloom (DAFB) to a maximum of 25.00 °Brix at 135 DAFB (Table 3), reflecting a consistent accumulation of sugars as the fruit ripened. Titratable acidity (TA) followed a biphasic trend, increasing to a peak of 2.67% at 105 DAFB before declining sharply to 0.78% at 135 DAFB. This pattern suggests a mid-maturation acid peak, followed by substantial deacidification during the later stages of ripening. Correspondingly, the TSS/TA ratio—a key indicator of the balance between sweetness and acidity—increased markedly from 0.46 at 15 DAFB to 32.05 at 135 DAFB. Low ratios during early development are indicative of dominant acidity, whereas high ratios at later stages highlight the predominance of sweetness. Vitamin C content displayed a non-linear trajectory, peaking at 512.33 mg/100 g fresh weight (FW) at 105 DAFB before declining to 166.17 mg/100 g FW by 135 DAFB. This suggests that vitamin C accumulation is optimized around mid-maturity.

3.5. Antioxidant Profiles and Dynamics in ‘Monthong’ Durian Across Different Maturity Stages

Total phenolic content increased significantly with fruit maturation, reaching its peak at 120 days after full bloom (DAFB) with 43.98 mg/100 g FW, followed by a slight decline to 39.00 mg/100 g FW at 135 DAFB. A pronounced accumulation of phenolics was observed post-90 DAFB, indicating enhanced biosynthesis during the later stages of development. Similarly, total flavonoid content exhibited a gradual increase, peaking at 120 DAFB (8.33 mg catechin equivalents/100 g FW), before declining markedly at 135 DAFB (4.22 mg catechin equivalents/100 g FW).
Beta-carotene levels demonstrated a consistent upward trend, attaining the highest concentration at 120 DAFB (1.35 mg/100 g FW), followed by a reduction to 0.89 mg/100 g FW at 135 DAFB. Lycopene content also increased progressively with maturation, peaking at 53.98 mg/100 g FW at 120 DAFB and slightly decreasing to 48.80 mg/100 g FW thereafter. These patterns suggest active carotenoid and lycopene biosynthesis during late maturation stages, coinciding with visible pigment development.
ABTS radical-scavenging activity exhibited a distinct peak at 90 DAFB (5.89 mg Trolox equivalents (TE)/100 g FW), followed by a significant decline, indicating that antioxidant potential as measured by ABTS is not directly correlated with total phenolic content, implying the involvement of additional antioxidant contributors. In contrast, DPPH radical-scavenging activity increased with maturity, reaching its maximum at 120 DAFB (6.32 mg TE/100 g FW), and declined marginally thereafter. Notably, DPPH activity showed a stronger correlation with total phenolic accumulation.
These findings indicate that the overall antioxidant capacity, particularly via DPPH and ABTS assays, is highest between 90 and 120 DAFB. The concentrations of phenolics, flavonoids, carotenoids, and lycopene also culminate at 120 DAFB, with most parameters either plateauing or declining by 135 DAFB, likely due to over-ripening or compound degradation. Therefore, 120 DAFB represents the optimal harvest maturity for maximizing antioxidant properties and bioactive compound content in durian cv. ‘Monthong’.

4. Discussion

This study investigated the growth and development of ‘Monthong’ durian fruit over a period of 15 to 135 days after full bloom (DAFB), focusing on changes in its physical characteristics. The results demonstrated a continuous increase in fruit circumference and length with age. These findings align with previous reports on ‘Monthong’ durian, where fruit length at 84–119 DAFB ranged from 25 to 35 cm [19]. The observed growth pattern followed a single sigmoidal curve, as described by Ketsa et al. [20]. The growth and development of durian fruit are primarily driven by cell division and cell enlargement. These two fundamental mechanisms contribute to the increase in fruit size, mass, and overall morphological development [19]. In the early stages of fruit development, cell division predominates, leading to an increase in the number of cells. This mitotic activity occurs actively in the meristematic regions, where new cells are generated through precise regulation of the cell cycle [21]. As the fruit matures, the transition from cell division to cell expansion becomes a key determinant of fruit enlargement. Cell enlargement occurs through processes such as vacuolar expansion, wall loosening, and increased turgor pressure [22]. The extensibility of the cell wall is modulated by enzymes such as expansins and xyloglucan endotransglucosylase/hydrolase (XTH), which facilitate wall remodeling and allow cells to expand significantly in size [23].
Additionally, plant hormones play a crucial role in regulating growth and physiological development at different stages. For example, hormones from the cytokinin and gibberellin groups promote rapid cell enlargement, facilitating fruit enlargement [24]. Cytokinins stimulate cell division and delay senescence, ensuring sustained development, while gibberellins promote cell elongation by loosening the cell wall and enhancing cellular expansion [25]. Additionally, auxins contribute to fruit set and early growth by modulating both cell division and elongation, whereas abscisic acid (ABA) plays a role in fruit ripening and maturation by regulating water balance and stress responses [26]. Understanding the intricate mechanisms of cell division and expansion, along with the hormonal regulation of these processes, is essential for optimizing durian fruit production. Further research on the molecular and physiological factors influencing these mechanisms could provide valuable insights for improving fruit quality, yield, and post-harvest longevity.
The results presented in Figure 5 exhibited a positive association between dry matter (DM) accumulation and days after full bloom (DAFB), with DM percentage increasing as fruit development progressed (R2 = 0.8918). As the fruit ripens, complex carbohydrates break down into simpler sugars, leading to reduced moisture content and higher DM levels [27]. Consequently, tree-abscised fruits exhibit greater DM accumulation. DM content serves as a key indicator of fruit maturity [28]. Kalayanamitra et al. [29] reported that durian reaches the critical immature stage at 60% DM and the minimum acceptable maturity threshold at 70%. In addition, Ngoenchai et al. [30] categorized durians into four maturity groups based on percent DM: <26.00% (group 1), 26.00–29.99% (group 2), 30.00–33.99% (group 3), and >34.00% (group 4), corresponding to maturity levels of 60%, 70%, 80%, and 90%, respectively. These classifications align with the standards set by the National Bureau of Agricultural Commodity and Food Standards [31], which recommends a minimum DM content of 32% for high-quality, harvest-ready ‘Monthong’ durians.
The results presented in Table 1 demonstrated a clear trend of increasing fruit weight in ‘Monthong’ durian as the fruit matured. During the early developmental phase (15–45 DAFB), the fruit showed continuous weight gain, indicating its immaturity and ongoing growth potential. Between 60 and 105 DAFB, the fruit experienced a rapid growth phase primarily driven by cell extension in the flesh, leading to significant increases in both size and weight before reaching physiological maturity [32,33]. Pulp firmness exhibited a general increasing trend from 15 to 120 DAFB, with the highest recorded value at 105 DFAB. This firmness is influenced by the structural integrity of the cell wall, which is primarily composed of polysaccharides such as cellulose. Cellulose microfibrils, interconnected by hydrogen bonds, provide the primary framework, while hemicellulose and pectin serve as additional structural components [24]. Hemicellulose functions to link microfibrils, whereas pectin facilitates the binding of cellulose and hemicellulose, thereby enhancing cell wall rigidity. However, after 120 DAFB, pulp firmness declined, reaching its lowest value at 135 DAFB due to over-ripening. This softening process is attributed to the degradation of cellulose, pectin, and hemicellulose, which compromises the cell wall structure and facilitates fruit ripening [34]. Dry matter (DM) content, an essential parameter for durian quality assessment, exhibited a progressive increase from 15 to 135 DAFB, peaking at 120 DAFB. The DM pattern aligns with previous findings by Timkhum and Terdwongworakul [35]. Early in fruit development, the flesh primarily consists of water. Over time, the accumulation of sugars, starches, and lipids contributes to the steady increase in dry matter content [36]. These results underscore the importance of developmental timing in determining optimal harvest periods, particularly for export-quality Thai durian [37].
Chromaticity values, including L* (lightness), a* (green–red), and b* (blue–yellow), serve as key indicators for assessing fruit maturity. The evaluation of these parameters is based on the progressive color changes that occur during ripening. The L* value, which ranges from 0 to 100 and represents brightness, generally decreases as fruits mature due to pigment accumulation and moisture loss. The a* value transitions from negative (green) to positive (red/orange) as chlorophyll degrades, while the b* value increases with the development of yellow pigments, primarily carotenoids. This chromatic assessment method has been extensively applied to various fruits, including passion fruit [38], pomelo [39], guava [40], and mango [41]. Our findings, presented in Table 2, indicate that as ‘Monthong’ durian matures, its peel progressively darkens and exhibits a more pronounced yellow hue, while the pulp also intensifies in yellow coloration with minimal green undertones. The increased b* values in the pulp, particularly at later developmental stages (120–135 DAFB), suggest optimal maturity for harvest. Additionally, in terms of changes in peel coloration specifically, a decrease in L* values and an increase in b* values may serve as reliable external indicators of internal pulp ripeness, facilitating non-destructive maturity assessment.
In this study, we observed that the majority of biochemical compounds exhibited significant changes during durian fruit maturation, altering the fruit quality and palatability. Our findings indicate distinct physiological phases: early-stage fruits (15–45 DAFB) are characterized by low sugar content, high acidity, and underdeveloped flavor profiles. By 105 DAFB, fruit quality is enhanced through elevated vitamin C levels, substantial acidity, and increasing sugar content, resulting in a more balanced flavor. At advanced stages (120–135 DAFB), fruits exhibit peak sugar levels and TSS/TA ratios, but with con-current declines in acidity and vitamin C, marking the onset of over-ripening. These re-sults underscore the critical importance of precise harvest timing in durian, with the 105–135 DAFB window offering the most favorable balance between sweetness, acidity, and nutritional quality. TSS has been widely recognized as a key parameter in assessing fruit quality, particularly in relation to sugar accumulation and maturity. Previous studies have demonstrated that TSS serves as a reliable indicator of sugar accumulation in fruit, as its levels typically increase as the fruit ripens [7]. This increase is primarily attributed to the breakdown of complex carbohydrates, such as starch, into simpler sugars, including glucose, fructose, and sucrose, which are the predominant contributors to fruit sweet-ness [42]. As fruit progresses through various stages of maturity, significant biochemical and structural modifications occur. The degradation of starch reserves, coupled with enzymatic activities regulating carbohydrate metabolism, plays a crucial role in the observed rise in TSS. Additionally, changes in cell wall components, particularly the pectin structure and neutral sugar composition, contribute to the overall solubility of these substances, further enhancing TSS concentrations [6,43]. Pectin degradation, facilitated by enzymes such as pectin methylesterase and polygalacturonase, softens the fruit, leading to in-creased water solubility and the subsequent release of soluble solids, including sugars and organic acids [44]. Moreover, higher TSS values are typically associated with im-proved sweetness and flavor development, making this parameter essential for post-harvest quality assessment and determining the optimal harvest time. Given the di-rect relationship between TSS and fruit sugar content, it remains a fundamental criterion in the evaluation of fruit maturity, marketability, and overall sensory attributes.
During the initial stages of fruit development, acidity levels exhibit a characteristic increase before gradually declining as the fruit matures. This reduction in acidity is primarily attributed to the utilization of organic acids in key metabolic processes, including respiration and the conversion of stored starch into soluble sugars [45]. These metabolic shifts play a crucial role in determining fruit quality, influencing parameters such as taste, sweetness, and overall consumer preference. One of the central enzymes involved in this biochemical transformation is invertase, which catalyzes the hydrolysis of sucrose into its constituent monosaccharides, glucose and fructose. This enzymatic reaction not only contributes to the accumulation of simple sugars but also regulates sugar partitioning and energy metabolism within the developing fruit [46].
Ascorbic acid, commonly known as vitamin C, is a vital antioxidant that plays a fundamental role in cellular protection by neutralizing reactive oxygen species (ROS) and mitigating oxidative-stress-induced damage. This essential molecule is involved in various physiological and biochemical processes, including enzymatic reactions, hormone biosynthesis, and the maintenance of redox homeostasis [47]. During fruit development, ascorbic acid is present in considerable quantities, highlighting its significance in metabolic pathways that contribute to growth, maturation, and stress responses. However, its concentration exhibits a declining trend as the fruit approaches full maturity, a phenomenon that has been observed across multiple plant species [48,49]. This reduction may be attributed to increased catabolism, reduced biosynthesis, or its utilization in antioxidative defense mechanisms.
Our study also revealed a progressive increase in the content of phenolics, flavonoids, β-carotene, lycopene, and DPPH radical-scavenging activity from 30 to 120 DAFB (Table 4). These findings indicate that, as fruit maturation progresses, the concentrations of phenolics, flavonoids, β-carotene, lycopene, and antioxidant activity increase, peaking at maturity before declining. This trend aligns with previous research, which suggests that bioactive compounds are abundant in the early stages of fruit development but decrease as ripening progresses [24]. The ripening process has been identified as a key factor influencing antioxidant activity in fruits [50,51]. The increase in antioxidant levels during ripening may serve as a protective mechanism against oxidative stress, as antioxidants counteract reactive oxygen species [52]. Tissues with higher antioxidant activity exhibit greater resistance to oxidative stress compared to those with reduced antioxidant potential [6], which may explain the decline in antioxidant levels once the fruit surpasses the optimal harvesting stage. Previous studies have shown that extending harvest maturity significantly enhanced the levels of carotenoids (from 22.3 μg/g FW to 122.0 μg/g FW), lycopene (from 5.9 μg/g FW to 47.1 μg/g FW), phenolics (from 65.1 μg GAE/g FW to 125.0 μg GAE/FW), and flavonoids (from 29.1 μg CE/g FW to 50.9 μg CE/g FW) in tomatoes. However, beta-carotene levels exhibited fluctuations with extended maturity, ranging from 0.81 μg/g FW to 2.12 μg/g FW. Additionally, antioxidant activity increased with extended maturity, as evidenced by the rise in DPPH values (from 25.7% to 85.6%) and FRAP values (from 1.38 μmol/g TE FW to 3.35 μmol/g TE FW) [53].

5. Conclusions

The postharvest quality of ‘Monthong’ durian was significantly influenced by the timing of harvest. As the fruit matured, there was a progressive increase in dry matter content, yellowness, and pulp softening, indicative of ripening. Our findings suggest that harvesting ‘Monthong’ durian at 120 days after full bloom (DAFB) yields optimal fruit quality, characterized by superior taste and high levels of total soluble solids, acidity, total phenolics, flavonoids, β-carotene, lycopene, and antioxidant activity. Therefore, 120 DAFB is recommended as the optimal harvest time to maximize both sensory and nutritional attributes. However, our one-year results should be regarded as a preliminary study. Further research involving multi-environmental trials across multiple years and locations is necessary to confirm the presence of G × E interactions.

Author Contributions

Conceptualization, S.N.; methodology, S.N., N.Y., P.B., S.M. and S.I.N.A.; software, S.N., N.Y. and J.P.; validation, S.N.; formal analysis, S.N.; N.Y., C.-I.C. and Y.S.; investigation, S.N. and N.Y.; resources, S.N.; data curation, S.N. and N.Y.; writing—original draft preparation, S.N.; writing—review and editing, S.N.; visualization, S.N.; supervision, S.N.; project administration, S.N.; funding acquisition, S.N. All authors have read and agreed to the published version of the manuscript.

Funding

This research was financially supported by the Khon Kaen University Research Scholarship 2024 (Grant No. 4707498).

Data Availability Statement

The data that support the findings of this study are available from the corresponding author upon reasonable request.

Acknowledgments

We express our sincere gratitude to Department of Horticulture, Faculty of Agriculture, Khon Kaen University, Khon Kaen, Thailand for providing laboratory space and research facilities. Additionally, we also extend our sincere gratitude to Abil Dermail for his meticulous proofreading of the manuscript.

Conflicts of Interest

The authors declare no conflicts of interest. The funders had no role in the design of the study; in the collection, analyses, or interpretation of data; in the writing of the manuscript; or in the decision to publish the results.

References

  1. Chaiprasart, P.; Ronnarit, R.; Puttapong, S. Quality Determination of Durian fruits cv. Monthong by Near Infrared Spectroscopy (NIR) at Uttaradit Province for Export; Research Report; DRI Naresuan University: Phitsanuloke, Thailand, 2015; p. 72. [Google Scholar]
  2. Ministry of Culture Thailand. Durian Situation. 2024. Available online: https://regional.moc.go.th/th/file/get/file/20240429416b720fc48c23e1e246c63221feda3f094402.pdf (accessed on 12 March 2025).
  3. Department of Intellectual Property. The Registration of Geographical Indication Sisaket Lava Durian No. 61100112 (in Thai). 2018. Available online: https://ipthailand.go.th/images/2284/GI61100112.pdf (accessed on 30 July 2024).
  4. Harnsuek, P.; Lekjarn, S.; Tangthin, S.; Saiyut, P. Factors related to consumers’ purchasing decisions of Lava Durian Sisaket in northeast Thailand. Khon Kaen Agric. J. 2019, 47 (Suppl. S1), 895–902. [Google Scholar]
  5. Siriphanich, J. Durian (Durio zibethinus Merr.). In Postharvest Biology and Technology of Tropical and Subtropical Fruits, Vol 3: Cocona to Mango; Yahia, E.M., Ed.; Woodhead Publishing: Cambridge, UK, 2011; pp. 80–116. [Google Scholar] [CrossRef]
  6. Youryon, P.; Supapvanich, S. Quality comparison of naturally and artificially ripened ‘Monthong’ durian (Durio zibethinus) fruits harvested at various maturity stages. Curr. Appl. Sci. Technol. 2022, 22, 1–11. [Google Scholar] [CrossRef]
  7. Onsiri, Y.; Kunprom, C.; Romphophak, T. Effect of the harvesting maturity of durian fruit cv. Monthong on their postharvest quality relationship. Agric. Sci. J. 2018, 49 (Suppl. S4), 30–34. [Google Scholar]
  8. Arsa, S.; Wipatanawin, A.; Suwapanich, R.; Makkerdchoo, O.; Chatsuwan, N.; Kaewthong, P.; Pinsirodom, P.; Taprap, R.; Haruenkit, R.; Poovarodom, S.; et al. Properties of different varieties of durian. Appl. Sci. 2021, 11, 5653. [Google Scholar] [CrossRef]
  9. Razali, N.A.; Rosly, N.K.; Hamzah, F.A.; Abdullah, S.A.; Hussin, W. Optimum storage temperature of mature drop durian (Durio zibethinus cv. Musang King). Int. J. Agric. For. Plant. 2020, 10, 267–273. [Google Scholar]
  10. Subhadrabandhu, S.; Ketsa, S. Durian: King of Tropical Fruit; CABI: Egham, UK, 2023. [Google Scholar] [CrossRef]
  11. Kalra, S.K.; Tandon, D.K.; Singh, B.P. Mango. In Handbook of Fruit Science and Technology-Production, Composition, Storage and Processing; Salunkhe, D.K., Kadam, S.S., Eds.; Mercel Dekker, Inc.: New York, NY, USA, 1995; pp. 123–169. [Google Scholar]
  12. Bouzayen, M.; Latché, A.; Nath, P.; Pech, J.C. Mechanism of Fruit Ripening. In Plant Developmental Biology-Biotechnological Perspectives; Springer: New York, NY, USA, 2010. [Google Scholar] [CrossRef]
  13. Sulaiman, S.F.; Yousoff, N.A.M.; Eldeen, I.M.; Seow, E.M.; Sajak, A.A.B.; Ooi, K.L. Correlation between total Phenolic and mineral contents with antioxidant activity of eight Malaysian banana (Musa sp.). J. Food Compos. Anal. 2011, 24, 1–10. [Google Scholar] [CrossRef]
  14. Mouhannad, A.H.; Baqir, S.J.; Aowda, S.A.; Hussein, F.A.; Alasedi, M.K. Determination of Vitamin C (Ascorbic Acid) Concentration in Some of Commercial Products, by Redox Titration; Ministry of Health: Hilla, Babylon, 2020; p. 15. [Google Scholar]
  15. Marinova, D.; Ribarova, F.; Atanassova, M. Total phenolics and total flavonoids in Bulgarian fruits and vegetables. J. Chem. Technol. Metall. 2005, 40, 255–260. [Google Scholar]
  16. Volker, B.; Puspitasari, N.L.; Ferruzzi, M.G.; Schwartz, S.J. Trolox equivalent antioxidant capacity of different geometrical isomers of α-carotene, β-carotene, lycopene, and zeaxanthin. J. Agric. Food Chem. 2002, 50, 221–226. [Google Scholar] [CrossRef]
  17. Kubola, J.; Siriamornpun, S. Phenolic contents and antioxidant activities of bitter gourd (Momordica charantia L.) leaf, stem and fruit fraction extracts in vitro. Food Chem. 2008, 110, 881–890. [Google Scholar] [CrossRef]
  18. Montelongo, R.G.; Lobo, M.G.; González, M. Antioxidant activity in banana peel extracts: Testing extraction conditions and related bioactive compounds. Food Chem. 2010, 119, 1030–1039. [Google Scholar] [CrossRef]
  19. Wisutiamonkul, A.; Dwamena, C.A.; Allan, A.C.; Ketsa, S. Carotenoid accumulation and gene expression during durian (Durio zibethinus) fruit growth and ripening. Sci. Hortic. 2017, 220, 233–242. [Google Scholar] [CrossRef]
  20. Ketsa, S.; Wisutiamonkul, A.; Palapol, Y.; Paull, R.E. The durian: Botany, horticulture, and utilization. Hortic. Rev. 2020, 47, 125–211. [Google Scholar] [CrossRef]
  21. Lipka, E.; Herrmann, A.; Mueller, S. Mechanisms of plant cell division. Wiley Interdiscip. Rev. Dev. Biol. 2015, 4, 391–405. [Google Scholar] [CrossRef] [PubMed]
  22. Fenn, M.A.; Giovannoni, J.J. Phytohormones in fruit development and maturation. Plant J. 2021, 105, 446–458. [Google Scholar] [CrossRef]
  23. Ishida, K.; Yokoyama, R. Reconsidering the function of the xyloglucan endotransglucosylase/hydrolase family. J. Plant Res. 2022, 135, 145–156. [Google Scholar] [CrossRef]
  24. Techawongstien, S. Post-harvest Technology of Horticultural Crops; Department of Horticulture, Faculty of Agriculture, Khon Kaen University: Khon Kean, Thailand, 1992; p. 158. [Google Scholar] [CrossRef]
  25. Barbosa, N.C.S.; Dornelas, M.C. The roles of gibberellins and cytokinins in plant phase transitions. Trop. Plant Biol. 2021, 14, 11–21. [Google Scholar] [CrossRef]
  26. Gupta, K.; Wani, S.H.; Razzaq, A.; Skalicky, M.; Samantara, K.; Gupta, S.; Deepu Pandita, D.; Sonia Goe, S.; Sapna Grewa, S.; Hejnak, V.; et al. Abscisic acid: Role in fruit development and ripening. Front. Plant Sci. 2022, 13, 817500. [Google Scholar] [CrossRef]
  27. Chaisrichonlathan, P.; Chavapradit, C. Durian maturity meter by dry weight. Acta Hortic. 2017, 1186, 165–170. [Google Scholar] [CrossRef]
  28. Pokhrel, D.R.; Sirisomboon, P.; Khurnpoon, L.; Posom, J.; Saechua, W. Comparing machine learning and PLSDA algorithms for durian pulp classification using inline NIR spectra. Sensors 2023, 23, 5327. [Google Scholar] [CrossRef]
  29. Kalayanamitra, K.; Sornsrivichai, J.; Yantarasri, T. Model for evaluation of maturity index of durian fruit (Durio zibethinus Murray ‘Monthong’). Acta Hortic. 2005, 682, 587–592. [Google Scholar] [CrossRef]
  30. Ngoenchai, P.; Suwonsichon, S.; Ritthiruangdej, P.; Jirapakkul, W.; Sangwanangkul, P. Volatile compound analysis of “Monthong” durian harvested at different maturity stages using flash gas chromatography electronic nose. J. Food Sci. Agric. Technol. 2022, 6, 145–150. [Google Scholar]
  31. Thai Agricultural Standard TAS3-2013; Durian [Internet]. National Bureau of Agricultural Commodity and Food Standards: Bangkok, Thailand, 2022. Available online: http://patricklepetit.jalbum.net/RAYONG/LIBRARY/durian-TIS.pdf (accessed on 7 May 2022).
  32. Sangwanangkul, P.; Siriphanich, J. Growth and maturation of durian fruit cv. Monthong. Thai J. Agric. Sci. 2000, 33, 75–82. [Google Scholar]
  33. Wongchan, B.; Chayanuch, T.; Suppaluck, A. Growth and seasonal change in nutrient of neck orange (Citrus reticulata Blanco.). Khon Kaen Agric. J. 2014, 42 (Suppl. S3), 99–104. [Google Scholar]
  34. Goulao, L.F.; Oliveira, C.M. Cell wall modifications during fruit ripening: When a fruit is not the fruit. Trends Food Sci. Technol. 2008, 19, 4–25. [Google Scholar] [CrossRef]
  35. Timkhum, P.; Terdwongworakul, A. Non-destructive classification of durian maturity of ‘Monthong’cultivar by visible spectroscopy of the husk. Thai Soc. Agric. Eng. J. 2013, 19, 1–6. [Google Scholar] [CrossRef]
  36. Siriphanich, J.; Khurnpoon, L. Dry matter as a possible maturity index of ‘Monthong’ durians. Thai J. Agric. Sci. 2003, 37, 365–372. [Google Scholar]
  37. Siriphanich, J. Durian: Post-harvest Management; Postharvest Technology Innovation Center, Chiang Mai University: Chiang Mai, Thailand, 2024; p. 430. [Google Scholar]
  38. de Jesus, O.N.; Lima, L.K.S.; dos Santos, I.S.; dos Santos, M.A.; Rosa, R.C.C. Bright red passion fruit-evaluation of colorimetry and physicochemical quality for the fresh fruit market. Sci. Hortic. 2023, 317, 112016. [Google Scholar] [CrossRef]
  39. Gupta, A.K.; Medhi, M.; Chakraborty, S.; Monica Yumnam, M.; Mishra, P. Development of rapid and non-destructive technique for the determination of maturity indices of pomelo fruit (Citrus grandis). J. Food Meas. Charact. 2021, 15, 1463–1474. [Google Scholar] [CrossRef]
  40. Mathiazhagan, M.; Chinnaiyan, V.; Venkata Sudhakar Rao, D.; Seetharamaiah Shivashankara, K.; Venkataramana Ravishankar, K. Estimation of Pulp Pigment Content Using Color Space Values in Guava. Appl. Fruit Sci. 2024, 66, 1997–2005. [Google Scholar] [CrossRef]
  41. Srivastav, M.; Radadiya, N.; Ramachandra, S.; Jayaswal, P.K.; Singh, N.; Singh, S.; Mahato, A.K.; Tandon, G.; Gupta, A.; Devi, R.; et al. High resolution mapping of QTLs for fruit color and firmness in Amrapali/Sensation mango hybrids. Front. Plant Sci. 2023, 14, 1135285. [Google Scholar] [CrossRef]
  42. Durán-Soria, S.; Pott, D.M.; Osorio, S.; Vallarino, J.G. Sugar signaling during fruit ripening. Front. Plant Sci. 2020, 11, 564917. [Google Scholar] [CrossRef] [PubMed]
  43. Krishna, H.; Parashar, A. Phytochemical constituents and antioxidant activities of some indian jujube (Ziziphus mauritiana Lamk.) cultivars. J. Food Biochem. 2013, 37, 571–577. [Google Scholar] [CrossRef]
  44. Flores-Fernández, C.N.; Cárdenas-Fernández, M.; Lye, G.J.; Ward, J.M. Synergistic action of thermophilic pectinases for pectin bioconversion into D-galacturonic acid. Enzym. Microb. Technol. 2022, 160, 110071. [Google Scholar] [CrossRef] [PubMed]
  45. Haryanto, B.; Royaningsih, S. Relationship between durian maturity of Sunan and its physical properties. Agritech 2003, 23, 33–36. [Google Scholar]
  46. Siriphanich, J. Physiology and Postharvest Technology of Vegetable and Fruits; Department of Horticulture, Faculty of Agriculture, Kamphaeng Saen, Kasetsart University: Bangkok, Thailand, 2006; p. 396. [Google Scholar]
  47. Khaksar, G.; Kasemcholathan, S.; Sirikantaramas, S. Durian (Durio zibethinus L.): Nutritional composition, pharmacological implications, value-added products, and omics-based investigations. Horticulturae 2024, 10, 342. [Google Scholar] [CrossRef]
  48. Wiangsamut, B.; Wiangsamut, M.E.L.; Wattana, K.; Bamrung, P.; Charroenmoon, K. Effect of ethephon on fruit ripening and fruit components of durian cv.‘monthong’ after harvest. Int. J. Agric. Technol. 2021, 17, 2021–2034. [Google Scholar]
  49. Bastos, V.J.; Neves, L.C.; Silva, P.M.C.; Shahab, M.; Colombo, R.C.; Roberto, S.R. Harvest point determination of indian jujube fruit (Ziziphus mauritiana L.) based on physicochemical and functional parameters. Sci. Hortic. 2016, 213, 392–402. [Google Scholar] [CrossRef]
  50. Haruenkit, R.; Poovarodom, S.; Vearasilp, S.; Namiesnik, J.; Kaszynska, M.S.; Park, Y.S.; Gorinstein, S. Comparison of bioactive compounds, antioxidant and antiproliferative activities of Mon Thong durian during ripening. Food Chem. 2010, 118, 540–547. [Google Scholar] [CrossRef]
  51. Fawole, O.A.; Opara, U.L. Effects of maturity status on biochemical content, polyphenol composition and antioxidant capacity of pomegranate fruit arils (cv.‘Bhagwa’). S. Afr. J. Bot. 2013, 85, 23–31. [Google Scholar] [CrossRef]
  52. Boonyaritthongchai, P.; Apiradee, U.; Sailom, S.; Pongphen, J. Effect of Fresh Cut and Freezing Process on Bioactive Compound of Durian cv. Monthong; Research Report; The Thailand Research Fund (TRF): Bangkok, Thailand, 2016; pp. 118–124. [Google Scholar]
  53. Cheng, W.; Li, S.; Bao, F.; Xu, Z.; Li, T. The changes of antioxidant contents and antioxidant activities of the tomato cultivar Fentailang during the maturity stages. J. Oleo Sci. 2023, 72, 577–583. [Google Scholar] [CrossRef]
Figure 1. Minimum, maximum, and mean temperatures recorded from January to October 2024.
Horticulturae 11 00432 g001
Figure 2. Rainfall and relative humidity recorded from January to October 2024.
Horticulturae 11 00432 g002
Figure 3. Fruit circumference and length of durian cultivar ‘Monthong’ fruit at different measurements dates.
Horticulturae 11 00432 g003
Figure 4. Impact of harvest maturity on the development of durian fruits from 15 to 135 days after full bloom; (a): 15 days after full bloom, (b): 30 days after full bloom, (c): 45 days after full bloom, (d): 60 days after full bloom, (e): 75 days after full bloom, (f): 90 days after full bloom, (g): 105 days after full bloom, (h): 120 days after full bloom, and (i): 135 days after full bloom.
Horticulturae 11 00432 g004
Figure 5. Relationship, calculated by a linear regression analysis for maturity stages and dry matter (%) in durian fruit from 15 to 135 days after full bloom.
Horticulturae 11 00432 g005
Table 1. Fruit weight, firmness, and dry matter of ‘Monthong’ fruit depending on the stage of ripeness.
Days After Full Bloom
(Day)
Fruit Weight
(g)
Firmness
(N/cm2)
Dry Matter (%)
15137.35 e30.97 c5.75 f
30288.94 de34.67 c7.10 ef
45614.87 d36.97 c9.40 ef
60990.43 c45.38 bc10.46 e
752385.00 b56.70 b16.50 d
902472.00 b75.64 a26.50 c
1053316.70 a76.08 a35.94 ab
1203652.30 a42.08 bc37.13 a
1353352.30 a1.62 d32.94 b
F-test******
CV (%)8.2217.807.99
Means followed by different lowercase letters within the same column are significantly different based on LSD test at p ≤ 0.01 (**).
Table 2. Peel and pulp color of ‘Monthong’ fruit depending on the stage of ripeness.
Days After
Full Bloom
(Day)
PeelPulp
L*a*b*L*a*b*
1526.82 a1.42 ab5.02 de74.31 c6.41 a27.27 c
3027.38 a1.01 abc4.07 e76.80 bc5.55 a26.15 cd
4529.36 a0.89 bc3.60 e80.18 abc0.83 b21.33 def
6028.11 a0.41 cd3.34 e82.13 ab0.26 b19.38 ef
7514.57 b1.22 abc12.50 bc80.35 abc0.49 b17.94 f
9016.22 b1.26 abc9.64 cd79.96 abc0.84 b38.92 b
10519.63 ab1.49 ab12.36 bc82.78 ab1.68 b24.00 cde
12015.10 b−0.12 d18.37 a83.22 a0.56 b47.47 a
13515.55 b1.92 a15.61 ab82.83 ab1.09 b49.90 a
F-test************
CV (%)20.9339.0821.893.2866.338.21
Means followed by different lowercase letters within the same column are significantly different based on LSD test at p ≤ 0.01 (**). Brightness (L*), Green (a*), and Yellow (b*).
Table 3. The impact of harvest maturity on fruit quality in durian cv. ‘Monthong’ fruit.
Days After
Full Bloom
(Day)
Total Soluble Solid (°Brix)Titratable Acidity
(%)
TSS/TAVitamin C (mg/100 g FW)
152.80 f0.69 c0.4637.79 d
307.47 e1.54 b4.8541.01 d
458.67 de1.55 b5.5941.35 d
609.53 cde1.59 b5.9943.89 d
7510.47 cd1.64 b6.3847.45 d
9011.47 c1.68 b6.8372.50 d
10520.50 b2.67 a7.68512.33 a
12023.36 a1.02 c22.90283.00 b
13525.00 a0.78 c32.05166.17 c
F-test**** **
CV (%)7.1111.50 20.10
Means followed by different lowercase letters within the same column are significantly different based on LSD test at p ≤ 0.01 (**).
Table 4. The impact of harvest maturity on antioxidants in durian cv. ‘Monthong’ fruit.
Days After
Full Bloom
(Day)
Total Phenolic (mg/100 g FW)Total Flavonoid Content
(mg catechin/
100 g FW)
β-Carotene Content (mg/100 g FW)Lycopene
Content (mg/100 g FW)
ABTS
(mg TE/100 g FW)
DPPH
(mg TE/100 g FW)
15------
309.17 d3.51 b0.44 d8.88 d2.22 cd2.22 b
4512.14 d3.42 b0.53 d9.28 d3.33 bc1.19 b
6012.35 d3.84 b0.51 d10.61 d4.21 ab1.58 b
7512.65 d5.54 ab0.5 d11.58 d5.17 a3.53 ab
9025.79 c5.83 ab0.69 cd25.79 c5.89 a4.00 ab
10539.12 b6.01 ab1.05 ab37.97 b1.02 d4.09 ab
12043.98 a8.33 a1.35 a53.98 a1.09 d6.32 a
13539 b4.22 b0.89 bc48.80 ab1.01 d4.06 ab
F-test************
CV (%)6.5813.0317.7918.1017.4920.29
Means followed by different lowercase letters within the same column are significantly different based on LSD test at p ≤ 0.01 (**). (-) = no data.
Disclaimer/Publisher’s Note: The statements, opinions and data contained in all publications are solely those of the individual author(s) and contributor(s) and not of MDPI and/or the editor(s). MDPI and/or the editor(s) disclaim responsibility for any injury to people or property resulting from any ideas, methods, instructions or products referred to in the content.

