Article

Impact of Two Hexaploidizations on Distribution, Codon Bias, and Expression of Transcription Factors in Tomato Fruit Ripeness

1
Department of Bioinformatics, School of Life Sciences, North China University of Science and Technology, Tangshan 063000, China
2
Center for Genomics and Computational Biology, School of Life Sciences, North China University of Science and Technology, Tangshan 063000, China
*
Authors to whom correspondence should be addressed.
These authors contributed equally to this work.
Horticulturae 2025, 11(5), 447; https://doi.org/10.3390/horticulturae11050447
Submission received: 8 February 2025 / Revised: 11 April 2025 / Accepted: 15 April 2025 / Published: 22 April 2025
(This article belongs to the Special Issue A Decade of Research on Vegetable Crops: From Omics to Biotechnology)

Abstract

:
Transcription factors play an important regulatory role in tomato fruit ripening. We identified and analyzed eight transcription factor families (TF families) associated with fruit ripening in the genomes of seven tomato species and two outgroup species, revealing the impact of whole-genome duplication (WGD) events on the structure and functional characteristics of these TF families. The results indicate that the Solanaceae Common Hexaploidization (SCH) event is the primary driver for the increase in the number of members within these TF families, leading to a more concentrated chromosomal distribution of family members. Compared with the two outgroup species, the tomato fruit-ripening-related TF families exhibit stronger codon usage bias, which may have been enhanced by WGD. Phylogenetic analysis found that family members generated by SCH show faster evolutionary rates, suggesting that SCH events significantly contribute to the evolution of these families. Additionally, our research uncovered that WGD events might maintain expression activity during fruit ripening by generating duplicate TF family members. Our study not only deepens our understanding of the mechanisms underlying tomato fruit ripening but also provides a theoretical foundation for future breeding improvements.

1. Introduction

Tomato (Solanum lycopersicum L.), a member of the Solanaceae family, is one of the world’s most important economic vegetable crops [1]. In 2023, global tomato cultivation covered an area of 5,412,458 hectares, with a staggering production volume reaching 192,317,973 tons (https://www.fao.org/faostat/, accessed on 15 January 2025). As a crucial vegetable crop, the attributes of tomatoes are largely attributed to the rich content of organic nutrients found in their fruits, such as sugars, amino acids, lycopene, β -carotene, vitamin C (ascorbic acid), and more [2,3,4]. The ripening of tomato fruits is regulated by endogenous hormones, environmental signals, and genetic regulatory factors, which function within a complex regulatory network. Among these factors, transcription factors (TFs) play a very important role in the regulation of gene expression associated with tomato fruit ripening [5,6,7].
Whole-genome duplications (WGDs) are recurring evolutionary events in plant evolution, characterized by the generation of numerous duplicated genes and rearrangements. These events enhance plants’ ability to resist adverse growing conditions and serve as a significant driver of innovation at the genomic or gene level [8,9,10,11]. The tomato genome has undergone two whole-genome triplications (WGTs) during its evolutionary history. The first occurred approximately 120 million years ago (Mya), an ancient triplication event ( γ ) shared by the common ancestor of all eudicots [12,13], referred to as Eudicot Common Hexaploidization (ECH). The second event took place around 81 Mya, affecting the common ancestor of the Solanaceae family [14,15], Solanaceae Common Hexaploidization (SCH). The two ancient WGTs have led to a significant accumulation of gene copies in tomatoes, which likely impact important regulatory gene families and subsequently influence tomato growth, development, and genetic characteristics. Given that fruits are the most distinctive phenotype of tomatoes, investigating the effects of these polyploidization events on transcriptional regulators from a genomic perspective is particularly significant.
Based on seven tomato species and eight TFs related to fruit ripening, we analyzed the characteristics of these TFs in terms of the number of different species, chromosomal distribution, codon preference, genome collinearity, and expression specificity. We also analyzed the differences and influences of these characteristics after two WGDs. Our research shows that the SCH event promoted the amplification of some TFs, resulting in their clustered distribution, and they often exhibit faster evolutionary rates. WGDs not only enhanced the usage frequency of preferred codons by TFs but also played a role in maintaining the expression activity of genes related to fruit ripening. Our study helps in understanding the impact of WGDs on tomato fruit-related transcription factor families from the perspective of origin and evolution. It not only deepens the biological understanding of the tomato fruit ripening mechanism but also provides a wealth of data for the improvement of tomato fruit breeding.

2. Materials and Methods

2.1. Species Selection and Identification of Transcription Factors Involved in Fruit Ripening

We selected seven tomato species (Solanum chilense [16], Solanum galapagense [17], Solanum habrochaites [17], Solanum lycopersicoides [18], Solanum lycopersicum [13], Solanum pennellii [19], Solanum pimpinellifolium [20]) and two outgroup species (Coffea canephora [21], Vitis vinifera [12]) as the basis for our research (Supplementary Table S1). The transcription factors analyzed in this study include eight TFs associated with tomato fruit ripening (NAC (PF02365) [22,23], SlHY5 (PF00170) [24], BR (PF05687) [25,26], MADS-box (PF01486) [27,28], bHLH (PF00010) [29], HD-Zip (PF02183) [30,31], MYB70 (PF00249) [32], and SRs/CAMTA (PF02403) [7]) (Supplementary Table S2). Our study focuses on the impact of different WGTs on these TFs and the differences in their functional roles across various tomato genomes. All genome data were downloaded from public databases. After standardized filtering and preprocessing, we selected the longest coding sequence (CDS) or protein for each gene locus for subsequent analyses. The Hidden Markov Model (HMM) profiles for all tomato fruit-ripening-related TFs were obtained from InterPro [33] (https://www.ebi.ac.uk/interpro/, accessed on 20 January 2025).
During the identification process, we first utilized Biopython [34] to handle nucleotide and protein sequences. We then performed multiple sequence alignments of proteins using Muscle v5.3 [35] with default parameters, and conducted HMM seed sequence alignments using the HMMER software suite [36] (http://hmmer.org, accessed on 20 January 2025) with default parameters. Finally, we used InterPro [33] to screen and validate the identification results. The threshold for constructing species-specific libraries was set at 1 × 10 20 , and the threshold for identifying transcription factor family members was set at 1 × 10 10 . The entire identification process was based on a Python-based automated workflow that we developed throughout the data analyses. (https://github.com/Daaaaxianer/family-candidate, accessed on 20 January 2025.)

2.2. Chromosome Localization Analysis of Transcription Factors

Based on the filtered gene IDs and their physical positions on chromosomes, we used the –id2bed parameter of the GffFormat.py script to screen and format the distribution information of genes on chromosomes. We then used the MG2C tool [37] (http://mg2c.iask.in/mg2c_v2.1/index.html, accessed on 20 January 2025) to visualize the chromosomal locations of the genes based on the formatted output from our script.

2.3. Codon Usage Analysis of Transcription Factors Involved in Fruit Ripening

Based on the identified and filtered transcription factor sequences, we used CodonU [38] to conduct statistical analyses related to Codon Usage Analysis (CUA). We calculated various metrics, including the Effective Number of Codons (ENc), Relative Synonymous Codon Usage (RSCU), Aromaticity, and GRAVY. Additionally, we performed comparative analyses based on the correlations between these metrics, such as Parity Rule 2 (PR2) analysis, neutrality plot, and ENc plot.
Relative Synonymous Codon Usage (RSCU) reflects the preference for a particular codon used to encode an amino acid. When R S C U < 1 , it indicates that the codon is used less frequently than other synonymous codons; when R S C U > 1 , it signifies that the codon is used more frequently than its synonymous alternatives; and when R S C U = 1 , it suggests that there is no bias in the usage of that codon compared to its synonyms.
The Effective Number of Codons (ENc) is a measure that indicates the number of effectively used codons within a gene. The ENc value ranges from 20 to 61, where 20 signifies that only one codon is used for each amino acid, and 61 indicates that all codons are used equally. A lower ENc value suggests stronger codon usage bias, meaning that fewer codons are used preferentially, while a higher ENc value indicates less bias or more even codon usage. Typically, highly expressed genes exhibit greater codon bias, resulting in a smaller ENc value. Conversely, lowly expressed genes contain a wider variety of rare codons, leading to a higher ENc value. However, it is important to note that there can be exceptions to this pattern, as other factors can also influence codon usage.
Neutrality plot analysis can provide preliminary insights into the factors influencing codon usage bias. This is achieved by plotting the average GC content at the first and second positions (GC12) on the y-axis against the GC content at the third position (GC3) on the x-axis, creating a scatter plot followed by linear regression analysis. When the regression coefficient approaches 1, indicating a significant correlation between GC—12 and GC3, it suggests that the base compositions at all three codon positions are similar, implying that mutation pressure predominantly determines codon usage bias. Conversely, if there is a large difference in base composition across the three positions, it suggests that natural selection plays a more significant role in determining codon usage bias.
ENc-plot analysis is used to assess the impact of mutations on codon usage bias and can visualize the situation of codon preference through graphical representation. The ENc-plot consists of a scatter plot and a curve graph, with GC3 (the GC content at the third codon position) as the X-coordinate and the ENc value as the Y-coordinate for plotting the scatter plot. The expected curve for ENc values is plotted using the following formula: E N c = 2 + G C 3 + 29 / [ G C 3 2 + ( 1 G C 3 ) 2 ] . When the actual ENc value is close to the expected value, it indicates that codon usage bias is determined by gene mutation.
The Aromaticity value is typically used to describe the content or distribution of aromatic amino acids (such as phenylalanine, tyrosine, and tryptophan) within a protein sequence. The higher the Aromaticity value is, the greater the content of aromatic amino acids in the protein, which may play a more important role in the protein’s folding and stability.
The Grand Average of Hydropathicity (GRAVY), known as the hydrophilicity average coefficient, reflects the hydrophilic nature of proteins. A positive GRAVY value indicates higher hydrophobicity, with increasing positive values representing increased hydrophobicity; more negative values indicate greater hydrophilicity. Values between 0.5 and −0.5 mainly represent amphipathic amino acids.

2.4. Inferences from Phylogenetic Trees Based on Genetic Data

We extracted all protein sequences from seven tomato species and two outgroup species, performed single-copy gene searches, and constructed a species tree using OrthoFinder [39]. We also defined the divergence times of species using TimeTree [40]. In the phylogenetic analyses of genes and proteins, relevant transcription factor sequences were aligned using MUSCLE v5.3 [35] for multiple sequence alignment, trimmed using trimAl v1.4 [41], and the trimmed alignments were then used in IQ-TREE 2 [42] with default parameters to select models and construct phylogenetic trees. Visualization of the resulting phylogenetic trees was carried out using tvBOT [43].

2.5. Analysis of the Origins of Transcription Factors Based on Collinearity

The protein sequences of two outgroup species (C. canephora and V. vinifera) and seven tomato genomes were aligned based on BLAST [44] (the main parameters: -outfmt 6, -evalue 1 × 10 5 , max_target_seqs 20, and -num_threads 20). According to the physical location of the sequences, we performed multiple sequence alignments using MUSCLE v5.3 [35], calculated non-synonymous (Ka) and synonymous (Ks) substitutions with PAML [45], and conducted collinearity analysis via the WGDI [46] command line by executing the following steps: Dotplot, Improved collinearity, Non-synonymous (Ka) and synonymous (Ks), BlockInfo, BlockKs, KsPeaks, and Alignment. The visualization of the collinearity results was carried out using shinyCircos-V2.0 [47] and JCVI [48].

2.6. Enrichment of TF Families and Expression Clustering Analysis

To explore the enrichment of related transcription factors (TFs) in biological pathways and metabolic pathways, we performed GO [49,50,51] enrichment and KEGG [52] enrichment analyses on fruit ripening-associated TFs for each species. Simultaneously, we collected and analyzed a set of transcriptomic data to measure the expression profiles of different TF families during various stages of fruit ripening. This transcriptomic dataset includes mRNA data from wild-type (A) tomatoes at the Mature Green (35) and Breaker (38) stages, with an experimental design that incorporates three biological replicates per stage. The expression data were downloaded from the NCBI Gene Expression Omnibus (GSE267238).
For the enrichment analysis of TF families, we used AnnotationHub [53], DOSE [54], clusterProfiler [55,56,57], and KEGGREST [58]. For visualizing the enrichment results as bubble plots, we utilized ggplot2 [59] and enrichplot [60], while chiplot was used for drawing clustered heatmaps (https://www.chiplot.online/, accessed on 20 January 2025). In both GO enrichment analysis and KEGG enrichment analysis, we used GeneRatio as the measurement metric, with a screening threshold of a d j . p . V a l u e < 0.05 . Clustering of expression levels was performed using Euclidean Distance, with feature standardization achieved through the StandardScaler() function from the scikit-learn module. To evaluate the significance of each group comparison, we used a moderated t-statistic to calculate the p.Value.

3. Results

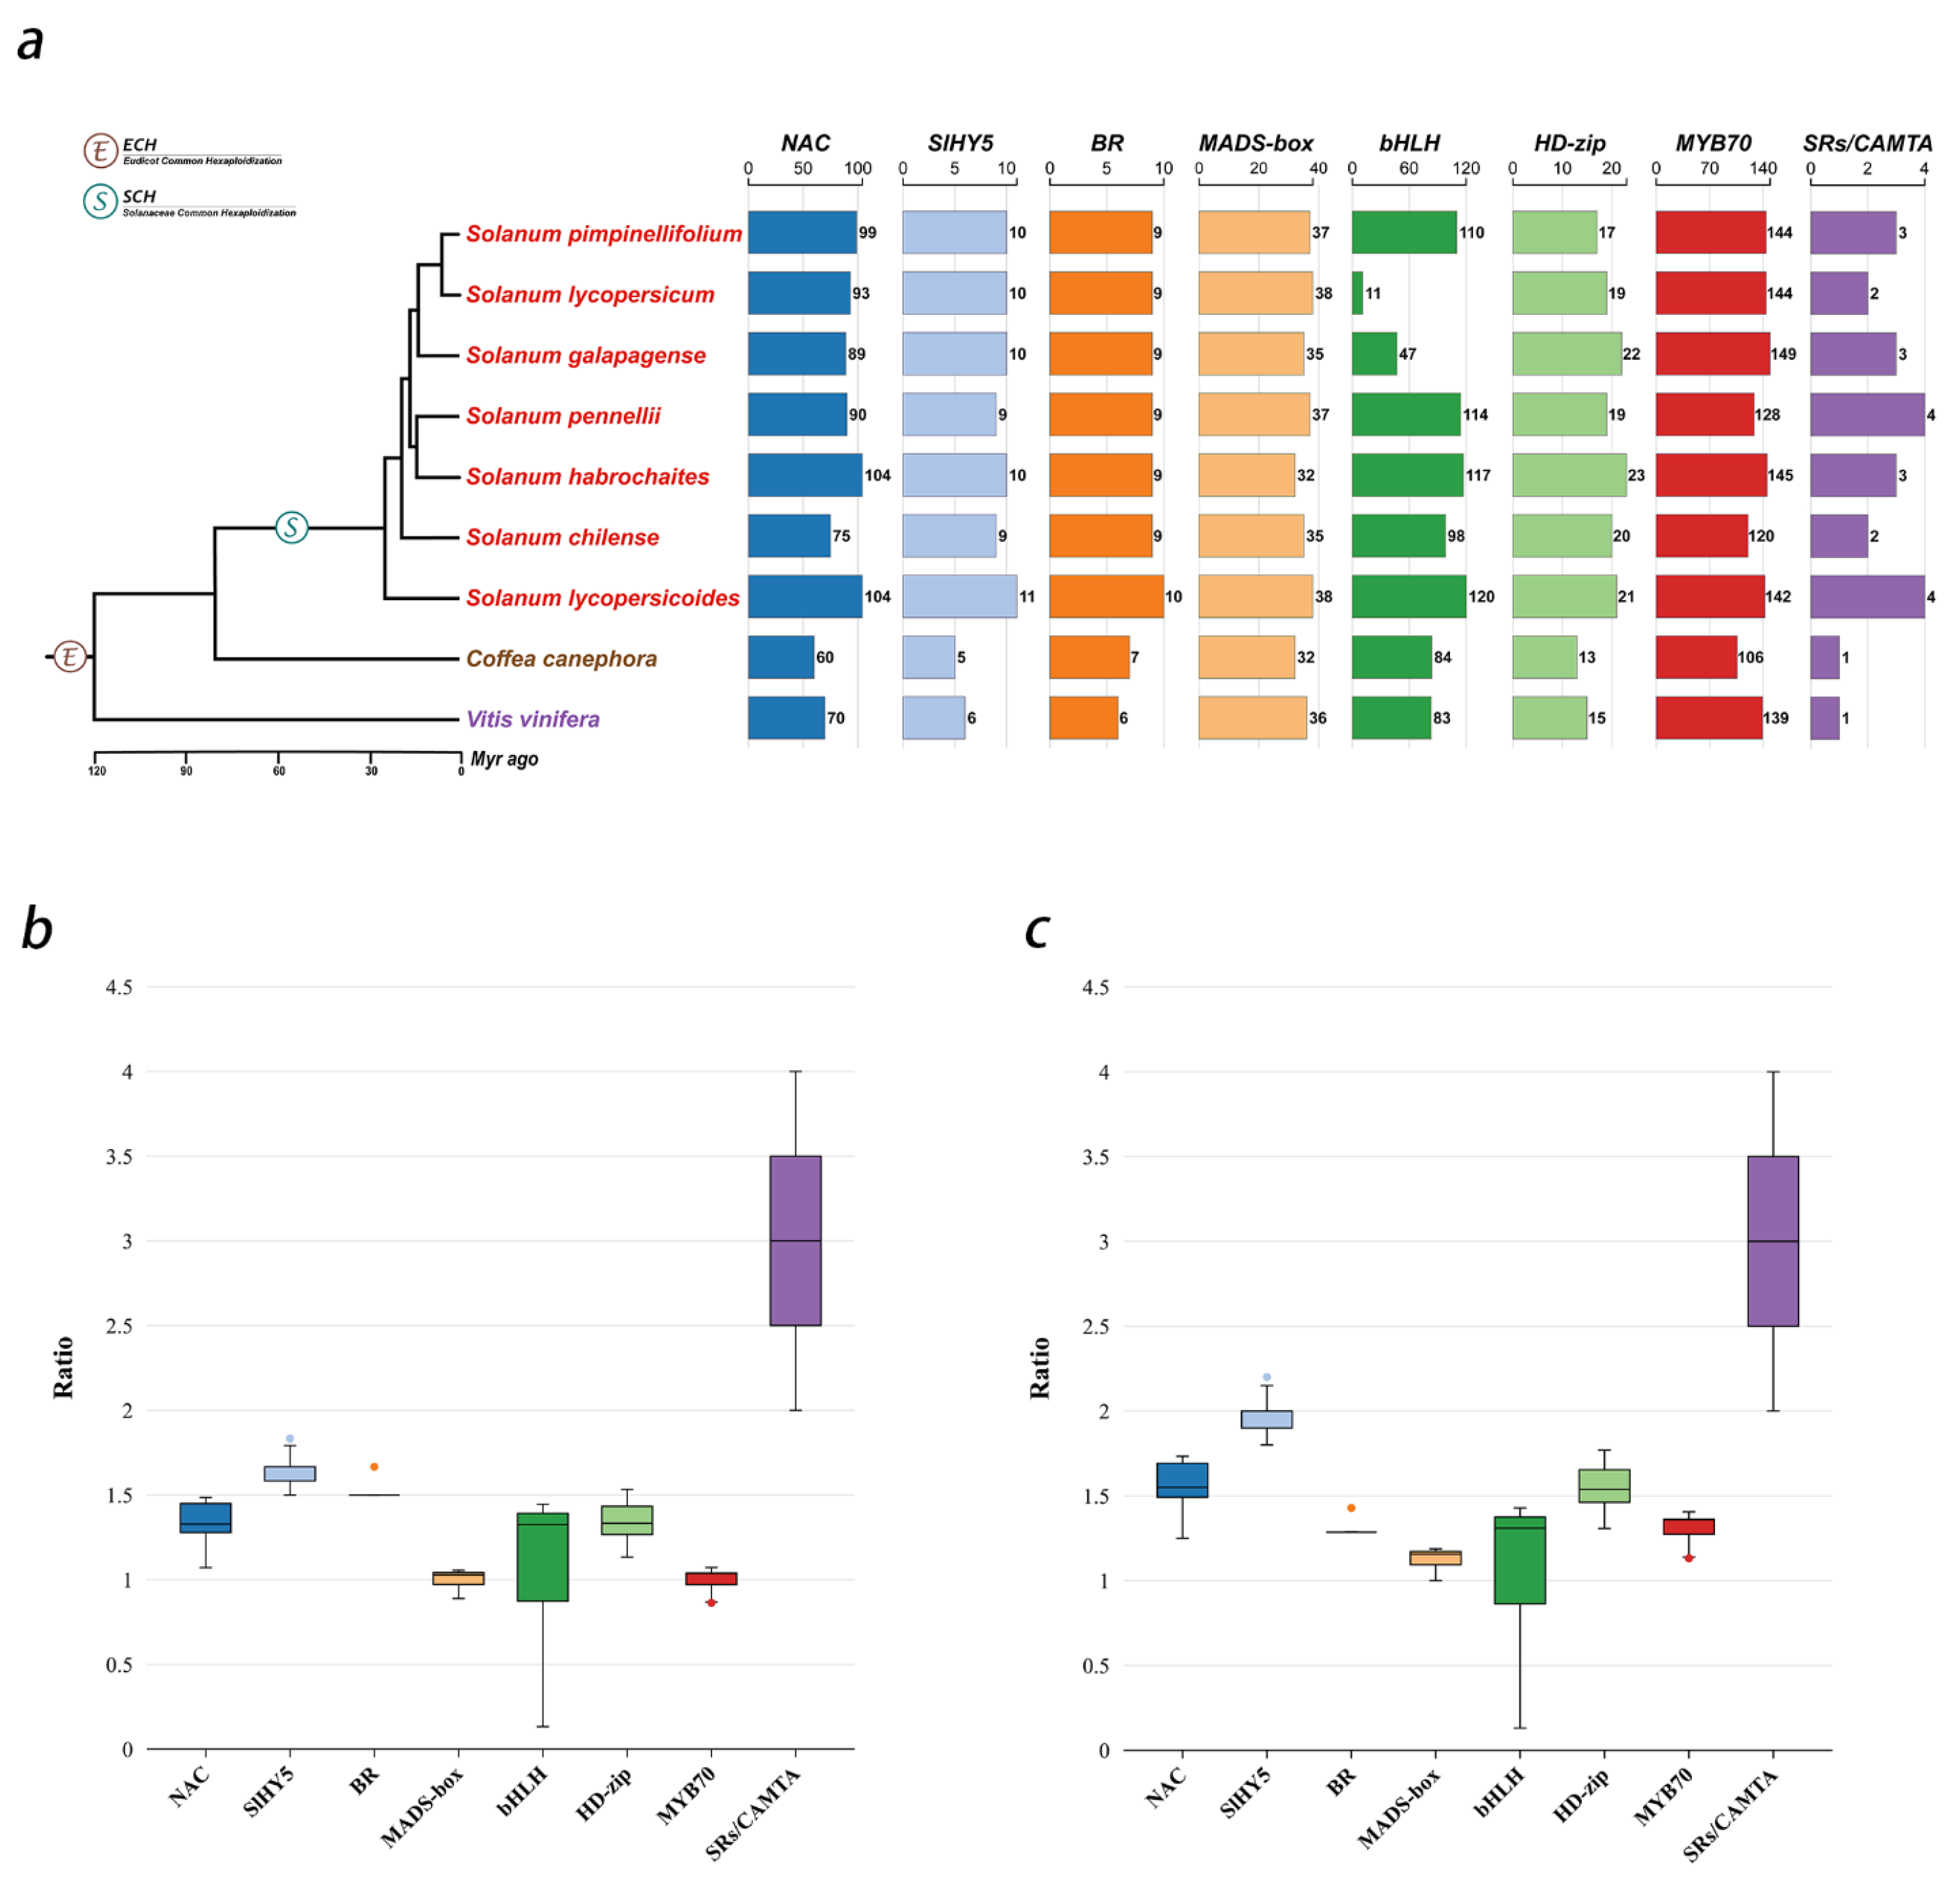
3.1. Identification of Fruit-Ripening-Related TFs and Their Quantitative Distribution Characteristics in Different Genomes

In dicotyledonous plants, C. canephora and V. vinifera, which exhibit relatively conserved evolutionary rates and have only undergone a single whole-genome triplication event (ECH), serve as outgroup species for the seven tomato species in this study. Based on Hidden Markov Models (HMMs) of different TFs, we identified various TFs within the seven tomato species and subsequently counted the number of TFs in these species (Figure 1a and Supplementary Table S2). Overall, the numbers of TFs in the tomatoes are close to each other, but higher than those of the two outgroup species, which indicates a correlation between phylogenetic relationship and TF quantity. For instance, the number of each type of TF in the genomes of C. canephora and V. vinifera is often lower than in the seven tomato species. An exception is that the number of bHLH TFs in S. lycopersicum and S. galapagense is lower than in the two outgroup species. Moreover, the distribution of different TFs across the various species is clearly uneven. Overall, SRs/CAMTA are relatively low in number across all species, with counts of two in S. lycopersicum and four in S. pennellii, respectively. In contrast, MYB70 has a higher count in most species, such as 149 in S. galapagense and 120 in S. chilense.
In addition to compare quantities, we also calculated the ratios of each type of TF between tomatoes and the two outgroup species (Supplemental Table S3). It can be observed that the ratios calculated between tomatoes and C. canephora and V. vinifera are very close. For example, the ratios for SRs/CAMTA are the highest among the two outgroup species and are equal between them (Figure 1b,c and Supplementary Table S3). Except for bHLH, the ratios of the other TFs are generally very close between the two outgroup species but tend to be slightly smaller when compared with V. vinifera, indicating that V. vinifera has identified more TFs than C. canephora. Additionally, taking C. canephora as an example, we found that the ratios of BR exhibit the least variation, while the greatest numerical differences are seen in SRs/CAMTA, followed by bHLH (Figure 1b).

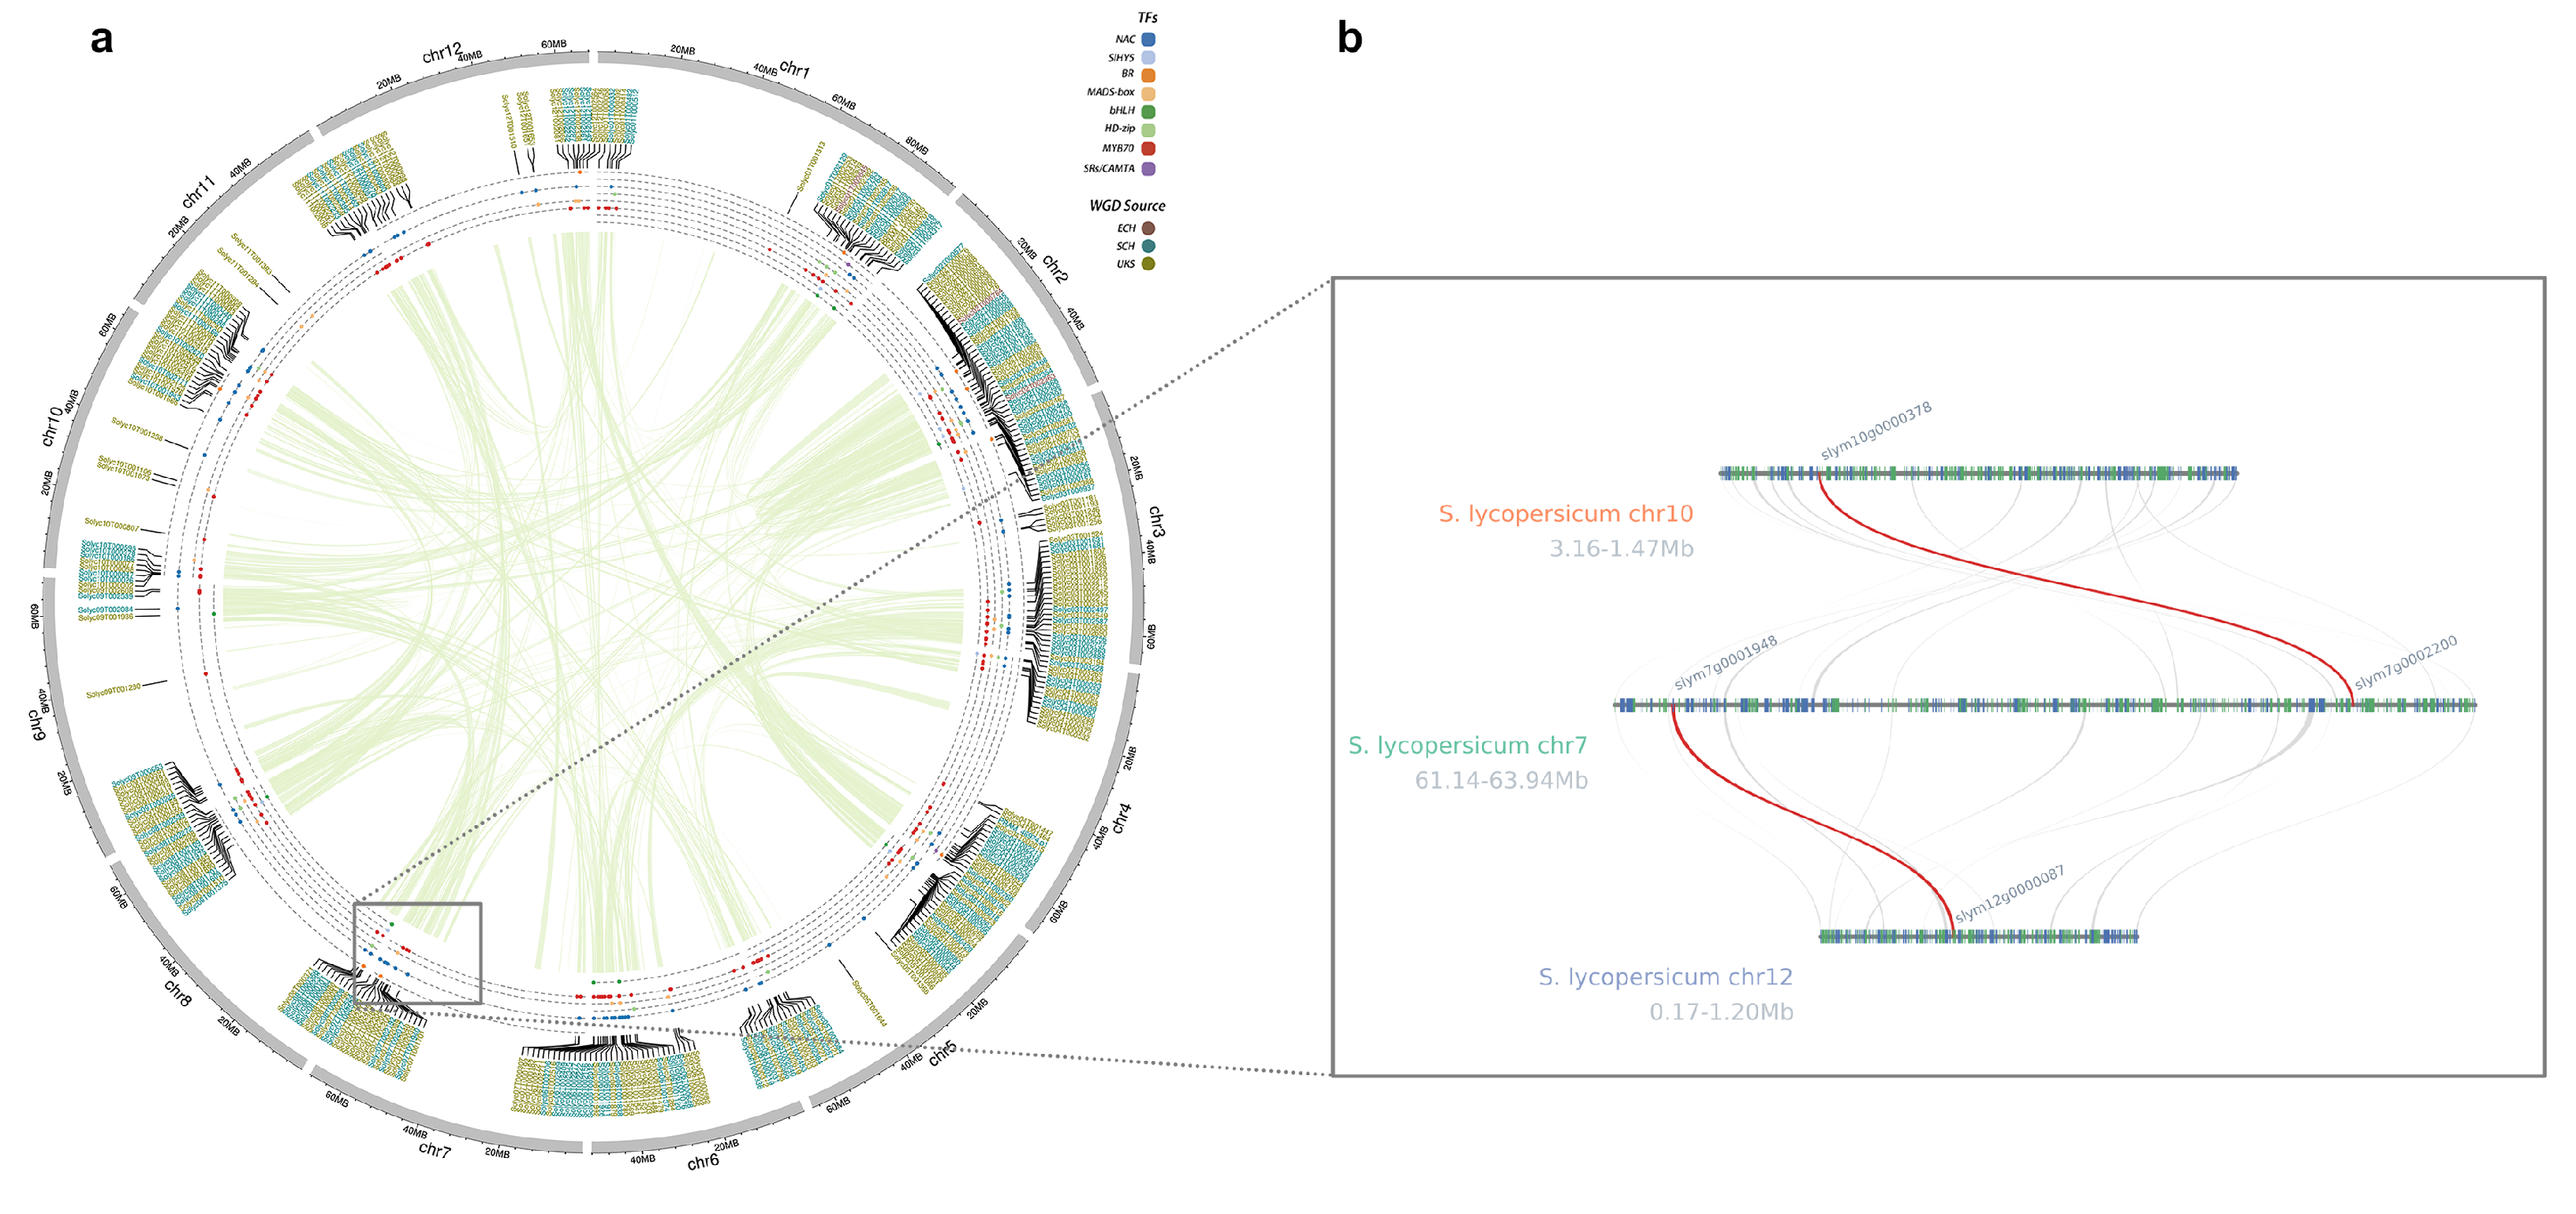
3.2. Analysis of Chromosomal Localization and Origin Characteristics of Fruit-Ripening-Related Transcription Factor Families

Based on the identification results, we analyzed the chromosomal distribution and origin characteristics of these transcription factors. Related TF families are rarely found in the central regions of chromosomes; instead, they tend to be located at the ends of chromosomes and form gene clusters in localized areas of the same chromosome. Within the same species, different TF families may be distributed across various chromosomes or clustered within specific chromosomal regions. For instance, in S. galapagense, members of the MYB70 and bHLH families are dispersed across multiple chromosomes, while some members of the SIHY5 and BR families tend to cluster in specific chromosomal regions (Supplementary Figure S2). Cross-species comparisons reveal that certain TF families exhibit conserved chromosomal localization trends across different species. For example, bHLH family members are concentrated on chromosome 1 in S. galapagense, S. chilense, and S. habrochites, while MYB70 members are concentrated on chromosome 5 (Supplementary Figures S1–S3). Additionally, the proportion of different TFs varies across different chromosomes within the same species. For example, in S. galapagense, the bHLH family is predominant on chromosome 1, whereas the MYB70 family is dominant on chromosomes 3, 4, 5, 9, 10, and 11 (Supplementary Figure S2).
Most members of the TF families are known to originate from SCH, with only a minority originating from ECH. For example, in S. galapagense, apart from those of unknown origin (UKS), the majority of TF family members originate from SCH, while only some TF family members on chromosomes 2 and 10 originate from ECH (Supplementary Figure S2). This characteristic is also observed in other species such as S. chilense, S. lycopersicoides, and S. galapagense (Supplementary Figures S1, S2 and S4). Overall, due to the larger contribution of SCH, these TF family members tend to form gene clusters on chromosomes, whereas ECH-derived family members, being fewer in number, tend to be more dispersed across chromosomes. Although we did not find a clear correlation between the localization patterns of TF family members and their polyploidization origins, the association still provides important insights for exploring the origin and evolution of these TFs.

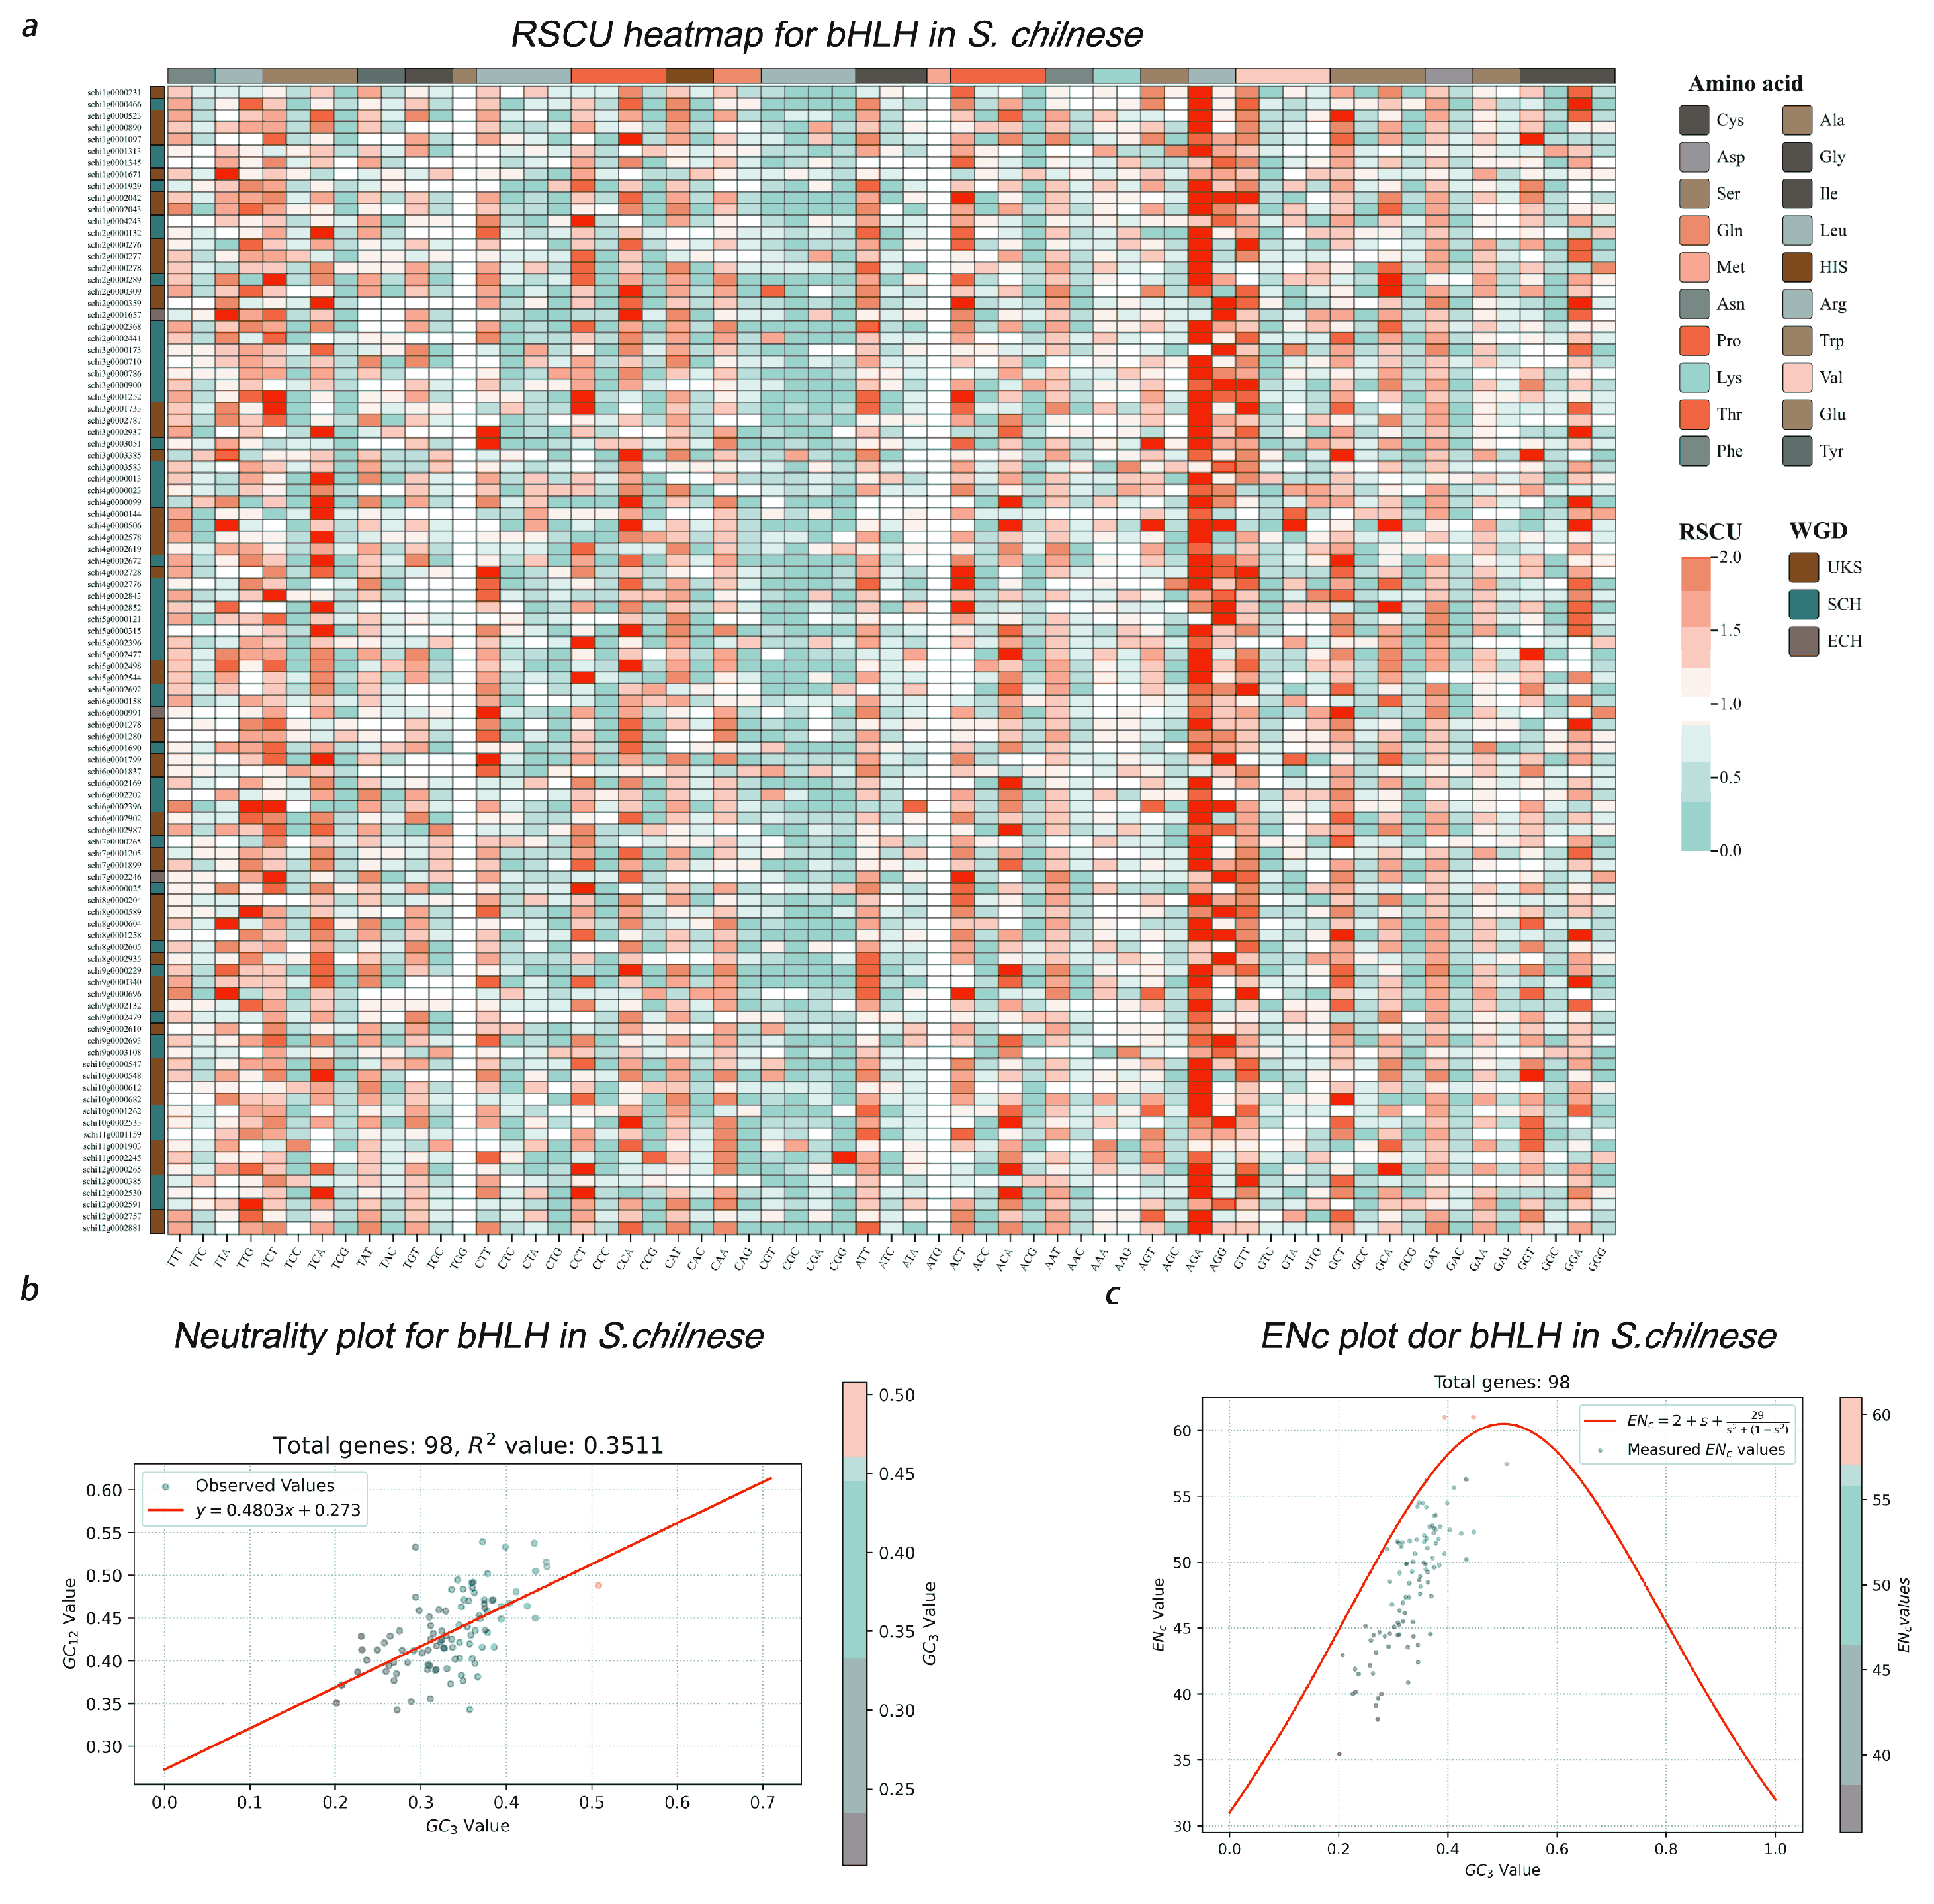
3.3. Codon Usage Bias in Fruit-Ripening-Related Transcription Factors

We processed the filtered sequences of eight different TFs from the aforementioned species and used CodonU to calculate values representing codon usage bias, such as ENc and RSCU (Supplementary Tables S4–S11). We observed that when compared with two outgroup species, the average ENc values of the same transcription factors (TFs) in tomatoes fluctuate within different ranges. Taking the NAC transcription factor as an example (Supplementary Table S8), the median ENc values for the seven tomato species were 47.93, 47.18, 47.91, 48.15, 46.93, 48.65, and 48.08, respectively, while the median ENc values for V. vinifera and C. canephora were 53.83 and 53.60, respectively. This indicates that the NAC transcription factors in tomatoes exhibit stronger codon usage bias compared to those in the two outgroup species. In contrast, for the BR transcription factors, tomatoes and the outgroup species showed similar median ENc values (Supplementary Table S6), suggesting comparable codon usage preferences in BR transcription factors between tomatoes and the outgroup species.
We also found that different TFs within the same species exhibit distinct codon usage patterns. For example, in S. chilense, the median ENc value for the NAC family (47.93) is lower than that for the BR family (53.71) (Supplementary Tables S6 and S8), indicating that the NAC family has a stronger codon usage bias compared to the BR family in S. chilense. Additionally, some TF families consistently show higher median ENc values than others across both the same and different species. For instance, the median ENc values of the BR family in all tomato species are higher than those of the NAC family, suggesting that the BR family has a weaker codon usage bias compared to the NAC family in all tomatoes (Supplementary Tables S6 and S8). The differences in ENc values among different species or TFs not only reflect variations in codon usage preferences but also suggest potential adaptive mechanisms and expression habits of regulatory factors.
We also identified distinct codon usage preferences within the same TF family. For example, in the bHLH family of S. chilense, vertical examination of the RSCU heatmap (Figure 2a) reveals that codons such as AGA and AGG have high RSCU values (close to 2), indicating that these codons are used more frequently in genes. In contrast, codons such as CGT and CGC have very low RSCU values (close to 0), suggesting rare usage. Additionally, codons such as TGG and ATG (encoding tryptophan and methionine, respectively) have RSCU values close to 1, indicating average usage frequencies with little to no preference. When comparing the RSCU heatmap horizontally (Figure 2a), we found that AGA generally has a higher usage frequency on the same gene, while CGC has a lower usage frequency.
Based on preliminary observations of codon usage bias, we conducted further correlation analyses on the aforementioned results (Figure 2). The neutrality plot results (Figure 2b) show a certain positive correlation between GC12 and GC3, with a coefficient of determination ( R 2 = 0.3511 ) significantly less than 1. This indicates notable differences in GC content among the three codon positions, suggesting that codon usage bias is primarily driven by natural selection. The ENc value reflects the strength of codon usage bias, where E N c > 35 indicates weak bias, while E N c 35 indicates strong bias. The ENc plot results (Figure 2c) reveal that most members of the bHLH family in S. chilense have ENc values greater than 35, indicating weak codon usage bias. On the other hand, the overall GC3 content of the bHLH family is relatively low (mostly ranging from 0.2 to 0.45), suggesting that A/T is the predominant choice at the third codon position. This implies that when GC3 is low, codon usage is relatively uniform; as GC3 increases, codon usage gradually shifts toward specific codons, leading to a decrease in ENc values.

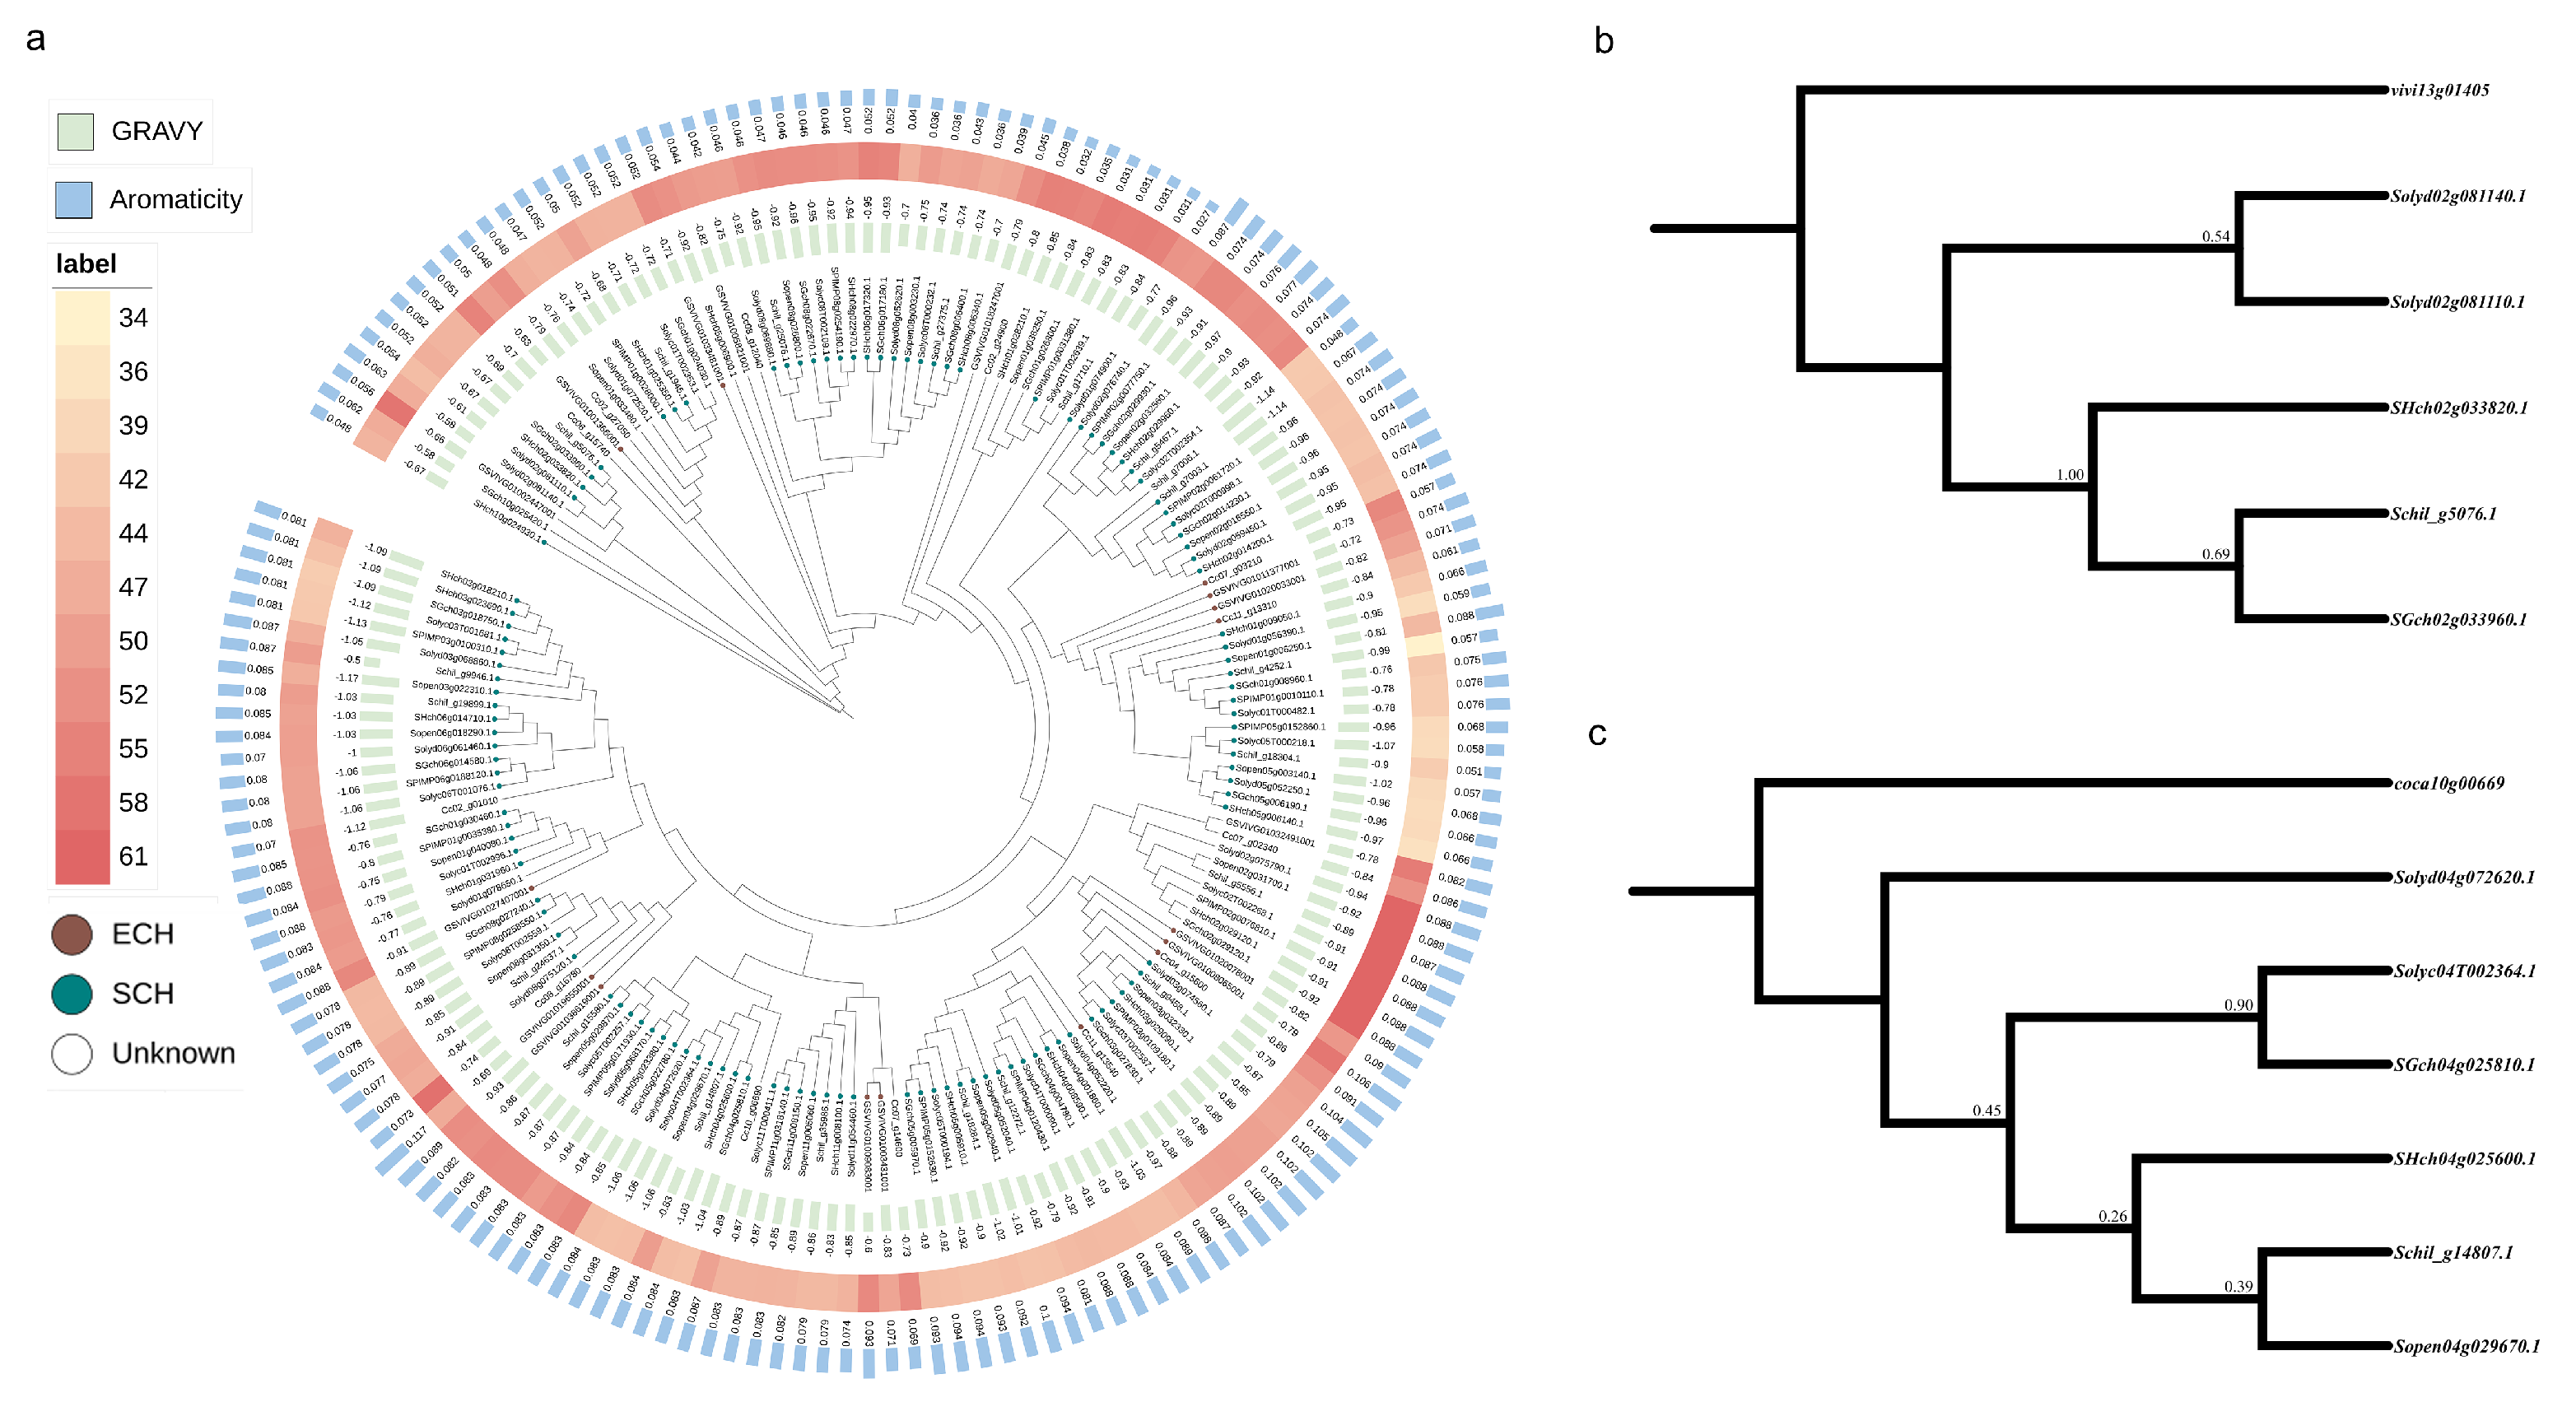
3.4. Phylogenetic Analysis of Transcription Factors in Fruit Development

We constructed phylogenetic trees for eight TF families across different species to explore their evolutionary characteristics. By examining the phylogenetic trees of each TF family, we can observe differences in evolutionary rates among members of the same TF family in different species. Taking the HD-zip family as an example (Figure 3a), we found that some members of the HD-zip family in species such as S. lycopersicoides, S. pimpinellifolium, and S. lycopersicum have longer branches, indicating a faster evolutionary rate for these members. Similarly, we can observe that some members of the HD-zip family in S. chilense and S. galapagense have a slower evolutionary rate.
Examining the phylogenetic trees of each TF family also reveals the phylogenetic relationships among different species. For instance, in a conserved branch (Figure 3b), we observed that the ratio of TF numbers between outgroups and tomatoes exceeds the ideal 1:3 ratio, suggesting greater gene loss in tomatoes compared to outgroups within these branches. In two independent branches (Figure 3b,c), we observed that the positions of S. lycopersicoides TF members in the HD-zip family tree are similar to their positions in the species tree, belonging to an early-diverging lineage among all tomatoes. In contrast, S. chilense shows the opposite pattern: while it is an early-diverging lineage in the species tree, some branches of the HD-zip family tree suggest it is a late-diverging lineage.
By correlating evolutionary rates with other characteristics, we identified several interesting patterns. Linking evolutionary rates with the origins of TF members (Figure 3a and Supplementary Table S9), we found that HD-zip members with faster evolutionary rates are predominantly derived from the SCH event, whereas those with slower evolutionary rates do not show a significant dominance of SCH origins. Similar patterns are observed in the phylogenetic trees of other TF families (Supplementary Figures S8–S14), such as bHLH, BR, MADS-box, and SRs/CAMTA, where SCH-derived members are more prevalent in rapidly evolving genes, while UKS-derived members are less common in slowly evolving genes. Linking evolutionary rates with the GRAVY values of TF members revealed that all encoded proteins are hydrophobic, with faster-evolving HD-zip members exhibiting lower average hydrophilicity and stronger hydrophobicity. Additionally, faster-evolving HD-zip members generally have higher ENc values, indicating weaker codon usage bias. Finally, faster-evolving HD-zip members also show higher aromaticity values compared to their slower-evolving counterparts.

3.5. Correlation Between Genomic Synteny and Fruit-Ripening-Related Transcription Factors

Tomatoes have undergone two whole-genome polyploidization events in their evolutionary history, namely ECH and SCH. Based on these events, we constructed a genome-wide synteny list including outgroups and seven tomato species. Using methods for analyzing complex plant genomes [61], we inferred the possible origins of each TF family member based on genome-wide synteny. We categorized these origins into ECH, SCH, and UKS, and explored the associations between different origins and various characteristics of TF families (Supplementary Table S12).
Genomic synteny reflects the quantity and proportion of each transcription factor (TF) family retained during the polyploidization process, making it a valuable resource for evolutionary studies. The genome-wide synteny results of S. lycopersicum (Figure 4) show that among the eight TF families derived from S. lycopersicum, there are 327 syntenic genes and 760 syntenic blocks, covering 0.89% of each family. The NAC family has the highest proportion, accounting for 36.9% of the syntenic genes among the eight TFs (Supplementary Table S12). Local synteny analysis (Figure 4b) reveals that MYB70 family members retain certain syntenic relationships on chromosomes 7, 10, and 12 of S. lycopersicum. For S. chilense, the syntenic genes of the eight TFs cover 0.94% of each family, with MYB70 having the highest proportion (Supplementary Figure S15 and Supplementary Table S12). In S. galapagense, the syntenic genes cover 1.1% of each family, with MYB70 being the most abundant (Supplementary Figure S16 and Supplementary Table S12). In S. habrochaites, the syntenic genes cover 1.32% of each family, with MYB70 having the highest proportion (Supplementary Figure S17 and Supplementary Table S12). For S. lycopersicoides, the syntenic genes cover 1.31% of each family, with bHLH being the most abundant (Supplementary Figure S18 and Supplementary Table S12). In S. pennellii, the syntenic genes cover 0.93% of each family, with bHLH having the highest proportion (Supplementary Figure S19 and Supplementary Table S12). Finally, in S. pimpinellifolium, the syntenic genes cover 1.2% of each family, with bHLH being the most abundant (Supplementary Figure S20 and Supplementary Table S12).

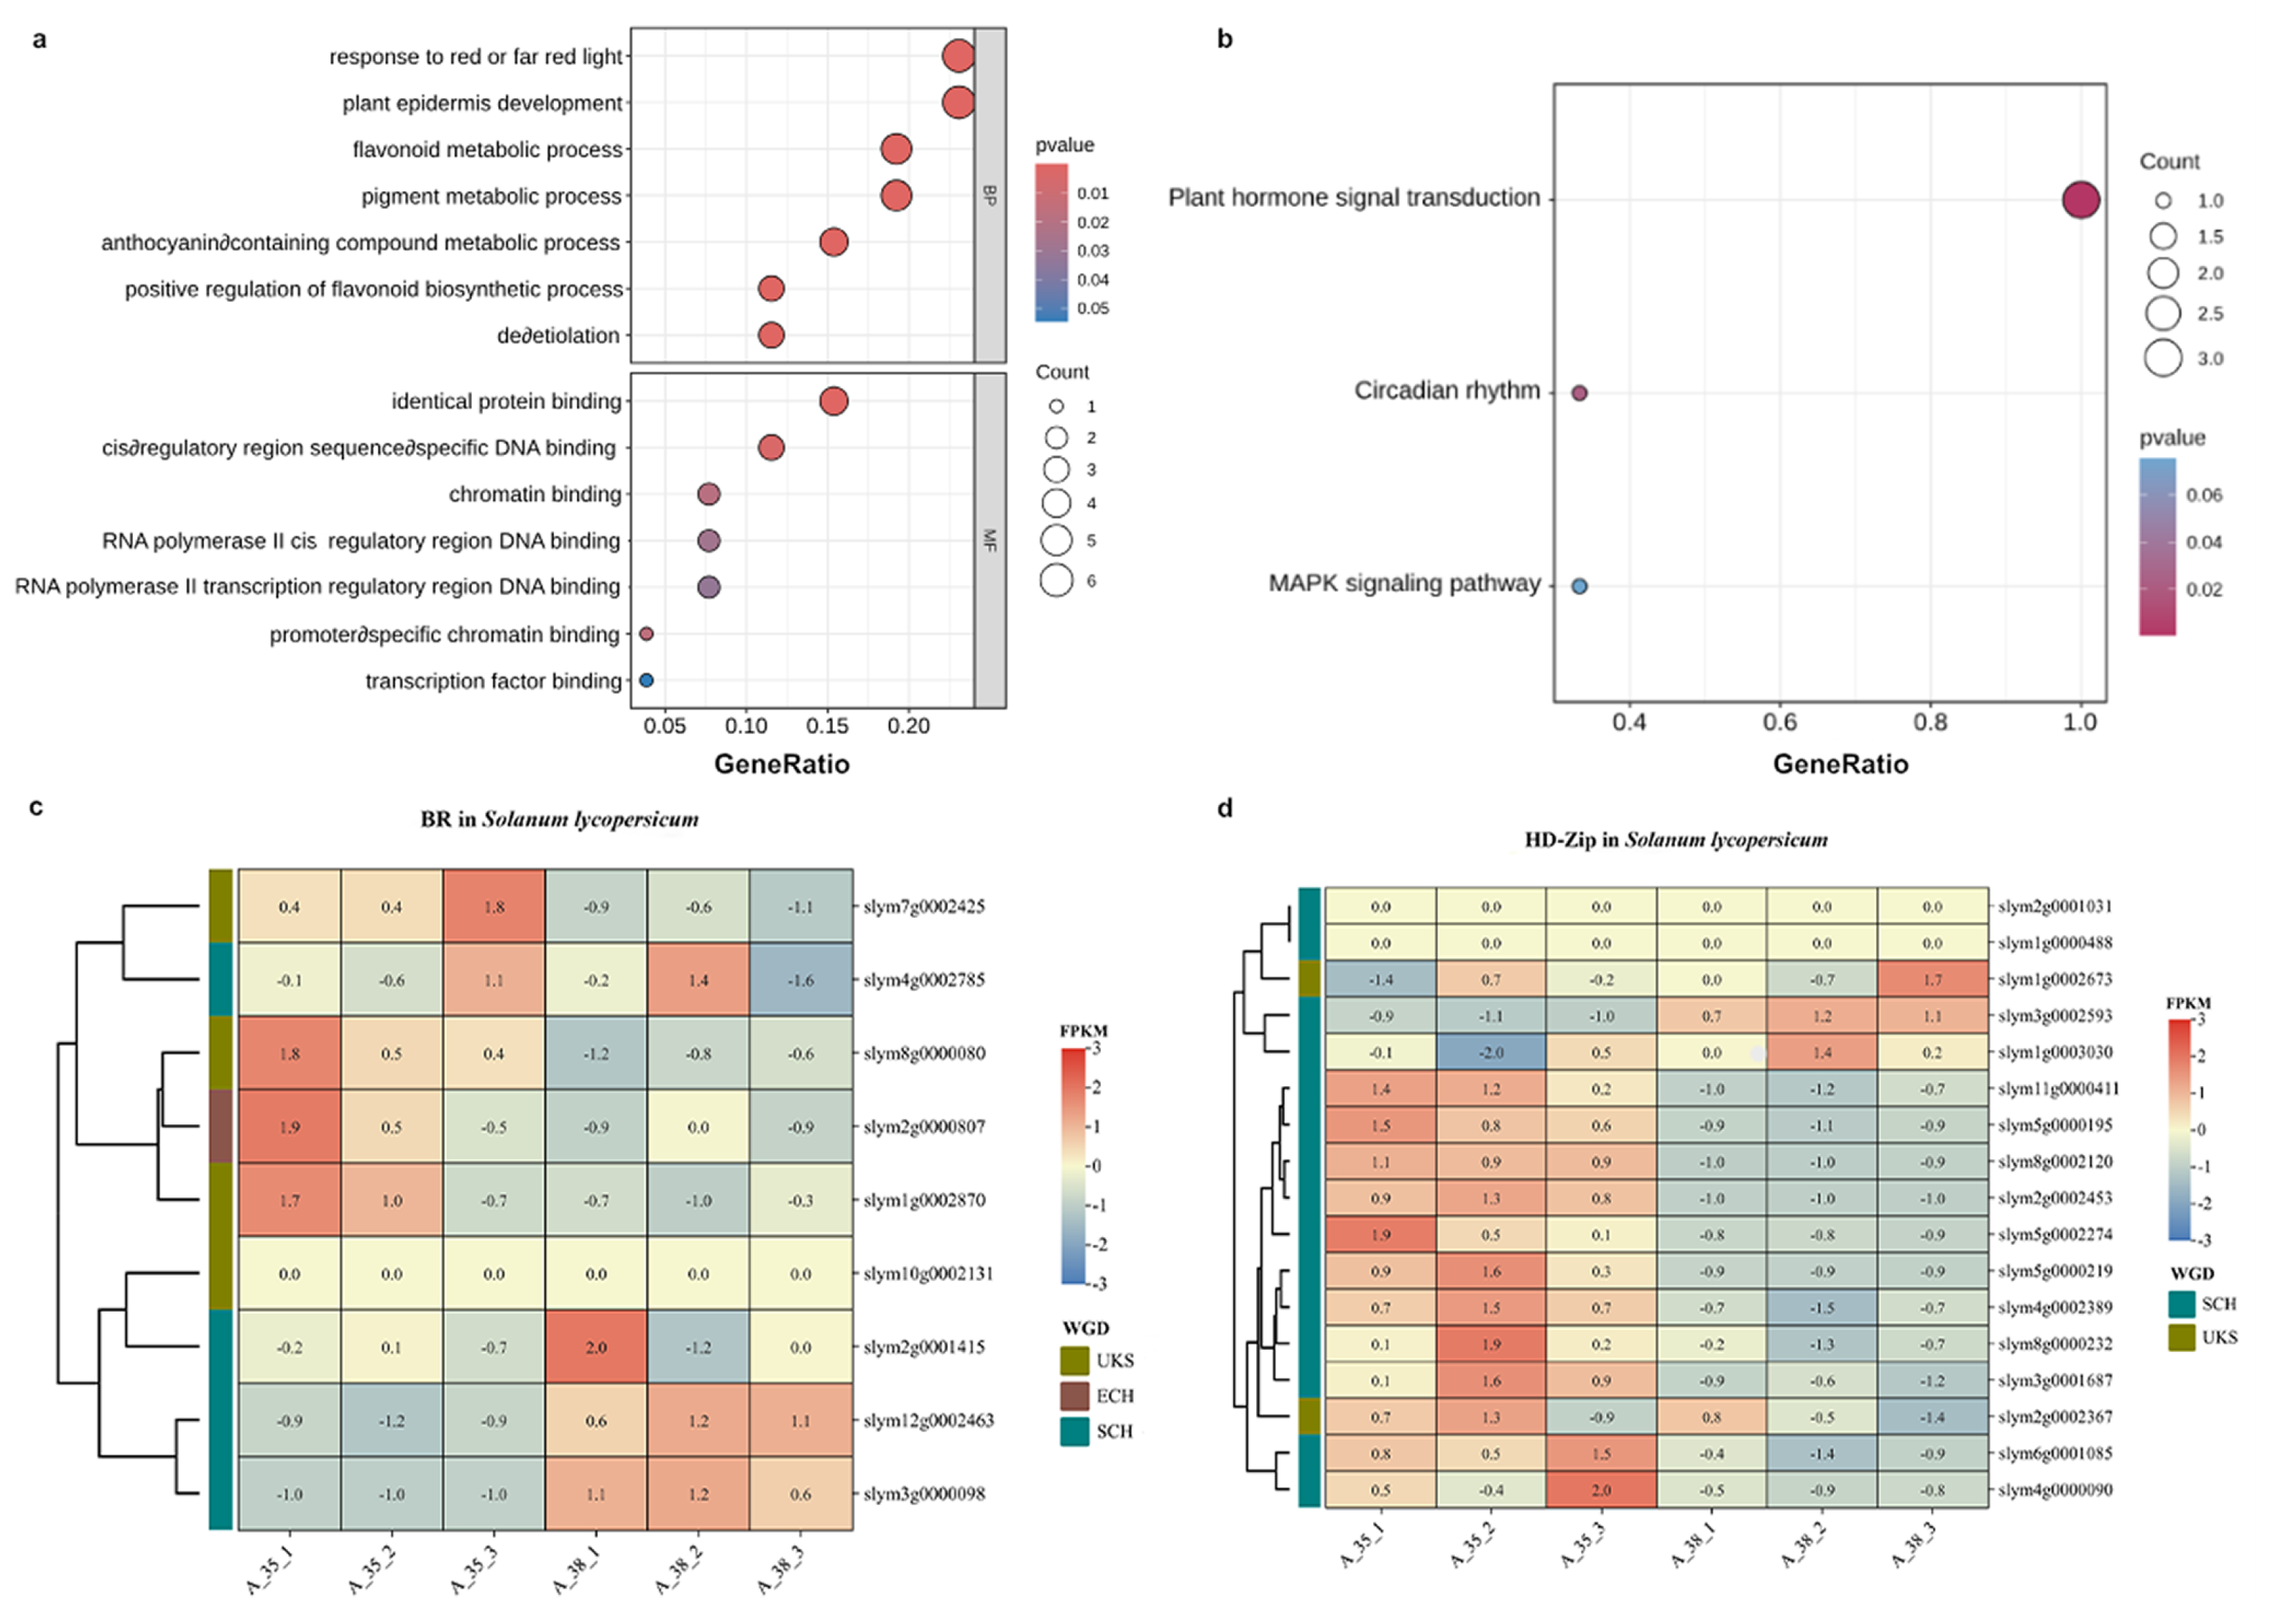
3.6. Expression Enrichment and Cluster Analysis of TF Families Related to Fruit Maturity

We performed GO enrichment and KEGG enrichment analyses on TF families related to fruit ripening in S. lycopersicum. The GO enrichment results (Figure 5a) showed that, in the Biological Process (BP) category, the relevant TF families were mainly enriched in responses to red or far-red light, plant epidermis development, flavonoid metabolic processes, pigment metabolic processes, and anthocyanin-containing compound metabolic processes. In the Molecular Function (MF) category, the TF families were primarily enriched in transcription factor binding processes, such as identical protein binding, cis-regulatory region sequence-specific DNA binding, chromatin binding, RNA polymerase II cis-regulatory region sequence-specific DNA binding, RNA polymerase II transcription regulatory region sequence-specific DNA binding, promoter-specific chromatin binding, and transcription factor binding. Due to limited gene data, only three enrichment results were obtained for KEGG enrichment (Figure 5b), which were enrichments in plant hormone signal transduction, circadian rhythm, and the MAPK signaling pathway.
Based on the heatmap of gene expression levels at different maturity stages of tomato, the expression trends of related TF families can be observed. As shown in the clustering expression heatmap of BR family genes (Figure 5c), slym3g00000098 and slym12g0002463 exhibit lower expression levels at the Mature Green (35) stage but significantly increased expression levels at the Breaker (38) stage. Conversely, slym7g0002425 shows higher expression levels at the Mature Green (35) stage and significantly decreased expression levels at the Breaker (38) stage. Furthermore, by combining this with the origins of TF family genes (Figure 5c), it is observed that BR transcription factor synthesis genes derived from the SCH event exhibit relatively high expression levels during the A38 stage, while those derived from UKS show more balanced expression levels across the two maturity stages.
Among other transcription factors, bHLH family genes and NAC family genes have a higher expression tendency during the A_38 stage, while MYB70 family genes have a higher expression tendency during the A_35 stage (Supplementary Figures S21, S23 and S24). The expression of MADS-box family genes, SIHY5 family genes, and SRs/CAMTA family genes is relatively balanced across the two maturation stages (Supplementary Figures S22, S25 and S26). There are too few genes in the SRs/CAMTA family, so it is difficult to identify a similar trend.

4. Discussion

4.1. SCH as the Primary Driver of Expansion in Specific Tomato Fruit-Ripening-Related TF Families

Based on the number and distribution of TF family members, we compared this result with other studies. Taking NAC as an example, we identified 93 NAC family members in common tomato (Solanum lycopersicum), which is inconsistent with the identification numbers in other relevant studies. For instance, the PlantTFDB 5.0 database [62] identified 101 NAC family members, and our previous study identified 85 NAC family members [62]. There may be two reasons for this phenomenon: (1) Our previous study used the ITAG 4.0 genome assembly version [63], while this study adopted the latest ITAG 5.0 version [64,65]. (2) PlantTFDB 5.0 also used the ITAG 4.0 tomato genome version, but due to its looser recognition parameters, it identified more NAC family members. The distribution of TF family members shows that all TF family members tend to be distributed at both ends of chromosomes and exist in clusters. This phenomenon has also been observed in studies of other plants, such as sorghum (Sorghum bicolor) [66], rice (Oryza sativa) [67], and maize (Zea mays) [68]. This is likely because these genes need to cluster to perform continuous functions.
Based on genomic synteny, we classified each member of the transcription factor (TF) family into different origin types (ECH, SCH, and UKS). We analyzed the origin types of all TFs one by one. Except for the SRs/CAMTA family, which could not be classified due to having too few members, the main origins of other family members such as MADS-box, bHLH, HD-Zip, and MYB70 were SCH (Supplementary Table S12). That is, SCH is the main driving force for the origin and expansion of these families.

4.2. Polyploidization Events May Enhance Codon Usage Bias in Tomato Fruit-Ripening-Related Transcription Factor Families

In the analysis of codon usage preference, we compared several tomato species with two outgroups. The comparison revealed that the TF families in tomatoes had a lower median ENc value (Supplementary Tables S4–S11), indicating stronger codon usage preference. Further associating the origin types of TF families (Supplementary Figure S28 and Supplementary Table S13), we found that TF families originating from SCH used fewer amino acids or codons during protein coding compared to those from other sources (ECH and UKS). That is to say, TFs originating or amplified from SCH exhibited stronger codon usage preference, which is likely the reason for more efficient gene expression of these genes.

4.3. Phylogenetic Analysis of Transcription Factor Family Members from Different Origins

Based on genomic homology research, it is known that the ancestor of tomatoes underwent an independent SCH event after diverging from the ancestors of two outgroup species. At this time, both fast-evolving and slow-evolving TF clusters exhibited a large number of gene loss phenomena, resulting in incomplete retention of the SCH-expanded TF members. In the phylogenetic tree analysis of TF families and their origins, we found that family members originating from the SCH event exhibited faster evolutionary rates. This suggests that the SCH event may have helped increase the evolutionary rate of TF families related to fruit ripening, thereby enhancing the function of TF families associated with fruit ripening.

4.4. Polyploidization May Be an Important Mechanism for Maintaining Expression Activity of Tomato Fruit-Ripening-Related Transcription Factor Families

Research findings indicate that eight TF families potentially exert either positive or negative regulatory effects during tomato fruit ripening. These TFs play crucial roles in facilitating the synthesis of essential hormones, including ethylene and abscisic acid, as well as vital nutrients like vitamin C and lycopene, thereby contributing significantly to the growth and development of both the fruit and its skin [6,7]. When comparing the expression of TF families across different species, this study found that each TF family in S. lycopersicum includes some inactive members in terms of expression. However, we did not observe a loss of fruit-ripening-related expression activity in tomatoes. We also discovered that most of the inactive TF families originated from UKS, while those that are active mostly originated from WGDs. Based on these findings, we hypothesize that TF families related to fruit ripening may continuously experience reductions in activity or even loss, while duplicate TF family members produced by WGDs seem to act as “successors”, effectively maintaining the expression and regulatory activity of the relevant TF families. We believe this may not be an isolated case, and many transcription factors may maintain their activity through this mechanism, but further research is needed to confirm this.

5. Conclusions

Tomato fruit ripening is regulated by a variety of internal and external factors, with TFs being one of the key regulatory components. In this study, we identified members of eight TF families from the genomes of seven tomato species and two outgroup species. Based on whole-genome collinearity, we determined the possible origins of each family member (ECH, SCH, and UKS) and found that SCH is the primary driver of the expansion of these TF families. Analyses of the quantity distribution and topological structure of phylogenetic trees indicate that each TF family amplified by whole-genome duplication (WGD) events experienced significant member loss. Codon usage bias analysis based on different origins revealed that WGD events likely enhanced the codon bias of TF families related to tomato fruit ripening, facilitating efficient expression with fewer family members. Correlation analysis between the origins and expression patterns of different TF families suggests that WGD events play a role in maintaining the expression activity of TF families associated with tomato fruit ripening. The association analysis between WGD events and TF families related to tomato fruit ripening provides a framework for exploring the origins, structure, and expression characteristics of these families, as well as insights for the development and breeding of tomato fruit ripening.

Supplementary Materials

The following supporting information can be downloaded at https://v2.fangcloud.com/share/bf317eab6dacea02b0409fd6a6, accessed on 27 January 2025; Supplementary Figure S1 Physical localization of 8 fruit ripening transcription factor synthesis genes on Solanum chilense; Supplementary Figure S2 Physical localization of 8 fruit ripening transcription factor synthesis genes on Solanum galapagense; Supplementary Figure S3 Physical localization of 8 fruit ripening transcription factor synthesis genes on Solanum habrochaites; Supplementary Figure S4 Physical localization of 8 fruit ripening transcription factor synthesis genes on Solanum lycopersicoides; Supplementary Figure S5 Physical localization of 8 fruit ripening transcription factor synthesis genes on Solanum lycopersicum; Supplementary Figure S6 Physical localization of 8 fruit ripening transcription factor synthesis genes on Solanum pennellii; Supplementary Figure S7 Physical localization of 8 fruit ripening transcription factor synthesis genes on Solanum pimpinellifolium; Supplementary Figure S8 Phylogenetic relationships of SRsCAMTA TFs in seven tomato specie; Supplementary Figure S9 Phylogenetic relationships of bHLH TFs in seven tomato species; Supplementary Figure S10 Phylogenetic relationships of BR TFs in seven tomato species; Supplementary Figure S11 Phylogenetic relationships of MADS-box TFs in seven tomato species; Supplementary Figure S12 Phylogenetic relationships of MYB70 TFs in seven tomato species; Supplementary Figure S13 Phylogenetic relationships of NAC TFs in seven tomato specie; Supplementary Figure S14 Phylogenetic relationships of SIHY5 TFs in seven tomato species; Supplementary Figure S15 The relationship between the synthesis genes of 8 fruit ripening TFs in Solanum chilense and their genome collinearity; Supplementary Figure S16 The relationship between the synthesis genes of 8 fruit ripening TFs in Solanum galapagense and their genome collinearity; Supplementary Figure S17 The relationship between the synthesis genes of 8 fruit ripening TFs in Solanum habrochaites and their genome collinearity; Supplementary Figure S18 The relationship between the synthesis genes of 8 fruit ripening TFs in Solanum lycopersicoides and their genome collinearity; Supplementary Figure S19 The relationship between the synthesis genes of 8 fruit ripening TFs in Solanum pennellii and their genome collinearity; Supplementary Figure S20 The relationship between the synthesis genes of 8 fruit ripening TFs in Solanum pimpinellifolium and their genome collinearity; Supplementary Figure S21 Expression of bHLH at Different Stages of Tomato Fruit Ripening; Supplementary Figure S22 Expression of MADS-box at Different Stages of Tomato Fruit Ripening; Supplementary Figure S23 Expression of MYB70 at Different Stages of Tomato Fruit Ripening; Supplementary Figure S24 Expression of NAC at Different Stages of Tomato Fruit Ripening; Supplementary Figure S25 Expression of SlHY5 at Different Stages of Tomato Fruit Ripening; Supplementary Figure S26 Expression of SRs/CAMAT at Different Stages of Tomato Fruit Ripening; Supplementary Figure S27 ENc plot of BHLH family in different species; Supplementary Figure S28 Distribution of ENC values of different species in three transcription factors (ECH/SCH/UKS); Supplemental Table S1 The species information involved in this study; Supplemental Table S2 Statistical table of TFs related to fruit ripening in involved species; Supplemental Table S3 Ratio of the number of TFs per tomato species to the reference species; Supplemental Table S4 The codon usage bias of bHLH transcription factors in the involved species; Supplemental Table S5 The codon usage bias of SlHY5 transcription factors in the involved species; Supplemental Table S6 The codon usage bias of BR transcription factors in the involved species; Supplemental Table S7 The codon usage bias of MADS-box transcription factors in the involved species; Supplemental Table S8 The codon usage bias of NAC transcription factors in the involved species; Supplemental Table S9 The codon usage bias of HD-zip transcription factors in the involved species; Supplemental Table S10 The codon usage bias of MYB70 transcription factors in the involved species; Supplemental Table S11 The codon usage bias of SRs/CAMTA transcription factors in the involved species; Supplemental Table S12 Statistics of different sources of TFs related to fruit ripeness; Supplemental Table S13 Median ENc values for Tfs from different sources.

Author Contributions

Conceptualization, Y.L., Z.W., and Y.H.; methodology, Y.H. and W.H.; software, W.H. and X.W.; validation, X.L., J.L., and Z.Z.; formal analysis, J.L. and Z.Z.; investigation, X.L.; writing—original draft preparation, Y.H. and W.H.; writing—review and editing, Y.L. and Z.W.; visualization, Y.H., W.H., and X.W.; project administration, Y.L. and Z.W. All authors have read and agreed to the published version of the manuscript.

Funding

This research study was funded by the Tangshan Science and Technology Program Project (21130217C to Y.L.)

Data Availability Statement

The primary data are included in the Supplementary Materials of the article, while the raw genomic and analytical data are available upon reasonable request from the corresponding author.

Conflicts of Interest

The authors declare no conflicts of interest.

References

  1. Bergougnoux, V. The History of Tomato: From Domestication to Biopharming. Biotechnol. Adv. 2014, 32, 170–189. [Google Scholar] [CrossRef] [PubMed]
  2. Perveen, R.; Suleria, H.A.R.; Anjum, F.M.; Butt, M.S.; Pasha, I.; Ahmad, S. Tomato (Solanum lycopersicum) Carotenoids and Lycopenes Chemistry; Metabolism, Absorption, Nutrition, and Allied Health Claims—A Comprehensive Review. Crit. Rev. Food Sci. Nutr. 2015, 55, 919–929. [Google Scholar] [CrossRef] [PubMed]
  3. Lin, T.; Zhu, G.; Zhang, J.; Xu, X.; Yu, Q.; Zheng, Z.; Zhang, Z.; Lun, Y.; Li, S.; Wang, X.; et al. Genomic Analyses Provide Insights into the History of Tomato Breeding. Nat. Genet. 2014, 46, 1220–1226. [Google Scholar] [CrossRef]
  4. Wang, Y.; Sun, C.; Ye, Z.; Li, C.; Huang, S.; Lin, T. The Genomic Route to Tomato Breeding: Past, Present, and Future. Plant Physiol. 2024, 195, 2500–2514. [Google Scholar] [CrossRef]
  5. Uluisik, S.; Chapman, N.H.; Smith, R.; Poole, M.; Adams, G.; Gillis, R.B.; Besong, T.M.D.; Sheldon, J.; Stiegelmeyer, S.; Perez, L.; et al. Genetic Improvement of Tomato by Targeted Control of Fruit Softening. Nat. Biotechnol. 2016, 34, 950–952. [Google Scholar] [CrossRef]
  6. Wang, R.; Angenent, G.C.; Seymour, G.; de Maagd, R.A. Revisiting the Role of Master Regulators in Tomato Ripening. Trends Plant Sci. 2020, 25, 291–301. [Google Scholar] [CrossRef]
  7. Li, C.; Hou, X.; Qi, N.; Liu, H.; Li, Y.; Huang, D.; Wang, C.; Liao, W. Insight into Ripening-Associated Transcription Factors in Tomato: A Review. Sci. Hortic. 2021, 288, 110363. [Google Scholar] [CrossRef]
  8. Ruprecht, C.; Lohaus, R.; Vanneste, K.; Mutwil, M.; Nikoloski, Z.; Van De Peer, Y.; Persson, S. Revisiting Ancestral Polyploidy in Plants. Sci. Adv. 2017, 3, e1603195. [Google Scholar] [CrossRef]
  9. Tang, H.; Bowers, J.E.; Wang, X.; Ming, R.; Alam, M.; Paterson, A.H. Synteny and Collinearity in Plant Genomes. Science 2008, 320, 486–488. [Google Scholar] [CrossRef]
  10. Zhang, K.; Wang, X.; Cheng, F. Plant Polyploidy: Origin, Evolution, and Its Influence on Crop Domestication. Hortic. Plant J. 2019, 5, 231–239. [Google Scholar] [CrossRef]
  11. Wu, S.; Han, B.; Jiao, Y. Genetic Contribution of Paleopolyploidy to Adaptive Evolution in Angiosperms. Mol. Plant 2020, 13, 59–71. [Google Scholar] [CrossRef] [PubMed]
  12. The French–Italian Public Consortium for Grapevine Genome Characterization The Grapevine Genome Sequence Suggests Ancestral Hexaploidization in Major Angiosperm Phyla. Nature 2007, 449, 463–467. Available online: https://www.nature.com/articles/nature06148#citeas (accessed on 14 April 2025). [CrossRef] [PubMed]
  13. The Tomato Genome Consortium The Tomato Genome Sequence Provides Insights into Fleshy Fruit Evolution. Nature 2012, 485, 635–641. [CrossRef] [PubMed]
  14. The Potato Genome Sequencing Consortium Genome Sequence and Analysis of the Tuber Crop Potato. Nature 2011, 475, 189–195. Available online: https://www.nature.com/articles/nature10158#citeas (accessed on 14 April 2025). [CrossRef]
  15. Huang, J.; Xu, W.; Zhai, J.; Hu, Y.; Guo, J.; Zhang, C.; Zhao, Y.; Zhang, L.; Martine, C.; Ma, H.; et al. Nuclear Phylogeny and Insights into Whole-Genome Duplications and Reproductive Development of Solanaceae Plants. Plant Commun. 2023, 4, 100595. [Google Scholar] [CrossRef]
  16. Li, N.; He, Q.; Wang, J.; Wang, B.; Zhao, J.; Huang, S.; Yang, T.; Tang, Y.; Yang, S.; Aisimutuola, P.; et al. Super-Pangenome Analyses Highlight Genomic Diversity and Structural Variation across Wild and Cultivated Tomato Species. Nat. Genet. 2023, 55, 852–860. [Google Scholar] [CrossRef]
  17. Yu, X.; Qu, M.; Shi, Y.; Hao, C.; Guo, S.; Fei, Z.; Gao, L. Chromosome-Scale Genome Assemblies of Wild Tomato Relatives Solanum habrochaites and Solanum galapagense Reveal Structural Variants Associated with Stress Tolerance and Terpene Biosynthesis. Hortic. Res. 2022, 9, uhac139. [Google Scholar] [CrossRef]
  18. Powell, A.F.; Feder, A.; Li, J.; Schmidt, M.H.-W.; Courtney, L.; Alseekh, S.; Jobson, E.M.; Vogel, A.; Xu, Y.; Lyon, D.; et al. A Solanum lycopersicoides Reference Genome Facilitates Insights into Tomato Specialized Metabolism and Immunity. Plant J. 2022, 110, 1791–1810. [Google Scholar] [CrossRef]
  19. Bolger, A.; Scossa, F.; Bolger, M.E.; Lanz, C.; Maumus, F.; Tohge, T.; Quesneville, H.; Alseekh, S.; Sørensen, I.; Lichtenstein, G.; et al. The Genome of the Stress-Tolerant Wild Tomato Species Solanum Pennellii. Nat. Genet. 2014, 46, 1034–1038. [Google Scholar] [CrossRef]
  20. Wang, X.; Gao, L.; Jiao, C.; Stravoravdis, S.; Hosmani, P.S.; Saha, S.; Zhang, J.; Mainiero, S.; Strickler, S.R.; Catala, C.; et al. Genome of Solanum Pimpinellifolium Provides Insights into Structural Variants during Tomato Breeding. Nat. Commun. 2020, 11, 5817. [Google Scholar] [CrossRef]
  21. Denoeud, F.; Carretero-Paulet, L.; Dereeper, A.; Droc, G.; Guyot, R.; Pietrella, M.; Zheng, C.; Alberti, A.; Anthony, F.; Aprea, G.; et al. The Coffee Genome Provides Insight into the Convergent Evolution of Caffeine Biosynthesis. Science 2014, 345, 1181–1184. [Google Scholar] [CrossRef] [PubMed]
  22. Gao, Y.; Fan, Z.; Zhang, Q.; Li, H.; Liu, G.; Jing, Y.; Zhang, Y.; Zhu, B.; Zhu, H.; Chen, J.; et al. A Tomato NAC Transcription Factor, SlNAM1, Positively Regulates Ethylene Biosynthesis and the Onset of Tomato Fruit Ripening. Plant J. 2021, 108, 1317–1331. [Google Scholar] [CrossRef] [PubMed]
  23. Gao, Y.; Wei, W.; Zhao, X.; Tan, X.; Fan, Z.; Zhang, Y.; Jing, Y.; Meng, L.; Zhu, B.; Zhu, H.; et al. A NAC Transcription Factor, NOR-Like1, Is a New Positive Regulator of Tomato Fruit Ripening. Hortic. Res. 2018, 5, 75. [Google Scholar] [CrossRef] [PubMed]
  24. Wang, W.; Wang, P.; Li, X.; Wang, Y.; Tian, S.; Qin, G. The Transcription Factor SlHY5 Regulates the Ripening of Tomato Fruit at Both the Transcriptional and Translational Levels. Hortic. Res. 2021, 8, 83. [Google Scholar] [CrossRef]
  25. Meng, F.; Liu, H.; Hu, S.; Jia, C.; Zhang, M.; Li, S.; Li, Y.; Lin, J.; Jian, Y.; Wang, M.; et al. The Brassinosteroid Signaling Component SlBZR1 Promotes Tomato Fruit Ripening and Carotenoid Accumulation. JIPB 2023, 65, 1794–1813. [Google Scholar] [CrossRef]
  26. Zhu, T.; Tan, W.-R.; Deng, X.-G.; Zheng, T.; Zhang, D.-W.; Lin, H.-H. Effects of Brassinosteroids on Quality Attributes and Ethylene Synthesis in Postharvest Tomato Fruit. Postharvest Biol. Technol. 2015, 100, 196–204. [Google Scholar] [CrossRef]
  27. Vrebalov, J.; Ruezinsky, D.; Padmanabhan, V.; White, R.; Medrano, D.; Drake, R.; Schuch, W.; Giovannoni, J. A MADS-Box Gene Necessary for Fruit Ripening at the Tomato Ripening-Inhibitor (Rin) Locus. Science 2002, 296, 343–346. [Google Scholar] [CrossRef]
  28. Fujisawa, M.; Nakano, T.; Shima, Y.; Ito, Y. A Large-Scale Identification of Direct Targets of the Tomato MADS Box Transcription Factor RIPENING INHIBITOR Reveals the Regulation of Fruit Ripening. Plant Cell 2013, 25, 371–386. [Google Scholar] [CrossRef]
  29. Zhang, L.; Kang, J.; Xie, Q.; Gong, J.; Shen, H.; Chen, Y.; Chen, G.; Hu, Z. The Basic Helix-Loop-Helix Transcription Factor bHLH95 Affects Fruit Ripening and Multiple Metabolisms in Tomato. J. Exp. Bot. 2020, 71, 6311–6327. [Google Scholar] [CrossRef]
  30. Lin, Z.; Hong, Y.; Yin, M.; Li, C.; Zhang, K.; Grierson, D. A Tomato HD-zip Homeobox Protein, LeHB-1, Plays an Important Role in Floral Organogenesis and Ripening. Plant J. 2008, 55, 301–310. [Google Scholar] [CrossRef]
  31. Li, F.; Fu, M.; Zhou, S.; Xie, Q.; Chen, G.; Chen, X.; Hu, Z. A Tomato HD-Zip I Transcription Factor, VAHOX1, Acts as a Negative Regulator of Fruit Ripening. Hortic. Res. 2023, 10, uhac236. [Google Scholar] [CrossRef] [PubMed]
  32. Cao, H.; Chen, J.; Yue, M.; Xu, C.; Jian, W.; Liu, Y.; Song, B.; Gao, Y.; Cheng, Y.; Li, Z. Tomato Transcriptional Repressor MYB70 Directly Regulates Ethylene-dependent Fruit Ripening. Plant J. 2020, 104, 1568–1581. [Google Scholar] [CrossRef] [PubMed]
  33. Blum, M.; Andreeva, A.; Florentino, L.C.; Chuguransky, S.R.; Grego, T.; Hobbs, E.; Pinto, B.L.; Orr, A.; Paysan-Lafosse, T.; Ponamareva, I.; et al. InterPro: The Protein Sequence Classification Resource in 2025. Nucleic Acids Res. 2025, 53, D444–D456. [Google Scholar] [CrossRef] [PubMed]
  34. Cock, P.J.A.; Antao, T.; Chang, J.T.; Chapman, B.A.; Cox, C.J.; Dalke, A.; Friedberg, I.; Hamelryck, T.; Kauff, F.; Wilczynski, B.; et al. Biopython: Freely Available Python Tools for Computational Molecular Biology and Bioinformatics. Bioinformatics 2009, 25, 1422–1423. [Google Scholar] [CrossRef]
  35. Edgar, R.C. Muscle5: High-Accuracy Alignment Ensembles Enable Unbiased Assessments of Sequence Homology and Phylogeny. Nat. Commun. 2022, 13, 6968. [Google Scholar] [CrossRef]
  36. Potter, S.C.; Luciani, A.; Eddy, S.R.; Park, Y.; Lopez, R.; Finn, R.D. HMMER Web Server: 2018 Update. Nucleic Acids Res. 2018, 46, W200–W204. [Google Scholar] [CrossRef]
  37. Chao, J.; Li, Z.; Sun, Y.; Aluko, O.O.; Wu, X.; Wang, Q.; Liu, G. MG2C: A User-Friendly Online Tool for Drawing Genetic Maps. Mol. Hortic. 2021, 1, 16. [Google Scholar] [CrossRef]
  38. Choudhuri, S.; Sau, K. CodonU: A Python Package for Codon Usage Analysis. IEEE/ACM Trans. Comput. Biol. Bioinf. 2024, 21, 36–44. [Google Scholar] [CrossRef]
  39. Emms, D.M.; Kelly, S. OrthoFinder: Phylogenetic Orthology Inference for Comparative Genomics. Genome Biol. 2019, 20, 238. [Google Scholar] [CrossRef]
  40. Kumar, S.; Suleski, M.; Craig, J.M.; Kasprowicz, A.E.; Sanderford, M.; Li, M.; Stecher, G.; Hedges, S.B. TimeTree 5: An Expanded Resource for Species Divergence Times. Mol. Biol. Evol. 2022, 39, msac174. [Google Scholar] [CrossRef]
  41. Capella-Gutiérrez, S.; Silla-Martínez, J.M.; Gabaldón, T. trimAl: A Tool for Automated Alignment Trimming in Large-Scale Phylogenetic Analyses. Bioinformatics 2009, 25, 1972–1973. [Google Scholar] [CrossRef] [PubMed]
  42. Minh, B.Q.; Schmidt, H.A.; Chernomor, O.; Schrempf, D.; Woodhams, M.D.; Von Haeseler, A.; Lanfear, R. IQ-TREE 2: New Models and Efficient Methods for Phylogenetic Inference in the Genomic Era. Mol. Biol. Evol. 2020, 37, 1530–1534. [Google Scholar] [CrossRef] [PubMed]
  43. Xie, J.; Chen, Y.; Cai, G.; Cai, R.; Hu, Z.; Wang, H. Tree Visualization by One Table (tvBOT): A Web Application for Visualizing, Modifying and Annotating Phylogenetic Trees. Nucleic Acids Res. 2023, 51, W587–W592. [Google Scholar] [CrossRef] [PubMed]
  44. Camacho, C.; Coulouris, G.; Avagyan, V.; Ma, N.; Papadopoulos, J.; Bealer, K.; Madden, T.L. BLAST+: Architecture and Applications. BMC Bioinform. 2009, 10, 421. [Google Scholar] [CrossRef]
  45. Yang, Z. PAML 4: Phylogenetic Analysis by Maximum Likelihood. Mol. Biol. Evol. 2007, 24, 1586–1591. [Google Scholar] [CrossRef]
  46. Sun, P.; Jiao, B.; Yang, Y.; Shan, L.; Li, T.; Li, X.; Xi, Z.; Wang, X.; Liu, J. WGDI: A User-Friendly Toolkit for Evolutionary Analyses of Whole-Genome Duplications and Ancestral Karyotypes. Mol. Plant 2022, 15, 1841–1851. [Google Scholar] [CrossRef]
  47. Wang, Y.; Jia, L.; Tian, G.; Dong, Y.; Zhang, X.; Zhou, Z.; Luo, X.; Li, Y.; Yao, W. shinyCircos-V2.0: Leveraging the Creation of Circos Plot with Enhanced Usability and Advanced Features. iMeta 2023, 2, e109. [Google Scholar] [CrossRef]
  48. Tang, H.; Krishnakumar, V.; Zeng, X.; Xu, Z.; Taranto, A.; Lomas, J.S.; Zhang, Y.; Huang, Y.; Wang, Y.; Yim, W.C.; et al. JCVI: A Versatile Toolkit for Comparative Genomics Analysis. iMeta 2024, 3, e211. [Google Scholar] [CrossRef]
  49. Ashburner, M.; Ball, C.A.; Blake, J.A.; Botstein, D.; Butler, H.; Cherry, J.M.; Davis, A.P.; Dolinski, K.; Dwight, S.S.; Eppig, J.T.; et al. Gene Ontology: Tool for the Unification of Biology. Nat. Genet. 2000, 25, 25–29. [Google Scholar] [CrossRef]
  50. The Gene Ontology Consortium; Aleksander, S.A.; Balhoff, J.; Carbon, S.; Cherry, J.M.; Drabkin, H.J.; Ebert, D.; Feuermann, M.; Gaudet, P.; Harris, N.L.; et al. The Gene Ontology Knowledgebase in 2023. Genetics 2023, 224, iyad031. [Google Scholar]
  51. Thomas, P.D.; Ebert, D.; Muruganujan, A.; Mushayahama, T.; Albou, L.; Mi, H. PANTHER: Making Genome-scale Phylogenetics Accessible to All. Protein Sci. 2022, 31, 8–22. [Google Scholar] [CrossRef] [PubMed]
  52. Kanehisa, M.; Furumichi, M.; Sato, Y.; Matsuura, Y.; Ishiguro-Watanabe, M. KEGG: Biological Systems Database as a Model of the Real World. Nucleic Acids Res. 2025, 53, D672–D677. [Google Scholar] [CrossRef] [PubMed]
  53. Martin Morgan [Cre], M.C. [Ctb] AnnotationHub: Client to Access AnnotationHub Resources, R Package Version 3.16.0; 2025. Available online: https://bioconductor.org/packages/release/bioc/html/AnnotationHub.html (accessed on 14 April 2025).
  54. Yu, G.; Wang, L.-G.; Yan, G.-R.; He, Q.-Y. DOSE: An R/Bioconductor Package for Disease Ontology Semantic and Enrichment Analysis. Bioinformatics 2015, 31, 608–609. [Google Scholar] [CrossRef] [PubMed]
  55. Wu, T.; Hu, E.; Xu, S.; Chen, M.; Guo, P.; Dai, Z.; Feng, T.; Zhou, L.; Tang, W.; Zhan, L.; et al. clusterProfiler 4.0: A Universal Enrichment Tool for Interpreting Omics Data. Innovation 2021, 2, 100141. [Google Scholar] [CrossRef]
  56. Yu, G.; Wang, L.-G.; Han, Y.; He, Q.-Y. clusterProfiler: An R Package for Comparing Biological Themes among Gene Clusters. OMICS A J. Integr. Biol. 2012, 16, 284–287. [Google Scholar] [CrossRef]
  57. Xu, S.; Hu, E.; Cai, Y.; Xie, Z.; Luo, X.; Zhan, L.; Tang, W.; Wang, Q.; Liu, B.; Wang, R.; et al. Using clusterProfiler to Characterize Multiomics Data. Nat. Protoc. 2024, 19, 3292–3320. [Google Scholar] [CrossRef]
  58. Tenenbaum, D. KEGGREST: Client-Side REST Access to the Kyoto Encyclopedia of Genes and Genomes (KEGG), R Package Version 1.48.0. 2025. Available online: https://bioconductor.org/packages/release/bioc/html/KEGGREST.html (accessed on 14 April 2025).
  59. Wickham, H. Data Analysis. In ggplot2; Use R! Springer International Publishing: Cham, Switzerland, 2016; pp. 189–201. [Google Scholar]
  60. Guangchuang, Y. Enrichplot: Visualization of Functional Enrichment Result, R Package Version 1.28.0. 2025. Available online: https://bioconductor.org/packages/release/bioc/html/enrichplot.html (accessed on 14 April 2025).
  61. Wang, J.; Sun, P.; Li, Y.; Liu, Y.; Yang, N.; Yu, J.; Ma, X.; Sun, S.; Xia, R.; Liu, X.; et al. An Overlooked Paleotetraploidization in Cucurbitaceae. Mol. Biol. Evol. 2018, 35, 16–26. [Google Scholar] [CrossRef]
  62. Tian, F.; Yang, D.-C.; Meng, Y.-Q.; Jin, J.; Gao, G. PlantRegMap: Charting Functional Regulatory Maps in Plants. Nucleic Acids Res. 2020, 48, D1104–D1113. [Google Scholar] [CrossRef]
  63. Yuan, J.; Liu, Y.; Wang, Z.; Lei, T.; Hu, Y.; Zhang, L.; Yuan, M.; Wang, J.; Li, Y. Genome-Wide Analysis of the NAC Family Associated with Two Paleohexaploidization Events in the Tomato. Life 2022, 12, 1236. [Google Scholar] [CrossRef]
  64. Hosmani, P.S.; Flores-Gonzalez, M.; Van De Geest, H.; Maumus, F.; Bakker, L.V.; Schijlen, E.; Van Haarst, J.; Cordewener, J.; Sanchez-Perez, G.; Peters, S.; et al. An Improved de Novo Assembly and Annotation of the Tomato Reference Genome Using Single-Molecule Sequencing, Hi-C Proximity Ligation and Optical Maps. bioRxiv 2019, 767764. [Google Scholar]
  65. Zhou, Y.; Zhang, Z.; Bao, Z.; Li, H.; Lyu, Y.; Zan, Y.; Wu, Y.; Cheng, L.; Fang, Y.; Wu, K.; et al. Graph Pangenome Captures Missing Heritability and Empowers Tomato Breeding. Nature 2022, 606, 527–534. [Google Scholar] [CrossRef] [PubMed]
  66. Rao, X.; Qian, Z.; Xie, L.; Wu, H.; Luo, Q.; Zhang, Q.; He, L.; Li, F. Genome-Wide Identification and Expression Pattern of MYB Family Transcription Factors in Erianthus Fulvus. Genes 2023, 14, 2128. [Google Scholar] [CrossRef] [PubMed]
  67. Arora, R.; Agarwal, P.; Ray, S.; Singh, A.K.; Singh, V.P.; Tyagi, A.K.; Kapoor, S. MADS-Box Gene Family in Rice: Genome-Wide Identification, Organization and Expression Profiling during Reproductive Development and Stress. BMC Genom. 2007, 8, 242. [Google Scholar] [CrossRef]
  68. Zhang, T.; Lv, W.; Zhang, H.; Ma, L.; Li, P.; Ge, L.; Li, G. Genome-Wide Analysis of the Basic Helix-Loop-Helix (bHLH) Transcription Factor Family in Maize. BMC Plant Biol. 2018, 18, 235. [Google Scholar] [CrossRef] [PubMed]
Figure 1. Quantitative distribution of eight fruit-ripening transcription factors in different genomes. (a) A species tree based on single-copy genes is shown on the left, with two whole-genome triplication events (ECH and SCH) indicated. The number of TFs identified in each species’ genome is displayed to the right of the tree, represented by bar charts. (b) The x-axis represents each type of TF, and the y-axis shows the ratio of the number of each TF in tomatoes relative to V. vinifera. Bar charts for different TFs are plotted using different colors. (c) The x-axis represents each type of TF, and the y-axis shows the ratio of the number of each TF in tomatoes relative to C. canephora. Bar charts for different TFs are plotted using different colors.
Horticulturae 11 00447 g001
Figure 2. Codon usage in the bHLH family of S. chilense. (a) The x-axis lists different codons, with each codon labeled by its encoded amino acid. The y-axis represents different genes, each marked by a color block indicating its source. The intersection of x and y is shown by a rectangular color block representing the RSCU value, with color intensity (0-2) indicating magnitude. (b) The x-axis shows the GC3 value, the proportion of G and C in the third codon position. The y-axis shows the GC12 value, the proportion of G and C in the first and second codon positions. Each point represents a specific codon combination, positioned by its GC3 and GC12 values. Color indicates GC3 value, with a gradient from low (purple) to high (yellow). The red line shows the linear regression, describing the relationship between GC12 and GC3 values. (c) The x-axis shows GC3 values, and the y-axis shows ENc values. Each point represents a codon combination, positioned by its GC3 and ENc values. If a gene is close to the expected curve, it suggests that mutation pressure mainly influences its codon usage. Significant downward deviation from this curve may indicate additional selection pressure, leading to a more limited codon usage to enhance translation efficiency or accuracy. Dot color indicates ENc value magnitude, with a gradient from low (purple) to high (yellow). The red curve represents the theoretical relationship between ENc and GC3 values.
Horticulturae 11 00447 g002
Figure 3. Phylogenetic relationships of HD-zip TFs in seven tomato species. (a) The innermost circle shows the gene tree of the HD-zip family, with colored balls under gene names indicating their possible origins. Black dots: ENC values (the size may reflect density or intensity). Red blocks: Aromaticity values (the depth of color indicates the level of content). Blue blocks: GRAVY values (low on the left → high on the right). (b) Subtree corresponding to branch marker 1 in (a). (c) Subtree corresponding to branch marker 2 in (a).
Horticulturae 11 00447 g003
Figure 4. The relationship between collinearity within the S. lycopersicum genome and eight TF families. (a) From the outside to the inside: the chromosomes of S. lycopersicum, the positions of eight TF family genes (each color represents a TF family), the origins of eight TF family genes (three colors represent ECH, SCH, and UKS), and collinear segments or connections between genes within the S. lycopersicum genome. (b) Collinear segments or gene connections between partial chromosome 7 and partial chromosomes 10 and 12 of S. lycopersicum (highlighting MYB70 family genes in a collinear state).
Horticulturae 11 00447 g004
Figure 5. Enrichment and expression of fruit-ripening-related TFs in S. lycopersicum. (a) The x-axis represents the gene ratio, and the y-axis lists the enriched GO biological pathways. The size of the dots indicates the number of enriched genes, and the color of the dots represents the significance of enrichment. Darker colors indicate higher significance in the GO pathway data. (b) The x-axis represents the gene ratio, and the y-axis lists the enriched KEGG metabolic pathways. The size of the dots indicates the number of enriched genes, and the color of the dots represents the significance of enrichment. Darker colors indicate higher significance in the KEGG pathway data. (c) The x-axis represents replicate samples of two different tomato varieties at different maturity stages, while the y-axis represents different BR family genes (annotated with ECH, SCH, and UKS origins). The values and colors within each rectangular box represent the logarithmic values of gene expression levels (FPKM). (d) The x-axis represents replicate samples of two different tomato varieties at different maturity stages, and the y-axis represents different HD-Zip family genes (annotated with ECH, SCH, and UKS origins). The values and colors within each rectangular box represent the logarithmic values of gene expression levels (FPKM).
Horticulturae 11 00447 g005
Disclaimer/Publisher’s Note: The statements, opinions and data contained in all publications are solely those of the individual author(s) and contributor(s) and not of MDPI and/or the editor(s). MDPI and/or the editor(s) disclaim responsibility for any injury to people or property resulting from any ideas, methods, instructions or products referred to in the content.

