Article

Distribution of Oligaphorura ursi in Morchella Cultivation Soil, Screening of Pesticides, and Analysis of Their Effects on Mycelial Growth and Pesticide Residues

Key Laboratory of Plant Protection Resources and Pest Management of Ministry of Education, Key Laboratory of Integrated Pest Management on Crops in Northwestern Loess Plateau of Ministry of Agriculture and Rural Affairs, College of Plant Protection, Northwest A&F University, Yangling 712100, China
*
Author to whom correspondence should be addressed.
Horticulturae 2025, 11(5), 471; https://doi.org/10.3390/horticulturae11050471 (registering DOI)
Submission received: 24 March 2025 / Revised: 13 April 2025 / Accepted: 24 April 2025 / Published: 27 April 2025
(This article belongs to the Special Issue Advances in Propagation and Cultivation of Mushroom)

Abstract

:
To identify the species of Collembola that harm Morchella and to screen for pesticides that are effective in controlling these pests with minimal inhibition of mycelial growth, a five-point sampling method was used to investigate the population of Collembola and its damaging effects on Morchella and to analyze its spatial distribution in the soil. The indoor control efficacy of ten insecticides was determined using the mushroom disc immersion method and the pesticide film method. The most effective insecticides were then selected for field testing. The effect of the best-performing field pesticides on the mycelial growth of Morchella was measured using the Petri dish mycelial growth rate method, and pesticide residues were detected using chromatography. The survey revealed that in three Morchella greenhouses, the average Collembola population was 220,333 individuals/m3. The spatial distribution of Collembola was uniform. The collected Collembola specimens were identified as Oligaphorura ursi from the family Onychiuridae. Through the lab and field screening of pesticides, it was found that 40% phoxim EC, 1.8% abamectin EC, 2.5% lambda-cyhalothrin EW, and 4.5% beta-cypermethrin EC had the best efficacy. Meanwhile, residues of these four pesticides were not detected. Mycelial growth inhibition experiments showed that 2.5% lambda-cyhalothrin EW, 1.8% abamectin EC, and 4.5% beta-cypermethrin EC exhibit low inhibition of mycelial growth and can be used as control pesticides for Collembola on Morchella, providing a technical reference for the green pesticide control of Collembola on Morchella in the study region.

1. Introduction

Edible fungi include large-fruiting-body mushrooms that are consumable and rich in protein, various vitamins, and dietary fiber with a low fat content. They have high nutritional and medicinal value [1,2]. With continuous advancements in scientific research, edible mushroom cultivation technology has improved. There are 70–80 species of edible fungi cultivated in China, with cultivation spanning the entire country, and commercial cultivation has been achieved for many varieties [3]. Currently, the edible fungus industry in China is the fifth-largest agricultural sector after vegetables, grains, fruits, and sugar crops. The production capacity of edible fungi continues to increase and plays an important role in improving farmers’ incomes [4].
As one of the four most famous mushrooms in the world, Morchella is widely loved for its delicious taste and high nutritional and economic value [5]. Since the cultivation technology for Morchella matured in 2010, China has entered a period of rapid development in morel mushroom cultivation. As of 2022, the area of morel mushroom cultivation in China had reached 1.67 × 10⁴ hm2 [6]. However, with the rapid development of the edible fungus industry, the occurrence of pests and associated damage has become increasingly severe. Various pests, such as Collembola and mites, damage the mycelia and fruiting bodies of edible fungi, resulting in decreased yields and quality, which severely hinders the further development of the edible fungus industry [7].
Collembplans are an ancient group of arthropods belonging to the subphylum Hexapoda and the class Collembola [8]. Research shows that through the identification and survey of the morphological characteristics of Collembola, the highest number of members from the family Entomobryidae is found in litter and soil layers in the Changbai Mountains, which are located in the southeastern part of Jilin Province, China [9]. In a study on the multi-scale patterns of soil Collembola assemblages in the eastern agricultural regions of China, it was found that the highest number of Collembola individuals occurred in North China, while Northeast China had the highest species diversity of soil Collembola [10]. Research indicates that adult and juvenile Collembola can carry a large number of pathogens and moth larvae, which spread as a result of activities such as oviposition and feeding [11]. When the soil contains abundant crop residues with high sugar content (such as corn stalks, peanut vines, and watermelon vines), Collembola outbreaks are more likely to occur. Collembola species thrive in humid environments and primarily damage edible fungi by inhibiting mycelial growth, burrowing into fruiting bodies to form irregular pits and interconnected tunnels, and acting as vectors for various fungal diseases [12]. Additionally, their small size, cryptic behavior, high mobility, and strong jumping ability make Collembola control particularly challenging [13]. Some insecticides have been reported to be effective against Collembola. Imidacloprid, nitenpyram, and indoxacarb exhibit strong insecticidal activity against Collembola while maintaining high safety for Morchella [14]. Additionally, abamectin demonstrates good residual effectiveness, rapid action, and strong control efficacy against Onychiuridae, Collembola [15]. However, in edible fungus production, fungi absorb nutrients directly from plant-based substrates. The extensive use of pesticides for pest control may lead to pesticide residues within the fungi, with some chemicals persisting over time and being difficult to degrade. This poses a serious concern for pesticide residues in edible fungi, hindering green agricultural development [16,17]. Therefore, analyzing pesticide residues in edible fungi has become a pressing issue in production.
Currently, research on Collembola control in China, as well as pesticide residue analysis of insecticides used against Collembola in Morchella cultivation, remains limited. Therefore, this study comprised a field survey of Collembola infestations at a Morchella cultivation base in Lantian County, Xi’an, Shaanxi Province. It included the species identification of Collembola specimens, screening of various insecticides for indoor and outdoor control trials, and pesticide residue analysis. The findings provide a scientific basis for Collembola management and serve as a reference for ensuring the quality and safety of Morchella.

2. Materials and Methods

2.1. Experimental Materials

Test solution for O. ursi and Morchella: The strain Morchella sextelata, which is a continuous variety planted at the base for many years, was collected from the edible mushroom (Morchella) cultivation base in Lantian County of Xi’an, Shaanxi Province.
Test items included 10% nitenpyram aqueous solutions (final concentration of 0.01%; Shanghai Huliang Biological Pharmaceutical Co., Ltd., Shanghai, China), 4.5% beta-cypermethrin emulsifiable concentrate (final concentration of 0.01%; Shandong Henglida Biotechnology Co., Ltd., Jinan, China), 3.5% lambda-cyhalothrin·emamectin benzoate micro-emulsion (SuKe Chemical Industry Co., Ltd., Shanghai, China), 40% phoxim emulsifiable concentrate (Jining Tongda Chemical Plant., Jining, China), 2.5% lambda-cyhalothrin emulsion in water, 50% thiamethoxam water-dispersible granules (Xianyang Hengtian Biological Agriculture Co., Ltd., Xianyang, China), 8000 IU/mg Bacillus thuringiensis wettable powder (Shangdong Tenov Pesticides Co., Ltd., Linyi, China), 1.8% abamectin emulsifiable concentrate (Handan Ruitian Pesticide Co., Ltd., Handan, China), 150 g/L indoxacarb emulsifiable concentrate (FMC Corporation. Philadelphia, PA, USA), and 0.3% azadirachtin emulsifiable concentrate (Fujibio Technology. Guangzhou, China). All the percentage values for the above pesticides represent %w/v.

2.2. Experimental Methods

2.2.1. Hazard Investigation of O. ursi

Methods of investigation of the soil O. ursi hazard for Morchella: In Lantian County of Xi’an, Shaanxi Province, three greenhouses were selected with 333.5 m2 per site. A five-point sampling method was adopted for each plot, and soil samples of 15 cm × 15 cm × 15 cm were taken using quadrats, with each point repeated three times. Then, 30 cm3 soil samples were collected from each plot, soaked in water, and let stand for 24 h, using the ability of O. ursi to float on the water’s surface to count individuals.

2.2.2. Spatial Distribution Pattern of O. ursi in Soil

Following the method of Zhou (2009) [18], the average density (m) and variance (V) of the collected samples were calculated. The crowding degree (M*) = m + V/m − 1, diffusion coefficient (C) = V/m, aggregation index (I) = V/m − 1, aggregation pattern index M*/m, aggregation index (Ca) = (V − m)/m², and index (K) = m2/ (V − m) in the negative binomial distribution were calculated. The relationship between the aggregation index and spatial distribution is as follows:
When the population is aggregated, C > 1, M*/m > 1, I > 0, Ca > 0, 8 > k > 0;
When the population is uniformly distributed, C < 1, M*/m < 1, I < 0, Ca < 0, k < 0;
If the population is randomly distributed, C = 1, M*/m = 0, I = 0, Ca = 0, 8 < k → ∞ [19].
The spatial pattern of O. ursi was analyzed based on the obtained aggregation index and the relationship described above.

2.2.3. Screening of Insecticides for Control of O. ursi

The test pesticides and the concentrations used are shown in Table 1. The screening method was as follows: the toxicity of 10 insecticides against O. ursi was determined by the mushroom slice dipping method and the film method. The fruiting bodies of Morchella were cut into rectangular samples with side lengths of 1 cm × 1 cm × 0.3 cm and placed into the test solution for 10 s, and then the residual test solution on the surface was removed. At the same time, 3 mL of the same test solution was poured into a Petri dish. The dishes were shaken well to ensure that the test solution was in full contact with the inner wall of the Petri dish, and the remaining test solution was removed. Subsequently, the fruiting bodies of edible fungi treated in the previous step were placed into Petri dishes with 30 O. ursi. Then, the Petri dishes were placed in an artificial climate chamber, and the residual insect mouths in each Petri dish were counted at 1 d, 3 d, 5 d, and 7 d after the test. Each test treatment was repeated three times, with clear water used as a control, and then the rate of population reduction and control correction were calculated [20].
The control efficacy was calculated using the following formulas:
Population reduction rate = [(pre-treatment population—post-treatment population)/pre-treatment population] × 100%.
Field pesticide screening method for O. ursi: Before treatment, soil samples were collected using an equidistant sampling method in the greenhouse, with an interval of 1 m, using 15 cm × 15 cm × 15 cm quadrats, and the number of O. ursi before treatment was counted. After sampling, soil was sprayed using a watering can over an area of approximately 15 m² per row, with 3 replicates set up. The test pesticides and the concentrations used are shown in Table 2.

2.2.4. Effect of Pesticides on Mycelium Growth of Morchella

Morchella was inoculated on PDA medium, placed in an incubator for culture, and set aside after the mycelium was overgrown in a Petri dish. Each pesticide was diluted 20 times with sterile water, and then 10 mL was added to 190 mL of sterilized medium, shaken well, poured it into a pre-sterilized Petri dish, cooled, and solidified. Each treatment was repeated 3 times, adding the same amount of sterile water as a control. Using a hole punch with an inner diameter of 6 mm, bacterial blocks with uniform growth were collected and inoculated in the above medium such that mycelial surface touched the medium, and these samples were incubated at a constant temperature of 25 °C. The effect of the pesticides on the mycelium growth of Morchella was calculated according to the amount of mycelial growth [21].
Mycelium inhibition rate (%) = [(control mycelium growth—treated mycelium growth)/control mycelium growth] × 100.

2.2.5. Detection of Pesticide Residues

Pesticides with lower antifungal activity were selected for pesticide residue testing. For each pesticide, the concentration used in the field trial was applied. In the greenhouse, young and healthy Morchella specimens with similar growth conditions were randomly selected, sprayed evenly with the pesticide, and marked. This process was repeated three times. Seven days after application, the marked Morchella were collected and sent to the Pony Testing International Group in Xi’an, Shaanxi Province, where high-performance liquid chromatography (HPLC) was used to detect pesticide residues [22].

2.3. Data Analysis

All the data were analyzed using Excel 2019 and the DPS Data Processing System 9.05. Duncan’s new compound range method was used with ANOVA to compare the differences in the level of control among different treatments.

3. Results

3.1. Investigation of O. ursi Hazard and Determination of Distribution Type

3.1.1. Investigation of O. ursi Populations in Morchella Cultivation Soil

Table 3 lists the number of O. ursi at the three sampling sites. Since the number of O. ursi presented in Table 2 is the number of O. ursi per 30 cm3 soil, this was scaled to the number of O. ursi per cubic meter at a depth of 15 cm from the soil surface. The average number of O. ursi as a pest at sampling site 1 was about 230,667 heads/m3, that at sampling site 2 was about 193,333 heads/m3, and that at sampling site 3 was about 237,000 heads/m3. The average number of O. ursi at the three sites was about 220,333 head/m3.

3.1.2. Spatial Distribution Pattern of O. ursi in Morchella Cultivation Soil

According to Table 4, a series of indicators reflecting the degree of aggregation were obtained after calculation from the results of the three surveys, all meeting the requirements of C < 1, M*/m < 1, I < 0, Ca < 0, and k < 0. Therefore, it can be concluded that the spatial distribution pattern of O. ursi in the field is uniform.

3.2. Laboratory Screening of Insecticides

The results of the laboratory pesticide screening experiment for O. ursi are shown in Table 5. There were certain differences in the effectiveness of the 10 pesticides in controlling O. ursi, with the control efficacy of each pesticide gradually increasing over time.
One day after pesticide treatment, the rate of O. ursi population reduction in the control group was 6.34%. Overall, 40% phoxim EC had the strongest control effect, reaching 90.37%, whereas the control efficacy of 150 g/L indoxacarb EC was the lowest at only 43.07%, and 3.5% lambda-cyhalothrin·emamectin benzoate ME, 2.5% lambda-cyhalothrin EW, 1.8% abamectin EC, 50% thiamethoxam WDG, 0.3% azadirachtin EC, 10% nitenpyram AS, and 4.5% beta-cypermethrin EC reached more than 50%.
Three days after pesticide treatment, the rate of O. ursi population reduction in the control group was 9.52%. Again, 40% phoxim EC had the strongest control effect, reaching 100%, and the control efficacy of 8000 IU/mg Bacillus thuringiensis WP was the lowest at only 50.17%, while 3.5% lambda-cyhalothrin·emamectin benzoate ME, 2.5% lambda-cyhalothrin EW, 1.8% abamectin EC, 50% thiamethoxam WDG, 0.3% azadirachtin EC, 10% nitenpyram AS, and 4.5% beta-cypermethrin EC reached more than 70%.
Five days after pesticide treatment, the rate of O. ursi population reduction in the control group was 17.80%. The 40% phoxim EC treatment had the strongest control effect, reaching 100%, while the control efficacy of 8000 IU/mg Bacillus thuringiensis WP was the lowest at only 50.85%, and 2.5% lambda-cyhalothrin EW, 1.8% abamectin EC, 0.3% azadirachtin EC, 10% nitenpyram AS, and 4.5% beta-cypermethrin EC reached more than 80%.
Seven days after pesticide treatment, the rate of O. ursi population reduction in the control group was 25.27%. The control efficacy of 1.8% abamectin EC and 40% phoxim EC reached 100%, and the control efficacy of 0.3% azadirachtin EC, 10% nitenpyram AS, and 4.5% beta-cypermethrin EC reached more than 90%.
The data from the lab experiments show that the pesticides used in the test had a certain degree of efficacy in controlling O. ursi, with some differences in efficacy among the various pesticides. Overall, among the tested pesticides, 40% phoxim EC demonstrated the best control, achieving 100% effectiveness on the first day. The 1.8% abamectin EC and 0.3% azadirachtin EC treatments were slightly less effective than the 40% phoxim EC but could also quickly achieve 90% effectiveness. However, the 150 g/L indoxacarb EC and 8000 IU/mg Bacillus thuringiensis WP treatments were relatively less effective.

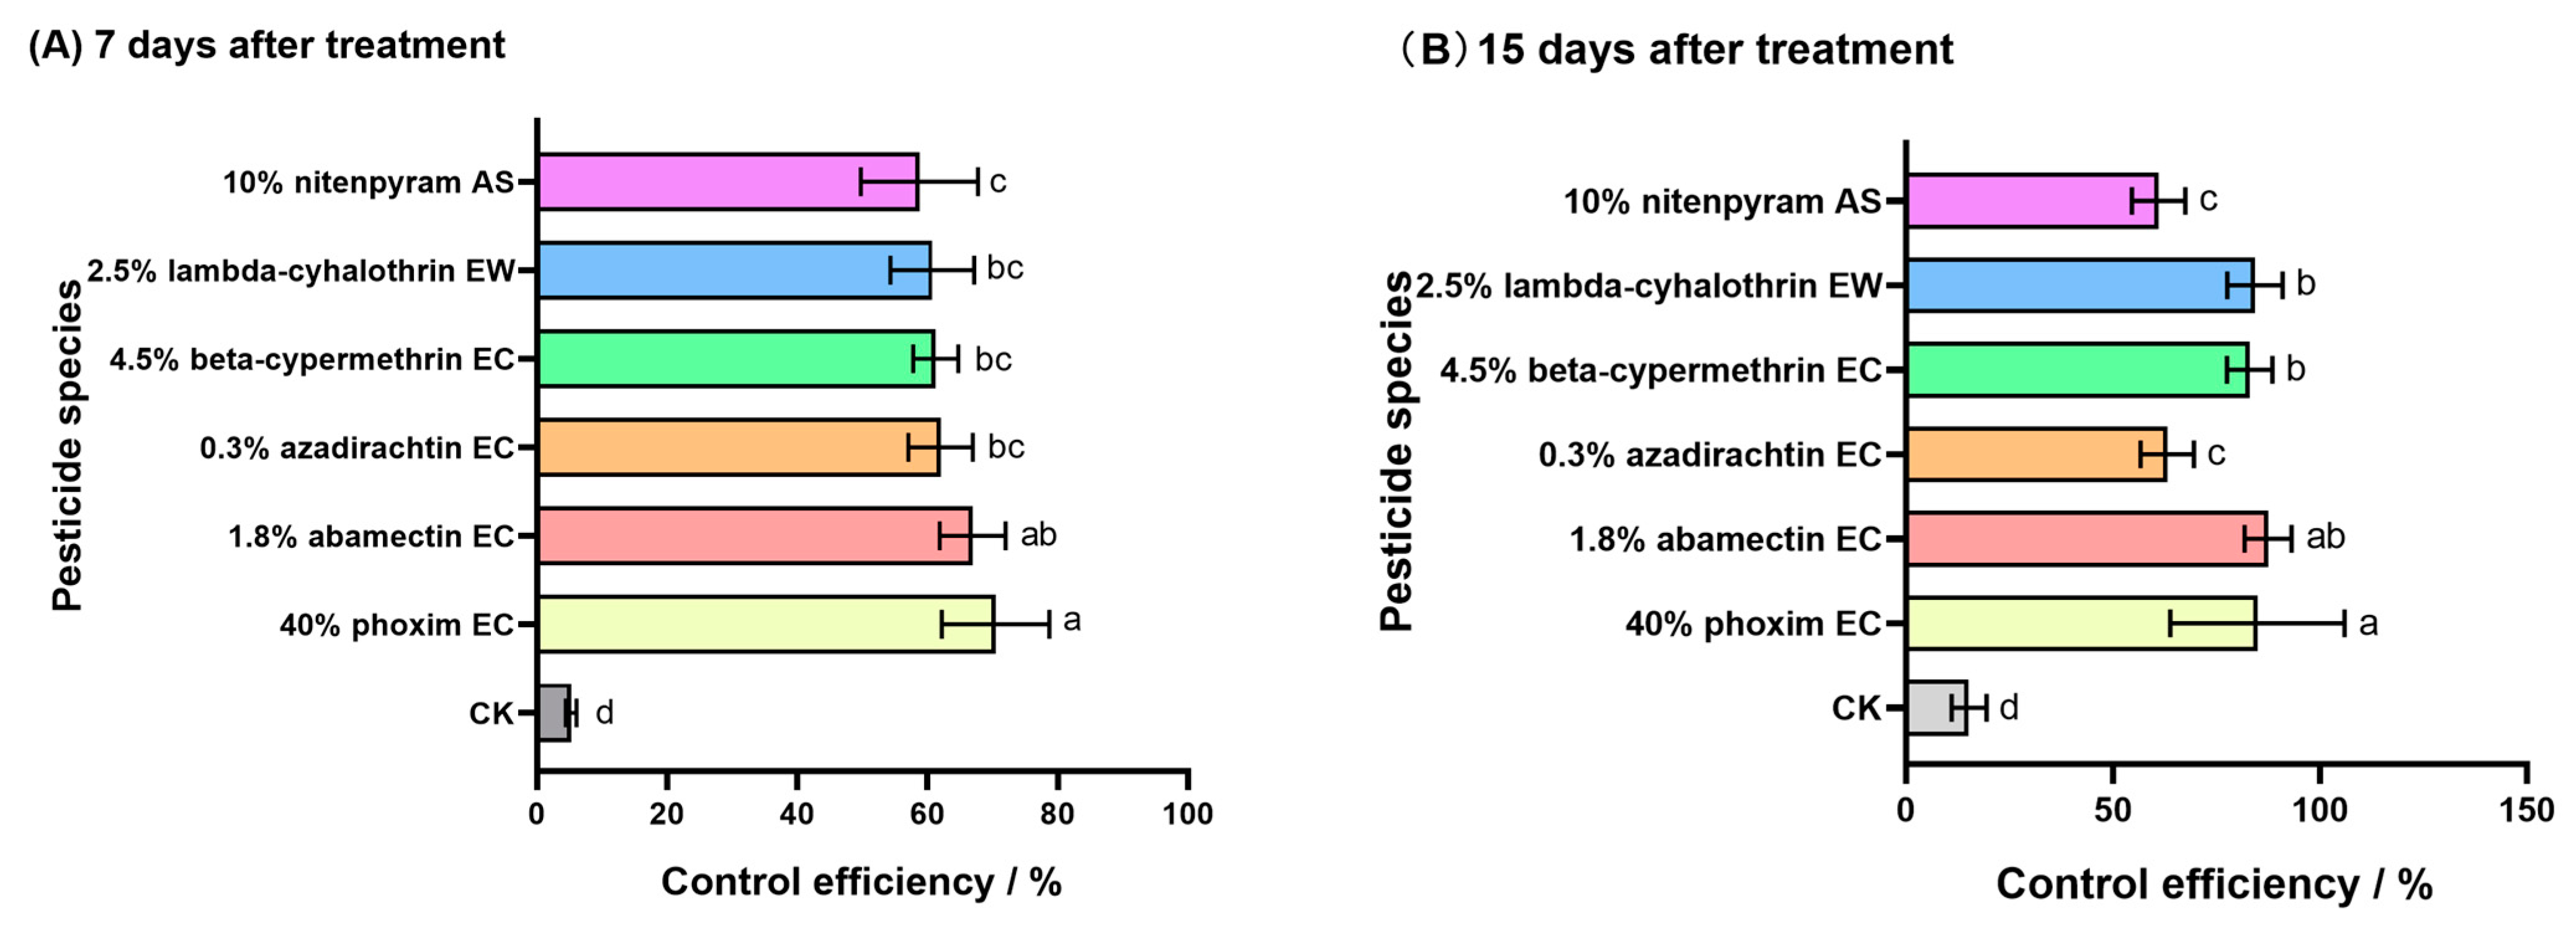
3.3. Screening of Field Insecticides for O. ursi

Based on the lab screening, six pesticides were selected for field testing. The results are shown in Figure 1A. Seven days after pesticide treatment, 40% phoxim EC had the highest control efficacy (70.43%), followed by 1.8% abamectin EC (66.92%). The control efficacies of 0.3% azadirachtin EC, 4.5% beta-cypermethrin EC, and 2.5% lambda-cyhalothrin EW all exceeded 60% (62.01%, 61.23%, and 60.73%, respectively), followed by 10% nitenpyram AS at 58.73%.
Further results are shown in Figure 1B. Fifteen days after pesticide treatment, 40% phoxim EC achieved the highest control efficacy (90.47%), significantly outperforming the other pesticides. The control efficacies of 1.8% abamectin EC, 2.5% lambda-cyhalothrin EW, and 4.5% beta-cypermethrin EC were 87.48%, 84.32%, and 83.03%, respectively. These three pesticides had significantly higher control efficacy than 0.3% azadirachtin EC (63.13%) and 10% nitenpyram AS (70%).

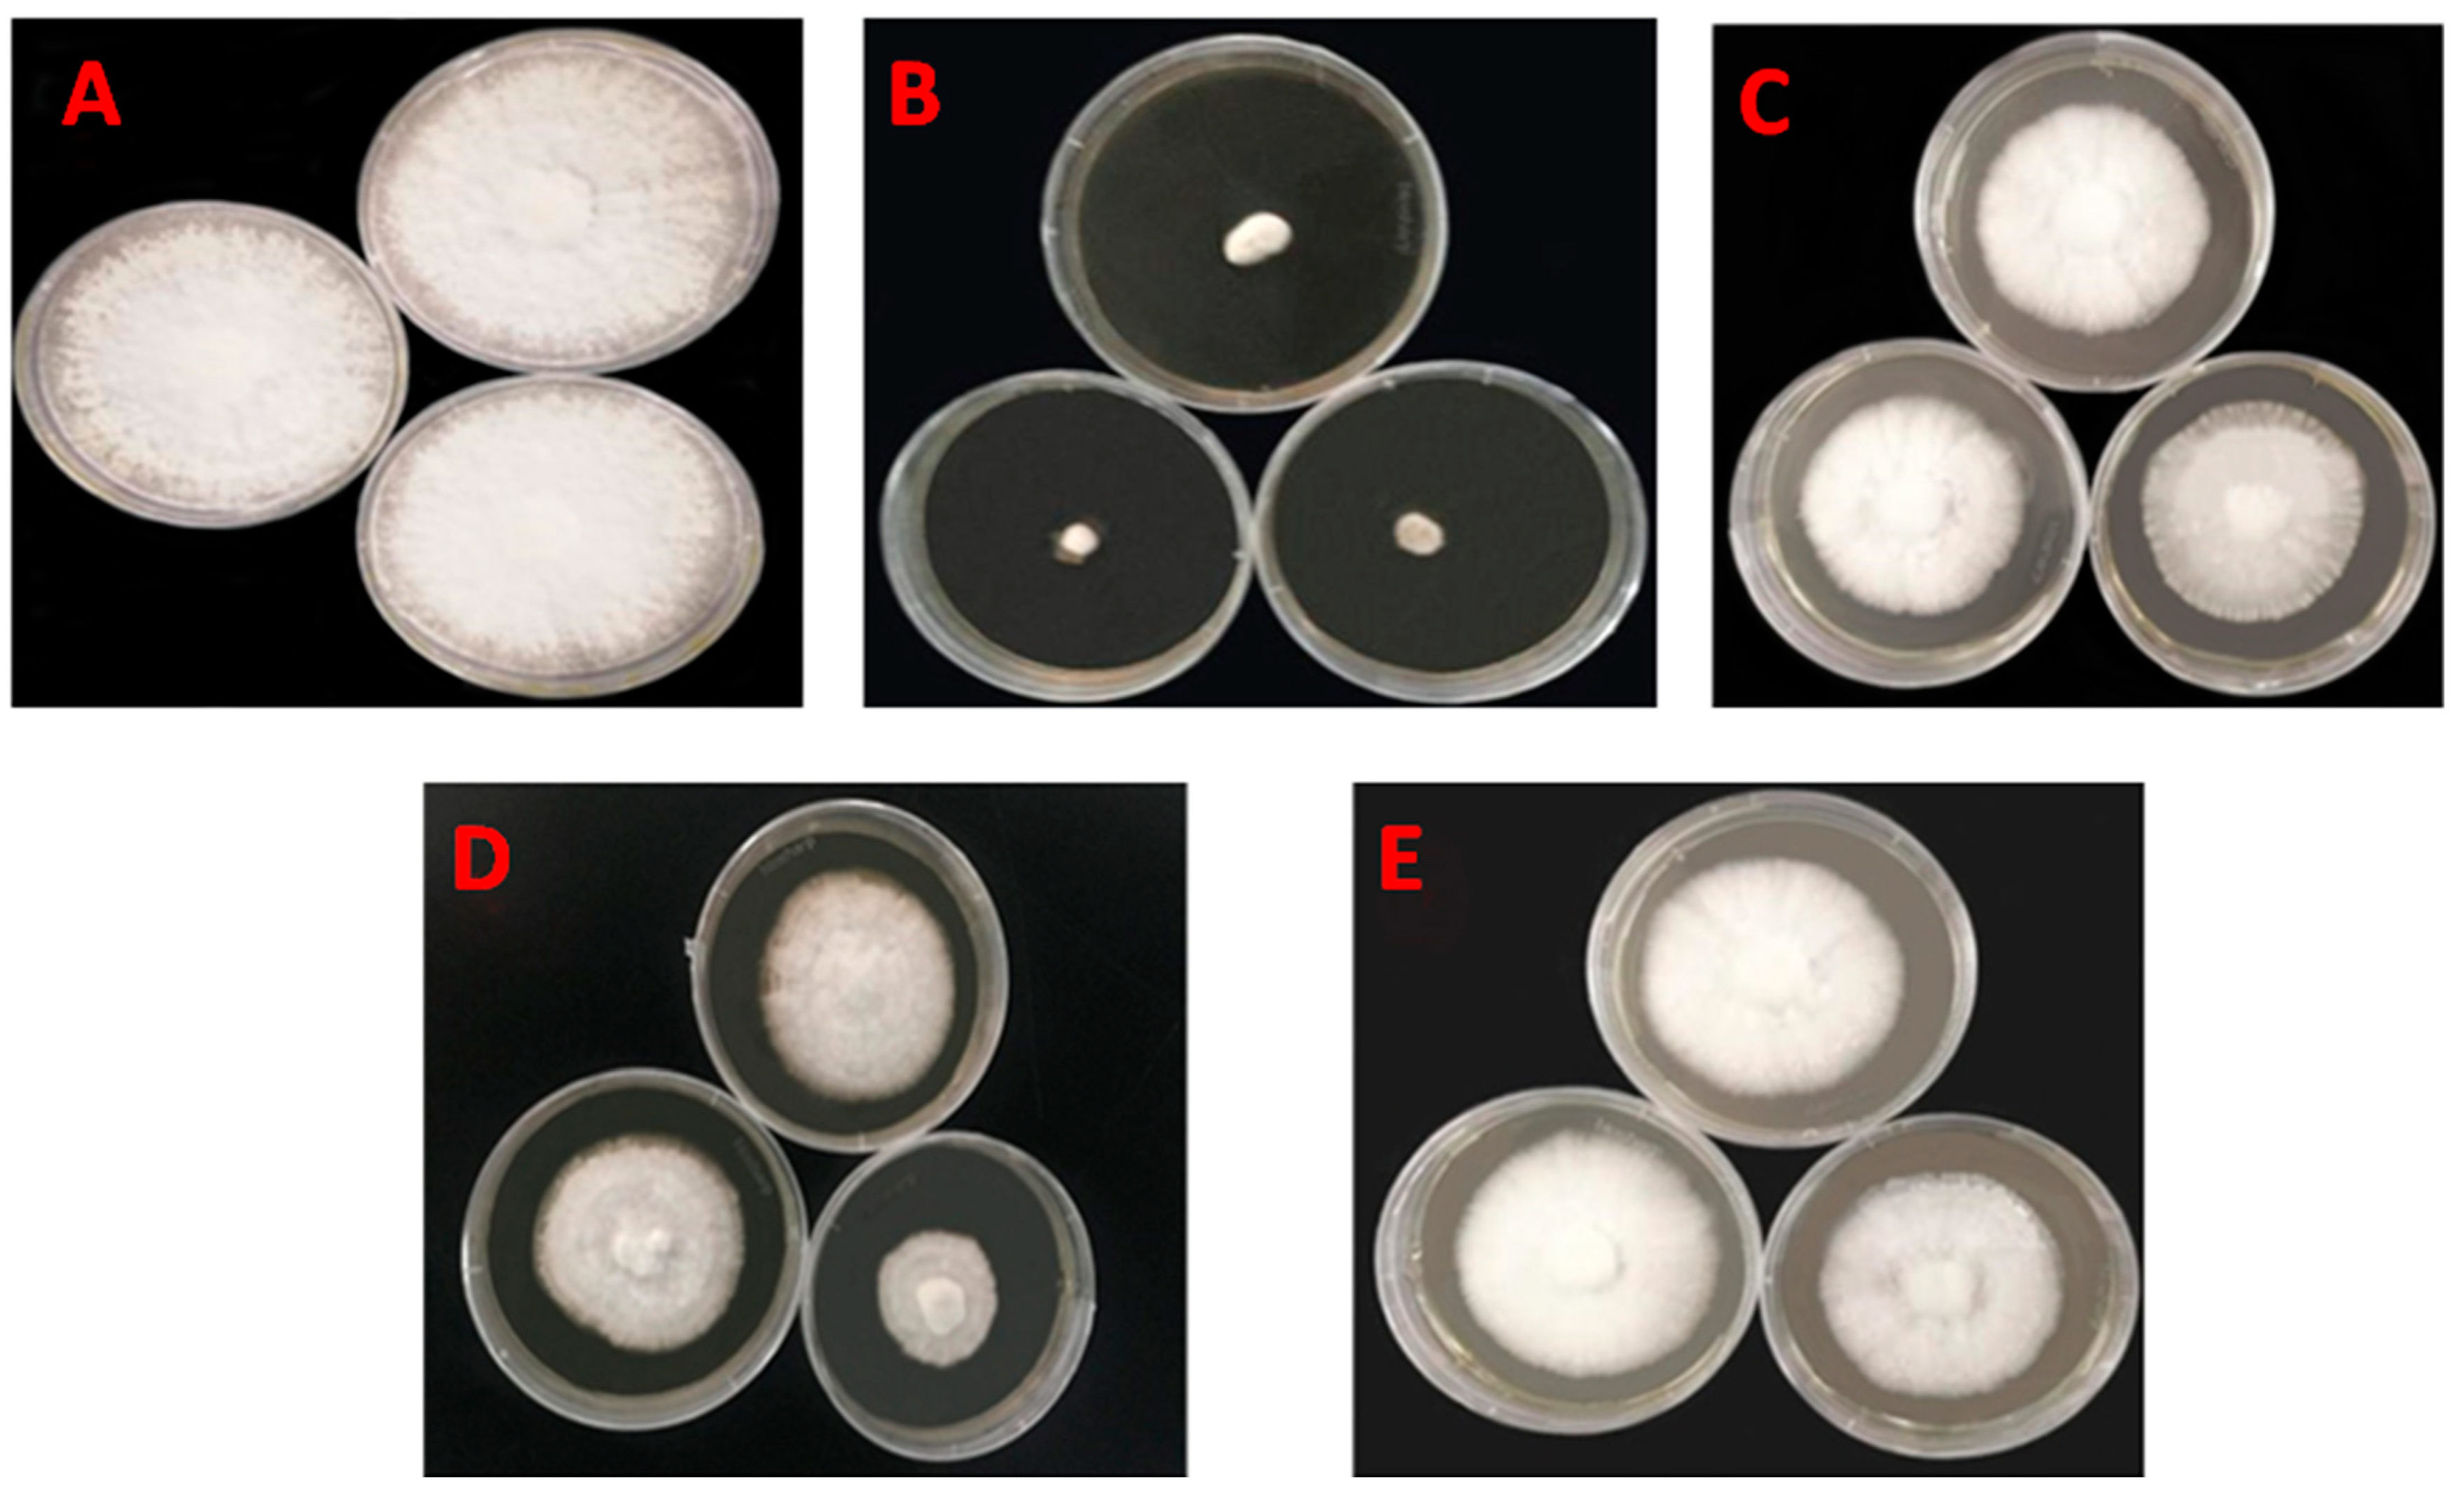
3.4. Effects of Pesticides on Mycelial Growth of Morchella

Based on the laboratory and field screening tests, four highly effective pesticides were selected to analyze their effects on mycelial growth. The results after 9 days of pesticide treatment are shown in Figure 2 and Table 6. The 1.8% abamectin EC exhibited the lowest inhibition rate on mycelial growth at 24.24%. The inhibition rates of 4.5% beta-cypermethrin EC and 2.5% lambda-cyhalothrin EW were 31.29% and 39.24%, respectively, indicating some suppression of mycelial growth. Although 40% phoxim EC had the highest efficacy against O. ursi, it also had the strongest inhibitory effect on mycelial growth (87.10%).

3.5. Pesticide Residue Detection Method

Based on the experimental results, chromatographic methods were used to detect pesticide residues of 1.8% abamectin EC, 4.5% beta-cypermethrin EC, and 2.5% lambda-cyhalothrin EW.
The pesticide residue results (Table 7) were provided by Pony Testing International Group in Xi’an, China. No residues were detected for the three pesticides within their detection limits. Therefore, 1.8% abamectin EC, 4.5% beta-cypermethrin EC, and 2.5% lambda-cyhalothrin EW not only control O. ursi effectively with minimal mycelial growth inhibition but also pose no risk to human health due to pesticide residues.

4. Discussion

There is an increasing demand for higher yield and quality of edible fungi. More attention is being paid to strain selection, nutrient supplementation, and cultivation management. However, during cultivation, edible fungal spores are directly sown into the soil, making it difficult to isolate mycelia and fruiting bodies from small soil-dwelling animals [14,23]. Collembola is a diverse and abundant group of soil arthropods that can damage various edible fungi, including Auricularia auricula, Morchella, and Pleurotus ostreatus [24,25]. According to research, Entomobrya sauteria is a pest in Auricularia cornea cultivation in Sichuan Province [26]. This study revealed that Collembola caused severe damage to edible fungi, with an average Collembola population of 220,333 individuals/m3. The Collembola specimens collected were O. ursi from the family Onychiuridae. Additionally, the study showed that the evenness index of the arthropod community per area remained stable [27]. Research has shown that the distribution of different species of soil Collembola is relatively uniform, which is consistent with the findings of this study, where Collembola exhibited a uniform spatial distribution in the soil [28]. Therefore, there is an urgent need to study the control of Collembola to reduce damage to edible fungi.
It is reported that 1.8% abamectin EC shows good control efficacy against taro Collembola, with a control efficacy of 95.2% after three applications [29]. Another study showed that 4.5% beta-cypermethrin EC exhibited excellent residual efficacy and control against Onychiuridae [27]. In this study, the indoor pesticide screening test showed that all the tested pesticides had a certain degree of control efficacy against Collembola. There were differences in control efficacy between the pesticides. Overall, among the tested pesticides, 40% phoxim EC had the best efficacy, reaching over 90% on day 1, and 1.8% abamectin EC and 0.3% azadirachtin EC had slightly lower efficacies than the former but still achieved over 80% control. However, 150 g/L indoxacarb EC and 8000 IU/mg Bacillus thuringiensis WP performed relatively poorly. The indoor pesticide screening for Collembola showed good results in the first five days, with significant differences in efficacy between the pesticides. The pesticides selected for the next step of field pesticide screening included 10% nitenpyram AS, 1.8% abamectin EC, 0.3% azadirachtin EC, 40% phoxim EC, 2.5% lambda-cyhalothrin EW, 50% thiamethoxam WDG, and 4.5% beta-cypermethrin EC.
In this study, the field pesticide screening trials showed that four pesticides, 40% phoxim EC, 1.8% abamectin EC, 2.5% lambda-cyhalothrin EW, and 4.5% beta-cypermethrin EC, demonstrated good control efficacy against Collembola 15 days after application with control efficacies of 90.47%, 87.48%, 84.32%, and 83.03%, respectively.
Research indicates that insecticides at high concentrations inhibit the growth of the edible mushroom mycelia [30]. At low concentrations, most insecticides promote the growth of mycelia, with the promotion rate increasing as the concentration of the insecticide decreases. After reaching a certain point, the promotion rate decreases as the concentration continues to drop, eventually having no effect on mycelial growth. Recent results showed that 2.5% lambda-cyhalothrin EW had good insecticidal activity against Collembola and a weak inhibitory effect on the mycelial growth of Morchella [14]. Another study showed the different effects of various pesticides on the growth of edible mushroom mycelia [31]. Therefore, the present study evaluated the overall effectiveness of several pesticides and their inhibitory effects on mycelial growth. The lowest mycelial growth inhibition was observed with 1.8% abamectin EC, followed by 4.5% beta-cypermethrin EC and 2.5% lambda-cyhalothrin EW.
In recent years, the edible mushroom industry has developed rapidly, and the prevention of edible mushroom pests and diseases has gradually received more attention [32]. Currently, chemical control remains the primary method for managing Collembola in edible mushrooms. There is an urgent need to conduct pesticide residue research and screen for new, efficient, low-toxicity, and low-residue insecticides for production to ensure safety [33]. Research has shown that the final pesticide residue levels of several pesticides applied via spraying on shiitake mushroom fruiting bodies exceed the MRLs specified by the European Union [34]. Studies that measured the pesticide residue levels of abamectin in edible mushrooms met three requirements for pesticide residue analysis [35]. The present study included pesticide residue detection for 1.8% abamectin EC, 4.5% beta-cypermethrin EC, and 2.5% lambda-cyhalothrin EW. No residues were detected for any of these three pesticides.
O. ursi is one of the major pests in edible mushroom cultivation, and its damaging effects significantly impact the yield and quality of edible mushrooms. In recent years, with the rapid development of the edible mushroom industry, significant progress has been made in O. ursi control. Technologies such as crop rotation, high-temperature substrate sterilization, and clean management of mushroom houses have effectively reduced pest populations. Non-toxic measures, such as sugar–vinegar solutions and color plate traps, have been employed, and chemical control has gradually shifted toward new, efficient, and low-toxicity pesticides. In the future, the control of springtails in edible mushrooms should adhere to the plant protection principle of “prevention-first, integrated control”. In terms of the construction of a control system, it is necessary to establish an early warning system that covers meteorological data, pest monitoring, and substrate testing; develop pest monitoring technology based on image recognition; and enhance the breeding of pest-resistant varieties. The development of second-generation biopesticides should include the enhanced application of RNA interference technology and gene editing in pest-resistant breeding, providing a solid foundation for the sustainable development of the edible mushroom industry.

Author Contributions

X.B.: Formal analysis, Investigation, Writing—original draft, Writing—review & editing. Y.W.: Formal analysis, Investigation, Data curation. M.W.: Investigation. J.Z.: Investigation. L.W.: Investigation. X.W.: Investigation. Y.L.: Conceptualization; Methodology; Writing—review and editing; Funding acquisition. All authors have read and agreed to the published version of the manuscript.

Funding

This study was supported by the National Key Research and Development Program of China (2021YFD1600401) and Agricultural Science and Technology Innovation Program of Shaanxi Province (NYKJ-2022-YL(XN)07).

Data Availability Statement

The original data of this study can be obtained from the corresponding author upon reasonable request.

Conflicts of Interest

The authors declare that they have no conflicts of interest with the contents of this article.

References

  1. Kong, L.; Zhang, L.; Hu, W.H.; Zhu, L.Y.; Wang, H.L.; Li, Y.J.; Jia, Y.S. The Chinese edible fungi industry-current status and future predictions. Acta Edulis Fungi 2016, 23, 104–109. [Google Scholar] [CrossRef]
  2. Zipora, T.; Segula, M. True morels (Morchella)-nutritional and phytochemical composition, health benefits and flavor: A review. Crit. Rev. Food Sci. 2017, 58, 1888–1901. [Google Scholar] [CrossRef]
  3. Zhang, J.X.; Chen, Q.; Huang, C.Y.; Gao, W.; Qu, J.B. The development history, present situation and trend of edible mushroom industry. Fungi 2015, 34, 524–540. [Google Scholar] [CrossRef]
  4. Zhang, Y.M.; Li, X.B.; E, H.C.; Zhou, C.Y.; Zhao, X.Y. Status of Chinese edible fungi trade and comparative analysis of standards of edible fungi pesticide residue limits at home and abroad. China Agric. Univ. 2022, 27, 145–163. [Google Scholar] [CrossRef]
  5. Qiao, T.; Li, J.Z.; Dai, L. Research progress on classification and identification methods and artificial cultivation technology of morel mushrooms. Edible Fungi China 2022, 41, 6–11. [Google Scholar] [CrossRef]
  6. Tang, J.; Wang, Y.; Xu, Y.Y.; Tan, H.; He, X.L.; Yu, Y.; Chen, Y.; Peng, W.H. Research Progress on key issues of Morchella Industry Development. Fungus Res. 2021, 19, 217–231. [Google Scholar] [CrossRef]
  7. Wang, G.Z.; Ma, C.J.; Zhou, S.; Põldmaa, K.; Tamm, H.; Luo, Y.; Guo, M.P.; Ma, X.L.; Bian, Y.B.; Zhou, Y. First Report of Cobweb Disease of Auricularia polytricha Caused by Cladobotryum cubitense in Xuzhou, China. Plant Dis. 2018, 102, 1452. [Google Scholar] [CrossRef]
  8. Jia, S.B.; Li, Z.H.; Zhang, Y.P.; Zhao, Y.; Yue, L.R. The catalogue search of the new taxonomic system of jumpers. J. Liaocheng Univ. 2010, 23, 38–41. [Google Scholar] [CrossRef]
  9. Xie, Z.J. Biodiversity Pattern of Equinoctial Jumping and Its Community Construction Mechanism in the Vertical Natural Zone of Changbai Mountain; University of Chinese Academy of Sciences (Northeast Institute of Geography and Agroecology, Chinese Academy of Sciences): Jilin, China, 2022. [Google Scholar] [CrossRef]
  10. Chen, T. Soil Springtail Community Diversity and Its Patterns in Eastern China Agricultural Areas; Harbin Normal University: Harbin, China, 2022. [Google Scholar] [CrossRef]
  11. Liu, W.; Cai, Y.; He, P.; Ma, X.; Bian, Y. Occurrence Patterns and Control Measures of Pests and Diseases in Morel Cultivation. J. Edible Fungi 2019, 26, 3–5+128–134. [Google Scholar] [CrossRef]
  12. Zhu, F.C. Occurrence rule and comprehensive control technology of edible fungus springtail pests. Edible Fungi 2017, 39, 71–72. [Google Scholar] [CrossRef]
  13. Dong, X.Y.; Jing, J.G. Screening test of peanut underground pest pesticides. Bull. Agric. Sci. Tech. 2021, 173–175. [Google Scholar] [CrossRef]
  14. Lin, J.S.; Luo, X.; Qu, S.X.; Jiang, N.; Hou, L.J.; Li, H.P.; Ma, L. Identification of springtail pests on Morchella and insecticides selection. Plant Prot. 2020, 46, 174–180. [Google Scholar] [CrossRef]
  15. Liu, Q.; Dong, J.C.; Cheng, W.Z.; Bai, R.X.; Shen, K.; Jiang, Z.L. Field control efficacies of eight pesticides to Tetranychus cinnabarinus and Hypogastrura communis on Bletilla striata. Plant Protect. 2020, 46, 276–280+286. [Google Scholar] [CrossRef]
  16. Yang, H.; Zhao, Z.H.; Wang, R.X.; Dong, M.F.; Song, W.G. Safety and risk assessment of pesticide residues in edible fungi. Acta Edulis Fungi 2011, 18, 105–110. [Google Scholar] [CrossRef]
  17. Liu, H. Study on Cultivation Techniques of Three Edible Fungi in Guizhou. Master’s Thesis, Guizhou University, Guiyang, China, 2021. [Google Scholar] [CrossRef]
  18. Zhou, H.B.; Chen, L.; Chen, J.L.; Cheng, D.F.; Liu, Y.; Sun, J.R. Effect of intercropping between wheat and pea on spatial distribution of Sitobion avenae based on GIS. Sci. Agric. Sin. 2009, 42, 3904–3913. [Google Scholar] [CrossRef]
  19. Wang, W.; Zhang, R.F.; Liu, H.Y.; Zhang, Y.; Yao, J. Spatial distribution pattern of common meadow bug Lygus pratensis (Linnaeus) in Xinjiang cotton fields. Plant Prot. 2016, 43, 972–978. [Google Scholar] [CrossRef]
  20. Yan, H.J.; Liu, X.J. Advances in ecotoxicology of pesticides on soil springtail pests. Jiangsu Agric. Sci. 2012, 40, 6–9+92. [Google Scholar] [CrossRef]
  21. Li, Y.P.; Sun, L.J.; Liu, Y.J.; Hu, Y.; Wu, J.X. Effects of eight insecticides on Scatopse sp. and their residue analysis in edible fungi. Plant Prot. 2009, 36, 261–267. [Google Scholar] [CrossRef]
  22. Zhao, H.Y.; Luo, L.; Zhang, Q. Research on pesticide multi-residue detection methods in vegetables and fruits. J. Food Saf. Qual. 2019, 10, 6343–6348. [Google Scholar] [CrossRef]
  23. LI, M.T.; Wang, N.; MAYLA Turdibek. Research progress on morel mushroom cultivation and selenium-rich control technology. Jiangsu Agric. Sci. 2021, 49, 20–27. [Google Scholar] [CrossRef]
  24. Ji, J.; Chen, X.; Lin, J.Z.; Zhang, Y.X. Functional responses of two predatory mites to Hypogastrura communis (Collembola: Hypogastruridae). Acta Edulis Fungi 2009, 16, 72–74. [Google Scholar] [CrossRef]
  25. Feng, X.J. Toxic Effects and Thresholds of Polycyclic Aromatic Hydrocarbons (PAHs) in Different Soils on the Folsomia candida; Nanjing University of Information Science & Technology: Nanjing, China, 2023. [Google Scholar] [CrossRef]
  26. Wu, M.X.; Wu, J.; Yang, Y. Study on the Diseases and Pests in Auricularia polytricha and their Control Techniques in Yuping County. Plant Dr. 2014, 27, 53–54. [Google Scholar] [CrossRef]
  27. Li, H.H. Composition of Arthropod Communities in Bletilla striata (Thunb.) with the Occurrence Pattern of Major Pests and Screening of Control Pesticides; Xinjiang Agricultural University: Xinjiang, China, 2024. [Google Scholar] [CrossRef]
  28. Liu, D.D. The Community Patterns of soil Oribatida and Collembola in the Vertical Zone of Changbai Mountain Vegetation; Northeast Forestry University: Harbin, China, 2024. [Google Scholar] [CrossRef]
  29. Wang, J.K.; Liang, J.; Xie, J.Y.; Fang, L.; Wang, H.R.; Wang, L.P. Control efficiency and application methods of four pesticides for taro rotten skin. Zhejiang Agric. Sci. 2021, 62, 978–980. [Google Scholar] [CrossRef]
  30. Hong, B. Toxicity Assessment of 19 Pesticides on Aino Verticillium and Their Effect on Edible Fungi Mycelial Growth; Guizhou University: Guiyang, China, 2023. [Google Scholar] [CrossRef]
  31. Zhao, X.N.; Luo, J.; Wu, M.X. Effect of imidacloprid on the prevention of mushroom phoridae and on the growth of edible mushroom mycelium. Edible Fungi China 2011, 30, 54–56. [Google Scholar] [CrossRef]
  32. Fan, Y.W. Study on Biochar-Blended Cultivation Substrate for Edible Fungus. Master’s Thesis, Shandong Agricultural University, Taian, China, 2021. [Google Scholar] [CrossRef]
  33. Song, W.G.; Yang, H.; Wang, W.M.; Qu, M.Q.; Zhang, X. Residue detection and safety of imidacloprid in edible fungi. Acta Edulis Fungi 2012, 19, 86–90. [Google Scholar] [CrossRef]
  34. Wu, Y.C.; Qi, C.Y.; Zhao, H.Q. Determination of 56 pesticide residues in shiitake mushrooms by QuEChERS-ultra performance liquid chromatography-tandem mass spectrometry. J. Pestic. Sci. 2018, 20, 58–66. [Google Scholar] [CrossRef]
  35. Shang, X.B.; Han, X.L.; Zhang, J.H. Investigation of edible mushroom pests and diseases and monitoring of pesticide residues in Guangdong Province. Hunan Agric. Sci. 2013, 28–29+35. [Google Scholar] [CrossRef]
Figure 1. Field control effect of six insecticides on O. ursi. (A): Seven days after pesticide treatment. (B): Fifteen days after pesticide treatment. Note: CK refers to a blank control. Different lowercase letters above bars indicate significant differences (p < 0.05, Tukey’s test).
Horticulturae 11 00471 g001
Figure 2. Photos of inhibition tests in the laboratory. Inhibition test of mycelial growth after 9 days of pesticide treatment. CK refers to the blank control. (A) CK; (B) 40% phoxim EC; (C) 4.5% beta-cypermethrin EC; (D) 2.5% lambda-cyhalothrin EW; (E) 1.8% abamectin EC.
Horticulturae 11 00471 g002
Table 1. Laboratory Pesticides and concentrations.
PesticideDilution
10% nitenpyram AS1000
4.5% beta-cypermethrin EC1600
3.5% lambda-cyhalothrin·emamectin benzoate ME3000
40% phoxim EC800
2.5% lambda-cyhalothrin EW600
8000 IU/mg Bacillus thuringiensis WP266
1.8% abamectin EC1600
50% thiamethoxam WDG4000
150 g/L indoxacarb EC4000
0.3% azadirachtin EC600
Table 2. Field Pesticides and concentrations.
PesticideDilution
10% nitenpyram AS500
2.5% lambda-cyhalothrin EW500
4.5% beta-cypermethrin EC800
0.3% azadirachtin EC300
1.8% abamectin EC800
40% phoxim EC400
CK
Table 3. Number of O. ursi in the soil of greenhouses 1–3 (heads).
QuadratNumber of CollembolaTotal Quantity
Site No. 1Site No. 2Site No. 3
17.60 ± 2.73 a5.60 ± 1.54 a9.20 ± 2.66 a5.42 ± 0.61 a
24.00 ± 1.52 a10.60 ± 2.01 a7.60 ± 1.81 ab5.93 ± 0.59 a
34.20 ±1.46 a5.20 ± 1.74 a2.60 ± 0.93 ab7.49 ± 0.75 a
49.00 ± 2.85 a8.80 ± 2.42 a5.60 ± 1.36 ab6.04 ± 0.66 a
59.00 ± 1.97 a6.60 ± 2.20 a6.80 ± 2.04 ab7.09 ± 0.71 a
610.00 ± 2.43 a7.40 ± 1.57 a5.60 ± 2.01 ab7.67 ± 0.69 a
710.00 ± 2.56 a8.60 ± 2.16 a5.40 ± 0.75 ab6.36 ± 0.73 a
89.00 ± 2.00 a4.40 ± 2.56 a6.20 ± 2.22 ab5.80 ± 0.61 a
93.40 ± 1.54 a4.20 ± 1.36 a6.00 ± 1.48 b7.67 ± 0.77 a
Note: Data are shown as mean ± standard error; different lowercase letters in the same column indicate significant differences at the p < 0.05 level by Duncan’s new multiple range test.
Table 4. Index of aggregation for O. ursi in soil samples.
QuadratMean
Density
VarianceMean
Crowding
Clumping
Index
Patchiness
Index
Aggregation IndexNegative Binomial DistributionDiffusion
Coefficient
Distribution
Pattern
10.2310.023−0.330−0.030−1.429−3.898−0.2570.100uniform
20.1930.018−0.261−0.022−1.352−4.698−0.2130.093uniform
30.2370.029−0.349−0.038−1.473−3.703−0.2700.122uniform
Table 5. Results of 10 pesticides tested in O. ursi control experiments in the laboratory.
Pesticides1 d After Treatment3 d After Treatment5 d After Treatment7 d After Treatment
Decrease RateControl EfficacyDecrease RateControl EfficacyDecrease RateControl EfficacyDecrease RateControl Efficacy
10% nitenpyram AS75.53 ± 1.31 c73.87 ± 1.40 c84.93 ± 1.46 c83.34 ± 1.62 cd89.26 ± 1.24 bc86.94 ± 1.51 bc96.82 ± 0.83 a95.74 ± 1.12 b
4.5% beta-cypermethrin EC73.6 ± 1.77 c71.86 ± 1.86 c83.70 ± 2.04 c81.99 ± 2.25 d87.72 ± 1.50 c85.06 ± 1.83 c93.13 ± 0.94 b90.81 ± 1.26 c
3.5% lambda-cyhalothrin·emamectin benzoate ME67.02 ± 1.66 d64.79 ± 1.77 d73.99 ± 1.99 e71.25 ± 2.20 f80.99 ± 1.36 d78.22 ± 2.27 de89.92 ± 1.41 bc87.40 ± 2.64 d
40% phoxim EC90.98 ± 1.64 a90.37 ± 1.75 a100 ± 0.00 a100 ± 0.00 a100 ± 0.00 a100 ± 0.00 a100 ± 0.00 a100 ± 0.00 a
2.5% lambda-cyhalothrin EW72.78 ± 1.10 c70.94 ± 1.18 c79.20 ± 1.39 d77.01 ± 1.54 e85.36 ± 1.36 c82.19 ± 1.64 cd92.45 ± 0.75 bc89.90 ± 1.00 c
8000 IU/mg Bacillus thuringiensis WP48.90 ± 1.29 e45.44 ± 1.38 e54.92 ± 1.43 f50.17 ± 1.58 g59.60 ± 1.55 f50.85 ± 1.89 g71.97 ± 1.40 e62.50 ± 1.87 f
1.8% abamectin EC85.56 ± 0.82 b84.59 ± 0.87 b94.88 ± 1.37 b94.34 ± 1.51 b97.62 ± 1.37 a97.47 ± 1.30 a1000.00 a100 ± 0.00 a
50% thiamethoxam WDG66.17 ± 1.12 d62.88 ± 1.19 d73.53 ± 1.11 e70.75 ± 1.23 f80.87 ± 1.29 d76.73 ± 1.57 e89.61 ± 1.19 c86.10 ± 1.59 d
150 g/L indoxacarb EC46.68 ± 1.53 e43.07 ± 1.63 e56.84 ± 1.45 f52.30 ± 1.61 g69.70 ± 1.32 e63.14 ± 1.60 f80.14 ± 1.71 d73.42 ± 2.29 e
0.3% azadirachtin EC85.15 ± 1.80 b84.55 ± 1.60 b87.56 ± 1.55 c87.22 ± 1.26 c92.27 ± 0.89 b90.60 ± 1.09 b97.03 ± 0.88 a96.03 ± 1.17 b
CK6.349.5217.8025.27
Note: CK refers to the blank control. Data are shown as mean ± standard error; different lowercase letters in the same column indicate significant differences at the p < 0.05 level by Duncan’s new multiple range test.
Table 6. Results of hyphal inhibition experiments.
PesticidesDilution Hyphal Diameter (cm)Average ValueInhibition Rate
123
40% phoxim EC16001.001.221.171.1387.10% a
4.5% beta-cypermethrin EC32006.056.125.906.0231.29% bc
2.5% lambda-cyhalothrin EW12006.105.874.005.3239.24% b
1.8% abamectin EC32006.726.546.676.6424.24% c
CK-8.908.578.848.77-
Note: CK refers to the blank control. Values are averages (n = 3), measured by the criss-cross method. Different lowercase letters in the same column indicate significant differences at the p < 0.05 level by Duncan’s new multiple range test.
Table 7. Pesticide residue in the fruiting bodies 7 days after treatment.
Sample Description and NumberTest ItemsTest ResultsTest Methods
J0074057F1beta-cypermethrinnot detected (detection limit 0.01)GB 23200.113-2018
J0088927F1lambda-cyhalothrinnot detected (detection limit 0.0005)GB/T 20769-2008
J0088927F1azadirachtinnot detected (detection limit 0.007)NY/T 1379-2007
Disclaimer/Publisher’s Note: The statements, opinions and data contained in all publications are solely those of the individual author(s) and contributor(s) and not of MDPI and/or the editor(s). MDPI and/or the editor(s) disclaim responsibility for any injury to people or property resulting from any ideas, methods, instructions or products referred to in the content.

