Abstract
Seed germination and early seedling growth are the plant growth stages most sensitive to salt stress. Thus, the availability of poor-quality brackish water can be a big limiting factor for the nursery vegetable industry. The exogenous supplementation of gibberellic acid (GA3) may promote growth and vigor and counterbalance salt stress in mature plants. This study aimed to test exogenous supplementation through foliar spray of 10−5 M GA3 for increasing salt tolerance of tomato and sweet pepper seedlings irrigated with increasing salinity (0, 25, and 50 mM NaCl during nursery growth. Tomato and sweet pepper seedlings suffered negative effects of salinity on plant height, biomass, shoot/root ratio, leaf number, leaf area, relative water content, and stomatal conductance. The foliar application of GA3 had a growth-promoting effect on the unstressed tomato and pepper seedlings and was successful in increasing salinity tolerance of tomato seedlings up to 25 mM NaCl and up to 50 mM NaCl in sweet pepper seedlings. This treatment could represent a sustainable strategy to use saline water in vegetable nurseries limiting its negative effect on seedling quality and production time.
1. Introduction
Greenhouse production of container-grown transplants has become a typical practice for vegetable crops in many vegetable production areas of the world [1]. Some of the advantages of using transplants are the possibility of anticipating planting, thus reducing field occupation time, the production of seedlings with higher and more consistent quality, the control of plant spacing in the field [2], the reduction of cost against direct seeding when using hybrid seeds or grafted plants, and concentration of crop maturity [2,3,4]. The main goal of transplant production is to produce in a short time strong, vigorous, and compact seedlings that establish and grow fast when transplanted in the field so that they can reach high yield and quality [5]. Containerized vegetable transplant production is an extremely intensive agricultural practice as seedlings need to be watered and fertilized frequently, even daily, due to the limited volume of substrate explored by the young roots that can retain only small amounts of water and nutrients. Water availability and quality can be limiting factors for the nursery vegetable industry. Vegetable growers are facing more and more frequently the availability of poor quality water due to high salt content. This is an increasingly important problem worldwide as it could limit the growth of sensitive plants such as young vegetable seedlings and result in reductions of crop yield. Many Mediterranean regions are characterized by high salinity groundwater due to the intensive draw of irrigation water that increases seawater infiltration [6]. The use of this water for growing vegetable transplants can adversely affect the growth and vigor of vegetable seedlings. The plant growth stages most sensitive to salt stress are generally seed germination and early seedling growth because plant sensitivity to salt stress usually decreases with plant ontogeny [7].
It is known that salinity activates stress response mechanisms which control the osmotic and ionic re-equilibrium, the detoxification of reactive oxygen species, and the modulation of cell growth or cell division [8]. These mechanisms may be mainly mediated by plant hormones as shown by the modifications of the endogenous phytohormone concentration recorded during seed germination and plant growth under salt stress [9]. Thus, the adverse effects of salinity could be mitigated by the exogenous application of plant growth regulators (PGR) such as auxins, gibberellins (GAs), or cytokinins [10,11,12,13]. Gibberellins are phytohormones produced by plants and fungi that act at different levels in plant metabolism ending in the modification of plant physiology and morphology. Exogenous supplementation with gibberellic acid (GA3) promoted seedling and plant growth, improved post-harvest life and enhanced tolerance to abiotic stress (e.g., drought, heat, salinity) of many crops [13,14,15,16,17,18,19,20,21,22]. Therefore, the object of this study was to evaluate the exogenous supplementation through foliar sprays of 10−5 M GA3 to increase salt tolerance of tomato and sweet pepper seedlings during nursery growth.
2. Materials and Methods
2.1. Plant Materials and Transplant Production
The effects of salt stress and gibberellic acid (GA3) treatment on transplant production were evaluated in a nursery trial carried out during autumn 2018 in a greenhouse situated at the Department of Agricultural, Food, and Forest Sciences (SAAF—University of Palermo, Palermo, Italy) (38°6′28″ N 13°21′3″ E; altitude 49 m above sea level).
Seeds of Solanum lycopersicum ‘Marmande’ (Vilmorin, La Ménitré, France) and Capsicum annuum ‘Dolce di Spagna’ were sown into 12 polystyrene trays (104 cells each) for each species filled with a commercial substrate (SER CA-V7 Special semine, Vigorplant Italia srl, Fombio, Italy, containing 800 g m−3 of a mineral fertilizer NPK 12-11-18). After sowing (1 October 2018), the trays were kept in a dark room at a temperature ranging from 22 °C to 24 °C until the first emergence was observed and were then moved onto benches in the greenhouse for seedling growth. Plantlet emergence occurred 5 and 14 days after sowing for tomato and pepper, respectively. Three days after emergence, the plantlets were thinned to one per cell. When the plantlets had fully expanded cotyledons and the first true leaf (11th BBCH growth stage [23]) (5 and 11 days after emergence for tomato and pepper, respectively), half trays were treated by spraying plantlets with 10−5 M GA3 (Gibrelex, Biolchim, Bologna, Italy). The gibberellic acid concentration was chosen according to previous experiments based on the effects of GA3 levels on tomato plants [8,14,18,22,24,25].
Salt treatments started at the same growth stage for tomato and pepper (11th BBCH growth stage [23]) and were applied with an ebb and flow sub-irrigation system using water with one of three concentrations of NaCl: 0 mM (Electrical conductivity—EC 0.68 mS cm−1), 25 mM (EC 3.14 mS cm−1) or 50 mM (EC 5.57 mS cm−1). Seedlings were sub-irrigated according to their need until they were ready for transplanting (twice a week on average).
Leaf stomatal conductance was measured one week before seedlings were ready for transplanting (17 and 25 days after emergence for tomato and pepper, respectively) using a diffusion porometer (AP4, Delta-T Devices Ltd., Cambridge, UK) on two young unshaded leaves of 20 seedlings for each species and each replicate.
The seedlings were considered ready for transplanting when they reached the 14–15th BBCH growth stage [23] (29 and 46 days from sowing for tomato and pepper, respectively). At this stage, four replicated samples of 30 seedlings for each species and each treatment were randomly selected and analyzed to evaluate their morphological characteristics (seedling height, stem diameter, and leaf number). Leaf color of each seedling was measured on the upper part of 2 randomly selected leaves, using a colorimeter (CR-400, Minolta corporation, Ltd., Osaka, Japan) that measured L* (lightness), a* (positive values for reddish colors and negative values for greenish colors) and b* (positive values for yellowish colors and negative values for bluish colors). These components were used to calculate Hue angle (h°) and Chroma (C*) as h° = 180° + arctan(b*/a*) [26] and C* = (a*2 + b*2)1/2. Then, the seedlings were separated into leaves, stem, and roots, weighed, and dried to a constant weight at 85 °C to determine the fresh and dry biomass and the shoot/root ratio for both fresh and dry weight. Before drying, the leaves were scanned at 350 dpi (Epson Perfection 4180 Photo, Seiko Epson Corp., Suwa, Japan) to obtain digital images that were analyzed with the ImageJ 1.52a software (National Institutes Health, Bethesda, MD, USA) to measure the leaf area. The specific leaf area (SLA cm2 g−1 DW) was estimated as the leaf area/leaf dry weight.
To evaluate the water status at the end of seedling growth the relative water content (RWC) was determined for each species and each treatment. Ten leaves for each replicate were weighed immediately (FW) after sampling the seedlings, placed in distilled water for 4 h and then their turgid weight (TW) was calculated. The turgid leaves were dried in an oven at 80 °C for 24 h and weighed to obtain their dry weight (DW). Relative water content was calculated as RWC = (FW − DW)/(TW − DW) × 100.
2.2. Statistics and Principal Component Analysis
The experimental design consisted of four replicated samples of 30 seedlings each for every combination of GA3 treatment and NaCl level, randomly assigned in four blocks. A two-way ANOVA was performed to evaluate the effects of GA3 treatments and NaCl levels on tomato and pepper seedlings. The mean values were compared by the least significant differences (LSD) test at p ≤ 0.05 to identify the significant differences among treatments and the significant interactions between factors.
A principal component analysis on morphophysiological parameters of tomato and pepper seedlings was performed (SPSS version 13.0; SPSS Inc., Chicago, IL, USA) to investigate the main parameters that were most efficient in differentiating between NaCl levels and GA3 treatments. The input matrix for the analysis consisted of the seedlings morphophysiological parameters (height, stem diameter, total, shoot and root fresh and dry weight, shoot/root ratio of fresh and dry weights, dry matter percentage, leaf number, total leaf area, SLA, stomatal conductance, RWC, L*, chroma, and hue angle). The number of principal components (PCs) was calculated by retaining only the factors with eigenvalues higher than 1.0. The correlations between the variables of the input data set were studied through the plot of the PCs. Furthermore, the initial variables were projected into the subspace defined by the first and second PCs, and correlated variables were determined.
3. Results
During the experiment, the average temperature outside the greenhouse ranged between 10.1 ± 0.3 °C (night) and 31.4 ± 0.6 °C (day), and the average net solar radiation at noon was 449 W·m−2, with a day length that ranged between 8 and 9 h. Inside the greenhouse, the air temperature was on average 23.5 ± 0.4 °C and ranged between 36.8 (day) and 11.9 °C (night) (Figure 1), whereas the relative humidity was 85.2 ± 1.4% and ranged between 59.9% and 100%; the light intensity at noon was 39063 ± 2451 lux and ranged from 58728 to 1286 lux as a function of the cloudiness.
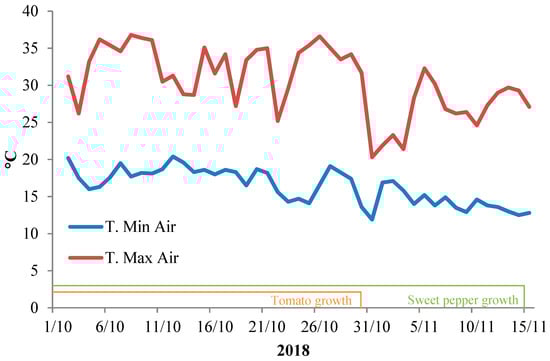
Figure 1.
Daily average maximum and minimum temperatures of the air inside the greenhouse during nursery trials.
3.1. Morphophysiological Parameters of Tomato Seedlings
The emergence (at least 50% of plantlets emerged) of tomato plantlets occurred 5 days after sowing and seedlings were ready for transplanting (4–5 true leaves; 14–15th BBCH growth stage [23]) after 29 d from sowing.
The height of tomato seedlings was significantly affected by the experimental factors. After ten days from the beginning of salt stress and GA3 spray treatment, the seedlings had less height with increasing NaCl concentration but were not influenced by GA3, whereas at the end of the experiment their height was affected by salt stress and was modified by the GA3 treatment (Figure 2).
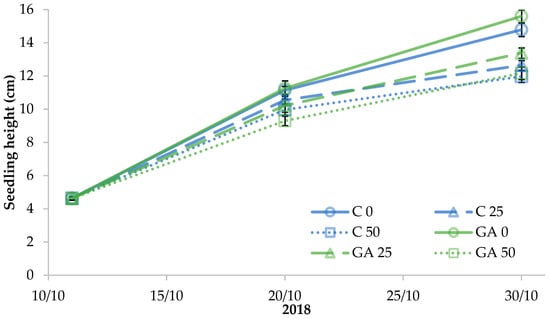
Figure 2.
Effect of the seedling treatments (C, untreated control, GA, gibberellic acid spray 10−5 M) and salt stress (0, 25, and 50 mM NaCl) on tomato seedling growth (the least significant difference (LSD) value at p < 0.05 for 20/10 = 0.37 and for 30/10 = 0.73).
The tallest seedlings were those treated with GA3 and no salt stress (15.6 cm on average) followed by the unstressed control seedlings (14.8 cm on average); the height significantly decreased under salt stress in control seedlings irrespective of NaCl concentration whereas it gradually dropped in the GA3-treated seedlings as salt stress increased (Figure 2).
Similar to seedling height, the stem of control seedlings had a lower diameter under both levels of salt stress, while the GA3-treated seedlings had a significantly lower stem diameter, with the highest NaCl concentration in the irrigation water (Figure 3).
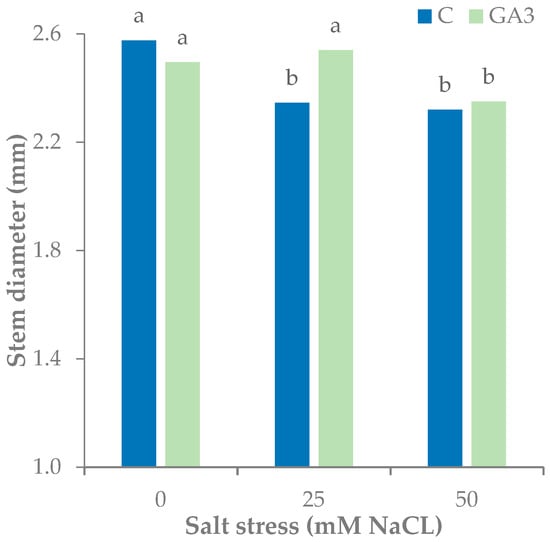
Figure 3.
Effect of the seedling treatments (C, untreated control, GA3, gibberellic acid spray 10−5 M) and salt stress (0, 25, and 50 mM NaCl in the irrigation water) on the stem diameter of tomato seedlings. Bars with different letters are significantly different at p < 0.05 according to the LSD test.
The fresh weight (FW) of tomato seedlings was affected by the interaction between the GA3 treatment and the salt stress (Table 1, Figure 4). The total fresh biomass was 2.28 g in the unstressed control seedlings and was reduced by 25.0 and 30.9% with 25 and 50 mM NaCl, respectively. GA3-treated seedlings had a higher total fresh weight under no salt stress (2.64 g with 0 mM NaCl) or moderate stress (1.95 g with 25 mM NaCl) even if they exhibited a reduction (−26.1%) close to those of control seedlings. The root fresh weight was almost constant in control seedlings even under salt stress conditions whereas it was significantly reduced by salt stress in GA3-treated seedlings. The fresh biomass of the stem and the leaves of the GA3-treated seedlings were higher than control with 0 and 25 mM NaCl and dropped to comparable values with the highest NaCl concentration (50 mM). The differences in the response to salt stress between control and GA3-treated seedlings for root and shoot fresh biomass accumulation resulted in some changes in the biomass partitioning. The shoot/root ratio was higher in GA3-treated seedlings than the control with 0 and 25 mM NaCl whereas it dropped below 4.0 with 50 mM NaCl irrespective of GA3 treatment (Table 1).

Table 1.
Effects of gibberellic acid treatment (C, not treated; GA3, 10−5 M GA3) and salt stress (0, 25, and 50 mM NaCl in the irrigation water) on morphological parameters of tomato seedlings.
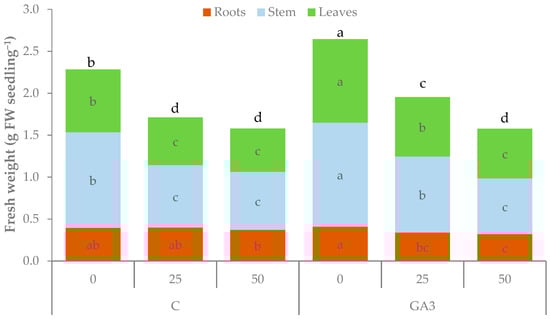
Figure 4.
Effect of the seedling treatments (C, untreated control, GA3, gibberellic acid spray 10−5 M) and salt stress (0, 25, and 50 mM NaCl in the irrigation water) on the total, root, stem, and leaf fresh weight of tomato seedlings. Bbars of the same color with different letters are significantly different at p < 0.05 according to the LSD test.
The total dry weight (DW) of the untreated seedlings showed the same trend as that of fresh biomass (Table 1, Figure 5). Control seedlings exhibted a reduction of 26.8% and 29.6% of total dry weight with 25 and 50 mM NaCl, respectively. GA3-treated seedlings were more tolerant to moderate salt stress (25 mM NaCl), with no significant reduction of total dry weight (−6.1%) but lowered their dry biomass to values comparable to the untreated seedlings with the highest NaCl concentration (175.3 mg DW seedling−1). The GA3 treatment had no significant effect on the accumulation of dry biomass in the roots, whereas increasing salt stress up to 50 mM NaCl significantly reduced root dry weight. The dry weights of the stem (94.0 and 94.8 mg DW seedling−1 for control and GA3, respectively) and the leaves (15.8 and 114.8 mg DW seedling−1 for control and GA3, respectively) were not affected by the GA3 treatment with 0 mM NaCl. The dry biomass of the shoot (stem and leaves) of the untreated seedlings was significantly reduced under the 25 mM NaCl salt stress, with no further significant decrease at the highest NaCl concentration (−31.4 ± 0.3% and −29.0 ± 2.9% for stem and leaves, respectively). GA3 spray limited the reduction of dry biomass in the shoot of the seedlings fed with 25 mM NaCl in the irrigation water; therefore, the dry weights of stems and leaves were similar to those of the unstressed seedlings. The GA3 treatment was not as effective at the highest NaCl level (−33.2% and −20.7% for stem and leaves, respectively) (Table 1). The dry biomass partitioning was influenced by salt stress that caused a reduction of the shoot/root ratio but this reduction was milder in the GA3-treated seedlings that showed a shoot/root ratio higher than control seedlings under the stress condition (Table 1).
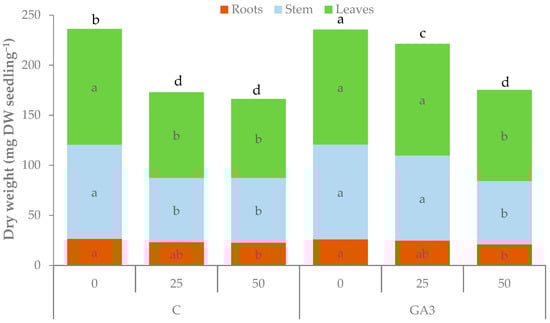
Figure 5.
Effect of the seedling treatments (C, untreated control, GA3, gibberellic acid spray 10−5 M) and salt stress (0, 25, and 50 mM NaCl in the irrigation water) on the total, root, stem, and leaf dry weight of tomato seedlings. Bars of the same color with different letters are significantly different at p < 0.05 according to the LSD test).
The GA3-treated seedlings had higher water content than controls with no salt stress as shown by the lower dry matter percentage. Salt stress had no effect on this parameter in the control seedlings while the increase was higher and significant in the GA3-treated seedlings (Table 1).
The tomato seedlings treated with GA3 recorded the highest leaf number (5.44 leaves seedling−1), as they had 18% more leaves than the control seedlings (4.61 leaves seedling−1 on average) (Table 2). Seedling leafiness significantly decreased by increasing the concentration of NaCl in the irrigation water from 0 to 50 mM (from 5.27 to 4.75 leaves seedling−1). The GA3 treatment significantly affected the average leaf area that was 18.0% wider in GA3-treated seedlings (10.17 cm2 leaf−1) than control (8.62 cm2 leaf−1) under no salt stress. Both NaCl level (25 and 50 mM) caused a similar reduction (−26.3 ± 0.8%) to the average leaf area of control seedlings, whereas the GA3-treated seedlings reduced by 18.6% the leaf wideness with the moderate salt stress (8.28 cm2 leaf−1 with 25 mM NaCl) resulting in a leaf area no different from that of the untreated and unstressed seedlings (control seedlings with 0 NaCl). Watering the GA3-treated seedlings with the highest NaCl level (50 mM) further reduced their leaf area with no significant difference between treated and untreated seedlings (6.47 cm2 leaf−1 on average). A similar effect of the GA3 treatment and the salt stress was found for the total leaf area of the seedlings that was highest in the unstressed seedlings sprayed with GA3 (58.47 cm2 seedling−1, +41.7% than control). Raising to 25 mM NaCl the salt concentration in the irrigation water, the seedlings sprayed with GA3 had a total leaf area (44.17 cm2 seedling−1) higher than the untreated seedlings (29.47 cm2 seedling−1) and not statistically different from the values of leaf area recorded for the control seedlings under no salt stress (41.25 cm2 seedling−1). The increase to 50 mM NaCl of the salt concentration in the irrigation water did not cause further significant reduction of total leaf area in control seedlings while it negatively affected treated seedlings that had values not statistically different from those not treated (Table 2, Figure 6).
Table 2.
Effects of the gibberellic acid treatment (C, not treated; GA3, GA3-treated seedlings) and salt stress (0, 25, and 50 mM NaCl in the irrigation water) on leaf characteristics of tomato seedlings.
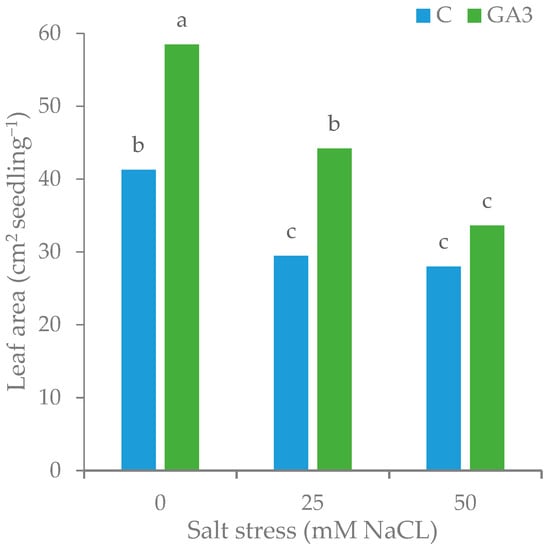
Figure 6.
Effect of the seedling treatments (C, untreated control, GA3, gibberellic acid spray 10−5 M) and the salt stress (0, 25, and 50 mM NaCl in the irrigation water) on the total leaf area of tomato seedlings. Bars with different letters are significantly different at p < 0.05 according to the LSD test.
The specific leaf area (SLA) is a parameter related to dry biomass distribution in the leaves and leaf thickness (Table 2). This index showed a significant increase only under no stress conditions in the treated seedlings compared to the control seedlings (+41.5%) (Table 2).
The seedlings did not differ in stomatal conductance due to GA3 treatment when not salt-stressed (371.8 mmol m2 s−1 ± 20.9) or with the highest salt stress level (67.8 ± 3.9 mmol m2 s−1), whereas they had a different response to the moderate salt stress that determined a reduction by 66.7% in control seedlings (123.0 mmol m2 s−1) and by 41.0% in GA3-treated seedlings (220.3 mmol m2 s−1) (Table 2).
The relative water content (RWC) was higher in the untreated seedlings and was negatively affected only by the highest NaCl level (Table 2).
The physiological and nutritional status of the plants can influence the pigment content of the leaf, thus leaf color can be an index of seedling health (Table 2). The supply of brackish water for irrigation caused a linear increase of color lightness (L*) with a significantly lighter color with the highest NaCl concentration. The color vividness of the leaves was evaluated by calculating the Chroma and exhibited a slight but significant increase by GA3 treatment (+3.9 ± 1.3%) and salt stress (+4.7 ± 0.7%) (Table 2). Moreover, the green component of color was less intense in the control seedlings compared to the GA3-treated seedlings and in the seedlings that received the highest level of NaCl with the irrigation water, as suggested by the reduction of the hue angle.
3.2. Morphophysiological Parameters of Sweet Pepper Seedlings
Pepper plantlets emerged 14 days after sowing and seedlings were ready for transplanting (3–4 true leaves; 13–14th BBCH growth stage [23]) after 46 d from sowing.
The height of pepper seedlings was significantly affected by the experimental treatments. After ten days from the beginning of salt stress and GA3 spray treatment, the control seedlings showed a reduction of plant height with increasing NaCl concentration, whereas GA3-treated seedlings suffered height reduction only with 50 mM NaCl. At the end of the experiment, the seedlings sprayed with GA3 (8.1 ± 0.2 cm on average) were significantly taller than the control (+27.3 ± 2.9%). Both treated and untreated pepper seedlings exhibited a linear decrease in their height as increasing salt stress from 0 to 50 mM NaCl (7.6 ± 0.7 and 6.8 ± 0.9 cm, respectively) (Figure 7).
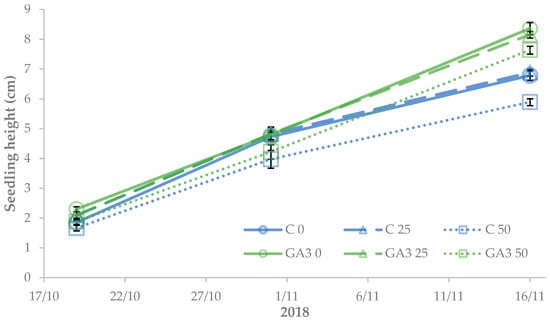
Figure 7.
Effect of the seedling treatments (C, untreated control, GA, gibberellic acid spray 10−5 M) and salt stress (0, 25, and 50 mM NaCl) on sweet pepper seedling growth (the LSD value at p < 0.05 for 30/10 = 0.44 and for 16/11 = 0.80).
The diameter of the seedling stem was 2.0 ± 0.03 mm and was not influenced by the experimental treatments.
The fresh weight (FW) of pepper seedlings was affected by the GA3 treatment applied to seedlings and by salt stress (Table 3, Figure 8). The mean total fresh biomass was 0.97 g in the unstressed control seedlings and was increased by 18.2 ± 1.8% due to GA3 spray irrespective of salt stress. The use of brackish irrigation water negatively affected the total fresh biomass produced by pepper seedlings that significantly dropped from 1.15 g to 0.95 g with 0 and 50 mM NaCl, respectively (Table 3, Figure 8). The fresh weight of the roots of pepper seedlings showed different variations due to salt stress according to seedling treatments. Control seedlings recorded the highest root fresh biomass with 0 and 25 mM NaCl, and it dropped significantly only with the highest salt stress level, whereas GA3-treated seedlings showed a reduction of root fresh weight even with the moderate salt stress (25 mM NaCl) (Table 3). The fresh biomass of the stem and the leaves significantly increased by 24.4% and 40.7%, respectively, in the unstressed GA3-treated seedlings compared to the control seedlings. The salinity of the irrigation water had a lower effect on shoot fresh weight as it negatively affected only stem fresh weight in the seedlings watered with the higher NaCl level (Table 3, Figure 8).
Table 3.
Effects of the gibberellic acid treatment (C, not treated; GA3, GA3-treated seedlings) and salt stress (0, 25, and 50 mM NaCl in the irrigation water) on morphological parameters of sweet pepper seedlings.
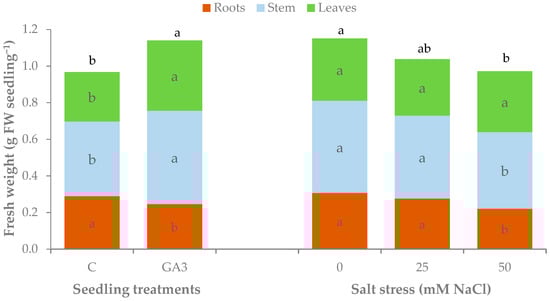
Figure 8.
Effect of the seedling treatments (C, untreated control, GA3, gibberellic acid spray 10−5 M) and salt stress (0, 25, and 50 mM NaCl in the irrigation water) on the total, root, stem, and leaf fresh weight of sweet pepper seedlings (within each experimental factor. Bars of the same color with different letters are significantly different at p < 0.05 according to the LSD test.
The experimental treatments modified the fresh biomass partitioning as shown by the shoot/root ratio (Table 3). The treatment with GA3 increased the portion of biomass accumulated in the shoot reaching a shoot/root ratio of 3.7 compared to 2.4 for the control seedlings. The reduction of root fresh weight due to salt stress was higher than those of the shoots determining an increasing trend of the shoot/root ratio when irrigation water salinity increased.
The effects of the experimental treatments on the dry weight (DW) of the seedlings were similar to those reported for the fresh biomass (Table 3, Figure 9). Control seedlings accumulated a total of 79.3 ± 4.3 mg DW seedling−1; the treatment with GA3 significantly increased the total dry weight up to 93.5 ± 6.4 mg DW seedling−1 (+17.8 ± 2.1%). The dry weight of the roots was 19.8 ± 1.4 mg DW seedling−1 in the untreated seedlings that were not affected by salt stress. GA3-treated unstressed seedlings had a similar root dry weight but significantly reduced the dry weight of this part under salt stress (−56.7 ± 6.7%). The accumulation of dry matter was almost equal between stem and leaves. Both plant parts were positively influenced by GA3 with an increase of 26.2 ± 2.5% for the stem and 47.3 ± 4.8% for the leaves. The stems also showed a greater effect of salt stress as regards the dry biomass accumulated as it dropped even with moderate salt stress (−15.2 ± 1.1% for 25 and 50 mM NaCl). The shoot/root ratio of the dry weights recorded the lowest values in the untreated seedlings irrespective of salt stress (3.0 on average). Unstressed GA3-seedlings had a shoot/root DW ratio of 4.3 that significantly increased up to 8.2 and 10.3 with 25 and 50 mM NaCl, respectively.
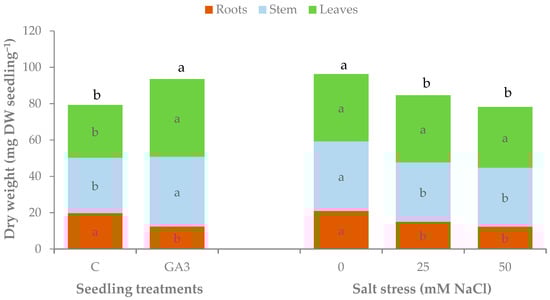
Figure 9.
Effect of the seedling treatments (C, untreated control, GA3, gibberellic acid spray 10−5 M) and salt stress (0, 25, and 50 mM NaCl in the irrigation water) on the total, root, stem, and leaf dry weight of sweet pepper seedlings (within each experimental factor. Bars of the same color with different letters are significantly different at p < 0.05 according to the LSD test.
The dry matter percentage of the pepper seedling shoots was slightly but significantly influenced by GA3 that determined a higher dry matter percentage in the treated seedlings (9.1%) compared to the untreated seedlings (8.8%) (Table 3).
The pepper seedlings treated with GA3 had the highest leaf number (4.44 ± 0.17 leaves seedling−1), with 18.4% more leaves than the untreated seedlings (3.75 ± 0.09 leaves seedling−1) (Table 4). The leaf number significantly decreased in the presence of NaCl in the irrigation water (−8.6 ± 1.3% for 25 and 50 mM NaCl) compared to 4.35 ± 0.26 leaves seedling−1 for the unstressed seedlings. The GA3 treatment significantly affected the average leaf area; it was 26.6 ± 3.4% wider in treated seedlings (4.51 ± 0.41 cm2 leaf−1) than control (3.57 ± 0.32 cm2 leaf−1) (Table 4). The effect of the GA3 treatment on the total leaf area of the seedlings was even greater as it increased this parameter from 13.44 ± 1.22 to 20.10 ± 1.97 cm2 seedling−1 (+49.9 ± 4.8%). The irrigation water salinity caused a linear reduction in the average leaf area that ranged on average from 4.41 ± 0.31 cm2 leaf−1, in the unstressed plants to 3.69 ± 0.28 cm2 leaf−1 with 50 mM NaCl (−16.6 ± 2.9%) (Table 4). Similarly, the total leaf area was reduced by 24.7 ± 1.5% when the salt concentration in the irrigation water increased from 0 to 50 mM (19.37 ± 1.9 and 14.64 ± 1.3 cm2 seedling−1, respectively).
Table 4.
Effects of the gibberellic acid treatment (C, not treated; GA3, GA3-treated seedlings) and salt stress (0, 25, and 50 mM NaCl in the irrigation water) on leaf characteristics of sweet pepper seedlings.
As with tomato seedlings, the specific leaf area (SLA) showed a significant increase due to GA3 only under no salt stress (542.4 cm2 g−1 DW, +9.1% compared to the control seedlings) but a reduction of SLA was recorded for both seedling treatments when the NaCl level was increased up to 50 mM (395.0 ± 2.1 cm2 g−1 DW) (Table 4).
The seedlings did not differ in stomatal conductance due to seedling treatments even if GA3-treated seedlings had a slightly higher stomatal conductance (Table 4). The highest salt stress caused a reduction of 23.3 ± 2.1% compared to the stomatal conductance values with 0 and 25 mM NaCl.
The relative water content (RWC) of unstressed pepper seedlings was 93.1 ± 0.3% and was significantly lower in the salt-stressed seedlings (88.8 ± 0.8% with 25 and 50 mM NaCl) (Table 4).
The leaf color of GA3-treated pepper seedlings was lighter, more vivid, and less greenish than the untreated seedlings as shown by the changes in the values of L*, Chroma, and Hue angle. Leaf color was also affected by the highest NaCl concentration mainly as regards L* and Chroma modifications, resulting in darker and less vivid color (Table 4).
3.3. Principal Components Analysis
The principal components analysis revealed four principal components (PCs) with eigenvalues higher than 1.00 (Table 5), representing 69.23%, 11.04%, 9.23%, and 5.11% of the total variance, respectively. Thus, the combination of four PCs could represent the initial twenty-two variables, explaining 94.61% of the total variance.
Table 5.
Correlation of variables to the factors of the principal components analysis (PCA) based on factor loadings.
PC1 was mainly related to height, stem diameter, total, root, stem, and leaf fresh weight (FW), shoot/root (S/R) FW, total, root, stem, and leaf dry weight (DW), dry matter percentage, leaf number, plant and leaf area, stomatal conductance, relative water content (RWC), chroma and hue angle; PC2 was related to the root DW, shoot/root (S/R) DW and L*; PC3 was related to the specific leaf area (SLA) and RWC; PC4 was related to L* (Table 5). Projecting the original variables on the plane of the two main PCs could ilustrate such relationships, as displayed in the plot of loadings (Figure 10a).
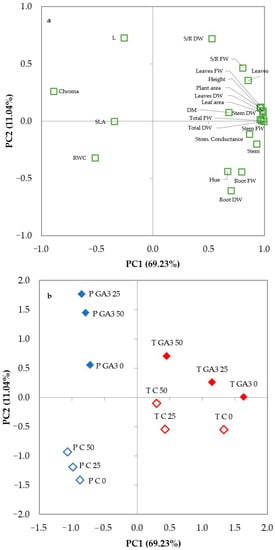
Figure 10.
Plots of (a) loadings (morphophysiological characteristics of tomato and sweet pepper seedlings) and (b) scores (trials) formed by the two principal components from the Principal Component Analysis (PCA). T C: untreated tomato seedlings; T GA3; tomato seedlings spayed with 10−5 M of gibberellic acid (GA3); P C: untreated pepper seedlings; P GA3: pepper seedlings spayed with 10−5 M GA3; 0, 25, and 50: concentration of NaCl (mM) in the irrigation water.
The differentiation of the NaCl levels supplied with the irrigation water to tomato and pepper seedlings treated or not treated with GA3 are shown in the plot of scores (Figure 10b), where two main clusters (tomato and pepper seedlings) and two sub-clusters for each main cluster (GA3 treated or untreated seedlings) could be visibly distinguished. The scores of tomato seedlings were located in the positive part of the PC1 axis, whereas pepper seedlings were located in the negative part of the PC1 axis; the tomato and pepper seedlings sprayed with GA3 were located in the positive part of the PC2 axis, whereas the untreated seedlings were located in the negative part of the PC2 axis. Thus, GA3 treated or untreated tomato and pepper seedlings were located in a different quadrant of the plane: GA3-treated tomato seedlings were in the first quadrant (+; +), control tomato seedlings were in the fourth quadrant (+; –), GA3-treated pepper seedlings were in the second quadrant (–; +), and control pepper seedlings were in the third quadrant (–; –). The response of tomato and pepper seedlings differed in their sensitivity to increased salt stress (from 0 to 50 mM NaCl) as a function of the GA3 treatment, as the scores of control tomato seedlings mainly reduced their PC1 values, the scores of GA3-treated tomato seedlings mainly reduced their PC1 values but also increased their PC2 values, the scores of control pepper seedlings mainly increased their PC2 values but also reduced their PC1 values, and the scores of GA3-treated pepper seedlings mainly increased their PC2 value. Combining the data from the plot of loadings and scores, it can be concluded that the concentration of NaCl in the irrigation water influenced the tomato and pepper seedlings in different ways according to the GA3 treatment (Figure 10a,b).
4. Discussion
Irrigation water of poor quality due to salinity may represent a big issue for vegetable crops as saline conditions result in lowered growth, yield, and quality and could have negative economic effects for vegetable growers [13,27,28]. These effects are even worse for the vegetable nursery industry that has to face the higher sensitivity to salt stress of vegetable seedlings compared to mature plants [7]. The goal of this important sector is to produce well-developed and vigorous transplants [25] which could be hard or even impossible to reach when brackish water is the only available source for watering the seedlings. Growth limitation due to salinity can reduce the size of transplants which is linked to establishment success, the growth rate, and the size at harvest [29,30] and thus also reduces the commercial success of these products.
In a previous study [13], we found that salt tolerance of leaf lettuce and rocket grown in a floating system increased when GA3 was added to the nutrient solution. In this experiment, we tested the possibility of increasing the salinity tolerance threshold of tomato and pepper seedlings by spraying a solution of 10−5 M GA3 on the seedlings at the beginning of salt stress.
The reductions in the biomass of untreated tomato and pepper seedlings watered with saline water were indicative of growth limitations even with differences in the salinity tolerance threshold. The negative effects of salinity on biomass were also noted on other morphological and physiological traits such as plant height, shoot/root ratio, leaf number, leaf area, relative water content, and stomatal conductance. Similar effects were also found in many other vegetable crops grown under salt stress [13,28,31,32]. Seedling height exhibited a significant reduction of over 14% in both non-GA3-treated tomato and pepper seedlings, but the latter species suffered this reduction only at the highest salt stress. The salinity of the irrigation water also affected the total fresh and dry biomass of the untreated seedlings of both species, but even for these traits, the reduction of these parameters was higher in tomato (–30.9% and –29.6% with 50 mM NaCl for total fresh and dry weight, respectively) than pepper (–19.5% and –16.1% with 50 mM NaCl for total fresh and dry weight, respectively) and progressively increased with salt stress level in pepper seedlings (–7.5% and –11.5% with 25 mM NaCl for total fresh and dry weight, respectively), whereas it reached a significantly lower value at an intermediate salt stress level in tomato seedlings (–25.0% and –26.8% with 25 mM NaCl for total fresh and dry weight, respectively), confirming that vegetables have different tolerance thresholds to salinity and that the magnitude of the negative effects can increase with different slopes with increases of salinity level [33,34]. The high electrical conductivity (EC) of the soil or the irrigation water may restrict water availability to the plants as it increases soil osmotic potential resulting in reduced water uptake and partial dehydration of the cell cytoplasm. This may lead to plasmolysis and could affect cell metabolism and macromolecule function, ending up with a slowdown or even cessation of growth [35]. The growth reduction recorded in response to salt stress could also be ascribed to a modification of nutrient uptake determined by a negative effect on nutrient availability [28,33]. Salinity can also affect nutrient translocation from the roots to the shoot, determining changes in biomass partitioning and plant morphology as shown by the variations in shoot/root ratios and the reduction of leaf number and leaf expansion in tomato and pepper seedlings. This latter effect could be related to the decrease of the relative water content of the leaves in response to increased salt stress that is generally due to lower water availability under stress conditions or to root disorders that impede sufficient water uptake to compensate for the water lost by transpiration [36,37].
The foliar application of gibberellic acid had a growth-promoting effect on the unstressed tomato and pepper seedlings. It affected some growth parameters similarly in tomato and pepper whereas others were enhanced to a greater extent in pepper than tomato. The GA3-treated seedlings increased by about 16% their total fresh weight thanks to an increase of 34.4% of the leaf fresh weight compared to the untreated seedlings; the increase of leaf fresh weight could be explained by the higher number of leaves (+20.9%) and the greater expansion of single leaf and total plant area (+21.2% and +46.5% respectively). The exogenous supplementation of gibberellic acid at a very low concentration can improve the morpho-physiological and yield characteristics of many vegetable crops [14,18,20,21,38,39] and has been already successfully applied to tomato transplant production [22]. Endogenous gibberellins are important plant hormones that act in regulating plant growth and development by promoting division and elongation of the cells [40,41]. Many other mechanisms are triggered by gibberellins and contribute to the improvement of biomass accumulation in vegetative parts [42,43] (stimulating the synthesis of DNA, RNA, and protein, the multiplication of ribose and polyribosomes, and improve enzyme activities and membrane permeability [44,45,46,47,48,49]). The plants supplemented with exogenous GA3 may significantly modify their morphological traits and direct the biomass allocation toward leaves and stem, increasing the shoot/root ratio [20,50], as found in the present work with tomato and pepper seedlings. These changes could significantly enhance transplant quality as it has been shown that the increase in shoot weight is related to seedling vigor and plant earliness [51].
The use of gibberellic acid was also effective in modifying the response of seedlings to salt stress even if to a different extent for tomato and pepper. Foliar treatment with GA3 delayed the onset of salt stress symptoms and limited growth reduction of tomato seedlings at the intermediate salinity level, resulting in fresh and dry weight of the shoot similar to those of the unstressed untreated tomato seedlings. The effect of the exogenous GA3 was more evident on pepper seedlings that maintained comparable or even higher values than unstressed untreated seedlings in many morphological characteristics. Similar effects of low doses of exogenous GA3 supplementation were also found in lettuce and rocket grown in an hydroponic floating system with brackish nutrient solutions [13]. Plant hormones are involved in the response of vegetables to salt stress and mediate the activation of tolerance mechanisms [52] through complex crosstalk between hormones signaling pathways [53]. Decreased growth under salt stress of many species has been linked to a reduced level of bioactive endogenous gibberellins (GAs) caused by the increase of the two stress hormones ethylene and abscisic acid (ABA). It is known that ABA and GAs reciprocally influence each other’s metabolism. The increase of ABA levels in seedlings may reduce bioactive GAs levels, thus reducing cell elongation and consequently stem elongation, leaf expansion, and root growth [54]. In contrast, gibberellins may promote the catabolism of ABA [55], so the exogenous supplementation of gibberellic acid might mitigate the negative responses mediated by ABA of plants to salt stress. This may be due to the GA-mediated activation of important metabolic pathways (ribose and polyribosome multiplication; DNA, RNA, and protein synthesis) [56,57,58,59] that could influence the repartitioning of the internal resources toward the aerial part of the plants thus increasing the biomass of seedling shoot. Moreover, exogenous GA3 may increase membrane permeability [60,61] leading to improved uptake and utilization of water and mineral nutrients [15,62,63] and enhanced transport of photosynthates [64,65,66], which end up increasing biomass accumulation. This could explain the higher tolerance of the GA3-treated seedlings to salinity compared to the untreated seedlings. In our experiment, tomato and pepper seedlings sprayed with GA3 reacted to moderate (tomato) or even high (pepper) salt stress increasing significantly the accumulation of assimilates in the leaves and the stems compared to untreated seedlings, confirming that gibberellins may noticeably change biomass partitioning thus increasing the shoot/root ratio [13,20,22,50]. High dry weights of stems and shoots in vegetable transplants is an index of seedling vigor and has been related to higher establishment success in the field and to reduced time from transplanting to production, thus promoting plant earliness [22,51,67,68]. The increase in NaCl level decreased the physiological age of the seedlings as resulted from the reduction of leaf number, whereas GA3 was confirmed to promote tomato seedling growth rate [22] and was effective in increasing the physiological age of tomato and pepper seedlings under salt stress conditions. As well as leaf number, gibberellic acid also increased the average leaf area under moderate (tomato) or even high (pepper) salt stress, resulting in a wider total leaf area compared to the untreated seedlings, despite the reduction of the relative water content under salt stress. This parameter is related to the cell turgor and its reduction can negatively affect leaf expansion. The higher biomass accumulation of GA3-treated seedlings under salt stress compared to control seedlings could be ascribed to the wider photosynthetic area. A supply of exogenous GA3 can stimulate nitrogen redistribution in plants and improve N utilization in leaves and stems by promoting the translocation of assimilates towards shoot apices and young leaves, thus determining the production of more leaves and the increase of physiological age [19]. This latter parameter could have a strong effect on early growth and production after plant establishment [22,68].
The quality of vegetable transplants is closely related to the morphological characteristics of the seedlings and the biomass accumulated, thus the adverse effects of salt stress on plant morphology and leaf development could negatively affect the agronomic and economic value of transplants. The foliar treatment with GA3 was effective in counteracting the negative impact of salinity on the growth and development of tomato and pepper seedlings but to a different extent in these two species as shown by the results of the principal component analysis. Tomato and pepper are considered moderately sensitive to salinity but have different tolerance thresholds and critical salinity values for yield loss [34]. The effect of salinity may vary as a function of species or even of varieties within a species, and can be widely different according to development stages and environmental or agronomic factors [7,28]. The principal components analysis (PCA) highlighted the different responses of the two species to salinity. Tomato seedlings showed similar harmful effects when exposed to moderate and high salt stress whereas the pepper negative response was more gradual and slightly increased at every NaCl level. The tested species also differed for the effects determined by GA3 treatment. Under no salt stress, pepper seedlings showed a higher growth-promoting effect from the GA3 foliar spray than tomato. The application of GA3 counterbalanced the response to salinity of pepper and tomato seedlings but it acted to a different extent and probably on distinct plant adaptation systems, as GA3 almost completely overrode the negative effects of all NaCl levels in pepper seedlings, while tomato seedlings showed an increased salt tolerance thanks to GA3 only up to 25 mM NaCl. These results confirmed that the effects of exogenous GA3 supply may vary according to species and environmental conditions [13,20,21,69].
5. Conclusions
Salinity of irrigation water negatively affected the growth of tomato and sweet pepper seedlings during nursery transplant production by affecting biomass accumulation, leaf number, leaf area, and delaying the physiological age. Tomato seedlings were more sensitive to salinity and suffered significant negative effects even with moderate salt stress (25 mM NaCl), whereas sweet pepper seedlings suffered progressive growth reduction that was significant only with the highest salt stress (50 mM NaCl). The spray application of 10−5 M GA3 exerted a growth-promoting effect on unstressed seedlings and was successful in increasing salinity tolerance of tomato seedlings up to 25 mM NaCl and up to 50 mM NaCl in sweet pepper seedlings. This treatment could represent a sustainable strategy for use with saline water in vegetable nurseries, limiting negative effects on seedling quality and production time, but this needs to be further validated on other vegetable species.
Author Contributions
Conceptualization, A.M. (Alessandro Miceli), F.V. and A.M. (Alessandra Moncada); Data curation, A.M. (Alessandro Miceli) and F.V.; Formal analysis, A.M. (Alessandro Miceli) and A.M. (Alessandra Moncada); Investigation, A.M. (Alessandro Miceli), F.V. and A.M. (Alessandra Moncada); Methodology, A.M. (Alessandro Miceli), F.V. and A.M. (Alessandra Moncada); Supervision, A.M. (Alessandro Miceli) and A.M. (Alessandra Moncada); Validation, A.M. (Alessandro Miceli), F.V. and A.M. (Alessandra Moncada); Writing—original draft, A.M. (Alessandro Miceli), F.V. and A.M. (Alessandra Moncada); Writing—review & editing, A.M. (Alessandro Miceli), F.V. and A.M. (Alessandra Moncada). All authors have read and agreed to the published version of the manuscript.
Funding
This research received no external funding.
Acknowledgments
The authors would like to thank Marina Di Simone, Monia Gnoffo, and Roberta Lo Nardo for their precious help and support.
Conflicts of Interest
The authors declare no conflict of interest.
References
- Nicola, S.; Cantliffe, D.J. Increasing cell size and reducing medium compression enhance lettuce transplant quality and field production. HortScience 1996, 31, 184–189. [Google Scholar] [CrossRef]
- Russo, V.M. Organic vegetable transplant production. HortScience 2005, 40, 623–628. [Google Scholar] [CrossRef]
- Caracciolo, G.; Moncada, A.; Prinzivalli, C.; D’Anna, F. Effects of planting dates on strawberry plug plant performance in Sicily. Acta Hortic. 2009, 842, 155–158. [Google Scholar] [CrossRef]
- Swiader, J.M.; Ware, G.W.; McCollum, J.P. Producing Vegetable Crops: Teacher’s Manual; Interstate Publishers: Crete, IL, USA, 1992; ISBN 0813429048. [Google Scholar]
- Kloepper, J.W.; Reddy, M.S.; Rodriguez-Kabana, R.; Kenney, D.S.; Kokalis-Burelle, N.; Martinez-Ochoa, N.; Vavrina, C.S. Application for rhizobacteria in transplant production and yield enhancement. Acta Hortic. 2004, 631, 217–229. [Google Scholar] [CrossRef]
- Mariani, L.; Ferrante, A. Agronomic Management for Enhancing Plant Tolerance to Abiotic Stresses—Drought, Salinity, Hypoxia, and Lodging. Horticulturae 2017, 3, 52. [Google Scholar] [CrossRef]
- Foolad, M.R. Recent Advances in Genetics of Salt Tolerance in Tomato. Plant Cell. Tissue Organ Cult. 2004, 76, 101–119. [Google Scholar] [CrossRef]
- Maggio, A.; Barbieri, G.; Raimondi, G.; de Pascale, S. Contrasting Effects of GA 3 Treatments on Tomato Plants Exposed to Increasing Salinity. J. Plant Growth Regul. 2010, 29, 63–72. [Google Scholar] [CrossRef]
- Wang, Y.; Mopper, S.; Hasenstein, K.H. Effects of salinity on endogenous ABA, IAA, JA, and SA in Iris hexagona. J. Chem. Ecol. 2001, 27, 327–342. [Google Scholar] [CrossRef]
- Egamberdieva, D. Alleviation of salt stress by plant growth regulators and IAA producing bacteria in wheat. Acta Physiol. Plant. 2009, 31, 861–864. [Google Scholar] [CrossRef]
- Khan, M.A.; Gul, B.; Weber, D.J. Action of plant growth regulators and salinity on seed germination of Ceratoides lanata. Can. J. Bot. 2004, 82, 37–42. [Google Scholar] [CrossRef]
- Afzal, I.; Basra, S.A.; Iqbal, A. The effects of seed soaking with plant growth regulators on seedling vigor of wheat under salinity stress. J. Stress Physiol. Biochem. 2005, 1, 6–14. [Google Scholar]
- Vetrano, F.; Moncada, A.; Miceli, A. Use of Gibberellic Acid to Increase the Salt Tolerance of Leaf Lettuce and Rocket Grown in a Floating System. Agronomy 2020, 10, 505. [Google Scholar] [CrossRef]
- Khan, M.M.A.; Gautam, C.; Mohammad, F.; Siddiqui, M.H.; Naeem, M.; Khan, M.N. Effect of gibberellic acid spray on performance of tomato. Turk. J. Biol. 2006, 30, 11–16. [Google Scholar]
- Khan, N.A.; Ansari, H.R. Effect of gibberellic acid spray during ontogeny of mustard on growth, nutrient uptake and yield characteristics. J. Agron. Crop Sci. 1998, 181, 61–63. [Google Scholar] [CrossRef]
- Pal, P.; Yadav, K.; Kumar, K.; Singh, N. Effect of gibberellic acid and potassium foliar sprays on productivity and physiological and biochemical parameters of parthenocarpic cucumber cv.‘Seven Star F1’. J. Hortic. Res. 2016, 24, 93–100. [Google Scholar] [CrossRef]
- Shah, S.H. Effects of Salt Stress on Mustard As Affected By Gibberellic Acid Application. Gen. Appl. Plant Physiol. 2007, 33, 97–106. [Google Scholar]
- Gelmesa, D.; Abebie, B.; Desalegn, L. Effects of gibberellic acid and 2, 4-dichlorophenoxyacetic acid spray on fruit yield and quality of tomato (Lycopersicon esculentum Mill.). J. Plant Breed. Crop Sci. 2010, 2, 316–324. [Google Scholar]
- Khan, N.A.; Mir, R.; Khan, M.; Javid, S. Effects of gibberellic acid spray on nitrogen yield efficiency of mustard grown with different nitrogen levels. Plant Growth Regul. 2002, 38, 243–247. [Google Scholar] [CrossRef]
- Miceli, A.; Moncada, A.; Sabatino, L.; Vetrano, F. Effect of Gibberellic Acid on Growth, Yield, and Quality of Leaf Lettuce and Rocket Grown in a Floating System. Agronomy 2019, 9, 382. [Google Scholar] [CrossRef]
- Miceli, A.; Vetrano, F.; Sabatino, L.; D’Anna, F.; Moncada, A. Influence of preharvest gibberellic acid treatments on postharvest quality of minimally processed leaf lettuce and rocket. Horticulturae 2019, 5, 63. [Google Scholar] [CrossRef]
- Moncada, A.; Vetrano, F.; Esposito, A.; Miceli, A. Fertigation Management and Growth-Promoting Treatments Affect Tomato Transplant Production and Plant Growth after Transplant. Agronomy 2020, 10, 1504. [Google Scholar] [CrossRef]
- Feller, C.; Bleiholder, H.; Buhr, L.; Hack, H.; Hess, M.; Klose, R.; Meier, U.; Stauss, R.; van den Boom, T.; Weber, E. Phanologische Entwicklungsstadien von Gemusepflanzen II. Fruchtgemuse und Hulsenfruchte. Nachr. Dtsch. Pflanzenschutzd. 1995, 47, 217–232. [Google Scholar]
- Kazemi, M. Effect of gibberellic acid and potassium nitrate spray on vegetative growth and reproductive characteristics of tomato. J. Biol. Environ. Sci. 2014, 8, 1–9. [Google Scholar]
- Choudhury, S.; Islam, N.; Ali, M. Growth and Yield of Summer Tomato as Influenced by Plant Growth Regulators. Int. J. Sustain. Agric. 2013, 5, 25–28. [Google Scholar] [CrossRef]
- McGuire, R.G. Reporting of objective color measurements. HortScience 1992, 27, 1254–1255. [Google Scholar] [CrossRef]
- Yamaguchi, T.; Blumwald, E. Developing salt-tolerant crop plants: Challenges and opportunities. Trends Plant Sci. 2005, 10, 615–620. [Google Scholar] [CrossRef]
- Shannon, M.C.; Grieve, C.M. Tolerance of vegetable crops to salinity. Sci. Hortic. 1998, 78, 5–38. [Google Scholar] [CrossRef]
- Gama, P.B.S.; Inanaga, S.; Tanaka, K.; Nakazawa, R. Physiological response of common bean (Phaseolus vulgaris L.) seedlings to salinity stress. Afr. J. Biotechnol. 2007, 6, 79–88. [Google Scholar]
- Bayuelo-Jiménez, J.S.; Debouck, D.G.; Lynch, J.P. Growth, gas exchange, water relations, and ion composition of Phaseolus species grown under saline conditions. Field Crops Res. 2003, 80, 207–222. [Google Scholar] [CrossRef]
- Shahbaz, M.; Ashraf, M.; Al-Qurainy, F.; Harris, P.J.C. Salt Tolerance in Selected Vegetable Crops. Crit. Rev. Plant Sci. 2012, 31, 303–320. [Google Scholar] [CrossRef]
- Moncada, A.; Vetrano, F.; Miceli, A. Alleviation of Salt Stress by Plant Growth-Promoting Bacteria in Hydroponic Leaf Lettuce. Agronomy 2020, 10, 1523. [Google Scholar] [CrossRef]
- Grieve, C.M.; Grattan, S.R.; Maas, E. V Plant salt tolerance. Agric. Salin. Assess. Manag. 2012, 2, 405–459. [Google Scholar]
- FAO Drainage Paper 61, Agricultural Drainage Water Management in Arid and Semi-Arid Areas, Annex 1. Crop Salt Tolerance Data. Available online: http://www.fao.org/3/y4263e/y4263e0e.htm (accessed on 10 September 2020).
- Le Rudulier, D. Osmoregulation in rhizobia: The key role of compatible solutes. Grain Legum. 2005, 42, 18–19. [Google Scholar]
- Srivastava, J.P.; Gupta, S.C.; Lal, P.; Muralia, R.N.; Kumar, A. Effect of salt stress on physiological and biochemical parameters of wheat. Annu. Arid Zo. 1988, 27, 197–204. [Google Scholar]
- Shalhevet, J. Plants under salt and water stress. In Plant Adaptation to Environmental Stress; Fowden, L., Mansfield, T., Stoddart, J., Eds.; Chapman and Hall: London, UK, 1993; p. 133. [Google Scholar]
- Lee, I.-J. Practical application of plant growth regulator on horticultural crops. J. Hort. Sci 2003, 10, 211–217. [Google Scholar]
- Khan, N.A. Comparative effect of modes of gibberellic acid application on photosynthetic biomass distribution and productivity of rapeseed-mustard. Physiol. Mol. Biol. Plants 2003, 9, 141–145. [Google Scholar]
- Achard, P.; Gusti, A.; Cheminant, S.; Alioua, M.; Dhondt, S.; Coppens, F.; Beemster, G.T.S.; Genschik, P. Gibberellin Signaling Controls Cell Proliferation Rate in Arabidopsis. Curr. Biol. 2009, 19, 1188–1193. [Google Scholar] [CrossRef]
- Ubeda-Tomás, S.; Federici, F.; Casimiro, I.; Beemster, G.T.S.; Bhalerao, R.; Swarup, R.; Doerner, P.; Haseloff, J.; Bennett, M.J. Gibberellin Signaling in the Endodermis Controls Arabidopsis Root Meristem Size. Curr. Biol. 2009, 19, 1194–1199. [Google Scholar] [CrossRef]
- Emongor, V.E. Effect of benzyladenine and gibberellins on growth, yield and yield components of common bean (Phaseolus vulgaris). UNISWA Res. J. Agric. Sci. Technol 2002, 6, 65–72. [Google Scholar] [CrossRef]
- Gupta, V.N.; Datta, S.K. Influence of gibberellic acid (GA3) on growth and flowering in chrysanthemum (Chrysanthemummorifolium, Ramat) cv. Jayanti. Indian J. Plant Physiol. 2001, 6, 420–422. [Google Scholar]
- Huttly, A.K.; Phillips, A.L. Gibberellin-regulated plant genes. Physiol. Plant. 1995, 95, 310–317. [Google Scholar] [CrossRef]
- Van Huizen, R.; Ozga, J.A.; Reinecke, D.M. Influence of auxin and gibberellin on in vivo protein synthesis during early pea fruit growth. Plant Physiol. 1996, 112, 53–59. [Google Scholar] [CrossRef]
- Cohn, N.S.; Zhang, L.; Mitchell, J.P.; Vierheller, C.-Z.J. Gibberellin-stimulated changes in abundance of two mRNAs in the developing shoot of dwarf peas (Pisum sativum L.). Int. J. Plant Sci. 1994, 155, 498–505. [Google Scholar] [CrossRef]
- Shiri, Y.; Solouki, M.; Ebrahimie, E.; Emamjomeh, A.; Zahiri, J. Gibberellin causes wide transcriptional modifications in the early stage of grape cluster development. Genomics 2020, 112, 820–830. [Google Scholar] [CrossRef]
- Siddiqui, M.H.; Khan, M.N.; Mohammad, F.; Khan, M.M.A. Role of nitrogen and gibberellin (GA3) in the regulation of enzyme activities and in osmoprotectant accumulation in Brassica juncea L. under salt stress. J. Agron. Crop Sci. 2008, 194, 214–224. [Google Scholar] [CrossRef]
- De Freitas, S.T.; Jiang, C.-Z.; Mitcham, E.J. Mechanisms involved in calcium deficiency development in tomato fruit in response to gibberellins. J. Plant Growth Regul. 2012, 31, 221–234. [Google Scholar] [CrossRef]
- Hedden, P.; Thomas, S.G. Gibberellin biosynthesis and its regulation. Biochem. J. 2012, 444, 11–25. [Google Scholar] [CrossRef]
- Liptay, A.; Nicholls, S. Nitrogen Supply during Greenhouse Transplant Production Affects Subsequent Tomato Root Growth in the Field. J. Am. Soc. Hortic. Sci. 1993, 118, 339–342. [Google Scholar] [CrossRef]
- Javid, M.G.; Sorooshzadeh, A.; Moradi, F.; Ali, S.; Modarres, M. Review article The role of phytohormones in alleviating salt stress in crop plants. Annu. Rev. Plant Biol. 2011, 5, 726–734. [Google Scholar]
- Yuan, K.; Rashotte, A.M.; Wysocka-Diller, J.W. ABA and GA signaling pathways interact and regulate seed germination and seedling development under salt stress. Acta Physiol. Plant. 2011, 33, 261–271. [Google Scholar] [CrossRef]
- Sun, T. Gibberellin Metabolism, Perception and Signaling Pathways in Arabidopsis. Arab. Book 2008, 6, e0103. [Google Scholar] [CrossRef] [PubMed]
- Gonai, T.; Kawahara, S.; Tougou, M.; Satoh, S.; Hashiba, T.; Hirai, N.; Kawaide, H.; Kamiya, Y.; Yoshioka, T. Abscisic acid in the thermoinhibition of lettuce seed germination and enhancement of its catabolism by gibberellin. J. Exp. Bot. 2004, 55, 111–118. [Google Scholar] [CrossRef] [PubMed]
- Evins, W.H.; Varner, J.E. Hormonal control of polyribosome formation in barley aleurone layers. Plant Physiol. 1972, 49, 348–352. [Google Scholar] [CrossRef] [PubMed]
- Broughton, W.J.; McComb, A.J. Changes in the pattern of enzyme development in gibberellin-treated pea internodes. Ann. Bot. 1971, 35, 213–228. [Google Scholar] [CrossRef]
- Johri, M.; Varner, J.E. Enhancement of RNA synthesis in isolated pea nuclei by gibberellic acid. Proc. Natl. Acad. Sci. USA 1968, 59, 269. [Google Scholar] [CrossRef]
- Roth-Bejerano, N.; Lips, S.H. Hormonal regulation of nitrate reductase activity in leaves. New Phytol. 1970, 69, 165–169. [Google Scholar] [CrossRef]
- Wood, A.; Paleg, L.G. The influence of gibberellic acid on the permeability of model membrane systems. Plant Physiol. 1972, 50, 103–108. [Google Scholar] [CrossRef]
- Wood, A.; Paleg, L.G. Alteration of liposomal membrane fluidity by gibberellic acid. Funct. Plant Biol. 1974, 1, 31–40. [Google Scholar] [CrossRef]
- Al-Wakeel, S.A.M.; Dadoura, S.S.; Hamed, A.A. Interactive effects of water stress and gibberellic acid on mineral composition of fenugreek plant. Egypt. J. Physiol. Sci. 1994, 18, 269–272. [Google Scholar]
- Ansari, H. Effect of Some Phytohormones and NPK on Growth and Metabolism of Mustard. Ph.D. Thesis, Aligarh Muslim University, Aligarh, India, 1996. [Google Scholar]
- Daie, J.; Watts, M.; Aloni, B.; Wyse, R.E. In vitro and in vivo modification of sugar transport and translocation in celery by phytohormones. Plant Sci. 1986, 46, 35–41. [Google Scholar] [CrossRef]
- Estruch, J.J.; Peretó, J.G.; Vercher, Y.; Beltrán, J.P. Sucrose loading in isolated veins of Pisum sativum: Regulation by abscisic acid, gibberellic acid, and cell turgor. Plant Physiol. 1989, 91, 259–265. [Google Scholar] [CrossRef] [PubMed]
- Mulligan, D.R.; Patrick, J.W. Gibberellic-acid-promoted transport of assimilates in stems of Phaseolus vulgaris L. Planta 1979, 145, 233–238. [Google Scholar] [CrossRef] [PubMed]
- Soundy, P.; Cantliffe, D.J.; Hochmuth, G.J.; Stoffella, P.J. Management of nitrogen and irrigation in lettuce transplant production affects transplant root and shoot development and subsequent crop yields. HortScience 2005, 40, 607–610. [Google Scholar] [CrossRef]
- Vetrano, F.; Miceli, C.; Angileri, V.; Frangipane, B.; Moncada, A.; Miceli, A. Effect of Bacterial Inoculum and Fertigation Management on Nursery and Field Production of Lettuce Plants. Agronomy 2020, 10, 1477. [Google Scholar] [CrossRef]
- Cleland, R.E. Introduction: Nature, occurrence and functioning of plant hormones. In Biochemistry and Molecular Biology of Plant Hormones; Hooykaas, P.J.J., Hall, M.A., Libbenga, K.R., Eds.; Elsevier: Amsterdam, The Netherlands, 1999; Volume 33, pp. 3–22. [Google Scholar]
Publisher’s Note: MDPI stays neutral with regard to jurisdictional claims in published maps and institutional affiliations. |
© 2020 by the authors. Licensee MDPI, Basel, Switzerland. This article is an open access article distributed under the terms and conditions of the Creative Commons Attribution (CC BY) license (http://creativecommons.org/licenses/by/4.0/).