Article

Climate Variables of the Sites of Origin and Genotype Influence on Phenolic Compounds Accumulation in Cultivars of Myrtus communis L.

1
Department of Agricultural Science, University of Sassari, Via De Nicola 9, 07100 Sassari, Italy
2
Institute of the Sciences of Food Production, National Research Council of Italy, Traversa la Crucca 3, 07100 Sassari, Italy
3
Centre for Conservation and Evaluation of Plant Biodiversity, University of Sassari, Via De Nicola 9, 07100 Sassari, Italy
*
Author to whom correspondence should be addressed.
Horticulturae 2022, 8(10), 928; https://doi.org/10.3390/horticulturae8100928
Submission received: 11 August 2022 / Revised: 27 September 2022 / Accepted: 6 October 2022 / Published: 10 October 2022
(This article belongs to the Section Fruit Production Systems)

Abstract

:
Myrtle (Myrtus communis L.) is an aromatic and medicinal plant spreading in the Mediterranean area. The main uses of myrtle plants are liqueur and essential oil production with several biological properties. A large part of the properties of these products is due to phenolic compounds. Twenty-two myrtle cultivars originating from several areas of Sardinia Island and cultivated at the same site were analysed for phenolic compounds determination. Pearson’s correlation was used to investigate a possible correlation between phenolic compounds content observed in the cultivation site and historical agrometeorological parameters in the sites of cultivar origin. Hierarchical cluster analysis (HCA) and principal component analysis (PCA) were applied to data to evaluate the characterization of myrtle cultivars based on the relationship between sites of origin with their climate traits and phenolic compounds content as recorded in the same field of comparison. Anthocyanins are negatively correlated with minimum, maximum, and average temperatures of some months. Total phenols content decreases with high temperatures in the summer months. Rainfall affected mainly tannins content. Two principal components explained about 79% of the variability and allowed the classification of cultivars into four groups, while cultivars from Laconi, Siniscola and Cuglieri sites were not included in any group. The HCA allowed the subdivision of the wild populations into three clusters.

1. Introduction

The content and composition of plant phenolic compounds can be influenced by genotype, growth factors, state of plant (plant age, phytosanitary status, development, and ripening stages), agricultural management, postharvest conditions, and food processing methods. Moreover, the plants increase the accumulation of these compounds under environmental stresses [1,2]. Among growth factors, climatic conditions (e.g., temperature, radiation, and rainfall) of plant habitat, play a key role in plant metabolism.
Most phenolic compounds originated from phenylpropanoid metabolism. Phenylalanine is a common substrate of phenolic compounds, and subsequently, there are different branches of the metabolism leading to different compounds, through reactions catalysed by several enzymes.
It has been well proven that climate traits can influence the phenolic compounds’ biosynthesis as well as their accumulation and qualitative composition in plant organs. Guo et al. [3] suggested that the increase in phenolic compounds concentration during biotic and abiotic stresses was due to an increase in PAL gene expression and PAL enzyme activity, thus providing the substrate for other reactions.
Several studies are based on the influence of one or more environmental factors on levels of gene expression involved in this pathway according to experiments carried out under controlled conditions, while other observations are based on the simple influence of the environmental factors as recorded in growing localities. In red orange, low-temperature storage (4 °C) increased 40 times with respect to control storage (25 °C) transcription levels of genes directly involved in anthocyanins biosynthesis: PAL (phenylalanine ammonia-lyase), CHS (chalcone synthase), DFR (dihydro-flavonol reductase), and UFGT [4]. Anthocyanin biosynthesis in some apple cultivars was positively affected by UV-B radiation [5], while low temperatures reduced anthocyanins genes transcripts in apple peel [6]. Moderate levels of water stress, also, affected gene expression levels. In the “Tannat” grape cultivar, a low leaf water potential during harvest time increases CHS, DFR, and F3H (flavanone 3-hydroxylase) gene expression with consequently higher anthocyanins content [7]. Another research on grapes showed early and high expression levels of F3H, DFR and UFGT (anthocyanidin 3-O-glucosyltransferase) flavonoids and anthocyanins genes when water stress was present [8]. Water stress led to the synthesis of ABA with consequent accumulation of anthocyanins [8]. Additionally, condensed tannins are affected by water stress [9]. The growing season can affect phenolic compound accumulation. Xu et al. [10] showed higher total phenols and anthocyanins content in grape berries during the winter season with respect to the summer one. In pigmented lettuce leaves phenols and flavonoid content was affected by radiation and temperature [11]. In grapes, when the maximum temperatures do not overcome 35 °C the anthocyanins accumulation is favoured [12].
A comparative study on Prunella vulgaris L. plants, cultivated in Italy and Hungary, showed that total phenols content was higher in the Italian population, characterised by higher average temperatures in spring and winter with respect to Hungary [13].
The profile and the concentration of secondary metabolites may be used as a genotypic marker, to identify the site of origin of the cultivars or as an index of produce quality. Phenolic compound accumulation depends on the interaction among genotype and environmental factors whereas some quality aspects can be specific for the genotypes [9]. For example, phenolic compound profiles can be used as botanic and geographic markers in Polish honey [14]. Derived products obtained with kiwifruit cultivars, originating from five China regions, can be tracked using their phenolic profile [15].
Myrtle berry contains high amounts of phenolic compounds that have been ascribed as responsible for their antioxidant and biological properties [16,17,18,19]. Myrtle is a thermophilic specie, that spontaneously spreads in the coastal areas of southern Italy and in Sardinia, limiting its area below 800 m of altitude [20]. Myrtle has a good capacity for adaptation to adverse conditions, like other shrubs of the Mediterranean area. In Sardinia, berries, and leaves (to a less extent), are used for liqueur production, and widely exported to other countries. During the domestication process, spontaneous germplasm variability in Sardinia was evaluated by analysing populations from many areas [21]. Afterwards, the most interesting cultivars were agamically propagated and cultivated in an experimental field [20]. During this process, the influence of geographic locality and long-historical temperature and rainfall data on myrtle genetic variability was studied by Mele et al. [22].
Iranian myrtle chemotypes were classified according to the bioactive compounds of essential oils and natural habitats [23]. In myrtle berries, Barboni et al. [19] showed that polyphenols content is affected by sampling site and year. To prevent food fraud, it is necessary to characterize food’s geographical origin and its quality with appropriate techniques [24]. In previous research on myrtle [25], chemometrics tools, such as principal component analysis (PCA) and hierarchical cluster analysis (HCA) were used to evaluate the influence of environmental and geographical area on berries’ chemical composition. These authors based on the concentrations of total phenols, total anthocyanins and anthocyanins profile classified 14 myrtle Spanish ecotypes into two clusters separated according to the geographical area [25]. The berry anthocyanins profile of Sardinian myrtle selected cultivars, also, was used to evaluate the origin geographical influence [26].
The Sardinian climate is typically maritime Mediterranean, characterized by rainy and mild winters and by dry and hot summers [27]. In winter and autumn, the highest rainfall occurs, with annual averages of 733 mm [28]. Caloiero et al. [28] studying Sardinian rainfall data from 1922 to 2011, observed a reduction of rainfall in winter and an increase in the summer months. Regarding temperatures, the average annual temperature is 23 °C with extreme values below 0 °C in winter and over 40 °C in summer, as reported by Caloiero et al. [28]. In Sardinia, the altitude ranged from sea level to 1834 m above sea level [28]. Moreover, the rainfall is affected by the orography. The orography of Sardinia consisted of two flat areas, in the northwest and in the south and by mountains and alluvial valleys [29].
The aim of this study was to evaluate the effect of climatic parameters of the sites of origin of 22 selected cultivars of myrtle on the concentration of total phenols, anthocyanins, and tannins in berries as recorded in the same collection field. The agrometeorological parameters of a twenty-three-year period for each origin site were considered, and their influence on phenolic compounds was evaluated using hierarchical cluster analysis, principal component analysis and Pearson’s correlation analysis.

2. Materials and Methods

2.1. Plant Material and Agrometeorological Data

Berries were collected from plants growing in the same experimental field of the University of Sassari (Province of Oristano, Central Western Sardinia 39°54′12″ N, 8°37′19″ E).
The ripe berries of 22 myrtle (Table 1) cultivars originating from nine areas of Sardinia (Italy: from 38°51′ to 41°15′ N, and from 8°8′ to 9°50′ E) were analysed (Figure 1). Ten cultivars were selected from the Rumanedda site, four cultivars were from Capoterra, and two cultivars were from Bosa site. For the other sites one cultivar was analysed (Cuglieri, Laconi, Isili, Siniscola, Telti and Monti).
The cultivars derived from a domestication process that began in 1995 in Sardinia, Italy [30]. This process included in situ biometric and morphological study of 130 candidate mother plants, selected and sampled in different locations of Sardinia. From these 130 candidate selections, after softwood cutting propagation and nursery management, 42 cultivars were selected to constitute a comparison field in 1998. Softwood cuttings were treated with 1.0% of indole butyric acid and placed in a rooting perlite bed for 3–4 weeks. After rooting, cuttings were placed in pots, and after one year of nursery growth, planted in the catalogue field. Here, plants were arranged in rows 3.15 m from each other, while on the row the distance was 1 m. The field was managed with total grassing and irrigation supply with a drip system for a season volume of 1.250 m3 per hectare.
In the experimental field, each selected cultivar was represented by a single plot of 20 plants. Each plot was divided into 3 sub-plots each comprising 5 plants. The remaining 5 plants in the plot were not considered in the sampling because they were border plants. From each sub-plot, 50 berries were randomly sampled, each constituting one biological replicate for a total of 3 biological replicates. “Grazia” and “Angela” cultivars showed unpigmented berries at ripe, while all other cultivars have pigmented berries.
For each cultivar, berries ripening time was established after a preliminary study on the maturation dynamic of berries during five seasons. The study of ripening time of berries of every cultivar was established after a preliminary study of the maturation dynamic of berries during five seasons. According to the study of Fadda and Mulas [31] the optimal harvest time is scheduled when the anthocyanins content of berries reaches the maximum peak and the tannins significantly decreased. This critical point is accompanied for every cultivar by particular intensity of peel colouration, partial pulp colouration, and reduction of the peduncle retention force. Unpigmented cultivars showed peel colour turning from light green to yellow and a significant reduction of the peduncle retention force. After these statements’ myrtle berries were sampled and analysed for the present study in the years 2010, 2011 and 2012. Considering the absence of statistically significant differences among the three years (Table S1), only the data from 2011 were used for the present elaboration.
Twenty-three-year meteorological data, from 1988 to 2011, were used for the analysis. Data were obtained from website Hydrographic Service of the region Sardinia using historical records of nine meteorological stations associated with the sites of origin of cultivars [32]. Agrometeorological data were maximum, minimum, and average monthly temperatures, annual average temperature, and monthly and annual rainfalls (Tables S2–S5). In addition, the altitude of each locality has been evaluated.

2.2. Preparation of Extracts

The extract for the determination of phenolic compounds was prepared by mixing 10 g of grounded berries in 100 mL of acidified methanol (1% HCl). The mixture was stirred for 12 h in the dark at room temperature and then filtered to remove solid biomass.

2.3. Determination of Total Phenols, Tannins, and Anthocyanins

Total phenols content was determined using the Folin–Ciocalteu colourimetric method [33], apportioning some modifications. A mixture, with 0.5 mL of methanolic acidified extract, 35 mL of deionized water and 2.5 mL of Folin–Ciocalteu reagent, was incubated for 3 min at room temperature. Then, 5 mL of sodium carbonate solution (20% in water) was added to the mixture. The solution was incubated at 70 °C for 20 min and deionized water was added to bring a final volume of 50 mL. Absorbance reading was carried out 750 nm, using a CARY 50 Scan Uv–Vis VARIAN (Amsterdam, The Netherlands) spectrophotometer. Total phenols concentration was expressed as mg of acid gallic eq. (GAE)/100 g of fresh weight (FW). Total tannins and total anthocyanins were determined as reported by Fadda and Mulas [31].
For tannins determination, ethanol (2 mL) and vanillin solution (4 mL) (1% vanillin in 70% sulphuric acid) were added to the diluted extract (4 mL). After 30 min of incubation the absorbance was read at 500 nm using CARY 50 Scan Uv–Vis VARIAN spectrophotometer (Amsterdam, The Netherlands). For calibration curve a range of 0.05–0.5 mg/mL of catechin was used, and the results were expressed as mg of catechin (CE)/100 g FW.
To determine total anthocyanins content, an aliquot of 1 mL of the appropriately diluted extract was added to the reaction solution containing 1 mL of acidified ethanol and 10 m of HCl 1 N. After 30 min of incubation, the absorbance was read at 525 nm against a prepared blank containing 1 mL of diluted extract, 1 mL of acidified ethanol and 10 mL of a pH 3.5 buffer solution. The plotted absorbance of malvidin solutions ranging from 0.05 to 0.5 mg/mL was used to calculate the calibration curve. The results were expressed as mg of malvidin 3-glucoside (M3G)/100 g FW.

2.4. Statistical Analysis

A one-way ANOVA (cultivar fixed variable) was performed using the MSTAT-C program (Michigan State University, East Lansing, MI, USA). Mean separation was performed by Tukey’s test (p < 0.05) and correlation test (R) at two levels of significance p < 0.05 and p < 0.01 was carried out.
PCA and HCA were applied using data phenolic compound content analysed (total phenols, anthocyanins, and tannins) and all agrometeorological parameters using SIMCA software (Sartorius Company, Goettingen, Germany).

3. Results

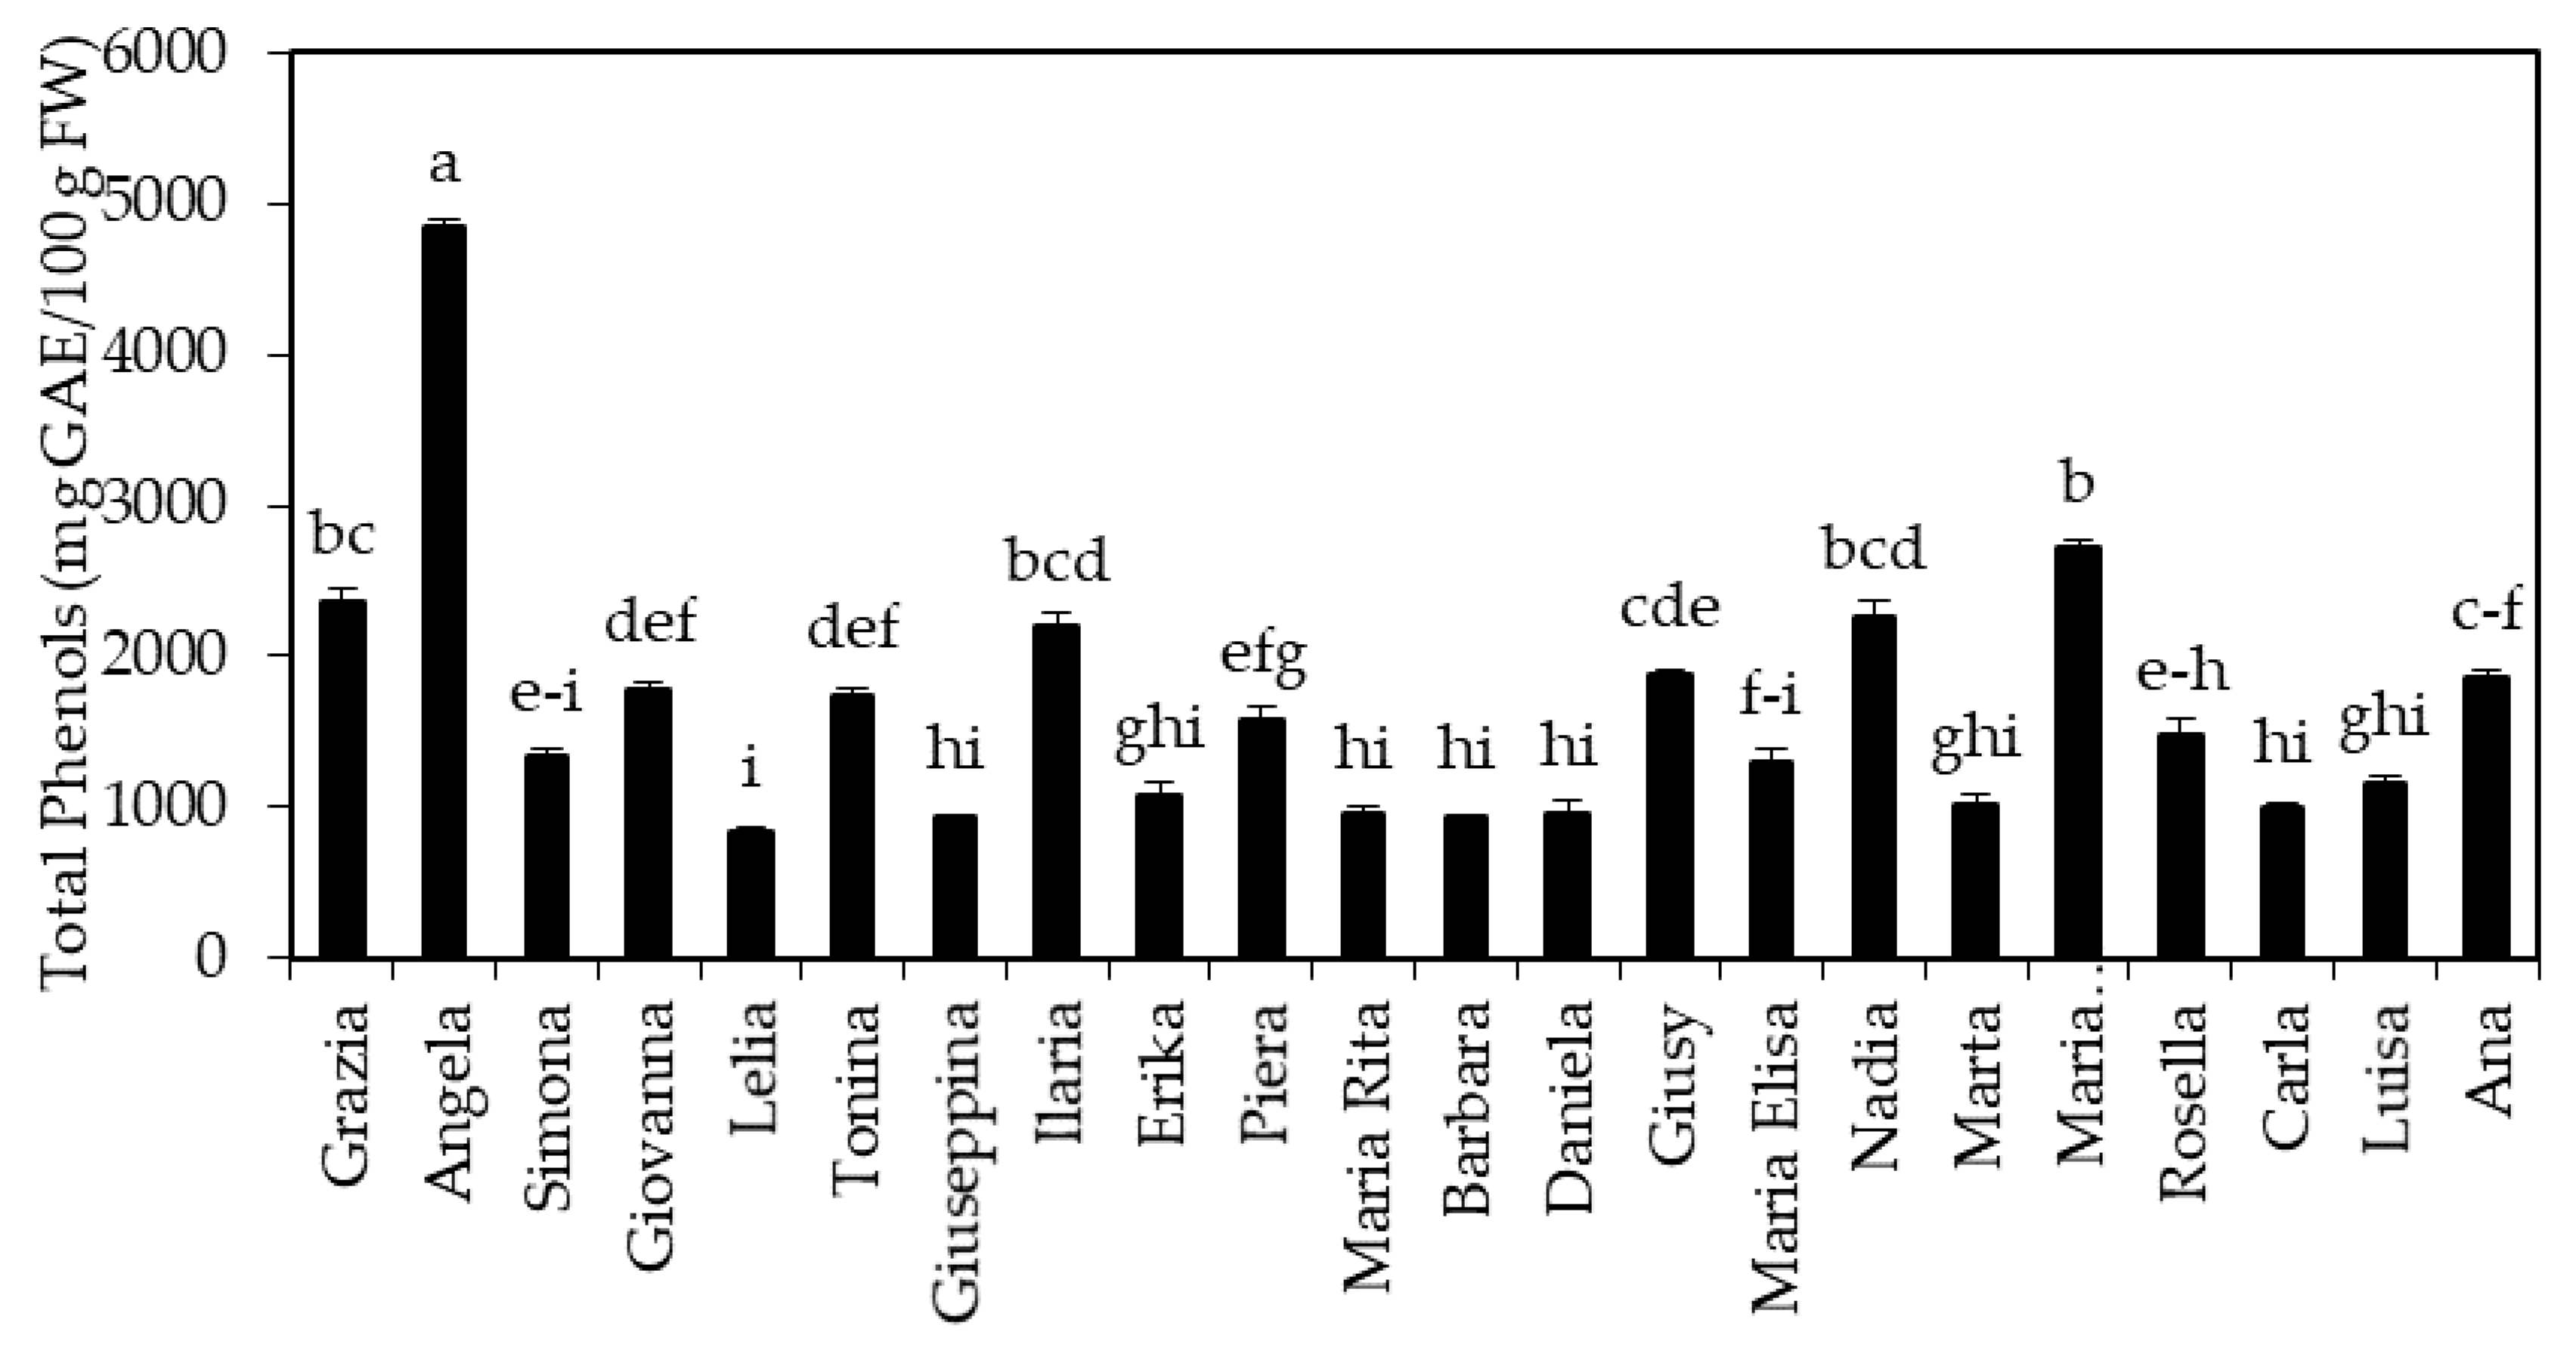
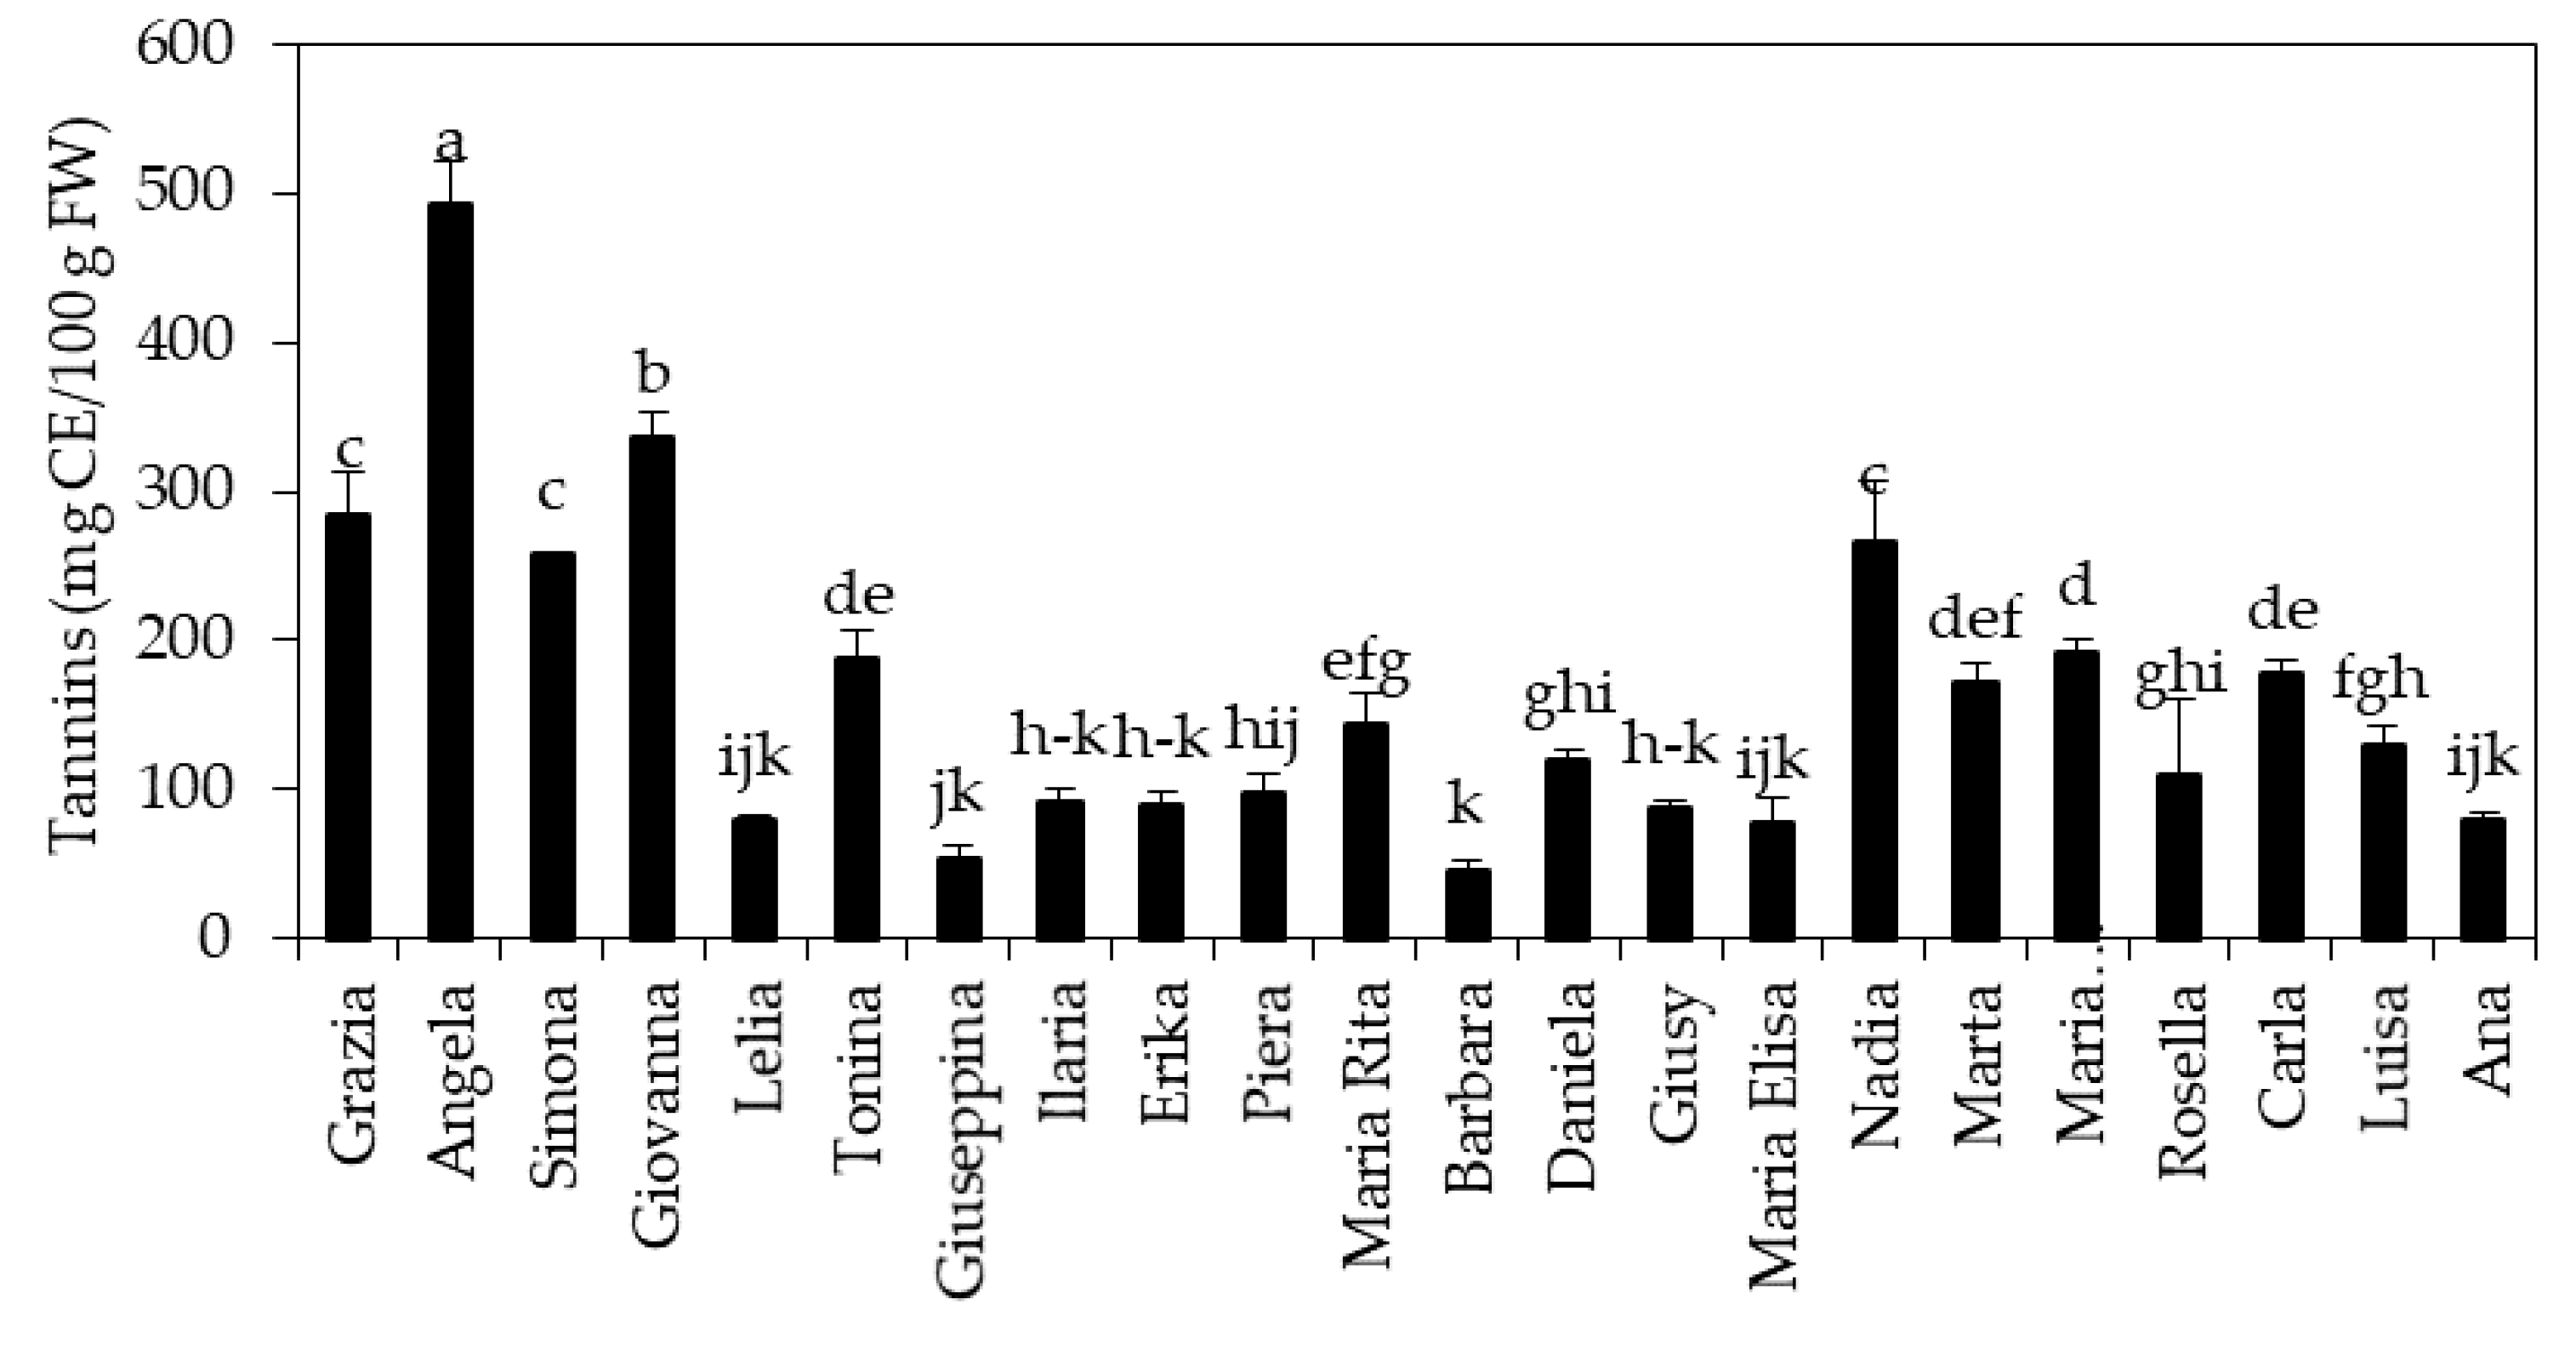
3.1. Concentration of Phenolic Compounds

The highest content of total phenols was found in the unpigmented “Angela” cultivar with 4299.25 mg GAE/100 g FW. In the cultivars originating from the Rumanedda group, “Ilaria” and “Grazia” showed the highest values, with 861.84 and 2098.57 mg GAE/100 g FW, respectively, while for the other cultivars the content ranged from 861.64 for “Lelia” to 1710.68 mg GAE/100 g FW for “Tonina” (Figure 2).
Cultivars from Capoterra had a concentration of total phenols close to about 900 mg GAE/100 g FW, except for “Giusy”, which showed a content of 1884.20 mg GAE/100 g FW. For “Sofia” cultivar total phenols content was 1369.54 mg GAE, for “Nadia” of 2334.72 mg GAE/100 g FW, and for “Marta” 1076.01 mg GAE/100 g FW. Other observed values were: 2611.90, 1339.07, 1053.15, 1060.83 and 2199.73 mg GAE/100 g FW, respectively, for “Maria Antonietta”, “Rosella”, “Carla”, “Luisa” and “Ana” (Figure 2).
Total anthocyanins were not detected in unpigmented “Grazia” and “Angela” cultivars. The pigmented cultivars with the highest anthocyanin content were “Piera” with 1245.03 mg and “Rosella” with 876.29 mg M3G/100 g FW. The range of other cultivars varied from 342.80 mg M3G/100 g FW for “Giusy” to 864.41 mg M3G/100 g FW for “Marta” (Figure 3).
Regarding tannin content, “Angela” showed the highest value with 456.55 mg CE/100 g FW, while the lowest one has been detected in “Giusy” with 46.23 mg CE/100 g FW. The content of the other cultivars was comprised between 456.55 for “Angela” and 53.75 for “Giuseppina” mg CE/100 g FW (Figure 4).

3.2. Agrometeorological Parameters of the Sites of Origin of the Cultivars

The sites of origin were located in a wide range of altitudes, from 40 m a.s.l. for Siniscola to 707 m a.s.l. for Laconi. Laconi, Monti and Isili sites were situated at the highest altitudes, respectively, at 707, 523 and, 506 m a.s.l. Rumanedda site was situated at 45 m a.s.l., while Capoterra and Cuglieri were at 151 and 235 m a.s.l (Table 1).
Regarding temperatures, the highest values were recorded for all collection sites from June to September. The highest temperature (33.3 °C) was recorded in Capoterra in August, whereas the lowest maximum temperatures were recorded in Isili (9.5 °C) and Telti (9.9 °C) in January (Table S2).
The lowest minimum temperatures were recorded in the Laconi site (1.5 °C) in February. The highest minimum values were reported for Capoterra in August (21.8 °C) (Supplementary Table S3). The average temperatures ranged between a minimum of 6.10 °C recorded for Laconi in January and a maximum of 24.6 °C for Capoterra in August (Table S1).
Supplementary Table S4 reports the trend of average, minimum, maximum temperature, and rainfall for each site (Rumanedda, Capoterra, Laconi, Bosa, Cuglieri, Isili, Siniscola, Monti, and Telti).
The average monthly rainfall varied between 46.2 mm for Capoterra and 152.2 mm for Cuglieri. November and December are the months with high mm of rainfall recorded, however, in July and August, the minimum rainfalls were registered. At the Rumanedda (RUM group) site the amount of rainfall was highest in November (113 mm) and low in July (5 mm). The same trend was reported for the Capoterra site with max rainfall of 79.7 mm and a minimum of 4.4 mm. The monthly rainfall at the Laconi site was relatively high, except in July and August months. In some sites, such as Telti, Monti and Siniscola, the rainfall was lower in June than in August while as found for the other sites the maximum was reached in winter months.

3.3. Correlations between Phenolic Compounds and Agrometeorological Data and Chemometric Analysis

The content of total phenols was negatively correlated with maximum temperatures in June (p < 0.05), July (p < 0.01), and August (p < 0.05). The content of tannins was negatively correlated with rainfall in March (p < 0.05), April (p < 0.01), September (p < 0.05), and November (p < 0.05) (Table 2). The altimetry of the site of origin was positively related to the content of anthocyanins (p < 0.05), and negatively to tannins content (p < 0.05) (Table 3).
Anthocyanin content in ripe berries was negatively correlated with the average temperatures of January, February, November, and December (p < 0.05); and with maximum temperatures of October, November, and December (p < 0.05) (Table 2). Moreover, anthocyanins content was negatively correlated with minimum temperatures in January, February, March, April, May, November, and December (p < 0.05), and positively with the rainfall in July (p < 0.05) (Table 3).
Chemometric analysis was carried out to evaluate the correlation between phenolic compounds in myrtle berries and the site of origin of cultivars considering some climatic traits.
The PCA allowed us to identify two main components that explained 79.07% of the total variability (Figure 5). The first component (PC1) contributed to 69.5% of the total variability while the second component (PC2) contributed 10.2%. In addition, PCA allowed the separation of samples into four main groups according to the area of origin. “Sofia”, “Carla” and “Maria Antonietta” cultivars were not included in any of these groups.
The HCA was carried out to evaluate the Euclidean distance among cultivars. Based on similarity, three clusters were identified. The first cluster included cultivars originating from Rumanedda, Capoterra, Siniscola and Bosa. The second cluster included only “Sofia” cultivar originating from Laconi, while the third one included cultivar originating from Isili, Monti and Telti (Figure 6). With HCA populations were divided into three clusters. “Maria Elisa” “Rosella”, “Luisa”, and “Ana” belong to the same cluster. “Maria Antonietta”, “Nadia” and “Marta” belong to another cluster, while all other cultivars are combined in a single cluster.

4. Discussion

In this research, 53 agrometeorological variables were considered to evaluate the influence of the environment on the concentration of total phenols, anthocyanins, and tannins in myrtle berries. The relationship between berry quality and climatic parameters was investigated using historical meteorological data of the Sardinian region (Tables S2–S5). There are significant differences among cultivars and berry content of total phenols, anthocyanins and tannins, and these differences were also found among cultivars originating from the same area (Figure 2, Figure 3 and Figure 4). It has been described that bioactive compound content in maqui fruit was affected both by genotype and growing locality [34]. Thus, studying climatic traits of growing locality and their influence on the accumulation of these compounds can be useful to choose the cultivation site to obtain fruit with high phenolic compounds production. The analysed cultivars originated from nine Sardinian localities with different thermal and rainfall trends (Table 1).
Despite the peel of pigmented berry genotypes being rich in anthocyanins (Figure 3), a negative correlation between total phenols and anthocyanins was found (−0.53, p < 0.05), suggesting that tannins more than anthocyanins might give a greater contribution to total phenols. This was confirmed by the positive correlation calculated between total phenols and tannins (0.72, p < 0.05). Moreover, it is important to point out that we analysed the whole berry including seeds rich in tannins. Tannin content was also negatively correlated with anthocyanins content (−0.49, p < 0.05).
The total phenols content was negatively correlated with maximum temperatures in June (−0.276, p < 0.05), July (−0.353, p < 0.01), and August (−0.254, p < 0.05). In leaves, high temperatures lessen total phenol content, due to photosynthesis reduction [11]. Treatment with high temperatures in apple decreases total phenols content, leading to oxidation and loss of nutritional values [35]. Shaded conditions decrease the photosynthetic activity with a consequent low substrate for the biosynthesis of secondary metabolism [36].
Anthocyanin’s content was more affected by temperature than total phenols. Anthocyanin content was negatively correlated with the average temperatures of winter months such as January (−0.287, p < 0.05), February (−0.245, p < 0.05), November (−0.261, p < 0.05), and December (−0.270, p < 0.05). Moreover, a negative correlation between maximum temperatures of October, November and December and anthocyanins was found. A negative correlation was also found between minimum temperatures of January, February, March, April, May, November, and December with anthocyanins content. From this work, it emerged that in myrtle berries the accumulation of anthocyanins is affected negatively by temperature parameters.
In grape berries, high temperatures negatively affected the anthocyanins accumulations [12,37], due to a lower anthocyanin gene expression level or anthocyanins degradation. Another study on grapes indicated that anthocyanin accumulation is negatively related to temperature from veraison to ripening, showing that the cultivars respond in a different way to climatic parameters [38]. In pomegranates, anthocyanin accumulation was inversely correlated to season temperatures, and also qualitative composition was affected by climate conditions. The authors have found that the glycosylation of anthocyanins depends on temperatures [39].
Total phenols in this work are not affected by rainfall unlike anthocyanins and tannins content. Anthocyanins were positively correlated with rainfall of July (0.256, p < 0.05). Summer months in Sardinian are characterised by dry summers with scarce rainfalls. We suppose that a moderate supply of water can favour anthocyanins accumulation in myrtle rather than high rainfall, although we found a significant correlation only with the rainfall of July. As previously reported for temperature, the influence of rainfall on anthocyanins accumulation and other compounds is largely dependent on cultivars [9]. Previous works showed the positive effects of low precipitation levels on anthocyanins accumulations [9,37]. Ferrer et al. [37] suggested that the anthocyanins increase is associated with water stress and may be also dependent on a cloudy day and a lower light. Correlations between rainfall over several months and tannin content were found. Tannins are negatively correlated with rainfall of March (−0.253, p < 0.05), April (−0.320, p < 0.01), and September (−0.287, p < 0.05) and positively with November (0.244, p < 0.05). As reported previously, temperatures did not affect the tannin content in myrtle. According to our results, previous work showed that factors such as water availability or light had more effect on tannins accumulations than temperature [40]. In contrast to our work, Bucchetti et al. [41] found that water stress increases the tannins content to a lesser extent than anthocyanins accumulation.
Altitude is a key parameter affecting the bioactive compounds in fruit and in other plant organs. Sites located at high altitudes are characterized by low temperatures and high light availability. An influence of altitude on anthocyanins and tannins myrtle content was found, and altitude is positively correlated to anthocyanins content (0.265, p < 0.05) and negatively with tannins content (−0.274, p < 0.05). According to our result, the tannin content of full-ripe pomegranate was negatively correlated with altitude [42]. A positive correlation between altitude and tannin content in bilberry fruit was found, despite the explanations of this correlation must be clarified [43]. In our work, plants that evolved or were selected from high altitude regions, when grown among other cultivars from other altitudes all at the same site, show greater anthocyanin expression. The influence of altitude on the phenolic compound’s accumulation is different among species. Moreover, differences for the same species were found by different authors. For example, in bilberry fruit light availability affected positively anthocyanins synthesis [36]. Contrarily, a negative correlation between altitude and anthocyanins synthesis in bilberry and in common elder was found by Rieger et al. [44] Instead, in another study on bilberry, Roslon et al. [45] found differences among anthocyanin content in cultivars grown in different habitats but no correlation with altitude was found. Anthocyanin’s concentration increased with rising altitudes in Vaccinium uliginosum berry [46] and in apple peel [47].
In addition to climate, other abiotic factors may also influence the content of secondary metabolites. From this point of view, myrtle is a species that has a well-defined range, making these variables less relevant than the climatic factor. In wild populations, myrtle prefers neutral and sub-acidic soils, with an elevation range below 800 m a.s.l. Moreover, it is sensitive to strong winds and demanding for soil moisture content.
The PCA allowed us to explain about 80% of the variability with two main components. The first main component (PC1) contributes to 69.5% of the total variability while the second component (PC2) contributes to 10.2% of the variability. In addition, it allowed samples to separate into four groups according to origin area. Cultivars originating from the Capoterra area belong to the same groups, as well as cultivars originating from Capoterra and Bosa sites. Populations originating from Telti, Monti and, Isili are grouped in the same group (Figure 5), while cultivars from Laconi, Siniscola and Cuglieri sites are not classified in any group.
The myrtle cultivars were divided into three clusters using HCA (Figure 6). The first cluster includes cultivars originating from Laconi (“Maria Elisa”), Isili (“Rosella”), Monti (“Luisa”) and Telti (“Ana”). These localities are located at the highest altitude, ranging from 707 m a.s.l to 523 m a.s.l, only the sampling of “Monti” is situated at 103 m a.s.l. Monti and Telti are located at about 8 km of distance, but the sampling in Monti was carried out at the lowest point of the area. The second cluster includes three cultivars “Nadia” and “Marta” originating from Bosa and, “Maria Antonietta” from Cuglieri. The populations originating from Rumanedda, located at 45 m a.s.l. (“Grazia”, “Angela”, “Simona”, “Giovanna”, “Lelia”, “Tonina”, “Giuseppina”, “Ilaria”, “Erika”, “Piera”) and Capoterra, located at 151 m a.s.l. (“Maria Rita”, “Barbara”, “Daniela”, “Giusy”) are included in the same cluster.
A preliminary study on gene expression in myrtle berries analysing two cultivars from the same area of origin was carried out [48]. To better understand the relationship between the environment and phenolic compounds in myrtle plants, studies at the molecular level are necessary. A future step is to study gene expression levels involved in flavonoids and anthocyanins biosynthesis in plants growing in different areas and their relationship with climatic parameters. These studies will provide information on the cultivation of myrtle genotypes with high potential for the production of bioactive compounds.

5. Conclusions

In this study, we have evaluated the influence of climatic traits of the sites of origin of 22 myrtle cultivars actually growing in the same field on berries’ total phenols, anthocyanins and tannins. Phenolic compounds contribute to the biological properties of the myrtle plant, as well as to the organoleptic characteristics and stability of myrtle liqueur. The overall results indicated that the high temperature of the site of origin has a negative effect on phenolic compound accumulation. The anthocyanins content increase with altitude and are negatively affected by temperatures. The main climatic parameter affecting tannin content in myrtle berries was rainfall. Moreover, with multivariate analysis, a correlation between the climatic parameters of the origin site and the phenolic compounds analysed was found. This information is useful for the choice of cultivation site for myrtle biomass for the pharmaceutical and food industries.

Supplementary Materials

The following supporting information can be downloaded at: https://www.mdpi.com/article/10.3390/horticulturae8100928/s1, Table S1. ANOVA analysis output of myrtle berry composition according to a split-plot design, using the cultivars and the years as main sources of variability. Table S2. Average monthly temperatures, from January to December, collected for a period of twenty years (1988–2011) for all sites of origin of the analysed cultivars. Table S3. Maximum monthly temperatures, from January to December, collected for a period of twenty years (1988–2011) for all sites of origin of the analysed cultivars. Table S4. Minimum monthly temperatures, from January to December, collected for a period of twenty years (1988–2011) for all sites of origin of the analysed cultivars. Table S5. Monthly rainfall, from January to December, collected for a period of twenty years (1988–2011) for all sites of origin of the analysed cultivars.

Author Contributions

Conceptualization, M.M. and S.M.; methodology, M.M., A.F. and S.M.; software, A.F. and S.M.; validation, M.M., formal analysis, S.M.; investigation, M.M. and S.M.; resources, M.M.; data curation, M.M., A.F. and S.M.; writing—original draft preparation, S.M.; writing—review and editing, M.M., A.F. and S.M.; visualization, M.M.; supervision, M.M.; project administration, M.M.; funding acquisition, M.M. All authors have read and agreed to the published version of the manuscript.

Funding

This work was funded by the FAR2020MULAS found, and by the project SYSTEMIC “An integrated approach to the challenge of sustainable food systems adaptive and mitigatory strategies to address climate change and malnutrition”, Knowledge hub on Nutrition and Food Security, in a joint action of JPI HDHL, JPI OCEANS and FACCE JPI launched in 2019 under the ERA NET ERA HDHL (n 696295).

Conflicts of Interest

The authors declare no conflict of interest.

References

  1. De Pascual-Teresa, S.; Sanchez-Ballesta, M.T. Anthocyanins: From plant to health. Phytochem. Rev. 2008, 7, 281–299. [Google Scholar] [CrossRef]
  2. Anttonen, M.J.; Hoppula, K.I.; Nestby, R.; Verheul, M.J.; Karjalainen, R.O. Influence of fertilization, mulch color, early forcing, fruit order, planting date, shading, growing environment, and genotype on the contents of selected phenolics in strawberry (Fragaria× ananassa Duch.) fruit. J. Agric. Food Chem. 2006, 54, 2614–2620. [Google Scholar] [CrossRef] [PubMed]
  3. Guo, J.; Han, W.; Wang, M. Ultraviolet and environmental stresses involved in the induction and regulation of anthocyanin biosynthesis: A review. Afr. J. Biotechnol. 2008, 7, 25. [Google Scholar]
  4. Lo Piero, A.R.; Puglisi, I.; Rapisarda, P.; Petrone, G. Anthocyanins accumulation and related gene expression in red orange fruit induced by low temperature storage. J. Agric. Food Chem. 2005, 53, 9083–9088. [Google Scholar] [CrossRef]
  5. Ubi, B.E.; Honda, C.; Bessho, H.; Kondo, S.; Wada, M.; Kobayashi, S.; Moriguchi, T. Expression analysis of anthocyanin biosynthetic genes in apple skin: Effect of UV-B and temperature. Plant Sci. 2006, 170, 571–578. [Google Scholar] [CrossRef]
  6. Lin-Wang, K.U.I.; Micheletti, D.; Palmer, J.; Volz, R.; Lozano, L.; Espley, R.; Iglesias, I. High temperature reduces apple fruit colour via modulation of the anthocyanin regulatory complex. Plant Cell Environ. 2011, 34, 1176–1190. [Google Scholar] [CrossRef]
  7. Borsani, O.; Gonzalez-Neves, G.; Ferrer, M.; Monza, J. Anthocyanins accumulation and genes-related expression in berries of cv. Tannat (Vitis vinifera L.). J. Appl. Hortic. 2010, 12, 3–9. [Google Scholar] [CrossRef] [Green Version]
  8. Castellarin, S.D.; Matthews, M.A.; Di Gaspero, G.; Gambetta, G.A. Water deficits accelerate ripening and induce changes in gene expression regulating flavonoid biosynthesis in grape berries. Planta 2007, 227, 101–112. [Google Scholar] [CrossRef]
  9. Costa, C.; Graça, A.; Fontes, N.; Teixeira, M.; Gerós, H.; Santos, J.A. The interplay between atmospheric conditions and grape berry quality parameters in Portugal. Appl. Sci. 2020, 10, 4943. [Google Scholar] [CrossRef]
  10. Xu, C.; Zhang, Y.; Zhu, L.; Huang, Y.; Lu, J. Influence of growing season on phenolic compounds and antioxidant properties of grape berries from vines grown in subtropical climate. J. Agric. Food Chem. 2011, 59, 1078–1086. [Google Scholar] [CrossRef]
  11. Marin, A.; Ferreres, F.; Barbera, G.G.; Gil, M.I. Weather variability influences color and phenolic content of pigmented baby leaf lettuces throughout the season. J. Agric. Food Chem. 2015, 63, 1673–1681. [Google Scholar] [CrossRef] [PubMed]
  12. Cheng, G.; He, Y.N.; Yue, T.X.; Wang, J.; Zhang, Z.W. Effects of climatic conditions and soil properties on Cabernet Sauvignon berry growth and anthocyanin profiles. Molecules 2014, 19, 13683–13703. [Google Scholar] [CrossRef] [PubMed]
  13. Sárosi, S.; Bernáth, J.; Burchi, G.; Antonetti, M.; Bertoli, A.; Pistelli, L.; Benvenuti, S. Effect of different plant origins and climatic conditions on the total phenolic content and total antioxidant capacity of self-heal (Prunella vulgaris L.). In Proceedings of the XXVIII International Horticultural Congress on Science and Horticulture for People (IHC2010): A New Look at Medicinal and 925, Lisbon, Portugal, 22–27 August 2010; pp. 49–55. [Google Scholar]
  14. Jasicka-Misiak, I.; Poliwoda, A.; Dereń, M.; Kafarski, P. Phenolic compounds and abscisic acid as potential markers for the floral origin of two Polish unifloral honeys. Food Chem. 2012, 131, 1149–1156. [Google Scholar] [CrossRef]
  15. Guo, J.; Yuan, Y.; Dou, P.; Yue, T. Multivariate statistical analysis of the polyphenolic constituents in kiwifruit juices to trace fruit varieties and geographical origins. Food Chem. 2017, 232, 552–559. [Google Scholar] [CrossRef]
  16. Giampieri, F.; Cianciosi, D.; Forbes-Hernández, T.Y. Myrtle (Myrtus communis L.) berries, seeds, leaves, and essential oils: New undiscovered sources of natural compounds with promising health benefits. Food Front. 2020, 1, 276–295. [Google Scholar] [CrossRef]
  17. Sanna, D.; Mulas, M.; Molinu, M.G.; Fadda, A. Oxidative stability of plant hydroalcoholic extracts assessed by EPR spin trapping under forced ageing conditions: A myrtle case study. Food Chem. 2019, 271, 753–761. [Google Scholar] [CrossRef]
  18. Aidi-Wannes, W.; Marzouk, B. Differences between Myrtle Fruit Parts (Myrtus communis var. italica) in Phenolics and Antioxidant Contents. J. Food Biochem. 2013, 37, 585–594. [Google Scholar] [CrossRef]
  19. Barboni, T.; Cannac, M.; Massi, L.; Perez-Ramirez, Y.; Chiaramonti, N. Variability of polyphenol compounds in Myrtus communis L. (Myrtaceae) berries from Corsica. Molecules 2010, 15, 7849–7860. [Google Scholar] [CrossRef] [Green Version]
  20. Mulas, M. The myrtle (Myrtus communis L.) case, from a wild shrub to a new fruit crop. Acta Hortic. 2012, 948, 235–242. [Google Scholar] [CrossRef]
  21. Mulas, M.; Cani, M.R. Germplasm evaluation of spontaneous myrtle (Myrtus communis L.) for cultivar selection and crop development. J. Herbs Spices Med. Plants 1999, 6, 31–49. [Google Scholar] [CrossRef]
  22. Mele, C.; Corona, L.; Melito, S.; Raggi, L.; Mulas, M. The genetic diversity of selections and wild populations of myrtle revealed by molecular geographic contexts. Ind. Crops Prod. 2019, 132, 168–176. [Google Scholar] [CrossRef]
  23. Rahimmalek, M.; Mirzakhani, M.; Pirbalouti, A.G. Essential oil variation among 21 wild myrtle (Myrtus communis L.) populations collected from different geographical regions in Iran. Ind. Crops Prod. 2013, 51, 328–333. [Google Scholar] [CrossRef]
  24. Piras, F.M.; Dettori, M.F.; Magnani, A. ToF-SIMS PCA analysis of Myrtus communis L. Appl. Surf. Sci. 2009, 255, 7805–7811. [Google Scholar] [CrossRef]
  25. González de Peredo, A.; Vázquez-Espinosa, M.; Espada-Bellido, E.; Jiménez-Cantizano, A.; Ferreiro-González, M.; Amores-Arrocha, A.; Barbero, G. Development of new analytical microwave-assisted extraction methods for bioactive compounds from myrtle (Myrtus communis L.). Molecules 2018, 23, 2992. [Google Scholar] [CrossRef] [PubMed] [Green Version]
  26. Sarais, G.; D’Urso, G.; Lai, C.; Pirisi, F.M.; Pizza, C.; Montoro, P. Targeted and untargeted mass spectrometric approaches in discrimination between Myrtus communis cultivars from Sardinia region. J. Mass Spectrom. 2016, 51, 704–715. [Google Scholar] [CrossRef]
  27. Canu, S.; Rosati, L.; Fiori, M.; Motroni, A.; Filigheddu, R.; Farris, E. Bioclimate map of Sardinia (Italy). J. Maps 2015, 11, 711–718. [Google Scholar] [CrossRef] [Green Version]
  28. Caloiero, T.; Coscarelli, R.; Gaudio, R.; Leonardo, G.P. Precipitation trend and concentration in the Sardinia region. Theor. Appl. Climatol. 2019, 137, 297–307. [Google Scholar] [CrossRef]
  29. Montaldo, N.; Sarigu, A. Potential links between the North Atlantic Oscillation and decreasing precipitation and runoff on a Mediterranean area. J. Hydrol. 2017, 553, 419–437. [Google Scholar] [CrossRef]
  30. Medda, S.; Mulas, M. Fruit Quality Characters of Myrtle (Myrtus communis L.) Selections: Review of a Domestication Process. Sustainability 2021, 13, 8785. [Google Scholar] [CrossRef]
  31. Fadda, A.; Mulas, M. Chemical changes during myrtle (Myrtus communis L.) fruit development and ripening. Sci. Hort. 2010, 125, 477–485. [Google Scholar] [CrossRef]
  32. RAS. 2019. Available online: https://www.regione.sardegna.it/autoritadibacino/monitoraggio/settoreidrografico/ (accessed on 27 August 2020).
  33. Singleton, V.L.; Rossi, J.A. Colorimetry of total phenolics with phosphomolybdic-phosphotungstic acid reagents. Am. J. Enol. Viticult. 1965, 16, 144–158. [Google Scholar]
  34. Fredes, C.; Yousef, G.G.; Robert, P.; Grace, M.H.; Lila, M.A.; Gómez, M.; Montenegro, G. Anthocyanin profiling of wild maqui berries (Aristotelia chilensis [Mol.] Stuntz) from different geographical regions in Chile. J. Sci. Food Agric. 2014, 94, 2639–2648. [Google Scholar] [CrossRef] [PubMed]
  35. Vega-Gálvez, A.; Ah-Hen, K.; Chacana, M.; Vergara, J.; Martínez-Monzó, J.; García-Segovia, P.; Di Scala, K. Effect of temperature and air velocity on drying kinetics, antioxidant capacity, total phenolic content, colour, texture and microstructure of apple (var. Granny Smith) slices. Food Chem. 2012, 132, 51–59. [Google Scholar] [CrossRef] [Green Version]
  36. Mikulic-Petkovsek, M.; Schmitzer, V.; Slatnar, A.; Stampar, F.; Veberic, R. A comparison of fruit quality parameters of wild bilberry (Vaccinium myrtillus L.) growing at different locations. J. Sci. Food Agric. 2015, 95, 776–785. [Google Scholar] [CrossRef] [PubMed]
  37. Ferrer, M.; Echeverría, G.; Carbonneau, A. Effect of berry weight and its components on the contents of sugars and anthocyanins of three varieties of Vitis vinifera L. under different water supply conditions. S. Afr. J. Enol. Viticult. 2014, 35, 103–113. [Google Scholar] [CrossRef]
  38. Barnuud, N.N.; Zerihun, A.; Gibberd, M.; Bates, B. Berry composition and climate: Responses and empirical models. Int. J. Biometeorol. 2014, 58, 1207–1223. [Google Scholar] [CrossRef] [Green Version]
  39. Borochov-Neori, H.; Judeinstein, S.; Harari, M.; Bar-Yaakov, I.; Patil, B.S.; Lurie, S.; Holland, D. Climate effects on anthocyanin accumulation and composition in the pomegranate (Punica granatum L.) fruit arils. J. Agric. Food Chem. 2011, 59, 5325–5334. [Google Scholar] [CrossRef]
  40. Gouot, J.C.; Smith, J.P.; Holzapfel, B.P.; Barril, C. Impact of short temperature exposure of Vitis vinifera L. cv. Shiraz grapevine bunches on berry development, primary metabolism and tannin accumulation. Environ. Exp. Bot. 2019, 168, 103866. [Google Scholar] [CrossRef]
  41. Bucchetti, B.; Matthews, M.A.; Falginella, L.; Peterlunger, E.; Castellarin, S.D. Effect of water deficit on Merlot grape tannins and anthocyanins across four seasons. Sci. Hort. 2011, 128, 297–305. [Google Scholar] [CrossRef]
  42. Mphahlele, R.R.; Stander, M.A.; Fawole, O.A.; Opara, U.L. Effect of fruit maturity and growing location on the postharvest contents of flavonoids, phenolic acids, vitamin C and antioxidant activity of pomegranate juice (cv. Wonderful). Sci. Hort. 2014, 179, 36–45. [Google Scholar] [CrossRef]
  43. Vaneková, Z.; Vanek, M.; Škvarenina, J.; Nagy, M. The Influence of Local Habitat and Microclimate on the Levels of Secondary Metabolites in Slovak Bilberry (Vaccinium myrtillus L.) Fruit. Plants 2020, 9, 436. [Google Scholar] [CrossRef] [PubMed] [Green Version]
  44. Rieger, G.; Muller, M.; Guttenberger, H.; Bucar, F. Influence of altitudinal variation on the content of phenolic compounds in wild populations of Calluna vulgaris, Sambucus nigra, and Vaccinium myrtillus. J. Agr. Food Chem. 2008, 56, 9080–9086. [Google Scholar] [CrossRef] [PubMed]
  45. Rosłon, W.; Osińska, E.; Ewelina Pióro-Jabrucka, E.; Grabowska, A. Morphological and chemical variability of wild populations of bilberry (Vaccinium myrtillus L.). Pol. J. Environ. Stud. 2011, 20, 237–243. [Google Scholar]
  46. Wang, L.J.; Su, S.; Wu, J.; Du, H.; Li, S.S.; Huo, J.W.; Wang, L.S. Variation of anthocyanins and flavonols in Vaccinium uliginosum berry in Lesser Khingan Mountains and its antioxidant activity. Food Chem. 2014, 160, 357–364. [Google Scholar] [CrossRef] [PubMed]
  47. Karagiannis, E.; Michailidis, M.; Tanou, G.; Scossa, F.; Sarrou, E.; Stamatakis, G.; Molassiotis, A. Decoding altitude-activated regulatory mechanisms occurring during apple peel ripening. Hortic. Res. 2020, 7, 1–12. [Google Scholar] [CrossRef]
  48. Medda, S.; Sanchez-Ballesta, M.T.; Romero, I.; Dessena, L.; Mulas, M. Expression of structural flavonoid biosynthesis genes in dark-Blue and White Myrtle Berries (Myrtus communis L.). Plants 2021, 10, 316. [Google Scholar] [CrossRef]
Figure 1. Sites of origin map of the studied cultivars correspond to the pale blue points. The red point corresponds to the repository of Fenosu experimental station.
Horticulturae 08 00928 g001
Figure 2. Total phenols content in berries of 22 myrtle cultivars. The results are expressed as means and standard deviation of three biological replicates. Histograms labelled with different letters indicate values significantly different (p < 0.05) according to the Tukey test. Hyphen separate a continuous range of letters.
Horticulturae 08 00928 g002
Figure 3. Anthocyanin’s content in berries of 22 myrtle cultivars. The results are expressed as means and standard deviations of three biological replicates. Histograms labelled with different letters indicate values significantly different (p < 0.05) according to the Tukey test. Hyphen separate a continuous range of letters.
Horticulturae 08 00928 g003
Figure 4. Tannins content in berries of 22 myrtle cultivars. The results are expressed as means and standard deviation of three biological replicates. Histograms labelled with different letters indicate values significantly different (p < 0.05) according to the Tukey test. Hyphen separate a continuous range of letters.
Horticulturae 08 00928 g004
Figure 5. Principal component analysis using climatic data site of origin of cultivars and total phenols, anthocyanins, and tannins content of berries.
Horticulturae 08 00928 g005
Figure 6. Hierarchal cluster analysis using climatic data sites of origin of cultivars and total phenols, anthocyanins, and tannins content of myrtle berries.
Horticulturae 08 00928 g006
Table 1. Analysed cultivars and its sites of origin in Sardinia as reported in the Figure 1. The altitudes and coordinate of the in sites of origin are reported.
Site of OriginAltitude
(m a.s.l.)
WGS84Cultivar
Rumanedda458.35484044, 40.68616703“Grazia”, “Angela”, “Simona”, “Giovanna”, “Lelia”, “Tonina”, “Giuseppina”, “Ilaria”, “Erika”, “Piera”
Monti5069.193589, 40.482492 “Luisa”
Telti1039.35427989, 40.87739254“Ana”
Siniscola409.69324407, 40.57296208“Carla”
Bosa838.49761184, 40.29915939“Nadia”, “Marta”
Cuglieri2358.56761404, 40.18907507“Maria Antonietta”
Laconi7079.05133847, 39.85371886“Sofia”
Isili5239.10765215, 39.74006983“Rosella”
Capoterra1518.96688623, 39.17913536“Maria Rita”, “Barbara”, “Daniela”, “Giusy”
Table 2. Correlation of average, maximum and minimum temperature and rainfall parameters with total phenols, anthocyanins and tannins in myrtle berry using a Pearson’s correlation at two levels of significance (** p < 0.05, * p < 0.01).
T Mean
JFMAMJJASOND
Total phenols0.009−0.019−0.045−0.044−0.086−0.04−0.216−0.192−0.104−0.0770.0150.013
Anthocyanins−0.287 *−0.245 *−0.218−0.208−0.1940.199−0.097−0.104−0.161−0.189−0.261 *−0.270 *
Tannins0.1550.1570.1200.1160.0580.157−0.145−0.1210.0620.1080.1750.185
T max
JFMAMJJASOND
Total phenols−0.062−0.063−0.071−0.062−0.083−0.276 *−0.353 **−0.254 *−0.108−0.055−0.038−0.040
Anthocyanins−0.236−0.216−0.191−0.173−0.159−0.034−0.013−0.140−0.194−0.254 *−0.264 *−0.260 *
Tannins0.1850.2010.2030.2150.200−0.019−0.184−0.1780.1390.1610.1760.185
T min
JFMAMJJASOND
Total phenols0.1130.1140.10.0990.046−0.012−0.017−0.0230.0110.0630.1060.112
Anthocyanins−0.300 *−0.272 *−0.28 4*−0.274 *−0.250 *−0.260−0.153−0.158−0.191−0.222−0.263 *−0.261 *
Tannins0.1280.1550.1040.1390.0920.0480.0590.0360.1230.1530.1720.191
Rainfall
JFMAMJJASOND
Total phenols−0.065−0.089−0.115−0.1560.1940.227−0.097−0.073−0.1090.1240.214−0.037
Anthocyanins0.13330.1640.0690.130−0.034−0.0160.256 *0.2130.2180.0350.0170.174
Tannins−0.186−0.206−0.253 *−0.320 **0.0960.156−0.188−0.127−0.287 *0.2080.244 *−0.140
Table 3. Correlation among total phenols, anthocyanins and tannins content and altitude using a Pearson’s correlation. ** p < 0.05, * p < 0.01.
Total PhenolsAnthocyaninsTanninsAltitude
Total phenols −0.53 **0.72 **−0.14
Anthocyanins −0.49 **0.27 *
Tannins −0.27 *
Publisher’s Note: MDPI stays neutral with regard to jurisdictional claims in published maps and institutional affiliations.

