Article

Rapid Detection of Moisture Content in the Processing of Longjing Tea by Micro-Near-Infrared Spectroscopy and a Portable Colorimeter Based on a Data Fusion Strategy

1
College of Bioengineering, Sichuan University of Science and Engineering, Yibin 644000, China
2
Tea Research Institute, China Academy of Agricultural Sciences, Hangzhou 310008, China
3
Key Laboratory of Tea Biology and Resource Utilization, Ministry of Agriculture, Hangzhou 310008, China
*
Authors to whom correspondence should be addressed.
These authors contributed equally to this work.
Horticulturae 2022, 8(11), 1007; https://doi.org/10.3390/horticulturae8111007
Submission received: 18 August 2022 / Revised: 26 September 2022 / Accepted: 27 October 2022 / Published: 31 October 2022
(This article belongs to the Special Issue Advances in Tea Plant Biology and Tea Quality Regulation)

Abstract

:
Moisture content (MC) is an important indicator to monitor the quality of Longjing tea during processing; therefore, it becomes more critical to develop digital moisture content detection methods for processing. In this study, based on a micro-near infrared (NIR) spectrometer and portable colorimeter, we used Longjing tea under the full processing process as the research object, and used competitive adaptive reweighted sampling (CARS) and a principal component analysis (PCA) to extract characteristic bands of spectral data as well as the principal component reduction processing of the color difference and glossiness data, respectively, combined with sensor data fusion technology to establish a quantitative prediction model of the partial least squares (PLS) for the moisture content of Longjing tea. The PLS quantitative moisture content prediction model, based on middle-level data fusion, obtained the best prediction accuracy and model robustness, with the correlation coefficient of the prediction set ( R p ) and the root mean square error of prediction (RMSEP) being 0.9823 and 0.0333, respectively, with a residual predictive deviation (RPD) of 6.5287. The results indicate that a data fusion of a micro NIR spectrometer and portable Colorimeter is feasible to establish a quantitative prediction model of the moisture content in Longjing tea processing, while multi-sensor data fusion can overcome the problem of a low prediction accuracy for the model established by single sensor data. More importantly, data fusion based on low-cost, fast, and portable detection sensors can provide new ideas and methods for real-time online detection in Longjing tea in actual production.

1. Introduction

As one of the most popular beverages in the world, tea plays an important role in people′s lives due to its health and wellness function [1]. Green tea is one of the most popular tea varieties in east Asia, and China is its largest consumer and exporter [2]. Longjing tea is the best-known green tea in China, and its processing process includes picking, spreading, a first drying, compressing and a second drying [3]. Although different types of tea are manufactured by various techniques, the essence of tea processing is a gradual dehydration with the formation of a specific flavor. Changes in the moisture content for each step seriously influences the sensory quality of Longjing tea during processing [4]; therefore, controlling the water content in a precise way will be necessary to stabilize the quality and flavor of the Longjing tea [5]. For example, harvested tea leaves are spread moderately, which is conducive to ester-type catechins transforming into non-ester-type catechins, weakening the bitterness and astringency in a tea infusion [6]. In addition, during the heating process, high-temperature-induced oxidation and the degradation of proteins, lipids and polyphenols will produce a large number of flavor compounds to determine the final sensory quality and style [7]. In the actual production process, the moisture content in tea leaves is evaluated by workers dependent on their experience, which is greatly influenced by subjective factors [8]. Frequently used moisture content determining methods are based on the dry matter constant weight, which is time-consuming and results in a loss of raw materials. It is, therefore, imperative to determine the water content in a rapid and non-destructive way during Longjing tea processing.
Near-infrared spectroscopy (NIR) is a rapid and non-destructive technique for the quantitative or qualitative analysis of the structure, composition, and concentration of substances responding to the C-H, OH-, and N-H groups in the organic molecules under test [9]. NIR has been widely used in the field of tea production for product traceability [10], fermentation identification [11], as well as for tea grade classification [12]. These applications of NIR in tea are based on the quantitative detection of components, including polyphenols, the water content, and fibers [13]. However, temperature produces effects on NIR data, which further limits the application of NIR on the detection of water content during Longjing tea processing. In fact, quality evaluations and composition detections with a single sensor have certain shortcomings; therefore, multi-sensor-based data fusion has been widely applied in relevant tea fields. In recent years, the data fusion of NIR spectroscopy and machine vision has been successfully used for tea production, such as for the discrimination of the fermentation degree of black tea [14], and the detection of black tea quality [15]. A colorimeter as a detection instrument in the visible spectrum range, also has the advantage of both a rapid and non-destructive detection. A colorimeter can measure the color and glossiness difference, and complement the range detected by NIR spectroscopy. More importantly, colorimeter-collected data would not include the effects from temperature, which could help to improve the precision of the water content by NIR; thus, decreasing the effects of temperature on the NIR data collection.
In this study, we evaluated the feasibility of micro-NIR and a portable colorimeter for predicting the moisture content of Longjing tea during the whole processing process. The objectives and contents of this study are as follows: (1) to collect data from the Longjing tea processing process in real-time by a micro NIRS and portable colorimeter system, and to establish a single sensor data prediction model, respectively; (2) to explore effective data fusion strategies and compare the effects of the data fusion level on the prediction accuracy of the model.

2. Materials and Methods

2.1. Sample Preparation

Tea leaves with one bud and one leaf (Jiukenzao variety) were harvested in Chun′an County, Hangzhou City, China. The processing of Longjing tea can be roughly divided into four stages: spreading, a first drying, shaping, and a second drying. The harvested tea leaves were spread in spreading troughs with a 1–2 cm thickness at 28–30 °C for 12 h, with the moisture content reached at 60%, approximately. Then, the tea leaves were moved into an automatic, flat, tea frying machine (6CCB-981ZD, Zhejiang Yinqiu Machinery Co., Ltd., Shengzhou City, China) for the first drying at 180 °C for 30 min. After the first drying, the tea leaves were placed back in the automatic, flat, tea frying machine for shaping at 130 °C for 10 min. The second drying was performed in a hexagon frying machine (6CH-3.0A, Shengzhou Chaohao Tea Machine Equipment Co., Ltd., Shengzhou City, China) at 80 °C for 5 min. During the whole process, tea samples were collected at each step to detect the NIR and color data by the spectrometer and colorimeter, simultaneously.

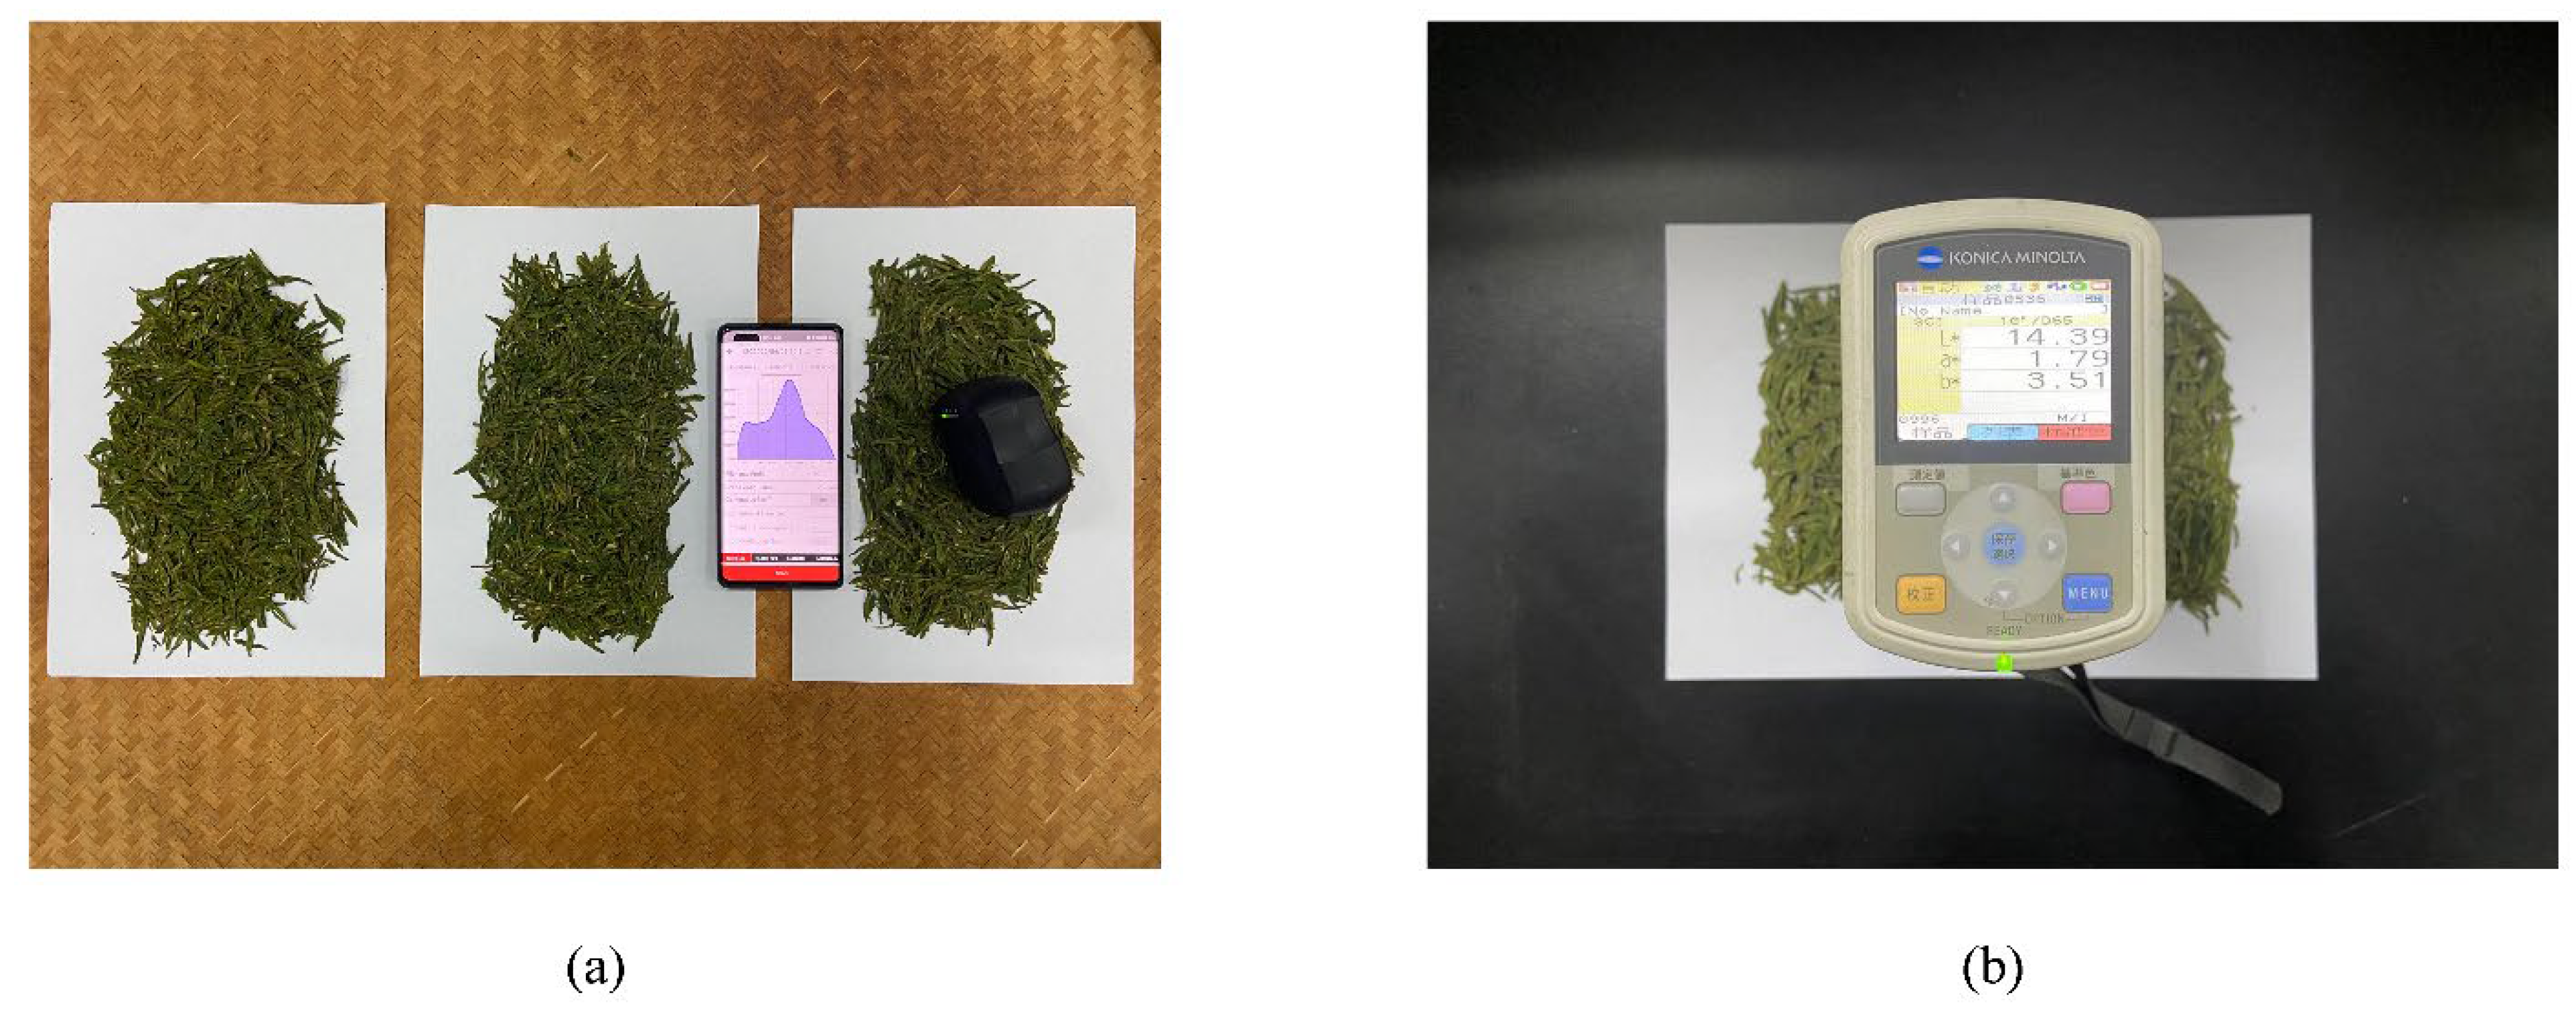
2.2. Spectral Data Collection

A micro-NIR device (NIR-S-R2; InnoSpectra Corporation, Taiwan, China) and a smartphone (Huawei Mate40 Pro; Huawei Technologies Co., Ltd., Shenzhen, China) were used to obtain the spectral data at room temperature (Figure 1a). The micro-NIR device (InnoSpectra Corporation of Taiwan, China) can connect with a smartphone via the ISC NIRS smartphone app, which contributes to acquiring and storing spectral data by using the smartphone control. The spectral data were collected five times for each sample, and then the average spectra was taken as the sample spectra. In the present work, 45 batches of Longjing tea sample spectra were collected, and a total of 225 spectral data were obtained for five steps during the whole Longjing tea processing (including the fresh tea leaves) procedure.

2.3. Colorimeters Data Acquisition

A portable spectrophotometer (CM-600d, Konica Minolta Co., Ltd., Osaka, Japan) was used to collect the color characteristics in the visible 400–700 nm wavelength range for the tea leaves at room temperature (Figure 1b). The illumination aperture was set to 8 mm, and the observer angle was set at 2°. The observation light source was D65, that simulated the daylight of the mean sky with a color temperature of 6500 K. The instrument was calibrated by using a white calibration plate (CM-A177, Konica Minolta Co., Ltd., Osaka, Japan).

2.4. Moisture Content Measurement

After collecting the NIR and color characteristics data, the corresponding tea sample was used to detect the water content. Tea samples of 3 g were placed into a moisture analyzer (MA35M-000230V1, Sartorius, Hamburg, Germany) at 120 °C, dried to the weight and kept constant. Three replications were used and the average value was calculated, with the experimental data shown in Table 1.

2.5. NIR Spectral and Colorimeter Data Processing

2.5.1. Spectral Preprocessing

Spectra collection is influenced by environmental conditions, which can produce useless information and noise interference that may have a certain degree of influence on the accuracy of the subsequent model building; therefore, we processed the raw spectral data using multiple scattering correction (MSC) [16], Savitzky–Golay filtering (S-G) [17], and a standard normal variational transform (SNV) [18]. The most widely used pretreatment techniques in NIR spectroscopy can be divided into two categories, among which, MSC and SNV belong to the scattering correction methods, which aim to reduce the (physical) variability between samples due to scattering. S-G smoothing belongs to the spectral derivatives, which aims at using the smoothing of the spectrum before even calculating the derivatives in order to reduce the negative impact on the signal-to-noise ratio of the conventional finite difference derivatives [19]. In addition, competitive adaptive reweighted sampling (CARS) was used to screen the feature wavelength, which decreased the problem of overlapping spectral matrix information and multicollinearity [20].

2.5.2. Colorimeter Data Optimization and Extraction

In this study, the four-color spaces of CIE L*a*b*, CIE L*C*h, Hunter L*a*b* and the Munsell Color System were used to extract the color parameters in the tea samples. In the CIE L*a*b* color space, the L* value indicates brightness, and higher values indicate a whiter sample color, lower values indicate a darker sample color, the a* indicates poor red-green, and b* indicates poor yellow-blue [21]. In the CIE L*C*h color space, C stands for the color saturation and h stands for the hue angle. The difference between the Hunter L* a*b* color space and the CIE L*a*b* color space is only that it is calculated as the square root with the latter as the cube root. Three dimensions of lightness (value), hue (hue) and chroma (chroma) are used to describe color in the Munsell Color System; therefore, a total of 17 parameter indices were collected in this study, including L* (D65), a* (D65), b* (D65), C* (D65), h (D65), L99 (D65), a99 (D65), b99 (D65), 99 (D65), h99 (D65), L (Hunter) (D65), a (Hunter) (D65), b (Hunter) (D65), Munsell C value, Munsell C chroma, Munsell D65 value, and Munsell D65 chroma, but due to the varying contribution to the characterization of the data set in the above parameters, there exists an excessive amount of data that occupies only a small contribution, that cannot make a large contribution to the subsequent model building. Feature extraction plays an important role in simplifying the dataset and improving the model’s accuracy by using mapping (or transformation) methods to reorganize the original data and extract new features for further processing and analysis; therefore, in this study, we used the method of principal component analysis (PCA) for special diagnosis extraction of the colorimeter datasets. It performed a dimensionality reduction in the dataset and converted multiple features into a small number of principal features [22], while ensuring that the main features of the color difference dataset were not lost.

2.6. Spectral and Colorimetric Sensor Data Fusion

Sensor data fusion is the theory, technology and tools used to combine data collected from different sensors to make the data from different feature collections more comprehensive in characterizing the same thing, in order to achieve complementarity [23]. In general, data fusion is divided into three different levels, namely, low-level, middle-level, and high-level data fusion [24]. Low-level fusion techniques simply stitch data from different sources into a single matrix, which has the advantage of retaining the maximum amount of original data to ensure the integrity of the information. Middle-level fusion techniques, extract the feature information from each sensor and use the combination of features as the input to the modeling approach, eliminating redundancy and improving the computational efficiency. The high-level fusion technique analyzes each data set individually for the modeling data and then combines the model responses together to produce the final “fused” response [25]. Since the source of the data in our study was an ensemble of both the spectral and chromatic aberration forms, its dataset composition was multi-sensor data; therefore, in this study, a low-level and middle-level data fusion strategy was selected to build our prediction model. Additionally, since the data were collected from different instruments and characterized by different parameters, this normalized the data before fusion to reduce or eliminate the effect of magnitude on the modeling effect.

2.7. Quantitative Prediction Model Establishment and Evaluation

A quantitative prediction model was developed using a partial least squares (PLS) regression which is a multivariate method [26]. This is most evident especially when the number of two sets of variables is large and both have multiple correlations, while the observations (sample size) are small [27]. In our study, the Kennard–Stone (K-S) algorithm was used to divide 225 sample data (spectral and color parameters) into calibration and prediction sets according to a 3:1 ratio, and a total of 169 calibration sets and 56 prediction sets were obtained. Meanwhile, in order to improve the generalization ability of the model and to prevent the overfitting or underfitting of the created model, K-fold cross-validation was used in the modeling process to solve the above problems. For the evaluation of the model after establishment, the calibration set calibration correlation coefficient ( R c ), calibration mean square error (RMSEC), prediction set correlation coefficient ( R p ) and prediction mean square error (RMSEP) was used as the evaluation indexes for the calibration set and prediction set, respectively. The relative percentage deviation (RPD) was used as the final evaluation index of the model performance. Generally, more accurate prediction models present a higher R c ,   R p and RPD and a lower RMSEC and RMSEP [28]. Figure 2 shows a flow chart of the implementation of this study.

2.8. Software

All the data analysis and processing, including the spectral preprocessing, CARS characteristic wavelength screening, principal component analysis, and PLS modeling were implemented in MATLAB (R2020b, Mathworks, Natick, MA, USA), while the spectrograms and box plots of the colorimeter data trends were plotted by Origin2018C (OriginLab, Northampton, MA, USA).

3. Results and Discussion

3.1. Spectral Characteristic Extraction Results

The pretreatment results of the raw spectra are shown in Figure 3a–d and show the spectra after the different pretreatment methods, where we can see two obvious absorption peaks at 1180 nm and 1440 nm. The absorption peak at 1180 nm was caused by the secondary-order frequency doubling of the protein CH group and the combined frequency absorption band of the water OH molecule [29]. Similarly, the absorption peak at 1440 nm was caused by the expansion and contraction vibration of O-H in the water molecule at the first frequency. It is noteworthy that the absorption peak at 960 nm disappeared gradually with processing. The reason for this phenomenon is that the absorption peak at this point was caused by the stretching vibration of C-H in the water molecule and the secondary-order frequency doubling of O-H [30]. Since the signature group in water was O-H, the stretching vibration gradually decreased and disappeared as the water decreased.
Additionally, after comparing the PLS models built with different preprocessed spectral data, the preprocessing method with the best results could be obtained. As shown in Table 2, the correlation coefficient R c was 0.9283 and RMSEC was 0.0720 for the calibration set, while the R p was 0.7855 and RMSEP was 0.0996 for the prediction set, based on the original spectral data. The results of the pre-processed data were significantly improved compared to the models of the original spectral data. Among the preprocessing methods used, the SNV preprocessed partial least squares model was the most effective, with a correlation coefficient R c of 0.8499 and RMSEC of 0.1012 for the calibration set, and an R p of 0.8228 and RMSEP of 0.0964 for the prediction set. Baseline drift, random noise, and spectral scattering eliminated a certain amount of interference and useless information present in the original spectra, which could effectively improve the accuracy of the model [31]; therefore, SNV was chosen as a pretreatment method for the subsequent modeling and analysis.

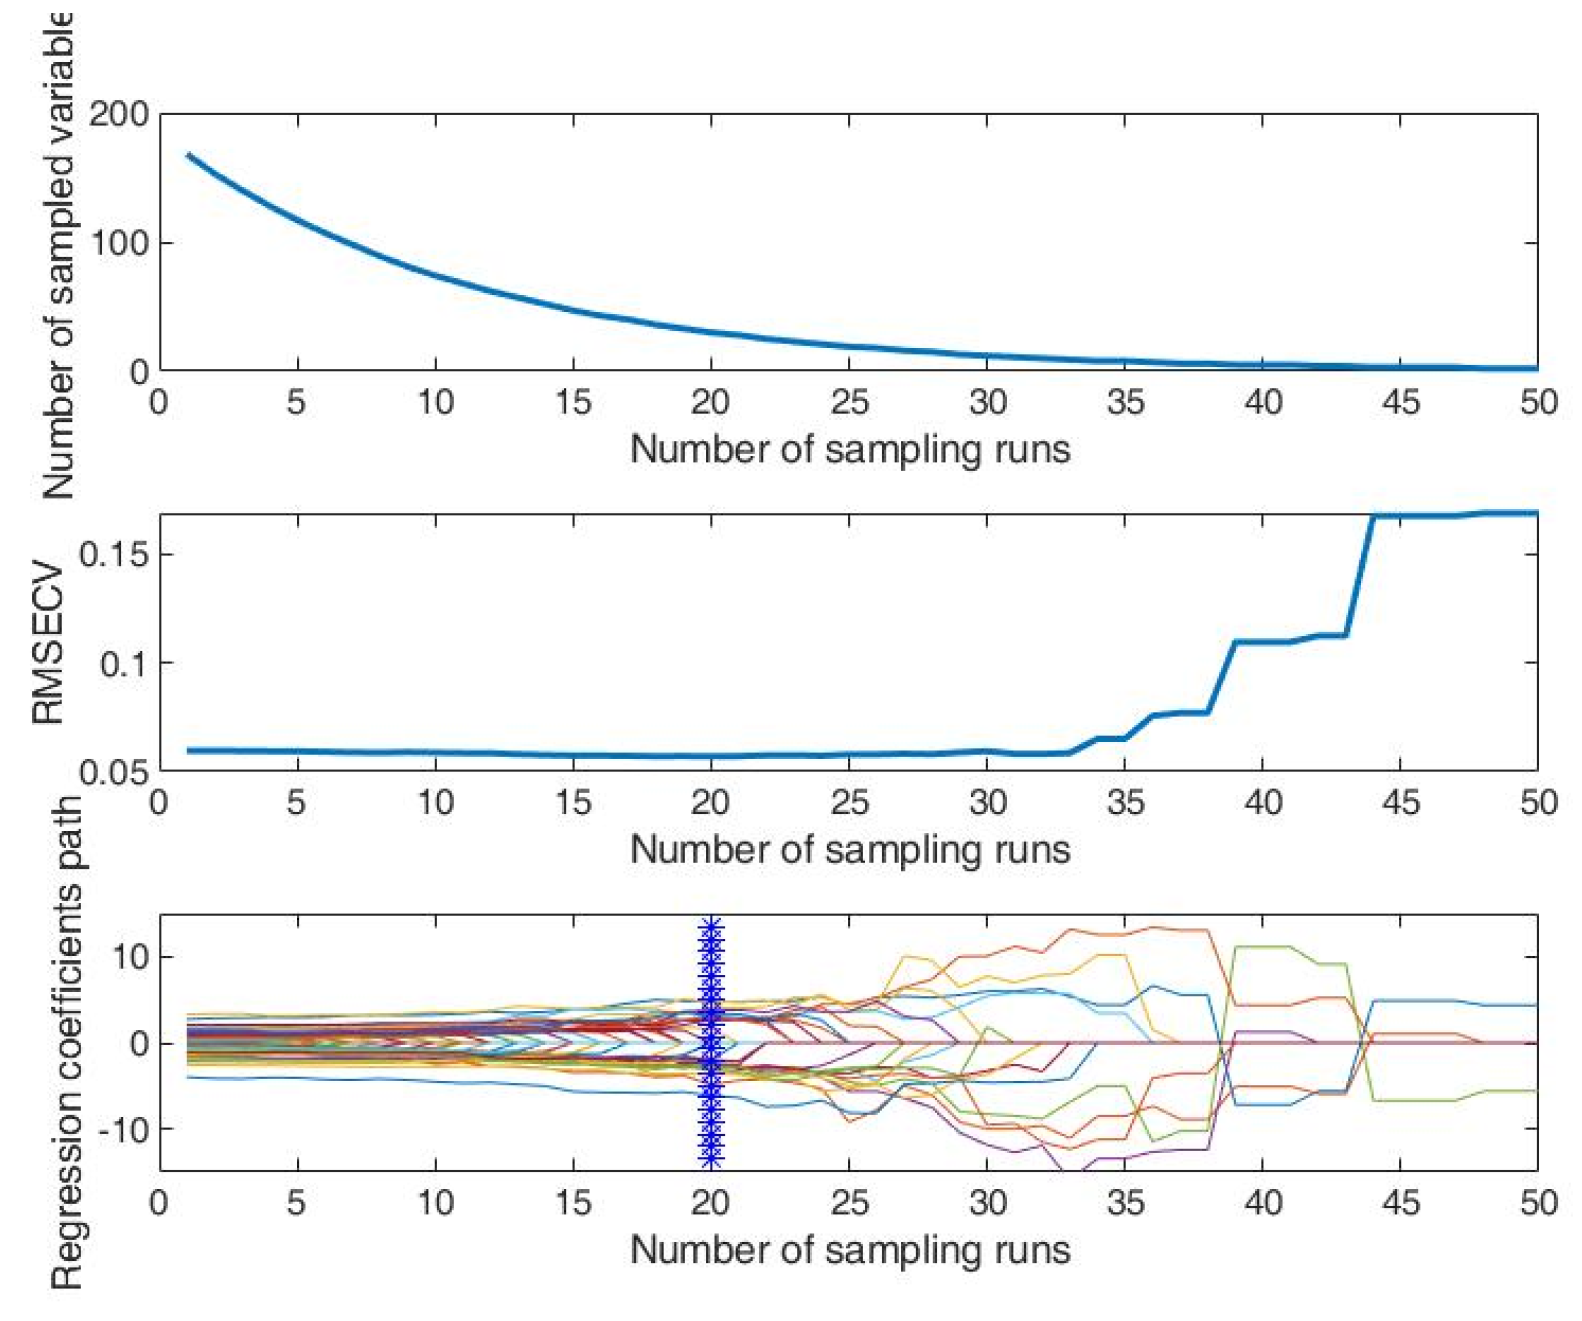
3.2. Selection of Spectral Characteristic Wavelengths

After selecting the optimal preprocessing method, SNV, the feature spectra were extracted by the competitive adaptive reweighted sampling (CARS) used in this study, specifically by determining the maximum number of factors extracted by CARS through a Monte Carlo (MC) cross-validation, followed by modeling the wavelength variables through 10 times of a partial least squares cross-validation, with the number of samples set to 50 and selecting the smallest RMSEC as the best sampling point. By the above operation, the smallest RMSEC could be calculated as 0.0570, and the minimum sample point was 20 at this time. A total of 30 characteristic wavelengths were finally selected by the CARS (937, 954, 957, 965, 978, 997, 1056, 1105, 1154, 1157, 1217, 1279, 1289, 1336, 1339, 1343, 1384, 1388, 1391, 1394, 1412, 1422, 1425, 1452, 1459, 1486, 1503, 1522, 1535, and 1542), and the extracted feature spectra account was for 4.84% of the true bands (Figure 4). From the above extracted characteristic wavelengths, they were mainly concentrated in the three wavelength ranges of 930–1000 nm, 1100–1290 nm, and 1340–1540 nm. The above wavelength ranges all responded to the overlapping positions of the absorption peaks in response to changes in the water and tea polyphenols, caffeine, free amino acids, and other major components during tea processing, such as the stretching of O-H in the water molecules’ vibration first-order frequency at 1440 nm. Therefore, it could respond well to the changes in moisture while reducing the redundant information in the spectral data, while at the same time improving the accuracy of the model.

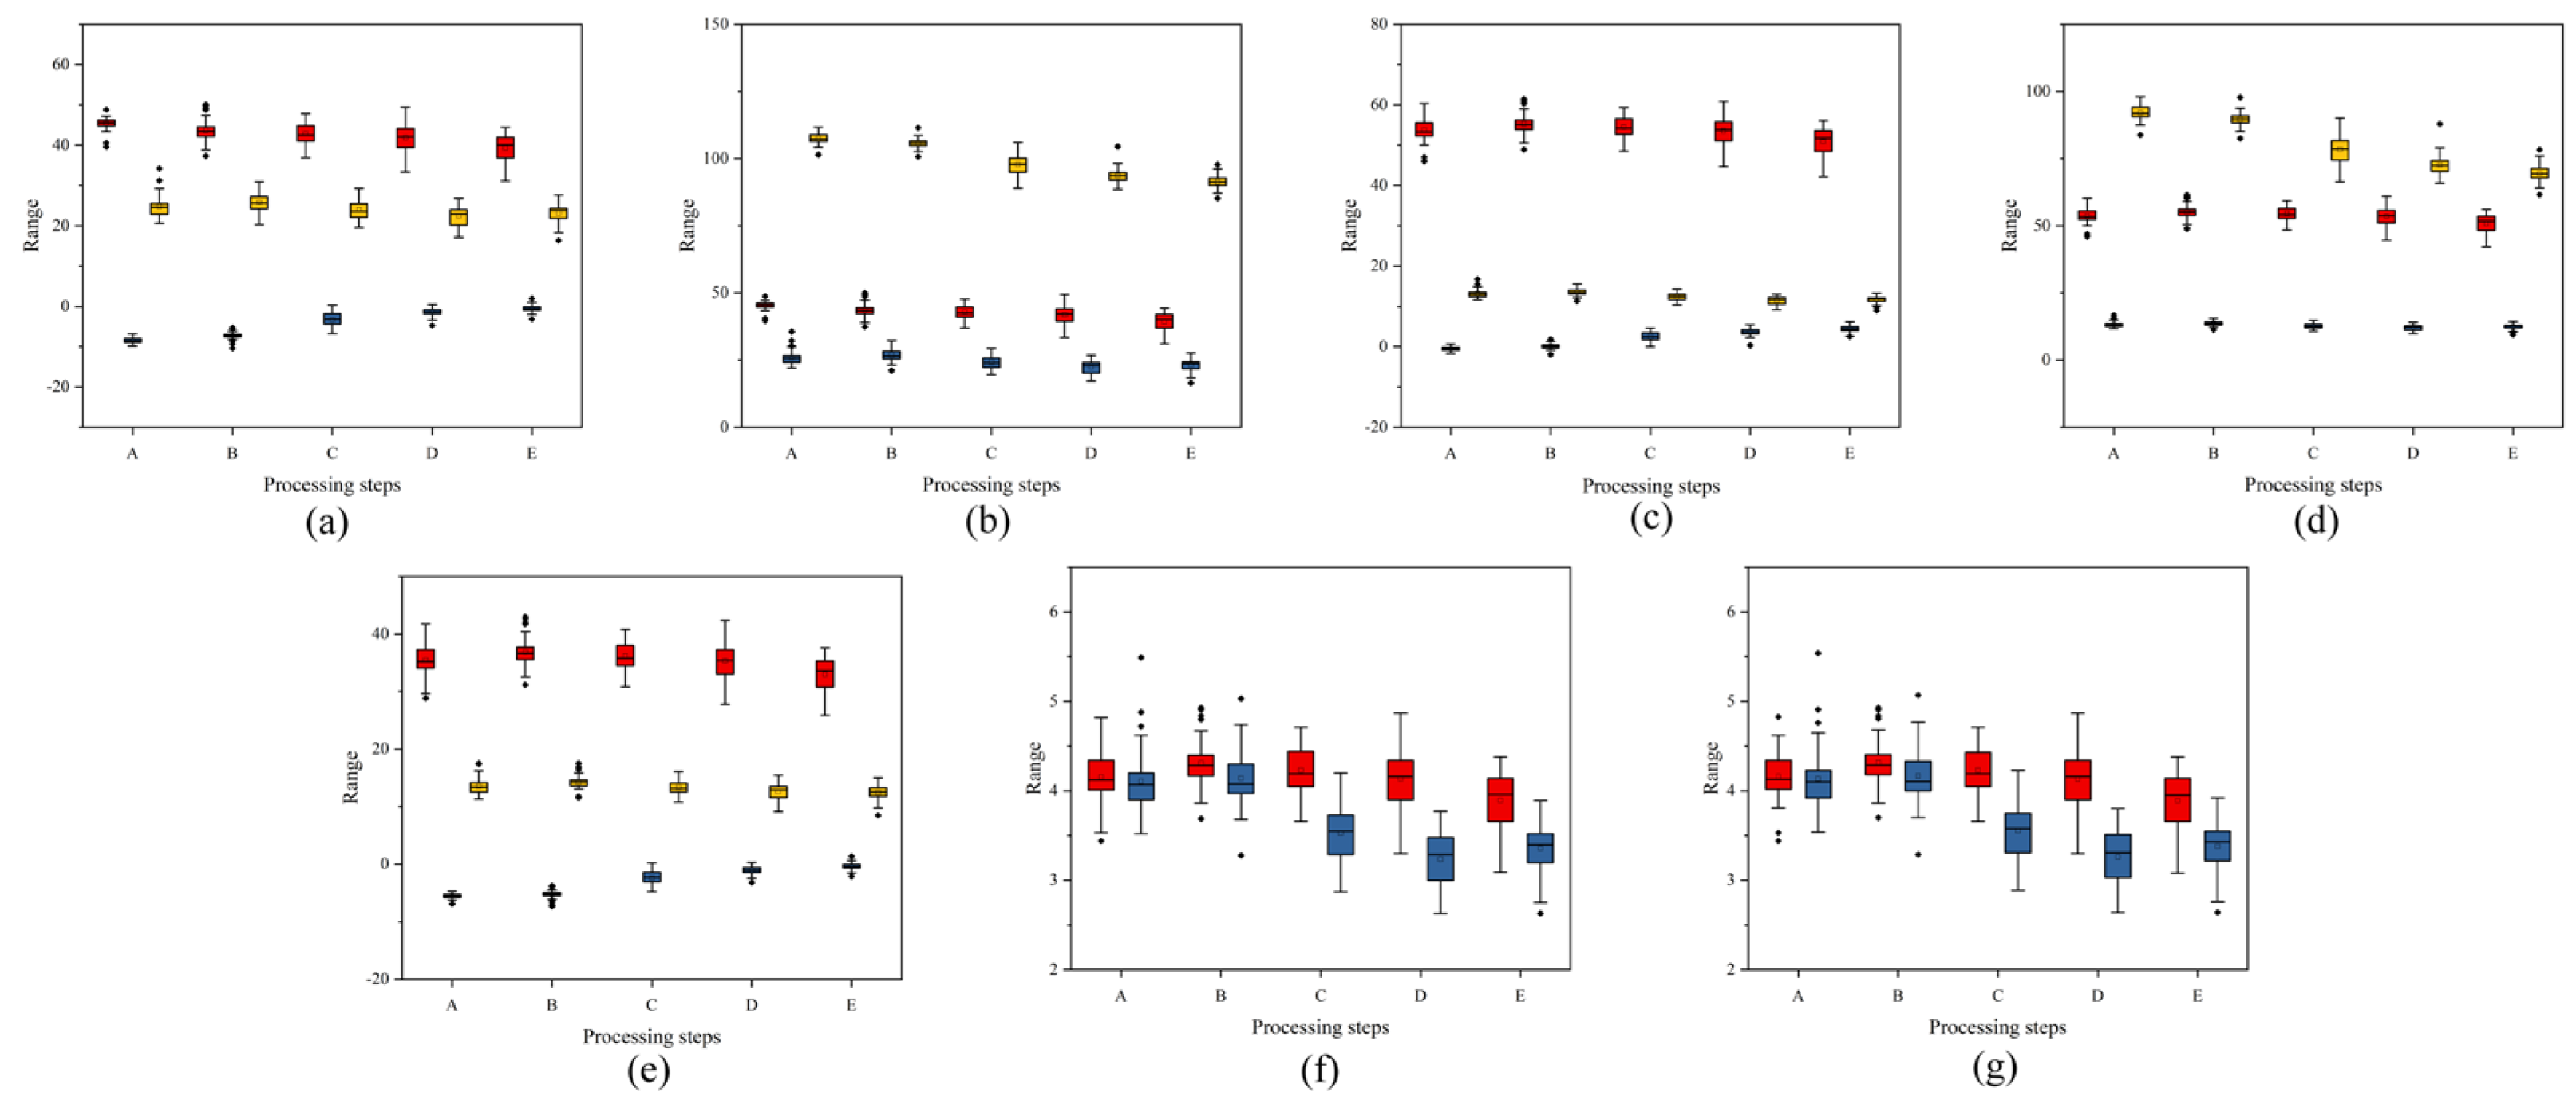
3.3. Characterization of Colorimetric Factors during Processing

Normally, the change of moisture during the processing of Longjing tea will be presented by the most intuitive color change [32], from the tender green and glossy fresh leaves to the loss of gloss and dull leaves in the subsequent first drying and compressing, before finally changing to a flat dark green or gray form through the second drying. A continuous reduction in moisture causes the above changes; therefore, it becomes necessary to quantify the above changes and then participate in moisture prediction modeling.
Figure 5a–g shows the process of the color difference values and gloss with different parameters. Although different evaluation criteria were used for the data sets, the trend of the data changes characterizing the same parameters was basically the same. Taking L*a*b* as an example, the L* and b* values decreased with the processing, while the a* values increased with the processing (Table 3). Meanwhile, the gloss changed with the time sequence and became darker, which is also consistent with a previous study [33]. In terms of the data processing, when all the collected color differences and gloss data were used simultaneously, it was not good enough to distinguish the tea moisture content conditions under the different time sequences, which may have been due to a redundancy of the parameters characterizing the same characteristics. Additionally, the model may have been in an overfitting situation if all these data were used for the model building; therefore, it was necessary to process these data, then, after the PCA, the contribution rates of the first principal component (PC1), second principal component (PC2) and third principal component (PC3) were 64.00, 23.28 and 11.74, respectively. It was found that the cumulative contribution of the first three principal components had reached 99.02%, and that their information loss rate was only 0.98%, which indicates that the first three principal components could already represent most of the information of the original color difference value and glossiness data, and that they could make some distinction between the moisture content of the tea leaves under the different time series (Figure 6). In the subsequent modeling process, therefore, using the color difference values and glossiness data after PCA processing is a better choice.

3.4. Data Fusion and Moisture Content Prediction of Tea Processing

3.4.1. Moisture Prediction Model Based on Single Sensor Data

Table 4 shows the PLS moisture prediction regression models built with optimal preprocessing and a dimensionality reduction based on the NIR and Colorimeter techniques, respectively. After comparison, the prediction accuracy of the Smooth-SNV-CARS-PLS, feature spectral-extraction moisture prediction model, that was built by a single NIR technique, had improved compared to the Smooth-SNV-PLS full-spectrum moisture prediction model, and the number of the feature spectra used for the modeling had been reduced from 620 to 30 bands in the full spectrum, while its R c value had improved from 0.9631 to 0.9666. The RMSEC value decreased from 0.0496 to 0.0430, while the R p value increased from 0.9423 to 0.9643 and the RMSEP value decreased from 0.0621 to 0.0445. The above changes also confirmed that the selection of the characteristic wavelengths had a positive effect on the accuracy of the PLS moisture prediction model. On the other hand, the color difference and gloss data measured by the colorimeter were normalized before building the prediction model due to the different characteristics characterized by the data parameters, after which we found that the R p value of 0.9033 of the built prediction model was greater than the R c value of 0.9011, which proves that if all the collected color difference and gloss data were used, there would have been significant redundant information between the data variables; therefore, causing an overfitting of the model. After normalizing the color difference and gloss data matrices and using the principal component analysis, the R c value was 0.8679 and the RMSEC value was 0.0927, while the R p value was 0.8607 and the RMSEP value was 0.0855. The prediction model built after the principal component analysis eliminated the overfitting phenomenon. Overall, the prediction accuracy of the NIR spectral prediction model was higher than that of the prediction model established by the color difference and gloss data, which was due to the fact that the NIR spectra could characterize the -OH and -CH substances in the tea very accurately and that they could establish a good correspondence. This shows that information about the changes of the moisture and composition of the Longjing tea during processing could be captured, while the color difference and gloss data detected by the colorimeter could capture color-related component information during the tea processing. This information was obtained based on the profile method, but some of the information could not be obtained by the sensor; therefore, the accuracy was reduced compared with the NIR spectral prediction model. However, since the detected data range was within the visible range of human eyes, the changes were more intuitive in the visible range, and when used in the actual production process, the data complementary to the NIR data could improve the accuracy of the prediction model compared to the invisible nature of the NIR spectrum.

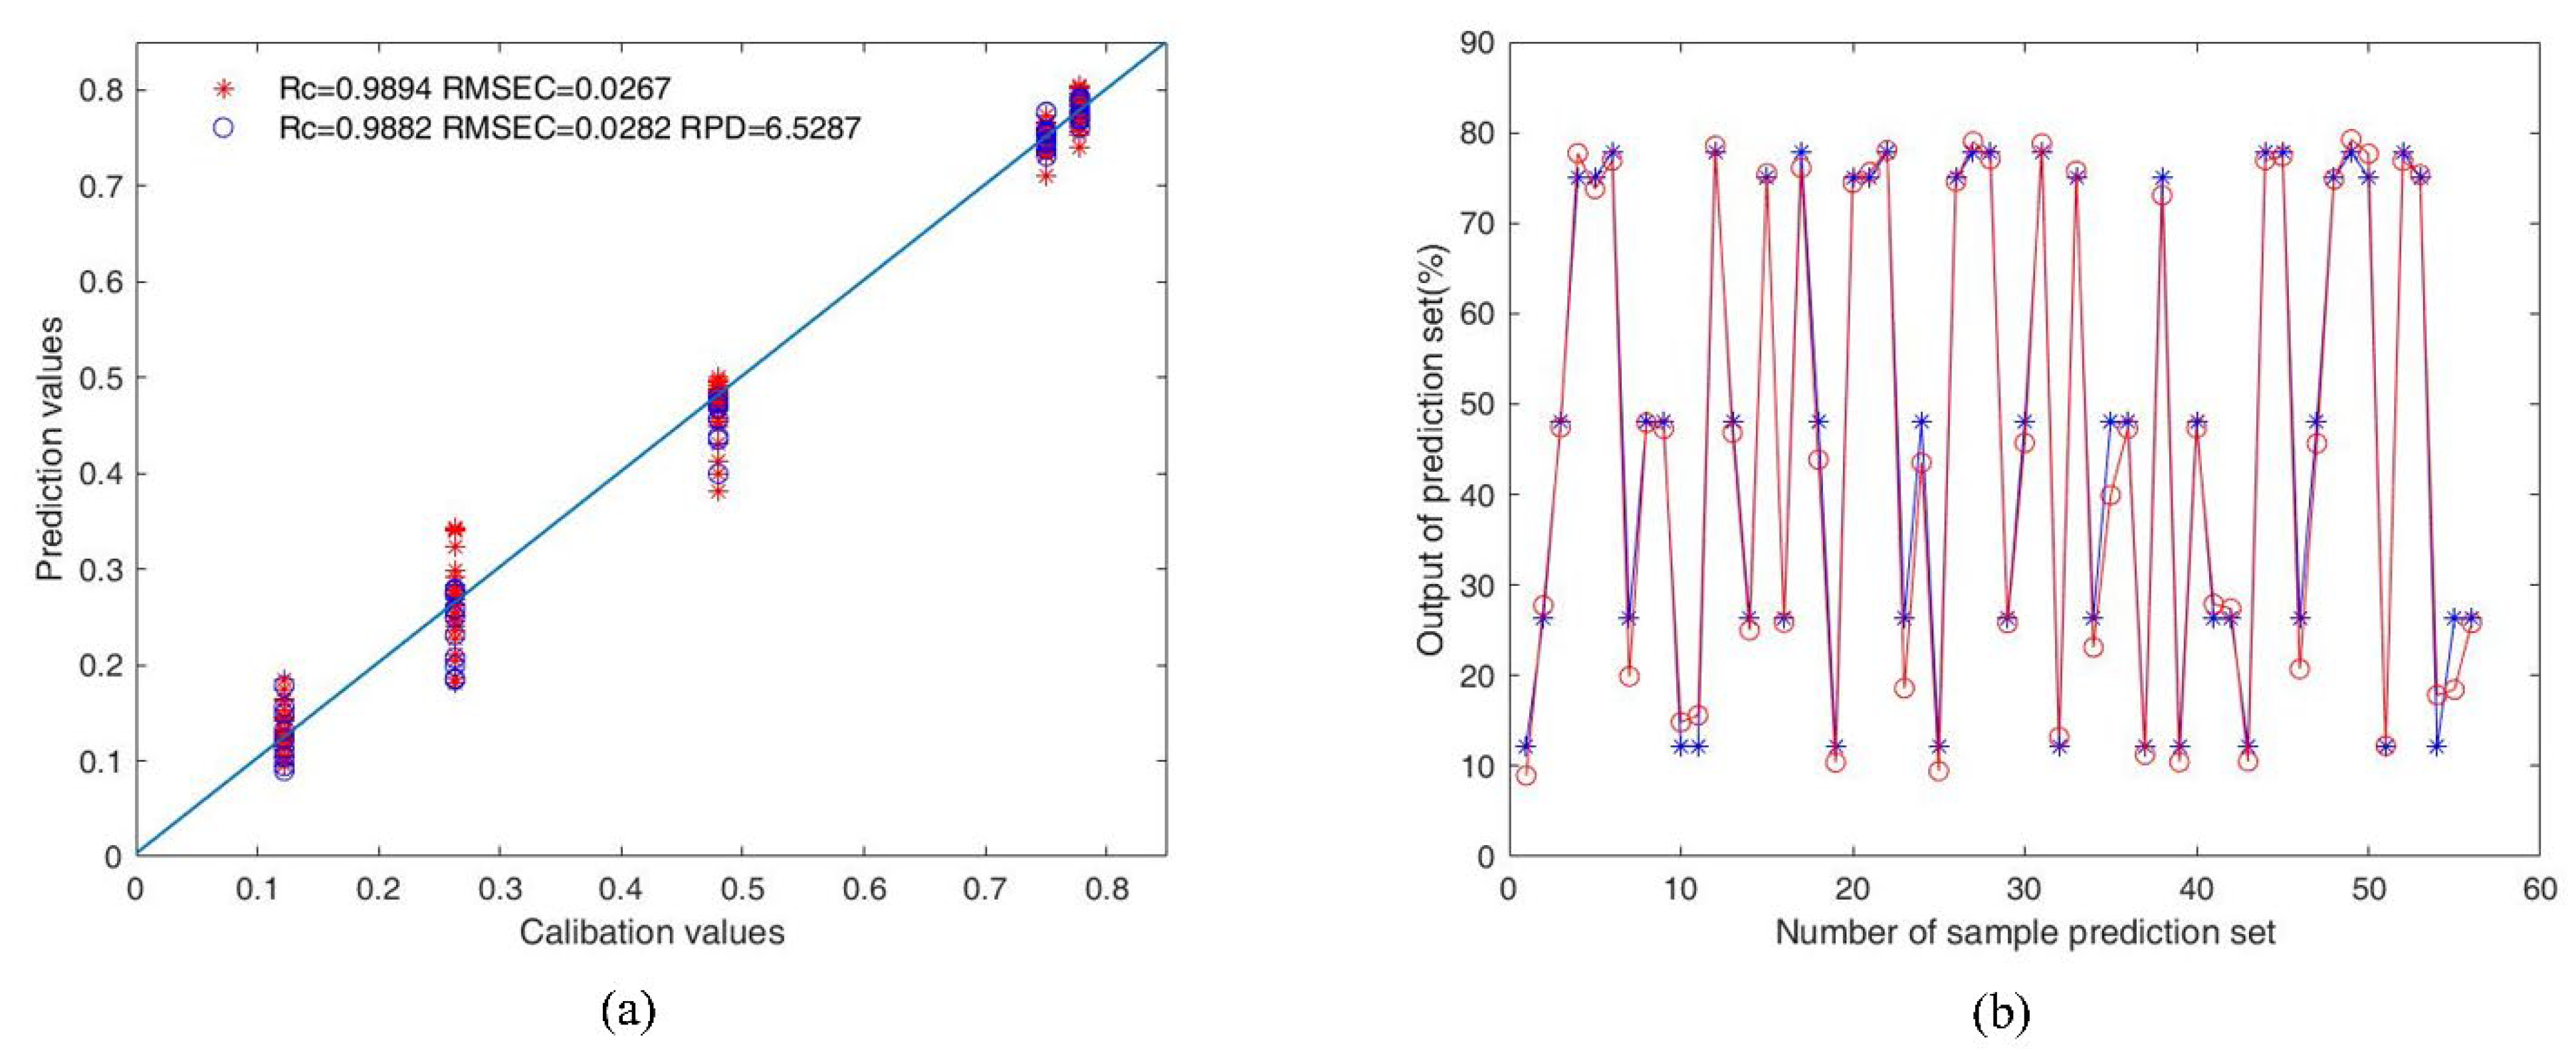
3.4.2. Moisture Prediction Model Based on Multi-Sensor Data Fusion

The performance of the data fusion moisture prediction model that was developed based on the fused NIR spectra and colorimeter chromatic aberration data is shown in Table 5.
The R p value of the PLS moisture prediction model that was developed based on the low-level data fusion was 0.9578, which was basically the same compared to the single NIR spectral data prediction model. As shown in Figure 7a, the low-level data fusion proved to be feasible and reliable for building a reliable PLS moisture prediction model, but it also meant that it was not significantly optimized compared to the prediction model built from a single sensor. This may be due to the fact that the low-level data fusion was performed in order to retain as much of the original data as possible to ensure the integrity of the information; however, this also means that there would be a large amount of redundant information between the data variables. Consequently, compared to the low-level data fusion, the middle-level data fusion could effectively solve the above problem. As shown in Figure 7b, in the optimization of the PLS moisture prediction model built by the mid-level data fusion, after the selection of the spectral feature wavelengths and the principal component analysis of the color difference data, representative feature wavelengths and color difference data were obtained, which effectively changed the problem of redundant data information and built a moisture prediction model with a higher prediction accuracy by using fewer feature data. The R c value increased from 0.9666 to 0.9867, and the RMSEC value decreased from 0.0430 to 0.0288, similarly, the R p value increased from 0.9643 to 0.9823, and the RMSEP value decreased from 0.0445 to 0.0333, compared with the best moisture prediction model established by a single model. The model accuracy was improved more significantly and the model was optimized significantly, with an RPD of 6.5287, which proves the reliability of the model while still having a high prediction accuracy.

4. Conclusions

This study demonstrates that it is feasible for us to combine a micro-NIR spectrometer with a portable colorimeter and use it for the quantitative prediction of moisture content during the processing of Longjing tea. Compared with the traditional benchtop equipment, a micro-NIR spectrometer and portable colorimeter have the advantages of easy portability, low costs, and efficiency, which provide the possibility for real-time online detection in actual production. Meanwhile, in terms of data processing, after comparing the effects of the moisture prediction models built from a single sensor data, this study compared the effects of PLS quantitative prediction models for Longjing tea moisture content built using low- and middle-level data fusion. The results showed that after combining the processing of feature extraction and data dimensionality reduction algorithms, such as CARS and PCA, the PLS moisture content prediction model with mid-level data fusion had the highest accuracy, with the values of the R p , RMSEP and RPD being 0.9823, 0.0333 and 6.5287, respectively. The above results show that a micro-NIR spectrometer and portable colorimeter can be used simultaneously for the quantitative prediction of the moisture content in Longjing tea processing, which can reduce the cost of using multiple sensors and improve their portability as much as possible, while also solving the lack of accuracy in single sensor detection and increasing the frequency of their use in actual production. This study also provides new ideas and methods for complementing and combining real-time online testing equipment in actual production.

Author Contributions

Conceptualization, X.Z. and X.S.; methodology, X.Z.; software, X.S.; validation, L.L. and J.Z.; formal analysis, Y.J.; investigation, H.Z.; resources, Y.J.; data curation, X.S.; writing—original draft preparation, X.S.; writing—review and editing, X.Z.; visualization, X.S. and X.Z.; supervision, S.S. and H.Y.; project administration, H.Y.; funding acquisition, H.Y. All authors have read and agreed to the published version of the manuscript.

Funding

This work was supported by the Science and Technology Innovation Project of the Chinese Academy of Agricultural Sciences (grant number CAAS-ASTIP-TRICAAS); and the National Natural Science Foundation of China (31972465).

Institutional Review Board Statement

Not applicable.

Informed Consent Statement

Not applicable.

Data Availability Statement

Not applicable.

Acknowledgments

The authors would like to thank CAAS-ASTIP-TRICAAS (the Science and Technology Innovation Project of the Chinese Academy of Agricultural Sciences) and National Natural Science Foundation of China (31972465).

Conflicts of Interest

The authors declare no conflict of interest.

References

  1. Khanali, M.; Hosseinzadeh-Bandbafha, H.; Salehpour, T. Chapter 10-Environmental impact of tea production/consumption chain. In Environmental Impact of Agro-Food Industry and Food Consumption; Galanakis, C.M., Ed.; Academic Press: New York, NY, USA, 2021; pp. 217–237. [Google Scholar] [CrossRef]
  2. Luo, F.; Du, X.-H.; Zeng, Q.; Wang, Y.; Ma, W.-W. Research on the Suitability for Different Tea Cultivars Processed into Flat Green Tea. Adv. Mater. Res. 2013, 726–731, 4405–4410. [Google Scholar] [CrossRef]
  3. Ni, K.; Wang, J.; Zhang, Q.; Yi, X.; Ma, L.; Shi, Y.; Ruan, J. Multi-element composition and isotopic signatures for the geographical origin discrimination of green tea in China: A case study of Xihu Longjing. J. Food Compos. Anal. 2018, 67, 104–109. [Google Scholar] [CrossRef]
  4. Wang, J.-Q.; Fu, Y.-Q.; Chen, J.-X.; Wang, F.; Feng, Z.-H.; Yin, J.-F.; Zeng, L.; Xu, Y.-Q. Effects of baking treatment on the sensory quality and physicochemical properties of green tea with different processing methods. Food Chem. 2022, 380, 132217. [Google Scholar] [CrossRef] [PubMed]
  5. Zhu, H.; Ye, Y.; He, H.; Dong, C. Evaluation of green tea sensory quality via process characteristics and image information. Food Bioprod. Process. 2017, 102, 116–122. [Google Scholar] [CrossRef]
  6. Huang, W.; Lu, G.; Deng, W.-W.; Ning, J. Effects of different withering methods on the taste of Keemun black tea. LWT 2022, 166, 113791. [Google Scholar] [CrossRef]
  7. Deng, S.; Zhang, G.; Olayemi Aluko, O.; Mo, Z.; Mao, J.; Zhang, H.; Liu, X.; Ma, M.; Wang, Q.; Liu, H. Bitter and astringent substances in green tea: Composition, human perception mechanisms, evaluation methods and factors influencing their formation. Food Res. Int. 2022, 157, 111262. [Google Scholar] [CrossRef]
  8. Dong, C.; An, T.; Yang, M.; Yang, C.; Liu, Z.; Li, Y.; Duan, D.; Fan, S. Quantitative prediction and visual detection of the moisture content of withering leaves in black tea (Camellia sinensis) with hyperspectral image. Infrared Phys. Technol. 2022, 123, 104118. [Google Scholar] [CrossRef]
  9. Mendes Novo, J.; Iriel, A.; Lagorio, M.G. Rapid spectroscopic method to assess moisture content in free and packaged oregano (Origanum vulgare L.). J. Appl. Res. Med. Aromat. Plants 2016, 3, 211–214. [Google Scholar] [CrossRef]
  10. Zhu, M.-Z.; Wen, B.; Wu, H.; Li, J.; Lin, H.; Li, Q.; Li, Y.; Huang, J.; Liu, Z. The Quality Control of Tea by Near-Infrared Reflectance (NIR) Spectroscopy and Chemometrics. J. Spectrosc. 2019, 2019, 8129648. [Google Scholar] [CrossRef]
  11. Dong, C.; Li, J.; Wang, J.; Liang, G.; Jiang, Y.; Yuan, H.; Yang, Y.; Meng, H. Rapid determination by near infrared spectroscopy of theaflavins-to-thearubigins ratio during Congou black tea fermentation process. Spectrochim. Acta Part A Mol. Biomol. Spectrosc. 2018, 205, 227–234. [Google Scholar] [CrossRef]
  12. Li, L.; Xie, S.; Ning, J.; Chen, Q.; Zhang, Z. Evaluating green tea quality based on multisensor data fusion combining hyperspectral imaging and olfactory visualization systems. J. Sci. Food Agric. 2019, 99, 1787–1794. [Google Scholar] [CrossRef]
  13. Lee, M.-S.; Hwang, Y.-S.; Lee, J.; Choung, M.-G. The characterization of caffeine and nine individual catechins in the leaves of green tea (Camellia sinensis L.) by near-infrared reflectance spectroscopy. Food Chem. 2014, 158, 351–357. [Google Scholar] [CrossRef]
  14. Jin, G.; Wang, Y.-J.; Li, M.; Li, T.; Huang, W.-J.; Li, L.; Deng, W.-W.; Ning, J. Rapid and real-time detection of black tea fermentation quality by using an inexpensive data fusion system. Food Chem. 2021, 358, 129815. [Google Scholar] [CrossRef]
  15. Wang, Y.; Li, L.; Liu, Y.; Cui, Q.; Ning, J.; Zhang, Z. Enhanced quality monitoring during black tea processing by the fusion of NIRS and computer vision. J. Food Eng. 2021, 304, 110599. [Google Scholar] [CrossRef]
  16. Hu, Y.; Youli, W.; Jie, S.; Jinping, G.; Rongsheng, F.; Zhiliang, K. Distinguishing Different Varieties of Oolong Tea by Fluorescence Hyperspectral Technology Combined with Chemometrics. Foods 2022, 11, 2344. [Google Scholar] [CrossRef]
  17. Jiang, H.; Wang, J.; Chen, Q. Comparison of wavelength selected methods for improving of prediction performance of PLS model to determine aflatoxin B1 (AFB1) in wheat samples during storage. Microchem. J. 2021, 170, 106642. [Google Scholar] [CrossRef]
  18. Yang, J.; Wang, J.; Lu, G.; Fei, S.; Yan, T.; Zhang, C.; Lu, X.; Yu, Z.; Li, W.; Tang, X. TeaNet: Deep learning on Near-Infrared Spectroscopy (NIR) data for the assurance of tea quality. Comput. Electron. Agric. 2021, 190, 106431. [Google Scholar] [CrossRef]
  19. Rinnan, Å.; van den Berg, F.; Engelsen, S.B. Review of the most common pre-processing techniques for near-infrared spectra. TrAC Trends Anal. Chem. 2009, 28, 1201–1222. [Google Scholar] [CrossRef]
  20. Yang, Y.; She, X.; Cao, X.; Yang, L.; Huang, J.; Zhang, X.; Su, L.; Wu, M.; Tong, H.; Ji, X. Comprehensive evaluation of Dendrobium officinale from different geographical origins using near-infrared spectroscopy and chemometrics. Spectrochim. Acta Part A Mol. Biomol. Spectrosc. 2022, 277, 121249. [Google Scholar] [CrossRef] [PubMed]
  21. Li, J.; Shao, Y.; Yao, Y.; Yu, Y.; Cao, G.; Zou, H.; Yan, Y. A novel quality evaluation method for magnolia bark using electronic nose and colorimeter data with multiple statistical algorithms. J. Tradit. Chin. Med. Sci. 2020, 7, 221–227. [Google Scholar] [CrossRef]
  22. Bossart, R.; Keller, H.; Kellerhals, H.; Oelichmann, J. Principal components analysis as a tool for identity control using near-infrared spectroscopy. J. Mol. Struct. 2003, 661–662, 319–323. [Google Scholar] [CrossRef]
  23. Ouyang, Q.; Zhao, J.; Chen, Q. Instrumental intelligent test of food sensory quality as mimic of human panel test combining multiple cross-perception sensors and data fusion. Anal. Chim. Acta 2014, 841, 68–76. [Google Scholar] [CrossRef]
  24. Borràs, E.; Ferré, J.; Boqué, R.; Mestres, M.; Aceña, L.; Busto, O. Data fusion methodologies for food and beverage authentication and quality assessment–A review. Anal. Chim. Acta 2015, 891, 1–14. [Google Scholar] [CrossRef]
  25. Di Rosa, A.R.; Leone, F.; Cheli, F.; Chiofalo, V. Fusion of electronic nose, electronic tongue and computer vision for animal source food authentication and quality assessment—A review. J. Food Eng. 2017, 210, 62–75. [Google Scholar] [CrossRef]
  26. Zhang, X.; Li, H.; Zhang, Y.; Qi, H.; Yang, X.; Wang, Q.; Li, D. Quantitative analysis of the oil mixture using PLS combined with spectroscopy detection. Optik 2021, 244, 167611. [Google Scholar] [CrossRef]
  27. Câmara, A.B.F.; de Oliveira, K.G.; Santos, M.C.D.; de Lima, R.R.S.; de Lima, K.M.G.; de Carvalho, L.S. Multivariate assessment for predicting antioxidant activity from clove and pomegranate extracts by MCR-ALS and PLS models combined to IR spectroscopy. Food Chem. 2022, 384, 132321. [Google Scholar] [CrossRef]
  28. Zareef, M.; Chen, Q.; Ouyang, Q.; Arslan, M.; Hassan, M.M.; Ahmad, W.; Viswadevarayalu, A.; Wang, P.; Ancheng, W. Rapid screening of phenolic compounds in congou black tea (Camellia sinensis) during in vitro fermentation process using portable spectral analytical system coupled chemometrics. J. Food Process. Preserv. 2019, 43, e13996. [Google Scholar] [CrossRef]
  29. Li, X.; Jin, J.; Sun, C.; Ye, D.; Liu, Y. Simultaneous determination of six main types of lipid-soluble pigments in green tea by visible and near-infrared spectroscopy. Food Chem. 2019, 270, 236–242. [Google Scholar] [CrossRef]
  30. Wang, Y.; Hu, X.; Jin, G.; Hou, Z.; Ning, J.; Zhang, Z. Rapid prediction of chlorophylls and carotenoids content in tea leaves under different levels of nitrogen application based on hyperspectral imaging. J. Sci. Food Agric. 2019, 99, 1997–2004. [Google Scholar] [CrossRef]
  31. Bi, Y.; Yuan, K.; Xiao, W.; Wu, J.; Shi, C.; Xia, J.; Chu, G.; Zhang, G.; Zhou, G. A local pre-processing method for near-infrared spectra, combined with spectral segmentation and standard normal variate transformation. Anal. Chim. Acta 2016, 909, 30–40. [Google Scholar] [CrossRef] [PubMed]
  32. Jiang, H.; Xu, W.; Chen, Q. Determination of tea polyphenols in green tea by homemade color sensitive sensor combined with multivariate analysis. Food Chem. 2020, 319, 126584. [Google Scholar] [CrossRef] [PubMed]
  33. Shahabi, M.; Rafiee, S.; Mohtasebi, S.S.; Hosseinpour, S. Image analysis and green tea color change kinetics during thin-layer drying. Food Sci. Technol. Int. 2014, 20, 465–476. [Google Scholar] [CrossRef]
Figure 1. Sensor data acquisition: (a) micro-NIR; (b)colorimeter.
Horticulturae 08 01007 g001
Figure 2. Flow diagram of the moisture content prediction experiment.
Horticulturae 08 01007 g002
Figure 3. Spectrum of Longjing tea under different processing timings: (a) raw spectrum; (b) spectrum after SNV pretreatment; (c) spectrum after S-G pretreatment; (d) spectrum after MSC pretreatment.
Horticulturae 08 01007 g003
Figure 4. CARS screening methods to select feature wavelength variables.
Horticulturae 08 01007 g004
Figure 5. Trend of chromaticity and gloss during processing: (ae) box plot of color difference value parameters under different testing standards of (a) L*a*b*; (b) L*C*h; (c) L99a99b99; (d) L99C99h99; (e) L (hunter) a (hunter) and b (hunter); (f,g) box plot of glossiness parameters under different testing standards of (f) Munsell C value and Munsell C chroma; and (g) Munsell D65 value and Munsell D65 chroma.
Horticulturae 08 01007 g005
Figure 6. Three-dimensional (3D) load distribution map obtained from the results of PCA analysis conducted for colorimetric and gloss during tea processing.
Horticulturae 08 01007 g006
Figure 7. Model optimization based on mid-level data fusion (a) scatter plots of the PLS models-based middle-level date fusion for the prediction of tea moisture content; (b) relationship between model predictions and calibration values based on middle-level data fusion.
Horticulturae 08 01007 g007
Table 1. Moisture content of Longjing tea during the entire processing procedure.
Processing ProcedureAverage Moisture Content (%)Number of Samples
SpectrumColorimetric
Fresh77.81225225
Spreading75.03
First drying47.98
Compressing26.28
Second drying12.22
Table 2. Prediction results of PLS moisture content of different pretreatment methods.
Pretreatment MethodsPCsCalibration SetPrediction Set
R c RMSEC R p RMSEP
RAW100.92830.07200.78550.0996
Smooth160.92900.07140.78730.0992
SNV140.84990.10120.82280.0964
S-G120.90940.07960.79430.0917
MSC130.85600.09740.82100.0990
Table 3. Range of main colorimetric parameters during processing.
Processing
Procedure
Parameter RangeAverage Parameter
L*a*b*L*a*b*
Fresh37.34~48.80−9.86~−6.7620.61~34.2545.38−8.4624.78
Spreading37.34~50.07−10.40~−5.2920.38~30.9143.64−7.2625.84
First drying36.94~47.78−6.74~0.3619.58~29.2542.89−3.3323.95
Carding33.39~49.45−4.74~0.5018.27~26.8141.91−1.4122.45
Second drying31.09~44.41−3.19~1.9516.4~26.1235.61−0.5123.19
Table 4. Effect of a single NIR spectrum or colorimeter data on the accuracy of the PLS moisture prediction model.
Prediction Data SourceData Processing MethodsPCsCalibration SetPrediction Set
R c RMSEC R p RMSEP
Near-infrared spectroscopySmooth-SNV-PLS150.96310.04960.94230.0621
Smooth-SNV-CARS-PLS130.96660.04300.96430.0445
colorimeterZ-score-PLS160.90110.08060.90330.0838
Z-score-PCA-PLS30.86780.09270.86070.0855
Table 5. Performance of the PLS model based on data fusion for moisture prediction in Longjing tea processing.
Degree of Data FusionData Processing MethodsPCsCalibration SetPrediction SetRPD
R c RMSEC R p RMSEP
Low-levelSNV + Z-score180.95870.05230.95780.04573.4790
Middle-levelSNV-CARS + Z-score-PCA130.98940.02670.98820.02826.5287
Publisher’s Note: MDPI stays neutral with regard to jurisdictional claims in published maps and institutional affiliations.

