The importance of olive (
Olea europaea L.) as essential for human diet and landscape management is undeniable in areas with Mediterranean climate. Olive production has been affected by increasing global demand (table olive and olive oil), which has imposed a greater need for agricultural inputs as we address resource scarcity and climate change [
1,
2,
3]. One of the key inputs of olive production is water. Around 70% of the world surface of olive groves is irrigated [
4], therefore, the development of appropriate methods and strategies of sustainable water use in olive groves is fundamental [
5]. The most common technique for optimizing water efficiency is Regulated Deficit Irrigation (RDI), in which water deficits are imposed during phenological periods when the tree is most insensitive to water stress [
6,
7,
8], and complementary irrigation [
9,
10]. Furthermore, the results of Goldhamer [
11] and Gómez-del Campo [
12] showed that RDI strategies resulted in a saving of about 20% of the total amount of water applied without reducing the yield, fruit and oil content. Moreover, numerous studies show that deficit irrigation avoids or minimizes the negative impact of irrigation on erosion, in particular by reducing surface runoff and contributing less to the infiltration of pollutants (herbicides and pesticides) into groundwater [
13]. In the classical method, the calculation of irrigation amount is based on multiplying reference evapotranspiration (ET
0) by grass-reference-based crop-specific coefficients (K
c). Nevertheless, the traditional method of estimation of K
c for olive orchards could be inaccurate. K
c is affected by some aspects such as canopy architecture, ground cover, and the interactions of climatic conditions, soil type, cultivars, and irrigation management practices [
6].
To achieve precise irrigation results, some recent research suggested continuous assessment of plant water status indices [
14,
15,
16,
17]. In fact, in Soil Plant Atmosphere Continuum (SPAC), plant plays an interface role between soil and the environment, and its physiological response is a combination of results [
14,
18,
19]. Furthermore, the continuous measurement of plant water status indices would provide a solid base for precision irrigation management, by real time response to water stress. However, the olive species (
Olea europaea) has a very wide genetic pool, which can respond to drought using different leaf and fruit physiological and morphological mechanisms [
14,
20]. It includes genotypes that can respond to drought using different tolerances to leaf dehydration and morphological and structural adaptations of the leaves [
14]. Lo Bianco and Scalisi [
20] found a different leaf stomatal regulation among the olive cultivars. Due to this difficulty, the correct choice of the water status index of the plant is essential. The most common suggested indices are midday stem water potential (ᴪ
stem), trunk diameter variation (TDV), sap flow (SF), leaf turgor pressure (LTP), as well as fruit diameter (FD), which can be used alone or in combination. A combination of indices (sensors) could provide robust data, however, increased the complexity. Moreover, considering the difficulty of replicating continuous measurements on a large number of trees, the need to obtain an accurate index has become more essential. The midday stem water potential (ᴪ
stem) is accurate and reliable, however, not only it is a destructive method, but also not suitable for continuous measurement [
14,
21,
22]. The stem/trunk diameter variation (by trunk dendrometer) is another useful index. However, the trunk diameter fluctuations are affected by plant age and size, crop load, environmental variables, and growth patterns [
19]. The sap flow (SF) methods are particularly demanding in terms of installation; most of the SF methods suitable for fruit trees are invasive, such that sensors must be installed within the trunk of the trees [
5]. Moreover, the sap flow rate demonstrates transpiration dynamics that depend on stomatal activity and environmental variables [
22]. The leaf turgor pressure (LTP) measurement method is carried out by probe which is a cheap and handy method but does not allow for continuous measurement [
23]. The advanced LTP measurement method employed leaf patch clamp pressure (LPCP) probes is able to continuously monitor the pressure, but the different initial condition of the leaf related to age (especially in evergreen species) and exposure to light inside the canopy leads to obtaining partial information from LPCP [
15,
22]. In addition, findings by Jones [
24] suggested that LTP in the isohydric species is not very useful in the early detection of plant water deficiency. The other innovative plant water status index is fruit diameter (FD). The daily fruit growth dynamics can be expounded as changes in flows of water into and out of the fruit, rather than carbon gains; thus, the daily fruit diameter variation responds to water deficit [
15,
25,
26,
27]. Fruits represent the actual goal of production but fruit growth is the result of several genetic, metabolic, hormonal, and environmental interactions [
28], therefore, optimal fruit growth can be determined only by the efficient physiological manipulation of the condition tree [
23]. In the olive tree, the root response to localized application systems of organic residues, nutrients, and water reveal an enormous plasticity of the root system [
29,
30,
31] which can compensate for local stress. Although olive tree root systems are highly capable and could supply a constant water flow, fruit daily growth trend is described by periods of shrinkage and then after expansion, which usually lead to increase in fruit size at the end of the day [
23,
27]. Due to the research of Fernandes et al. [
26] and Marino et al. [
15], the daily variations in fruit transversal diameters can be expounded as changes in flows of water into and out of the fruit hence, these can be connected to vapor pressure deficit (VPD) and tree water status. Furthermore, Scalisi et al. [
14] explained that fruit growth (measured by FD) is strictly related to soil water availability and plant water status, it is also influenced by environmental variables, crop load, genetic factors, and phenology. Consequently, fruit growth monitoring (by FD) could represent a sensitive indicator of plant water and physiological status of the trees, especially during cell expansion phase, when fruit growth rate is constant and truly decisive for productive performances [
23,
32]. FD monitoring has been investigated in several studies by researchers to measure daily fluctuation in the volume of selected fruits, including pears [
33], sweet cherry [
34,
35,
36], mango [
37], apple [
23], nectarine [
22], orange [
38], and olive [
14,
15,
26,
27]. The continuous FD monitoring provides robust data but water management protocols based on FD measurements need further study to develop field applicable models [
15,
23,
27]. A common challenge with tree-based sensors is to adjust their output to physiologically meaningful parameters in a consistent manner [
19,
27,
36].
In order to translate outputs of plant-based sensors, the phenomenon of hysteresis should be further considered. Explaining the causes of hysteretic phenomenon appears fraught with complex interactions between exogenous and endogenous factors to the plant system [
39]. The root of the word hysteresis is Greek and means to “lag behind” [
27,
40]. Hysteresis is non-linear loop-like behavior that has been known in plant systems for a long time [
40,
41]. In hysteresis, when the time argument of an input function is stretched or compressed, the corresponding output function is not stretched in the same way, so the hysteresis does not show affine similarity with respect to time [
40,
42,
43]. For example, a diurnal hysteresis between evapotranspiration (ET) (or transpiration) and vapor pressure deficit (VPD) has been studied [
40]; hysteresis as a relationship between environmental factor (e.g., meteorological factors) and sap flow [
40,
44,
45]; hysteresis was found also in the relationship between canopy conductance and temperature [
46]; hysteresis between fruit diameter and leaf pressure on two different olive cultivars [
14]. Furthermore, in the cherry fruit growth relationship with VPD, complete hysteresis was found only during the maturation phase while during fruit extension phase the hysteresis was null or partial [
36]. Recently Khosravi et al. [
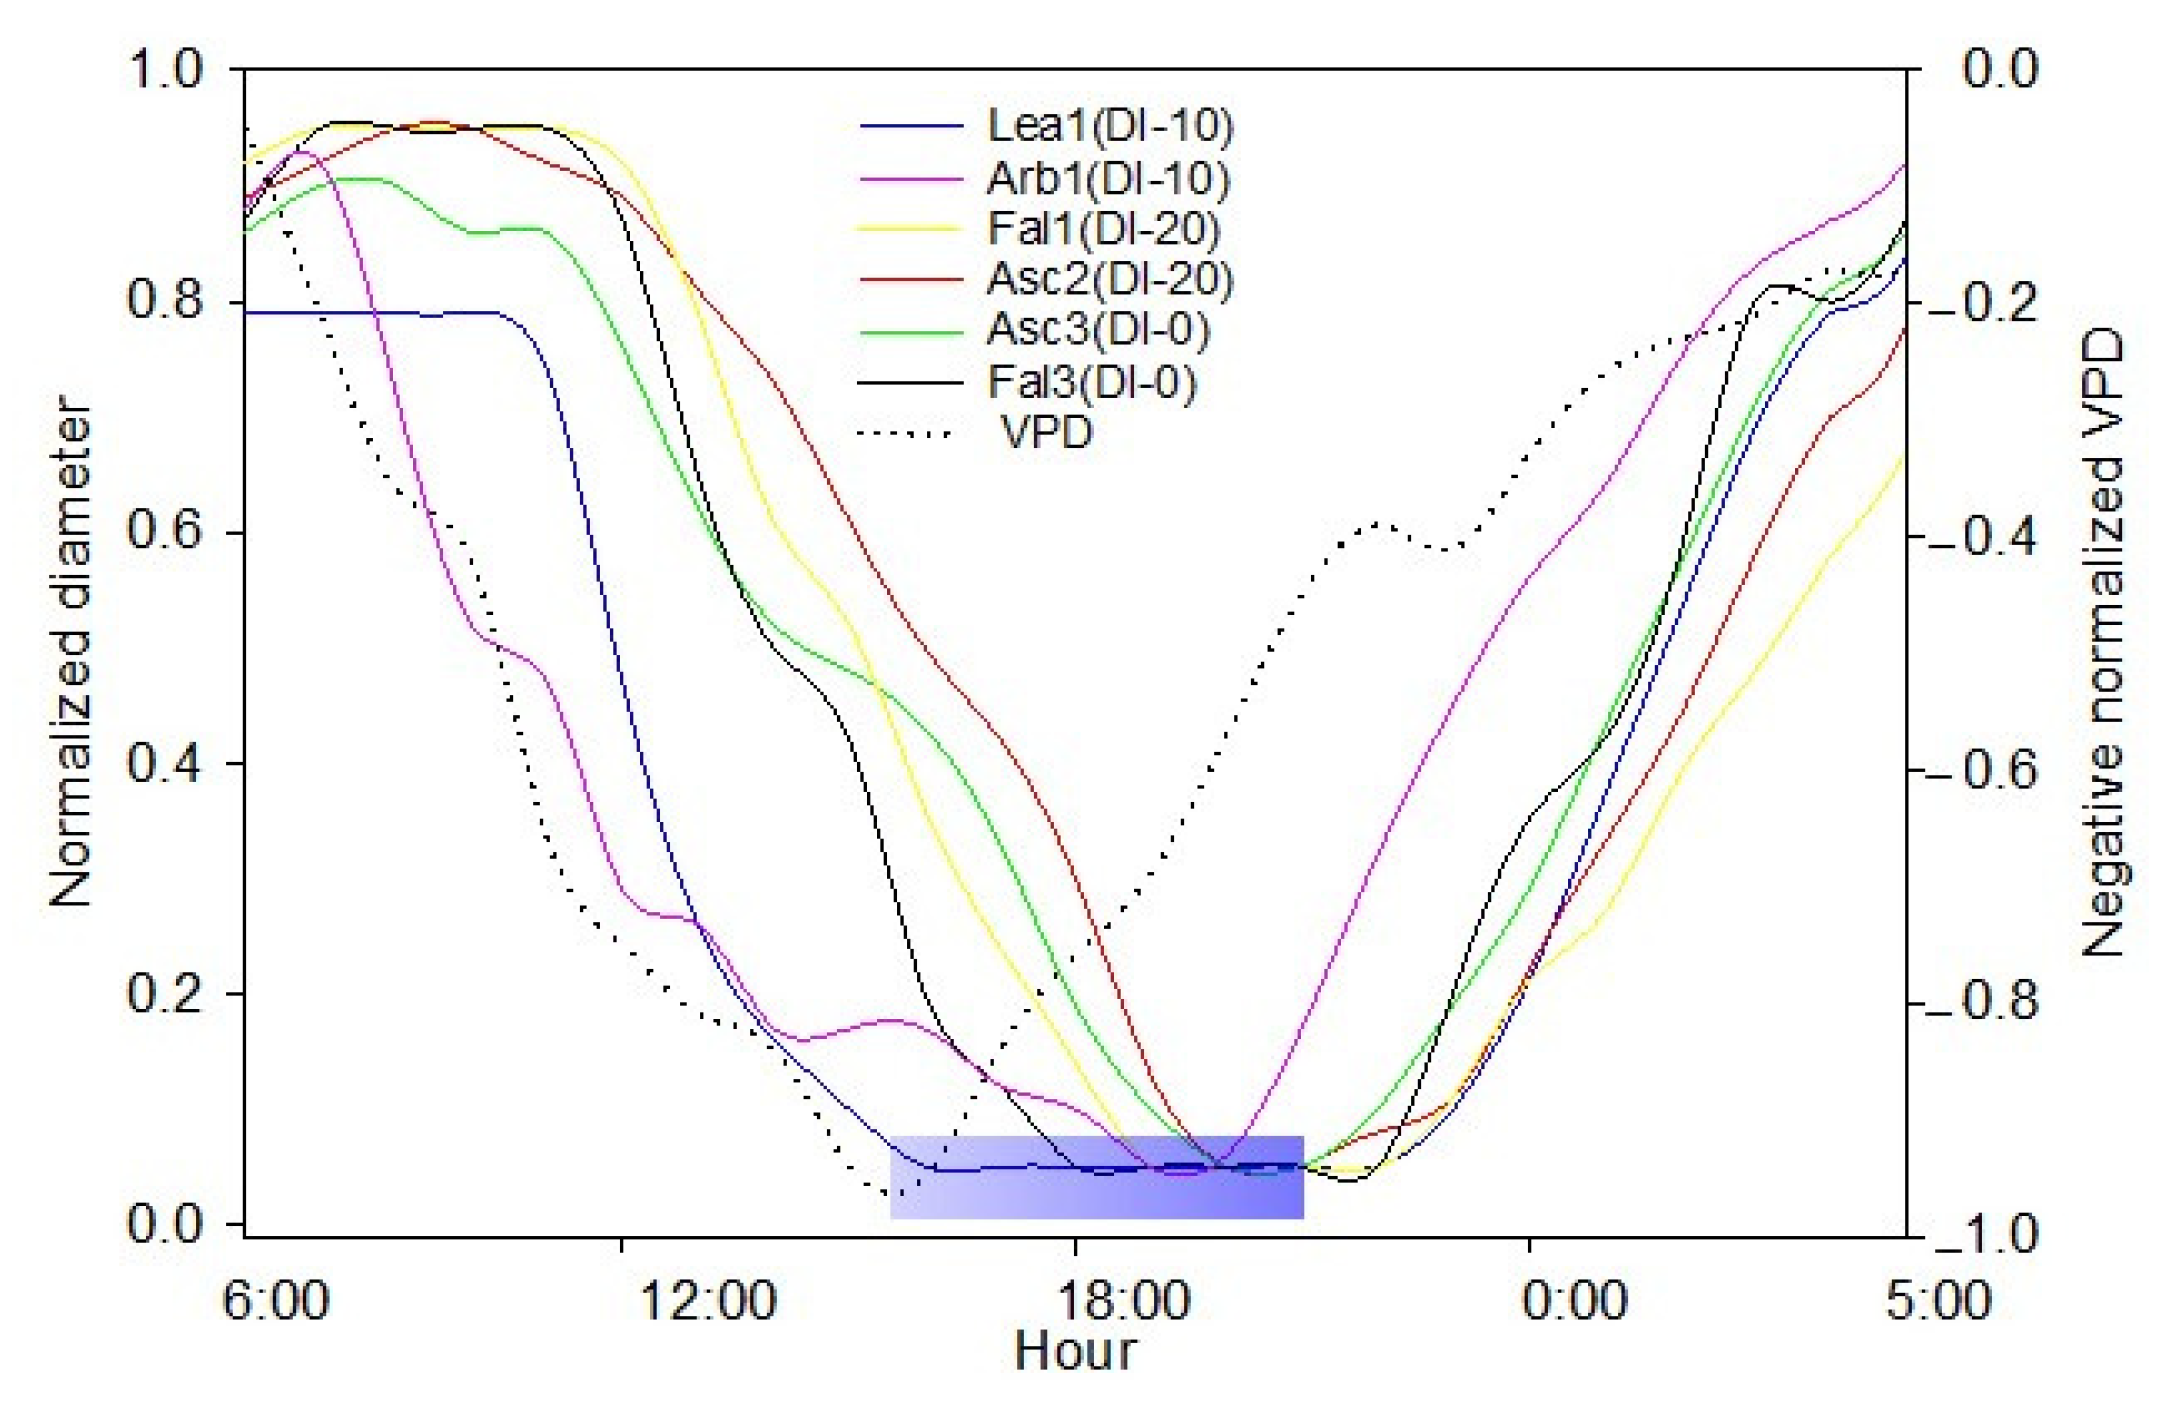
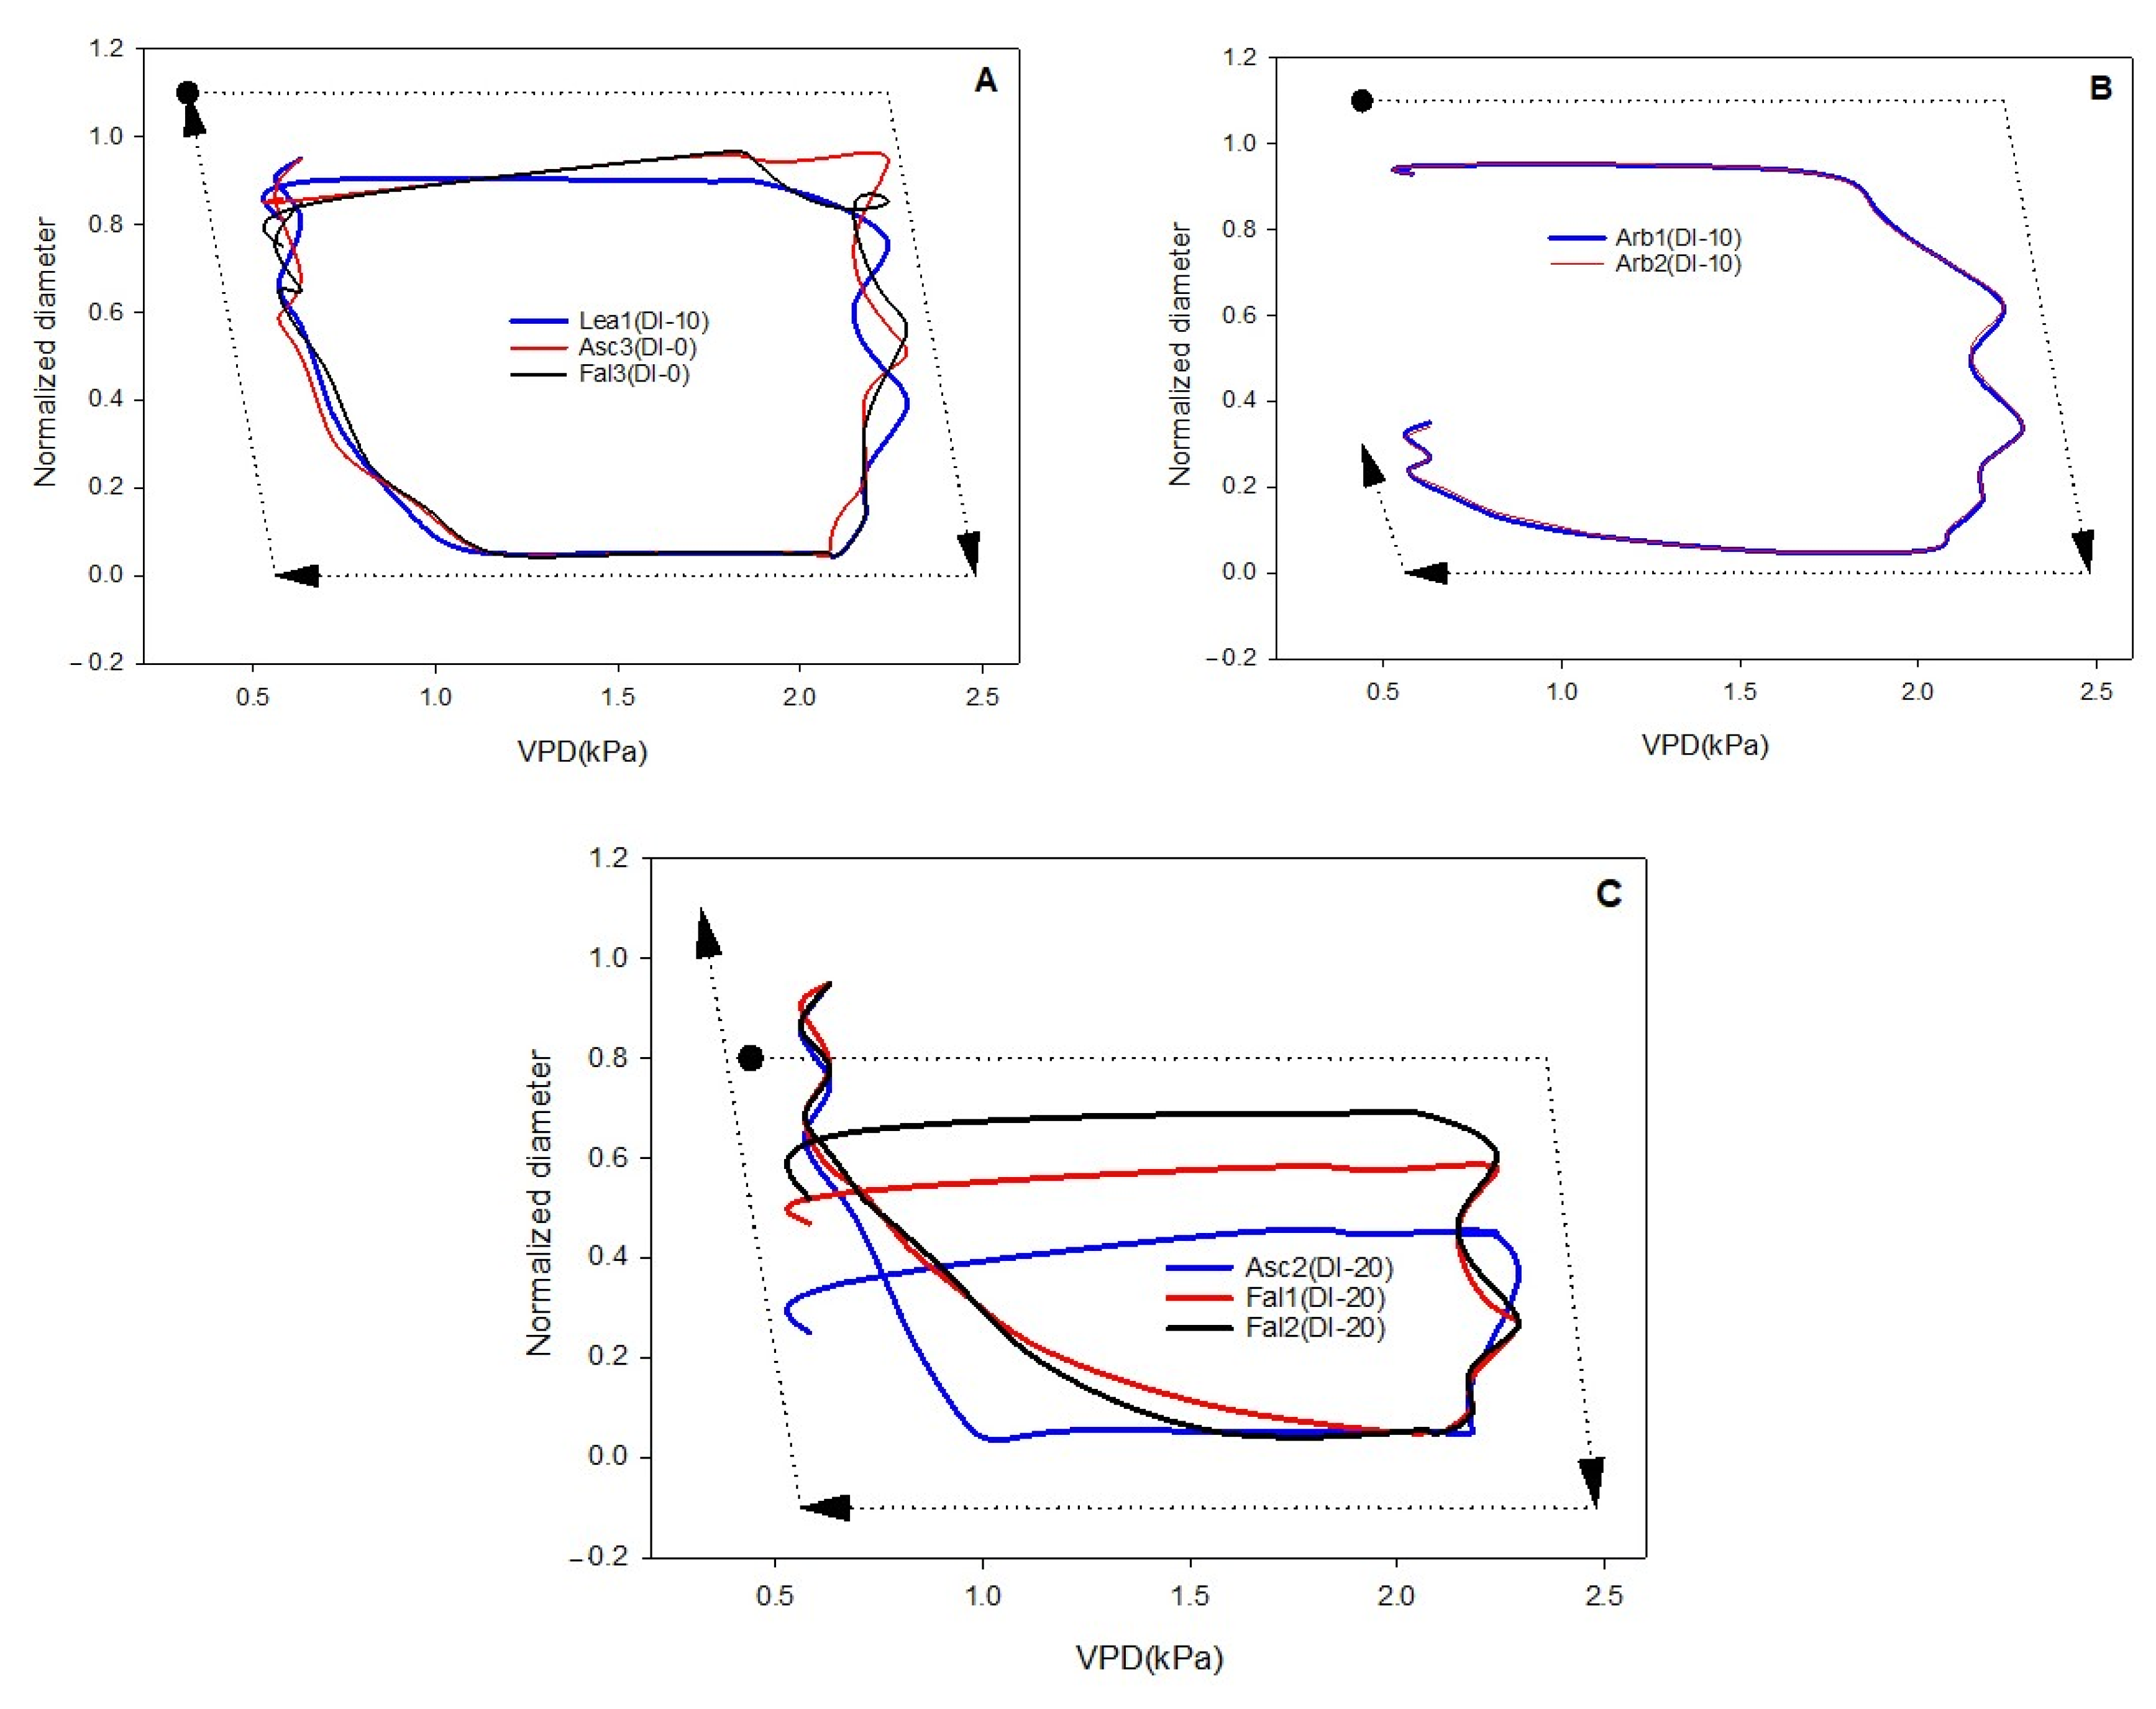
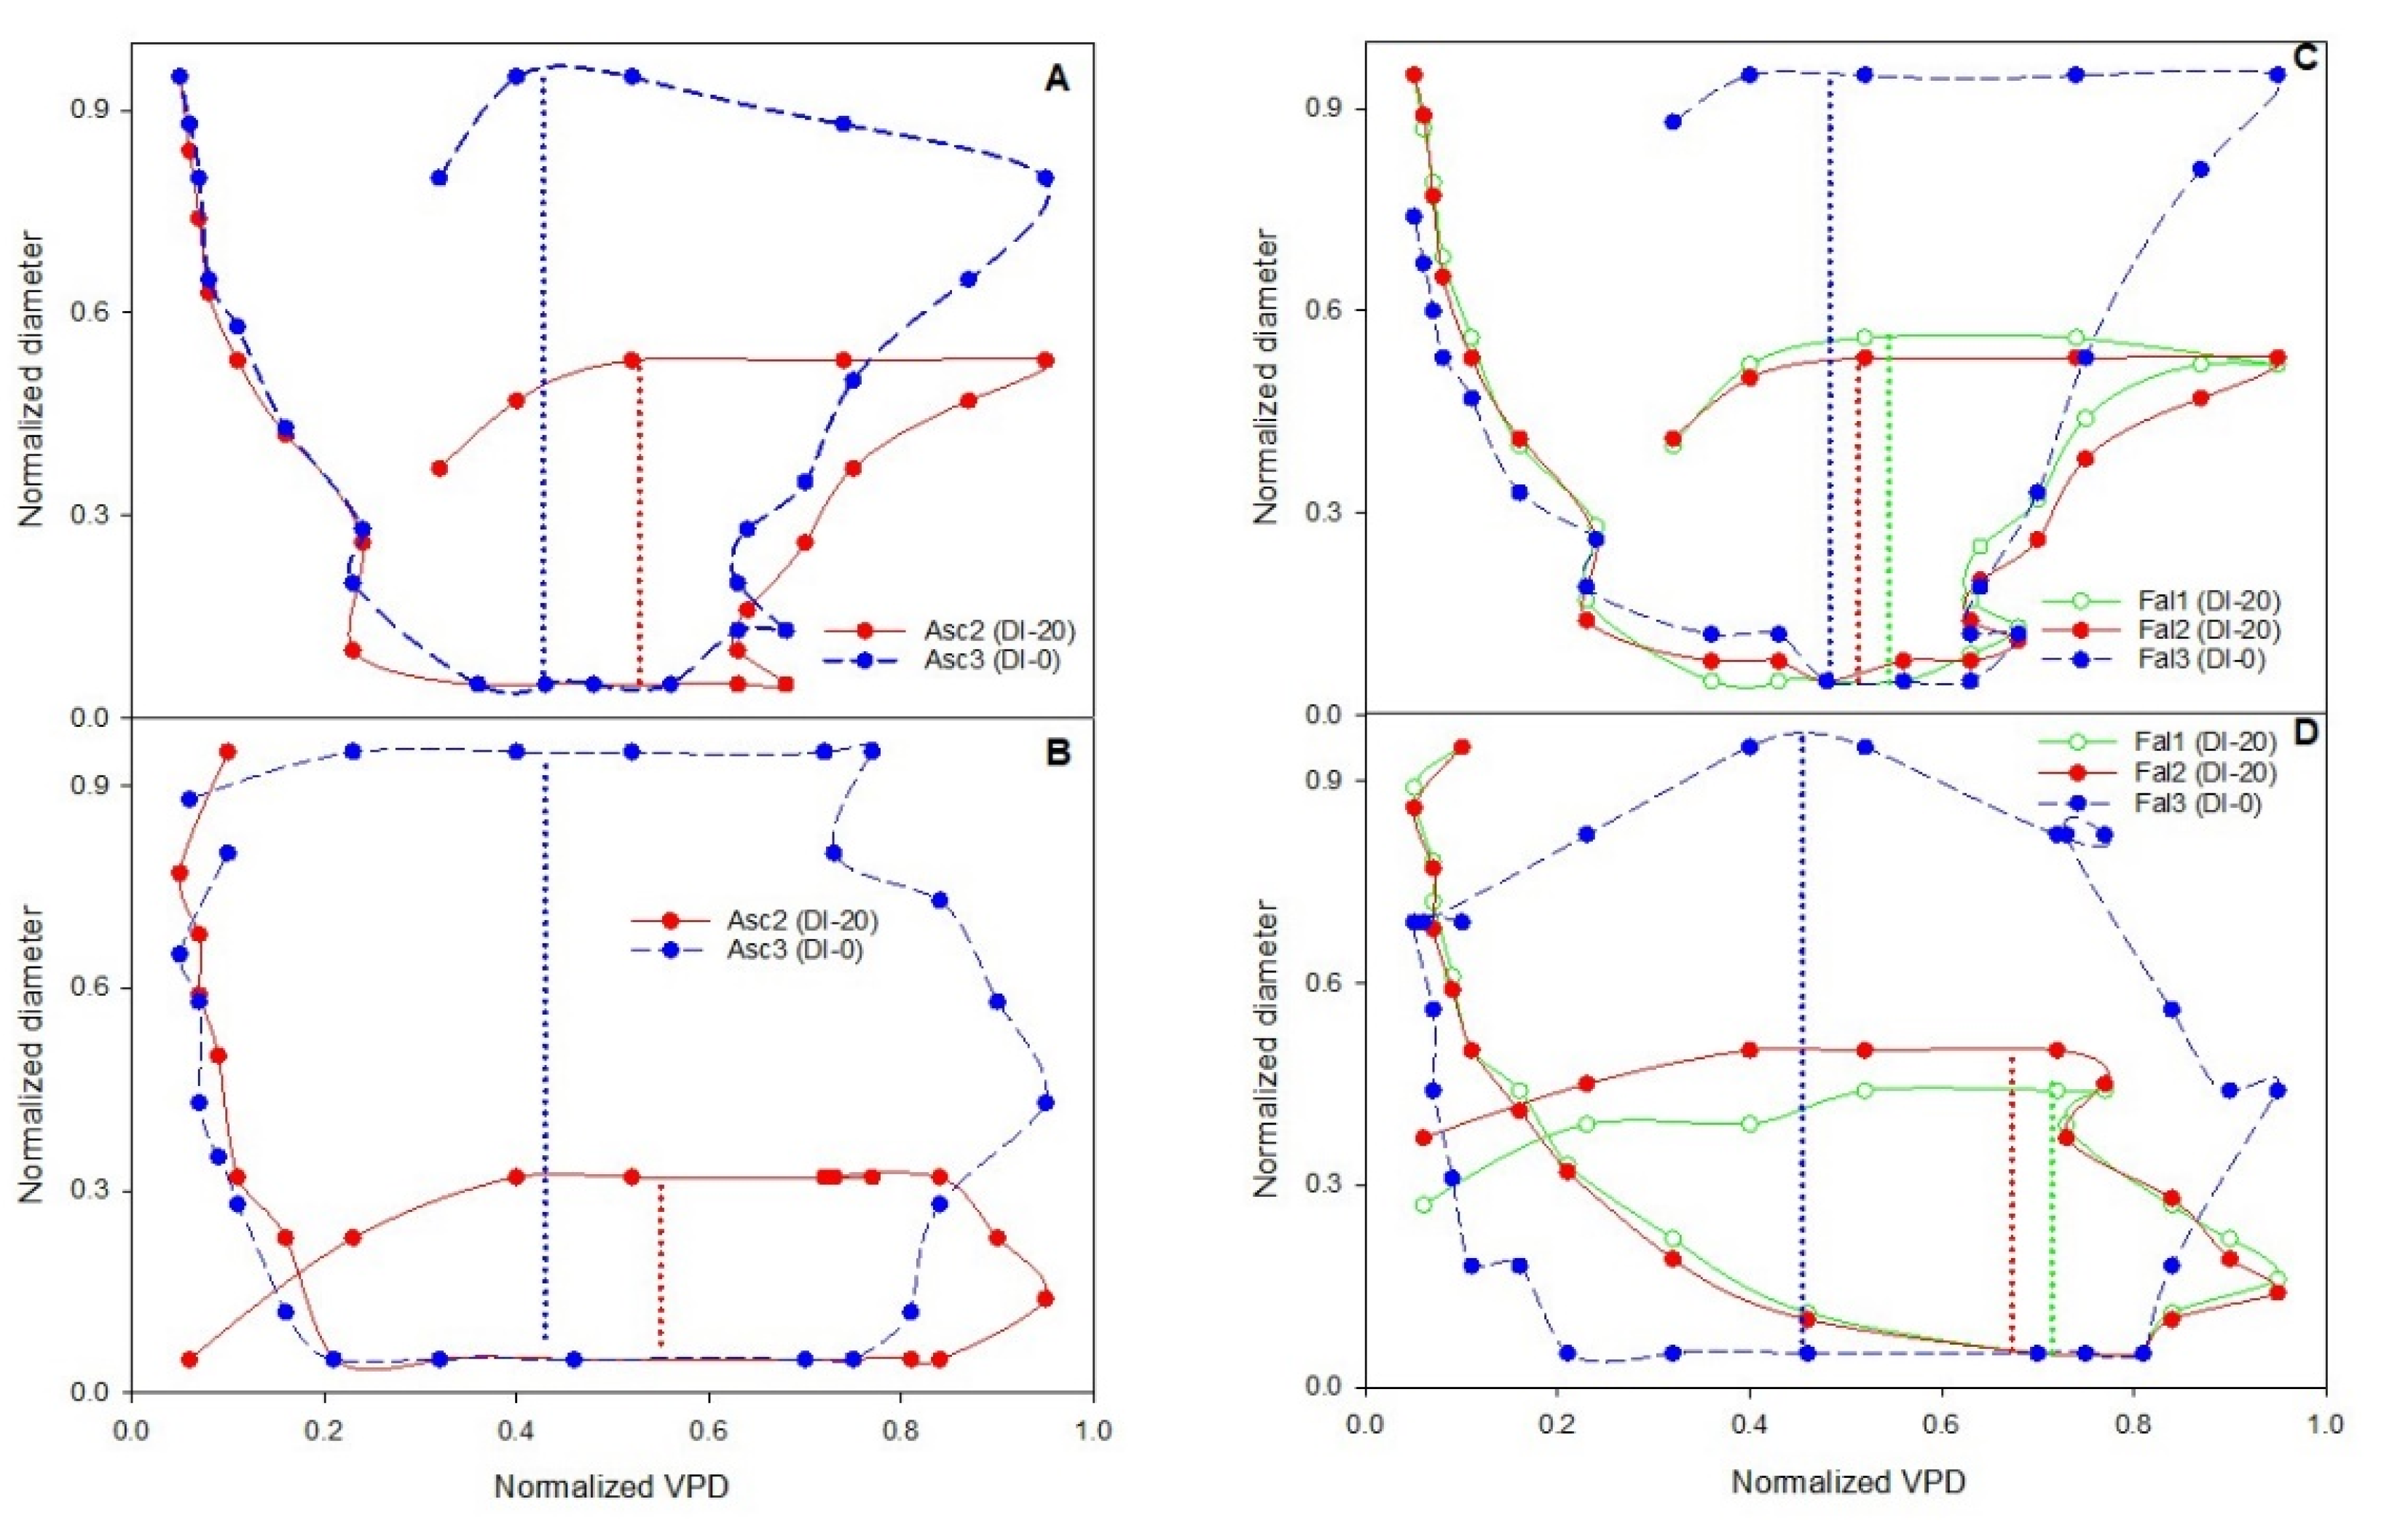
27] examined the “Frantoio” olive cultivar and explained the different hysteresis curves of the diameter versus the VPD during the second, third, and fourth phases of olive fruit development. According to this research, monitoring hysteretic loops and detecting the magnitude change could be used as a method for detecting the growth phases. In this research, the form, magnitude, and rotational pattern of hysteresis curve (loop) of transversal diameter versus VPD were investigated. It has been shown that VPD is especially important in woody plants, where it is the main variable affecting their diurnal evolution of transpiration [
47].
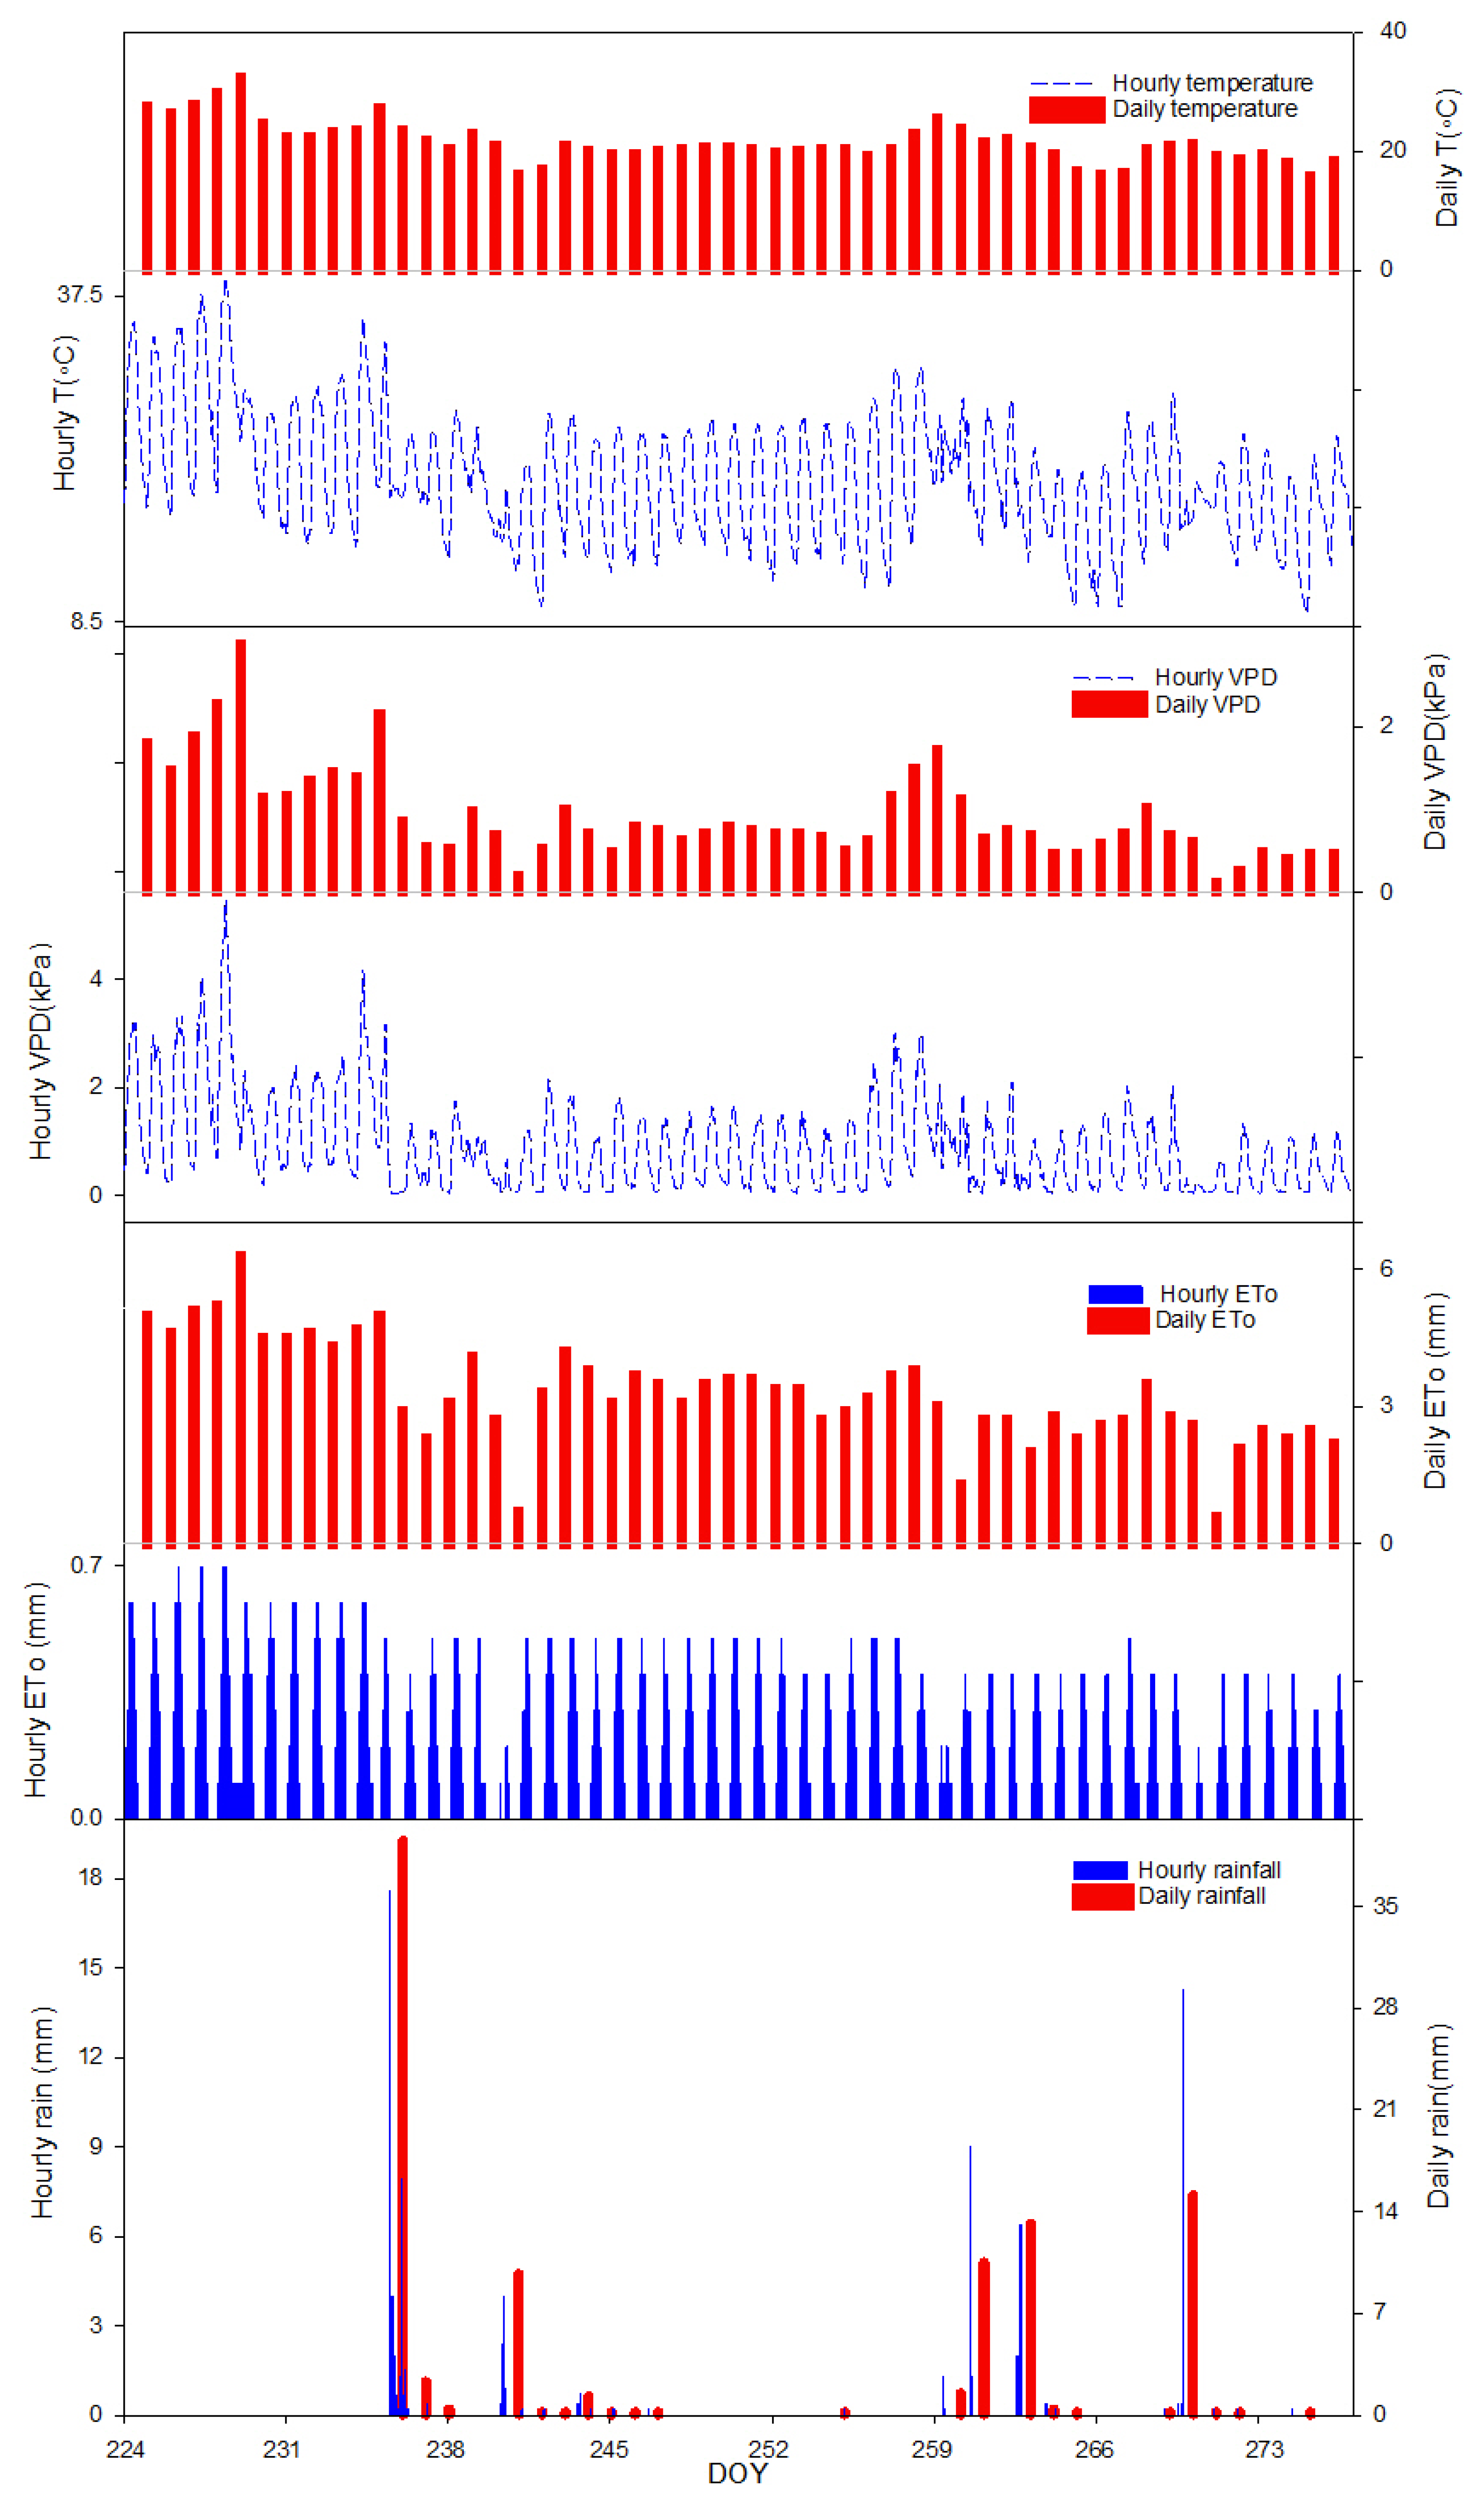
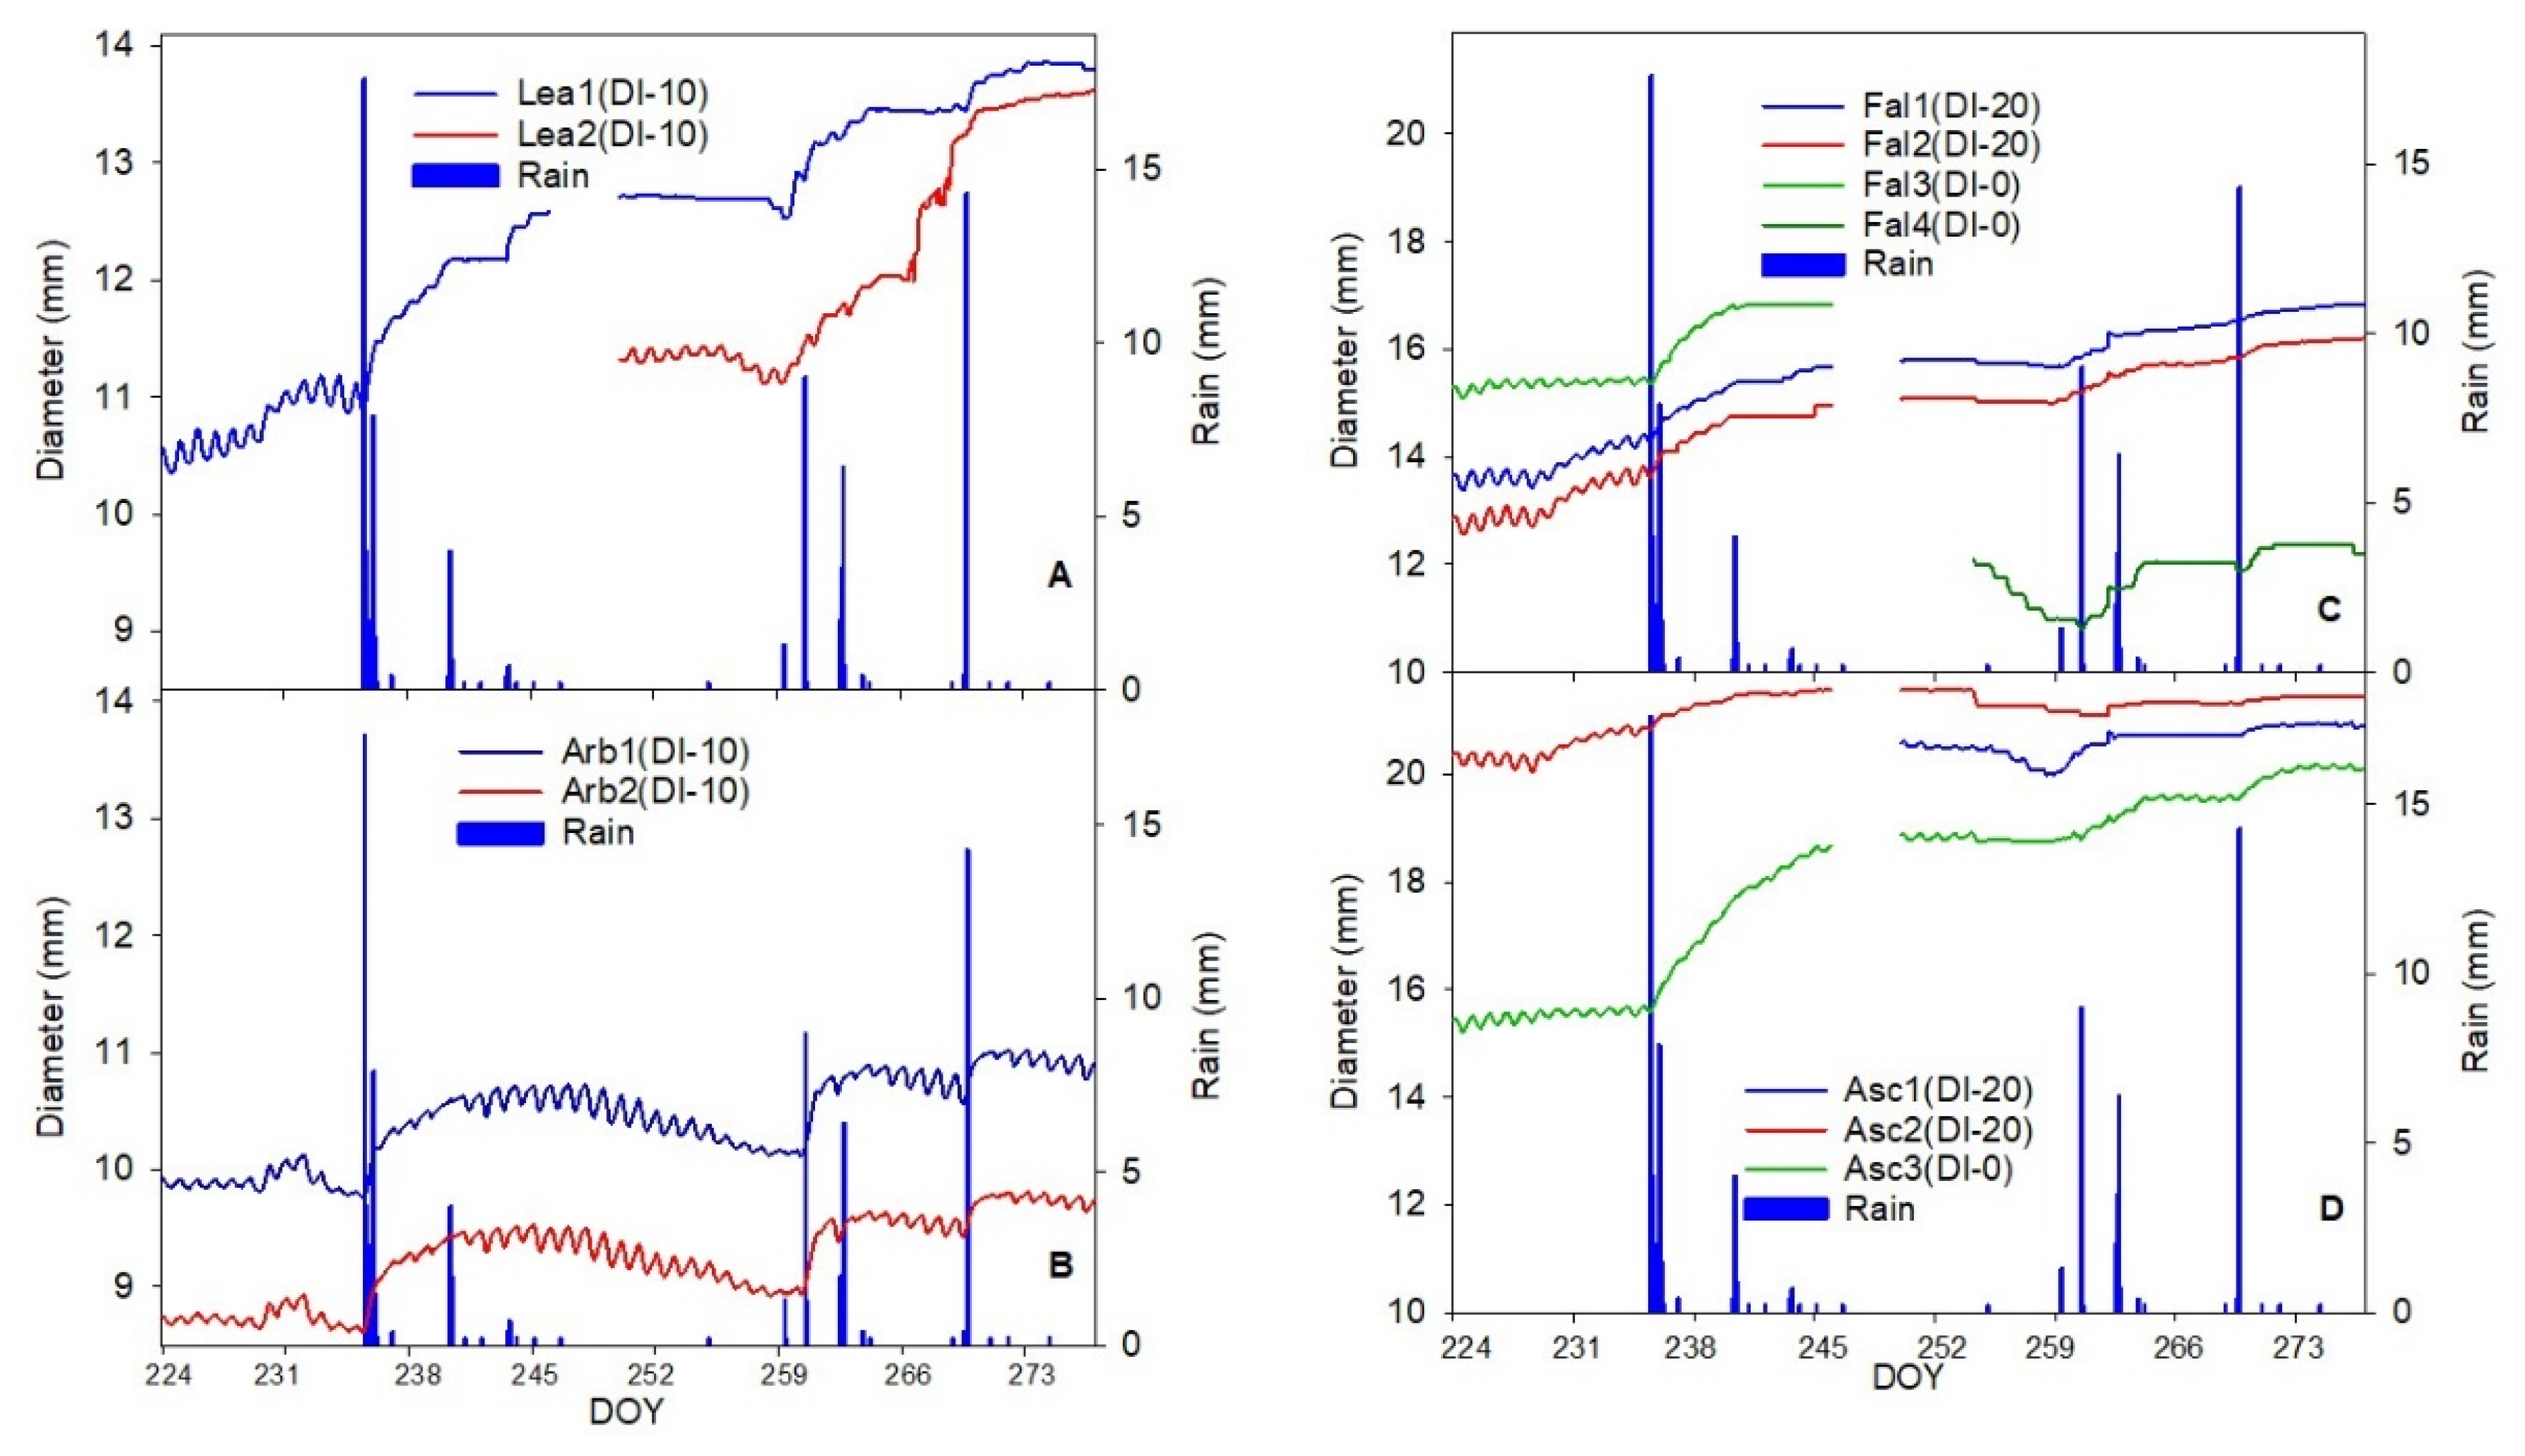
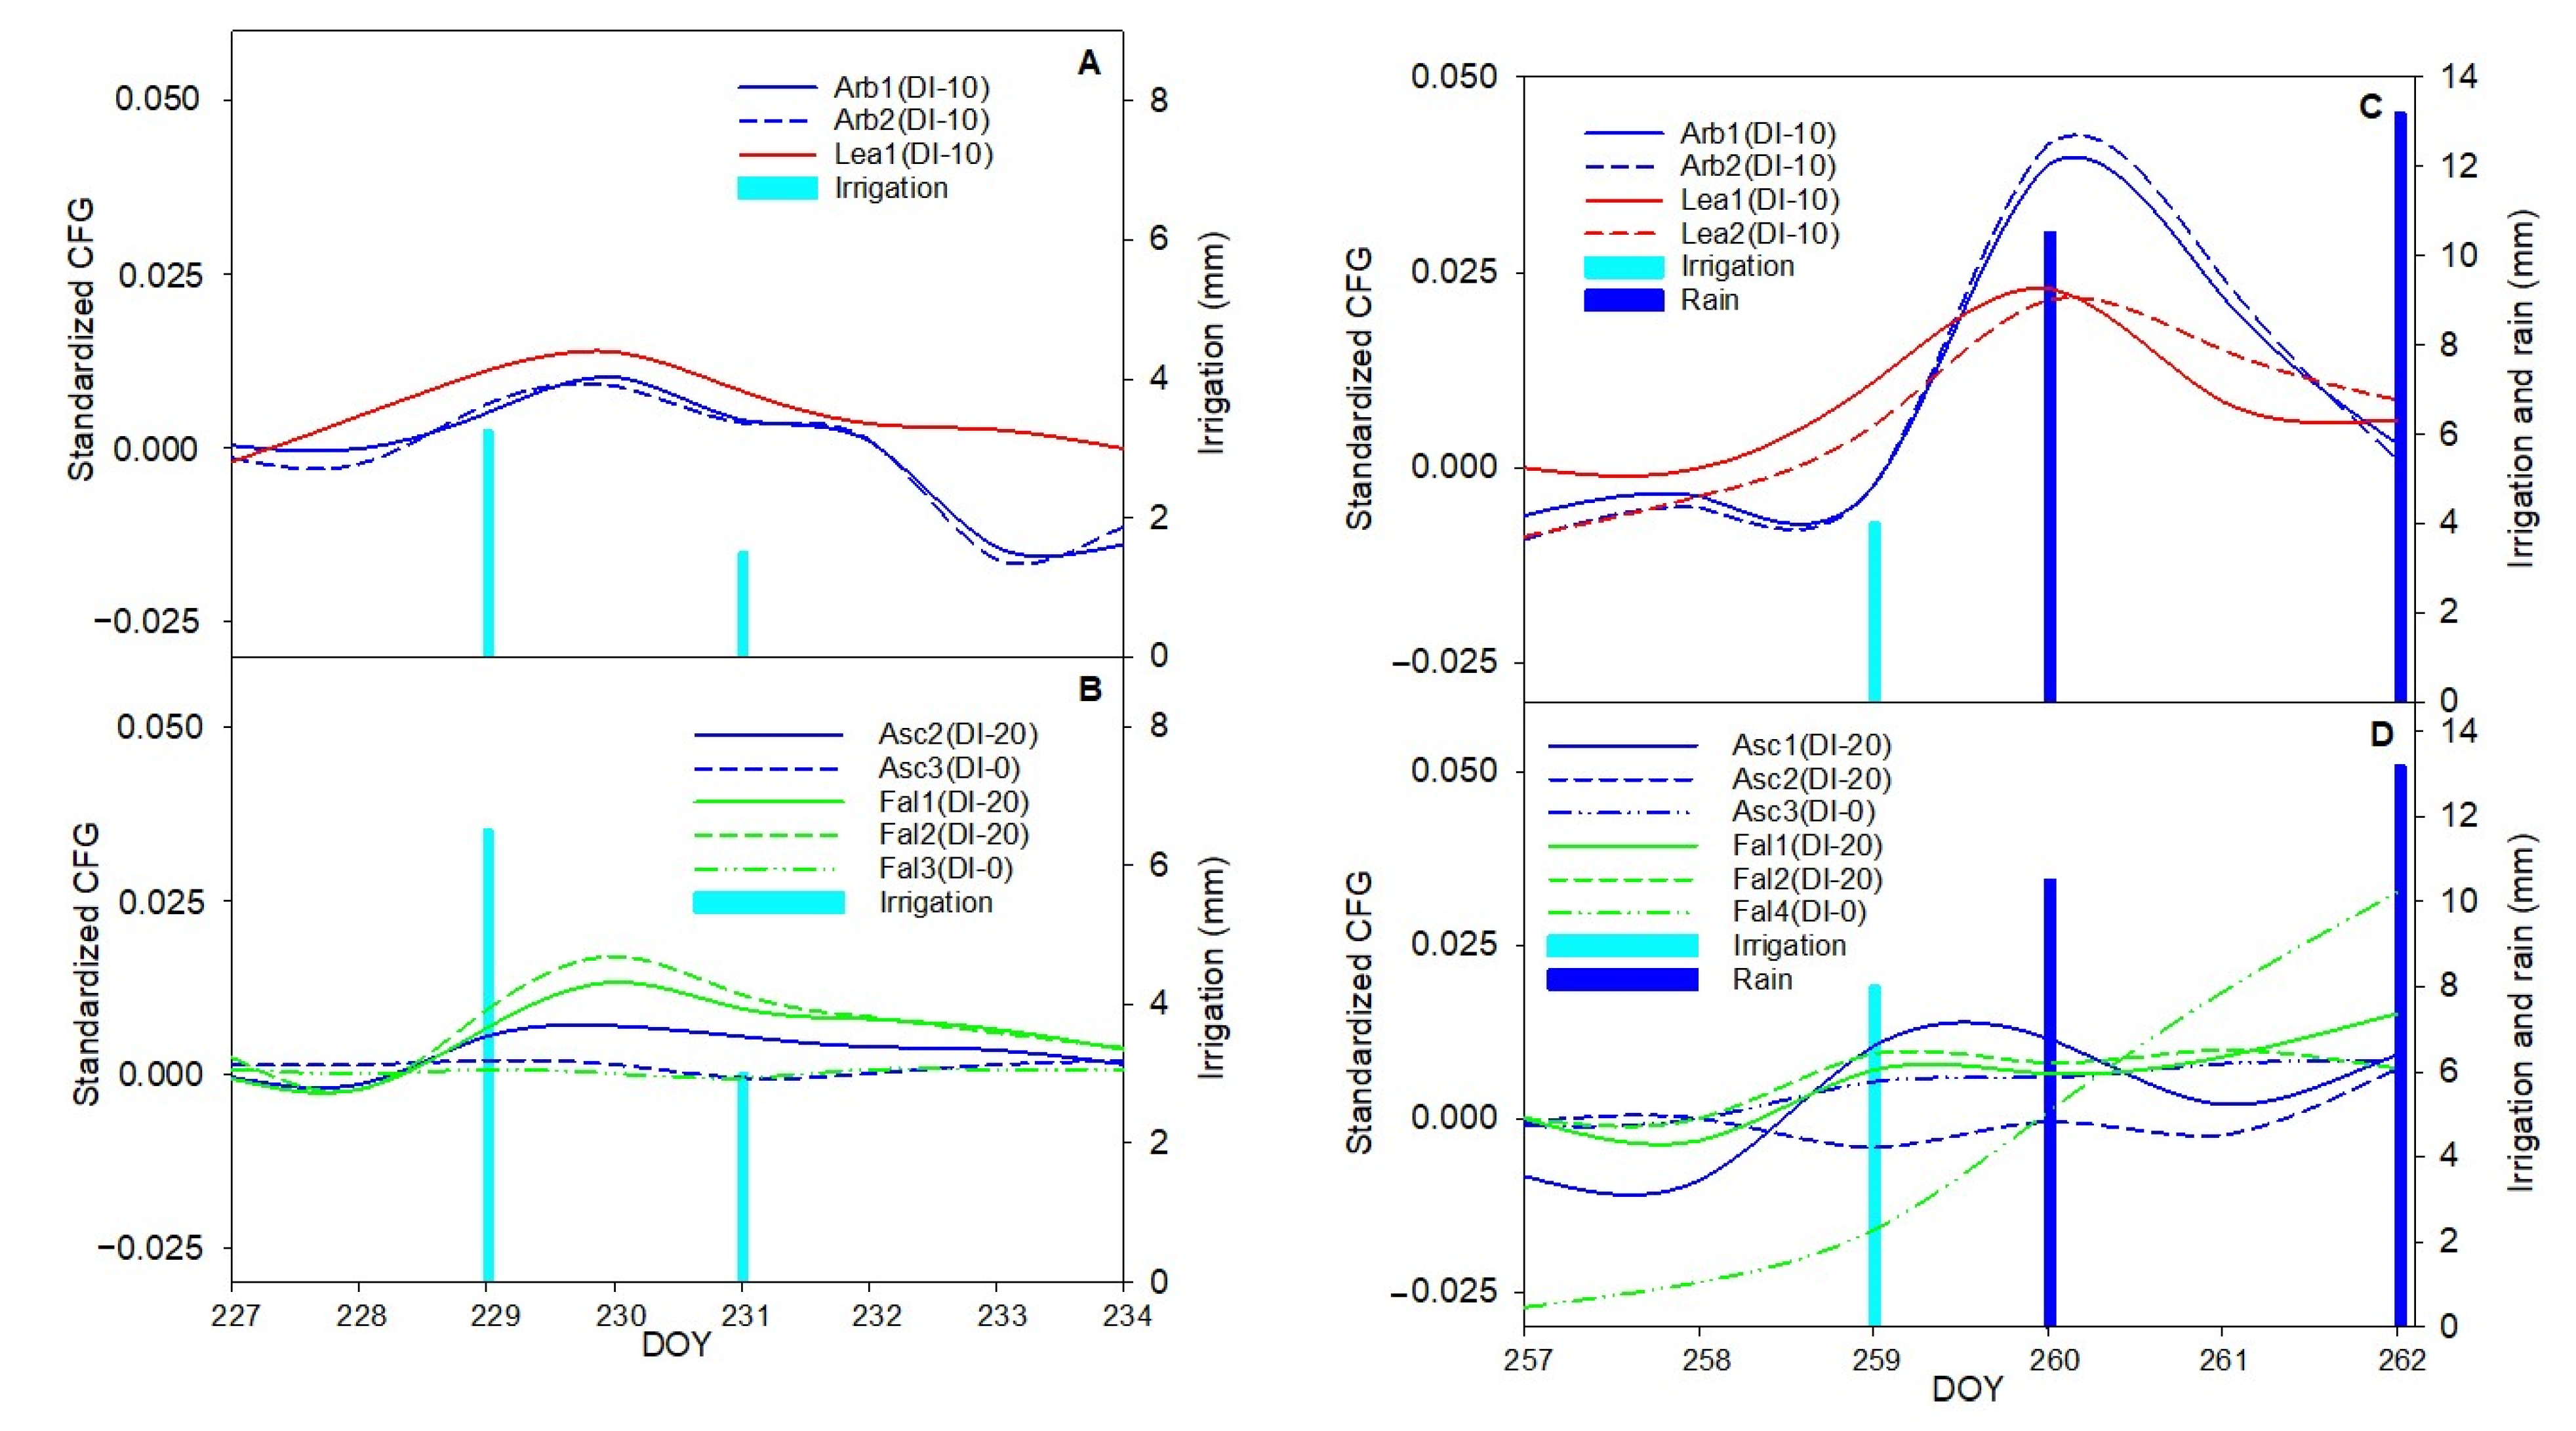
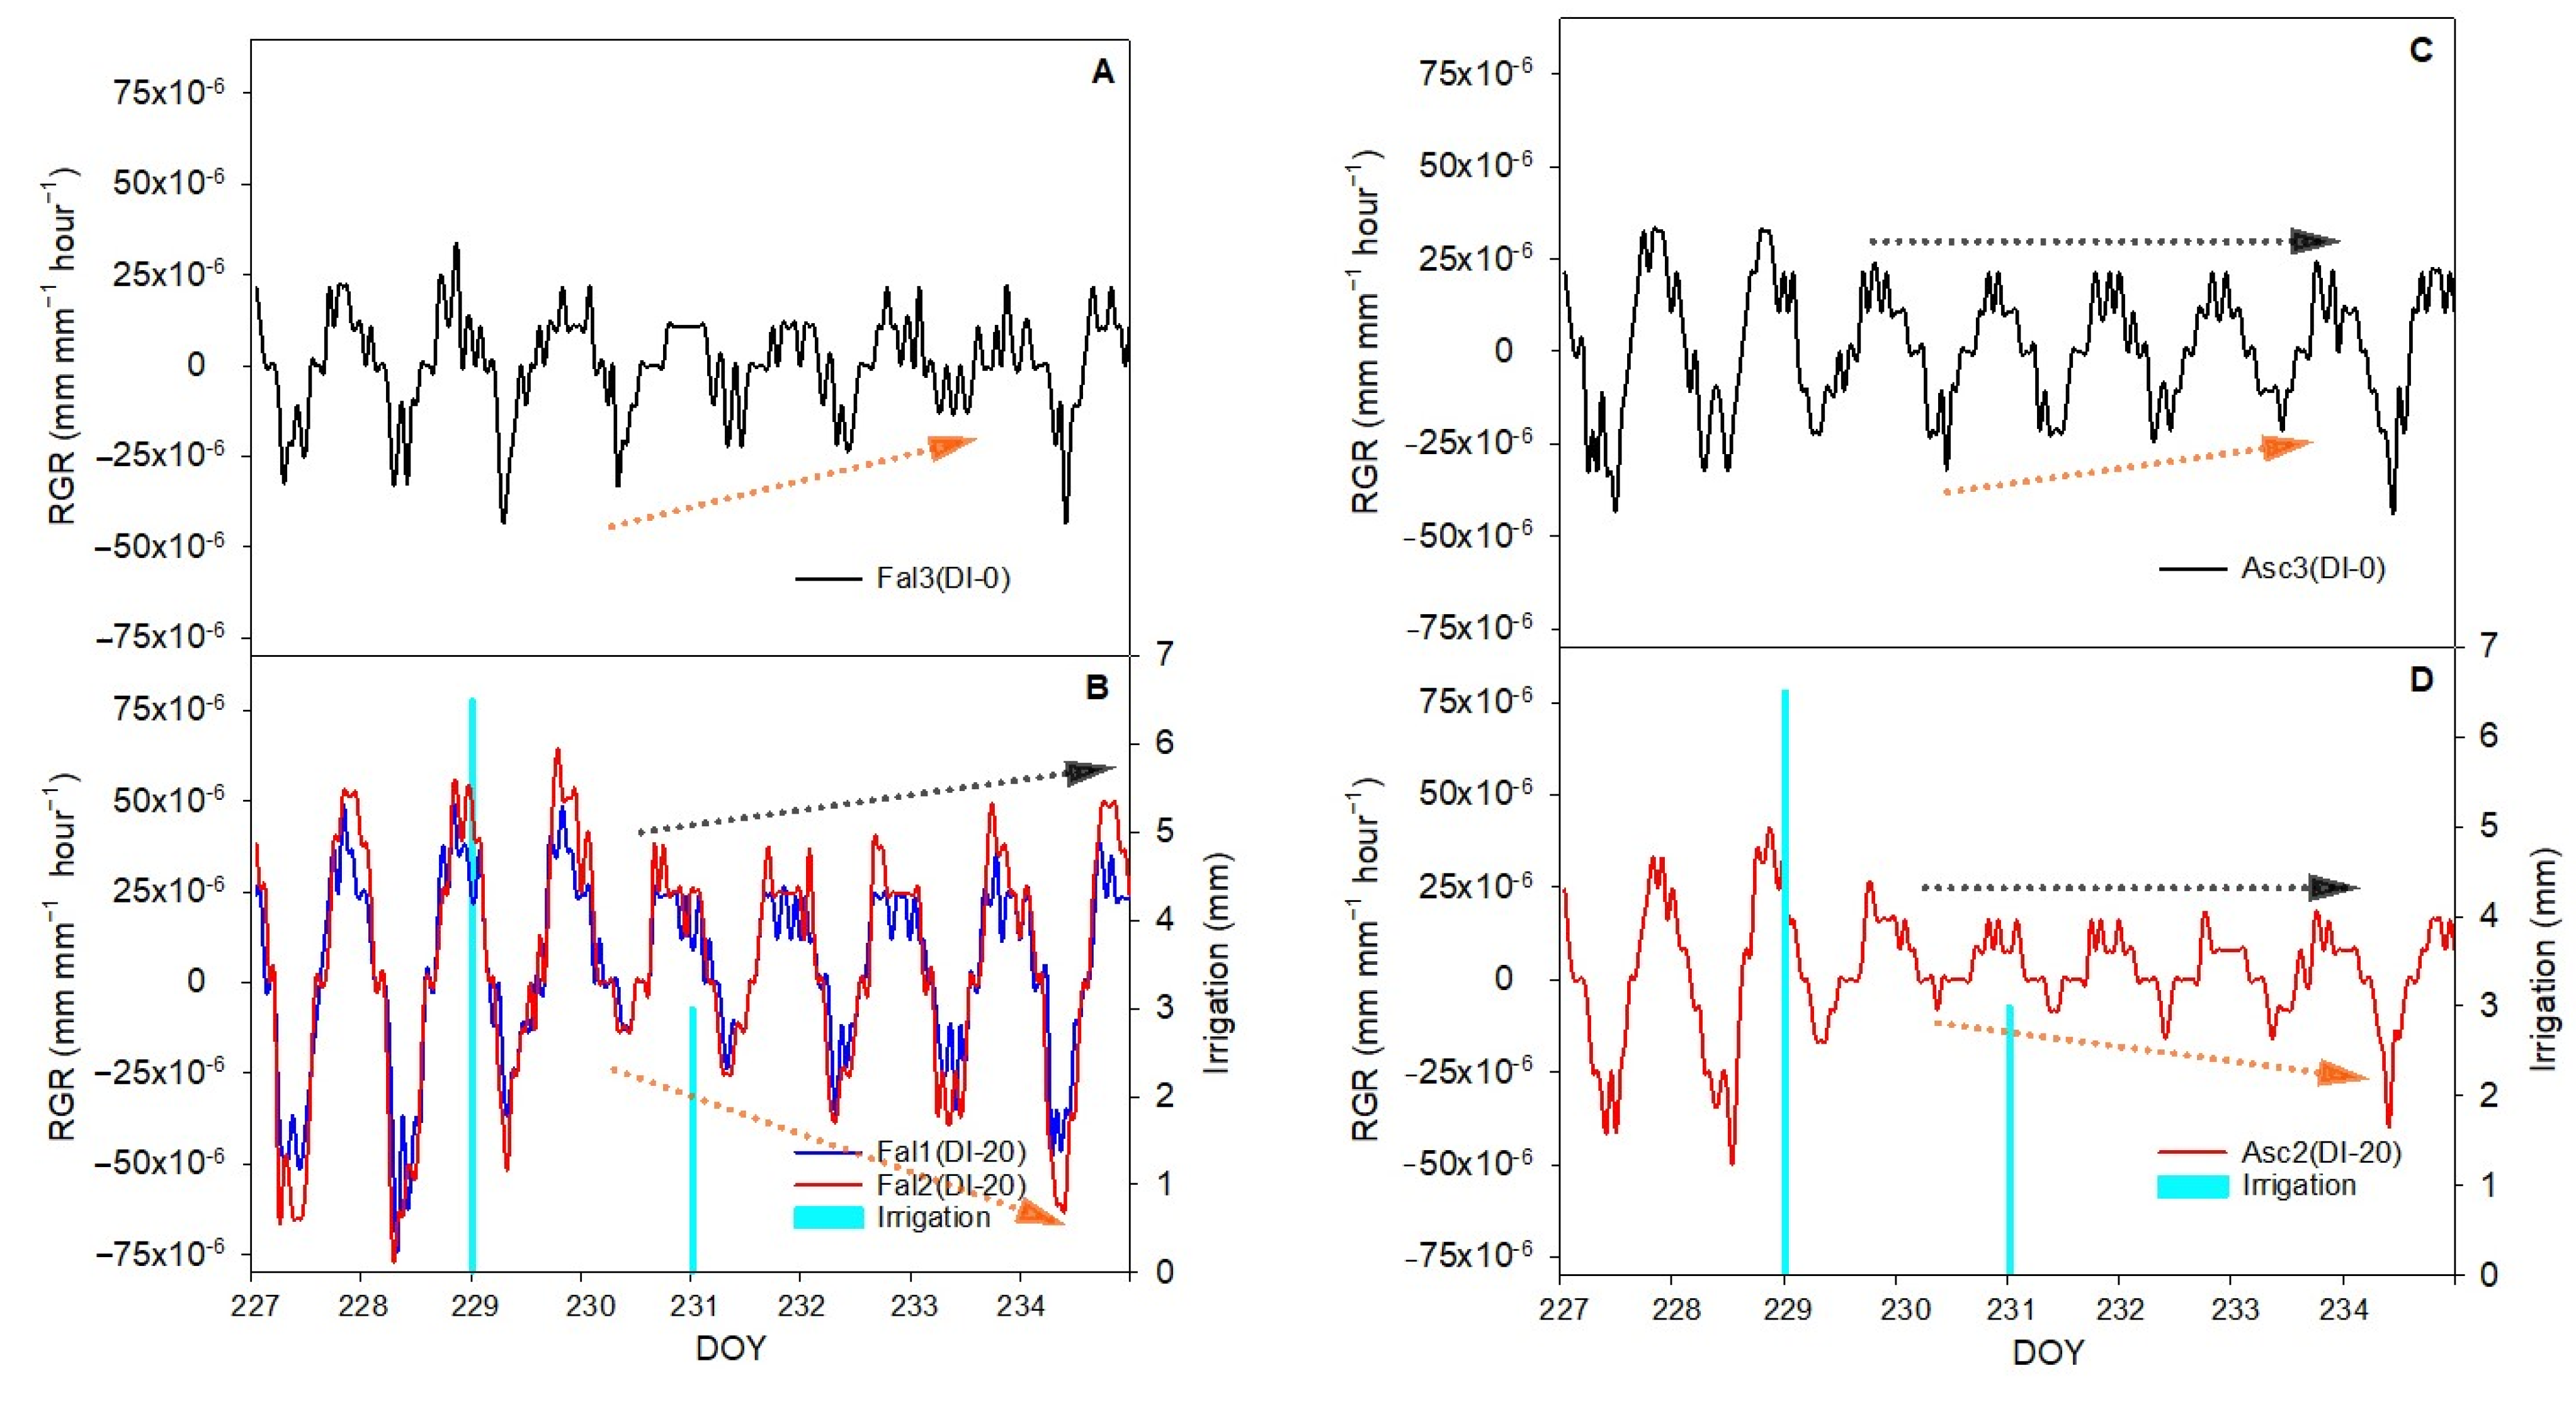
The aim of this work was to describe third phase of olive fruit development by continuous monitoring with extensimeter under regulated deficit irrigation regimes. Furthermore, we hypothesized the presence of hysteresis curves by examining the olive fruit diameter (FD) compared to VPD. We intended to provide some indexes for smart irrigation in relation to the regulated deficit irrigation in a key phenological stage of the fruit.


