Article

Identification of Suitable Reference Genes for qRT-PCR Normalization in Kiwifruit

1
College of Horticulture, Sichuan Agricultural University, Chengdu 611130, China
2
Institute of Pomology and Olericulture, Sichuan Agricultural University, Chengdu 611130, China
*
Author to whom correspondence should be addressed.
These authors contributed equally to this study.
Horticulturae 2022, 8(2), 170; https://doi.org/10.3390/horticulturae8020170
Submission received: 7 January 2022 / Revised: 13 February 2022 / Accepted: 14 February 2022 / Published: 18 February 2022

Abstract

:
Reference genes are used for the correction of qRT-PCR data, and it is necessary to investigate the optimum reference gene under certain conditions. The expression levels of seven traditional reference genes ACT1, ACT2, GAPDH, 18S rRNA, UBQ, TUB and CYP were analyzed using qRT-PCR in different varieties, tissues, developmental stages and hormone (or pollen polysaccharide) treatments in kiwifruit. Gene expression stability was assessed with the help of three common software (geNorm, NormFinder, BestKeeper), and the minimum number of reference genes necessary for normalization was also determined. GAPDH, ACT1 and ACT2 were selected as reference genes for different genotypes of kiwifruit. GAPDH and UBQ were the best combinations of reference genes for root, stem, leaf, flower and fruit. GAPDH and ACT1 could be the preferred reference genes for normalization of qRT-PCR data during fruit development. The pairing of ACT1 and UBQ constituted the optimal combination of reference genes in kiwifruit treated with different hormones (or pollen polysaccharide). This study provides a new and reliable option for the use of reference genes in the analysis of gene expression patterns of interest in kiwifruit.

1. Introduction

Quantitative real-time PCR (qRT-PCR) has become a mainstream method for gene expression analysis because of its high sensitivity, high specificity, good reproducibility, ease of operation and short time consumption [1,2,3]. When performing gene expression analysis on multiple samples, it is often necessary to ensure that the samples have the same RNA quality, cDNA yield and gene amplification efficiency, but in practice, it is often difficult to meet these conditions [4,5]. To eliminate differences in RNA quality, cDNA yield and gene amplification efficiency between samples, it is often necessary to introduce reference genes to normalize the qRT-PCR data [6].
Ideally, the reference gene should be independent of experimental factors and maintain stable transcript levels in all types of tissues and cells [7,8]. However, the study has shown that there is no absolute constant expression of a reference gene that is suitable for all experimental conditions, and that any one reference gene is only relatively consistently expressed under limited conditions [9]. The use of inappropriate reference genes for normalization can lead to bias in the quantitative data [10]. In order to obtain more reliable results, one or more reference genes need to be selected for calibration in the experiment [11,12].
As research into the molecular biology of kiwifruit has progressed, the study of kiwifruit gene regulation function has become a hot topic of research, and the analysis of gene expression patterns is an essential part of the study of gene function, so the selection of suitable reference genes is crucial [13]. Unfortunately, there are few reports on the systematic identification of kiwifruit reference genes [14], let alone literature on the screening of kiwifruit reference genes in different varieties and under hormone treatments. Therefore, in this study, qRT-PCR was used to analyze the expression of seven commonly used plant reference genes, including actin 1 (ACT1), actin 2 (ACT2), 3-phosphoglyceraldehyde dehydrogenase (GAPDH), 18S rRNA, polyubiquitin gene (UBQ), β-microtubulin gene (TUB) and procyclin gene (CYP), in different genotypes, tissues, fruit developmental stages and hormone (or pollen polysaccharide) treatments of kiwifruit. Meanwhile, the expression stability of reference genes was assessed using three software programs, geNorm [15], NormFinder [16] and BestKeeper [17], to select the appropriate reference genes for gene expression studies in kiwifruit.

2. Materials and Methods

2.1. Plant Materials and Treatments

The tested genotypes included Actinidia latifolia, Actinidia deliciosa ‘Qinmei’, ‘Hayward’ and Actinidia chinensis ‘Hort16A’, ‘Jinshi 1’, ‘Hongyang’ and ‘Hongshi 2’, and their fruits were sampled at 30 days after 75% flower drop. The roots, stems, leaves and flowers of ‘Jinshi 1’ were collected on 25 April, 2020, and fruits of ‘Jinshi 1’ were collected at 30, 55, 70, 95, 130 and 145 days after 75% flower drop. All samples were harvested in 2020 from the kiwifruit research base of the Sichuan Academy of Natural Resources Science (104°2′ E, 31°23′ N). ‘Jinshi 1’ potted live annual seedlings were treated with two hormones (melatonin (MT): M8600 and 14-hydroxybrassinosterol (HBR): B29511), and one pollen polysaccharide (PP), which are some of the substances that are beneficial in improving plant stress resistance, and the latter two substances are receiving a lot of attention. A total of eight processes were set up: CK (water), MT (50 μmol·L−1), PP1 (0.004 mg·L−1), PP2 (0.008 mg·L−1), HBR1 (0.01 mg·L−1), HBR2(0.12 mg·L−1), MT (50 μmol·L−1) + PP (0.008 mg·L−1), MT (50 μmol·L−1) + HBR (0.12 mg·L−1), with root irrigation every 20 days (1 L/time), normal water and fertilizer management for the rest of the year [18]. A total of nine pots per treatment, replicated three times. Leaves were collected from the fourth to eighth positions up the root after three treatments. All samples were then frozen in liquid nitrogen and stored at −80 °C for the following analysis.

2.2. RNA Isolation and cDNA Synthesis

Each sample was extracted for total RNA according to the Plant RNA Extraction Kit-V1.5 (Biofit, Chengdu, China). RNA quality was assessed in a spectrophotometer (Thermo Scientific, Waltham, MA, USA), with only RNA samples showing both an A260/280 ratio between 1.8 and 2.0 and A260/230 ratio more than 2.0 used for subsequent analysis. The integrity of RNA samples was assessed by electrophoresis in 1.0% agarose gels. The first strand of cDNA was synthesized according to the PrimeScript™ RT reagent kit with gDNA Eraser (TaKaRa, Dalian, China) using 1000 ng of total RNA in a 20 μL reaction system.

2.3. qRT-PCR Primer Design of Candidate Reference Genes

Seven candidate reference genes were selected based on literature, including ACT1, ACT2, GAPDH, 18S rRNA, UBQ, TUB and CYP. Five of seven tested primer pairs (ACT1, ACT2, GAPDH, 18S rRNA, UBQ) were obtained from existing reports [16]. The remaining two primer pairs were derived from the kiwifruit genome database (http://kiwifruitgenome, accessed on 7 December 2021). The sequences of the tested primer pairs are shown in Table 1.

2.4. Quantitative Real-Time PCR Analysis

The qRT-PCR assay was performed using the CFX96 real-time PCR system (Bio-Rad, Hercules, CA, USA). qRT-PCR assays were carried out in 20 µL reaction volumes, which contained 1.5 µL diluted cDNA (1:100), 1.6 µL primers (0.32 µM forward and reverse primers), 10 µL TB GreenTM Premix Ex TaqTM Ⅱsolution and 6.9 µL sterile water. The amplification program was at 95 °C for 30 s, 40 cycles of 95 °C for 5 s and 58 °C for 31 s and a final step for dissociation at 95 °C for 10 s, 65 °C for 30 s and 95 °C for 15 s. Each reaction included three biological replicates with three technical duplicates.

2.5. Standard Curve of Candidate Reference Genes

The standard curves referred to the method of Khanlou et al. [19]. After mixing equal amounts of cDNA from all kiwifruit samples and diluting them into six concentration gradients in sequence with a 5-fold gradient, the expression abundance of the seven reference genes was analyzed using the diluted mixed samples as templates, and the corresponding standard curve for each gene was plotted with the Ct value and the dilution number. The amplification efficiency (E) of the reference genes can be calculated according to the slope of the standard curve, which is calculated as E = [5(1/slope) −1] × 100%. Only reference genes with an amplification efficiency in the range of 90% to 110% are eligible for subsequent analysis [20].

2.6. Data Analysis

The Ct values for each reaction were obtained directly using Bio-Rad CFX Manager v2.0 software (Bio-Rad, Hercules, CA, USA). The arithmetic mean of the Ct values was calculated by Microsoft Excel 2010, and expression stability of seven reference genes was evaluated using the following three software programs: geNorm, NormFinder and BestKeeper (https://seqyuan.shinyapps.io/seqyuan_prosper/, accessed on 23 December 2021).

3. Results

3.1. Amplification Efficiency of Candidate Reference Genes

The amplification efficiency of the genes was calculated by performing qRT-PCR using a 5-fold gradient dilution of an equal volume of mixed cDNA of all kiwifruit samples for testing as the template, followed by plotting the standard curve. The correlation coefficients (Table 2) for all seven reference genes were above 0.98, with good linearity. The amplification efficiencies (Table 2) of all the reference genes except 18S rRNA reached 91~107%, indicating good primer specificity and reliable quantification results, which met the requirements of the subsequent experiments.

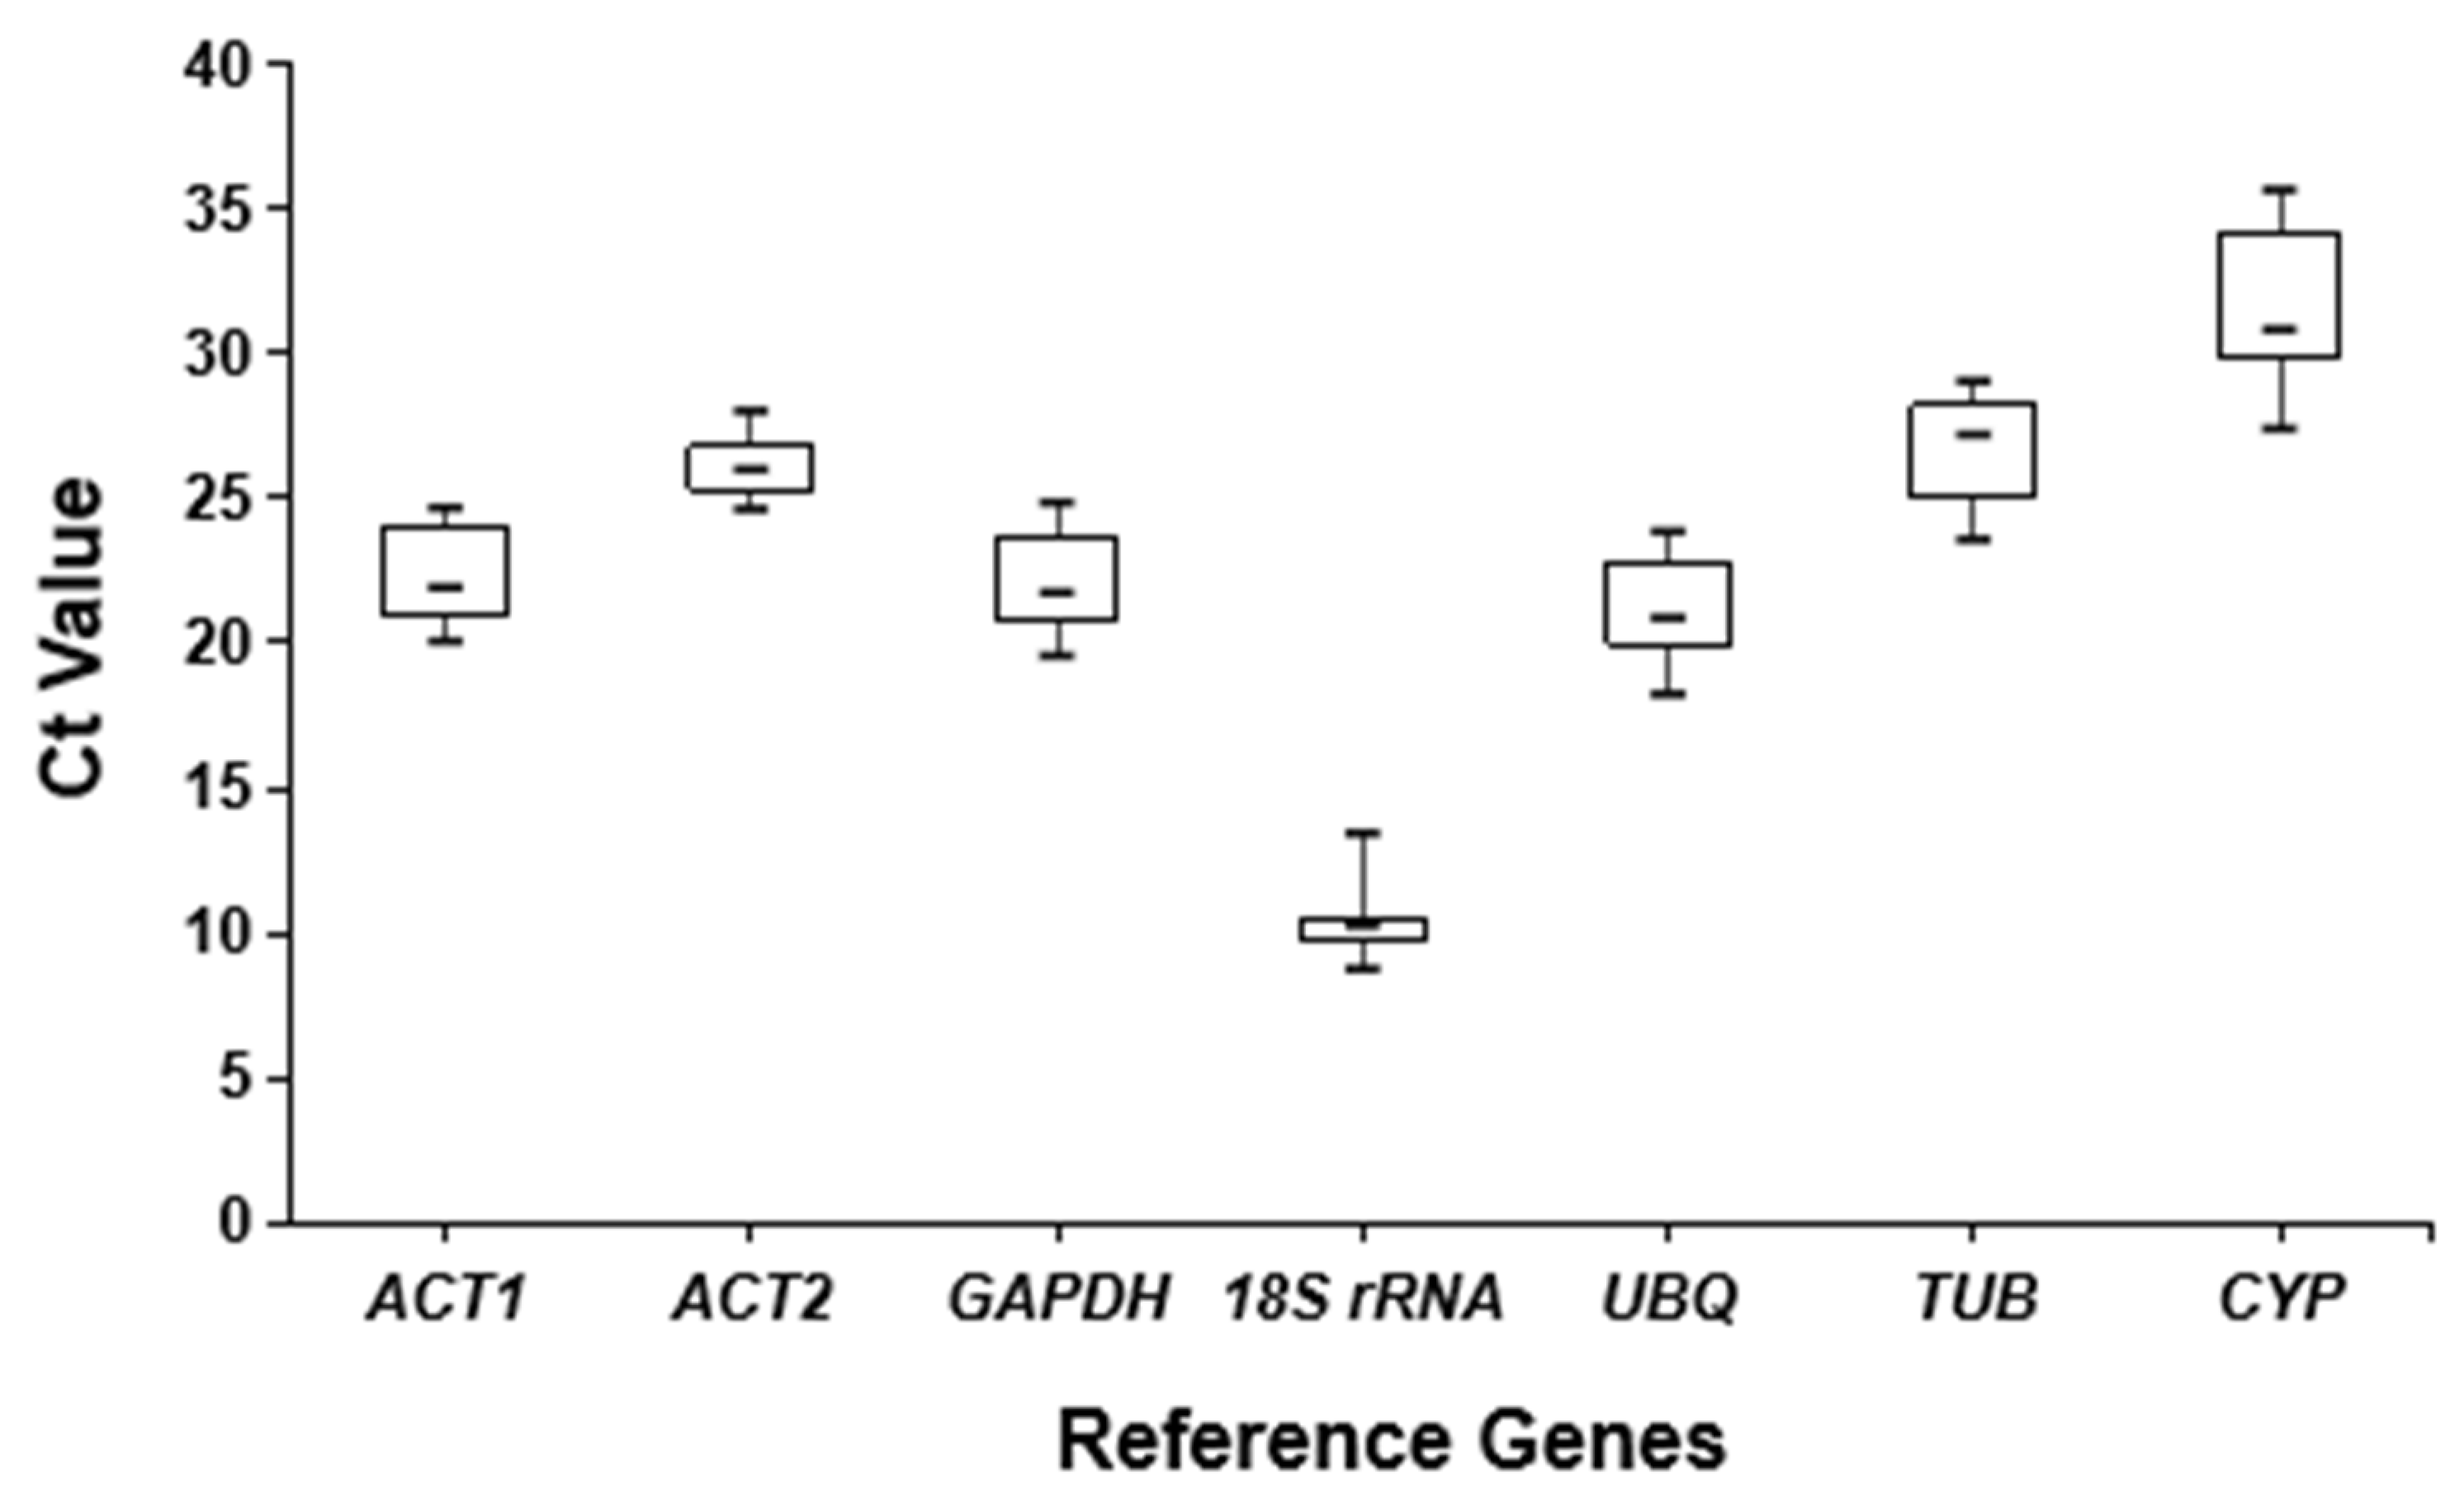
3.2. Expression Analysis of Candidate Reference Genes

The Ct value reflects the transcriptional level of the gene; the higher the Ct value, the lower the transcriptional level of the gene. The expression abundance of the seven reference genes varied from sample to sample (Figure 1). 18S rRNA had a low Ct value, suggesting that expression abundance was highest; CYP had about twice the Ct value of 18S rRNA and therefore had the lowest expression abundance, while the expression of the remaining five genes was at an intermediate level.

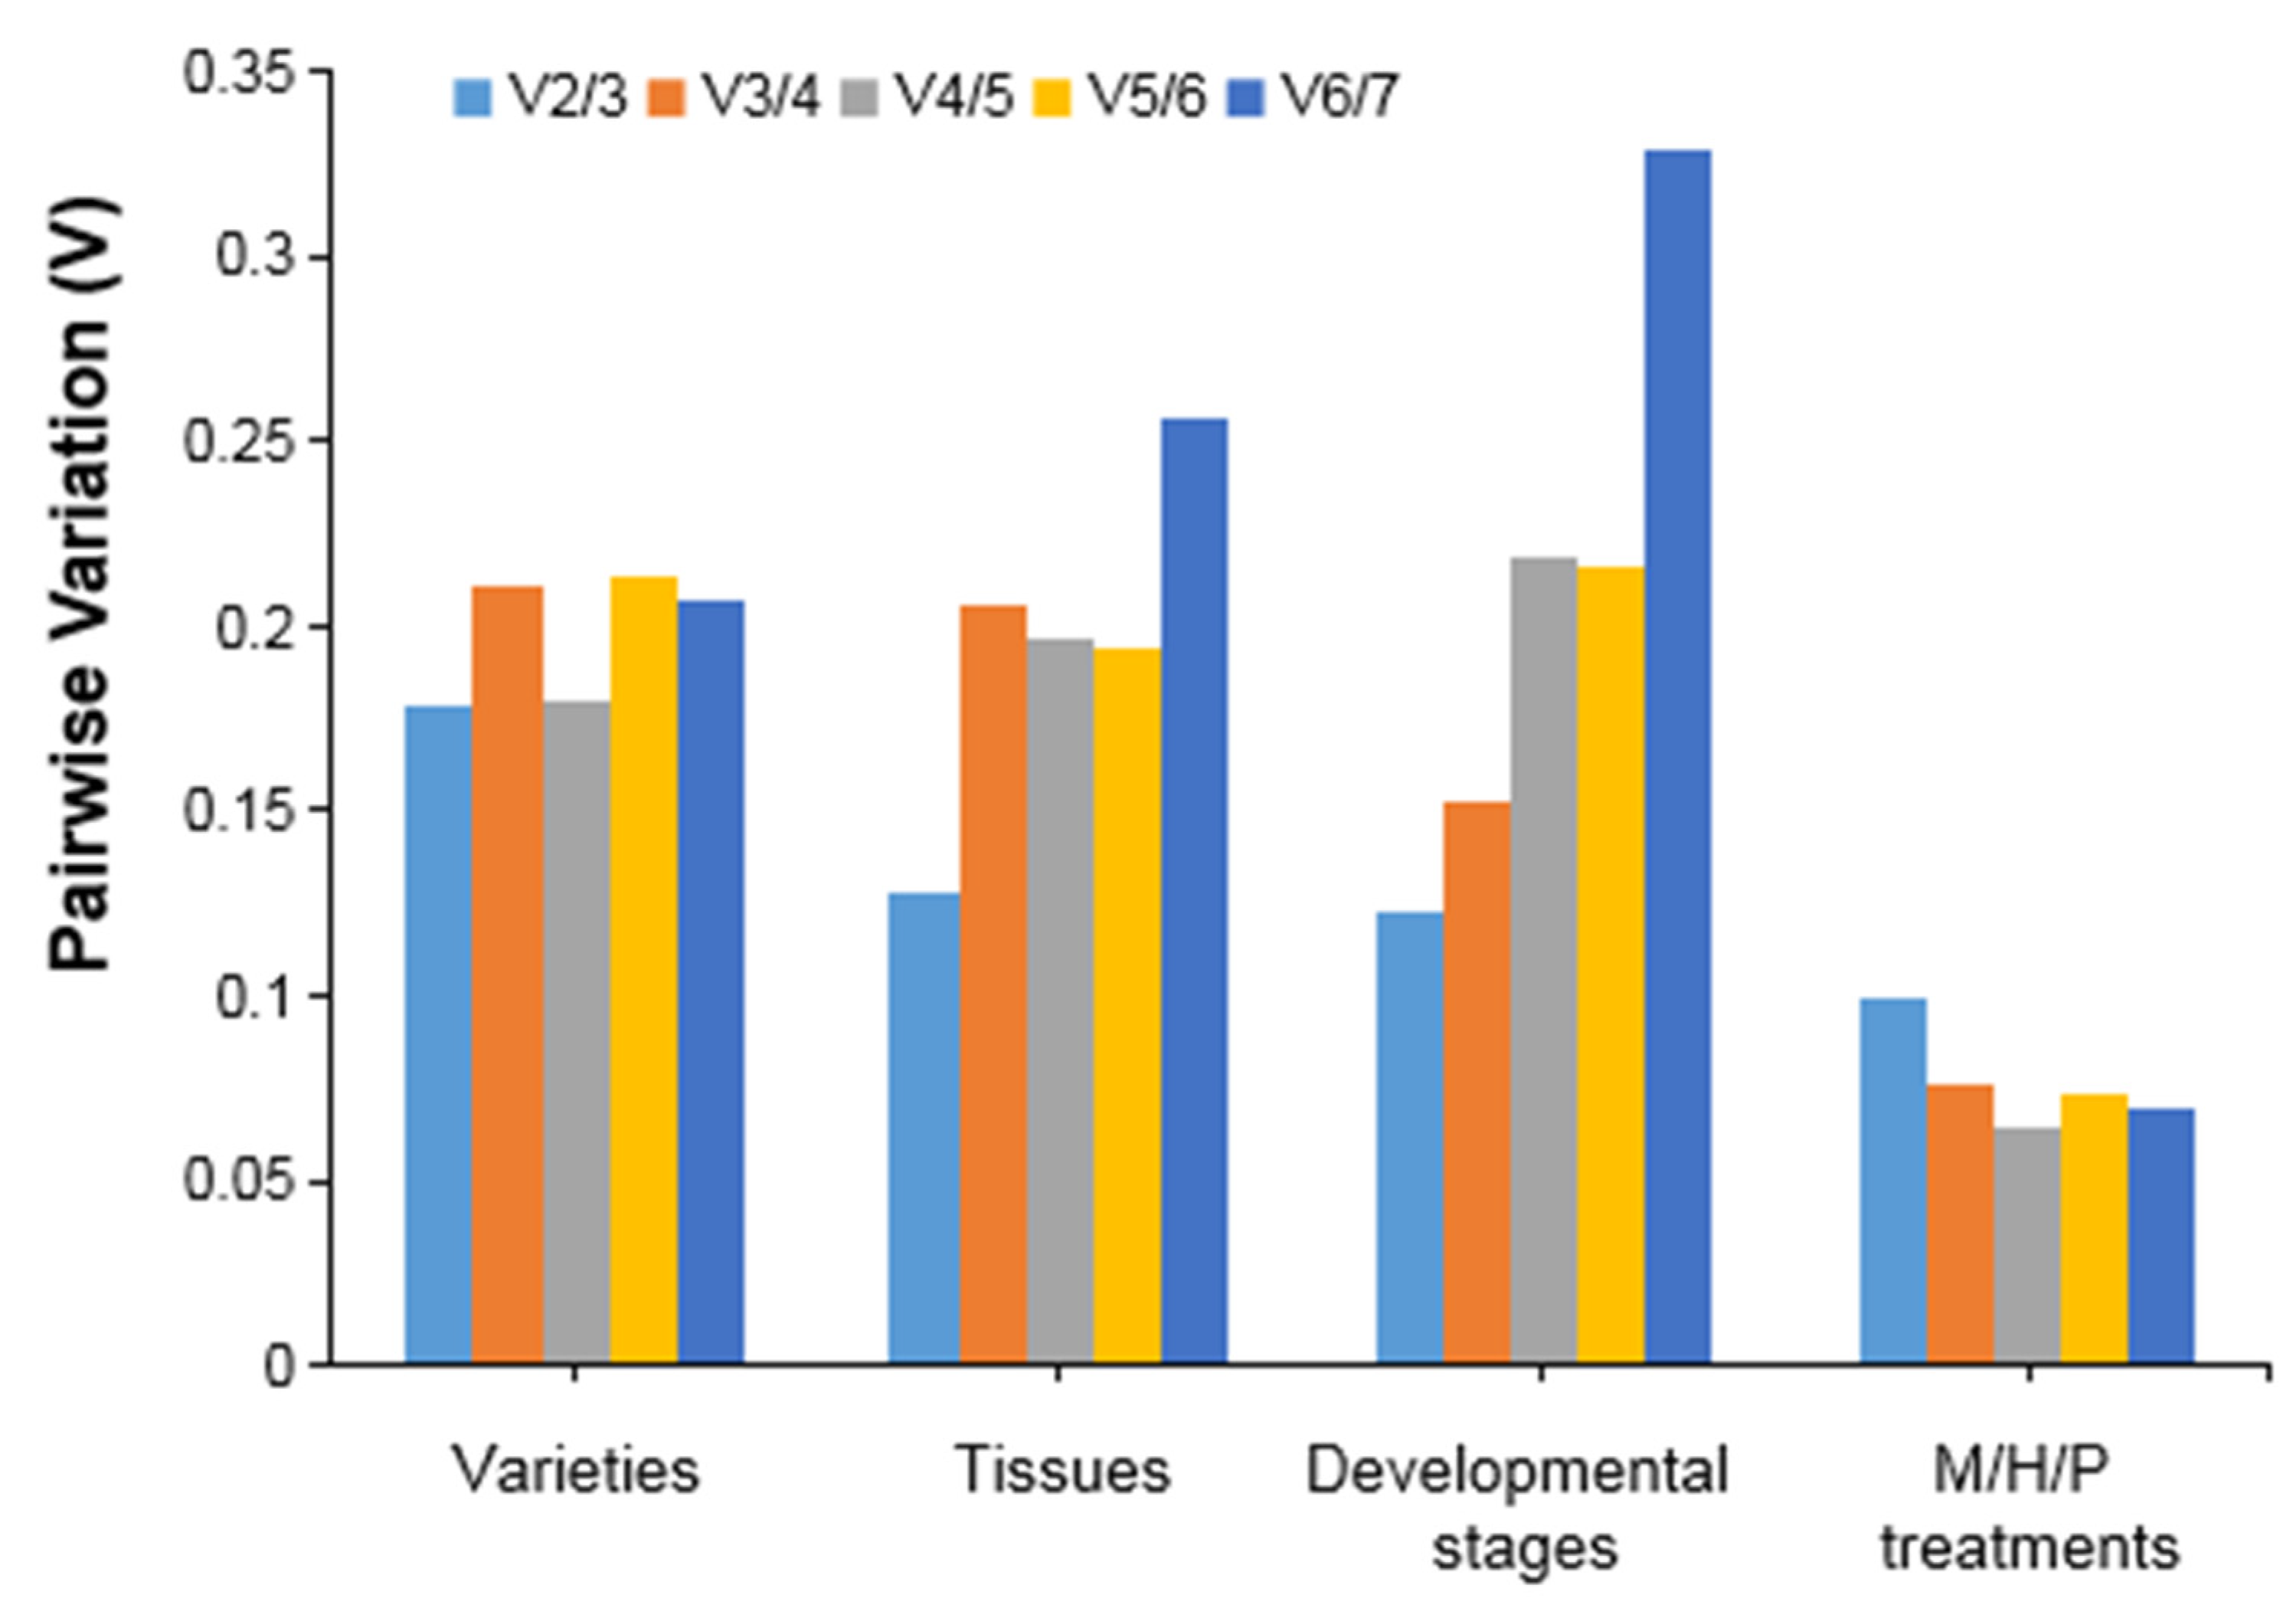
3.3. Expression Stability Analysis of Candidate Reference Genes

The geNorm software determines gene stability by calculating the gene expression stability value (M), which is generally considered to be more stable if the M value is less than 0.5, and the lower the M value, the more stable the gene is. As shown in Table 3, GAPDH was the most stable gene in nearly all kiwifruit samples. In addition, the M values of 18S rRNA and CYP were less than 0.5 in the fruit of seven different genotypes, and they were also stable, while in the ‘Jinshi 1’ roots, stems, leaves, flowers and fruits, 18S rRNA and CYP were less stable, and ACT1 and UBQ were the most stable genes. In the ‘Jinshi 1’ fruit development, the M values of ACT1 and ACT2 were about 0.3, which also had good stability. Considering the result from all the hormone (or pollen polysaccharide)-treated samples, the M values of all seven genes were less than 0.5, indicating that the transcript levels of the seven genes were stable.
geNorm also calculated the pairwise variation (Vn/n+1) to determine the minimum number of reference genes. When the pairwise variation Vn/n+1 is below 0.15, n reference genes are sufficient to correct the data, and conversely, n + 1 reference genes are required. The values of V2/3 for all samples except for the different genotypes were between 0.09 and 0.13 (Figure 2), indicating that two reference genes were sufficient for qRT-PCR data normalization under these conditions. In contrast, the V2/3 values for the different varieties were greater than 0.15 (Figure 2), indicating that the combination of the two reference genes was less stable and that a third reference gene needed to be introduced.
The NormFinder software differs from the geNorm algorithm but also judges gene expression stability based on the M value of the gene; the smaller the M value, the better the stability. The best reference gene screened by NormFinder was similar to the results of the geNorm analysis. GAPDH was the most consistently expressed gene in the non-hormone (or pollen polysaccharide)-treated kiwifruit samples, while ACT1 showed the best stability in the eight different hormone (or pollen polysaccharide)-treated kiwifruit samples (Table 4).
BestKeeper software assesses the expression stability of genes on the basis of the following variables: the standard deviation (SD) and coefficient of variation (CV). SD values of genes less than 1 are considered to be good expression stability, and the smaller the SD and CV values, the better the gene stability. Slightly different from the two previous algorithms for ranking, the results obtained with the BestKeeper algorithm (Table 5) revealed that all five genes except for UBQ and TUB were stable, as their SD values were less than 0.5 among the different varieties. The transcript levels of TUB and CYP were unstable in ‘Jinshi 1’ different tissues and fruits at various developmental stages, whereas the remaining five genes were all relatively stable. The SD values of all seven genes in kiwifruit leaves treated with different hormones (or pollen polysaccharide) were less than 1, indicating that these seven genes had stable expression under this condition.

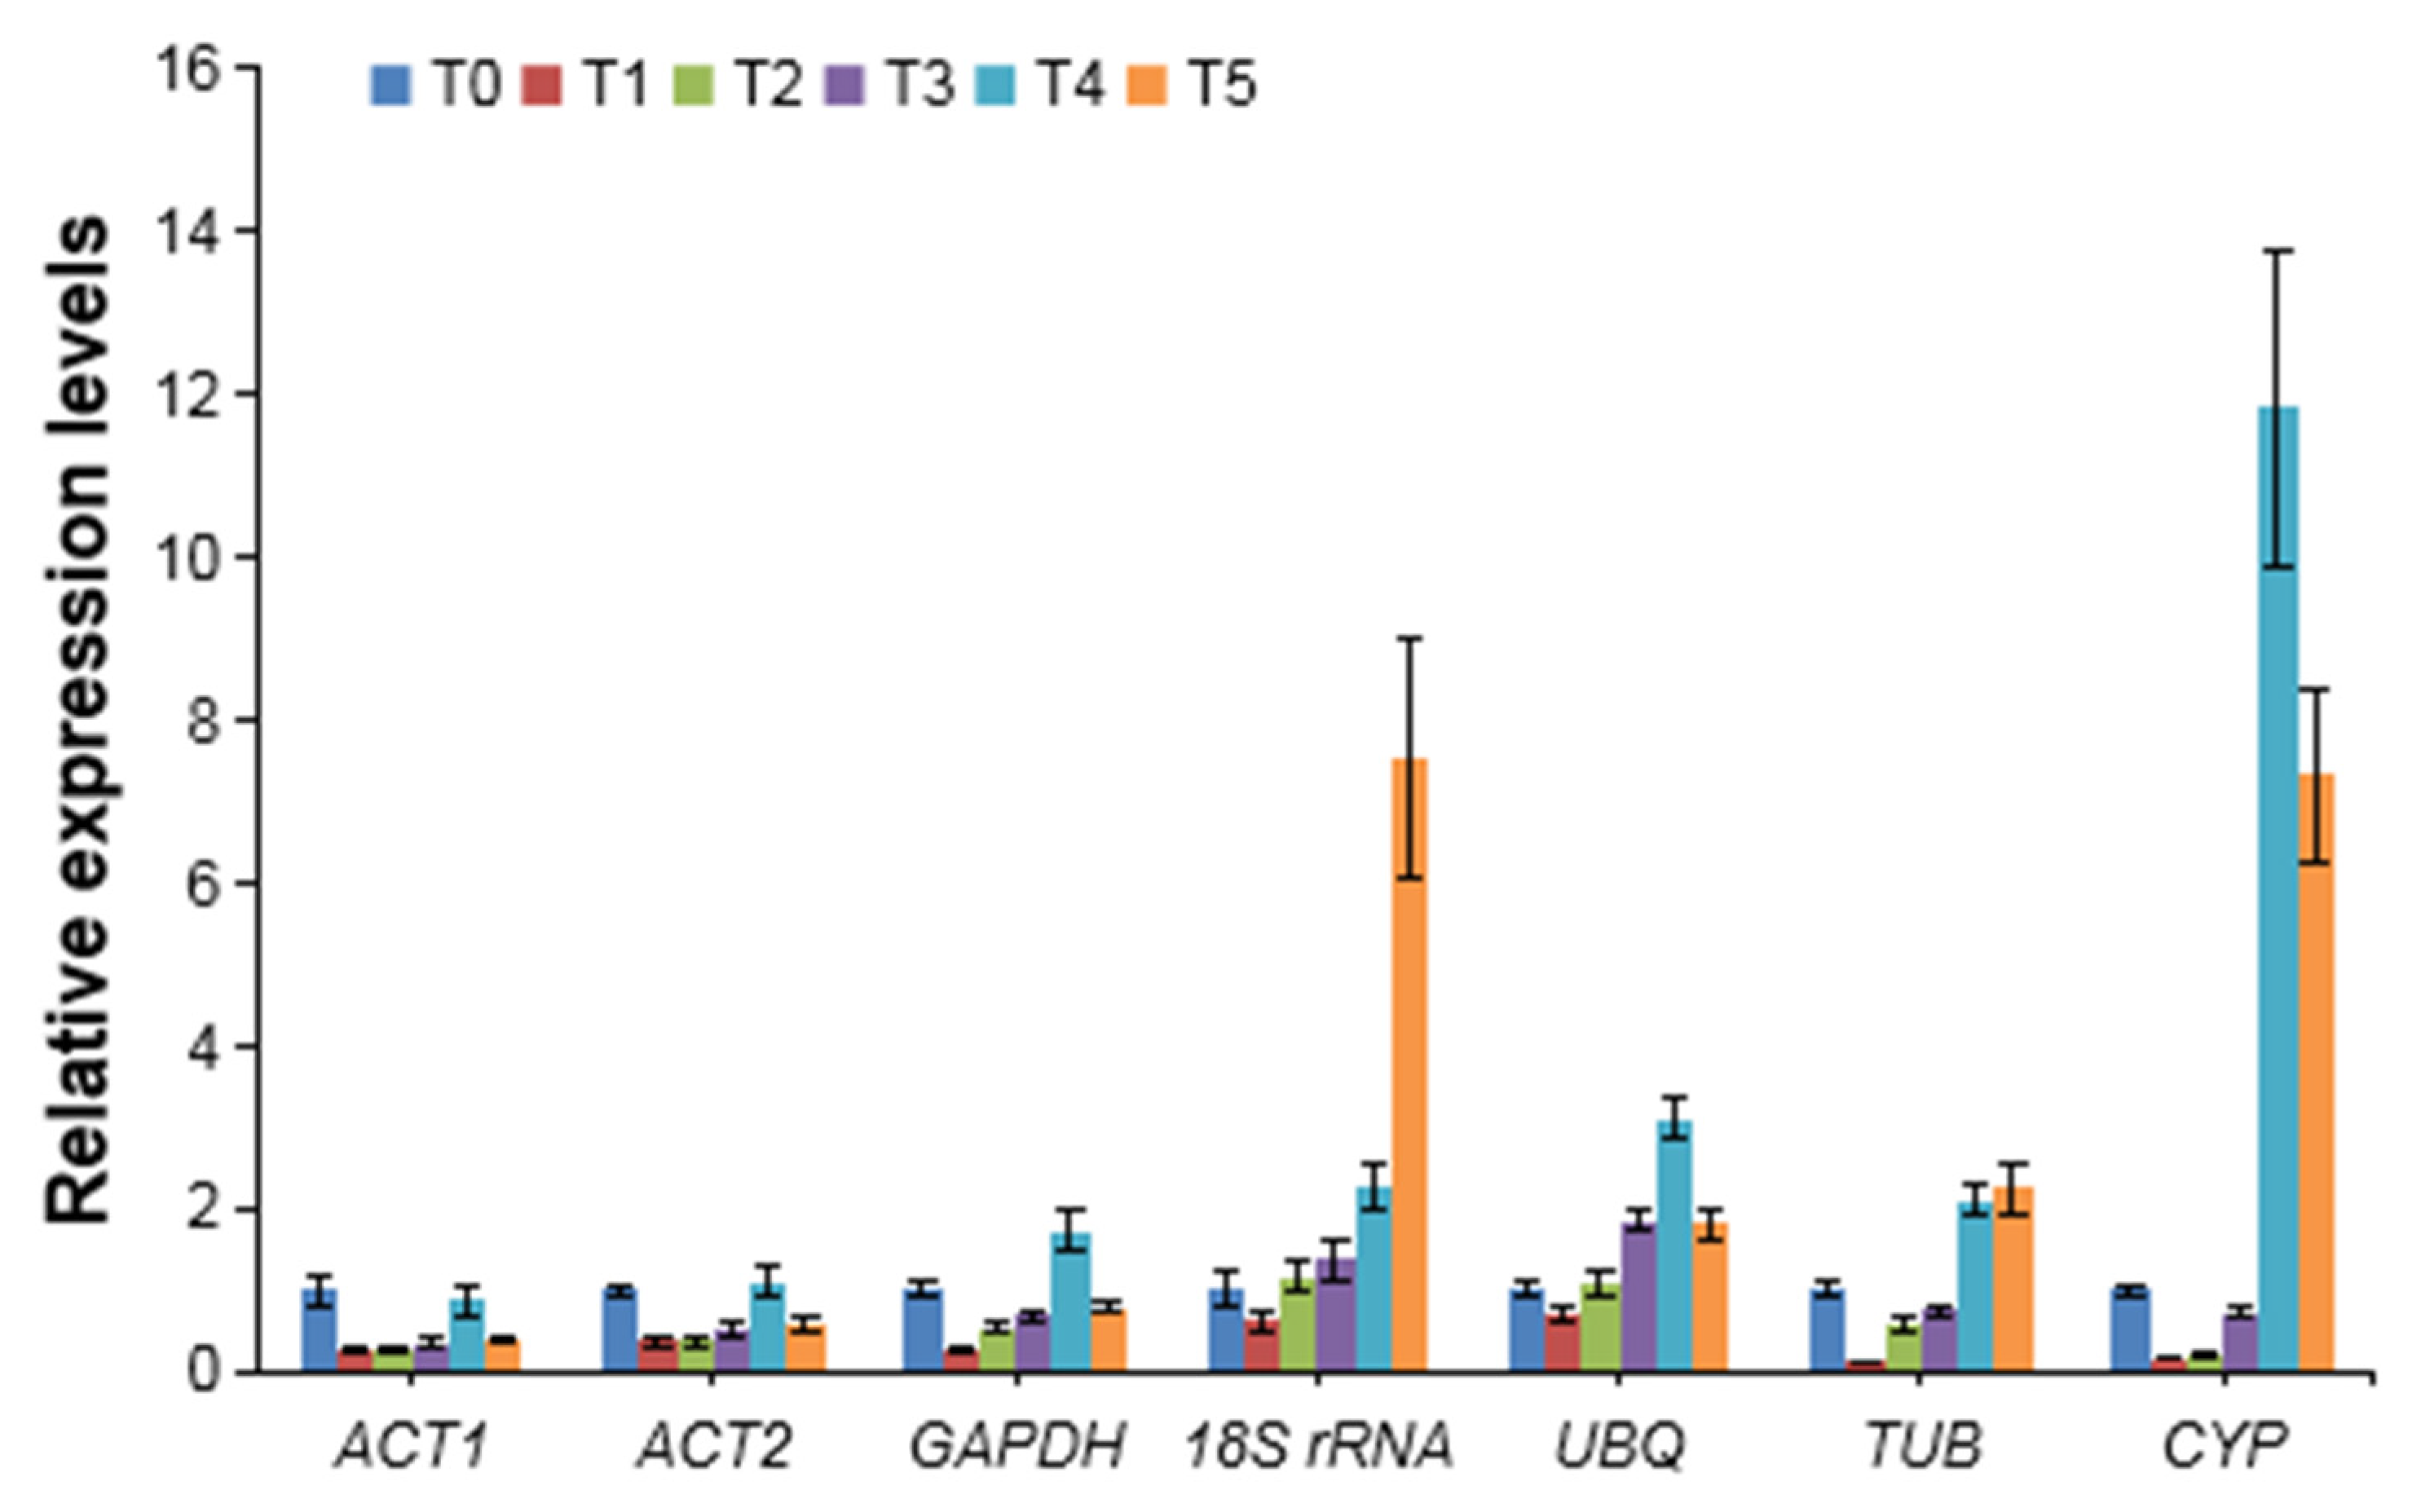
3.4. Validation of Selected Reference Genes by AcPSY Expression Analysis

PSY, a primary rate-limiting enzyme gene in the carotenoid metabolic pathway, was selected as a target gene to further validate the reliability of the reference genes [21]. As shown in Figure 3, we normalized the expression levels of PSY during kiwifruit fruit development using the seven reference genes, respectively. Similar expression patterns and abundances were observed when the data normalization was performed with the most stably expressed reference genes (ACT, GAPDH and UBQ). When the least stably expressed reference genes (CYP) were used for data normalization, a consistent pattern of expression was also observed; however, the transcript levels of PSY increased dramatically during late fruit development. The expression pattern of PSY was considerably biased when the other two reference genes (18s rRN and TUB) with poor expression stability were used to standard the data. These results were consistent with the stability evaluation of the seven reference genes and also indicated that less stable reference genes did not effectively calibrate the data from the qRT-PCR assay.

4. Discussion

qRT-PCR is one of the most common methods used to analyze gene expression patterns, and obtaining reliable results depends on the correct selection of reference genes. There have been many studies involving the screening of fruit tree reference genes. For instance, it has been shown that TEF2, CYP2 and ACT are the most suitable reference genes in cherry fruit and flower development [22]. Screening of apple reference genes revealed that UBQ had the most stable expression in different genotypes of apples, in different developmental stages of fruit and in different tissues [23]. Another study analyzing the stability of reference genes in different tissues of apple found that RPL2 and GAPDH showed good stability, while UBQ showed poor stability [24]. It was also found that GAPDH maintained stable expression in different organs and at different stages of fruit development in strawberry [25]. Both GAPDH and CYP maintained good stability in pomegranate when subjected to biotic and abiotic stresses [26]. The most consistently expressed reference genes in blueberry were UBC9 and GAPDH when attacked by Monilinia vaccinii-corymbosi [27]. In summary, no completely universal reference gene existed, and the expression stability of genes varied considerably under different experimental conditions. Therefore, it is necessary to systematically select the most stable reference genes prior to their use in qRT-PCR normalization rather than directly using other published reference genes.
Our data suggested that the widely used kiwifruit reference genes ACT and 18s RNA were not fully applicable under the conditions of this experiment, while GAPDH expression was much more stable. GAPDH was commonly used as a reference gene due to its stable expression in plants such as Arabidopsis [28], cucumber [29], tree peony [30] and sugarcane [31]. In this study, GAPDH was also considered suitable for data normalization of the qRT-PCR assay in kiwifruit, as it obtained high stability assessment values in most of the test samples based on different algorithms. Further analysis suggested that ACT1 maintained a more stable transcript level during fruit development, a result similar to that of previous screening of reference genes in pitaya [32]. UBQ was reported to be the most stable reference gene when identified in different tissues of pineapple [33]. In this study, UBQ was similarly considered to have good stability in roots, leaves, flowers and fruits based on its high scores obtained through three software programs. The above results were quite different from those of Ferradá et al. [14] for the identification of the ‘Hayward’ kiwifruit reference genes, which identified ACT and 18s rRNA as suitable for use as reference genes in different tissues. Our results provided further evidence that the expression of reference genes varied between varieties and that there was a need to conduct reference gene screening for different trials. Meanwhile, we also found that in addition to GAPDH, ACT1 and ACT2 also presented good stability between different varieties of kiwifruit, which was in agreement with recent studies that ACT was the most stable gene between different varieties of peach [34] and jujuba [35]. Both ACT1 and UBQ maintained stable transcript levels in kiwifruit stimulated by different hormones (or pollen polysaccharide), which was similar to the results of a previous study about bananas [36]. The above information indicated that the appropriate reference gene was restricted to a particular experimental setting.
The ideal Ct value for the reference gene should be in the range of 15–30 [37], with either too high or too low a Ct value being highly likely to result in less accurate quantitative results. Therefore, when selecting reference genes, in addition to considering gene expression stability, it is important to ensure that gene expression abundance is maintained at a moderate level. In this study, 18S rRNA and CYP were stably expressed in seven different varieties of kiwifruit, but the expression of 18S rRNA was high and CYP low (Figure 1), both of which were outside the range of Ct values for ideal reference genes and unsuitable for use as reference genes. Further research is needed on the applicability of low (high) level expression of the reference genes.
PSY, a key gene controlling the flow of total carotenoid metabolism in plants [21], has been observed in our previous studies to be expressed at a certain abundance throughout kiwifruit fruit development [38]. To verify the reliability of the selected reference genes, the relative expression of PSY was calibrated with different reference genes. The relative expression of PSY diverged significantly after normalization with less stable reference genes. These results highlighted the need for the appropriate choice of reference genes in qRT-PCR assays.
In recent years, genome-wide searches have identified new reference genes from fruit crops such as strawberry [39], peach [40] and plum [41], providing new insights into the mining of kiwifruit reference genes. With the improvement of genome-wide information in kiwifruit, it will also be possible in the future to explore new types of reference genes with greater stability and wider applicability by a number of biological means, rather than being limited to traditional reference genes.

5. Conclusions

The result of the stable analysis of the reference genes in the three software programs (geNorm, NormFinder, BestKeeper) revealed that GAPDH, ACT and UBQ were stably expressed in the test kiwifruit samples. Combined with the results of the pairwise variation analysis, GAPDH, ACT1 and ACT2 were recommended as the best reference genes for different genotypes, GAPDH and UBQ were the optimal combinations of reference genes for gene expression analysis in different tissues, GAPDH and ACT1 were suitable for use as reference genes during fruit development and ACT1 and UBQ were the optimal choice for correcting qRT-PCR data under hormone (or pollen polysaccharide) stimulation. Our results will provide additional options for future gene expression analysis in kiwifruit.

Author Contributions

Conceptualization, H.X. and D.L.; methodology, Y.Z. and X.L. (Xinling Liu); software, Z.L. and Y.G.; validation, Y.Z. and X.L. (Xinling Liu); formal analysis, J.W.; resources, L.L. and Q.D.; data curation, Y.Z.; writing—original draft preparation, Y.Z.; writing—review and editing, H.X.; visualization, H.D. and Y.Z.; supervision, X.L. (Xiulan Lv); project administration, K.X.; funding acquisition, D.L. All authors have read and agreed to the published version of the manuscript.

Funding

This work was supported by a grant from the Sichuan Science and Technology Projects, China (2021YFYZ0010).

Institutional Review Board Statement

Not applicable.

Informed Consent Statement

Not applicable.

Data Availability Statement

The data presented in this study are available in the body of this article.

Conflicts of Interest

The authors declare that they have no conflict of interest.

References

  1. Higuchi, R.; Fockler, C.; Dollinger, G.; Watson, R.J.B.T. Kinetic PCR Analysis: Real-time Monitoring of DNA Amplification Reactions. Biotechnology 1993, 11, 1026–1030. [Google Scholar] [CrossRef] [PubMed]
  2. Gachon, C.; Mingam, A.; Charrier, B. Real-time PCR: What relevance to plant studies? J. Exp. Bot. 2004, 55, 1445–1454. [Google Scholar] [CrossRef] [PubMed] [Green Version]
  3. Huggett, J.; Dheda, K.; Bustin, S.; Zumla, A.J.G. Real-time RT-PCR normalisation; strategies and considerations. Genes Immun. 2005, 6, 279–284. [Google Scholar] [CrossRef] [PubMed] [Green Version]
  4. Exposito-Rodriguez, M.; Borges, A.A.; Borges-Perez, A.; Perez, J.A. Selection of internal control genes for quantitative real-time RT-PCR studies during tomato development process. BMC Plant Biol. 2008, 8, 131. [Google Scholar] [CrossRef] [PubMed] [Green Version]
  5. Bustin, S.A. Quantification of mRNA using real-time reverse transcription PCR (RT-PCR): Trends and problems. J. Mol. Endocrinol. 2002, 29, 23–39. [Google Scholar] [CrossRef]
  6. Thellin, O.; ElMoualij, B.; Heinen, E.; Zorzi, W. A decade of improvements in quantification of gene expression and internal standard selection. Biotechnol. Adv. 2009, 27, 323–333. [Google Scholar] [CrossRef]
  7. Radonić, A.; Thulke, S.; Mackay, I.M.; Landt, O.; Siegert, W.; Nitsche, A. Guideline to reference gene selection for quantitative real-time PCR. Biochem. Biophys. Res. Commun. 2004, 313, 856–862. [Google Scholar] [CrossRef]
  8. Dheda, K.; Huggett, J.F.; Bustin, S.A.; Johnson, M.A.; Rook, G.; Zumla, A.J.B. Validation of housekeeping genes for normalizing RNA expression in real-time PCR. Biotechniques 2004, 37, 112–119. [Google Scholar] [CrossRef] [Green Version]
  9. Hu, R.; Fan, C.; Li, H.; Zhang, Q.; Fu, Y.-F. Evaluation of putative reference genes for gene expression normalization in soybean by quantitative real-time RT-PCR. BMC Mol. Biol. 2009, 10, 93. [Google Scholar] [CrossRef] [Green Version]
  10. Dheda, K.; Huggett, J.F.; Chang, J.S.; Kim, L.U.; Bustin, S.A.; Johnson, M.A.; Rook, G.A.W.; Zumla, A. The implications of using an inappropriate reference gene for real-time reverse transcription PCR data normalization. Anal. Biochem. 2005, 344, 141–143. [Google Scholar] [CrossRef]
  11. Podevin, N.; Krauss, A.; Henry, I.; Swennen, R.; Remy, S. Selection and validation of reference genes for quantitative RT-PCR expression studies of the non-model crop Musa. Mol. Breed. 2012, 30, 1237–1252. [Google Scholar] [CrossRef] [PubMed] [Green Version]
  12. Ye, Y.; Lu, Y.; Wang, G.; Liu, Y.; Zhang, Y.; Tang, H. Stable reference gene selection for qRT-PCR normalization in strawberry (Fragaria × ananassa) leaves under different stress and light-quality conditions. Horticulturae 2021, 7, 452. [Google Scholar] [CrossRef]
  13. Ampomah-Dwamena, C.; Thrimawithana, A.H.; Dejnoprat, S.; Lewis, D.; Espley, R.V.; Allan, A.C.J.N.P. A kiwifruit (Actinidia deliciosa) R2R3-MYB transcription factor modulates chlorophyll and carotenoid accumulation. New Phytol. 2019, 221, 309–325. [Google Scholar] [CrossRef] [Green Version]
  14. Ferradas, Y.; Rey, L.; Martinez, O.; Rey, M.; Victoria Gonzalez, M. Identification and validation of reference genes for accurate normalization of real-time quantitative PCR data in kiwifruit. Plant Physiol. Biochem. 2016, 102, 27–36. [Google Scholar] [CrossRef] [PubMed]
  15. Pattyn, F.; Speleman, F.; De Paepe, A.; Vandesompele, J. RTPrimerDB: The real-time PCR primer and probe database. Nucleic Acids Res. 2003, 31, 122–123. [Google Scholar] [CrossRef] [PubMed] [Green Version]
  16. Andersen, C.L.; Jensen, J.L.; Orntoft, T.F. Normalization of real-time quantitative reverse transcription-PCR data: A model-based variance estimation approach to identify genes suited for normalization, applied to bladder and colon cancer data sets. Cancer Res. 2004, 64, 5245–5250. [Google Scholar] [CrossRef] [PubMed] [Green Version]
  17. Pfaffl, M.W.; Tichopad, A.; Prgomet, C.; Neuvians, T.P. Determination of stable housekeeping genes, differentially regulated target genes and sample integrity: BestKeeper--Excel-based tool using pair-wise correlations. Biotechnol. Lett. 2004, 26, 509–515. [Google Scholar] [CrossRef]
  18. Liang, D.; Shen, Y.; Ni, Z.; Wang, Q.; Lei, Z.; Xu, N.; Deng, Q.; Lin, L.; Wang, J.; Lv, X.; et al. Exogenous melatonin application delays senescence of kiwifruit leaves by regulating the antioxidant capacity and biosynthesis of flavonoids. Front. Plant Sci. 2018, 9, 426. [Google Scholar] [CrossRef]
  19. Khanlou, K.M.; Van Bockstaele, E. A critique of widely used normalization software tools and an alternative method to identify reliable reference genes in red clover (Trifolium pratense L.). Planta 2012, 236, 1381–1393. [Google Scholar] [CrossRef]
  20. Taylor, S.; Wakem, M.; Dijkman, G.; Alsarraj, M.; Nguyen, M. A practical approach to RT-qPCR-Publishing data that conform to the MIQE guidelines. Methods 2010, 50, S1–S5. [Google Scholar] [CrossRef]
  21. Dang, Q.; Sha, H.; Nie, J.; Wang, Y.; Yuan, Y.; Jia, D. An apple (Malus domestica) AP2/ERF transcription factor modulates carotenoid accumulation. Hortic. Res. 2021, 8, 223. [Google Scholar] [CrossRef] [PubMed]
  22. Ye, X.; Zhang, F.; Tao, Y.; Song, S.; Fang, J. Reference gene selection for quantitative real-time PCR normalization in different cherry genotypes, developmental stages and organs. Sci. Hortic. 2015, 181, 182–188. [Google Scholar] [CrossRef]
  23. Zhu, L.; Yang, C.; You, Y.; Liang, W.; Wang, N.; Ma, F.; Li, C. Validation of reference genes for qRT-PCR analysis in peel and flesh of six apple cultivars (Malus domestica) at diverse stages of fruit development. Sci. Hortic. 2019, 244, 165–171. [Google Scholar] [CrossRef]
  24. Kumar, G.; Singh, A.K. Reference gene validation for qRT-PCR based gene expression studies in different developmental stages and under biotic stress in apple. Sci. Hortic. 2015, 197, 597–606. [Google Scholar] [CrossRef]
  25. Liu, D.; Huang, X.; Lin, Y.; Wang, X.; Yan, Z.; Wang, Q.; Ding, J.; Gu, T.; Li, Y. Identification of reference genes for transcript normalization in various tissue types and seedlings subjected to different abiotic stresses of woodland strawberry Fragaria vesca. Sci. Hortic. 2020, 261, e108840. [Google Scholar] [CrossRef]
  26. Doddaraju, P.; Kumar, P.; Dashyal, M.S.; Girigowda, M. Identification of suitable reference genes for expression studies in pomegranate under different biotic and abiotic stress conditions. Mol. Biol. Rep. 2021, 48, 3935–3943. [Google Scholar] [CrossRef] [PubMed]
  27. Jose, S.; Abbey, J.; Jaakola, L.; Percival, D. Selection and validation of reliable reference genes for gene expression studies from Monilinia vaccinii-corymbosi infected wild blueberry phenotypes. Sci. Rep. 2020, 10, 11688. [Google Scholar] [CrossRef]
  28. Jin, Y.; Liu, F.; Huang, W.; Sun, Q.; Huang, X. Identification of reliable reference genes for qRT-PCR in the ephemeral plant Arabidopsis pumila based on full-length transcriptome data. Sci. Rep. 2019, 9, 84408. [Google Scholar] [CrossRef]
  29. Liang, C.; Hao, J.; Meng, Y.; Luo, L.; Li, J. Identifying optimal reference genes for the normalization of microRNA expression in cucumber under viral stress. PLoS ONE 2018, 13, e0194436. [Google Scholar] [CrossRef] [Green Version]
  30. Li, J.; Han, J.; Hu, Y.; Yang, J. Selection of reference genes for quantitative real-time PCR during flower development in tree peony (Paeonia suffruticosa Andr.). Front. Plant Sci. 2016, 7, 516. [Google Scholar] [CrossRef] [Green Version]
  31. Andrade, L.M.; Dos Santos Brito, M.; Favero Peixoto Junior, R.; Marchiori, P.E.R.; Nobile, P.M.; Martins, A.P.B.; Ribeiro, R.V.; Creste, S. Reference genes for normalization of qPCR assays in sugarcane plants under water deficit. Plant Methods 2017, 13, 28. [Google Scholar] [CrossRef] [PubMed] [Green Version]
  32. Chen, C.; Wu, J.; Hua, Q.; Tel-Zur, N.; Xie, F.; Zhang, Z.; Chen, J.; Zhang, R.; Hu, G.; Zhao, J.; et al. Identification of reliable reference genes for quantitative real-time PCR normalization in pitaya. Plant Methods 2019, 15, 70. [Google Scholar] [CrossRef] [PubMed] [Green Version]
  33. Chen, H.; Hu, B.; Zhao, L.; Shi, D.; She, Z.; Huang, X.; Priyadarshani, S.V.G.N.; Niu, X.; Qin, Y. Differential expression analysis of reference genes in pineapple (Ananas comosus L.) during reproductive development and response to abiotic stress, hormonal stimuli. Trop. Plant Biol. 2019, 12, 67–77. [Google Scholar] [CrossRef]
  34. You, S.; Cao, K.; Chen, C.; Li, Y.; Wu, J.; Zhu, G.; Fang, W.; Wang, X.; Wang, L. Selection and validation reference genes for qRT-PCR normalization in different cultivars during fruit ripening and softening of peach (Prunus persica). Sci. Rep. 2021, 11, 7302. [Google Scholar] [CrossRef] [PubMed]
  35. Zhang, C.; Huang, J.; Li, X. Identification of appropriate reference genes for RT-qPCR analysis in Ziziphus jujuba Mill. Sci. Hortic. 2015, 197, 166–169. [Google Scholar] [CrossRef]
  36. Chen, L.; Zhong, H.; Kuang, J.; Li, J.; Lu, W.; Chen, J. Validation of reference genes for RT-qPCR studies of gene expression in banana fruit under different experimental conditions. Planta 2011, 234, 377–390. [Google Scholar] [CrossRef] [PubMed]
  37. Wan, H.; Zhao, Z.; Qian, C.; Sui, Y.; Malik, A.A.; Chen, J. Selection of appropriate reference genes for gene expression studies by quantitative real-time polymerase chain reaction in cucumber. Anal. Biochem. 2010, 399, 257–261. [Google Scholar] [CrossRef]
  38. Xia, H.; Wang, X.; Zhou, Y.; Su, W.; Jiang, L.; Deng, H.; Li, M.; Zhuang, Q.; Xie, Y.; Liang, D. Biochemical and molecular factors governing flesh-color development in two yellow-fleshed kiwifruit cultivars. Sci. Hortic. 2021, 280, 109929. [Google Scholar] [CrossRef]
  39. Chen, J.; Zhou, J.; Hong, Y.; Li, Z.; Cheng, X.; Zheng, A.; Zhang, Y.; Song, J.; Xie, G.; Chen, C.; et al. Genome-wide identification of ubiquitin proteasome subunits as superior reference genes for transcript normalization during receptacle development in strawberry cultivars. BMC Genom. 2021, 22, 88. [Google Scholar] [CrossRef]
  40. Kou, X.; Zhang, L.; Yang, S.; Li, G.; Ye, J. Selection and validation of reference genes for quantitative RT-PCR analysis in peach fruit under different experimental conditions. Sci. Hortic. 2017, 225, 195–203. [Google Scholar] [CrossRef]
  41. Galimba, K.; Tosetti, R.; Loerich, K.; Michael, L.; Pabhakar, S.; Dove, C.; Dardick, C.; Callahan, A. Identification of early fruit development reference genes in plum. PLoS ONE 2020, 15, e0230920. [Google Scholar] [CrossRef] [PubMed]
Figure 1. Ct values for seven candidate reference genes in all test samples: fruits of Actinidia latifolia, ‘Qinmei’, ‘Hayward’, ‘Hort16A’, ‘Jinshi 1’, ‘Hongyang’ and ‘Hongshi 2’ at 30 days after 75% flower drop; roots, stems, leaves and flowers of ‘Jinshi 1’, and fruits of ‘Jinshi 1’ at 30, 55, 70, 95, 130 and 145 days after 75% flower drop; MT, HBR or PP treated leaves of ‘Jinshi 1’ live seedlings.
Horticulturae 08 00170 g001
Figure 2. Pairwise variation (V) analysis of the seven candidate reference genes in all tested samples. M/H/P treatments means MT, HBR or PP treatments.
Horticulturae 08 00170 g002
Figure 3. Relative expression levels of AcPSY normalized by the seven reference genes during fruit development. T0–T5 represent 30, 55, 70, 95, 130 and 145 days after 75% flower drop.
Horticulturae 08 00170 g003
Table 1. Primer sequences of candidate reference genes used for qRT-PCR analysis.
GenePrimer Sequence (5′→3′)Tm (°C)
ACT1GCAGGAATCCATGAGACTACC
GTCTGCGATACCAGGGAACAT
58
ACT2TGCATGAGCGATCAAGTTTCAAG
TGTCCCATGTCTGGTTGATGACT
57
18S rRNACTGTGAAACTGCGAATGGCTC
TTCCAGAAGTCGGGGTTTGT
56.5
UBQCCACCACGGAGACGGAGCAC
TGCAGATCTTCGTGAAAACC
58
GAPDHACACTCCATCACTGCGACA
CACCTTGCCAACAGCCTTA
56.5
TUBTGAGCACTAAAGAGGTGGATGA
TGGGATGTCACACACACTGG
56.5
CYPTGATGGCACTGGAGGAGAATC
ACTGAGACCCGTTTGTGTTAGG
58
Table 2. Amplification efficiency of candidate reference genes.
GeneR2Amplification Efficiency (%)
ACT10.99994.57
ACT20.99991.01
GAPDH0.99992.21
18S rRNA0.99887.38
UBQ0.989104.07
TUB0.989106.91
CYP0.981103.66
Table 3. Average expression stability values of seven candidate reference genes as calculated by geNorm. M/H/P treatments means MT, HBR or PP treatments.
RankingVarietiesTissuesDevelopmental StagesM/H/P Treatments
GeneStabilityGeneStabilityGeneStabilityGeneStability
1GAPDH0.377 ACT10.407 ACT20.322 GAPDH0.242
218S rRNA0.377 GAPDH0.407 GAPDH0.322 UBQ0.242
3CYP0.498 UBQ0.424 ACT10.372 ACT10.294
4ACT10.693 ACT20.638 UBQ0.503 TUB0.318
5ACT20.810 18S rRNA0.804 18S rRNA0.752 ACT20.341
6TUB0.987 TUB0.951 TUB0.966 CYP0.390
7UBQ1.141 CYP1.221 CYP1.366 18S rRNA0.432
Table 4. Average expression stability values of seven candidate reference genes as calculated by NormFinder. M/H/P treatments means MT, HBR or PP treatments.
RankingVarietiesTissuesDevelopmental StagesM/H/P Treatments
GeneStabilityGeneStabilityGeneStabilityGeneStability
1GAPDH0.110 GAPDH0.240 GAPDH0.490 ACT10.120
218S rRNA0.360 UBQ0.270 ACT10.650 TUB0.210
3CYP0.480 ACT10.340 UBQ0.660 UBQ0.230
4ACT10.530 ACT20.640 ACT20.800 GAPDH0.230
5ACT20.810 18S rRNA0.950 TUB0.830 ACT20.320
6UBQ1.410 TUB1.240 18S rRNA0.930 CYP0.460
7TUB1.440 CYP1.770 CYP2.280 18S rRNA0.470
Table 5. Average expression stability values of seven candidate reference genes as calculated by BestKeeper. M/H/P treatments means MT, HBR or PP treatments.
RankingVarietiesTissuesDevelopmental StagesM/H/P Treatments
GeneSDCVGeneSDCVGeneSDCVGeneSDCV
1CYP0.427 1.414 ACT20.422 1.645 ACT20.253 0.996 ACT10.184 0.759
2GAPDH0.535 2.503 UBQ0.614 3.025 ACT10.259 1.260 18S rRNA0.202 1.962
318S rRNA0.683 6.871 GAPDH0.719 3.426 GAPDH0.459 2.248 UBQ0.259 1.128
4ACT10.758 3.541 18S rRNA0.867 8.504 UBQ0.647 3.223 GAPDH0.323 1.349
5ACT20.773 2.990 ACT10.955 4.482 18S rRNA0.899 8.536 TUB0.335 1.173
6UBQ1.470 7.057 TUB1.296 4.970 TUB1.168 4.494 ACT20.411 1.522
7TUB1.171 4.520 CYP2.002 6.496 CYP2.375 7.603 CYP0.458 1.328
Publisher’s Note: MDPI stays neutral with regard to jurisdictional claims in published maps and institutional affiliations.

