Article

An Integrated Analysis of Transcriptome and miRNA Sequencing Provides Insights into the Dynamic Regulations during Flower Morphogenesis in Petunia

1
College of Landscape Architecture, Central South University of Forestry and Technology, Changsha 410004, China
2
Hunan Big Data Engineering Technology Research Centre of Natural Protected Areas Landscape Resources, Changsha 410018, China
*
Authors to whom correspondence should be addressed.
Horticulturae 2022, 8(4), 284; https://doi.org/10.3390/horticulturae8040284
Submission received: 7 February 2022 / Revised: 24 March 2022 / Accepted: 24 March 2022 / Published: 28 March 2022
(This article belongs to the Section Genetics, Genomics, Breeding, and Biotechnology (G2B2))

Abstract

:
Published genome sequences can facilitate multiple genome sequencing studies of flower development, which can serve as the basis for later analysis of variation in flower phenotypes. To identify potential regulators related to flower morphology, we captured dynamic expression patterns under five different developmental stages of petunia flowers, a popular bedding plant, using transcriptome and miRNA sequencing. The significant transcription factor (TF) families, including MYB, MADS, and bHLH, were elucidated. MADS-box genes exhibited co-expression patterns with BBR-BPC, GATA, and Dof genes in different modules according to a weighted gene co-expression network analysis. Through miRNA sequencing, a total of 45 conserved and 26 novel miRNAs were identified. According to GO and KEGG enrichment analysis, the carbohydrate metabolic process, photosynthesis, and phenylalanine metabolism were significant at the transcriptomic level, while the response to hormone pathways was significantly enriched by DEmiR-targeted genes. Finally, an miRNA–RNA network was constructed, which suggested the possibility of novel miRNA-mediated regulation pathways being activated during flower development. Overall, the expression data in the present study provide novel insights into the developmental gene regulatory network facilitated by TFs, miRNA, and their target genes.

1. Introduction

Flowers are the most complex structures of plants, and exploring the regulatory mechanisms underlying their formation is of great significance in evolutionary and reproductive biology. To date, it has been revealed that flower formation involves different developmental processes, such as the induction of floral meristem fate, determination of floral organ identity, morphogenesis, and maturation of floral organs [1,2].
Based on the experimental results of genetic analyses, especially in Arabidopsis, several hundred genes and models for the molecular control of flower development have been identified and largely validated. For example, FLOWERING LOCUS T (FT), LEAFY (LFY), and APETALA1 (AP1)/CAULIFLOWER (CAL) are crucial for the establishment of the floral meristem (FM) [3,4,5]. Hormone signalling genes, such as PIN-FORMED (PIN1), YUCCA (YUC), and ARABIDOPSIS HISTIDINE PHOSPHOTRANSFER PROTEIN6 (AHP6), and boundary genes CUP-SHAPED COTYLEDON (CUC) and SUPERMAN (SUP) are master regulators in the formation of floral organ primordia and basic floral patterning, including the relative position, total number of floral organs, and symmetry [1]. A series of MADS-box transcription factor genes have been found to specify the identity of the four types of floral organs, leading to the proposal of the ABCDE model, which provides a genetic basis for understanding many aspects of flower diversity [6,7,8]. Additionally, boundary-specification genes, such as CUC [9], SUP [10], and RABBIT EARS (RBE) [11], control the exact expression domains of floral organ identity genes to establish demarcated individual whorls and organs. From available data, related regulators, such as PHYSALIS ORGAN SIZE 1 [12], SYMMETRIC PETALS 1 (SYP1), SYP5, BIGGER ORGANS (BIO), ELEPHANT-EAR-LIKE LEAF1 (ELE1) [13,14], and CINCINNATA (CIN)-like TCP genes [15], control cell proliferation and expansion to influence the final size of floral organs. NOZZLE/SPOROCYTELESS (NZZ/SPL) [16] and CRABS CLAW (CRC) [17] are both activated by AGAMOUS (AG) and play essential roles in reproductive organ development. Additionally, AG acts together with WUSCHEL (WUS) in a feedback loop, along with KNUCKLES (KNU) and SUP, to promote FM determinacy and determine the final size and number of floral organs [18,19,20].
Aside from the transcriptional level of genetic mechanisms, epigenetic regulators, especially microRNAs, are involved in many aspects of flower development. For example, miR156-SPL has been found to regulate flowering time through pathways related to photoperiod and age [21,22], and it also controls floral organ development [23,24]. miR172 targets AP2-like genes to regulate flowering transition [25,26] and floral organ development [27,28]. Furthermore, miR172/AP2 plays an important role in the fruit development of tomato [29]. miR164 and its targets have been found to be related to the number of petals and the fusion of carpels [30]. RBE is the up-stream regulator of miR164, and it defines the boundary between the second and third whorls by suppressing AG expression [31]. In Arabidopsis, the over-expression of miR159 leads to a reduction in MYB33, resulting in anther defects, male sterility, and late flowering [32,33]. miR319 was found to originate from a common ancestor and observe the same 17 nucleotides as miR159 [34], although miR319 targets the transcriptional factor of TCP to influence petal size [35,36]. miR166/165 and its targets of HD-ZIP III transcription factors ATHB15, ATHB8, REVOLUTA (REV), PHABULOSA (PHB), and PHAVOLUTA (PHV) play important roles in regulating the stem apical meristem, particularly in establishing floral organ polarity and determining the floral meristem determinacy [37,38]. Auxin response factors (ARFs) are involved in many aspects of flower development and are also regulated by miR167 and miR160 [39,40,41].
Morphological variations in flowers of different plants include differences in organ number, shape, colour, size, arrangement, and even scent and taste; however, the genetic mechanisms of these differences are still far from being understood, as studies on Arabidopsis cannot represent the morphological processes and interaction strategies of all plants. Petunia is a popular bedding plant and has remained one of the top genera for developing new varieties. Additionally, petunia is a model organism for understanding the developmental differences in flowers of different species. Advantages of the petunia model include the funnel-shaped corollas, easy transformation procedures, easy sexual propagation from crosses, the availability of large sets of floral mutants, and great diversity in flower forms [42], such as the complex floral pigmentation pattern in the petal limb, flower tube, anther, flower bud blushing, and flower tube venation. Recent studies have shown that certain genes, such as the TM6 lineage of the DEF/AP3 subfamily, petal fusion genes, and BLIND (BL) encoding miR169, were not present in Arabidopsis, but they were functionally characterised in petunia [42,43]. Additionally, the myeloblastosis (MYB) gene of PH4 integrated the colour and scent mechanisms for sexual reproduction in a stage-specific model in petunia, regulated petal pigmentation through vacuolar acidification in the early stage of bud development, and was essential for scent emission in the late stage following anthesis, during which time scent production began and anthocyanin biosynthesis ceased [44,45]. Recently, chromosome-level genome sequences of Petunia axillaris and P. inflate (which are considered the ancestors of current cultivars) were released. These sequences can provide sufficient and significant information for multiomics sequencing projects to better explore the potential regulators of unique floral characteristics. In this study, we analysed the global gene expression dynamics in petunia, starting from the establishment of floral organ identity to flowering. Transcriptome and miRNA sequencing were conducted at five different developmental stages, and the results revealed the abundant genes and important pathways during flower morphogenesis. These results provide extensive and novel insights into the molecular regulation of flower development and will broaden the scope of plant research and help to unravel the crucial mechanisms underlying flower morphological diversity.

2. Materials and Methods

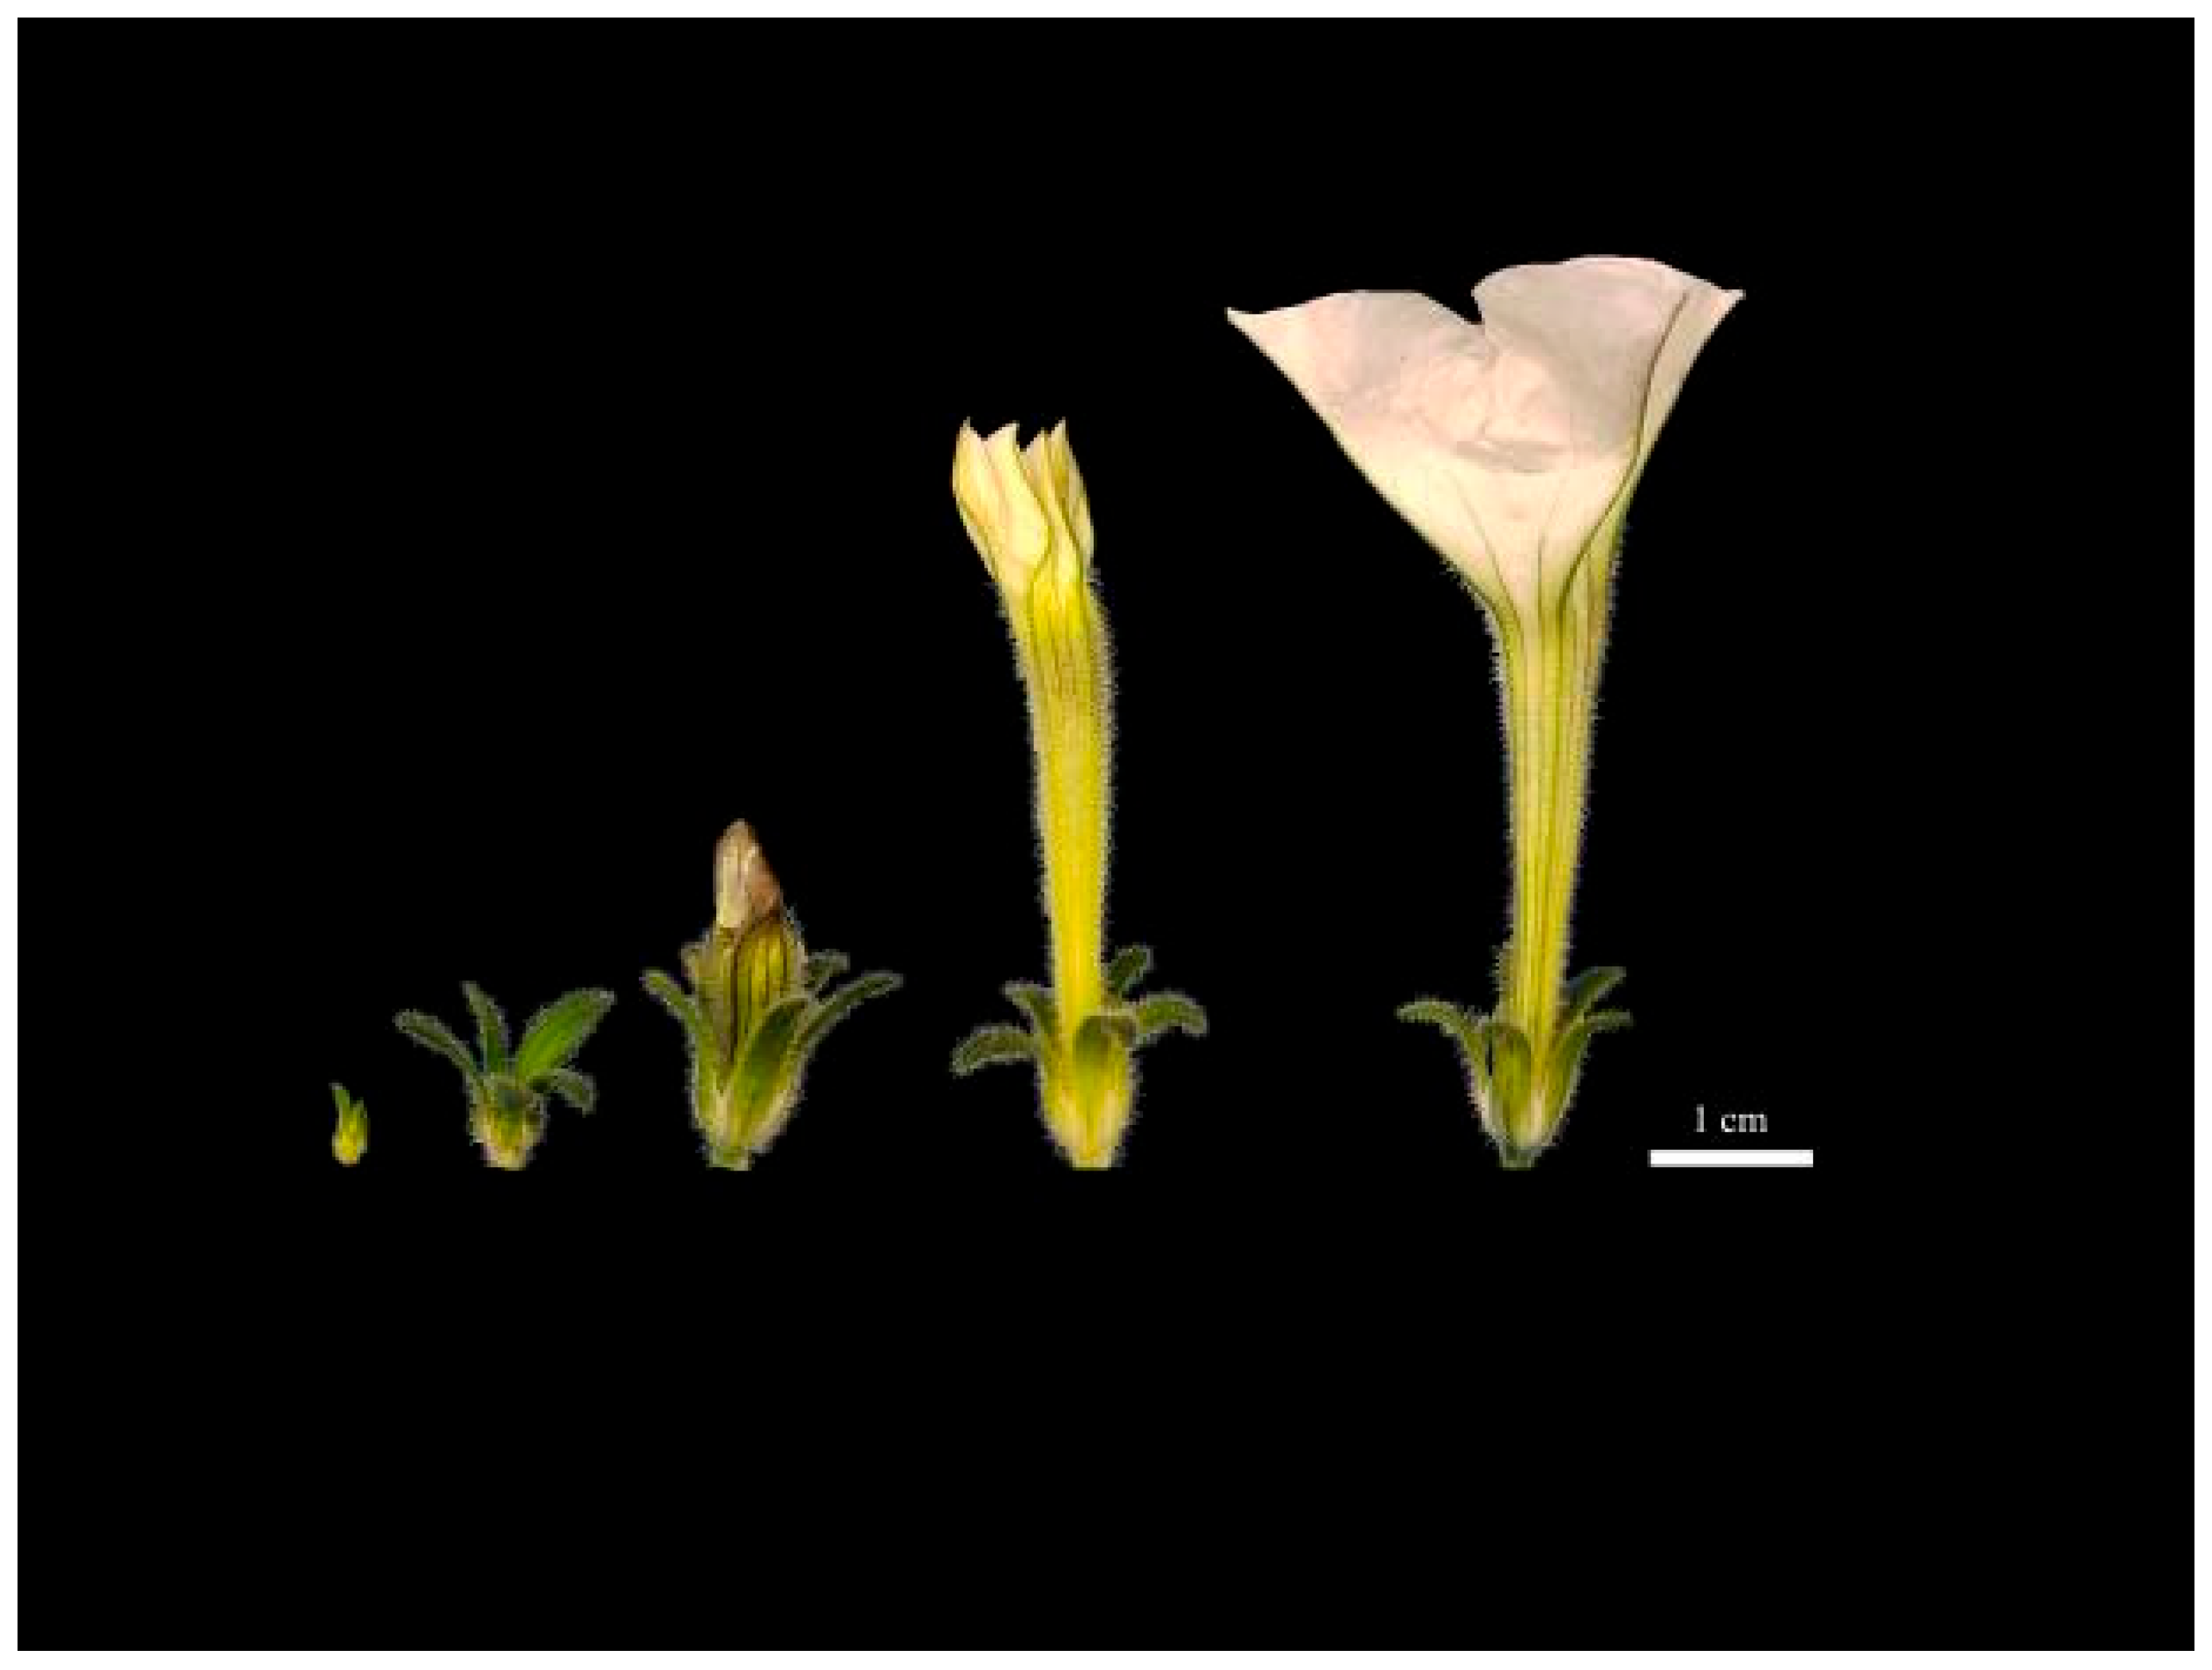
2.1. Plant Materials

Petunia axillaris (S26) plants were grown in a culture room at the Central South University of Forestry and Technology (Changsha, China). Flower buds before full bloom were divided into five different developmental stages: buds <0.2 cm, 0.3–1 cm, 1–2 cm, 3–5 cm, and >5 cm (flower open day 0) according to an earlier study [46] (Figure 1). Samples from each stage were collected from different plant individuals in three biological replicates. The samples were immediately frozen in liquid nitrogen and stored at −80 °C until use.

2.2. RNA Extraction, Library Construction, and Illumina Sequencing

Total RNA was exacted from each sample using a Quick RNA isolation kit (Bioteke Corporation, Beijing, China). Agarose gel electrophoresis and a NanoDrop ND1000 spectrophotometer (NanoDrop Technologies, Wilmington, DE, USA) were used to assess RNA quality and quantity, and an Agilent 2100 Bioanalyzer (Santa Clara, CA, USA) was used to test RNA integrity values, which should be more than 8.0. mRNA was collected from the purified total RNA and used to construct the cDNA library. Fifteen cDNA libraries were constructed and sequenced on the Illumina HiSeqTM Xten platform at Igenebook Biotechnology Co., Ltd. (Wuhan, China). Each study was performed in three biological replicates.

2.3. Illumina Sequencing and Data Analysis

The raw data were filtered using Cutadapter (version 1.11) [47] by removing reads containing adaptor sequences and low-quality reads. The filtered data were then subjected to quality control processes using FastQC (version: 0.11.5). The obtained high-quality reads (i.e., clean reads) were mapped to the reference genome (https://solgenomics.net/organism/Petunia_axillaris/genome, accessed on 2 February 2022) using HISAT2 software (version: 2.0.1-beta) [48], removing duplicated reads to ensure that effective reads corresponded to only one annotation. The respective percentages of effective reads mapped to the CDS, 5′ UTR, 3′ UTR, intron, and intergenic regions on the reference genome were calculated. Then, the read count of each gene was measured by HTSeq [49]. Quantitative analysis of gene expression was conducted using the featureCounts tool (-Q 10 -B -C parameter) in Subread software, and the results were normalised according to the FPKM (fragments per kilobase of exon per million reads mapped) method [50]. Based on this, the Pearson correlation coefficient was used to calculate the correlation between samples. Principal component analysis (PCA) was performed to evaluate the repeatability of biological replicates.

2.4. Differential Gene Expression Analysis

Differential gene expression across the developmental stages was analysed using the R package ‘edgeR’ [51], and significantly different genes were screened with the criteria of a false discovery rate (FDR) < 0.05 and an absolute value of fold change > 2 (|logFC|>2). Differentially expressed genes’ (DEGs) expression data were extracted, and a heat map was created using the ‘pheatmap’ package to cluster and demonstrate the dynamic changes in DEGs among the five different stages. Gene Ontology (GO) and Kyoto Encyclopaedia of Genes and Genomes (KEGG) enrichment analyses of DEGs were performed by cluster profiling [52] using a q-value < 0.05 as the threshold of significant enrichment.

2.5. Co-Expression Network Analysis

Genes with similar expression patterns were clustered using the ‘maSigPro’ package, and weighted gene co-expression network analysis (WGCNA) was used to identify genes with highly coordinated variation. Finally, the co-expression network was constructed, as described by Langfelder and Horvath (2008) [53]. Further, GO and KEGG enrichment analyses were conducted for the genes in each cluster (q-value < 0.05).

2.6. Small RNA Sequencing and microRNA Screening

Total RNA exacted from the five different developmental stages was used to construct small RNA (sRNA) libraries, which were sequenced with Solexa sequencing technology (Igenebook, Wuhan, China) to obtain raw data. Raw data were screened to eliminate adaptor sequences in reads (i.e., low-quality reads and small reads < 18 bp). We selected sRNA ranging from 18–30 nt in clean reads obtained from the last step and summarised the types and abundance of sRNA. The distribution of common and unique sRNA between two different developmental stages was also analysed. Non-coding sRNA sequences, such as rRNA, scRNA, snoRNA, snRNA, and tRNA, in clean sRNA reads were discarded by searching against them in the Rfam database (14.1 http://rfam.xfam.org, accessed on 2 February 2022) database using Blast (v2.5.0+). MicroRNA was preliminarily screened based on the characteristic hairpin structure of the miRNA precursors combined with information on the Dicer restriction site, energy value, and other characteristics. Subsequently, conserved miRNAs were identified by screening in miRBase 17.0 (http://www.mirbase.org/index.shtml, accessed on 2 February 2022). The unmatched miRNAs were considered novel miRNAs.

2.7. Differentially Expressed miRNAs (DEM) Analysis

DESeq2 software was used to analyse the differential expression of conserved and novel miRNAs between two stages following default parameters. Only differences meeting the standards of padj < 0.05 and |log2FoldChange| > 1 were considered significant.

2.8. miRNA Target Prediction and Annotation

The target genes of known and novel miRNAs were predicted by psRobot (psRobot_v1.2) and annotated by searching the reference genome sequences. The set of targets of the DEMs were selected to perform GO and KEGG enrichment analysis (q-value < 0.05).
According to the prediction results of small RNA target genes, the correlations between the expression trends of small RNA and mRNA in different samples were calculated, and negative correlations > 0.8 were screened to analyse the association of miRNA–mRNA in the five different developmental stages.

2.9. qRT-PCR Verification of Small RNA and Transcriptome Sequencing

Nine DEGs were chosen to perform a quantitative real-time PCR (qRT-PCR) assay to validate the gene expression patterns from the transcriptome sequencing results using the EvaGreen 2x qPCR MasterMix-Low ROX Kit (Applied Biological Materials, Richmond, BC, Canada) and the Strata gene MX3000p Real-Time PCR system. All experiments were repeated three times, and data on the gene expression levels were calculated using the 2−ΔΔCt method. The specific primers designed by Primer Premier 5.0 software are shown in the Supplementary Materials. The actin gene was considered as an internal control.
Total RNA exacted from the flower buds at different stages were reverse-transcribed using the miRcute Plus miRNA First-Strand cDNA Kit (Roche, Basel, Switzerland). The qRT-PCR of nine miRNAs was performed on an ABI StepOnePlus Real-Time PCR System using the miRcute Plus miRNA qPCR Kit (SYBR Green). SAND was used as an endogenous control for the miRNA analysis. The reaction procedure was as follows: 94 °C for 15 min, then 40 cycles of 94 °C for 20 s and 64 °C for 34 s. Finally, the 2−ΔΔCt method was used to calculate the expression levels of miRNAs in different developmental stages.

3. Results

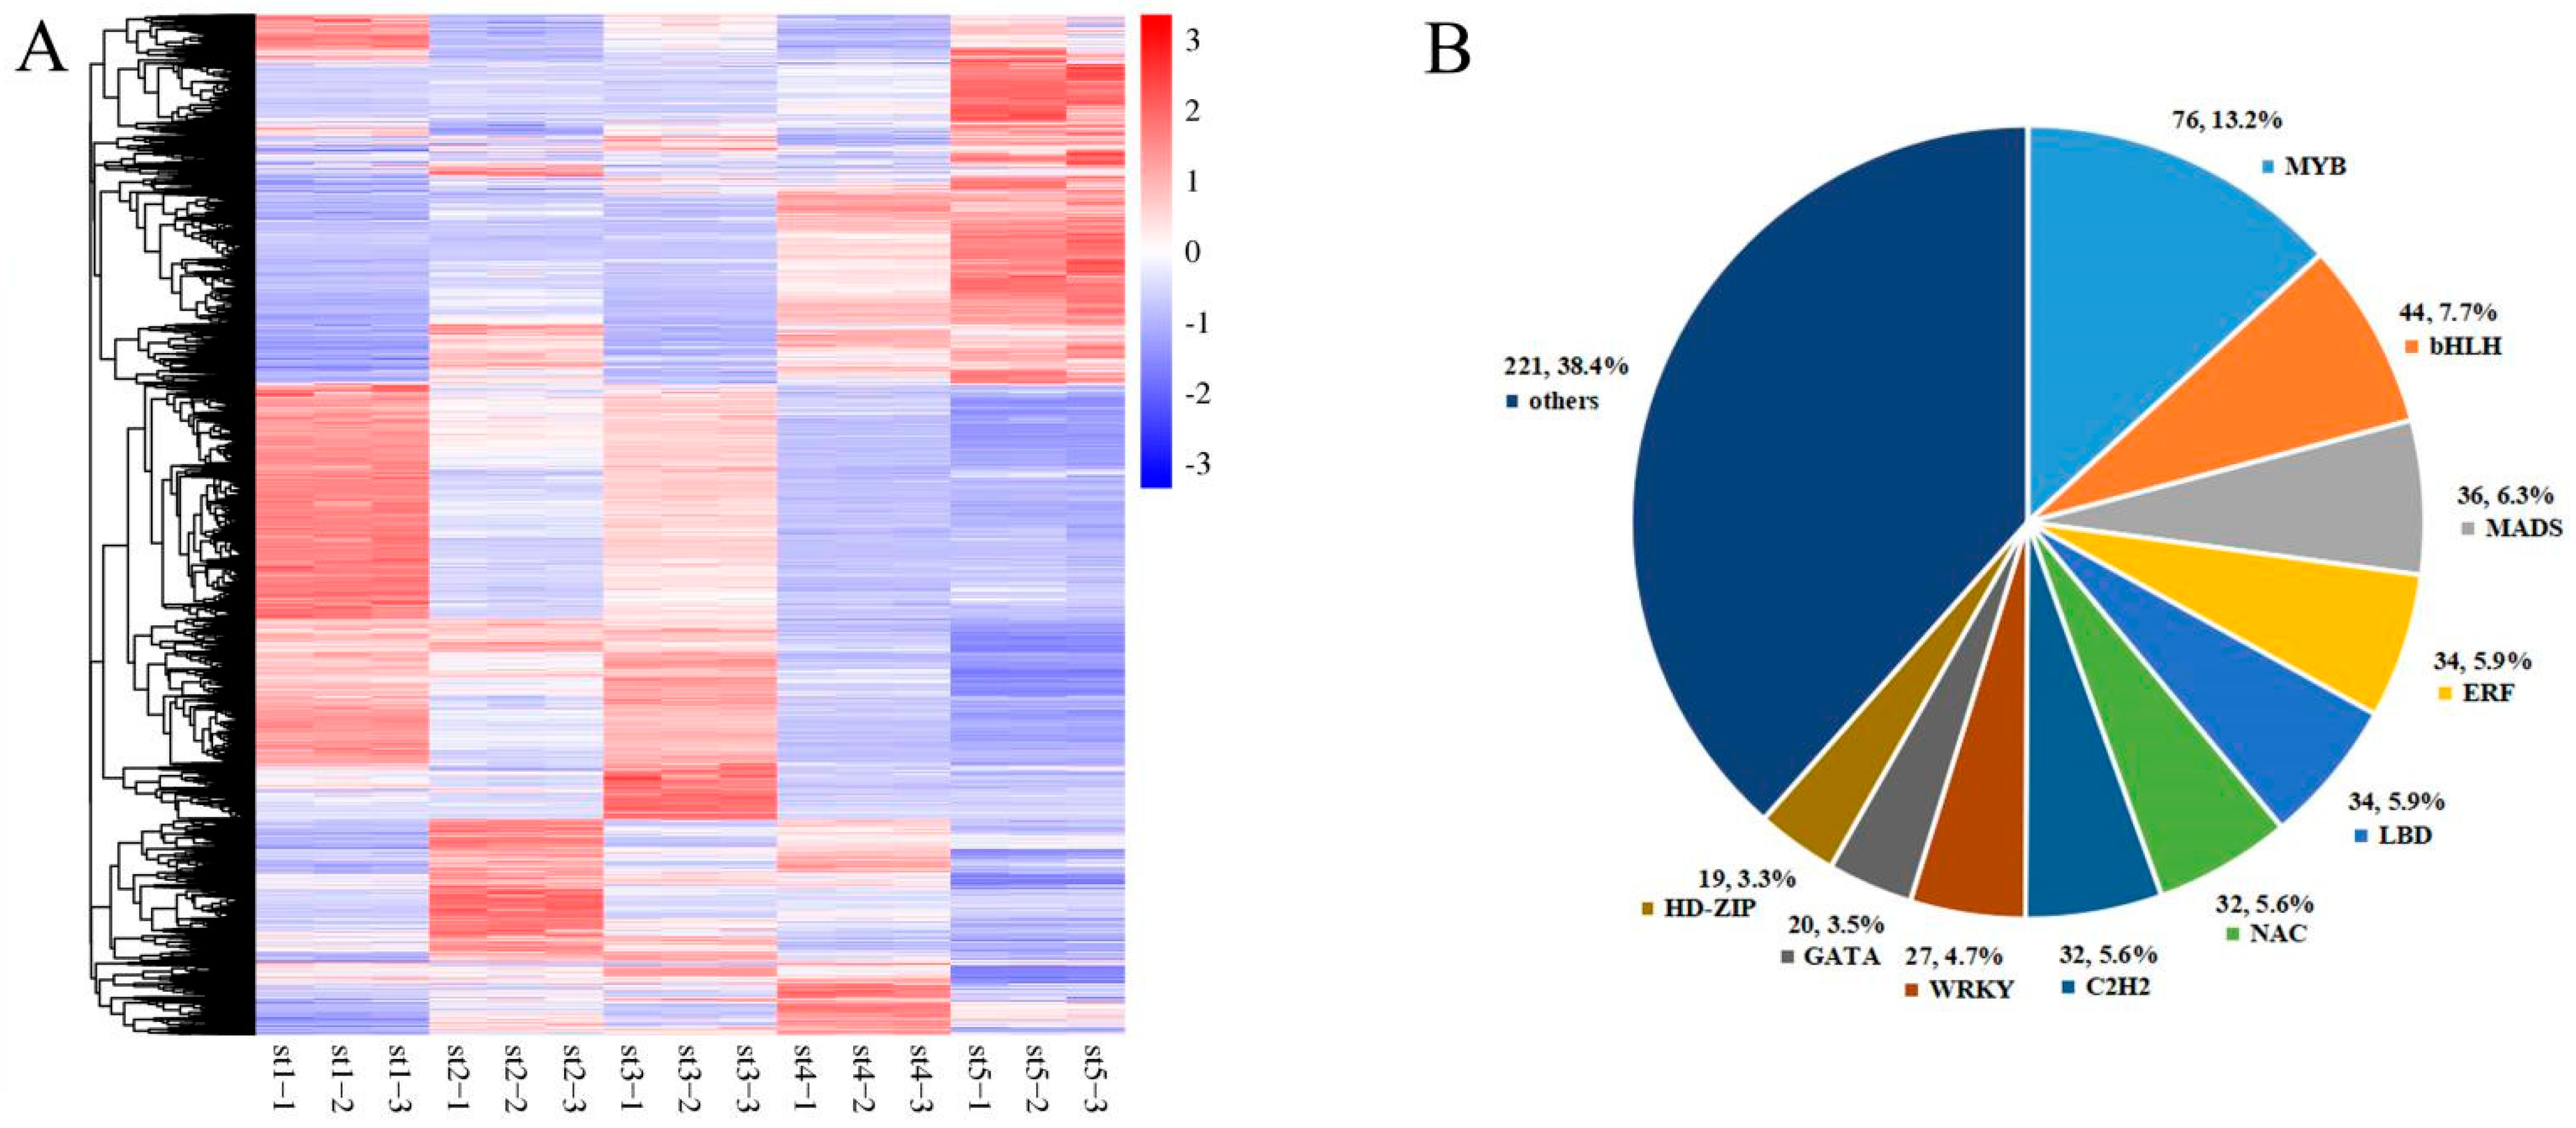
3.1. Global Transcriptomic Changes during Petunia Flower Development

A total of 723,670,362 clean reads were generated from the 15 cDNA libraries, and in each sample, the value of Q20 was more than 97%, Q30 > 93%, and GC content > 42% (Table S1A). HISAT2 software was used to compare clean reads and the reference genome, and the percentage of reads that were uniquely mapped was more than 93% in nearly all samples (except for st2-1) (Table S1B).
The analysis of differentially expressed genes was conducted using edgeR, with screening criteria of FDR < 0.05 and |Fold Change| > 2. As shown in Table 1, there were 12,674 (6354 up-regulated and 6320 down-regulated) DEGs between st5 and st1; this was the greatest number of DEGs of all the comparisons and was in accordance with the most differences in flower morphology. The lowest number of DEGs occurred between st3 and st1, with 3005 (2271 up-regulated and 734 down-regulated) DEGs. The heat map shown in Figure 2A exhibited the global clustering and significant changes in gene expression across all samples, in which a stage-specific transcriptome profile during flower development could be observed. Simultaneously, a large proportion of down-regulated DEGs showed similar expression patterns in st4 and st5 (Figure 2A). Accordingly, the PCA analysis showed that samples from the five different stages were clearly distinguishable and those from the three biological duplications were clustered together (Figure S1).

3.2. Differential Expression of Transcription Factor Genes

Research has focused on transcription factor (TF) genes because they play essential roles in flower development, and many members belonging to different TF families have been verified to be active in various aspects of flower formation. With the criteria of FDR < 0.05 and |logFC| > 2, a total of 575 DEGs encoding transcription factors were identified and assigned to 39 TF families according to the transcription factor database. The top ten TF families are shown in Figure 2B. The MYB gene family accounted for the largest proportion of DEGs (76; 13.2%), followed by bHLH (44; 7.7%), MADS (36; 6.3%), ERF (34; 5.9%), and LBD (34; 5.9%). Additionally, there were candidate genes assigned to other TF families, such as TCP (9), PLATZ (7), Trihelix (5), NF-YA (6), NF-YB (7), NF-YC (1), and YABBY (2). For each TF family, the number of up- and down-regulated TF genes in each comparison group were counted; this showed that the most differentially expressed TF genes in these families all occurred in st5 vs. st1 (except for the NAC family; Table S2), which corresponded to the periods with the most differences in morphology.

3.3. GO Enrichment and KEGG Pathway Analysis of DEGs

The DEGs of two different flower developmental stages were used to conduct GO and KEGG enrichment analysis. Compared to st1, there were 57, 8, 61, and 65 significantly enriched GO terms for the down-regulated DEGs in st2 vs. st1, st3 vs. st1, st4 vs. st1, and st5 vs. st1, respectively. The GO term “nucleus” (GO:0005634) occurred in all four comparison groups (Table S3A); a total of 65, 24, 87, and 73 enriched GO terms for the up-regulated DEGs were obtained in st2 vs. st1, st3 vs. st1, st4 vs. st1, and st5 vs. st1, respectively. All groups also contained the GO term “biological_process carbohydrate metabolic process” (GO:0005975) (Table S3B), which was enriched in the down-regulated DEGs in st3 vs. st2, st4 vs. st2, st5 vs. st2, st5 vs. st3, and st5 vs. st4 (Table S3A). Compared to the first four stages (st1, st2, st3, st4), the most significantly over-represented GO terms of down-regulated DEGs in st5 vs. st1, st5 vs. st2, st5 vs. st3, and st5 vs. st4 were focused on photosynthesis, including the biological process terms “photosynthesis” (GO:0015979), “photosynthetic light harvesting” (GO:0009765), “cellular_component photosystem II oxygen evolving complex” (GO:0009654), and “cellular_component photosystem II” (GO:0009523) (Table S3A). In addition, the significantly enriched GO terms for the up-regulated DEGs, including “protein kinase activity” (GO:0004672), “protein phosphorylation” (GO:0006468), and “transferase activity, transferring phosphorus-containing groups” (GO:0016772) were present in st4 vs. st2, st5 vs. st2, st5 vs. st3, and st5 vs. st4 (Table S3B).
According to the KEGG enrichment analysis, there were 9, 9, 10, and 10 down-regulated DEGs in the comparisons of st5 with the first four stages, respectively, that were enriched in the pathway of “photosynthesis—antenna proteins” (ko00196) (Table S3C). The up-regulated DEGs were mainly enriched in the pathway of “starch and sucrose metabolism” (ko00500) in st2 vs. st1, st3 vs. st1, st4 vs. st1, and st5 vs. st1 (Table S3D). In general, the enrichment analysis revealed an increasing trend of carbohydrate metabolism and a decreasing trend of photosynthesis during petunia flower morphogenesis. Additionally, the enriched pathways related to phenylalanine metabolism, including flavonoid biosynthesis (ko00941), phenylpropanoid biosynthesis (ko00940), and phenylalanine metabolism (ko00360), simultaneously occurred in the up-regulated DEGs of st2 vs. st1, st4 vs. st1, st5 vs. st1, st4 vs. st2, st4 vs. st3, and st5 vs. st3 (Table S3D). The genes encoding the three enzymes that catalyse the first three steps in the synthesis of phenylpropanoid-derived compounds, namely, phenylalanine ammonia-lyase (PAL), 4-coumarate-coenzyme A ligase (4CL), and cinnamate 4-hydroxylase (C4H), showed significant up-regulation collectively in st2 vs. st1, st4 vs. st1, and st5 vs. st1. The enzyme genes associated with flavonoid biosynthesis—chalcone synthase (CHS), chalcone–flavonone isomerase (CHI), naringenin, 2-oxoglutarate 3-dioxygenase (F3H), and flavonoid 3′, 5′-hydroxylase (F3′5′H)—and lignin biosynthetic genes—caffeoyl-CoA O-methyltransferase (CCoAOMT), cinnamyl alcohol dehydrogenase (CAD), and hydroxycinnamoyl-CoA shikimate/quinatehydroxycinnamoyltransferase (HCT)—also showed significant up-regulation in these groups (Table S3E). These results illustrate the important role of secondary metabolites during flower morphogenesis, except for flower organ differentiation and growth. The enriched KEGG pathways for down-regulated DEGs in st2 vs. st1 and st4 vs. st1 were similar, such as the pathways of “cell cycle” (ko04110), “cellular senescence” (ko04218), “p53 signalling pathway” (ko4115), and “FoxO signalling pathway” (ko4068) (Table S3C). There were no enriched pathways of down-regulated DEGs in st3 vs. st1 or of up-regulated DEGs in st5 vs. st2.

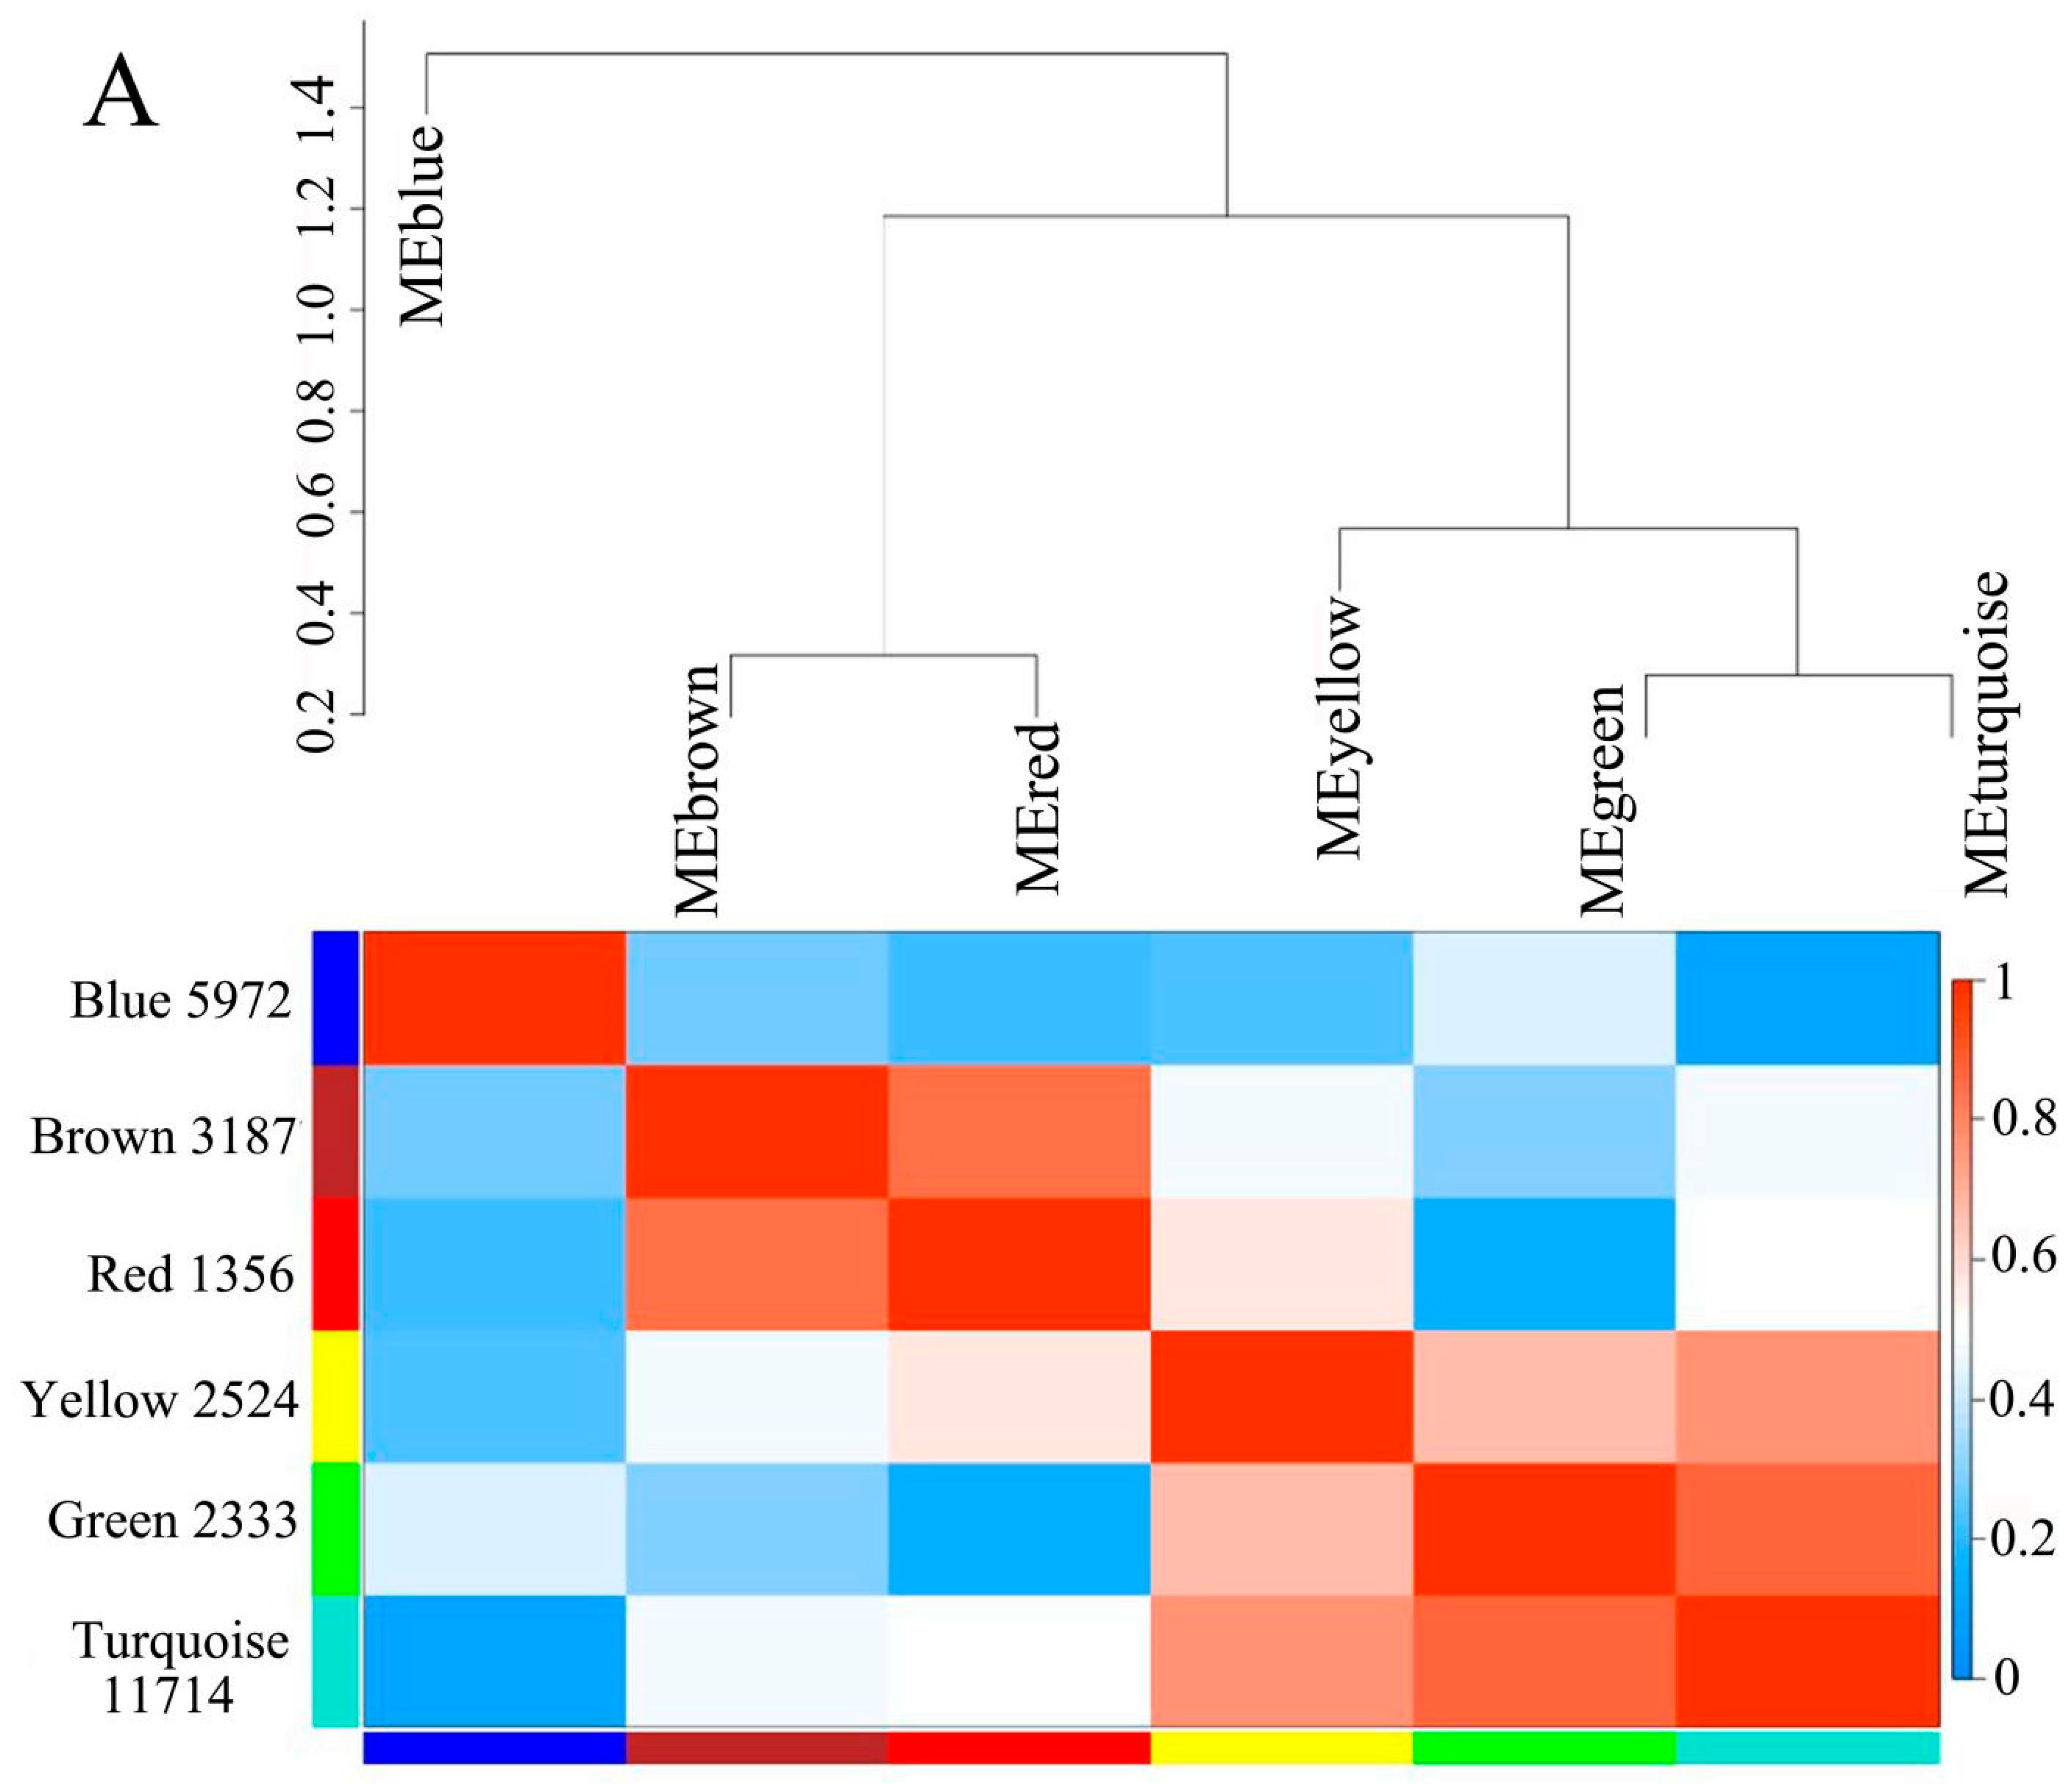
3.4. Gene Clustering Analysis and Co-Expression Network Construction

Based on the expression patterns of genes in different flower developmental stages, the genes with similar transcriptome profiles were grouped into clusters. A total of nine distinct expression clusters were identified (Figure S2), which were further grouped into six modules through WGCNA analysis: blue, brown, green, red, turquoise, and yellow modules (Figure 3A). In each module, genes shared high cooperativity in expression patterns. For example, the genes in the blue module exhibited down-regulation in the first three stages and up-regulation in the last two stages of development (Figure 3(BI)), and they were significantly enriched in the GO terms of transferase activity (GO:0016740), chloroplast thylakoid (GO:0009534), and plastid thylakoid (GO:0031976), and the pathways of photosynthesis–antenna proteins (ko00196), photosynthesis (ko00195), and endocytosis (ko04144) (Table S4). The genes in the brown module were down-regulated in nearly all stages except for st2 (Figure 3(BII)). The top 10 enriched GO terms of these genes were in the category of cellular component, and the top five KEGG enrichment pathways were oxidative phosphorylation (ko00190), glycolysis/gluconeogenesis (ko00010), citrate cycle (TCA cycle) (ko00020), arginine biosynthesis (ko00220), and fructose and mannose metabolism (ko00051) (Table S4). Co-expressed genes in the red module exhibited down-regulation in st1 and st5 and up-regulation in st2, st3, and st4 (Figure 3(BIII)), and were mainly enriched in the GO terms of endosome (GO:0005768), necrotic cell death (GO:0070265), and vacuolar proton-transporting V-type ATPase, V0 domain (GO:0000220) without significant KEGG enrichment (q-value < 0.05, Table S4). Contrastingly, the green module showed up-down-up-down-up regulation during flower development (Figure 3(BIV)) and was significantly enriched in the KEGG pathway of amino and nucleotide sugar metabolisms (ko00520) without statistically significant GO enrichment results (q-value < 0.05, Table S4). The expression of genes in the yellow and turquoise modules showed opposite trends in st1, but the same trend in the later four stages (Figure 3(BV), 3(BVI)); these genes were mainly enriched in the GO terms in the “cellular component” category (Table S4). The KEGG enrichment analysis showed that the genes in the yellow module were enriched in the pathway of plant hormone signal transduction (ko04075), while the top three enriched pathways of genes in the turquoise module were ribosome (ko03010), ribosome biogenesis in eukaryotes (ko03008), and spliceosome (ko03040) (Table S4).
According to the WGCNA results, the genes in the blue module and the yel+tur module (the yellow and turquoise modules were taken as one sample because the gene expression pattern in the two modules was largely similar) were selected to construct a putative transcriptional regulatory network linking the co-expressed genes harbouring the binding motif in the promoter region to the transcription factor genes with binding sites. As shown in Figure 3C(I), the blue module exhibited high enrichment in the DNA sequence motifs of MIKC-MADS, BBR-BPC, and Dof, mainly associated with TFs, including AGL2, AGL16, AG, AGL9, ATBPC6, ADOF1, DAG2, and OBP3. The target genes were enriched in the GO terms of thylakoid, glycogen metabolic process, thylakoid part, photosynthesis, light reaction, plastid part, plastid thylakoid, and photosynthetic membrane. The DNA motifs of MIKC_MADS, BBR-BPC, Dof, and GATA were found in the yel+tur module in Figure 3C(II), with TFs including AGL9, AGL20, AGL16, ATBPC6, ADOF1, OBP3, and GATA24. Target genes in this module were involved in the GO terms of negative regulation of biological process, developmental process involved in reproduction, regulation of gene expression, and epigenetic and shoot system development.

3.5. Analysis of sRNAs in Petunia

High-throughput small RNA-sequencing of the 15 libraries generated raw reads ranging from 9,838,267 to 22,586,531. After discarding adapter sequences, low-quality reads, and small reads (<18 nt), the average number of clean reads (total sRNA, 18–30 nt) obtained from st1 to st5 were 15,532,003, 13,704,259, 11,729,713, 13,127,518, and 15,393,630, respectively. The ratio between the clean reads and raw reads was over 90% for all samples. We annotated the clean reads and removed non-coding sRNAs, such as rRNA, snRNA, snoRNA, and tRNA, and then a total of approximately 74.92% clean reads were successfully aligned to the petunia reference genome (Table S5A). The distribution of total and unique sRNAs in at least two different samples was analysed, and the greatest amount of total sRNA was identified in st5 vs. st1 (92,701,553), while the largest amount of total unique sRNA was identified in st2 vs. st1 (Table S5B). The majority of the sRNA reads were 21–24 nt long; the 24 nt class was the largest. The 21 and 22 nt classes were more abundant than the 23 nt class in the studied samples (Table S5C).
A blastn search against miRbase 17.0 identified 45 conserved miRNAs, including miR156, miR159, miR160, miR164, miR166/165, miR167, miR172, and miR319 loci. Each discovered miRNA received an identification number in the following format: Ph-miR (number). In cases where miRNAs displayed identity with sequences from miRBase, the annotation Ph-miR (number)/miRBase was used. The most common were Pa-miR36/stu-miR395j (12 loci) and Pa-miR29/stu-miR166d-3p (8 loci), and the precursor length of these miRNAs ranged from 41–252 nt. A total of 26 novel miRNAs were predicted based on the characteristic stem–loop structures, and Pa-miRn7/t0000105_x32633 occurred at five loci, while the others, except for Pa-miRn8/t0000114_x29467, Pa-miRn19/t0001889_x2898, and Pa-miRn21/t0005657_x1302, were at only one locus (Table S6A). miR169 (Phy-BLIND), which targets NF-YA to confine the expression of C class genes in the inner organs [54], was not identified in the present study. This might be because miRBL was expressed only in the early bud stage and a subset of bud tissue, as there was relatively low expression of miRBL in older flower buds [54,55]. The absence of reported miRNAs, such as miR6164, miR157, miR8016, miR2111, and miR397, in our study can similarly be explained. The above results indicate that miRNA expression exhibits specificity depending on the stage or tissue, which is similar to the sex-specific miRNAs in Coccinia grandis that play an important role in the activation of sex differentiation [56] and the dynamic regulatory network mediated by floral homeotic TFs and miRNAs controlling floral development in Arabidopsis [57].

3.6. Differential Expression of miRNAs during Flower Development

The significantly differentially expressed miRNAs (DEMs) between two different developmental stages were screened with the criteria of padj < 0.05 and |log2FoldChange| > 1. The greatest number of 44 DEMs was identified in st5 vs. st1 (Figure 4), which contained 26 known miRNAs (9 down-regulated and 17 up-regulated; Table S6B) and 18 novel miRNAs (10 down-regulated and 8 up-regulated; Table S6C). The 43 DEMs in st4 vs. st1 was the second greatest (Figure 4), containing 14 up-regulated and 9 down-regulated known miRNAs (Table S6B), and 9 up-regulated and 11 down-regulated novel miRNAs (Table S6C). A heat map was generated to characterise the clustering and global expression pattern of all DEMs, which exhibited the obvious stage-specific expression of up-regulated miRNAs (Figure S3).
The miR156 shown in three forms was differentially expressed in all of the comparison groups. Compared to st1, Pa-miR6/sly-miR156d-5p and Pa-miR25/stu-miR156d-3p showed simultaneous up-regulation in st2, st3, and st5, and Pa-miR6/sly-miR156d-5p showed up-regulation in st4, while Pa-miR26/stu-miR156d-5p showed down-regulation in this stage (Table S6B). There are two forms of miR172: Pa-miR12/sly-miR172d and Pa-miR32/stu-miR172e-3p. The Pa-miR12/sly-miR172d showed up-regulation in st3 vs. st1 and st3 vs. st2, and down-regulation in st4 vs. st3 and st5 vs. st3 (Table S6B), indicating its dominant expression in st3. The novel miRNA of Pa-miRn6/t0000099_x36005 showed up-regulation in st2 vs. st1 and down-regulation in the other comparison groups. Pa-miRn2/t0000048_x74694 showed up-regulation in nearly all of the comparison groups except for st4 vs. st3 and st5 vs. st4 (Table S6C). Additionally, miR3627, which was found in tomato and potato but not in an earlier study on petunia [54], was identified. It showed up-regulation in st4 compared to st1 and st2, and down-regulation in st5 compared to the first four stages (Table S6B), indicating that miR3267 may act mainly in st4, which is a more advanced bud stage than that studied in the earlier study.

3.7. GO Enrichment Analysis and KEGG Analysis of Targets for DEMs

The potential targets of conserved and novel miRNAs were predicted using psRobot software, and the target genes for DEMs in each of two different stages were selected to perform GO functional enrichment and KEGG pathway enrichment analysis using a q-value < 0.05 as the significant difference threshold. The GO term “nucleus” (GO:0005634) of the cellular component category occurred in nearly all comparison groups except for st5 vs. st3, in which the significantly over-represented GO terms were focused on DNA binding (GO:0003677) of the molecular function category; regulation of transcription, DNA-templated (GO:0006355), and TOR signalling (GO:0031929) of the biological process category; and TORC1 complex (GO:0031931) of the cellular component category (Table S7A). The target genes for DEMs in st2 vs. st1, st3 vs. st1, st4 vs. st1, and st5 vs. st1 were all enriched in the GO term of biological process response to hormone (GO:0009725) (Table S7A), including ARF6, ARF10, and ARF8, which might be regulated by miR160 and miR167 (Table S7B).
The significantly enriched KEGG pathways were only obtained in five comparison groups: st2 vs. st1, st4 vs. st2, st5 vs. st2, st4 vs. st3, and st5 vs. st3. The pathway of autophagy—other (ko04136) was found in four comparison groups (except for st2 vs. st1), while the metabolic pathways of plant–pathogen interaction (ko04626), aminoacyl-tRNA biosynthesis (ko00970), and toxoplasmosis (ko05145) were only found in st2 vs. st1 (Table S7A).

3.8. Correlation Analysis of miRNA–mRNA at Different Stages of Flower Development in Petunia

According to the prediction results in target genes for conserved and novel miRNAs, the correlations between the miRNA and mRNA-sequencing profiles were analysed on the basis of the expression level of samples from the five different developmental stages, and the pairs of miRNA and target genes with negative correlations > 0.8 were screened to construct an miRNA–mRNA regulation network during flower development in petunia. As shown in Table 2, five genes in total were predicted as target genes of Pa-miR15/sly-miR390b-5p, three of which were annotated as “leucine-rich receptor-like protein kinase family protein” (LRR-RLKs). One of the three predicted targets for Pa-miR39/stu-miR399i-3p was “NAC domain containing protein 82” (NAC). For the novel miRNAs, a gene annotated as “sequence-specific DNA binding transcription factors” (Trihelix) was predicted as a target of the novel miRNA of Pa-miRn8/t0000114_x29467, and the annotated “UDP-galactose transporter 3 (UGT3)” gene was putatively targeted by Pa-miRn5/t0000087_x39090.

3.9. Validation of the Differentially Expressed Genes and miRNAs by Quantitative RT-PCR Analysis

A total of nine DEGs and nine DEMs were selected to conduct qRT-PCR for validation of the results of transcriptomic sequencing and miRNA sequencing. The primers are listed in the Supplementary Materials (Table S8A,B). The results (Figures S4 and S5) showed that most of the genes or miRNAs exhibited the same expression patterns in the five different developmental stages, while a few of them showed a contrasting trend in two adjacent phases; this may have been caused by the difference between the technologies in sequencing and qRT-PCR analysis.

4. Discussion

The elucidation of the developmental mechanisms underlying different flowering patterns is critical for a comprehensive understanding of the diversification of flowers, which has been exemplified in studies on Cicer arietinum [58], Annona squamosa [59], Achimenes [60], Rhododendron pulchrum [61], and Zingiber zerumbet [62]. Similar to the results of these studies, we found carbohydrate metabolism and photosynthesis to play important roles during flower morphogenesis in petunia. Carbohydrate metabolism during flower development, especially the carbohydrate supply, is essential for flower initiation, development of the floral organs up to gametophyte development, and fruit setting [63,64]. Sucrose is the main circulating form of carbohydrate from source tissues [65], while starch is another main carbohydrate that is actively mobilised in floral organs, including the ovular tissues [66,67]. Sugar provides energy, and it is a precursor and component of anthocyanin structure. It also acts as a signal molecule to regulate the expression of anthocyanin synthesis-related enzyme genes affecting plant colouration. For example, sugar regulates anthocyanin synthesis-related enzyme genes in petunia crowns through hexokinase-related signal transduction pathways [68], and it modulates changes in endogenous Ca2+ levels, which, in turn, regulate anthocyanin accumulation in Arabidopsis [69]. Modifying sugar signalling can improve photosynthetic performance through regulating the source–sink balance [70], while photosynthesis can supply the carbon required for flower development and is performed not only in leaves but also in the flowers themselves, such as in the bracts, sepals, anthers, corolla, or flower stalks [71]. A previous report on grapevines showed that the global photosynthetic activity in inflorescences decreased during inflorescence development; this may be dissimulated by intense respiratory activity [72], as the mechanisms underlying photosynthesis in flowers remain to be fully elucidated. We hypothesised that due to the formation of flower colour, the contents of photosynthesis-related pigments, such as chlorophyll and carotenoid, might be reduced, which might influence photosynthesis.
The phenylalanine-derived secondary metabolites, which include monolignols, flavonoids (anthocyanins, proanthocyanidins, flavonols, flavones, flavanones, isoflavonoids, and phlobaphenes), various phenolic acids, and stilbenes, act as phytoalexins, pigments, cell wall components, and signalling molecules [73,74]. Flavonoids have also been proven to be essential for pollen tube growth and pollen function [75]. In our study, we found that the genes regulating phenylalanine-related pathways, including flavonoid biosynthesis, phenylpropanoid biosynthesis, and phenylalanine metabolism, were up-regulated during the flower developmental stages; similar metabolic pathways have been observed in many plant species [58,60,61,76], suggesting the involvement of secondary metabolites in some developmental events occurring in various stages. However, the molecular mechanism underlying the appearance and enrichment of metabolites in flower development remains nebulous, which might be due to the stage-specific expression of TF family members, such as the genes in subgroup 7 of R2R3 MYB and the subgroup bHLH IIIf and III(d+e), which play important roles in flavonoid biosynthesis in many plants [77,78,79]. Another hypothesis might be that floral organ identity genes connect organ shape development with secondary metabolism, as a previous study showed that the functional loss of SEP3 homologs in Petunia hybrida and the Phalaenopsis orchid leads to the appearance of green tissues in petals [80,81]. Overexpression of the kiwifruit MADS-box gene SHORT VEGETATIVE PHASE (SVP) results in increased chlorophyll content in petals [82], and VmTDR4 was associated with anthocyanin biosynthesis in bilberry fruit [83]. In Arabidopsis, AP3/PI regulated the GATA genes GNC and GNL, which were found to be involved in organ identity and chlorophyll biosynthesis in the petals and stamens [84]. To date, the regulatory mechanisms of the MADS-box genes involved in metabolic pathways, especially those related to flower pigmentation, are still unclear. In this study, the MYB, bHLH, MADS, ERF, and LBD were particularly important in our transcriptome data. The co-expression analysis showed that the MIKC-MADS, BBR-BPC, Dof, and GATA genes showed a high correlation of expression patterns with the developmental stages. We suggest that implementing subsequent genome-wide identification, expression analysis, and interaction validation in these families can provide necessary support for exploring the novel regulatory network of flower development. In addition, changes in morphology, physiological and biochemical reactions, metabolite contents, and plant hormone levels in different flower buds should also be considered in the study of potential regulators involved in flower morphogenesis.
Plant hormones or phytohormones can affect most aspects of the plant life cycle, including flower development, secondary metabolites, and stress responses [85,86,87]. The phytohormone pathway has been found in the transcriptomic analysis of flower development [88,89,90]. In our study, we found that the involvement of miRNAs in plant hormone signalling regulates flower morphogenesis, which is in accordance with previous studies on the interactions between miRNA pathways and phytohormone responses. For example, miR393, miR167, and miR413 are regulated by abscisic acid (ABA) [91,92]; miR167, miR164, miR168, miR169, and miR393 are involved in auxin signalling [93,94,95]; and miR159 and miR394 expression levels are decreased following ethylene treatment in rice, while miR172 and miR319 are down-regulated following 6-BA treatment [94]. A complex network of phytohormones, miRNAs, and TFs has been found in the flower development process; for instance, miR156-regulated SPL genes can promote the expression of miR172, whose targets are APETALA2 (AP2) genes in Arabidopsis that can also positively regulate the expression of miR156 during floral transition [96,97]. Gibberellic acid (GA) treatment regulates miR159 to affect the SPL expression that influences flower bud development [23,98], and GA concentration is regulated by miR319-targeted TCP genes [99]. A cooperative regulation mechanism that integrates the miR156 module with GA responses and miR319-controlled pathways was revealed in tomato flower transition and development [100]. In this study, the miRNA–mRNA correlation analysis showed a strong negative correlation in the expression of Pa-miR39/stu-miR399i-3p and NAC, which was also verified by the qRT-PCR analysis. Many studies show that miR399 plays a role in plant responses to Pi deficiency stress by inhibiting the expression of PHOSPHATE2 (PHO2, or UBC24 encoding the ubiquitin-conjugating E2 enzyme) [101]. The miR399–PHO2 module also contributes to other functions in plants, such as flowering time, salt stress, nutrient starvation responses, sugar metabolism, and male sterility [102,103]. Besides controlling plant growth and development and abiotic stress responses [104,105], the NAC TFs were also found to respond to ethylene and ABA signals in tomato fruit ripening [74]. A subset of NAC genes, including CUC1 and CUC2, are regulated by miR164, which provides novel insights for understanding the molecular network of plant development and stress response [106,107,108]. Thus, whether a novel regulatory pathway that integrates phytohormone, miR399, miR164, and NAC genes exists in petunia needs further investigation. Furthermore, most research on hormonal regulation in flowers has been conducted in A. thaliana; hence, it is necessary to investigate plant hormone signalling and epigenetic regulation mechanisms, including miRNA, DNA methylation, and histone modification, in petunia to better understand the diversification of flowers. The results of the miRNA–mRNA correlation analysis in our study provide a good foundation for such analyses.

5. Conclusions

This study presents a comprehensive description of the dynamic expression profiles of mRNA and miRNA levels during the five flower developmental stages in Petunia axillaris. A large set of candidate genes and miRNAs were identified which exhibited characteristic features of time series expression patterns. A co-expression pattern was observed in the expressed genes, and the existence of novel miRNA–mRNA pathways was suggested. Enrichment analysis of DEGs and DEM-target genes showed that the carbohydrate metabolism, photosynthesis, phenylalanine metabolism, and plant hormone pathways function throughout flower development. These results will be useful for further studies since they provide insights into the mechanisms by which transcription factors achieve their specificity, gene-mediated regulation at different developmental stages, and the genetic basis for large variations in floral morphologies.

Supplementary Materials

The following supporting information can be downloaded at: https://www.mdpi.com/article/10.3390/horticulturae8040284/s1. Figure S1: Principal component analysis (PCA) for all samples, Figure S2: Cluster analysis of genes with a similar expression pattern. The cluster name and the number of genes for each cluster are indicated, Figure S3: The heat map of the total differentially expressed miRNAs. The colour scale represents the TPM values. Colours from blue to red indicate low to high TPM values; red indicates a high expression level, and blue indicates a low expression level, Figure S4: qRT-PCR verification of nine randomly selected differentially expressed genes (DEGs). Error bars indicate standard deviations, Figure S5: qRT-PCR verification of nine randomly selected differentially expressed miRNAs (DEMs). Error bars indicate standard deviations, Table S1: Summary of the petunia transcriptome, Table S2: GO and KEGG enrichment analysis of DEGs in different comparison groups, Table S3: Numbers of up- and down-regulated transcription factor genes in different comparison groups, Table S4: GO and KEGG enrichment analysis of the co-expressed genes in each module, Table S5: Characteristics of sRNAs in the five developmental stages of petunia flowers, Table S6: Discovery and differential expression analysis of miRNAs during flower development, Table S7: GO and KEGG enrichment analysis of the targets for DEMs, Table S8: Primer sequences of genes and miRNAs used for quantitative RT-PCR verification.

Author Contributions

Conception and design: C.L. and Y.W.; experiment design and implementation: Q.Y. and C.L.; data analysis: Q.Y., X.J. and Y.W.; writing of the manuscript: Q.Y. and C.L. All authors have read and agreed to the published version of the manuscript.

Funding

This research was supported by the National Natural Science Foundation of China (31701954), the Outstanding Youth Program of Hunan Education Department (20B599), and the State Forestry Administration of the People’s Republic of China of key disciplines (No. 21, Lin Renfa (2016)) and the “Double-first” cultivation discipline (No. 469, Hunan Jiao Tong (2018)) of Hunan Province.

Data Availability Statement

The data that support the findings of this study are available in the Supplementary Materials of this article.

Conflicts of Interest

The authors declare no conflict of interest.

References

  1. Shan, H.; Cheng, J.; Zhang, R.; Yao, X.; Kong, H. Developmental mechanisms involved in the diversification of flowers. Nat. Plants 2019, 5, 917–923. [Google Scholar] [CrossRef] [PubMed]
  2. Krizek, B.A.; Fletcher, J.C. Molecular mechanisms of flower development: An armchair guide. Nat. Rev. Genet. 2005, 6, 688–698. [Google Scholar] [CrossRef] [PubMed]
  3. Luo, Y.; Guo, Z.; Li, L. Evolutionary conservation of microRNA regulatory programs in plant flower development. Dev. Biol. 2013, 380, 133–144. [Google Scholar] [CrossRef] [PubMed] [Green Version]
  4. Jin, S.; Nasim, Z.; Susila, H.; Ahn, J.H. Evolution and functional diversification of FLOWERING LOCUS T/TERMINAL FLOWER 1 family genes in plants. Semin. Cell Dev. Biol. 2021, 109, 20–30. [Google Scholar] [CrossRef]
  5. Thomson, B.; Wellmer, F. Molecular regulation of flower development. Curr. Top. Dev. Biol. 2019, 131, 185–210. [Google Scholar] [CrossRef]
  6. Theißen, G.; Saedler, H. Floral quartets. Nature 2001, 409, 469–471. [Google Scholar] [CrossRef]
  7. Dubois, A.; Raymond, O.; Maene, M.; Baudino, S.; Langlade, N.B.; Boltz, V.; Vergne, P.; Bendahmane, M. Tinkering with the C-Function: A Molecular Frame for the Selection of Double Flowers in Cultivated Roses. PLoS ONE 2010, 5, e9288. [Google Scholar] [CrossRef]
  8. Kanno, A. Molecular Mechanism Regulating Floral Architecture in Monocotyledonous Ornamental Plants. Hortic. J. 2016, 85, 8–22. [Google Scholar] [CrossRef] [Green Version]
  9. Vroemen, C.W.; Mordhorst, A.P.; Albrecht, C.; Kwaaitaal, M.A.C.J.; De Vries, S.C. The CUP-SHAPED COTYLEDON3 Gene Is Required for Boundary and Shoot Meristem Formation in Arabidopsis. Plant Cell 2003, 15, 1563–1577. [Google Scholar] [CrossRef]
  10. Prunet, N.; Yang, W.; Das, P.; Meyerowitz, E.M.; Jack, T.P. SUPERMAN prevents class B gene expression and promotes stem cell termination in the fourth whorl of Arabidopsis thaliana flowers. Proc. Natl. Acad. Sci. USA 2017, 114, 7166–7171. [Google Scholar] [CrossRef] [Green Version]
  11. Huang, T.; Irish, V.F. Temporal Control of Plant Organ Growth by TCP Transcription Factors. Curr. Biol. 2015, 25, 1765–1770. [Google Scholar] [CrossRef] [Green Version]
  12. Wang, L.; He, L.; Li, J.; Zhao, J.; Li, Z.; He, C. Regulatory change at Physalis Organ Size 1 correlates to natural variation in tomatillo reproductive organ size. Nat. Commun. 2014, 5, 4271. [Google Scholar] [CrossRef] [Green Version]
  13. Wang, Z.; Luo, Y.; Li, X.; Wang, L.; Xu, S.; Yang, J.; Weng, L.; Sato, S.; Tabata, S.; Ambrose, M.; et al. Genetic control of floral zygomorphy in pea (Pisum sativum L.). Proc. Natl. Acad. Sci. USA 2008, 105, 10414–10419. [Google Scholar] [CrossRef] [Green Version]
  14. Li, X.; Liu, W.; Zhuang, L.; Zhu, Y.; Wang, F.; Chen, T.; Yang, J.; Ambrose, M.; Hu, Z.; Weller, J.L.; et al. Bigger organs and elephant ear-like Leaf1 control organ size and floral organ internal asymmetry in pea. J. Exp. Bot. 2019, 70, 179–191. [Google Scholar] [CrossRef]
  15. Koyama, T.; Ohme-Takagi, M.; Sato, F. Generation of serrated and wavy petals by inhibition of the activity of TCP transcription factors in Arabidopsis thaliana. Plant Signal. Behav. 2011, 6, 697–699. [Google Scholar] [CrossRef] [Green Version]
  16. Liu, X.; Huang, J.; Parameswaran, S.; Ito, T.; Seubert, B.; Auer, M.; Rymaszewski, A.; Jia, G.; Owen, H.A.; Zhao, D. The SPOROCYTELESS/NOZZLE Gene Is Involved in Controlling Stamen Identity in Arabidopsis. Plant Physiol. 2009, 151, 1401–1411. [Google Scholar] [CrossRef] [Green Version]
  17. Ó’Maoiléidigh, D.S.; Wuest, S.E.; Rae, L.; Raganelli, A.; Ryan, P.T.; Kwaśniewska, K.; Das, P.; Lohan, A.J.; Loftus, B.; Graciet, E.; et al. Control of Reproductive Floral Organ Identity Specification in Arabidopsis by the C Function Regulator AGAMOUS. Plant Cell 2013, 25, 2482–2503. [Google Scholar] [CrossRef] [Green Version]
  18. Lohmann, J.; Hong, R.L.; Hobe, M.; Busch, M.A.; Parcy, F.; Simon, R.; Weigel, D. A Molecular Link between Stem Cell Regulation and Floral Patterning in Arabidopsis. Cell 2001, 105, 793–803. [Google Scholar] [CrossRef] [Green Version]
  19. Sun, B.; Xu, Y.; Ng, K.-H.; Ito, T. A timing mechanism for stem cell maintenance and differentiation in the Arabidopsis floral meristem. Genes Dev. 2009, 23, 1791–1804. [Google Scholar] [CrossRef] [Green Version]
  20. Sun, B.; Ito, T. Regulation of floral stem cell termination in Arabidopsis. Front. Plant Sci. 2015, 6, 17. [Google Scholar] [CrossRef] [Green Version]
  21. Wang, J.-W.; Czech, B.; Weigel, D. miR156-Regulated SPL Transcription Factors Define an Endogenous Flowering Pathway in Arabidopsis thaliana. Cell 2009, 138, 738–749. [Google Scholar] [CrossRef] [Green Version]
  22. Teotia, S.; Tang, G. To Bloom or Not to Bloom: Role of MicroRNAs in Plant Flowering. Mol. Plant 2015, 8, 359–377. [Google Scholar] [CrossRef] [Green Version]
  23. Chen, G.; Li, J.; Liu, Y.; Zhang, Q.; Gao, Y.; Fang, K.; Cao, Q.; Qin, L.; Xing, Y. Roles of the GA-mediated SPL Gene Family and miR156 in the Floral Development of Chinese Chestnut (Castanea mollissima). Int. J. Mol. Sci. 2019, 20, 1577. [Google Scholar] [CrossRef] [Green Version]
  24. Ding, X.; Ruan, H.; Yu, L.; Li, Q.; Song, Q.; Yang, S.; Gai, J. miR156b from Soybean CMS Line Modulates Floral Organ Development. J. Plant Biol. 2020, 63, 141–153. [Google Scholar] [CrossRef]
  25. Jung, J.-H.; Seo, Y.-H.; Seo, P.J.; Reyes, J.L.; Yun, J.; Chua, N.-H.; Park, C.-M. The GIGANTEA-Regulated MicroRNA172 Mediates Photoperiodic Flowering Independent of CONSTANS in Arabidopsis. Plant Cell 2007, 19, 2736–2748. [Google Scholar] [CrossRef] [Green Version]
  26. Mathieu, J.; Yant, L.; Muerdter, F.; Küttner, F.; Schmid, M. Repression of Flowering by the miR172 Target SMZ. PLoS Biol. 2009, 7, e1000148. [Google Scholar] [CrossRef] [Green Version]
  27. Grigorova, B.; Mara, C.; Hollender, C.; Sijacic, P.; Chen, X.; Liu, Z. LEUNIG and SEUSS co-repressors regulate miR172 expression in Arabidopsis flowers. Development 2011, 138, 2451–2456. [Google Scholar] [CrossRef] [Green Version]
  28. Wang, T.; Ping, X.; Cao, Y.; Jian, H.; Gao, Y.; Wang, J.; Tan, Y.; Xu, X.; Lu, K.; Li, J.; et al. Genome-wide exploration and characterization of miR172/euAP2 genes in Brassica napus L. for likely role in flower organ development. BMC Plant Biol. 2019, 19, 336. [Google Scholar] [CrossRef] [Green Version]
  29. Chung, M.-Y.; Nath, U.K.; Vrebalov, J.; Gapper, N.; Lee, J.M.; Lee, D.-J.; Kil Kim, C.; Giovannoni, J. Ectopic expression of miRNA172 in tomato (Solanum lycopersicum) reveals novel function in fruit development through regulation of an AP2 transcription factor. BMC Plant Biol. 2020, 20, 283. [Google Scholar] [CrossRef]
  30. Baker, C.C.; Sieber, P.; Wellmer, F.; Meyerowitz, E.M. The early extra petals1 Mutant Uncovers a Role for MicroRNA miR164c in Regulating Petal Number in Arabidopsis. Curr. Biol. 2005, 15, 303–315. [Google Scholar] [CrossRef] [Green Version]
  31. Huang, T.; López-Giráldez, F.; Townsend, J.; Irish, V.F. RBE controls microRNA164 expression to effect floral organogenesis. Development 2012, 139, 2161–2169. [Google Scholar] [CrossRef] [PubMed] [Green Version]
  32. Achard, P.; Herr, A.; Baulcombe, D.; Harberd, N.P. Modulation of floral development by a gibberellin-regulated microRNA. Development 2004, 131, 3357–3365. [Google Scholar] [CrossRef] [PubMed] [Green Version]
  33. Schwab, R.; Palatnik, J.; Riester, M.; Schommer, C.; Schmid, M.; Weigel, D. Specific Effects of MicroRNAs on the Plant Transcriptome. Dev. Cell 2005, 8, 517–527. [Google Scholar] [CrossRef] [PubMed] [Green Version]
  34. Li, Y.; Li, C.; Ding, G.; Jin, Y. Evolution of MIR159/319 microRNA genes and their post-transcriptional regulatory link to siRNA pathways. BMC Evol. Biol. 2011, 11, 122. [Google Scholar] [CrossRef] [Green Version]
  35. Nag, A.; King, S.; Jack, T. miR319a targeting of TCP4 is critical for petal growth and development in Arabidopsis. Proc. Natl. Acad. Sci. USA 2009, 106, 22534–22539. [Google Scholar] [CrossRef] [Green Version]
  36. Sarvepalli, K.; Nath, U. Hyper-activation of the TCP4 transcription factor in Arabidopsis thaliana accelerates multiple aspects of plant maturation. Plant J. 2011, 67, 595–607. [Google Scholar] [CrossRef] [Green Version]
  37. Kim, J.; Jung, J.-H.; Reyes, J.L.; Kim, Y.-S.; Kim, S.-Y.; Chung, K.-S.; Kim, J.A.; Lee, M.; Lee, Y.; Kim, V.N.; et al. microRNA-directed cleavage of ATHB15 mRNA regulates vascular development in Arabidopsis inflorescence stems. Plant J. 2005, 42, 84–94. [Google Scholar] [CrossRef] [Green Version]
  38. Ji, L.; Liu, X.; Yan, J.; Wang, W.; Yumul, R.E.; Kim, Y.J.; Dinh, T.T.; Liu, J.; Cui, X.; Zheng, B.; et al. ARGONAUTE10 and ARGONAUTE1 Regulate the Termination of Floral Stem Cells through Two MicroRNAs in Arabidopsis. PLoS Genet. 2011, 7, e1001358. [Google Scholar] [CrossRef] [Green Version]
  39. Liu, N.; Wu, S.; Van Houten, J.; Wang, Y.; Ding, B.; Fei, Z.; Clarke, T.H.; Reed, J.W.; van der Knaap, E. Down-regulation of AUXIN RESPONSE FACTORS 6 and 8 by microRNA 167 leads to floral development defects and female sterility in tomato. J. Exp. Bot. 2014, 65, 2507–2520. [Google Scholar] [CrossRef] [Green Version]
  40. Mallory, A.C.; Bartel, D.P.; Bartel, B. MicroRNA-Directed Regulation of Arabidopsis AUXIN RESPONSE FACTOR17 Is Essential for Proper Development and Modulates Expression of Early Auxin Response Genes. Plant Cell 2005, 17, 1360–1375. [Google Scholar] [CrossRef] [Green Version]
  41. Liu, X.; Huang, J.; Wang, Y.; Khanna, K.; Xie, Z.; Owen, H.A.; Zhao, D. The role of floral organs in carpels, an Arabidopsis loss-of-function mutation in MicroRNA160a, in organogenesis and the mechanism regulating its expression. Plant J. 2010, 62, 416–428. [Google Scholar] [CrossRef]
  42. Gerats, T.; Vandenbussche, M. A model system for comparative research: Petunia. Trends Plant Sci. 2005, 10, 251–256. [Google Scholar] [CrossRef]
  43. Cabral, A.R.; Beaudoin, G.; Choquette, M.; Lehmann, B.; Polônia, J.C. Supergene leaching and formation of platinum in alluvium: Evidence from Serro, Minas Gerais, Brazil. Miner. Pet. 2007, 90, 141–150. [Google Scholar] [CrossRef]
  44. Faraco, M.; Spelt, C.; Bliek, M.; Verweij, W.; Hoshino, A.; Espen, L.; Prinsi, B.; Jaarsma, R.; Tarhan, E.; de Boer, A.H.; et al. Hyperacidification of Vacuoles by the Combined Action of Two Different P-ATPases in the Tonoplast Determines Flower Color. Cell Rep. 2014, 6, 32–43. [Google Scholar] [CrossRef] [Green Version]
  45. Cna’Ani, A.; Spitzer-Rimon, B.; Ravid, J.; Farhi, M.; Masci, T.; Aravena-Calvo, J.; Ovadis, M.; Vainstein, A. Two showy traits, scent emission and pigmentation, are finely coregulated by the MYB transcription factor PH 4 in petunia flowers. New Phytol. 2015, 208, 708–714. [Google Scholar] [CrossRef] [Green Version]
  46. Colquhoun, T.A.; Verdonk, J.; Schimmel, B.; Tieman, D.M.; Underwood, B.A.; Clark, D.G. Petunia floral volatile benzenoid/phenylpropanoid genes are regulated in a similar manner. Phytochemistry 2010, 71, 158–167. [Google Scholar] [CrossRef]
  47. Martin, M. Cutadapt removes adapter sequences from high-throughput sequencing reads. EMBnet. J. 2011, 17, 10–12. [Google Scholar] [CrossRef]
  48. Kim, D.; Langmead, B.; Salzberg, S.L. HISAT: A fast spliced aligner with low memory requirements. Nat. Methods 2015, 12, 357–360. [Google Scholar] [CrossRef] [Green Version]
  49. Anders, S.; Pyl, P.T.; Huber, W. HTSeq—A Python framework to work with high-throughput sequencing data. Bioinformatics 2015, 31, 166–169. [Google Scholar] [CrossRef]
  50. Mortazavi, A.; Williams, B.A.; McCue, K.; Schaeffer, L.; Wold, B. Mapping and quantifying mammalian transcriptomes by RNA-Seq. Nat. Methods 2008, 5, 621–628. [Google Scholar] [CrossRef]
  51. Robinson, M.D.; McCarthy, D.J.; Smyth, G.K. EdgeR: A Bioconductor package for differential expression analysis of digital gene expression data. Bioinformatics 2010, 26, 139–140. [Google Scholar] [CrossRef] [PubMed] [Green Version]
  52. Yu, G.; Wang, L.-G.; Han, Y.; He, Q.-Y. clusterProfiler: An R Package for Comparing Biological Themes among Gene Clusters. OMICS J. Integr. Biol. 2012, 16, 284–287. [Google Scholar] [CrossRef] [PubMed]
  53. Langfelder, P.; Horvath, S. WGCNA: An R package for weighted correlation network analysis. BMC Bioinform. 2008, 9, 559. [Google Scholar] [CrossRef] [PubMed] [Green Version]
  54. Bombarely, A.; Moser, M.; Amrad, A.; Bao, M.; Bapaume, L.; Barry, C.; Bliek, M.; Boersma, M.R.; Borghi, L.; Bruggmann, R.; et al. Insight into the evolution of the Solanaceae from the parental genomes of Petunia hybrida. Nat. Plants 2016, 2, 16074. [Google Scholar] [CrossRef] [Green Version]
  55. Tedder, P.; Zubko, E.; Westhead, D.R.; Meyer, P. Small RNA analysis in Petunia hybrida identifies unusual tissue-specific expression patterns of conserved miRNAs and of a 24mer RNA. RNA 2009, 15, 1012–1020. [Google Scholar] [CrossRef] [Green Version]
  56. Mohanty, J.N.; Chand, S.K.; Joshi, R.K. Multiple microRNAs Regulate the Floral Development and Sex Differentiation in the Dioecious Cucurbit Coccinia grandis (L.) Voigt. Plant Mol. Biol. Rep. 2019, 37, 111–128. [Google Scholar] [CrossRef]
  57. Chen, D.; Yan, W.; Fu, L.-Y.; Kaufmann, K. Architecture of gene regulatory networks controlling flower development in Arabidopsis thaliana. Nat. Commun. 2018, 9, 4534. [Google Scholar] [CrossRef] [Green Version]
  58. Singh, V.K.; Garg, R.; Jain, M. A global view of transcriptome dynamics during flower development in chickpea by deep sequencing. Plant Biotechnol. J. 2013, 11, 691–701. [Google Scholar] [CrossRef]
  59. Liu, K.; Feng, S.; Pan, Y.; Zhong, J.; Chen, Y.; Yuan, C.; Li, H. Transcriptome Analysis and Identification of Genes Associated with Floral Transition and Flower Development in Sugar Apple (Annona squamosa L.). Front. Plant Sci. 2016, 7, 1695. [Google Scholar] [CrossRef] [Green Version]
  60. Roberts, W.R.; Roalson, E.H. Comparative transcriptome analyses of flower development in four species of Achimenes (Gesneriaceae). BMC Genom. 2017, 18, 240. [Google Scholar] [CrossRef] [Green Version]
  61. Wang, S.; Li, Z.; Jin, W.; Fang, Y.; Yang, Q.; Xiang, J. Transcriptome analysis and identification of genes associated with flower development in Rhododendron pulchrum Sweet (Ericaceae). Gene 2018, 679, 108–118. [Google Scholar] [CrossRef]
  62. Zhao, T.; Specht, C.D.; Dong, Z.; Ye, Y.; Liu, H.; Liao, J. Transcriptome analyses provide insights into development of the Zingiber zerumbet flower, revealing potential genes related to floral organ formation and patterning. Plant Growth Regul. 2020, 90, 331–345. [Google Scholar] [CrossRef]
  63. Brun, O.; Lebon, G.; Duchêne, E.; Magné, C.; Clément, C. Flower abscission and inflorescence carbohydrates in sensitive and non-sensitive cultivars of grapevine. Sex. Plant Reprod. 2004, 17, 71–79. [Google Scholar] [CrossRef]
  64. Lebon, G.; Rondeau, M.; Sanchez, L.; Barka, E.A.; Vaillant-Gaveau, N. Modulation of the Activity of Enzymes Involved in Carbohydrate Metabolism during Flower Development of Grapevine (Vitis vinifera L.). Open J. Plant Sci. 2016, 1, 010–017. [Google Scholar] [CrossRef] [Green Version]
  65. Lemoine, R.; La Camera, S.; Atanassova, R.; Dédaldéchamp, F.; Allario, T.; Pourtau, N.; Bonnemain, J.L.; Laloi, M.; Coutos-Thévenot, P.; Maurousset, L.; et al. Source-to-sink transport of sugar and regulation by environmental factors. Front. Plant Sci. 2013, 4, 272. [Google Scholar] [CrossRef] [Green Version]
  66. Ruiz, R. Carbohydrate Availability in Relation to Fruitlet Abscission in Citrus. Ann. Bot. 2001, 87, 805–812. [Google Scholar] [CrossRef] [Green Version]
  67. Rolland, F.; Baena-Gonzalez, E.; Sheen, J. Sugar sensing and signaling in plants: Conserved and Novel Mechanisms. Annu. Rev. Plant Biol. 2006, 57, 675–709. [Google Scholar] [CrossRef] [Green Version]
  68. Neta-Sharir, I.; Shoseyov, O.; Weiss, D. Sugars enhance the expression of gibberellin-induced genes in developing petunia flowers. Physiol. Plant. 2000, 109, 196–202. [Google Scholar] [CrossRef]
  69. Shin, D.H.; Choi, M.-G.; Lee, H.K.; Cho, M.; Choi, S.-B.; Choi, G.; Park, Y.-I. Calcium dependent sucrose uptake links sugar signaling to anthocyanin biosynthesis in Arabidopsis. Biochem. Biophys. Res. Commun. 2013, 430, 634–639. [Google Scholar] [CrossRef]
  70. Paul, M.; Pellny, T.; Goddijn, O. Enhancing photosynthesis with sugar signals. Trends Plant Sci. 2001, 6, 197–200. [Google Scholar] [CrossRef]
  71. Sawicki, M.; Jacquens, L.; Baillieul, F.; Clément, C.; Jacquard, C.; Vaillant-Gaveau, N. Distinct regulation in inflorescence carbohydrate metabolism according to grapevine cultivars during floral development. Physiol. Plant. 2015, 154, 447–467. [Google Scholar] [CrossRef] [PubMed]
  72. Sawicki, M.; Courteaux, B.; Rabenoelina, F.; Baillieul, F.; Clement, C.; Barka, E.; Jacquard, C.; Vaillant-Gaveau, N. Leaf vs. inflorescence: Differences in photosynthetic activity of grapevine. Photosynthetics 2017, 55, 58–68. [Google Scholar] [CrossRef]
  73. Liu, J.; Osbourn, A.; Ma, P. MYB Transcription Factors as Regulators of Phenylpropanoid Metabolism in Plants. Mol. Plant 2015, 8, 689–708. [Google Scholar] [CrossRef] [PubMed] [Green Version]
  74. Zou, Q.J.; Wang, T.; Guo, Q.S.; Yang, F.; Chen, J.M.; Zhang, W.Y. Combined Metabolomic and Transcriptomic Analysis Reveals Redirection of the Phenylpropanoid Metabolic Flux in Different Colored Medicinal Chrysanthemum morifolium. Ind. Crops Prod. 2021, 164, 113343. [Google Scholar] [CrossRef]
  75. Xie, D.-Y.; Sharma, S.B.; Paiva, N.L.; Ferreira, D.; Dixon, R.A. Role of Anthocyanidin Reductase, Encoded by BANYULS in Plant Flavonoid Biosynthesis. Science 2003, 299, 396–399. [Google Scholar] [CrossRef] [Green Version]
  76. Feng, G.; Huang, S.; Liu, Y.; Xiao, F.; Liu, J.; Zhang, Z.; Chen, Q.; Mao, Y.; Cao, X.; Wang, Y.; et al. The transcriptome analyses of Tagetes erecta provides novel insights into secondary metabolite biosynthesis during flower development. Gene 2018, 660, 18–27. [Google Scholar] [CrossRef]
  77. Patra, B.; Schluttenhofer, C.; Wu, Y.; Pattanaik, S.; Yuan, L. Transcriptional regulation of secondary metabolite biosynthesis in plants. Biochim. Biophys. Acta 2013, 1829, 1236–1247. [Google Scholar] [CrossRef]
  78. Zhang, B.; Chopra, D.; Schrader, A.; Hülskamp, M. Evolutionary comparison of competitive protein-complex formation of MYB, bHLH, and WDR proteins in plants. J. Exp. Bot. 2019, 70, 3197–3209. [Google Scholar] [CrossRef] [Green Version]
  79. Zhou, L.-J.; Geng, Z.; Wang, Y.; Wang, Y.; Liu, S.; Chen, C.; Song, A.; Jiang, J.; Chen, S.; Chen, F. A novel transcription factor CmMYB012 inhibits flavone and anthocyanin biosynthesis in response to high temperatures in chrysanthemum. Hortic. Res. 2021, 8, 1–16. [Google Scholar] [CrossRef]
  80. Matsubara, K.; Shimamura, K.; Kodama, H.; Kokubun, H.; Watanabe, H.; Basualdo, I.L.; Ando, T. Green corolla segments in a wild Petunia species caused by a mutation in FBP2, a SEPALLATA-like MADS box gene. Planta 2008, 228, 401–409. [Google Scholar] [CrossRef]
  81. Pan, Z.; Chen, Y.-Y.; Du, J.; Chen, Y.; Chung, M.; Tsai, W.; Wang, C.-N.; Chen, H. Flower development of Phalaenopsis orchid involves functionally divergent SEPALLATA-like genes. New Phytol. 2014, 202, 1024–1042. [Google Scholar] [CrossRef] [Green Version]
  82. Wu, R.; Wang, T.; McGie, T.; Voogd, C.; Allan, A.C.; Hellens, R.P.; Varkonyi-Gasic, E. Overexpression of the kiwifruit SVP3 gene affects reproductive development and suppresses anthocyanin biosynthesis in petals, but has no effect on vegetative growth, dormancy, or flowering time. J. Exp. Bot. 2014, 65, 4985–4995. [Google Scholar] [CrossRef] [Green Version]
  83. Jaakola, L.; Poole, M.; Jones, M.O.; Kämäräinen-Karppinen, T.; Koskimäki, J.J.; Hohtola, A.; Häggman, H.; Fraser, P.D.; Manning, K.; King, G.J.; et al. A SQUAMOSA MADS Box Gene Involved in the Regulation of Anthocyanin Accumulation in Bilberry Fruits. Plant Physiol. 2010, 153, 1619–1629. [Google Scholar] [CrossRef] [Green Version]
  84. Mara, C.D.; Irish, V.F. Two GATA Transcription Factors Are Downstream Effectors of Floral Homeotic Gene Action in Arabidopsis. Plant Physiol. 2008, 147, 707–718. [Google Scholar] [CrossRef] [Green Version]
  85. Lymperopoulos, P.; Msanne, J.; Rabara, R. Phytochrome and Phytohormones: Working in Tandem for Plant Growth and Development. Front. Plant Sci. 2018, 9, 1037. [Google Scholar] [CrossRef] [Green Version]
  86. Wang, Y.-C.; Wang, N.; Xu, H.-F.; Jiang, S.-H.; Fang, H.-C.; Su, M.-Y.; Zhang, Z.-Y.; Zhang, T.-L.; Chen, X.-S. Auxin regulates anthocyanin biosynthesis through the Aux/IAA-ARF signaling pathway in apple. Hortic. Res. 2018, 5, 59. [Google Scholar] [CrossRef] [Green Version]
  87. Li, Z.Q.; Xing, W.; Luo, P.; Zhang, F.J.; Jin, X.L.; Zhang, M.H. Comparative transcriptome analysis of Rosa chinensis ‘Slater’s crimson China’ provides insights into the crucial factors and signaling pathways in heat stress response. Plant Physiol. Biochem. 2019, 142, 312–331. [Google Scholar] [CrossRef]
  88. He, C.; Liu, X.; Da Silva, J.A.T.; Liu, N.; Zhang, M.; Duan, J. Transcriptome sequencing and metabolite profiling analyses provide comprehensive insight into molecular mechanisms of flower development in Dendrobium officinale (Orchidaceae). Plant Mol. Biol. 2020, 104, 529–548. [Google Scholar] [CrossRef]
  89. Zhang, J.; Wu, K.; Zeng, S.; Silva, J.A.T.D.; Zhao, X.; Tian, C.-E.; Xia, H.; Duan, J. Transcriptome analysis of Cymbidium sinense and its application to the identification of genes associated with floral development. BMC Genom. 2013, 14, 279. [Google Scholar] [CrossRef] [Green Version]
  90. Yang, H.; Zhang, Y.; Zhen, X.; Guo, D.; Guo, C.; Shu, Y. Transcriptome sequencing and expression profiling of genes involved in daylily (Hemerocallis citrina Borani) flower development. Biotechnol. Biotechnol. Equip. 2020, 34, 542–548. [Google Scholar] [CrossRef]
  91. Sunkar, R.; Zhu, J.-K. Novel and Stress-Regulated MicroRNAs and Other Small RNAs from Arabidopsis. Plant Cell 2004, 16, 2001–2019. [Google Scholar] [CrossRef] [PubMed] [Green Version]
  92. Liu, Q.; Zhang, Y.-C.; Wang, C.-Y.; Luo, Y.-C.; Huang, Q.-J.; Chen, S.-Y.; Zhou, H.; Qu, L.-H.; Chen, Y.-Q. Expression analysis of phytohormone-regulated microRNAs in rice, implying their regulation roles in plant hormone signaling. FEBS Lett. 2009, 583, 723–728. [Google Scholar] [CrossRef] [PubMed] [Green Version]
  93. Yang, J.H.; Han, S.J.; Yoon, E.K.; Lee, W.S. ‘Evidence of an auxin signal pathway, microRNA167-ARF8-GH3, and its response to exogenous auxin in cultured rice cells’. Nucleic Acids Res. 2006, 34, 1892–1899. [Google Scholar] [CrossRef] [PubMed]
  94. Liu, Q.; Chen, Y.-Q. Insights into the mechanism of plant development: Interactions of miRNAs pathway with phytohormone response. Biochem. Biophys. Res. Commun. 2009, 384, 1–5. [Google Scholar] [CrossRef]
  95. Chen, Z.-H.; Bao, M.-L.; Sun, Y.-Z.; Yang, Y.-J.; Xu, X.-H.; Wang, J.-H.; Han, N.; Bian, H.-W.; Zhu, M.-Y. Regulation of auxin response by miR393-targeted transport inhibitor response protein 1 is involved in normal development in Arabidopsis. Plant Mol. Biol. 2011, 77, 619–629. [Google Scholar] [CrossRef]
  96. Wu, G.; Park, M.Y.; Conway, S.R.; Wang, J.-W.; Weigel, D.; Poethig, R.S. The Sequential Action of miR156 and miR172 Regulates Developmental Timing in Arabidopsis. Cell 2009, 138, 750–759. [Google Scholar] [CrossRef] [Green Version]
  97. Yant, L.; Mathieu, J.; Dinh, T.T.; Ott, F.; Lanz, C.; Wollmann, H.; Chen, X.; Schmid, M. Orchestration of the floral transition and floral development in Arabidopsis by the bifunctional transcription factor APETALA2. Plant Cell 2010, 22, 2156–2170. [Google Scholar] [CrossRef] [Green Version]
  98. Galvão, V.C.; Horrer, D.; Küttner, F.; Schmid, M. Spatial control of flowering by DELLA proteins in Arabidopsis thaliana. Development 2012, 139, 4072–4082. [Google Scholar] [CrossRef] [Green Version]
  99. Yanai, O.; Shani, E.; Russ, D.; Ori, N. Gibberellin partly mediates LANCEOLATE activity in tomato. Plant J. 2011, 68, 571–582. [Google Scholar] [CrossRef]
  100. Silva, G.F.F.; Silva, E.M.; Correa, J.P.O.; Vicente, M.H.; Jiang, N.; Notini, M.M.; Junior, A.C.; De Jesus, F.A.; Frederico, A.; Castilho, P.; et al. Tomato floral induction and flower develop-ment are orchestrated by the interplay between gibberellin and two unrelated microRNA-controlled modules. New Phytol. 2019, 221, 1328–1344. [Google Scholar] [CrossRef] [Green Version]
  101. Bari, R.; Pant, B.D.; Stitt, M.; Golm, S.P. PHO2, MicroRNA399, and PHR1 Define a Phosphate-Signaling Pathway in Plants. Plant Physiol. 2006, 141, 988–999. [Google Scholar] [CrossRef] [Green Version]
  102. Wang, R.; Fang, Y.-N.; Wu, X.-M.; Qing, M.; Li, C.-C.; Xie, K.-D.; Deng, X.-X.; Guo, W.-W. The miR399-CsUBC24 Module Regulates Reproductive Development and Male Fertility in Citrus. Plant Physiol. 2020, 183, 1681–1695. [Google Scholar] [CrossRef]
  103. Sun, Y.; Xiong, X.; Wang, Q.; Zhu, L.; Wang, L.; He, Y.; Zeng, H. Integrated Analysis of Small RNA, Transcriptome, and Degradome Sequencing Reveals the MiR156, MiR5488 and MiR399 Are Involved in the Regulation of Male Sterility in PTGMS Rice. Int. J. Mol. Sci. 2021, 22, 2260. [Google Scholar] [CrossRef]
  104. Chen, Q.; Jing, D.; Wang, S.; Xu, F.; Bao, C.; Luo, M.; Guo, Q. The Putative Role of the NAC Transcription Factor EjNACL47 in Cell Enlargement of Loquat (Eriobotrya japonica Lindl.). Horticulturae 2021, 7, 323. [Google Scholar] [CrossRef]
  105. Jian, W.; Zheng, Y.; Yu, T.; Cao, H.; Chen, Y.; Cui, Q.; Xu, C.; Li, Z. SlNAC6, A NAC transcription factor, is involved in drought stress response and reproductive process in tomato. J. Plant Physiol. 2021, 264, 153483. [Google Scholar] [CrossRef]
  106. Allen, P.D.; Gansle, K.A. Global Implications of the Terrorist Attacks of September 11, 2001. New Glob. Dev. 2003, 19, 3–4. [Google Scholar] [CrossRef]
  107. Mallory, A.C.; Dugas, D.; Bartel, D.P.; Bartel, B. MicroRNA Regulation of NAC-Domain Targets Is Required for Proper Formation and Separation of Adjacent Embryonic, Vegetative, and Floral Organs. Curr. Biol. 2004, 14, 1035–1046. [Google Scholar] [CrossRef] [Green Version]
  108. Zheng, G.; Wei, W.; Li, Y.; Kan, L.; Wang, F.; Zhang, X.; Li, F.; Liu, Z.; Kang, C. Conserved and novel roles of miR164- CUC 2 regulatory module in specifying leaf and floral organ morphology in strawberry. New Phytol. 2019, 224, 480–492. [Google Scholar] [CrossRef]
Figure 1. Images of the different studied floral stages of Petunia axillaris. Floral buds were collected at five different developmental stages: buds <0.2 cm, 0.3–1 cm, 1–2 cm, 3–5 cm, and >5 cm (flower open day 0) (from left to right).
Horticulturae 08 00284 g001
Figure 2. Summary of differentially expressed genes (DEGs). (A) Heat map of the total DEGs. Columns and rows in the heat map represent samples and genes, respectively. The colour gradient from blue to red indicates low to high expression levels. (B) The top ten percentages of differentially expressed transcription factors.
Horticulturae 08 00284 g002
Figure 3. Gene clustering analysis and co-expression network construction. (A) Module eigenvector clustering. The six modules were distinguished by different colours assigned by the WGCNA package. The number of genes in each module is indicated on the left. The colour scale represents the strength of the correlation between the modules (from 0 to 1). (B) The expression patterns of the co-expressed genes in each module: I, blue module; II, brown module; III, red module; IV, green module; V, yellow module; VI, turquoise module. (C) The predicted transcriptional regulatory network associated with blue (I) and yel+tur (II) modules. The red circles indicate transcription factor (TF) genes and green triangles represent the related TF families. The GO terms of the target genes are indicated by blue hexagons.
Horticulturae 08 00284 g003aHorticulturae 08 00284 g003bHorticulturae 08 00284 g003c
Figure 4. The number of differentially expressed miRNAs (DEMs) between two different developmental stages. The vertical axis reflects the numbers of DEMs, and the red and blue bars indicate the conserved and novel miRNAs, respectively.
Horticulturae 08 00284 g004
Table 1. The number of differentially expressed genes in different developmental stages.
Comparison GroupNumber of Up-Regulated GenesNumber of Down-Regulated Genes
st2_vs_st147843521
st3_vs_st12271734
st4_vs_st157824688
st5_vs_st163546320
st3_vs_st224743416
st4_vs_st224732253
st5_vs_st249355183
st4_vs_st346423632
st5_vs_st357756223
st5_vs_st427163296
Table 2. The correlation analysis of miRNA and its target genes.
miRNATarget_GeneAnnotationScore
Pa-miRn2/t0000048_x74694Peaxi162Scf00038g02039T-complex protein 1 subunit eta3
Pa-miRn2/t0000048_x74694Peaxi162Scf00275g00008T-complex protein 1 subunit eta3
Pa-miRn5/t0000087_x39090Peaxi162Scf00026g02810UDP-galactose transporter 3 (UGT3)3
Pa-miRn5/t0000087_x39090Peaxi162Scf00284g00524S-adenosyl-L-methionine-dependent methyltransferases superfamily protein3
Pa-miRn8/t0000114_x29467Peaxi162Scf00213g00939Sequence-specific DNA binding transcription factors (Trihelix)3
Pa-miRn8/t0000114_x29467Peaxi162Scf01021g00126Proline-rich spliceosome-associated (PSP) family protein2.8
Pa-miRn14/t0000356_x10375Peaxi162Scf00055g00142Exocyst subunit exo70 family protein B13
Pa-miRn14/t0000356_x10375Peaxi162Scf00488g00924RING/U-box superfamily protein2.5
Pa-miRn14/t0000356_x10375Peaxi162Scf01205g00173RNA-binding protein3
Pa-miRn15/t0000510_x7859Peaxi162Scf00304g01121Oxidoreductase, zinc-binding dehydrogenase family protein3
Pa-miRn18/t0001319_x3709Peaxi162Scf00684g00120YEATS family protein2.8
Pa-miRn22/t0014836_x652Peaxi162Scf00906g00224Unknown protein3
Pa-miR2/nta-miR477aPeaxi162Scf01026g00268Double-stranded DNA binding3
Pa-miR3/nta-miR477bPeaxi162Scf00295g00014DNA-directed RNA polymerases I, II, and III subunit RPABC13
Pa-miR3/nta-miR477bPeaxi162Scf00853g00311Flotillin-like protein 12.8
Pa-miR37/stu-miR398b-3pPeaxi162Scf00498g0002560S ribosomal protein L313
Pa-miR38/stu-miR399f-3pPeaxi162Scf01012g00019Nucleotide sugar transporter family protein3
Pa-miR39/stu-miR399i-3pPeaxi162Scf00016g02216Protein of unknown function (DUF579)3
Pa-miR39/stu-miR399i-3pPeaxi162Scf00095g00913Mitogen-activated protein kinase 163
Pa-miR39/stu-miR399i-3pPeaxi162Scf00589g00322NAC domain containing protein 82 (NAC)3
Pa-miR40/stu-miR399o-3pPeaxi162Scf00767g00521Beta-galactosidase2.8
Pa-miR43/stu-miR530Peaxi162Scf00819g004144,5-DOPA dioxygenase extradiol3
Pa-miR44/stu-miR6024-5pPeaxi162Scf00042g01612Late blight resistance protein, putative 3
Pa-miR15/sly-miR390b-5pPeaxi162Scf00102g01878Serine/threonine-protein kinase 253
Pa-miR15/sly-miR390b-5pPeaxi162Scf00173g00046Diphosphomevalonate decarboxylase3
Pa-miR15/sly-miR390b-5pPeaxi162Scf00286g00028Leucine-rich receptor-like protein kinase family protein2.8
Pa-miR15/sly-miR390b-5pPeaxi162Scf00620g00014Leucine-rich receptor-like protein kinase family protein3
Pa-miR15/sly-miR390b-5pPeaxi162Scf00732g10028Leucine-rich receptor-like protein kinase family protein2.5
Pa-miR19/sly-miR396bPeaxi162Scf00016g03253Pyruvate kinase family protein3
Pa-miR19/sly-miR396bPeaxi162Scf00074g00526Unknown protein2.5
Publisher’s Note: MDPI stays neutral with regard to jurisdictional claims in published maps and institutional affiliations.

