Article

The Influence of Red and Blue Light Ratios on Growth Performance, Secondary Metabolites, and Antioxidant Activities of Centella asiatica (L.) Urban

1
Department of Horticulture, College of Agriculture & Life Sciences, Jeonbuk National University, Jeonju 54896, Korea
2
Core Research Institute of Intelligent Robots, Jeonbuk National University, Jeonju 54896, Korea
3
Korea Institute of Agricultural Science & Technology, Jeonbuk National University, Jeonju 54896, Korea
*
Author to whom correspondence should be addressed.
Horticulturae 2022, 8(7), 601; https://doi.org/10.3390/horticulturae8070601
Submission received: 30 May 2022 / Revised: 28 June 2022 / Accepted: 1 July 2022 / Published: 4 July 2022

Abstract

:
This study aimed to determine the optimal light conditions for the protected cultivation of Centella asiatica—a herbaceous medicinal plant with high bioactive content and antioxidant potential. The growth, triterpene glycoside content, total phenol content (TPC), total flavonoid content (TFC), and antioxidant activities of seedlings grown for five weeks under different light intensities (150 and 200 μmol m−2 s−1) and qualities (red and blue light ratios: 10:0, 8:2, and 6:4) were evaluated. Light intensity and quality significantly affected the studied parameters. At 150 μmol m−2 s−1 photosynthetic photon flux density (PPFD), most growth parameters decreased as the blue light ratio increased; however, the plants showed extreme epinasty under the sole red light treatment. Growth performance was highest under 20% blue light and 200 μmol m−2 s−1 PPFD. At both light intensities, the total triterpene glycoside content was higher for the sole red light and 20% blue light treatments than the 40% blue light treatment. Moreover, the TPC, TFC, and antioxidant activity increased as the blue light ratio increased. In conclusion, artificial light conditions affect the growth and secondary metabolite production of C. asiatica differentially, and 20% blue light at a higher light intensity (200 μmol m−2 s−1) is optimum for growing C. asiatica.

1. Introduction

Centella asiatica (L.) Urban, also known as Asiatic pennywort, marsh pennywort, and Indian pennywort, is a perennial herbaceous plant belonging to the family Apiaceae [1,2]. It naturally grows in moist, damp, and shaded areas of tropical and subtropical regions showing a slow growth rate in its natural environment [3,4]). It has slender stems, reniform–cordate leaves, and monochasium flowers [5]. These plants are propagated sexually and vegetatively by seeds and stolons (runners), respectively [6]. During vegetative propagation, new plants are generated from new roots and stems at each node of the stolons. C. asiatica has been used as a herbal medicine since ancient times because it contains numerous health-promoting bioactive compounds (triterpene glycosides, phenolics, flavonoids, carotenoids, anthocyanins, vitamins, etc.) that show remedial value against various diseases [3,7,8,9]. These compounds have antibacterial, anticancer, fungicidal, cell proliferative, and antioxidant activities, and they improve vein insufficiency, enhance memory, and are used to treat mental disorders [4,10]. The plant is also beneficial for the treatment of wounds (burns, scars, and scratches) and skin diseases (cellulitis, eczema, leprosy, lupus, etc.) [7,11,12]. Therefore, it is in high demand for herbal drug preparations and cosmeceutical purposes [13]. The content and profile of phytochemicals and their overall production are influenced by both genetic and environmental factors, including light conditions, water, temperature, and fertilizers [6,8,10]. Hence, the selection of the optimum environmental conditions and suitable genotypes are key factors for maximizing the synthesis of bioactive constituents.
A plant factory is a controlled system that aids in the stable production of higher quality plants throughout the year by artificially controlling the environment (light, humidity, temperature, and culture solution) [14,15]. In particular, light (intensity, quality, and period) is one of the most important factors that influences the development, growth, morphology, and physiology of plants by affecting photosynthesis [16,17,18], which in turn affects the accumulation and profile of bioactive compounds. Recently, many studies have been conducted using artificial light under controlled environmental conditions to understand the relationship between light conditions and bioactive compounds in various horticultural crops [18,19,20,21,22]. Light intensity affects the overall growth of the plant by influencing in net photosynthesis [23]. The optimum light intensity is required for the best biomass production and bioactive compounds’ accumulation dependent on the plant species [6,23,24,25,26]. Plants grown under lower light intensities show higher specific leaf area, longer petiole length, and lower biomass, whereas the opposite is observed under higher light intensities [17,27]. Many researches have been performed within the specific range of 50 to 300 photosynthetic photon flux density (PPFD) in a range of plants to optimize the light intensity [19,21,28,29,30]. It has also been reported that light quality affects growth and secondary metabolite production, including antioxidant production and activities in a range of plants [20,22,31,32,33]. Among the different light spectra used in crop production in artificial environmental conditions, red and blue light are frequently used as these lights are highly correlated to the maximum absorption spectra of chlorophyll a (420 and 660 nm, respectively) and chlorophyll b (435 and 642 nm, respectively). Both red and blue light have specific effects on plant morphology, bioactive compound contents, antioxidants, and their activities, which are highly dependent on the plant genotypes [19,34,35,36]. In previous studies, red light significantly increased plant height and internode elongation, whereas blue light increased chlorophyll content, antioxidants, and stomatal formation in specific crops [16,32,37]. Moreover, red and blue light, and their combinations, help in the improvement of bioactive compounds in plants [16,34]. However, studies on the influence of the light environment on C. asiatica are limited. Therefore, this study aimed to compare the effects of light intensity and quality (red and blue light combination) on the growth performance, bioactive compounds, and antioxidant activities of C. asiatica and to determine the optimum light conditions for maximizing biomass and bioactive compound production in the plant.

2. Materials and Methods

2.1. Plant Materials

Centella asiatica purchased from Centella farm (Hapcheon, Korea) were transplanted into high beds filled with horticultural soil in a plastic house (Jeonbuk National University, Jeonju, Korea) and grown using Yamazaki nutrient solution 1.5 dS m−1 for two months. New stolons with 3–4 leaves were cut and used to create uniform experimental plants. The cut plants were placed in water prior to transplantation. The experimental plants were grown in a growth chamber for one week before the experiment. The temperature and relative humidity were set to 24/18 °C (day/night) and 60 ± 5%, respectively.

2.2. Light Treatment Instrument

Six metal boxes (60 cm × 35 cm × 50 cm, l × b × h) with red (R, 660 nm) and blue (B, 450 nm) light-emitting diode (LED) bars were constructed and placed in the growth chamber. Light treatment was performed using these boxes (seven LED bars were installed on top) and controlled remotely. The experimental plants were subjected to six light treatments: a combination of two light intensities (150 and 200 μmol m−2 s−1) and three light qualities (R:B = 10:0, 8:2, and 6:4, where R:B = 10:0 was assumed as a control) (Figure 1). The photoperiod and relative humidity were maintained at 14/10 h (day/night) and 60 ± 5%, respectively. After growing the plants for 35 d, five plants from each light-treatment category were harvested and used for the analysis of growth parameters, major triterpene glycosides, antioxidants (total phenol and flavonoid content), and antioxidant capacity.

2.3. Measurement of Growth Parameters

Five plants were randomly selected from each treatment, washed to eliminate soil particles, and dried gently using a paper towel. Eight growth parameters (petiole length, root length, total fresh weight, total dry weight, leaf fresh weight, leaf dry weight, leaf length, and leaf width) were measured. Petiole and root lengths were measured from the crown to the end of the petiole and root, respectively. Petiole length (cm), root length (cm), leaf length (cm), and leaf width (cm) were measured using digital calipers (CD-20APX; Mitutoyo Co., Kanagawa, Japan). The fresh weights of the whole plant (g) and leaf (g) were measured using a digital weighing machine (UX420H; Shimadzu Corp., Kyoto, Japan). The dry weights of the whole plant (g) and leaf (g) were measured after drying the respective plant materials in a freeze drier (ilShinBioBase Co., Ltd., Gyeonggi-do, Korea).

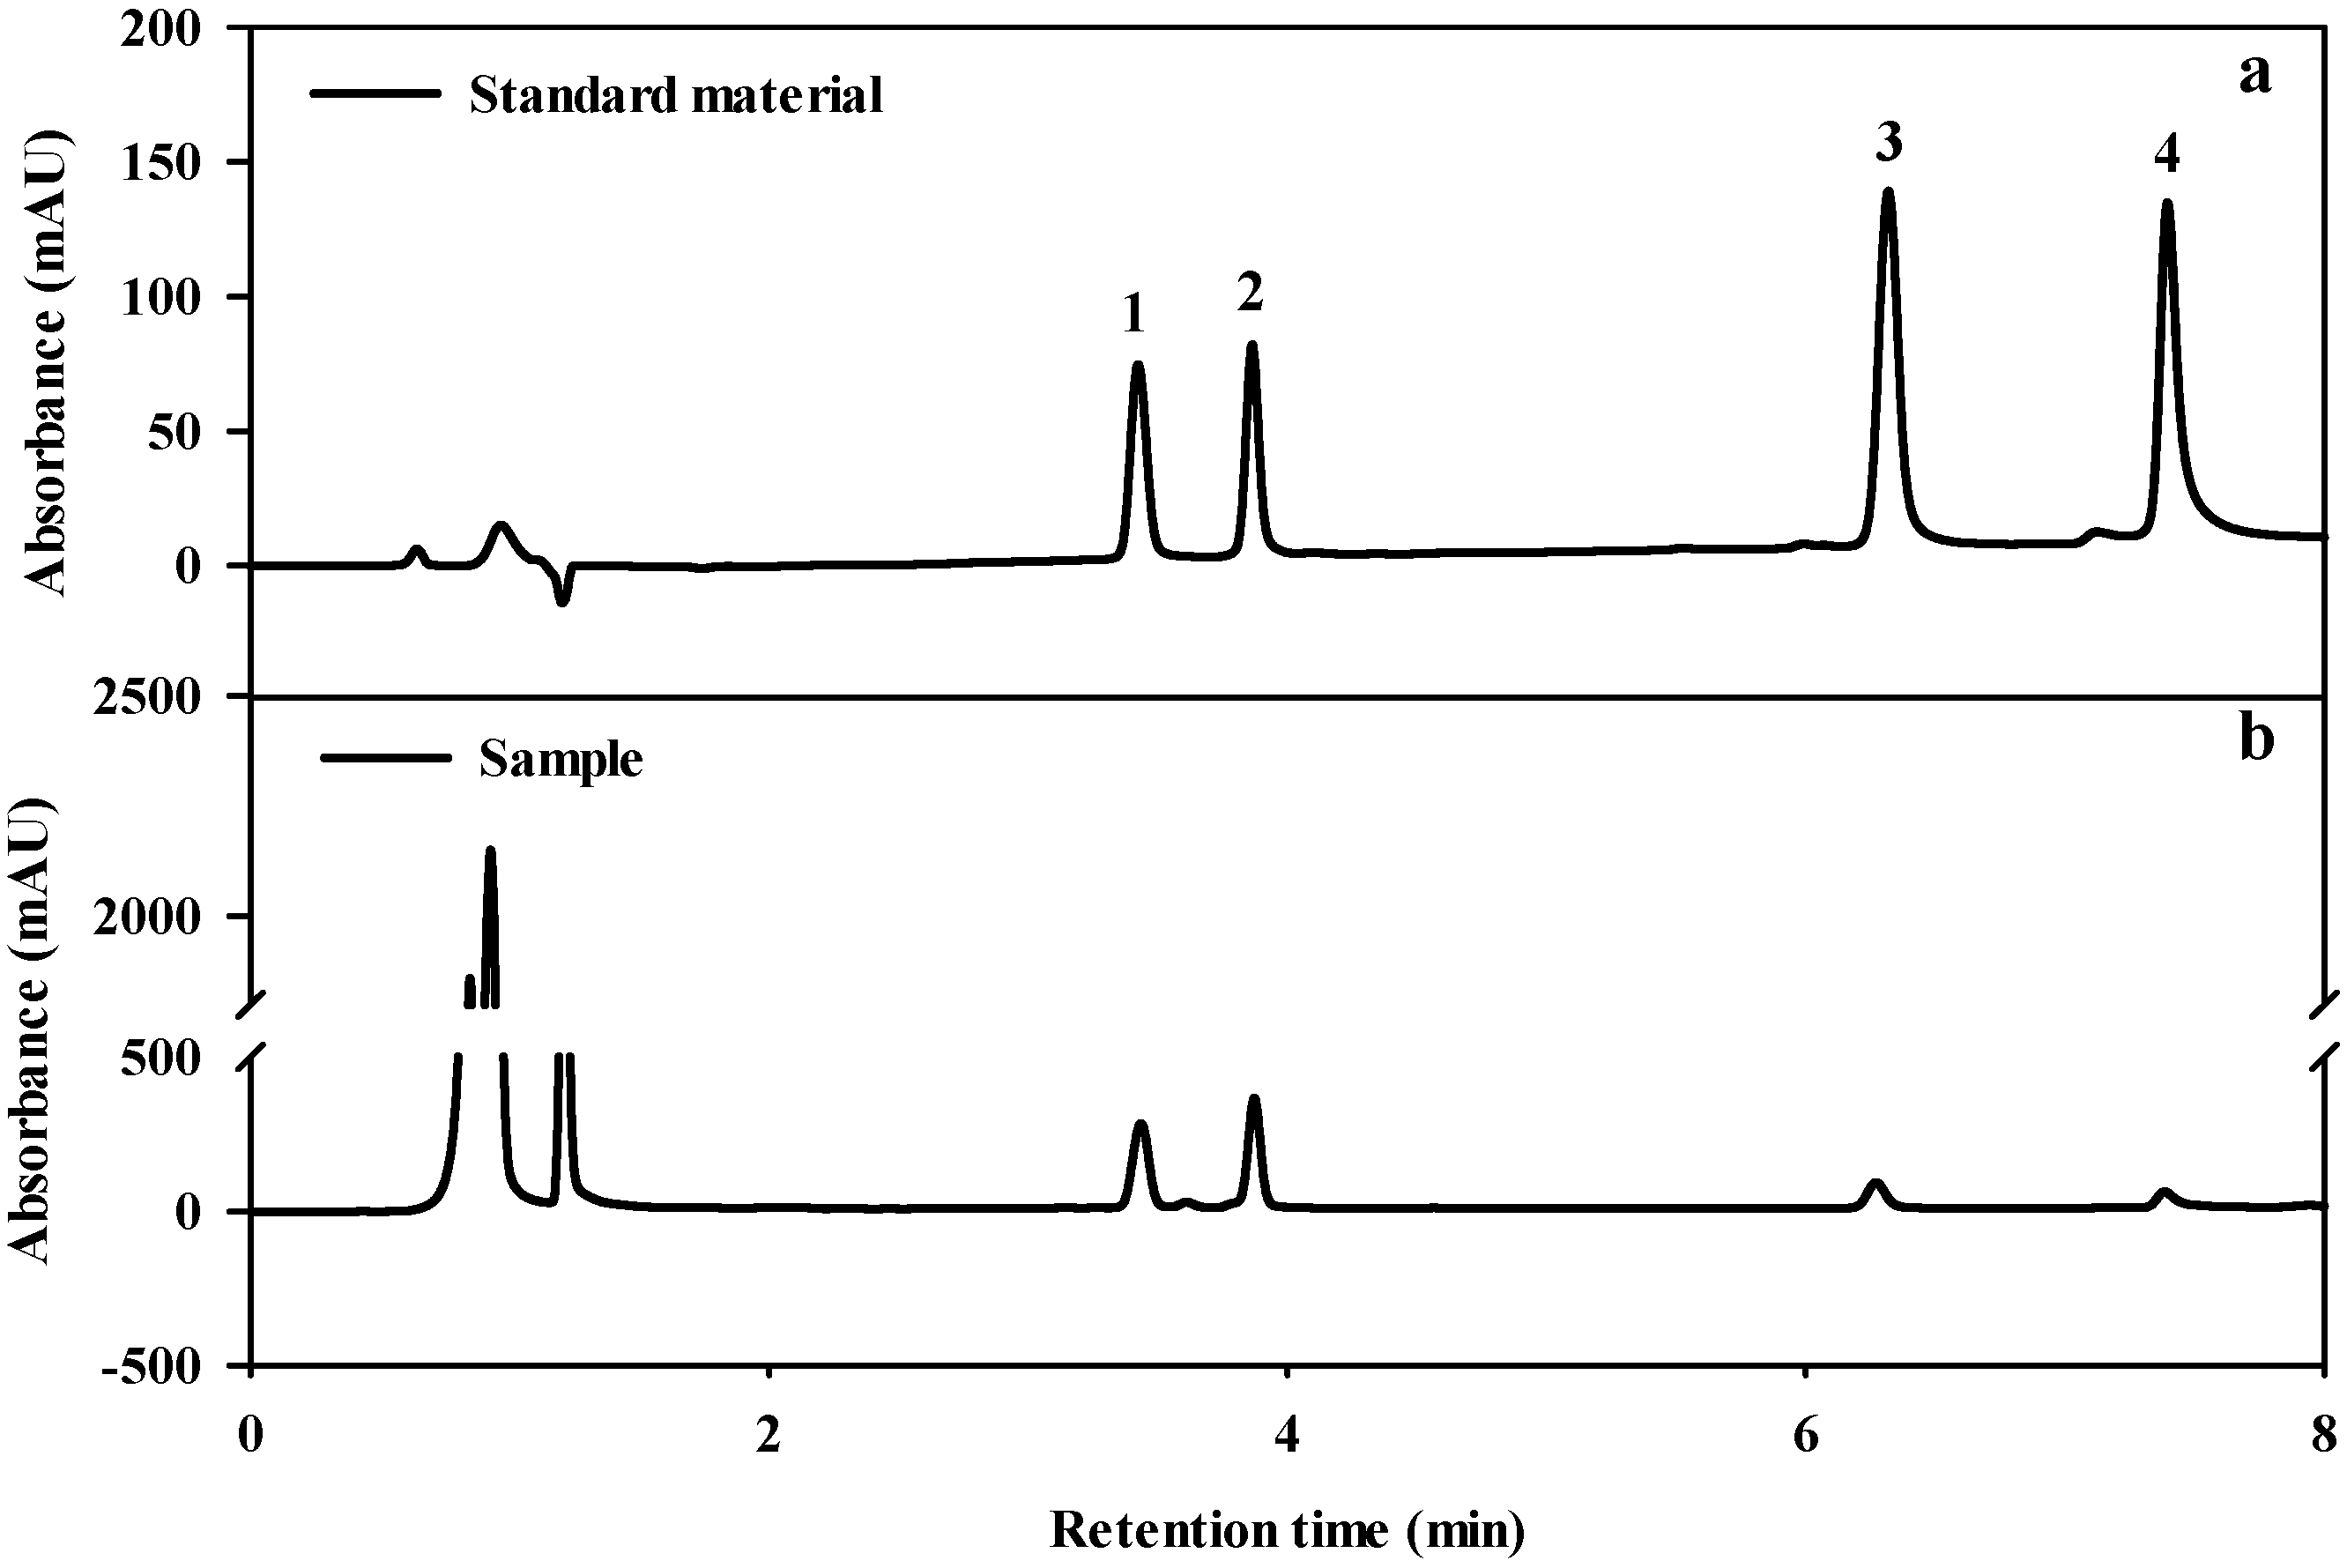
2.4. Analysis of Triterpene Glycoside Content

Four triterpene glycosides (asiatic acid, asiaticoside, madecassic acid, and madecassoside; Sigma-Aldrich, St. Louis, MO, USA) were analyzed using high-performance liquid chromatography (HPLC; Agilent 1200; Agilent Technologies, Santa Clara, CA, USA) according to modified version of Baek et al. [38]. Freeze-dried C. asiatica powdered samples (50 mg) were individually extracted using 5 mL 80% MeOH (Avantor Performance Materials Co., Center Valley, PA, USA) for 1 h in a shaker. The extracts were centrifuged at 3500 rpm for 10 min. Subsequently, the supernatants were filtered through a membrane filter (0.45 μm pore size) and kept in 1.5 mL vials. The samples (10 µL each) were then analyzed using an HPLC instrument with a diode array detector set at 292 nm. Separation of peaks was performed in a Nova-Pak C18 column (4 μm, 3.9 × 150 mm; Water Co., Milford, MA, USA) with a gradient of solvent A (100% distilled water, HPLC grade; Avantor Performance Materials Co., Center Valley, PA, USA) and solvent B (100% acetonitrile, HPLC grade; Avantor Performance Materials Co., Center Valley, PA, USA) at a flow rate of 1.3 mL min−1. The gradient program was as follows: solvent B was gradually increased from 20% to 95% within 7 min, followed by a constant ratio up to 15 min, a drop to 20% solvent B for 21 min, and then this gradient was maintained up to 25 min. Pure commercial triterpene glycoside standards (Sigma-Aldrich) at 25–200 µg mL−1 were used to generate the calibration curve of each triterpene glycoside peak by measuring the retention time and area of each peak separated by HPLC (Figure 2).

2.5. Analysis of Total Phenol and Total Flavonoid Content

Powdered sample (50 mg) was mixed with 80% MeOH (1.5 mL) in a water bath at 50 °C and the mixture was extracted for 1 h at 150 rpm. The extract was then centrifuged at 14,000 rpm for 10 min at 4 °C, filtered using a membrane filter (0.45 μm pore size), and used for the analysis of total phenol and flavonoid contents. Total phenol content (TPC) was measured based on the previous method [39]. Briefly, supernatant (200 μL) was mixed with distilled water (600 μL) in a 2 mL tube. Thereafter, 200 μL Folin–Ciocalteu reagent (Sigma-Aldrich) was added, and the solution was vortexed and incubated in a water bath at 27 °C for 5 min. Two hundred μL of 15% sodium carbonate (Sigma-Aldrich) was added, and the mixture was incubated in dark conditions at room temperature (25 °C) for 1 h, centrifuged at 12,000 rpm for 10 min at 4 °C, and the absorbance of the extract (200 µL) was measured at 760 nm using a microplate reader (Multiskan GO; Thermo Fisher Scientific Inc., Waltham, MA, USA). Gallic acid (Sigma-Aldrich) at 10–100 µg mL−1 was used as a standard, and the results were expressed as milligram gallic acid equivalents per gram of dry weight (mg GAE g−1 DW).
Total flavonoid content (TFC) was analyzed according Shin et al. [40]. The same sample extract used for analyzing TPC was used to analyze the flavonoid content. Briefly, 200 µL of the sample extract was mixed with water (800 μL) in a 2 mL tube, and 60 μL of 5% sodium nitrite (Sigma-Aldrich) was added. Sixty microliters of 10% aluminum chloride (Sigma-Aldrich) and 400 μL of 1 M sodium hydroxide (Sigma-Aldrich) were simultaneously added after 5 min. Absorbance of extract (200 µL was measured at 510 nm using a microplate reader). Standard curve was generated using the 10–100 µg mL−1 of catechin hydrate (Sigma-Aldrich) and used for the calculation of TFC as mg of catechin hydrate equivalent per gram of dry weight (mg CE g−1 DW).

2.6. Measurement of Antioxidant Activities

Two different methods, ferric reducing antioxidant power (FRAP) assay and 2,2′-azino-bis (3-ethylbenzothiazoline-6-sulfonic acid) (ABTS) assay, were used to measure antioxidant activity in C. asiatica according to Bhandari et al. [41]. The same supernatant obtained for TPC and TFC analyses was used to perform the antioxidant activity test. First, 300 mM acetate buffer (3.1 g sodium acetate trihydrate (Sigma-Aldrich) in 16 mL acetic acid (Sigma-Aldrich) at pH 3.6), 10 mM 2,4,6-Tris(2-pyridyl)-s-triazine (Sigma-Aldrich) in 40 mM HCl (Sigma-Aldrich), and 20 mM ferric chloride hexahydrate (Sigma-Aldrich) were prepared and mixed in a 10:1:1 (v/v/v) ratio to prepare a fresh FRAP solution. Thereafter, 50 µL supernatant was mixed with 950 µL of FRAP solution and incubated at 37 °C for 10 min. Absorbance of reaction mixture (200 µL) was measured at 593 nm using a microplate reader. Standard curve was generated using the 0–1000 µM of Trolox ((±)-6-hydroxy−2,5,7,8-tetramethylchromane-2-carboxylic acid) (Sigma-Aldrich) and used for the calculation of antioxidant capacity. The results are expressed as µM Trolox equivalent antioxidant capacity per gram of dry weight (µM TE g−1 DW).
For the ABTS assay, ABTS radical cation (ABTS+) was prepared by mixing 7.4 mM ABTS (2,2-azino-bis(3-ethylbenzothiazoline-6-sulfonic acid) di-ammonium salt (Sigma-Aldrich)) and 2.4 mM potassium persulfate (Sigma-Aldrich) solution at equal ratio (v/v) in the dark for 16 h at room temperature (25 °C). The solution was then diluted with MeOH to obtain an absorbance of ~0.90 at 734 nm. Fifty microliters of supernatant was mixed with 950 μL of ABTS+ solution, vortexed, and stored in the dark at room temperature (25 °C) for 2 h. The absorbance of the reaction mixture (200 µL) was measured at 734 nm using a microplate reader. Trolox (100–1000 µM) was used to generate a standard curve by applying the same method as in the sample. The results were then expressed as µM TE g−1 DW.

2.7. Statistical Analysis

All the statistical analyses were generated using R studio software, version 1.4 (R studio Inc., Boston, MA, USA). The results of growth parameters are presented as the mean of five biological replications, whereas those of triterpene glycosides, TPC, TFC, and antioxidant activities are reported as the mean of three technical replications. The relationships between the studied parameters were generated using Pearson’s correlation coefficient (r) at p < 0.05. All figures were generated using SigmaPlot®12 (Systat Software Inc., San Jose, CA, USA).

3. Results

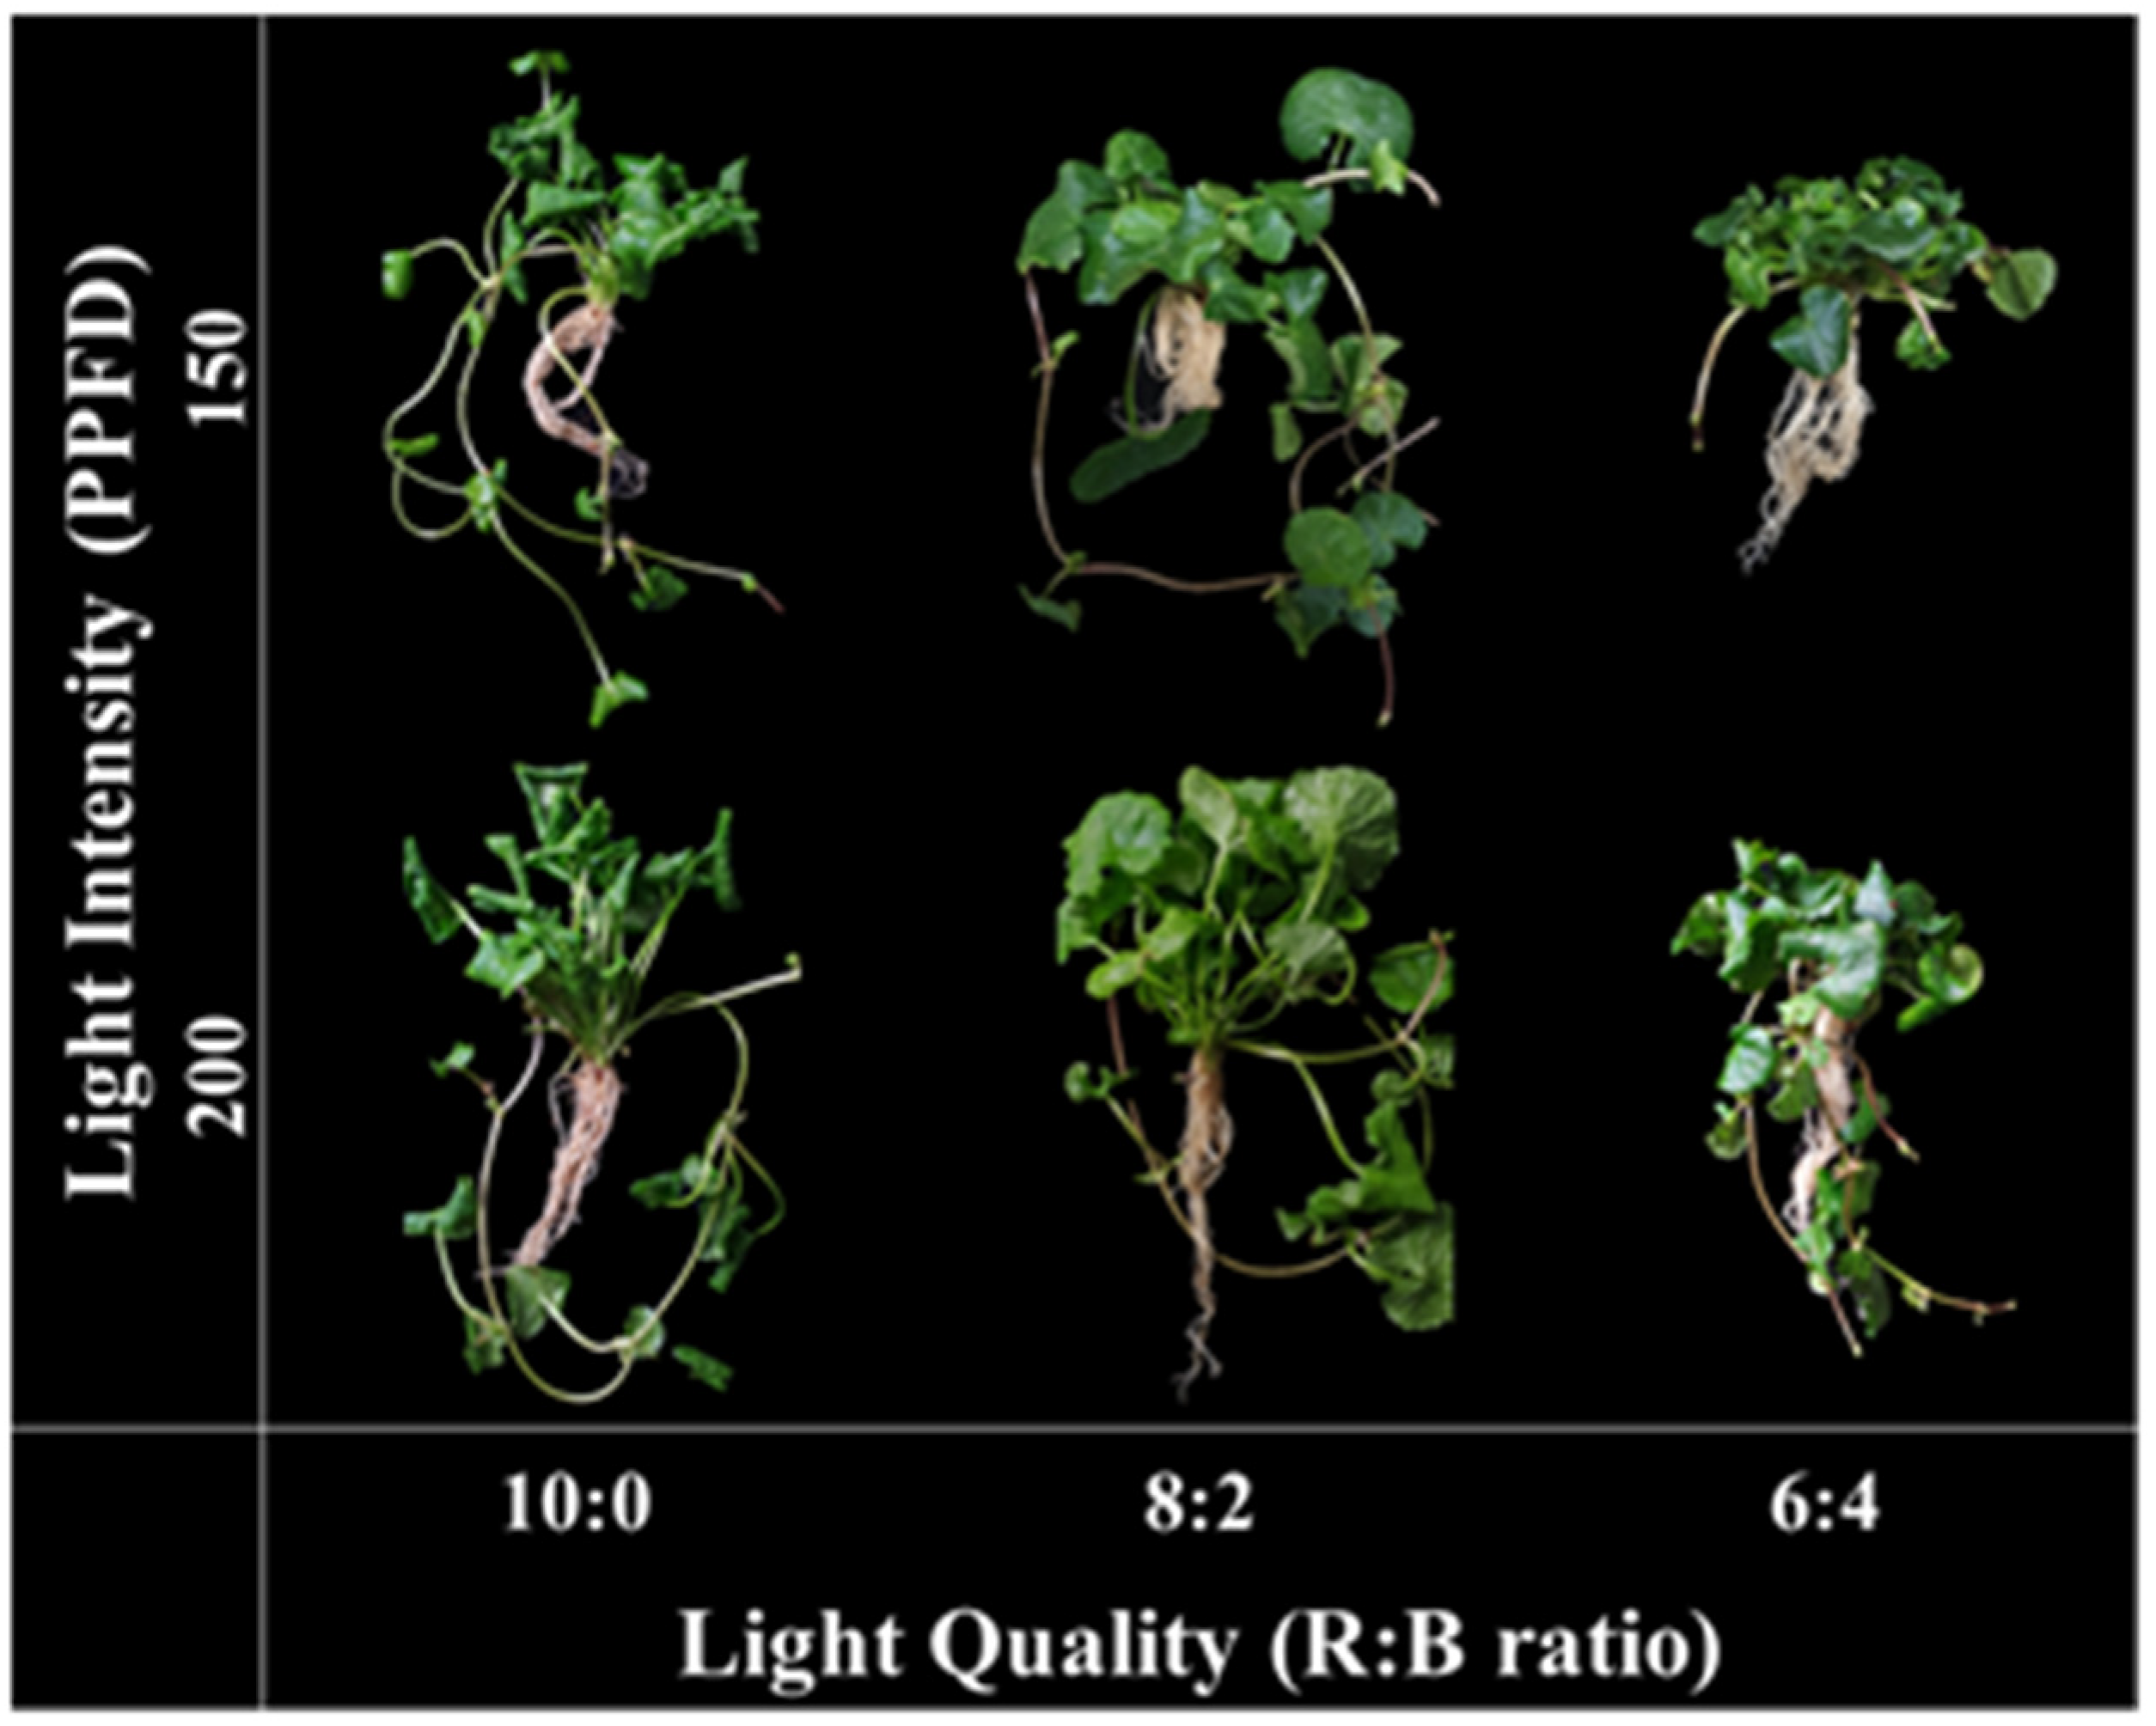
3.1. Effect of Light Conditions on Growth Characteristics

The growth parameters (petiole length, total fresh weight, total dry weight, leaf fresh weight, leaf dry weight, leaf length, and leaf width) were affected by light intensity (150 and 200 μmol m−2 s−1 photosynthetic photon flux density, i.e., PPFD) and quality (different R:B ratios) (Table 1). Most of the growth parameters significantly differed with R:B ratios and showed the lowest value for R:B = 6:4 for almost all traits. Petiole length was highest (11.2 cm) at R:B = 8:2 and 200 μmol m−2 s−1 PPFD, followed by the sole source of red light (R:B = 10:0) and 150 μmol m−2 s−1 PPFD (8.4 cm). A higher root length was observed at 8:2 and 6:4 R:B ratios under 150 and 200 μmol m−2 s−1 light intensities, respectively, than in the control (R:B = 10:0). However, the difference was not significant when compared to the other light qualities at respective light intensities. At 150 μmol m−2 s−1, total fresh and dry weights decreased with decreasing amounts of red light, and the highest values were observed at R:B = 8:2 under 200 μmol m−2 s−1. Similarly, reductions in leaf fresh and dry weights in response to the R:B ratio were similar to those in total fresh and dry weights under both PPFD conditions. Leaf length and width showed non-significant differences among light qualities at 150 μmol m−2 s−1. In contrast, significant differences were observed between the R:B ratios under 200 μmol m−2 s−1, with a remarkable improvement in leaf length and width at R:B = 8:2. Unlike red and blue mixed light conditions (R:B = 8:2 and 6:4), some physiological disorders, such as extreme epinasty and unusual growth, were observed in the sole red light treatment (R:B = 10:0) under both PPFDs (Figure 3). Overall, the plants grown under R:B (8:2) and 200 μmol m−2 s−1 PPFD showed the best growth performance among the different light treatments including the control.

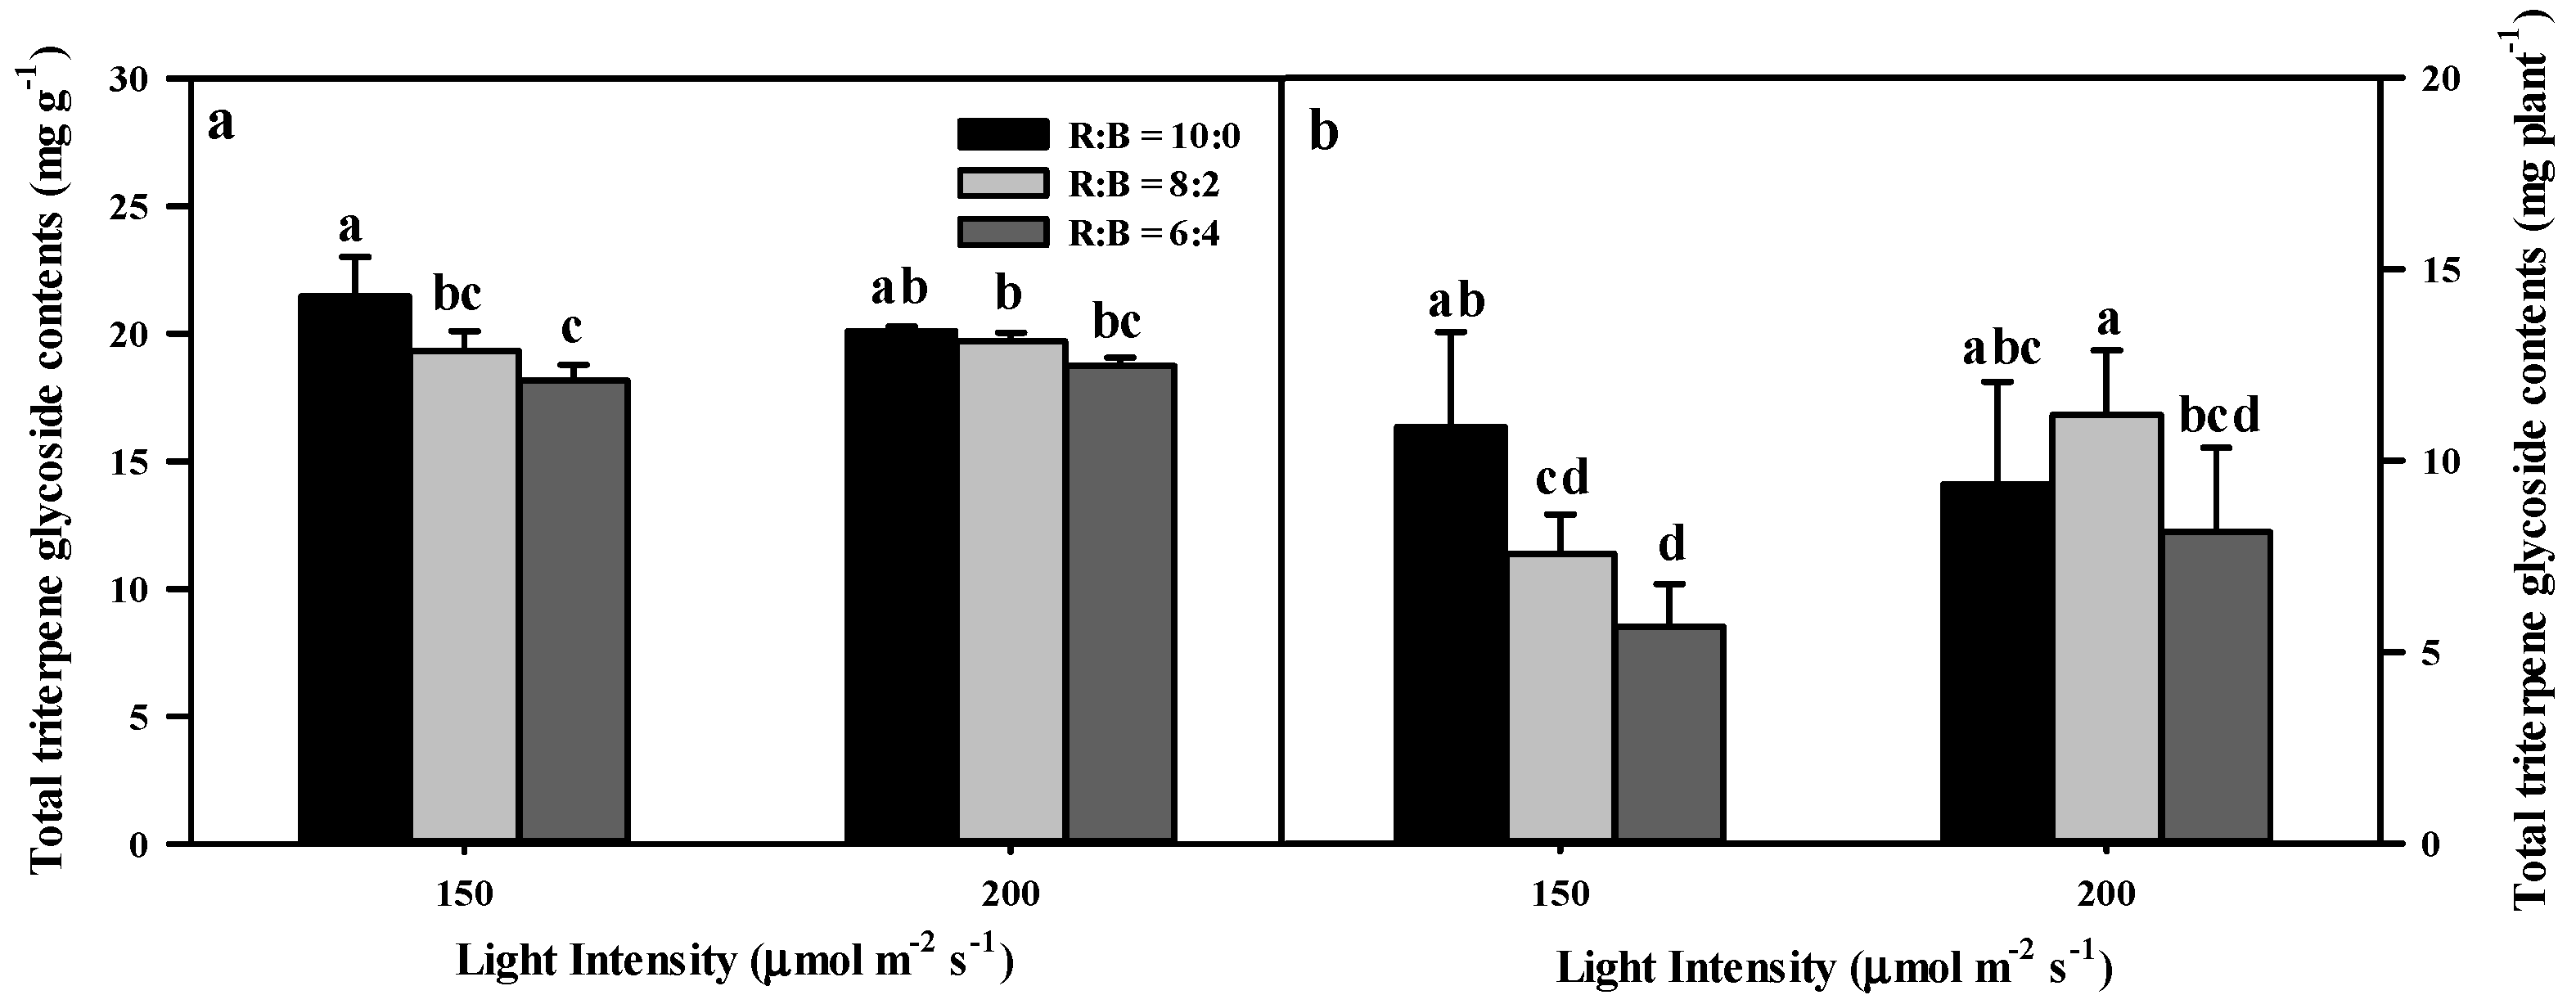
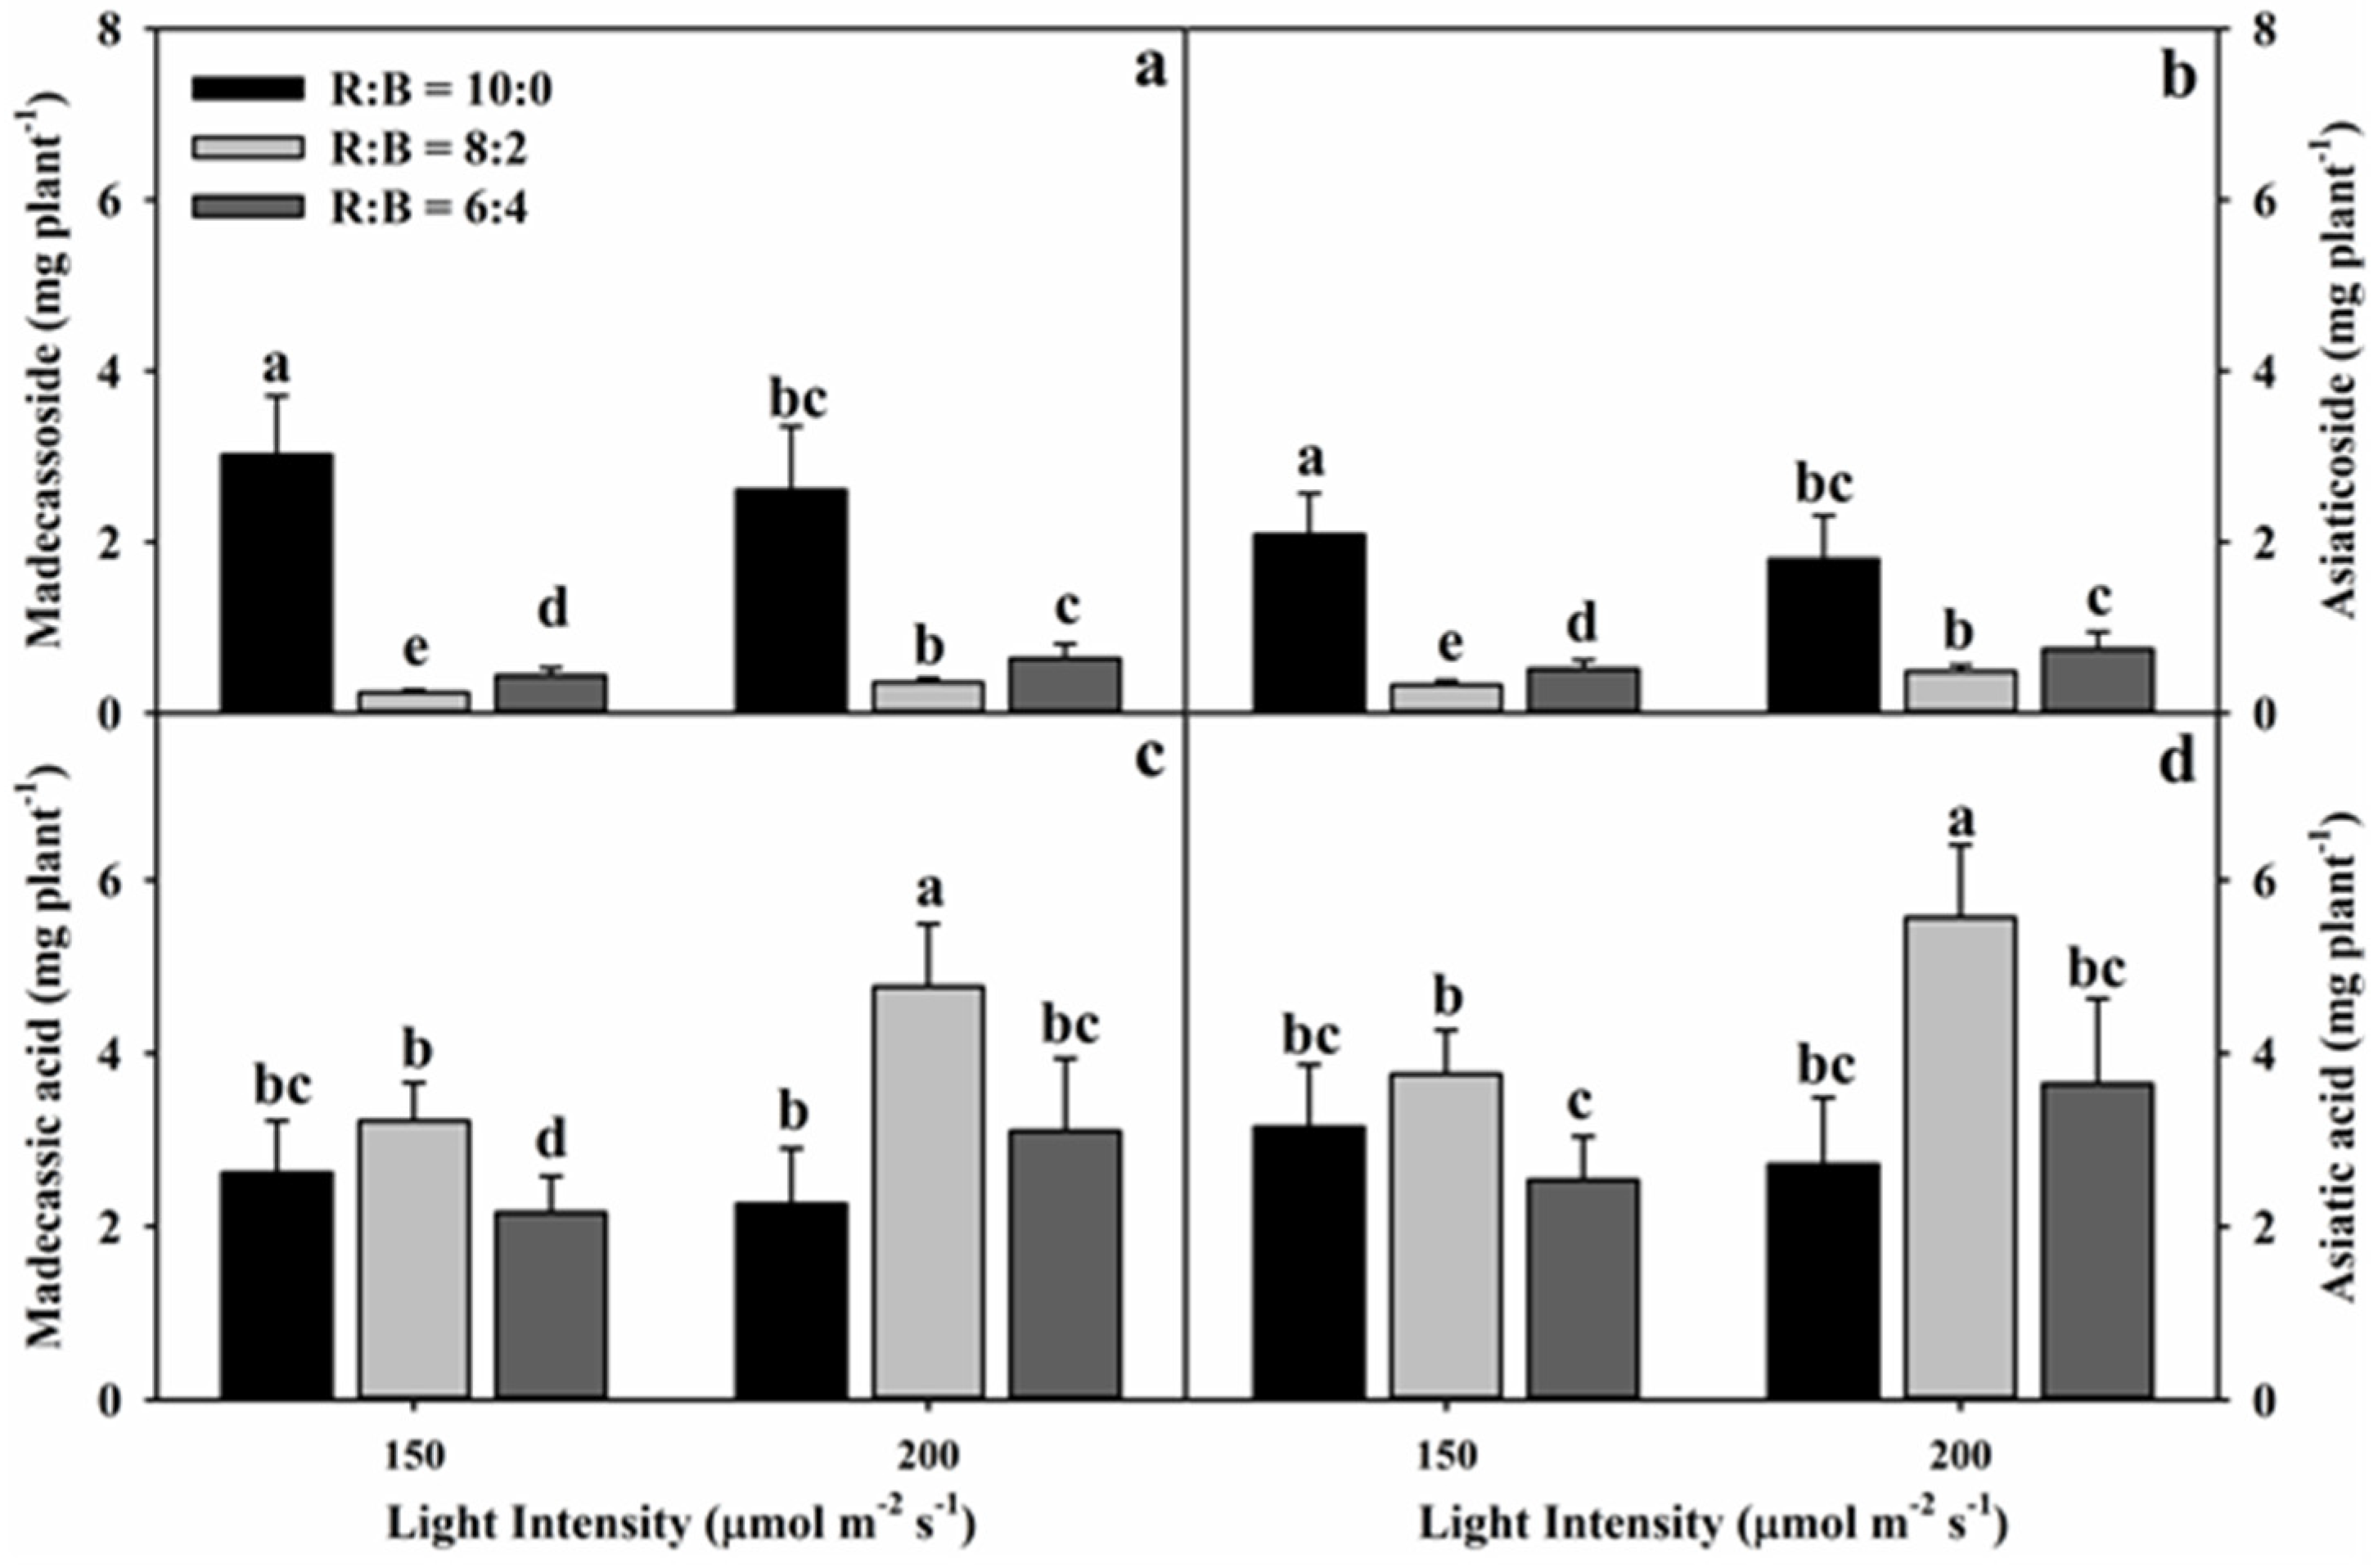
3.2. Effect of Light Conditions on Triterpene Glycoside Content

Four major triterpene glycosides were evaluated in this study. Both the light quality (R:B ratio) and intensity affected the individual triterpene glycoside contents (Figure 4). Triterpene glycosides significantly differed with the R:B ratio under both light intensities (150 and 200 PPFD) (Figure 4); however, their accumulation patterns were somewhat different between the light intensities. At 150 PPFD, asiatic acid was the most dominant glycoside (6.21–9.62 mg g−1) regardless of the light ratio. Furthermore, asiaticoside (0.85 mg g−1) and madecassoside (0.62 mg g−1) were the lowest at an 8:2 R:B ratio. Individual triterpene glycosides showed somewhat consistent contents at different light ratios under 200 PPFD. Madecassoside content was the highest at control (R:B = 10:0), followed by 6:4 and 8:2 at 150 PPFD, and a similar trend was also found for asiaticoside content. However, the madecassic acid and asiatic acid contents showed opposite accumulation trends. Among the three light qualities used in this study, madecassoside and asiaticoside contents were the highest at R:B = 8:2. In contrast, asiatic acid and madecassic acid showed opposite trends, with the lowest content at an 8:2 R:B ratio, which was opposite to the result observed at 150 PPFD. The total triterpene glycoside content generally declined with decreasing red light and showed the lowest value at R:B = 6:4 under both PPFDs (Figure 5). Altogether, each triterpene glycoside content was significantly affected by light intensity, light quality, and their interaction, while the total triterpene glycoside content showed non-significant results for light quality, light intensity, and their interaction (Table 2). Light intensity had the strongest influence on asiaticoside content, whereas light quality, and the interaction of light intensity and quality had the strongest influence on madecassoside content.
To determine the actual triterpene glycoside content in a single plant, the amount obtained in mg per gram was converted into mg per plant. The results showed a similar trend as in the mg per gram basis in the case of 150 PPFD in all the individual and total triterpene glycoside contents (Figure 5 and Figure 6). In contrast, we found different patterns at 200 PPFD. The highest madecassoside and asiaticoside contents were found in the control group that had only a source of red light: R:B = 10:0 (2.61 and 1.80 mg plant−1, respectively). In contrast, madecassic acid and asiatic acid were the highest for R:B = 8:2 (4.77 and 5.57 mg plant−1, respectively), which resulted in the highest total triterpene glycoside content (11.19 mg plant−1) in the given light quality (Figure 6). The actual madecassoside and asiaticoside contents per plant showed non-significant results for the two light intensities, whereas all four triterpene glycosides were significantly affected by light quality. The interactive results of light intensity and quality showed a significant effect on madecassic acid, asiatic acid, and total triterpene glycoside content (data not shown).

3.3. Effect of Light Conditions on TPC, TFC, and Antioxidant Activities

The TPC increased with an increase in the blue light ratio for both light intensities. It ranged from 6.36 to 8.53 mg GAE g−1 at 150 PPFD. However, the values were not significantly different between the control, 10:0, and the 8:2 R:B ratios (Table 3). At 200 PPFD, the TPC was statistically higher than the respective 150 PPFD treatments, and the values were significant. The highest TPC was observed at 6:4 (R:B) for both light intensities. The effects of light intensity, quality, and their interaction on the TPC were statistically significant (Table 2). The TFC also exhibited a trend similar to that of the TPC in all experiments and had the highest value at 6:4 (R:B). It ranged from 3.62 to 6.92 mg CE g−1 and 7.89 to 19.59 mg CE g−1 at 150 and 200 PPFD, respectively (Table 3). As with the TPC, the TFC was also significantly affected by light intensity, light quality, and their interaction.
Two different assays, ABTS and FRAP, were used to evaluate the antioxidant activity of the plant extract. Both light intensity (PPFD) and light quality (R:B ratios) affected the ABTS and FRAP assay values, and the values elevated with increasing light intensity and blue light ratio (Table 3). Similar to the TPC and TFC, both the antioxidant assays showed the highest values at 6:4 (R:B). At 150 PPFD, antioxidant activity ranged from 46.31 to 74.76 µmol TE g−1, which was lower than that at 200 μmol m−2 s−1 PPFD (80.07 to 163.47 µmol TE g−1) in respective light quality. The FRAP assay results also showed a similar trend to the ABTS assay results, which increased with an increase in the blue light ratio. The lowest value was found in the control treatment ( R:B = 10:0) at 150 PPFD. Moreover, all FRAP assay results at 150 μmol m−2 s−1 were lower than those at 200 PPFD. Overall, the TPC, TFC, and both antioxidant assay results increased with increasing light intensity, and the ratio of blue light showed a similar pattern of accumulation. Light intensity, quality, and their interactions were also statistically significant (p < 0.01) in all cases (Table 2). The effect of light intensity on the TPC, TFC, and antioxidant activity was more prominent than that of light quality.

3.4. Correlations between Triterpene Glycosides, TPC, TFC, and Antioxidant Activity

Correlation analysis was performed to understand the relationship between the four types of triterpene glycosides, antioxidant activities (ABTS and FRAP assays), TPC, and TFC (Table 4). Madecassoside showed a significant positive correlation with asiaticoside (r = 0.995) and a significant negative correlation with madecassic acid and asiatic acid. Likewise, madecassic acid had a strong positive correlation with asiatic acid (r = 1.000). However, the total triterpene glycoside content did not have a strong correlation with any other parameter (r = −0.481 to 0.314). Significant positive correlations were observed among ABTS, FRAP, TPC, and TFC (r = 0.999 to 1.000). Madecassoside and asiaticoside showed a significant positive correlation (r= 0.711 − 0.788) with ABTS, FRAP, TPC, and TFC. In contrast, madecassic acid and asiatic acid were negatively correlated (r = −0.825 to −0.852) with ABTS, FRAP, TPC, and TFC.

4. Discussion

This study summarizes the effects of light intensity and quality on the growth performance, triterpene glycoside content, TPC, TFC, and antioxidant activities of C. asiatica grown under controlled environmental conditions. Light intensity ranging from 50–300 PPFD has been used in a range of plants including lettuce, tea, cucumber, tomato, and so on, which showed better results in growth performance and accumulation in bioactive compounds [19,21,28,29,36,42]. Previous results also showed that the use of a sole source of red (R) and blue (B) light, and their ratios, had a more positive impact on phytochemicals’ and growth performance, in particular in photomorphogenesis and photosynthesis, than the use of white (fluorescent light normally used as a control) or other lights in a range of plants [21,28,32,34,36,42]. However the responses to red and blue lights are species dependent. Furthermore, the plants grown under high light intensities increased in plant biomass and some of the bioactive compounds compared to low light intensities [6,24,28]. Thus, we used two different light intensities (150 and 200 PPFDs) and three different ratios of red (R) and blue (B) light (R:B = 10:0, 8:2, and 6:4) for the light quality treatment in this study. The R:B =10:0 was assumed as the control treatment as there was no proportion of blue light. The results showed a significant or non-significant effect of the light intensity and quality on the studied parameters. In the current study, eight growth parameters were analyzed, and almost all of them showed significant differences among the treatments. Most of the growth parameters were significantly affected by light quality, which is in agreement with previous studies [35,42]. We found significantly higher biomass in plants grown solely under red light (in control group), at both light intensities, which is similar to previous reports in lettuce, kale, spinach, basil, and sweet pepper [19,21,42]. Unlike Devkota and Jha [17], we found a non-significant difference in petiole length between the same R:B ratios, except for R:B = 8:2, which might be due to the minor difference (50 PPFD) between the two light intensities in our experiment. Non-significant changes in root length among the light qualities and between the light intensities were consistent with those observed by Lee et al. [43], who found that root length was not changed by red or blue light and their ratios. Total fresh and dry weights also showed no differences between the two PPFDs. However, more red light increased the total fresh weight. These results were similar to those of Liang et al. [28], who observed higher shoot fresh and dry weights in cucumber and tomato under decreased blue light. In contrast, Naznin et al. [19] reported higher fresh and dry weights in different vegetables under increased blue light. These inconsistent results suggest that the effect of light quality (red and blue light) on plant growth is highly dependent on plant species. Wang et al. [44] also reported that a higher R/B ration increased the shoot dry weight of lettuce. Leaf fresh and dry weights also showed trends similar to the total fresh and dry weights. Previous studies also showed decreased leaf fresh and dry weights under a higher blue light ratio than in a control [21,43]; however, non-significant changes were observed in leaf length and width between the two light intensities used in this study, which might be due to the small difference in PPFD between the two experiments. Further studies with various combinations of red and blue light as well as a sole source of blue light with a high difference in PPFDs seem necessary to understand the actual effect of light intensity and quality in the overall growth performance of C. asiatica plants.
Four major triterpene glycosides (asiatic acid, asiaticoside, madecassic acid, and madecassoside) were quantified and analyzed in this study. Asiatic acid and asiaticoside contents in this study were quite a bit higher compared to the results obtained by Devkota et al. [3] in C. asiatica spicemens collected from different geographical regions of Nepal. Furthermore, our studied showed higher individual and total triterpene glycoside content than in the previous report in different accessions of C. asiatica grown under natural habitats [45,46], although some discrepancies was also observed. Moreover, the use of red and blue light and their ratio had a positive influence on the accumulation of phytochemicals and growth performance in different plant species [16,32,35]. These results imply that the use of artificial light has a positive impact on the accumulation of triterpene glycoside content. In our study, all the triterpene glycosides were significantly affected by both the light intensity and quality; however, non-significant differences in total triterpene glycoside content between the two light intensities in the respective light quality was found. Our result was contrary with previous reports by Srithongkul et al. [6], who found significant differences in the total triterpene glycoside contents of C. asiatica cultivars grown under 93.3 to 933.1 PPFD. These results showed that light intensity affected the triterpene glycoside content of C. asiatica; however, the ~50 μmol m−2 s−1 difference in light intensity in this study did not cause considerable differences in the triterpene glycoside contents. The triterpene glycoside content markedly decreased with decreasing R:B ratio, regardless of light intensity. Under both light intensities, there was a reverse relationship between glycosylated triterpene (madecassoside and asiaticoside) and hydroxy triterpene (madecassic acid and asiatic acid) content ratios. This relationship might be due to the triterpene glycoside synthesis pathway, in which glycosyltransferase glycosylates hydroxyl triterpenes [38]. Total triterpene glycoside content (mg g−1 basis) was highest in a sole source of red light and continuously decreased with the increase in blue light ratio. Our results are consistent with the previous report by Watcharatanon et al. [22], who also found higher triterpene saponin glycosides in Bacopa monnieri grown in red light. It has been found that there is a positive or negative influence of a sole source of red light on bioactive compounds depending upon the plant genotype and nature of the bioactive compounds [28,30,42]. To understand the role of red light in the highest triterpene glycoside content, further experiments in genetic level are required as there is a lack of reports regarding the light quality and biosynthetic gene expression levels of these compounds in C. asiatica. The content of each triterpene glycoside per plant was significantly affected by both light intensity and quality. The highest total triterpene glycoside per plant was found at 200 PPFD and with the addition of a small proportion of blue light on red light (R:B = 8:2), which was inconsistent with the total triterpene glycoside content in mg per gram basis. These results suggest that the light condition with 200 PPFD and R:B = 8:2 is suitable for the production of triterpene glycosides, although the highest biomass was obtained with the sole red light treatment (control treatment) at 150 PPFD. To the best of our knowledge, this is the first report on the influence of light quality (different red and blue light ratios) on the triterpene glycoside content of C. asiatica. Therefore, this study might be useful for selecting optimum light quality for the improvement in triterpene glycoside content in C. asiatica. Moreover, it is highly recommended to perform further experiments with a large number of samples (replications and repetitions) in diverse light conditions including fluorescent light to elucidate the best results.
Phenolics and flavonoids are secondary metabolites that possess a strong antioxidant capacity, along with anticancer, antiproliferative, and antibacterial activities [47,48]. Both TPC and TFC increased with the increase in PPFD and proportion of blue light (R:B ratio) (Table 2). The TPC for the control treatment (R:B = 10:0) at both PPFDs was the lowest, followed by R:B =8:2 and 6:4. The higher TPC at 200 PPFD than at 150 PPFD was similar to previous reports in Labisia pumila Benth [24], which was probably due to the increase in phenylalanine ammonia-lyase, an enzyme for the biosynthesis of phenolic acids [49]. The higher TPC content with the increase in blue light ratio than with the sole red light application in this study was consistent with the previous reports in different vegetables [35,42]. In addition, previous studies have reported that the TPC in lettuce increased as the blue light ratio increased until the ratio became 53:47 (R:B) and started to decrease upon further increments of blue light [35]. The TFC also showed a trend similar to that of TPC; the TFC increased with the increase in light intensity and blue light ratio. Deng et al. [50] and Karimi et al. [24] obtained similar results using different light intensities in the leaves of Cyclocarya paliurus and Labisia pumila, respectively, and observed a higher TFC content at higher light intensities than at low light intensities. Our results are also in agreement with those of Dlugosz-Grochowska et al. [51], who reported the highest flavonoid content in Valerianella locusta under 7:3 (R:B) LED light composition, followed by 8:2, 9:1, and 10:0 light compositions.
Antioxidant capacity is highly important for understanding the health-promoting capacity of plants and their products, as it illustrates their ability to inhibit the oxidation process [52]. Two methods (FRAP and ABTS assays) were applied for the measurement of antioxidant activities in this study as only one method may not be sufficient to predict the antioxidant capacity accurately. Both ABTS and FRAP antioxidant activity assays were significantly affected by changes in light intensities and qualities, PPFDs and the R:B ratio. Furthermore, the results of light conditions were similar for both assays. The increase in antioxidant capacity with the increase in light intensity and the blue light ratio was similar to that in TPC and TFC. Under the same PPFD, ABTS and FRAP values increased with the blue light ratio, which was in accordance with previous studies on leafy green vegetables [19] and herbal plants [24]. According to Naznin et al. [19], five leafy green vegetables (lettuce, spinach, kale, basil, and pepper) grown under an LED light with a high blue light ratio showed high antioxidant capacity, which is probably due to the induction of LeHY5 and LeCOP1LIKE genes by blue light-mediated signals [53]. In another study, lettuce grown under a 53:47 (R:B) ratio had the highest antioxidant capacity, whereas the lowest value was observed under 0:100 light conditions [35], suggesting the use of blue and red light to stimulate antioxidant capacity. Son and Oh [35] explained this phenomenon as the improvement in antioxidant capacity through the fresh weight reduction by increasing the blue light. Overall results confirmed that the antioxidant compounds and antioxidant activity increased with the increase in the blue light ratio, although more compositional ratios of red and blue light are required to elucidate the highest antioxidant compounds in C. asiatica.
The correlation results showed a differential association between the bioactive compounds and their contribution to antioxidant capacity. A negative correlation between hydroxy triterpenes (asiatic acid and madecassic acid) and glycosylated triterpenes (asiaticoside and madecassoside) was observed because of the conversion of hydroxyl triterpenes into glycosylated triterpenes by glycosyltransferase [54]. The total triterpene glycoside had a little, positive, non-significant correlation with madecassoside (0.426). The significantly higher positive correlations between the TFC and TPC and antioxidant activity (ABTS and FRAP assays) are in agreement with Bhandari and Lee [39] and Song et al. [55], as phenolic compounds and flavonoids have a higher contribution to the total antioxidant activity.

5. Conclusions

The growth performance, triterpene glycosides, antioxidant activity, and total phenol and total flavonoid contents of C. asiatica grown under different light intensities and qualities were evaluated. Most of the growth parameters were the highest with the control treatment (R:B = 10:0) and 8:2 under 150 and 200 PPFD, respectively; however, sole red light induced epinasty and overgrowth of the plant. The total triterpene glycoside content per gram was relatively high at R:B = 10:0 at both 150 and 200 PPFD. In contrast, the actual total triterpene glycoside content was highest at R:B = 8:2 and 200 PPFD, which was probably due to the higher leaf dry weight and triterpene glycoside content per gram. Antioxidant (total phenolic and total flavonoid) contents and their antioxidant activities increased with the increase in the blue light ratio. Therefore, using the mixture of red and blue light rather than the use of only red light, and high light intensity is recommended to enhance the crop yield and targeted functional bioactive compounds in C. asiatica grown in plant factories. Further studies using different combinations of red and blue light and light intensities are required to elucidate the best light environment.

Author Contributions

Conceptualization, S.R.B. and J.G.L.; methodology, J.W.S. and S.R.B.; formal analysis, J.W.S. and S.R.B.; investigation, J.W.S. and Y.K.S., resources, J.W.S. and Y.K.S.; data curation, J.W.S. and S.R.B.; writing—original draft preparation, S.R.B. and J.W.S.; writing—review and editing, S.R.B. and J.G.L.; supervision, S.R.B. and J.G.L.; project administration, Y.K.S.; funding acquisition, J.G.L. All authors have read and agreed to the published version of the manuscript.

Funding

This work was supported by the National Research Foundation of Korea (NRF) grant funded by the Korean Government, Korea (Grant Number: 2020R1F1A1068658).

Informed Consent Statement

Not applicable.

Data Availability Statement

All the data are included in the manuscript.

Conflicts of Interest

The authors declare no conflict of interest.

References

  1. Sritongkul, J.; Srilaong, V.; Uthairatanakij, A.; Kanlayanarat, S.; Chalermglin, P. Effect of light intensity on chemical composition of asiatic pennywort (Centella asiatica L. Urban). Acta Hortic. 2009, 837, 87–93. [Google Scholar] [CrossRef]
  2. Peiris, K.; Kays, S. Asiatic Pennywort [Centella asiatica (L.) Urb.]: A little-known vegetable crop. Horttechnology 1996, 6, 13–18. [Google Scholar] [CrossRef] [Green Version]
  3. Devkota, A.; Dall’Acqua, S.; Comai, S.; Innocenti, G.; Jha, P.K. Centella asiatica (L.) urban from Nepal: Quali-quantitative analysis of samples from several sites, selection of high terpene containing populations for cultivation. Biochem. Syst. Ecol. 2010, 38, 12–22. [Google Scholar] [CrossRef]
  4. Mathur, S.; Verma, R.; Gupta, M.; Ram, M.; Sharma, S.; Kumar, S. Screening of genetic resources of the medicinal-vegetable plant Centella asiatica for herb and asiaticoside yields under shaded and full sunlight conditions. J. Hortic. Sci. Biotechnol. 2000, 75, 551–554. [Google Scholar] [CrossRef]
  5. Menglan, S.; Fading, P.; Zehui, P.; Watson, M.F.; Cannon, J.F.; Holmes-Smith, I.; Kljuykov, E.V.; Phillippe, L.R.; Pimenov, M.G. Apiaceae (Umbelliferae). Flora China 2005, 14, 1–205. [Google Scholar]
  6. Srithongkul, J.; Kanlayanarat, S.; Srilaong, V.; Uthairatanakij, A.; Chalermglin, P. Effects of light intensity on growth and accumulation of triterpenoids in three accessions of Asiatic pennywort (Centella asiatica (L.) Urb.). J. Food Agric. Environ. 2011, 9, 360–363. [Google Scholar]
  7. Bylka, W.; Znajdek-Awizen, P.; Studzinska-Sroka, E.; Brzezinska, M. Centella asiatica in cosmetology. Postepy. Dermatol. Alergol. 2013, 30, 46. [Google Scholar] [CrossRef]
  8. Devkota, A.; Dall’ Acqua, S.; Jha, P.K.; Innocenti, G. Variation in the active constituents in Centella asiatica grown in different habitats in Nepal. Bot. Orient.: J. Plant Sci. 2010, 7, 43–47. [Google Scholar] [CrossRef] [Green Version]
  9. Singh, S.; Singh, D.R.; Banu, V.S.; Avinash, N. Functional constituents (micronutrients and phytochemicals) and antioxidant activity of Centella asiatica (L.) Urban leaves. Ind. Crop. Prod. 2014, 61, 115–119. [Google Scholar] [CrossRef]
  10. Plengmuankhae, W.; Tantitadapitak, C. Low temperature and water dehydration increase the levels of asiaticoside and madecassoside in Centella asiatica (L.) Urban. S. Afr. J. Bot. 2015, 97, 196–203. [Google Scholar] [CrossRef]
  11. Rafat, A.; Philip, K.; Muniandy, S. A novel source of bioactive compounds: Endophytic bacteria isolated from Centella asiatica. J. Pure Appl. Microbiol. 2012, 6, 1. [Google Scholar]
  12. Shukla, A.; Rasik, A.M.; Jain, G.M.; Shankar, R.; Kulshrestha, D.K.; Dhawan, B.N. In vitro and in vivo wound healing activity of asiaticoside isolated from Centella asiatica. J. Ethnopharmacol. 1999, 65, 1–11. [Google Scholar] [CrossRef]
  13. Thomas, M.T.; Kurup, R.; Johnson, A.J.; Chandrika, S.P.; Mathew, P.J.; Dan, M.; Baby, S. Elite genotypes/chemotypes, with high contents of madecassoside and asiaticoside, from sixty accessions of Centella asiatica of south India and the Andaman Islands: For cultivation and utility in cosmetic and herbal drug applications. Ind. Crop. Prod. 2010, 32, 545–550. [Google Scholar] [CrossRef]
  14. Goto, E. Plant production in a closed plant factory with artificial lighting. In Proceedings of the 7th International Symposium on Light in Horticultural Systems, Wageningen, The Netherlands, 15–18 October 2012; pp. 37–50. [Google Scholar]
  15. Kozai, T. Resource use efficiency of closed plant production system with artificial light: Concept, estimation and application to plant factory. Proc. Jpn. Acad. Ser. B Phys. Biol. Sci. 2013, 89, 447–461. [Google Scholar] [CrossRef] [Green Version]
  16. Adil, M.; Ren, X.; Jeong, B.R. Light elicited growth, antioxidant enzymes activities and production of medicinal compounds in callus culture of Cnidium officinale Makino. J. Photochem. Photobiol. B Biol. 2019, 196, 111509. [Google Scholar] [CrossRef]
  17. Devkota, A.; Jha, P.K. Effects of different light levels on the growth traits and yield of Centella asiatica. Middle-East J. Sci. Res. 2010, 5, 226–230. [Google Scholar]
  18. Kumar, S.S.; Arya, M.; Mahadevappa, P.; Gridhar, P. Influence of photoperiod on growth, bioactive compounds and antioxidant activity in callus cultures of Basella rubra L. J. Photochem. Photobiol. B Biol. 2020, 209, 111937. [Google Scholar] [CrossRef]
  19. Naznin, M.T.; Lefsrud, M.; Gravel, V.; Azad, M.O.K. Blue light added with red LEDs enhance growth characteristics, pigments content, and antioxidant capacity in lettuce, spinach, kale, basil, and sweet pepper in a controlled environment. Plants 2019, 8, 93. [Google Scholar] [CrossRef] [Green Version]
  20. Poudel, P.R.; Kataoka, I.; Mochioka, R. Effect of red-and blue-light-emitting diodes on growth and morphogenesis of grapes. Plant Cell Tissue Organ Cult. 2008, 92, 147–153. [Google Scholar] [CrossRef]
  21. Son, K.-H.; Oh, M.-M. Growth, photosynthetic and antioxidant parameters of two lettuce cultivars as affected by red, green, and blue light-emitting diodes. Hortic. Environ. Biotechnol. 2015, 56, 639–653. [Google Scholar] [CrossRef]
  22. Watcharatanon, K.; Ingkaninan, K.; Putalun, W. Improved triterpenoid saponin glycosides accumulation in in vitro culture of Bacopa monnieri (L.) Wettst with precursor feeding and LED light exposure. Ind. Crop. Prod. 2019, 134, 303–308. [Google Scholar] [CrossRef]
  23. Ahmed, H.A.; Yu-Xin, T.; Qi-Chang, Y. Optimal control of environmental conditionds affecting lettuce plant growth in a controlled environment with artificial lighting: A review. S. Afr. J. Bot. 2020, 130, 75–89. [Google Scholar] [CrossRef]
  24. Karimi, E.; Jaafar, H.Z.; Ghasemzadeh, A.; Ibrahim, M.H. Light intensity effects on production and antioxidant activity of flavonoids and phenolic compounds in leaves, stems and roots of three varieties of Labisia pumila Benth. Aust. J. Crop Sci. 2013, 7, 1016. [Google Scholar] [CrossRef] [Green Version]
  25. Pan, J.; Guo, B. Effects of light intensity on the growth, photosynthetic characteristics, and flavonoid content of Epimedium pseudowushanense B.L. Guo. Molecules 2016, 21, 1475. [Google Scholar] [CrossRef] [Green Version]
  26. Zhou, J.; Li, P.; Wang, J. Effects of light intensity and temperature on the photosynthesis characteristics and yield of lettuce. Horticulturae 2022, 8, 178. [Google Scholar] [CrossRef]
  27. Fan, X.-X.; Xu, Z.-G.; Liu, X.-Y.; Tang, C.-M.; Wang, L.-W.; Han, X.-l. Effects of light intensity on the growth and leaf development of young tomato plants grown under a combination of red and blue light. Sci. Hortic. 2013, 153, 50–55. [Google Scholar] [CrossRef]
  28. Liang, Y.; Kang, C.; Kaiser, E.; Kuang, Y.; Yang, Q.; Li, T. Red/blue light ratios induce morphology and physiology alterations differently in cucumber and tomato. Sci. Hortic. 2021, 281, 109995. [Google Scholar] [CrossRef]
  29. Wang, P.; Chen, S.; Gu, M.; Chen, X.; Yang, J.; Zhao, F.; Ye, N. Exploration of the effects of different blue light intensities on flavonoid and lipid metabolism in tea plants via transcriptomics and metabolomics. Int. J. Mol. Sci. 2020, 21, 4606. [Google Scholar] [CrossRef]
  30. Zhang, S.; Ma, J.; Zou, H.; Zhang, L.; Li, S.; Wang, Y. The combination of blue and red LED light improves growth and phenolics acid contents in Salvia miltiorrhiza Bunge. Ind. Crop. Prod. 2020, 158, 112959. [Google Scholar] [CrossRef]
  31. Yang, L.; Wen, K.-S.; Ruan, X.; Zhao, Y.-X.; Wei, F.; Wang, Q. Response of plant secondary metabolites to environmental factors. Molecules 2018, 23, 762. [Google Scholar] [CrossRef] [Green Version]
  32. Khurshid, R.; Ullah, M.A.; Tungmunnithum, D.; Drouet, S.; Shah, M.; Zaeem, A.; Hameed, S.; Hano, C.; Abbasi, B.H. Lights triggered differential accumulation of antioxidant and antidiabitic secondary metabolites in callus culture of Eclipta alba L. PLoS ONE 2020, 15, e0233963. [Google Scholar] [CrossRef] [PubMed]
  33. Stagnari, F.; Mattia, C.D.; Galieni, A.; Santarelli, V.; D’Egidio, S.; Pagnani, G.; Pisante, M. Light quantity and quality supplies sharply affect growth, morphological, physiological and quality traits of basil. Indus. Crop. Prod. 2018, 122, 277–289. [Google Scholar] [CrossRef]
  34. Jung, W.-S.; Chung, I.-M.; Hwang, M.H.; Kim, S.-H.; Yu, C.Y.; Ghimire, B.K. Application of light-emitting diodes for improving the nutritional quality and bioactive compound levels of some crops and medicinal plants. Molecules 2021, 26, 1477. [Google Scholar] [CrossRef]
  35. Son, K.-H.; Oh, M.-M. Leaf shape, growth, and antioxidant phenolic compounds of two lettuce cultivars grown under various combinations of blue and red light-emitting diodes. HortScience 2013, 48, 988–995. [Google Scholar] [CrossRef]
  36. Zheng, L.; Van Labeke, M.-C. Long-term effects of red-and blue-light emitting diodes on leaf anatomy and photosynthetic efficiency of three ornamental plants. Front. Plant. Sci. 2017, 8, 917. [Google Scholar] [CrossRef] [Green Version]
  37. Li, Y.; Kong, D.; Fu, Y.; Sussman, M.R.; Wu, H. The effect of developmental and environmental factors on secondary metabolites in medicinal plants. Plant Physiol. Biochem. 2020, 148, 80–89. [Google Scholar] [CrossRef]
  38. Baek, S.; Ho, T.-T.; Lee, H.; Jung, G.; Kim, Y.E.; Jeong, C.-S.; Park, S.-Y. Enhanced biosynthesis of triterpenoids in Centella asiatica hairy root culture by precursor feeding and elicitation. Plant Biotechnol. Rep. 2020, 14, 45–53. [Google Scholar] [CrossRef]
  39. Bhandari, S.R.; Lee, J.G. Ripening-dependent changes in antioxidants, color attributes, and antioxidant activity of seven tomato (Solanum lycopersicum L.) cultivars. J. Anal. Method Chem. 2016, 2016, 5498618. [Google Scholar] [CrossRef] [PubMed] [Green Version]
  40. Shin, Y.K.; Bhandari, S.R.; Jo, J.S.; Song, J.W.; Cho, M.C.; Yang, E.Y.; Lee, J.G. Response of salt stress in lettuce: Changes in chlorophyll fluorescence parameters, phytochemical contents, and antioxidant activities. Agronomy 2020, 10, 1627. [Google Scholar] [CrossRef]
  41. Bhandari, S.R.; Cho, M.-C.; Lee, J.G. Genotypic variation in carotenoid, ascorbic acid, total phenolic, and flavonoid contents, and antioxidant activity in selected tomato breeding lines. Hortic. Environ. Biotechnol. 2016, 57, 440–452. [Google Scholar] [CrossRef]
  42. Johkan, M.; Shoji, K.; Goto, F.; Hashida, S.-N.; Yoshihara, T. Blue light-emitting diode light irradiation of seedlings improves seedling quality and growth after transplanting in red leaf lettuce. HortScience 2010, 45, 1809–1814. [Google Scholar] [CrossRef] [Green Version]
  43. Lee, J.-G.; Oh, S.-S.; Cha, S.-H.; Jang, Y.-A.; Kim, S.-Y.; Um, Y.-C.; Cheong, S.-R. Effects of red/blue light ratio and short-term light quality conversion on growth and anthocyanin contents of baby leaf lettuce. J. Bio-Environ. Con. 2010, 19, 351–359. [Google Scholar]
  44. Wang, J.; Lu, W.; Tong, Y.; Yang, Q. Leaf morphology, photosynthetic performance, chlorophyll fluorescence, stomatal development of lettuce (Lactuca sativa L.) exposed to different ratios of red light to blue light. Front. Plant Sci. 2016, 7, 250. [Google Scholar] [CrossRef] [PubMed] [Green Version]
  45. Puttarak, P.; Panichayupakaranant, P. Factors affecting content of pentacyclic triterpenes in Centella asiatica raw materials. Pharm. Biol. 2012, 50, 1508–1512. [Google Scholar] [CrossRef] [PubMed]
  46. Kunjumon, R.; Johnson, A.J.; Remadevi, R.K.S.; Baby, S. Assessment of major centelloside ratios in Centella asiatica accessions grown under identical ecological conditions, bioaconversion clues and identification of elite lines. Sci. Rep. 2022, 12, 8177. [Google Scholar] [CrossRef]
  47. Harborne, J.B.; Williams, C.A. Advances in flavonoid research since 1992. Phytochemistry 2000, 55, 481–504. [Google Scholar] [CrossRef]
  48. Manach, C.; Mazur, A.; Scalbert, A. Polyphenols and prevention of cardiovascular diseases. Curr. Opin. Lipidol. 2005, 16, 77–84. [Google Scholar] [CrossRef]
  49. Kumari, R.; Singh, S.; Agrawal, S.B. Effects of supplemental ultraviolet-B radiation on growth and physiology of Acorus calamus L. (sweet flag). Acta. Biol. Cracov. Ser. Bot. 2009, 51, 19–27. [Google Scholar]
  50. Deng, B.; Shang, X.; Fang, S.; Li, Q.; Fu, X.; Su, J. Integrated effects of light intensity and fertilization on growth and flavonoid accumulation in Cyclocarya paliurus. J. Agric. Food Chem. 2012, 60, 6286–6292. [Google Scholar] [CrossRef]
  51. Dlugosz-Grochowska, O.; Wojciechowska, R.; Kruczek, M.; Habela, A. Supplemental lighting with LEDs improves the biochemical composition of two Valerianella locusta (L.) cultivars. Hortic. Environ. Biotechnol. 2017, 58, 441–449. [Google Scholar] [CrossRef]
  52. Rajashekar, C.B.; Carey, E.E.; Zhao, X.; Oh, M.-M. Health-promoting phytochemicals in fruits and vegetables: Impact of abiotic stresses and crop production practices. Funct. Plant Sci. Biotechnol. 2009, 3, 30–38. [Google Scholar]
  53. Yang, H.Q.; Wu, Y.J.; Tang, R.H.; Liu, D.; Liu, Y.; Cashmore, A.R. The C termini of Arabidopsis cryptochromes mediate a constitutive light response. Cell 2000, 103, 815–827. [Google Scholar] [CrossRef] [Green Version]
  54. Prasad, A.; Mathur, A.K.; Mathur, A. Advances and emerging research trends for modulations of centelloside biosynthesis in Centella asiatica (L.) Urban—A review. Ind. Crop. Prod. 2019, 141, 111768. [Google Scholar] [CrossRef]
  55. Song, F.-L.; Gan, R.-Y.; Zhang, Y.; Xiao, Q.; Kuang, L.; Li, H.-B. Total phenolic contents and antioxidant capacities of selected Chinese medicinal plants. Int. J. Mol. Sci. 2010, 11, 2362–2372. [Google Scholar] [CrossRef] [PubMed]
Figure 1. The absolute irradiance spectrum of light-emitting diodes (LEDs). R: red, B: blue.
Horticulturae 08 00601 g001
Figure 2. Effect of light conditions (light intensity and quality) on the visual appearance and growth status of Centella asiatica.
Horticulturae 08 00601 g002
Figure 3. High-performance liquid chromatography (HPLC) chromatogram of four triterpene glycosides in the (a) standard mixture and (b) sample extract. 1: madecassoside; 2: asiaticoside; 3: madecassic acid; and 4: asiatic acid.
Horticulturae 08 00601 g003
Figure 4. Effects of light quality on triterpene glycoside contents (mg g−1 of dry weight) of Centella asiatica leaves grown under two PPFD conditions. Each bar represents the mean ± SD of three replicates. Different letters within a figure indicate a significant difference at p < 0.05 based on Duncan’s multiple range test. (a) Madecassoside; (b) asiaticoside; (c) madecassic acid; (d) asiatic acid.
Horticulturae 08 00601 g004
Figure 5. Total triterpene glycoside contents of Centella asiatica leaves grown under six different light conditions. Each bar represents the mean ± SD of three replicates. Different letters within a figure indicate a significant difference at p < 0.05 based on Duncan’s multiple range test. (a) Total triterpene glycoside content in mg per gram of dry sample; (b) total triterpene glycoside content in mg per plant of dry sample.
Horticulturae 08 00601 g005
Figure 6. Effects of light quality on triterpene glycoside content (mg plant−1) in Centella asiatica under two PPFD conditions. Each bar represents the mean ± SD of three replicates. Different letters within a figure indicate a significant difference at p < 0.05 based on Duncan’s multiple range test. (a) Madecassoside; (b) asiaticoside; (c) madecassic acid; (d) asiatic acid.
Horticulturae 08 00601 g006
Table 1. Variation in growth parameters of Centella asiatica grown under different light conditions.
Light Intensity
(μmol m−2 s−1)
Light Quality
(R:B)
Whole PlantLeaf
Petiole Length (cm)Root Length (cm)Fresh Weight (g)Dry Weight (g)Length (g)Width (g)Fresh Weight (g)Dry Weight (g)
15010:08.4 ± 1.7 z b y12.0 ± 2.0 a8.19 ± 1.54 a0.92 ± 0.19 ab4.2 ± 0.4 b4.8 ± 0.3 bc3.93 ± 0.63 a0.51 ± 0.12 ab
8:26.0 ± 1.7 c13.8 ± 1.5 a5.57 ± 0.62 bc0.74 ± 0.09 bc4.0 ± 0.6 bc4.8 ± 0.6 bc2.78 ± 0.41 b0.39 ± 0.05 bc
6:45.5 ± 1.7 c12.9 ± 1.5 a4.35 ± 1.10 c0.62 ± 0.14 c3.6 ± 0.5 bc4.3 ± 0.9 c1.97 ± 0.19 c0.31 ± 0.06 c
20010:07.5 ± 1.4 bc12.3 ± 0.6 a6.78 ± 1.59 ab0.76 ± 0.21 bc3.9 ± 0.4 bc5.3 ± 0.5 b4.11 ± 0.87 a0.44 ± 0.12 abc
8:211.2 ± 1.7 a13.6 ± 1.9 a7.34 ± 0.69 ab1.02 ± 0.15 a5.5 ± 0.8 a6.3 ± 0.7 a3.92 ± 0.54 a0.58 ± 0.09 a
6:45.4 ± 1.4 c14.1 ± 3.5 a6.24 ± 1.38 b0.82 ± 0.21 abc3.4 ± 0.4 c4.4 ± 0.5 c3.26 ± 0.84 b0.45 ± 0.12 abc
z Values are mean ± SD of five biological replications. y Values within a column followed by the same letter are not significantly different from each other at p < 0.05 based on Duncan’s multiple range test.
Table 2. Triterpene glycosides, total phenol content (TPC), total flavonoid content (TFC), and antioxidant activities of Centella asiatica at different light intensities and qualities.
ParameterLight Intensity (L)Light Quality (Q)L × Q
F-ValueSignificanceF-ValueSignificanceF-ValueSignificance
Madecassoside z719.00***338.50***335.00***
Asiaticoside1076.30***114.70***253.90***
Madecassic acid194.34***12.40**39.98***
Asiatic acid195.78***12.80**39.51***
Total0.13NS13.35***2.80NS
ABTS1062.98***414.32***83.21***
FRAP318.23***79.40***27.69***
TPC319.50***95.90**41.46***
TFC521.16***155.68**54.16***
NS, **, and *** indicate non-significant and significant differences at p ≤ 0.01 and p ≤ 0.001, respectively. FRAP, ferric reducing antioxidant power; ABTS, 2,2′-azino-bis(3-ethylbenzothiazoline-6-sulfonic acid). Z Statistical results for triterpene glycosides are based on mg per gram basis.
Table 3. Effect of light intensity and quality on antioxidant activities and total phenol and flavonoid contents of Centella asiatica leaves.
Light Intensity
(μmol m−2 s−1)
Light Quality (R:B)ABTS
(μmol TE g−1 DW)
FRAP
(μmol TE g−1 DW)
Total Phenol
(mg GAE g−1 DW)
Total Flavonoid
(mg CE g−1 DW)
15010:046.31 ± 0.46 z d y26.57 ± 2.07 d6.36 ± 0.22 d3.62 ± 0.71 d
8:246.74 ± 5.68 d27.16 ± 2.08 d6.66 ± 0.48 d4.20 ± 0.28 d
6:474.76 ± 3.77 c43.61 ± 3.16 c8.53 ± 0.61 c6.92 ± 0.23 c
20010:080.07 ± 4.08 c52.28 ± 3.38 c9.18 ± 0.33 c7.89 ± 0.36 c
8:299.18 ± 2.24 b76.01 ± 4.20 b12.57 ± 0.36 b11.41 ± 1.11 b
6:4163.47 ± 4.40 a120.18 ± 12.95 a19.06 ± 1.61 a19.59 ± 1.16 a
z Values are mean ± SD of three replications. y Values within columns followed by the same letter are not significantly different from each other at p < 0.05 based on Duncan’s multiple range test.
Table 4. Correlations between triterpene glycosides, antioxidant activities, total phenol content (TPC), and total flavonoid content (TFC) in Centella asiatica leaves.
ParameterAMaAaTTCABTSFRAPTPCTFC
M0.995 ***−0.983 ***−0.983 ***0.4260.711 *0.744 *0.733 *0.738 *
A −0.994 ***−0.994 ***0.3140.758 *0.788 *0.778 *0.782 *
Ma 1.000 ***−0.158−0.825 *−0.851 **−0.843 **−0.846 **
Aa −0.158−0.826 *−0.852 **−0.843 **−0.846 **
TTC −0.481−0.432−0.451−0.444
ABTS 0.999 ***0.999 ***0.999 ***
FRAP 1.000 ***1.000 ***
TPC 1.000 ***
*, **, *** Indicate significant correlations at p ≤ 0.05, 0.01, and 0.001, respectively. M, madecassoside; A, asiaticoside; Ma, madecassic acid; Aa, asiatic acid; TTC, triterpene glycoside content; FRAP, ferric reducing antioxidant power; ABTS, 2,2′-azino-bis(3-ethylbenzothiazoline-6-sulfonic acid).
Publisher’s Note: MDPI stays neutral with regard to jurisdictional claims in published maps and institutional affiliations.

