Article

The Main Morphological Characteristics and Chemical Components of Fruits and the Possibilities of Their Improvement in Raspberry Breeding

1
Research and Development Station for Plant Culture on Sands, 207220 Calarasi, Romania
2
Department of Transversal Competences, University of Agricultural Sciences and Veterinary Medicine Cluj-Napoca, 3–5 Manastur Street, 400372 Cluj-Napoca, Romania
3
Research Institute for Fruit Growing Pitesti, 402 Mărului Street, 117450 Mărăcineni, Romania
4
Research Station for Fruit Growing, 3 Ion Vodă cel Viteaz, 707305 Iaşi, Romania
5
Department of Horticulture & Food Science, Faculty of Horticulture, University of Craiova, 200585 Craiova, Romania
6
Department of Horticulture and Landscape, University of Agricultural Sciences and Veterinary Medicine Cluj-Napoca, 3–5 Manastur Street, 400372 Cluj-Napoca, Romania
7
Department of Horticulture, Faculty of Agriculture, Ataturk University, Erzurum 25240, Turkey
8
Department of Forestry, University of Agricultural Sciences and Veterinary Medicine Cluj-Napoca, 3–5 Manastur Street, 400372 Cluj-Napoca, Romania
*
Authors to whom correspondence should be addressed.
Horticulturae 2023, 9(1), 50; https://doi.org/10.3390/horticulturae9010050
Submission received: 6 December 2022 / Revised: 25 December 2022 / Accepted: 27 December 2022 / Published: 3 January 2023
(This article belongs to the Special Issue New Results in Fruit Tree Breeding and Efficient Use of Cultivars)

Abstract

:
Raspberry is a delicious fruit with important nutritional and health properties for consumers. The efficiency of achieving raspberry breeding aims such as productivity, fruit quality, and adequate response to stressors, etc., depends directly on knowledge of the inheritance of traits and genetic factors of influence and their pragmatic use. In this study, the main morphological characteristics and chemical components of fruits of 24 raspberry genotypes were studied in a comparative field trial; 14 were promising selections and the other 10 included their parental forms (Autumn Bliss, Glen Moy, Glen Prosen, Opal, Pathfinder, Titan, Tulameen, Veten, Willamette) and Glen Ample cultivar, which was used as control. The results highlighted significant differences and a large variation among the genotypes (between 2.40 and 4.90 g for fruit weight, 0.19–0.47 kg/cane for yield, 50–106 for drupelets/fruit, 10.0–12.7% for dry matter, 0.23–2.00% pectin, 1.61–2.72% glucose, etc.). The inheritance of the analyzed traits, considered quantitative, was different, but a low heritability was recorded for non-marketable fruits and the number of drupelets in fruit. In several hybrid selections, negative heterosis prevailed, highlighting the breeding difficulties of the important desired traits of the species. The values of heterosis and the broad-sense and narrow-sense heritability of some traits demonstrate that, through judiciously choosing parents, raspberry breeding in the desired direction can be successful.

1. Introduction

Raspberry (Rubus idaeus L.), which belongs to the Rosaceae family of genus Rubus, is a valuable semi-shrub fruit species that includes 12 subgenera [1,2]. The most economically important are the subgenus Ideobatus, the European red raspberry, North American red raspberry, and black raspberry [2,3,4]. In Romania, a large proportion of raspberry fruits come from spontaneous flora; however, the quantity demanded both for the domestic market and for export can be met with this species only through the cultivation of large areas of land [5]. In general, raspberries are cultivated in small farms (1–2 ha on average), and among the most cultivated and widespread cultivars are those used as parents in the hybrid combinations in the present study.
The raspberry is a fruit species characterized by early maturity, early fruit bearing, regular and high yields, and a quick return on capital investment [6]. Although genetic factors significantly influence fruit quality [7,8], different agricultural practices [9,10], fruit maturity [11], and environmental conditions can also influence berry metabolite amounts and composition [12,13,14,15]. The productivity of raspberries is directly dependent on the cultivars and the biological qualities of the crop, soil and climate conditions, and the applied agricultural cultivation techniques. Currently, interest in raspberries is growing due to a number of advantages over some of the other fruit crops. Many researchers focus their work on the study of the vegetative and reproductive manifestations of plants, with the aim of potentiating the production and quality characteristics of new cultivars. In this direction, new cultivars of raspberries are being created with specific qualities and requirements that are consistent in terms of the indicators of vegetative growth, yield, fruit characteristics, and other qualities of the crop when considering specific growing conditions. The selection activity is diverse, expressed by an improvement in each indicator of the manifestations of plants [16,17].
There are different climatic factors which can change a great deal in the natural environment and which can significantly affect growth and fruit quality (such as light conditions (intensity, quality, photoperiod), temperature, precipitation, etc. [14,18,19]); however, there are also other abiotic and biotic factors which can influence harvesting and its quality [20]. The yield of fruits and their quality varies among cultivars, with variations in fruit quality capable of occurring due to the location where it is grown [18]. The current literature does not always provide clarifications on how raspberry quality is influenced by a farms’ management, cultivars, and harvest time [21].
Raspberry fruits are being appreciated for their taste and flavor, as well as their ability to ensure early and quality fruit production, which is well exploited in markets. Although raspberry grows and bears fruit well in spontaneous flora, the fruit of cultivated raspberries matures earlier and is of better quality. Raspberries are one of the most popular and valued fruits, not only because of their high vitamin and mineral content, but also because of their organoleptic characteristics (taste, color, and aroma) [22,23,24,25]. The worldwide tendency toward growing more small fruits, including raspberries, has shown a permanent increase because this group of fruits has relatively high bioactive nutrient content [26].
The characteristic taste of raspberry fruit is a consequence of its sugars and organic acid concentration. Raspberry fruit is considered a low-energy fruit that is comprised primarily of natural carbohydrates with the main sugar form being fructose, a feature that makes berry fruit very popular among consumers [24]. It represents a functional food and is known as a “superfruit” rich in bioactive natural substances [27,28]. The package of nutrients and bioactive components that the raspberries deliver confers their important protective role in human health [29]. It is well known that the high phenolic profile of raspberry fruits provides positive effects on the health of consumers, and anthocyanins and ellagitannins offer major antioxidant capacity [30,31]. However, the content of these compounds is influenced by environmental and weather conditions, agrotechnical conditions, harvest time, and the specific cultivar [32,33,34]. Raspberry is an economically important berry crop that contains numerous bioactive compounds and antioxidant capacity, which thus offers significant potential health benefits [35,36].
Even though it is generally accepted that the nutrient content of raspberries is affected by numerous factors, limited information is available on the influence of genotype or environmental factors [36]. Among the methods for analyzing fruits and their principal peculiarities, morphological and biochemical characterization are preferred because they are cheaper and easier [37,38,39]. Plant morphological, biochemical, and molecular characterization provides important information about the genetic variability of genotypes from both wild and cultivated flora, which is thus useful for breeding [26,40,41,42,43].
The growing needs of the fresh raspberry market, the growing number of consumers, and the demands of processors have led to the development of new cultivars that have higher quality and more useful substances and nutritional principles. Raspberries have a lot of differences between genotypes and their fruit have a lot of different physical characteristics [44]. Morphological and biochemical characterization and resource efficiency are necessary for raspberry breeding and germplasm exploitation [45]. The prospect of using some genotypes as parental forms in artificial hybridizations to acquire variability that may be exploited through selection and cultivar creation is also of interest. Thus, to assist raspberry breeders in meeting customer demands, this study compared promising raspberry selections to their parental forms to assess yields and physicochemical fruit qualities, consequently providing important information for raspberry breeding. In addition to the variability in morphological and qualitative fruit qualities in well-known cultivars, which were used to test the value of their selected hybrid progeny, information on raspberry trait inheritance was investigated. Because heterosis research in raspberries was scarce [46,47,48,49], our study examined the forms of heterosis in the hybrid combinations of certain high-quality cultivars and how heterosis might be used to improve raspberry breeding.

2. Materials and Methods

2.1. Location of Experiment and Study Conditions

This study was conducted by the Small Berry Department of the Research Institute for Fruit Growing Pitesti (RIFGP) in the central-southern part of Romania over a period of three consecutive years (2015, 2016 and 2017), starting from the second year after the establishment of the raspberry plantation. The experimental fields with biological material are located at 44°54′7.82″ North and 24°52′19.63″ East, and the soil properties were the following: organic matter (H) = 1.71%, clay content (C) Ø < de 0.003 mm (C) = 16.6%, pH = 6.2.

2.2. Biological Material and Experimental Procedures

The biological material consisted of 14 promising raspberry selections (clones), which were tested in a comparative trial with their parental forms and the Glen Ample cultivar as control. A total of 24 genotypes were studied, respectively 14 selections and their 10 parental cultivars (Autumn Bliss, Glen Moy, Glen Prosen, Opal, Pathfinder, Titan, Tulameen, Veten, Willamette), and Glen Ample. The clonal selections belonged to six hybrid combinations (families of offspring), in which the hybrids were selected individually and chosen as elites based on their overall value (such as the taste quality of the fruits) before then being multiplied vegetatively. The experiment was part of the first evaluation cycle of these new selections obtained at the RIFGP. After testing throughout the 2015–2017 period, the selections entered a cycle that also included their response to abiotic and biotic stress factors. This is yet to be completed, though two selections have already been proposed for testing in the official registration system as new cultivars. Clonal selections that are not recommended for registration will be maintained in the raspberry germplasm pool as conserved genetic resources at the RIFGP.
According to the hybrid combinations from which they originated, the selections were framed as full-sib (with the same male and female parents) or half-sib progenies (with a common parent, either mother or father). Thus, the T 38, T 25, and T 34 selections originated from hybrids selected in the family derived from the combination of Tulameen (♂) × Autumn Blis (♀); GLT 18, GLT 15, and GLT 12 were derived from Glen Moy (♂) × Tulameen (♀); WXVE 8 and WXVE 16 were derived from Willamette (♂) × Veten (♀); TXPE 3 and TXPE 6 were derived from Tulameen (♂) × Pathfinder (♀); TXOE 13 and TXOE 9 were derived from Tulameen (♂) × Opal (♀); and TXGPE 11 and TXGPE 19 were derived from Titan (♂) × Glen Prosen (♀). The signs ♂ and ♀ in the cross combination represent the paternal and maternal symbols. Every genotype was represented in the experimental plot by 45 plants (three replications of 15 plants), which were arranged in a randomized complete block design. The plants were spaced 2.8 m apart between rows and 0.5 m apart within the row. During the study period, the experimental plot was irrigated but no chemical fertilization was applied, and the canes were cut in spring (March), which thus reduced the number of canes to eight per plant.
The morphological characteristics of the fruits were evaluated at each picking (four picking stages per year) using a sample of 50 fruits for each studied genotype, with the sample randomized but approximately equal in terms of the number from each cane. The length and diameter (mm) of each fruit in the sample were measured individually with a digital caliper. The fruit shape index was calculated using the formula fruit length/fruit diameter. The fruit size index was calculated using the formula (fruit length + fruit diameter)/2. The weight of fruits was obtained by weighing each fruit in the sample. The number of drupelets was obtained by individually counting the drupelets extracted from the berry with fine tweezers. Non-marketable fruits were considered to be those that had an altered appearance, unsuitable firmness, or mold (usually caused by Botrytis cinerea), and these were counted and weighed at each harvesting stage. The yield/cane was determined by weighing the total fruits harvested. All analyzed characteristics were subsequently processed as mean values.

2.3. Chemical Analysis

Dry matter was determined via the gravimetric method by drying the weighed samples in an oven dryer (Memmert, Memmert Gmbh, Schwabach, Germany) for 24 h at 105 °C to constant mass following AOAC Official Method 923.09 [50]. Total drying time represents the time taken for the samples to reach a stable weight. Total soluble solid content was determined as °Brix (°Bx) in raspberry juice obtained from fruits mixed from every pick by averages of a digital refractometer (PR-101, Atago, Tokyo, Japan). The titratable acidity (organic acids) of fruits was determined from 10 mL of fruit juice slowly titrating 0.1 N NaOH with a 25 mL burette or an automatic burette. The phenolphthalein indicator changed very rapidly from colorless to pink. Results were expressed as tartaric acid in gram/litre (g/L) = Titre × acid factor × 100/10 (mL juice). The amount of pectin was determined with the titrimetric method [51], using a sample of 0.5–1.0 g of dry rough material or 20–25 g of the fresh weight of fruits. The pH of fruits was determined from the same juice using a digital pH meter type IQ 150 (Spectrum Laboratory Products, Inc., Gardena, CA, USA) calibrated to pH solutions of 7 and 4.
Glucose content was determined with the iodometric method, and the sucrose content in fruit juice samples was evaluated via the titration methods for determining the concentration of reducing sugars in samples based on their reducing action towards certain metallic salts. Since sucrose is a nonreducing sugar, sucrose was converted into monosaccharides to obtain reducing activity. In this process, the sample reduces copper sulfate in an alkaline tartrate system (Fehling’s solution) [50]. Total reducing sugar content of initial fruit juice sample was quantified by titration, and the difference between the reducing sugar and glucose content represents fructose content.

2.4. Statistical Analyses

To provide an overview of the main morphological characteristics of the fruits of the 24 raspberry genotypes analyzed over three consecutive years, boxplots were used, with each demonstrating the minimum values, lower quartiles, median, upper quartiles, and maximum values of the parameters. The final data were processed as mean values for all the analyzed characteristics. To identify possible differences between the means of the analyzed parameters, analysis of variance (ANOVA) was used as a statistical test. When the null hypothesis was rejected, ANOVA was completed with Duncan’s test (α < 0.05) to separate and highlight the differences among means. Pearson correlations (simple respectively phenotypic correlations) were calculated and graphically represented using PAST software (PAleontological STatistics (PAST) Version 4.09, Natural History Museum, University of Oslo, Norway) [52]. The same software was used to perform principal component analysis (PCA), correspondence analysis (CA), and hierarchical clustering analyses using the single linkage method, as well as to calculate the Gover similarity index.
For the selections that were previously identified as elite plants from hybrid families with common parents, four types of heterosis were calculated. Absolute heterosis was calculated in two ways: by comparing each trait with the mean of the parents and by comparing each trait with the mean of the best parent. In addition, relative heterosis, or mid-parent heterosis (%), was calculated using the mean values of selections and parents, and heterobeltiosis was calculated as a percentage using the mean values of the selections and the best parent. The model and formulas used are presented in the study by Felföldi et al. [53].
Heritability was calculated according to two models. In the first model, broad-sense heritability (H2) was calculated on the set of all genotypes in the experiment, considering that they are clones and that there was no genetic variation between plants within the clones aside from those induced by the environment. In this case, the formula used was H2 = VG/VP, where VG = genotypic variance and VP = phenotypic variance. In the second model, which was used for the selections that belonged to half-sibling families, genetic variances were partitioned based on the relationship between the half-siblings and both heritability coefficients were calculated (broad-sense heritability (H2) and narrow sense heritability (h2)). Consequently, total genetic variance was partitioned into its three components, i.e., additive, dominance, and epistatic variances (VG = VGA + VGD + VGI), and total phenotypic variance was partitioned into its components, including not only genetic variance, but also environmental and genetic × environmental interaction variances (VP = VGA + VGD + VGI + VE + VG*E). It was assumed that all sibling selections shared the same technology and environment conditions, and additive genetic variance was estimated using only within-family differences. For H2, the same formula was used but was based on data between half-related selections (only Tulameen was considered as it was the one common parent). Narrow-sense heritability (h2) was calculated according to the formula h2 = VGA/VP, where VGA = additive genetic variance and VP = phenotypic variance. Therefore, for the calculation of H2 and h2, formulas based on variations in half-siblings were used [54] that considered the proportion of common genes among half-brother selections, respectively their degree of relatedness, to be equal to 25%, or 1/4 from additive variance [55]. This additive variance of the means of half-sib families, which is a quarter of the additive variance of the selected parents, is called the variance of breeding values [55].

3. Results

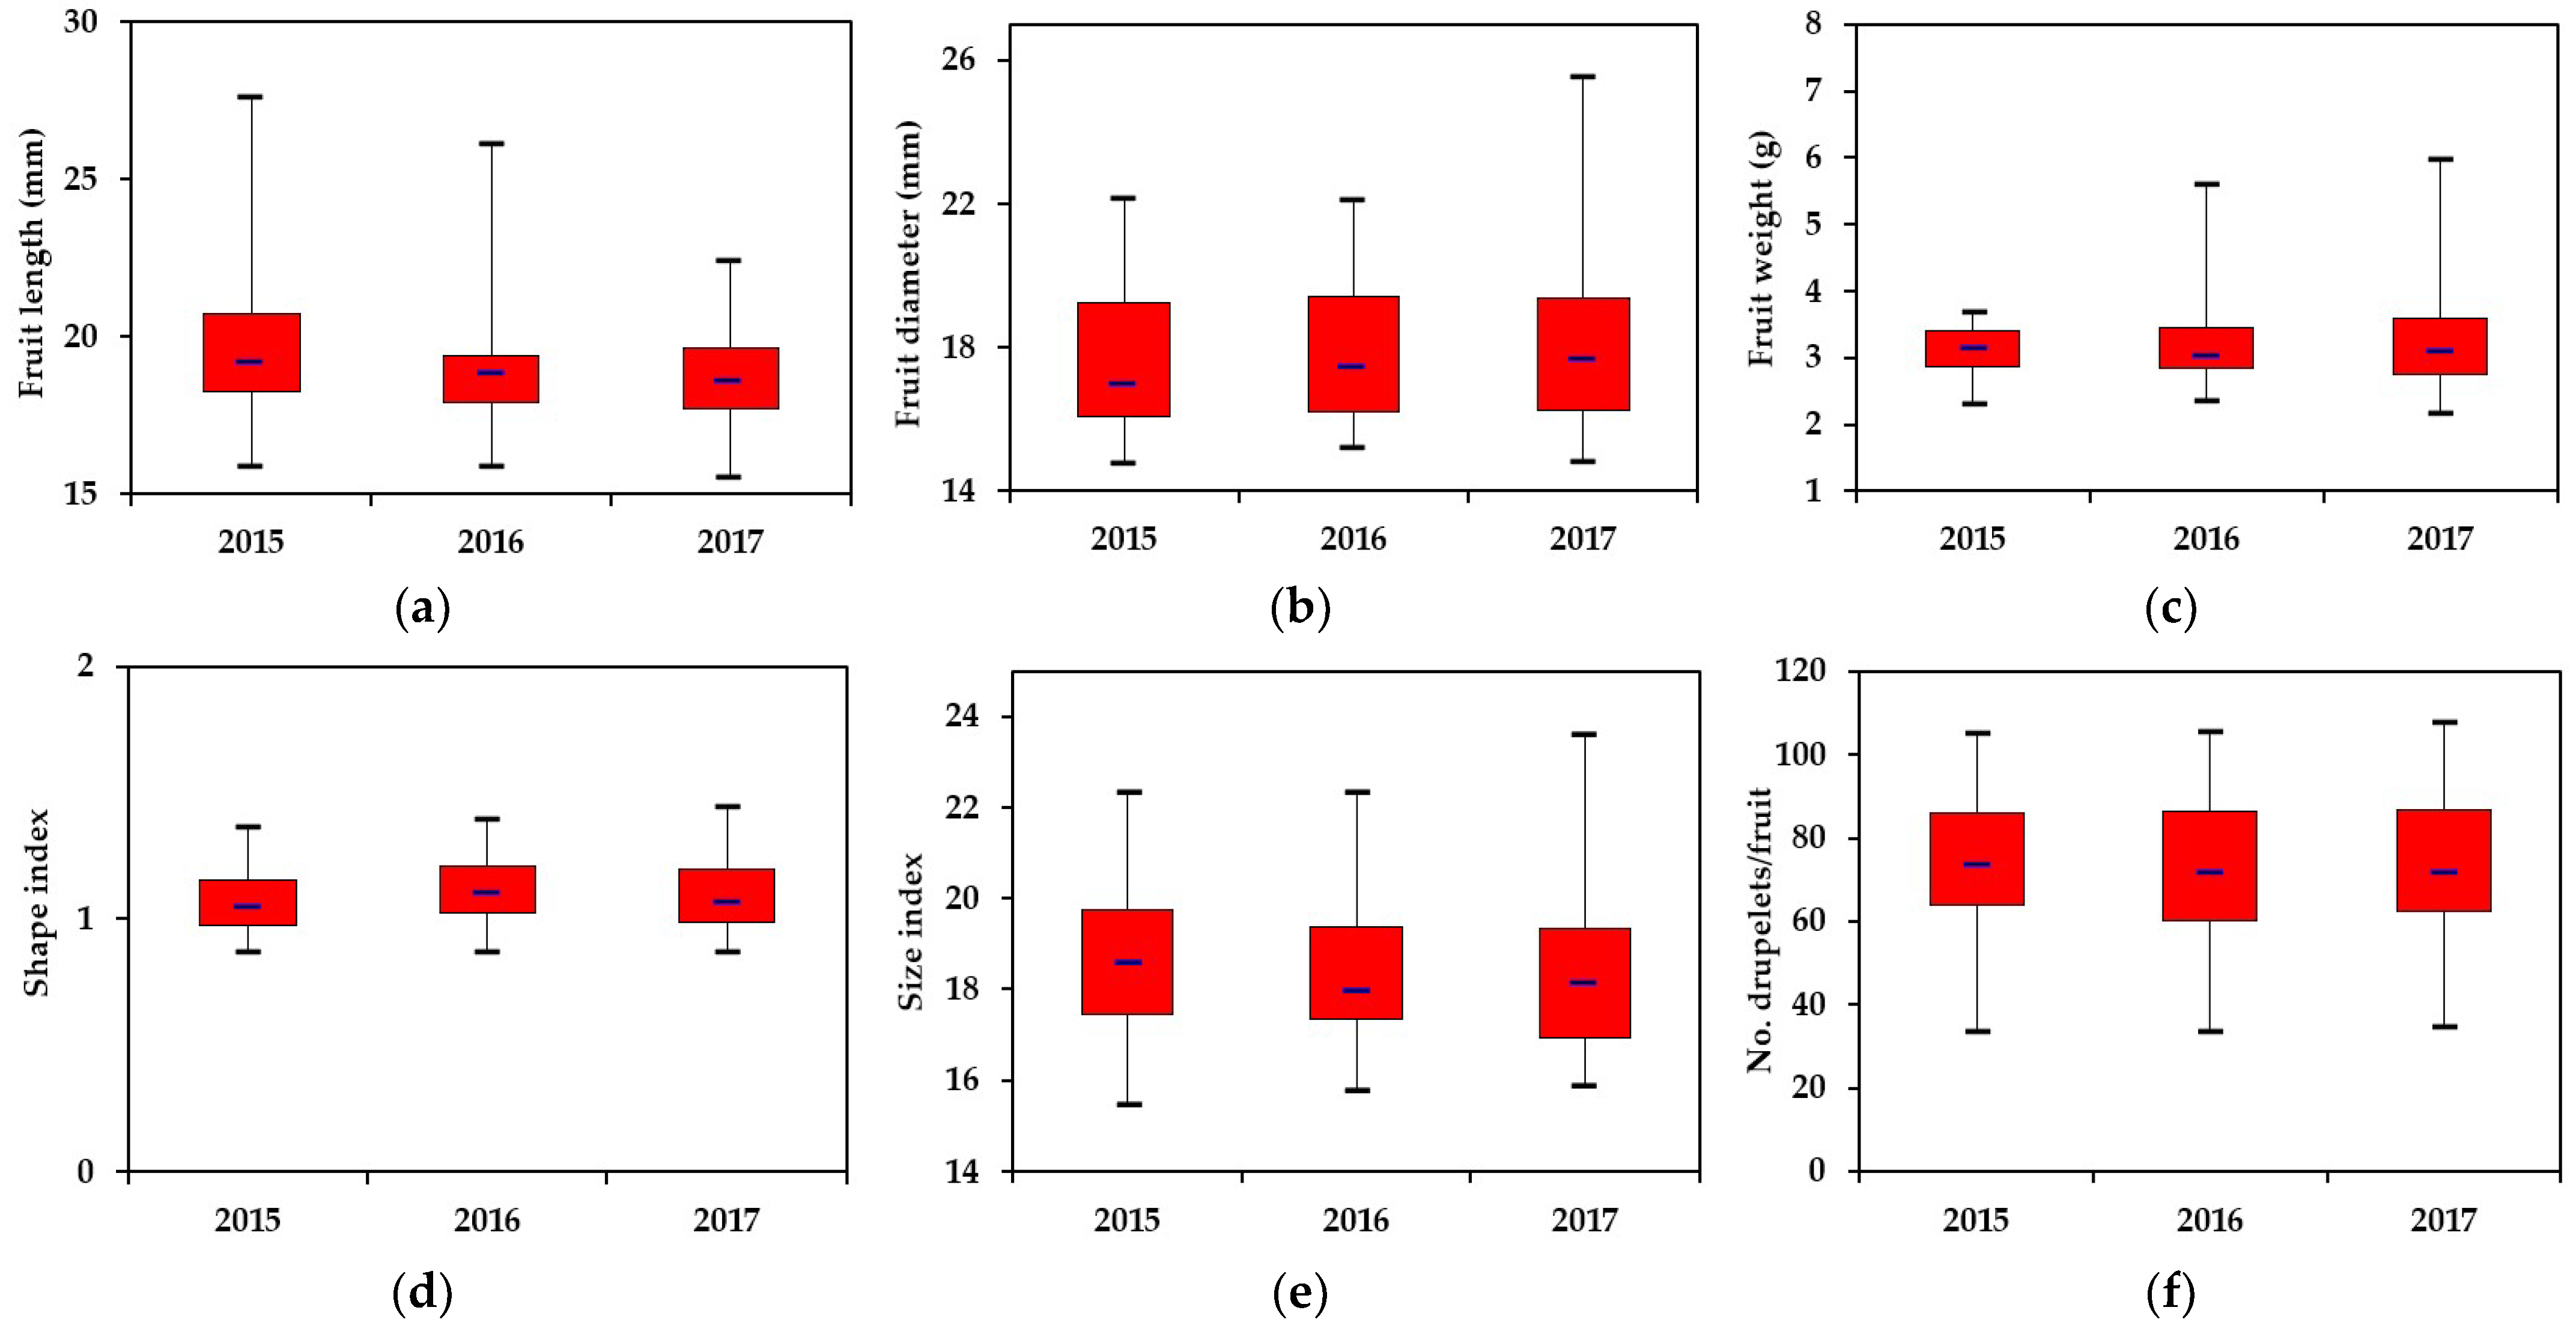
3.1. The Morphological Traits of the Fruits

Within the ensemble of 24 genotypes from the experiment, the boxplot diagrams reflect the relatively close morphological traits of the fruits for the three consecutive years of experimentation (2015–2017) (Figure 1). For the length of the fruits, a greater dispersion of values was recorded in the first two years, while in the third year the trait was more homogeneous (Figure 1a); the extreme limits in the three years were between 15.5 mm (2017) and 27.6 mm (2015). For the diameter of the fruits, the largest fluctuation occurred in the third year, with an amplitude between 14.8 and 25.5 mm (Figure 1b). The largest dispersion of fruit weight was recorded in 2017, with oscillations between 2.2 and 6.0 g; in the first year, the trait was more homogeneously expressed than in the following two (Figure 1c). For shape index, size index, and the number of drupelets per fruit (berry), the boxplots generally depict close averages between the three years of experimentation, as well as close averages regarding the fluctuation of individual genotype values in relation to the 24 analyzed genotypes as a whole (Figure 1d–f). The overall mean of the 24 genotypes over the three years was 19.5 mm for fruit length, 17.9 mm for fruit diameter, 3.2 g for fruit weight, 76.9 drupelets per fruit, and 0.35 kg/cane for yield.
Analyzing the morphological traits as mean values per each genotype ± SEM (standard errors of the mean) (Table 1), one may find that the highest fruit length was reported in hybrid selections of Tulameen × Autumn Bliss (T 25, 23.10 mm; T 38, 22.43 mm) and Glen Moy × Tulameen (GLT 15, 22.78 mm; GLT 18, 21.69 mm), while the lowest was reported in the TXOE 9 selection (Tulameen × Opal, 15.77 mm). The highest fruit diameter and size index values were recorded in hybrids of Tulameen × Autumn Bliss (T 38, 22.21 mm and 22.32), Glen Moy × Tulameen (GLT 15, 20.85 mm and 21.82), and Willamette × Veten (WXVE 8, 20.88 mm and 20.06), while the lowest values were observed in the parental cultivar Veten for both fruit diameter (15.60 mm) and size index (16.45). The highest mean value for shape index (1.36) was reported in the parental cultivar Tulameen and its hybrid T 25, with the next highest value of 1.23 observed in Glen Moy and the control cultivar Glen Ample; the lowest value (0.92) was reported in WXVE 8 (hybrid of Willamette × Veten).

3.2. The Traits That Contribute to the Production and Marketing Potential of Fruits

The best performance in terms of yield (Table 2) was reported in the parental cultivar Glen Prosen (0.47 kg/cane), Veten (0.46 kg/cane), and T 34 (Tulameen × Autumn Bliss, 0.43 kg/cane). Tulameen and Glen Ample registered 0.42 kg/cane. GLT 15 and GLT 18 (both belonging to Glen Moy × Tulameen hybridization) exhibited the highest mean weight (4.90 g and 4.86 g, respectively), while T 38 and T 25 (Tulameen × Autumn Bliss) were characterized by the highest mean number of drupelets per berry (105.91 and 102.58, respectively). Opal presented the lowest number of drupelets/fruit (50.09).
Three parental cultivars exhibited the highest quantitative values in terms of non-marketable fruits (Table 2), i.e., altered fruits (Glen Ample, 36.30 g/cane; Tulameen, 32.07 g/cane; Glen Moy, 31.93 g/cane). Except for fruit weight and the number of drupelets/fruit where the lowest mean values were reported in parental cultivars Titan and Opal (2.40 g and 50.09 g, respectively), most of the low values for the analyzed quantitative traits correspond to hybrids. The lowest means for yield and non-marketable fruits were noted in the TXPE 6 (Tulameen × Pathfinder) hybrid (0.19 kg/cane and 6.17 g/cane, respectively).

3.3. Chemical Compounds of Interest in the Fruits

Mean dry matter content in all 24 genotypes ranged between 10.00% (T 34 = Tulameen × Autumn Bliss) and 12.70% (Veten), and total soluble solids (TSS%) oscillated between 9.85% (T 38 = Tulameen × Autumn Bliss) and 8.62% (Willamette) (Table 3). Even if the amplitude of the variation does not seem very large, the differences between the genotypes were significant. With higher dry matter content, TXOE 13 (Tulameen × Opal), WXVE 8 (Willamette × Veten), and GLT 15 (Glen Moy × Tulameen) stood out, while Opal, GLT 18 (Glen Moy × Tulameen), and Titan had high soluble solid content.
The highest titratable acidity values (g/L tartaric acid) were recorded in Veten (2.65), Autumn Bliss (2.28), and Opal (2.22). Pectin content oscillated between 0.23% in WXVE 8 (Willamette × Veten) and 2.00% in GLT 18 (Glen Moy × Tulameen). The pH values ranged between 2.51 for GLT 18 (Glen Moy × Tulameen) and 4.47 for Veten.
Glucose content ranged between 1.61 and 2.72 g glucose/100 g (in GLT 12 and GLT 15, respectively). The two selections where the limits of variation in glucose content were observed belong to the same hybridization, namely Glen Moy × Tulameen (Table 4). In GLT 18 (Glen Moy × Tulameen), the highest mean content of fructose (7.34 g/100 g), sucrose (1.83 g/100 g), and reducing sugar (11.57 g/100 g) was observed. The intervals for mean values were 2.07–7.34 g/100 g, 1.13–1.83 g/100 g, and 5.01–11.57 g/100 g for fructose, sucrose, and reducing sugar, respectively. For these three parameters (fructose, sucrose, and reducing sugar), the highest means were observed in the GLT 18 selection, while the lowest were found in TXGPE 11 (Titan × Glen Prosen).

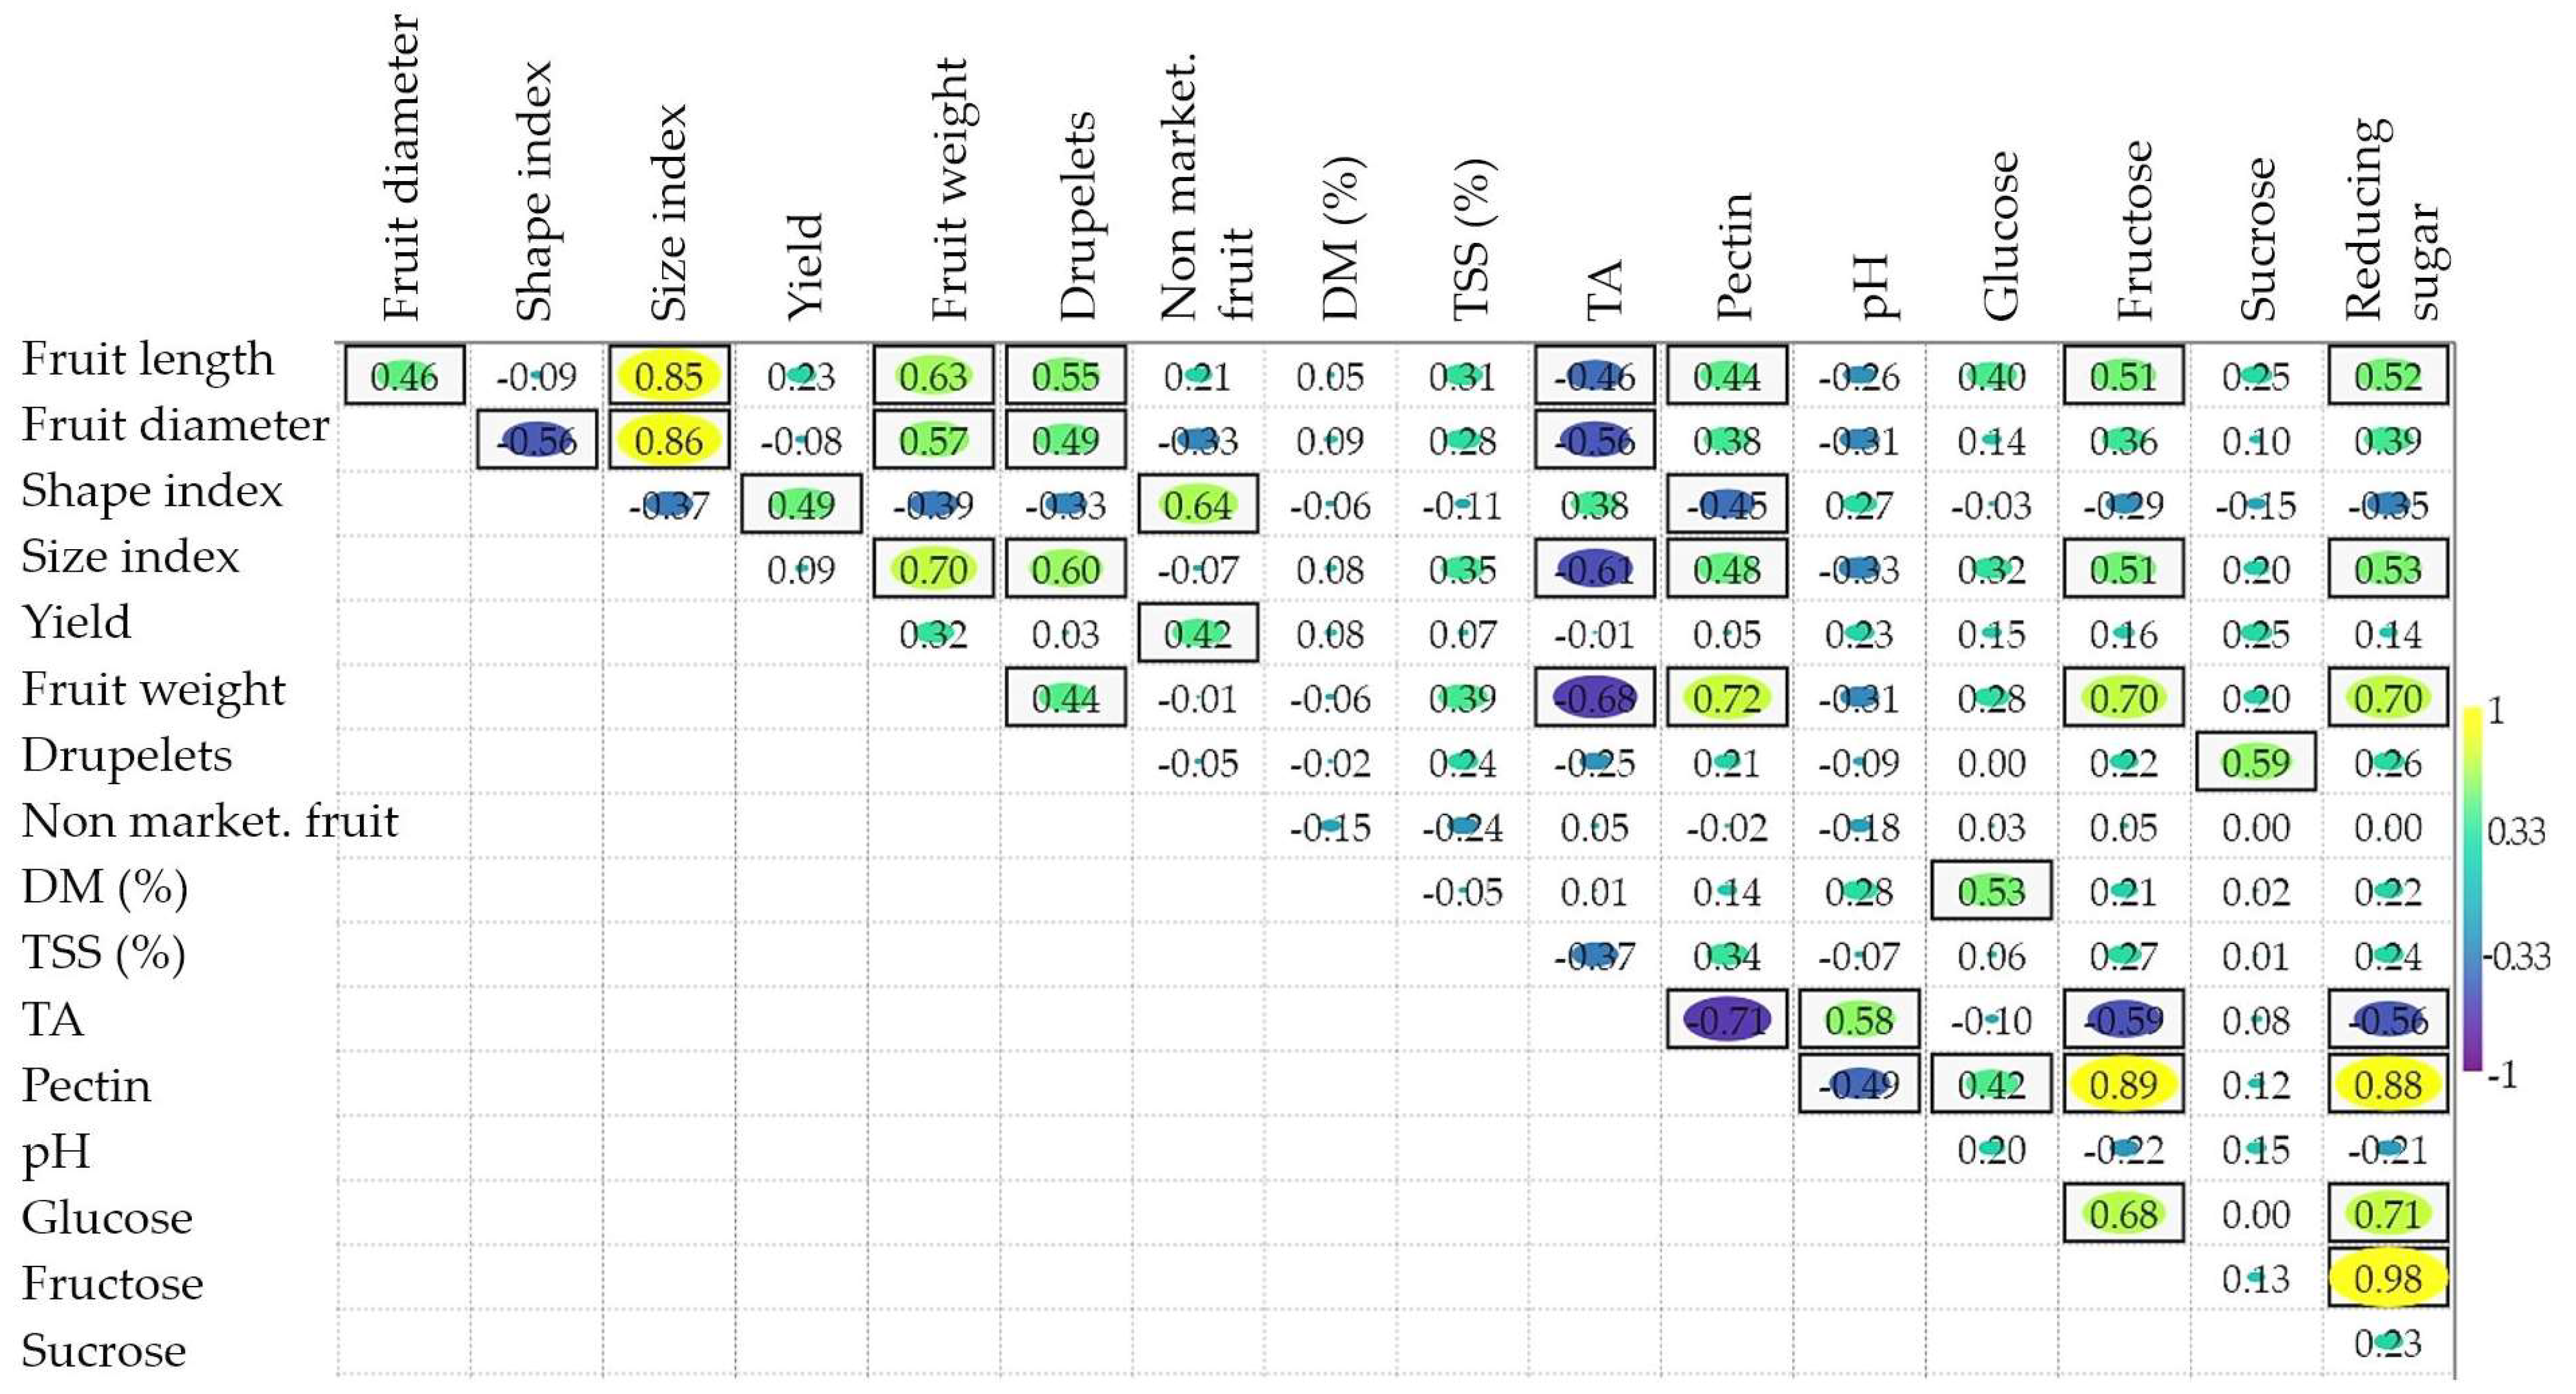
3.4. Correlations between Morphological Traits and Fruit Content in Useful Substances

The main environmental variables (i.e., average annual temperature and total annual precipitation) and the chemical composition of the fruits did not significantly correlate over the course of the three years of the study, hence the data are not reported. It was found that the correlation coefficient values were positive between temperature and the chemical composition of the fruits and negative between precipitation and the studied chemical components, even if they were not statistically assured (α = 0.05). Additionally, the majority of the correlation coefficients had values just below the threshold of significance. As in other species [56], the impact of climatic conditions on the chemical composition of fruits and the other metrics (fruit quality, yield, or responsiveness to abiotic or biotic stress factors) could be better highlighted by extending the study over a longer period of time.
The Pearson correlation coefficients calculated for the main morphological traits and the chemical composition of raspberry fruits indicate both positive and negative interrelations of different intensity (Figure 2). Significant positive correlations were identified between size index and fruit length, fruit diameter, fruit weight, number of drupelets, pectin, fructose, and reducing sugar. In contrast, the size index was negatively correlated with titratable acidity. Fruit length and fruit diameter were positively correlated with fruit weight and the number of drupelets. In addition, fruit length was positively correlated with pectin, fructose, and reducing sugar. Fruit weight was also positively correlated with drupelet number, pectin, fructose, and reducing sugar, but was instead negatively correlated with titratable acidity. Significant positive correlations were also recorded between glucose and dry matter and pectin, fructose was correlated with pectin and glucose, sucrose was correlated with drupelets, and reducing sugar was correlated with pectin, glucose, and fructose. Titratable acidity was negatively correlated with pectin, fructose, and reducing sugar.

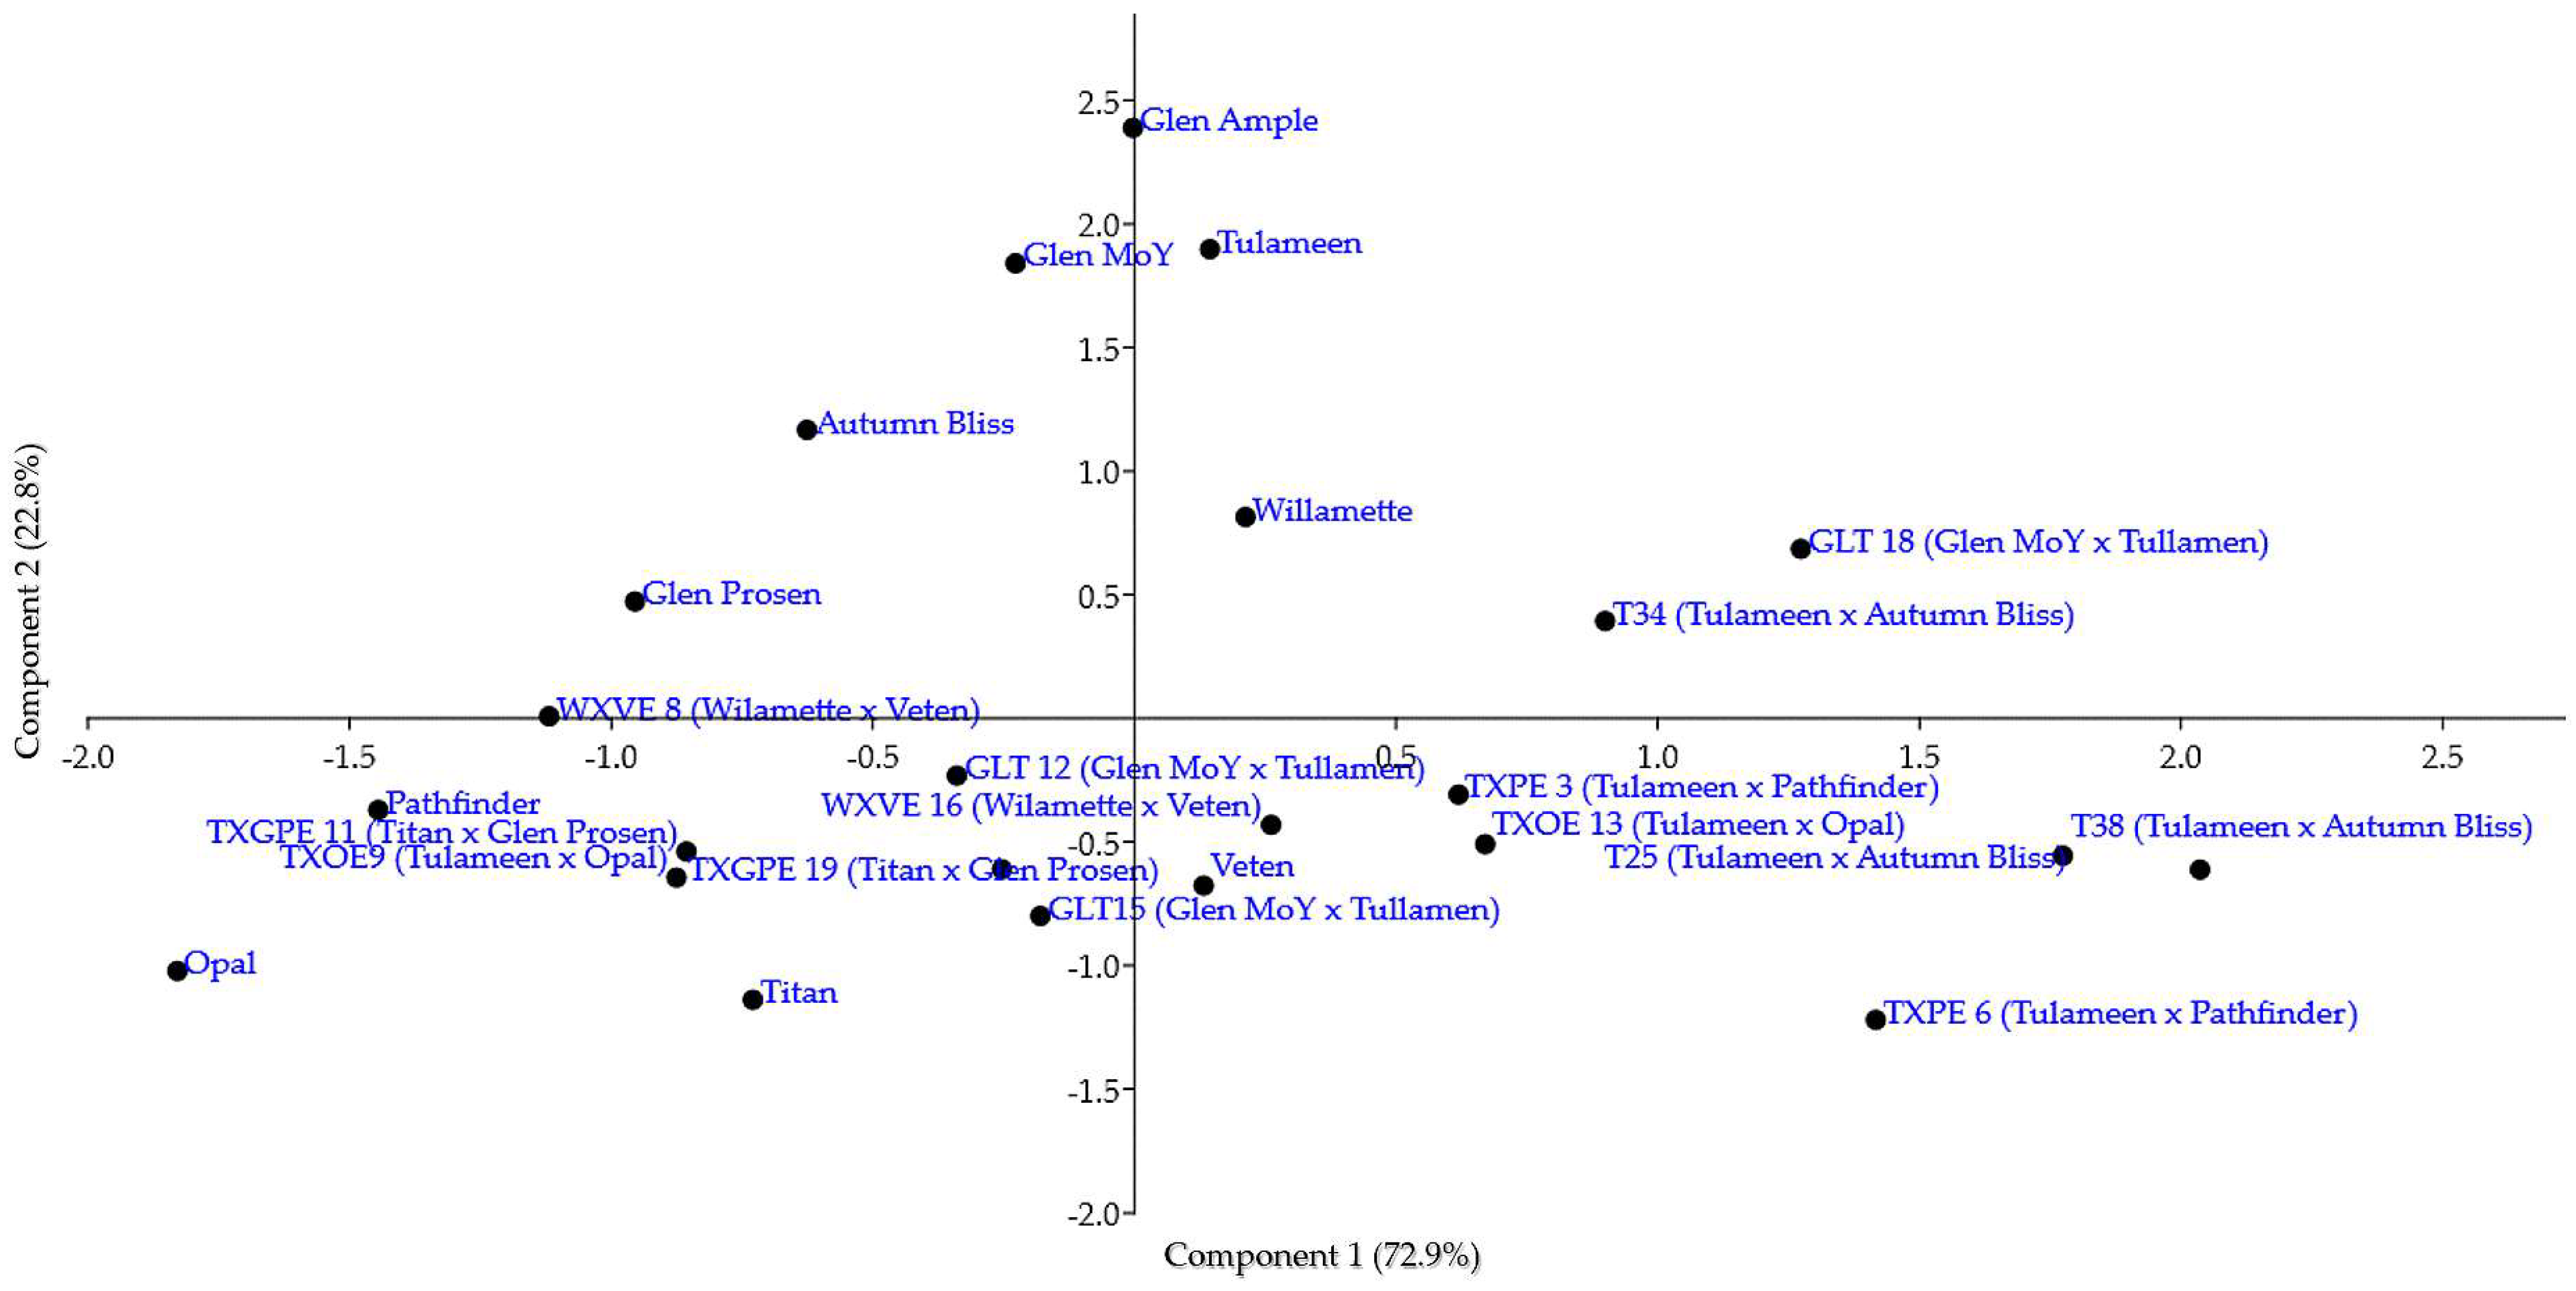
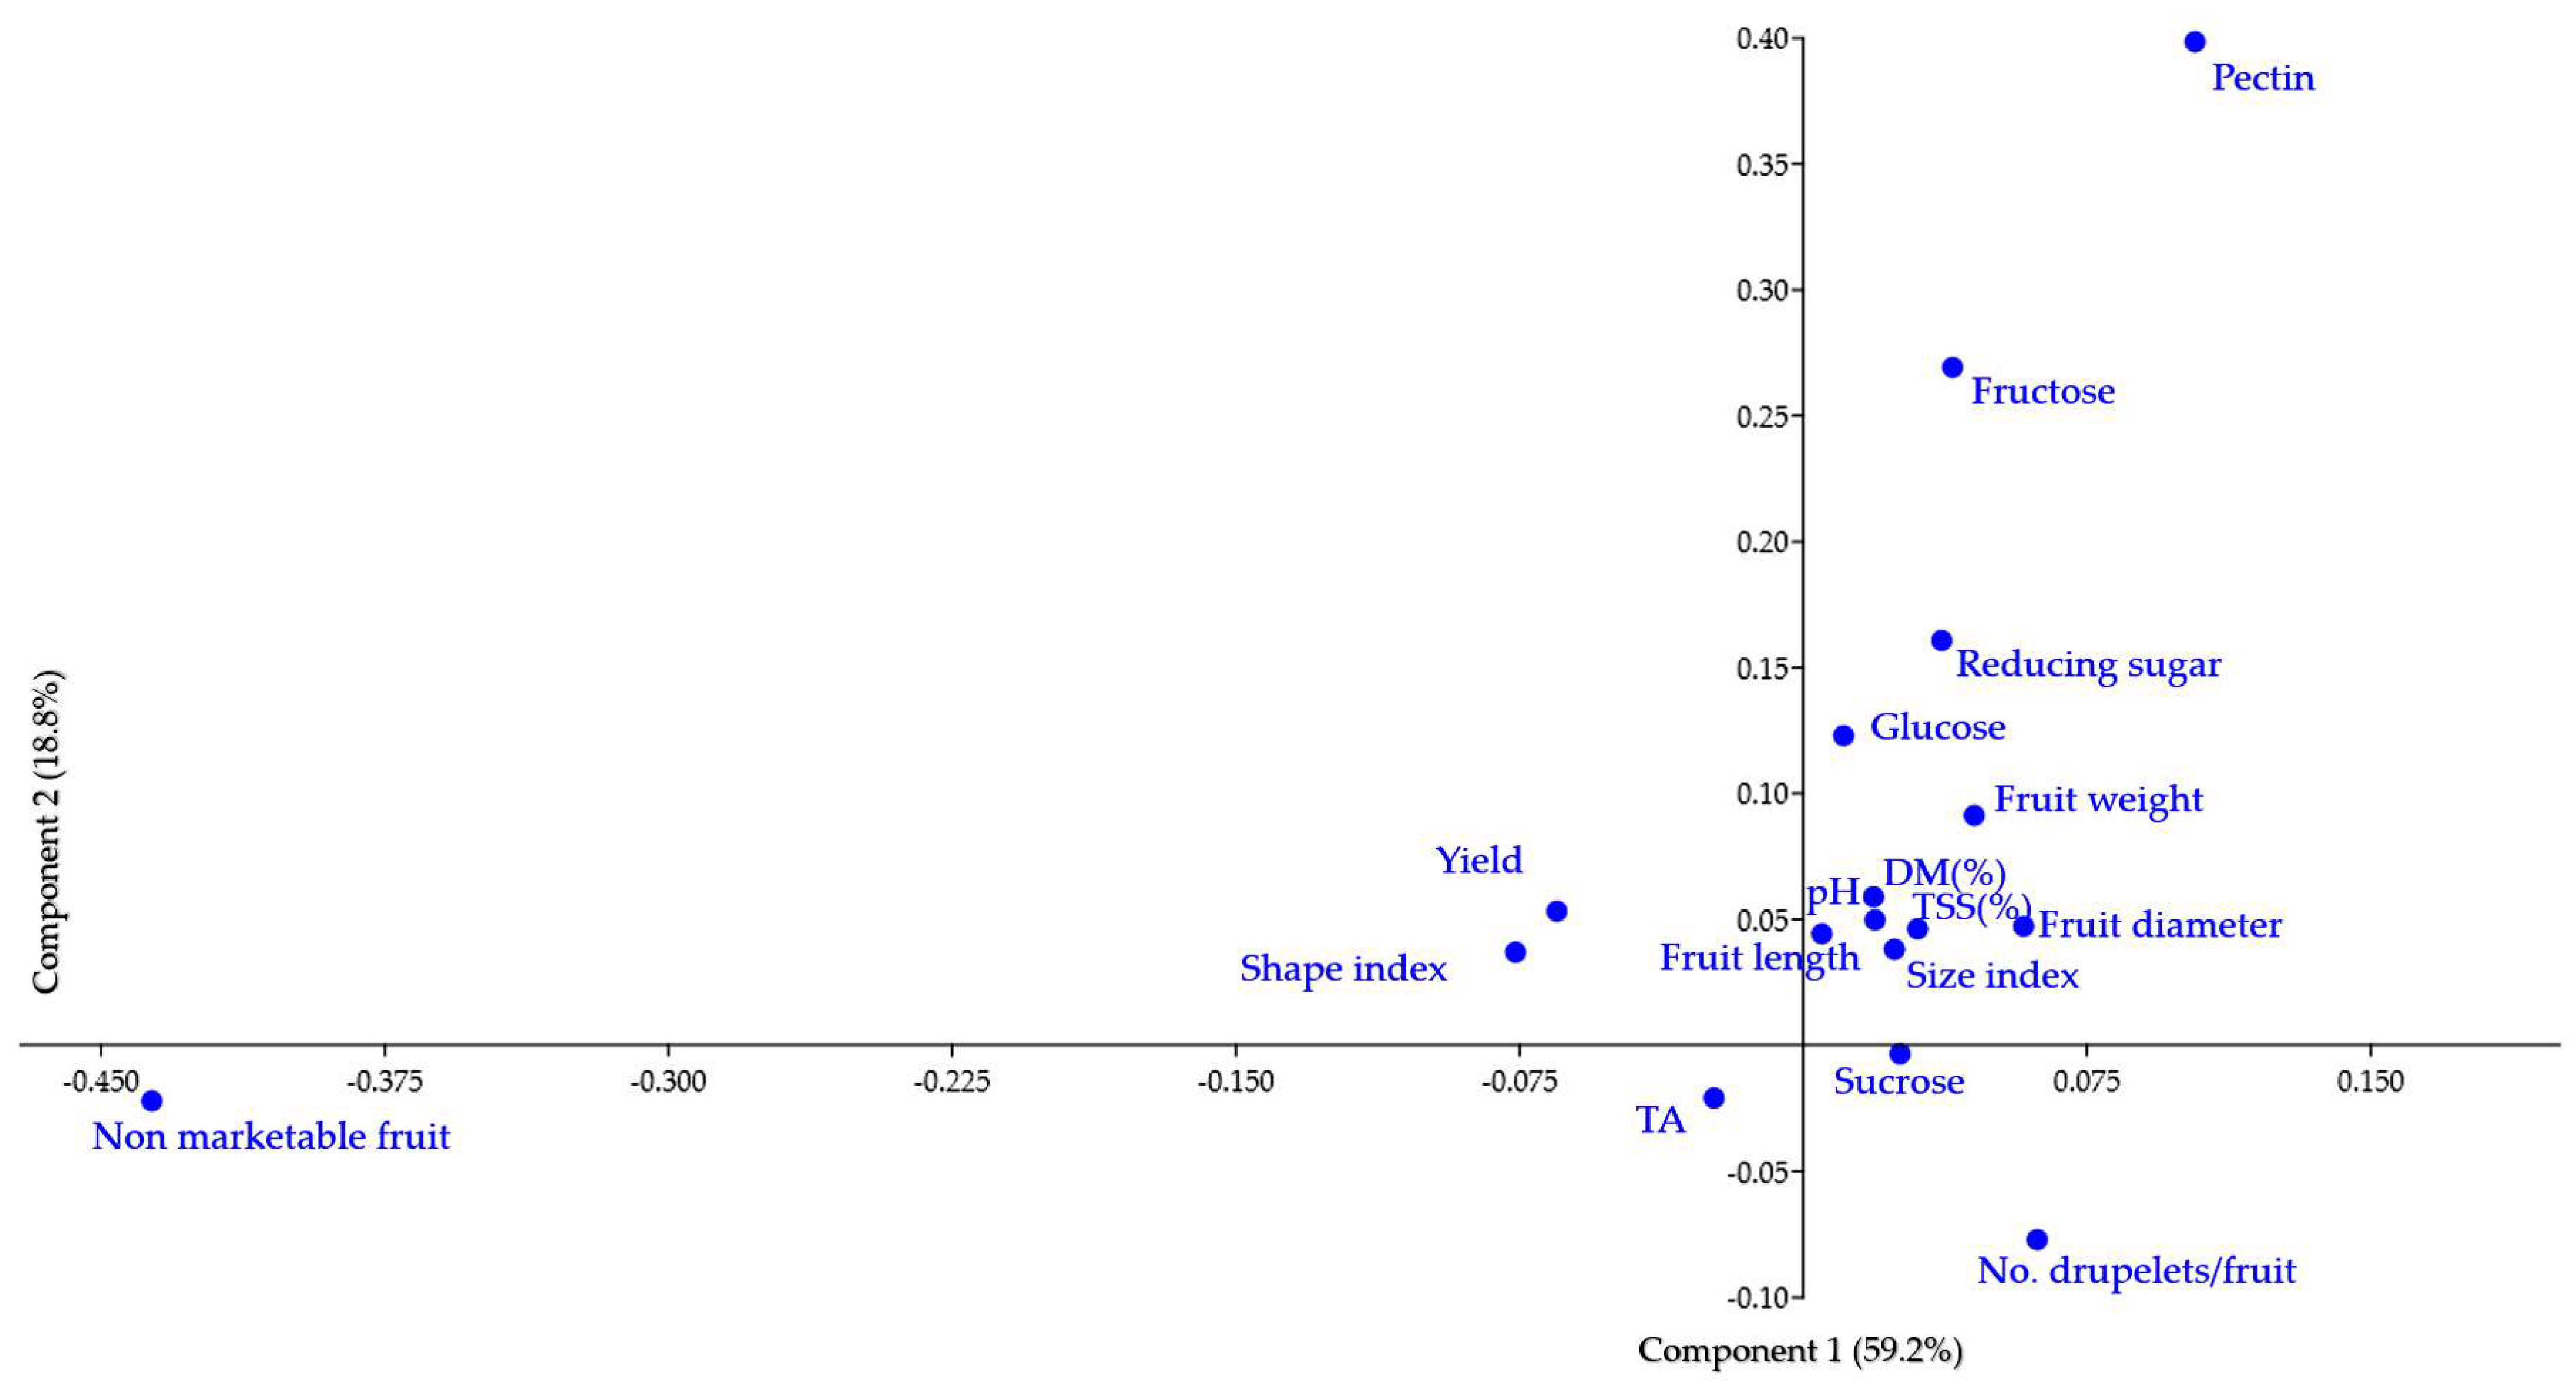
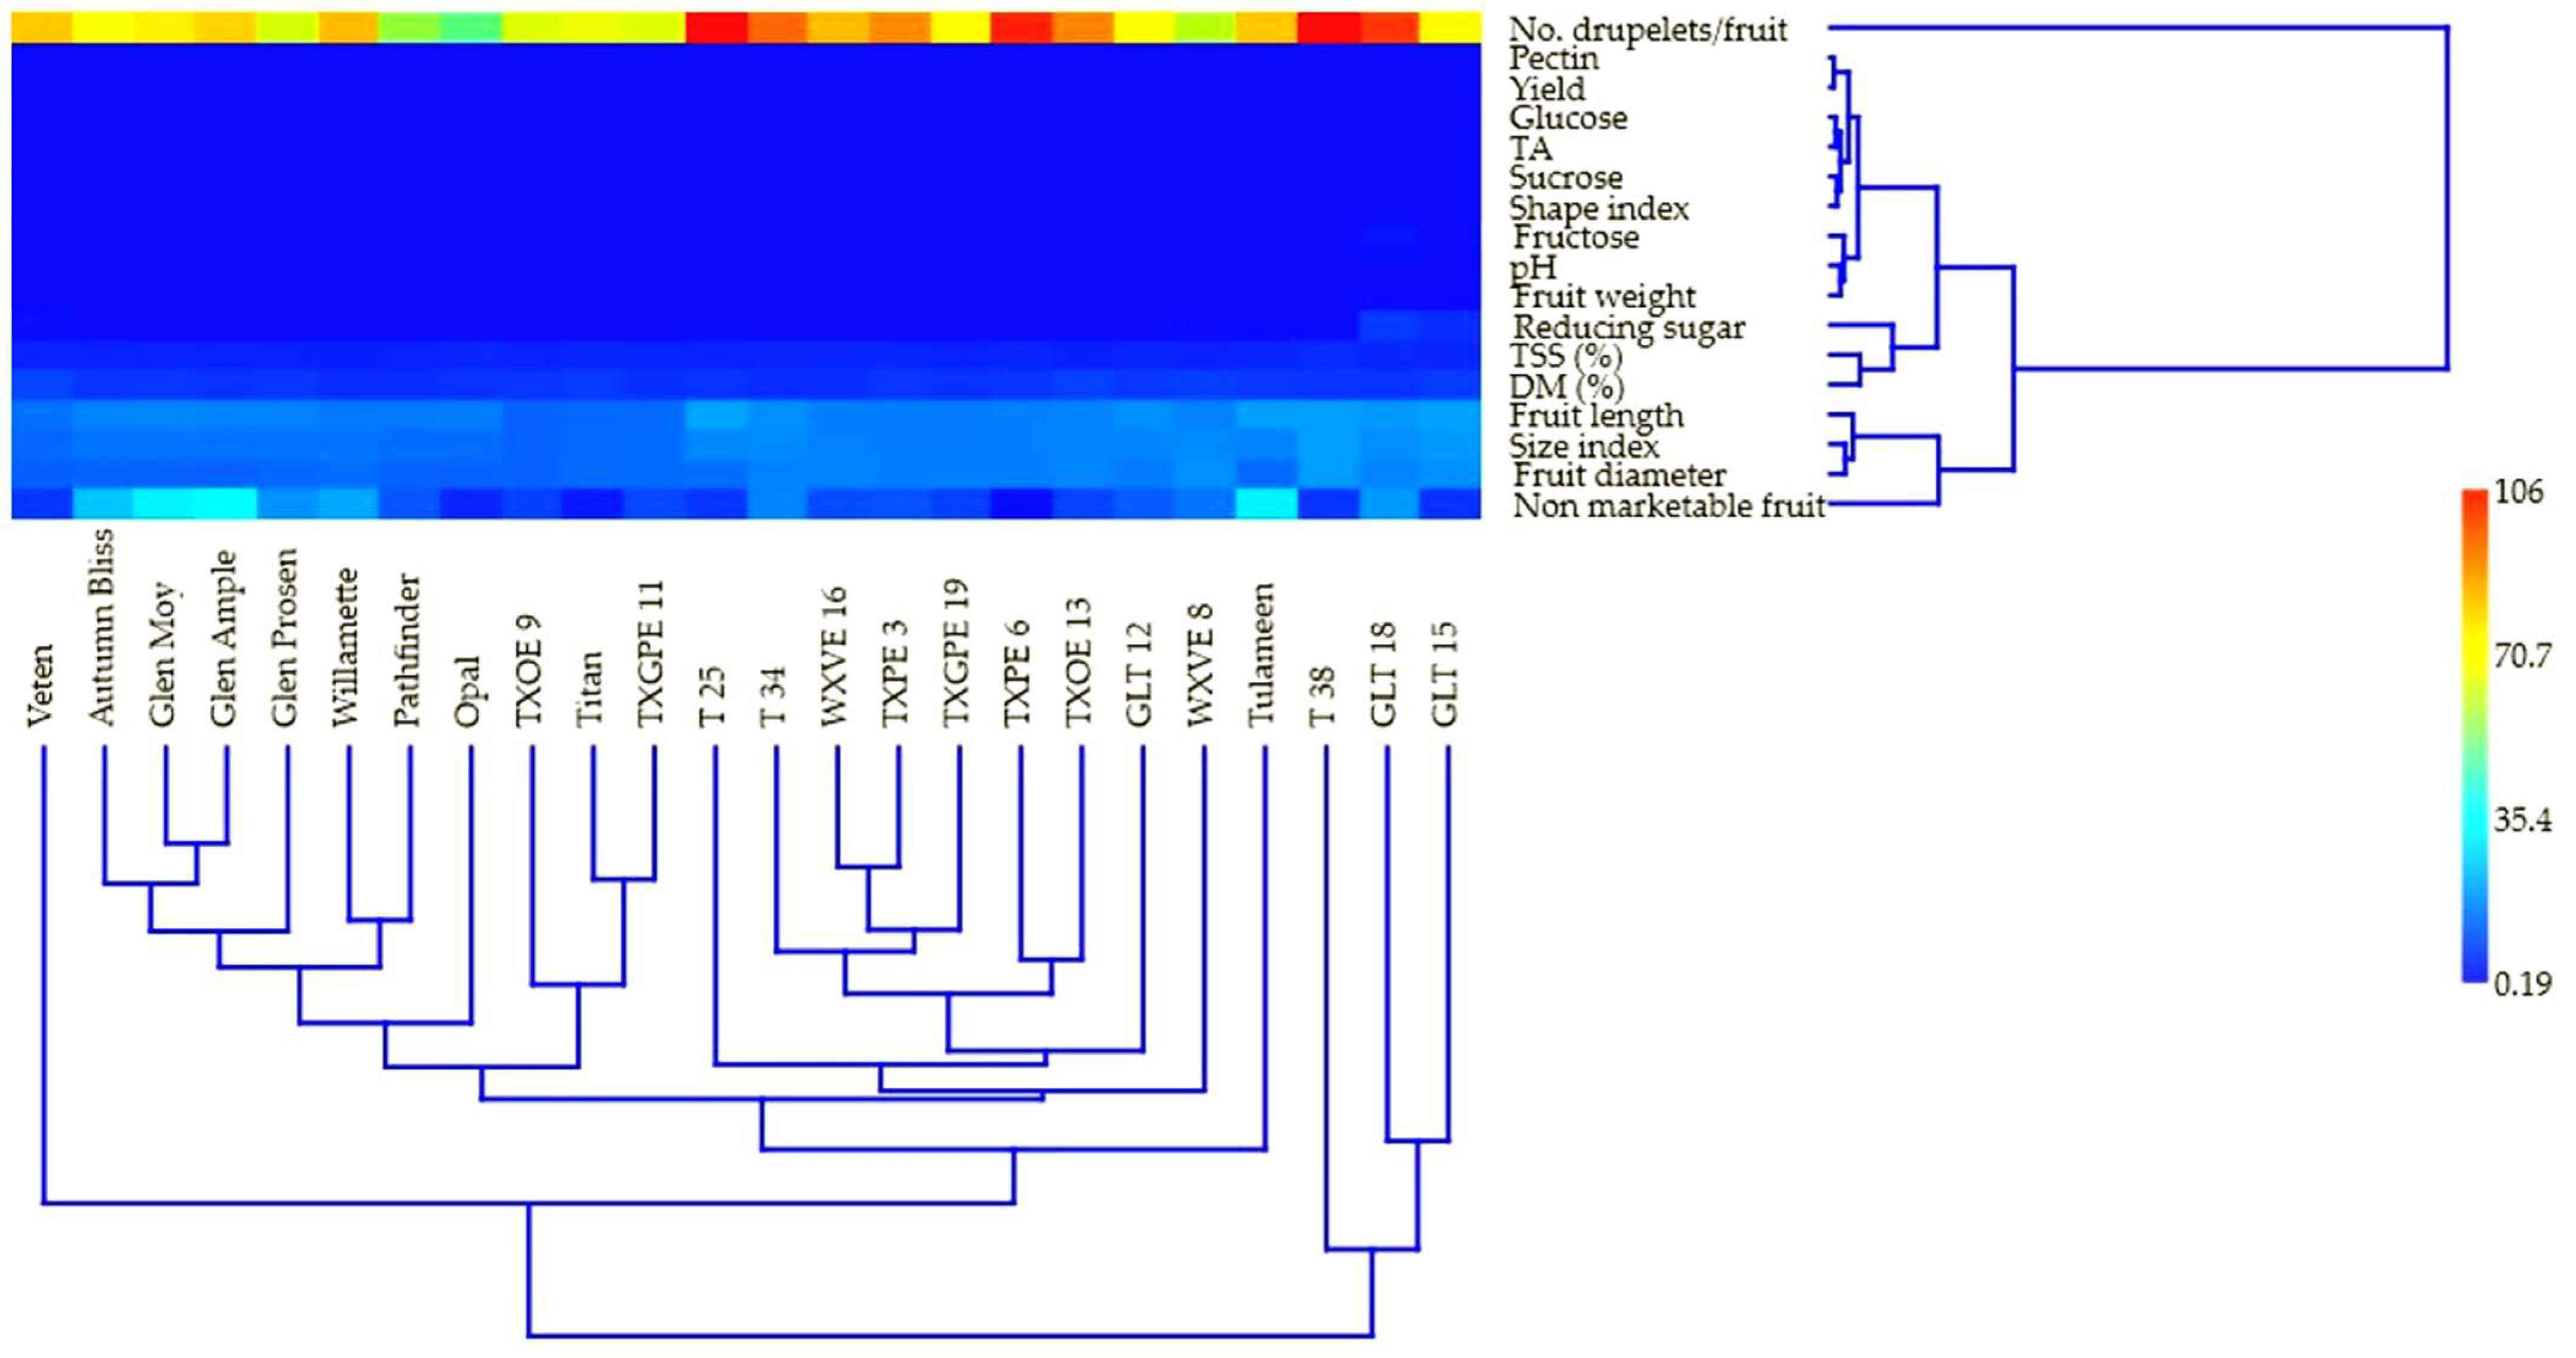
3.5. Multivariate Analysis

According to principal components analysis (PCA) applied to the 24 raspberry genotypes, from the two principal components identified (PC1 and PC2, reflecting the source of the most and second most variation, respectively), the first component is responsible for 72.9% of the total variance, while the second component is responsible for 22.8% (Figure 3). The two parents from the hybrid combination Tulameen × Autumn Bliss were grouped in the upper right and left quadrants, while their descendants were placed in the upper right quadrant (their descendant T 34) and bottom right quadrant (the clonal selections T 25 and T 38). Most of the descendant selections were also placed in this last section of the PCA (bottom right). In contrast to Tulameen, Titan and Opal, as well as some clonal selections, were located in the diagonally opposite quadrant in the lower left. Some cultivars used as parents, i.e., Glen Moy and Tulameen, seem relatively close to each other and Glen Ample (used as a control in the comparative trial of hybrid selections). Autumn Bliss, Willamette, and even Glen Prosen were placed close to them, being located in the central area above the horizontal axis. The group composed of these six cultivars, of which five were used as parents in artificial hybridizations, seems more distant from the other genotypes (both cultivars and hybrid selections) arranged in the lower part of the horizontal axis of the PCA.
In the correspondence analysis (CA) applied to the 17 characteristics analyzed in the 24 raspberry genotypes, the first component was responsible for 59.2% of the variance and the second was responsible for 18.8% (Figure 4). Most characteristics are grouped together in the upper right quadrant: fruit length, fruit diameter, fruit weight, size index, dry matter, total soluble solids, pH, glucose, reducing sugar, fructose, and pectin. The most distant characteristic among those analyzed is non-marketable fruit, located in an opposite quadrant (lower left) to most of the characteristics (upper right quadrant). Along with non-marketable fruit, in the same quadrant is also TA. In the two other opposite quadrants, there are two pairs of characteristics, i.e., yield and shape index in the top left and the number of drupelets per fruit and sucrose in the bottom right.
Multivariate analysis (hierarchical clustering using paired group UPGMA, Gover similarity index) performed with the mean values of all morphological and chemical parameters of raspberry fruits highlights interesting relationships both for the 24 genotypes (column dendrogram) and for the closeness or distance of the 17 analyzed characteristics (row dendrogram), which is also reflected in the heatmap in Figure 5.
Of the two largest clusters in the column dendrogram of genotypes, the one on the right is represented by only three descendant selections, of which the two that are placed closer together in a common subcluster (GLT 18 and GLT 15) are even from the same hybrid combination (Glen Moy × Tulameen). In this case, their genetic kinship is also confirmed by the similar phenotypes for the analyzed characteristics. The large cluster on the left has two main branches, one of which contains only one genotype, the cultivar Veten, which appears the furthest from all the genotypes located on the right branch. The last one also has two branches, with the one on the right represented only by Tulameen and the one on the left possessing very complex subclusters. There are two main subclusters, each with different secondary ramifications. It is interesting that the main subcluster on the left includes all the other cultivars used as parents, except for those that stood out due to their previously mentioned distancing (Tulameen and Veten). In the subcluster on the right, nine selections are differentiated into different branches and subclusters, though they do not reside here on the basis of close genetic kinship (i.e., full siblings) as the selections from the last cluster did. It is worth highlighting the position of the Glen Ample and Glen Moy cultivars in the same subcluster. In addition, the multivariate analysis highlighted the close proximity between them, even if their genetic origin is different. However, not far from Glen Ample is Glen Prosen, which is its parent. Interestingly, compared to Glen Prosen, Tulameen, one of its hybrid descendants, is located a great distance away.
In the row dendrogram of the analyzed characteristics of the berries, there are two main clusters, with the upper one being represented by a single trait that is strongly distanced from the others (the number of drupelets per fruit). The second cluster has two subclusters, each with subdivisions. In the one below, the trait that stands out from the rest in terms of distance is non-marketable fruit, which is placed in a subcluster next to fruit diameter, size index (both being very closely placed), and fruit length. Some features are located very close to each other and form less predictable pairs, such as total soluble solids and dry matter, pectin and yield, glucose and titratable acidity, sucrose and shape index, and pH and fruit weight.

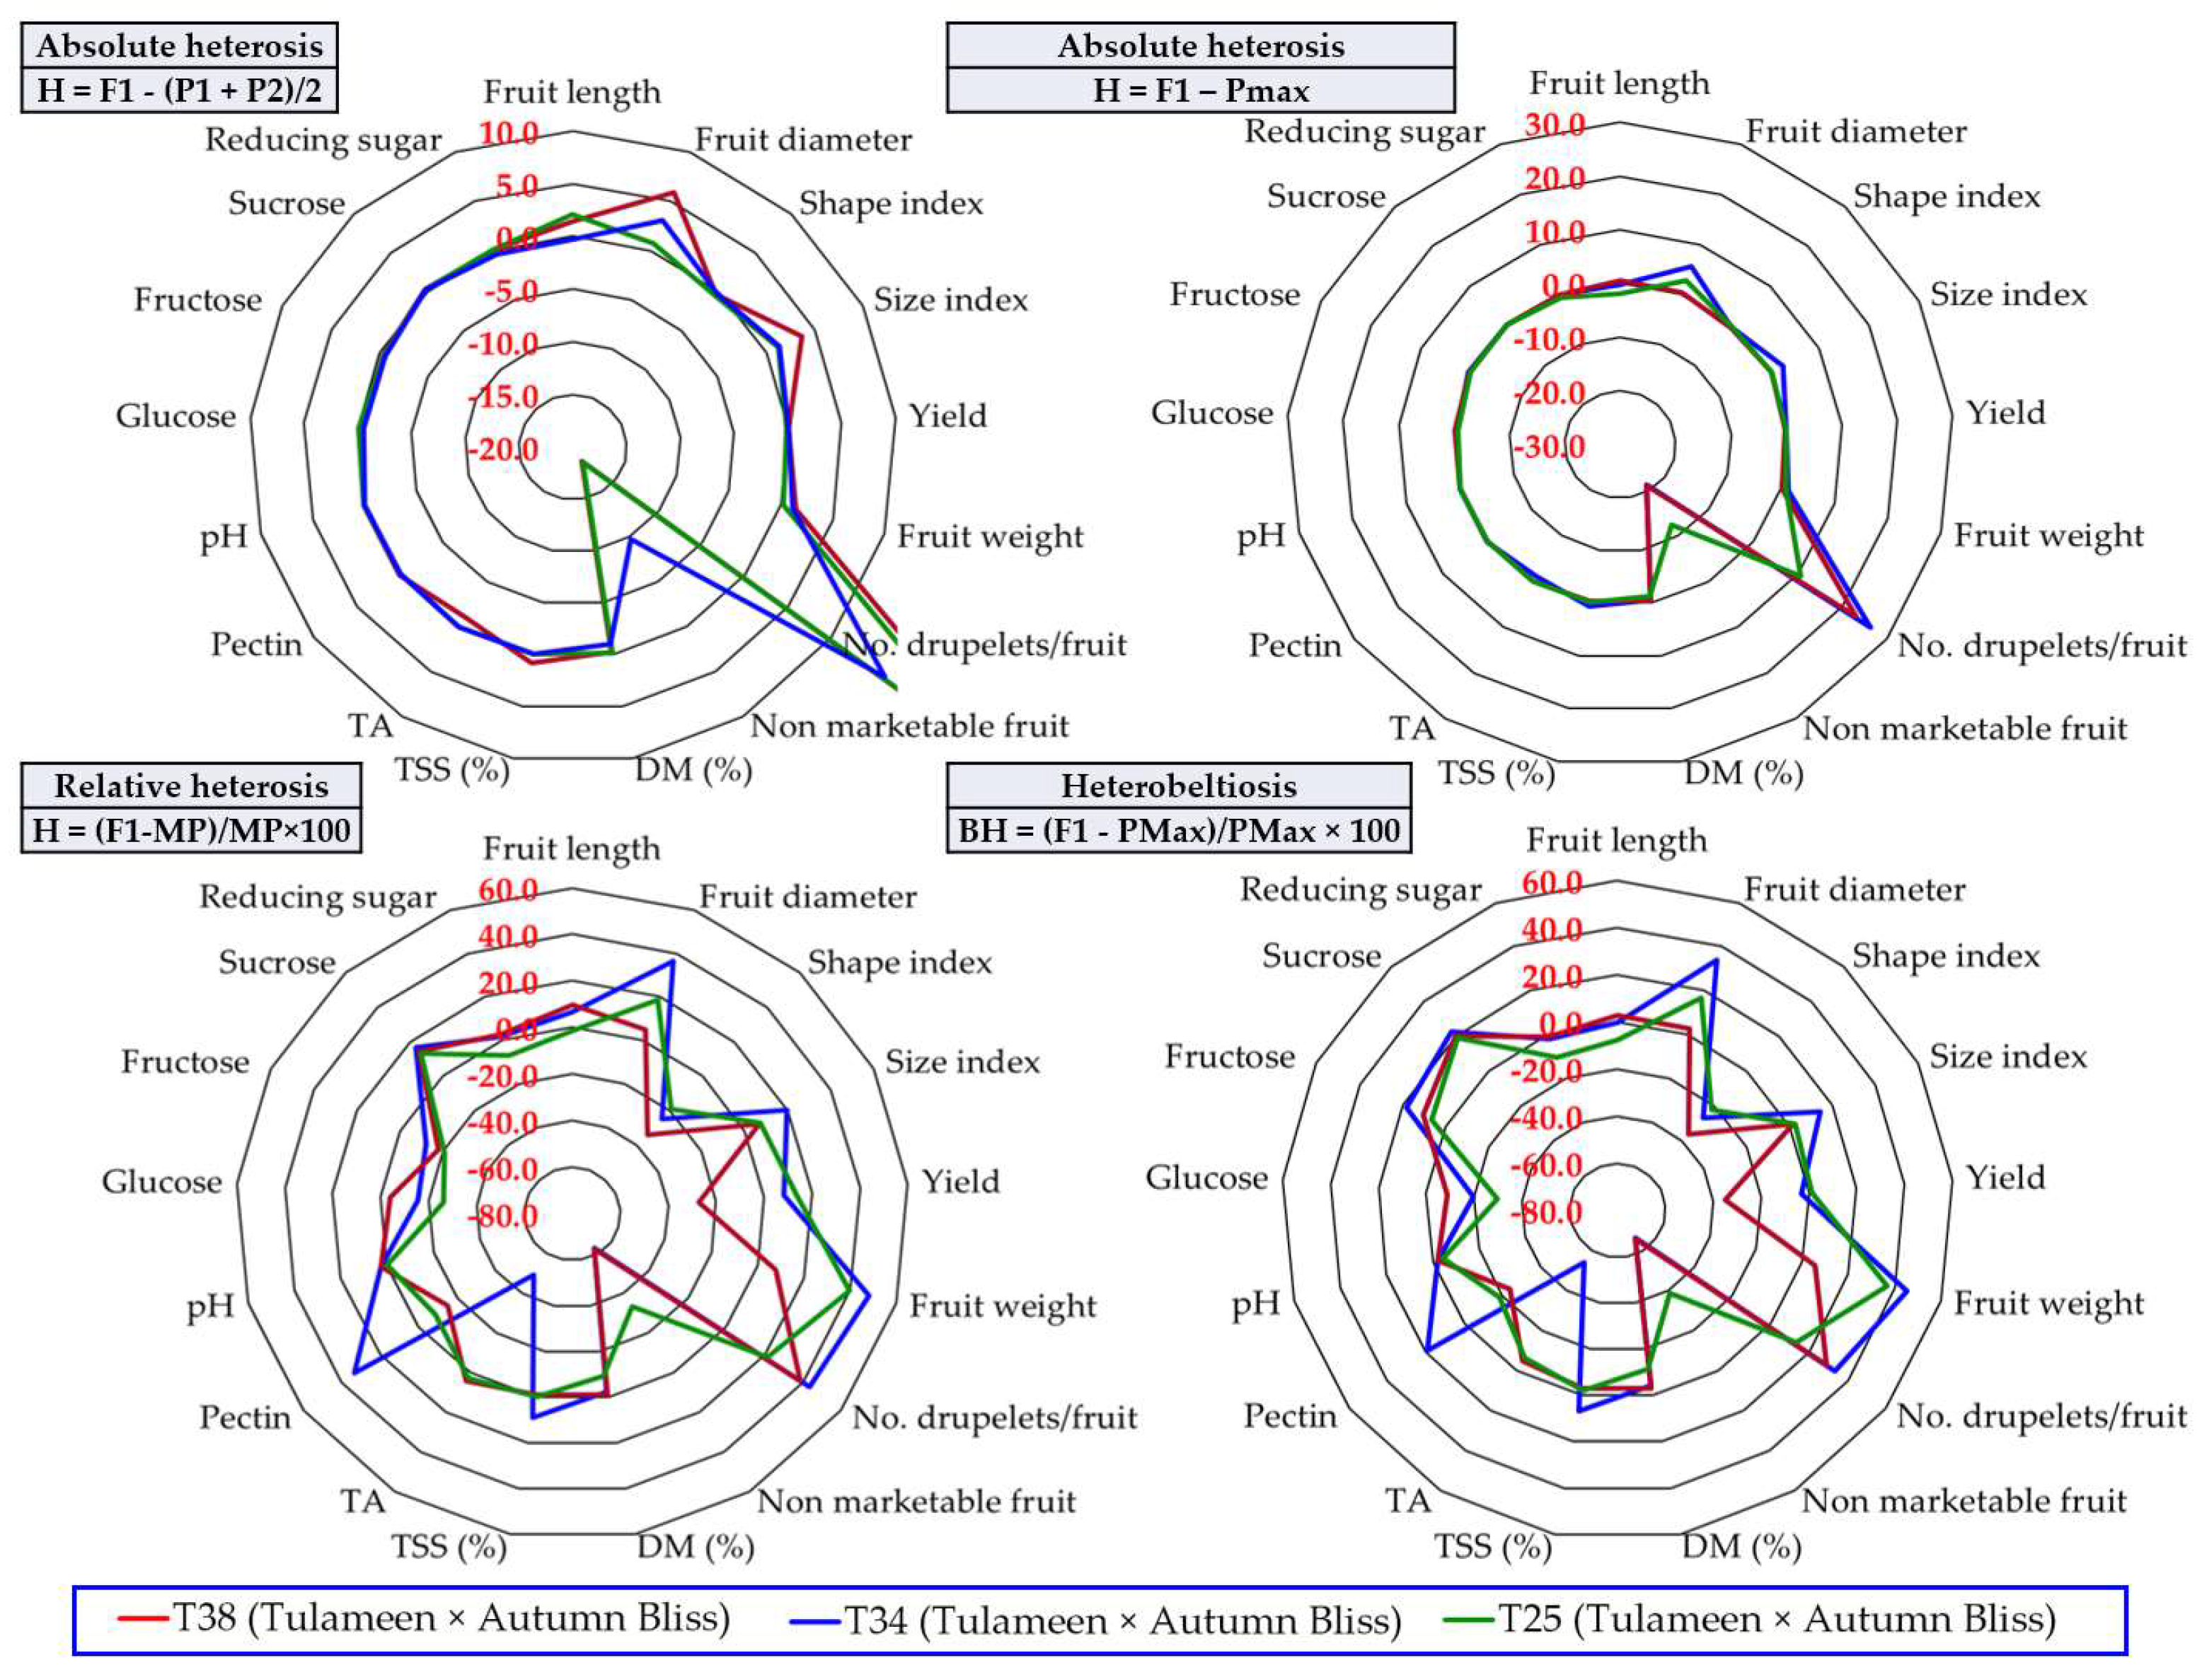
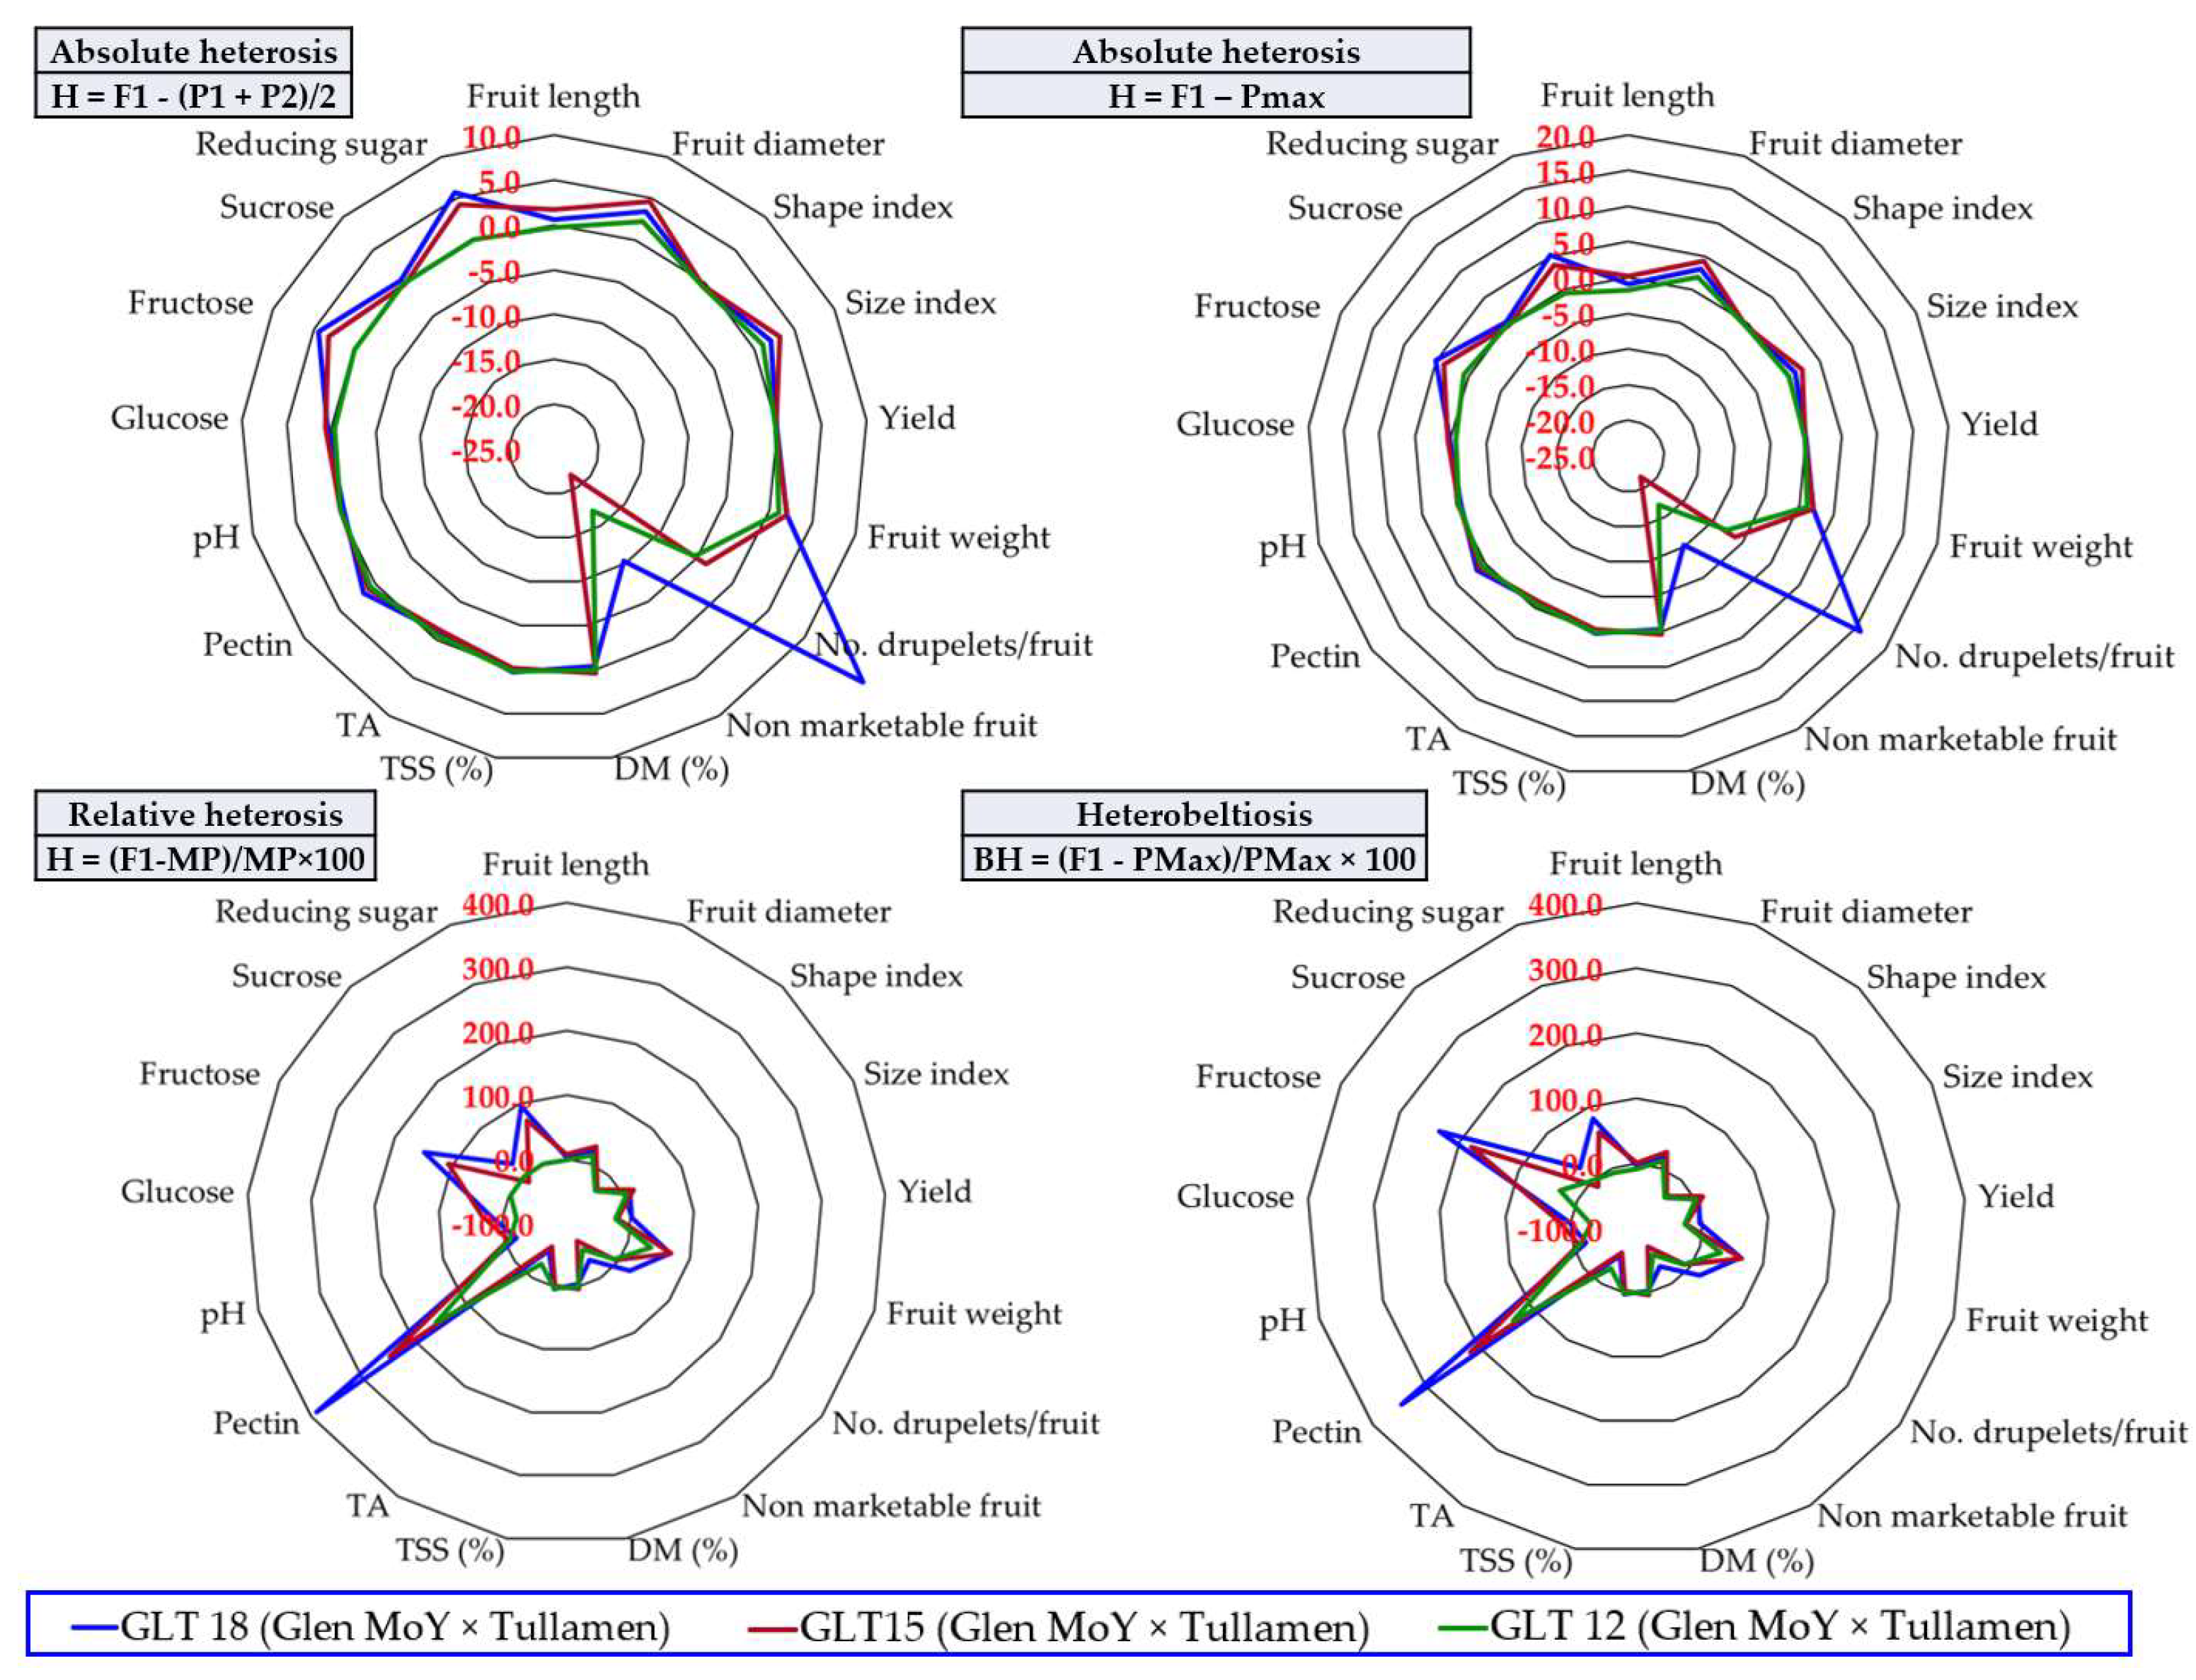
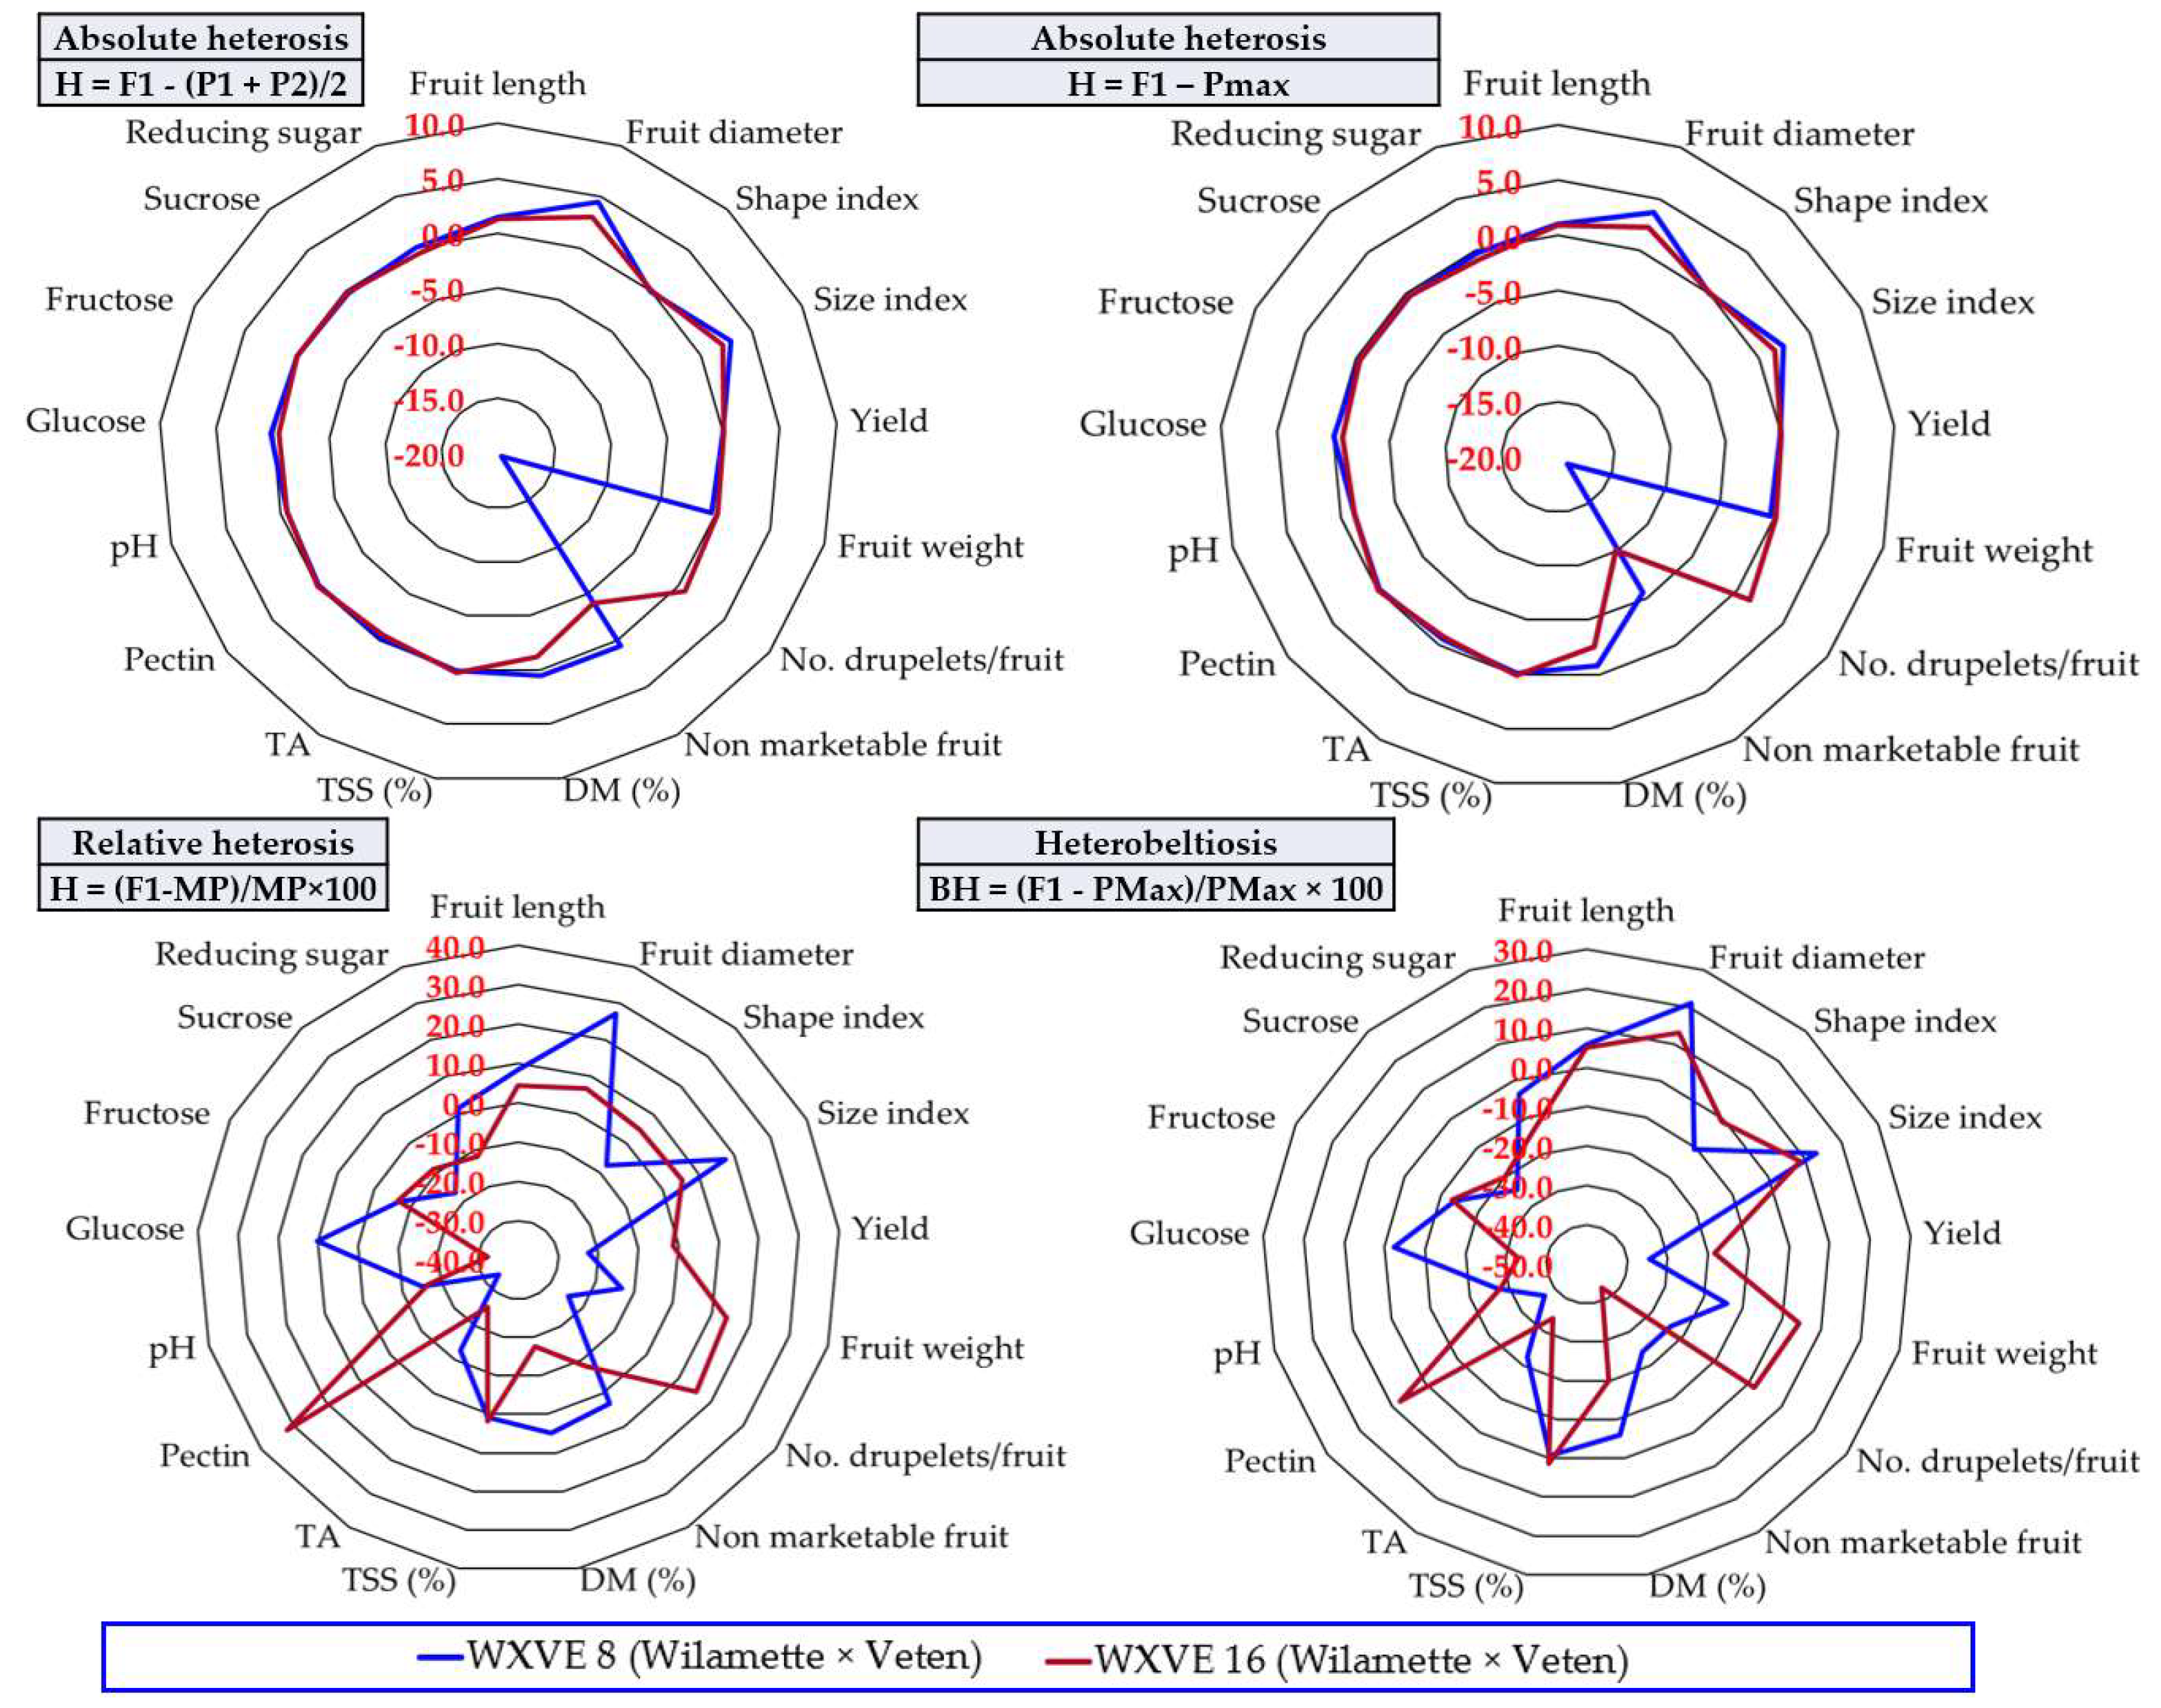
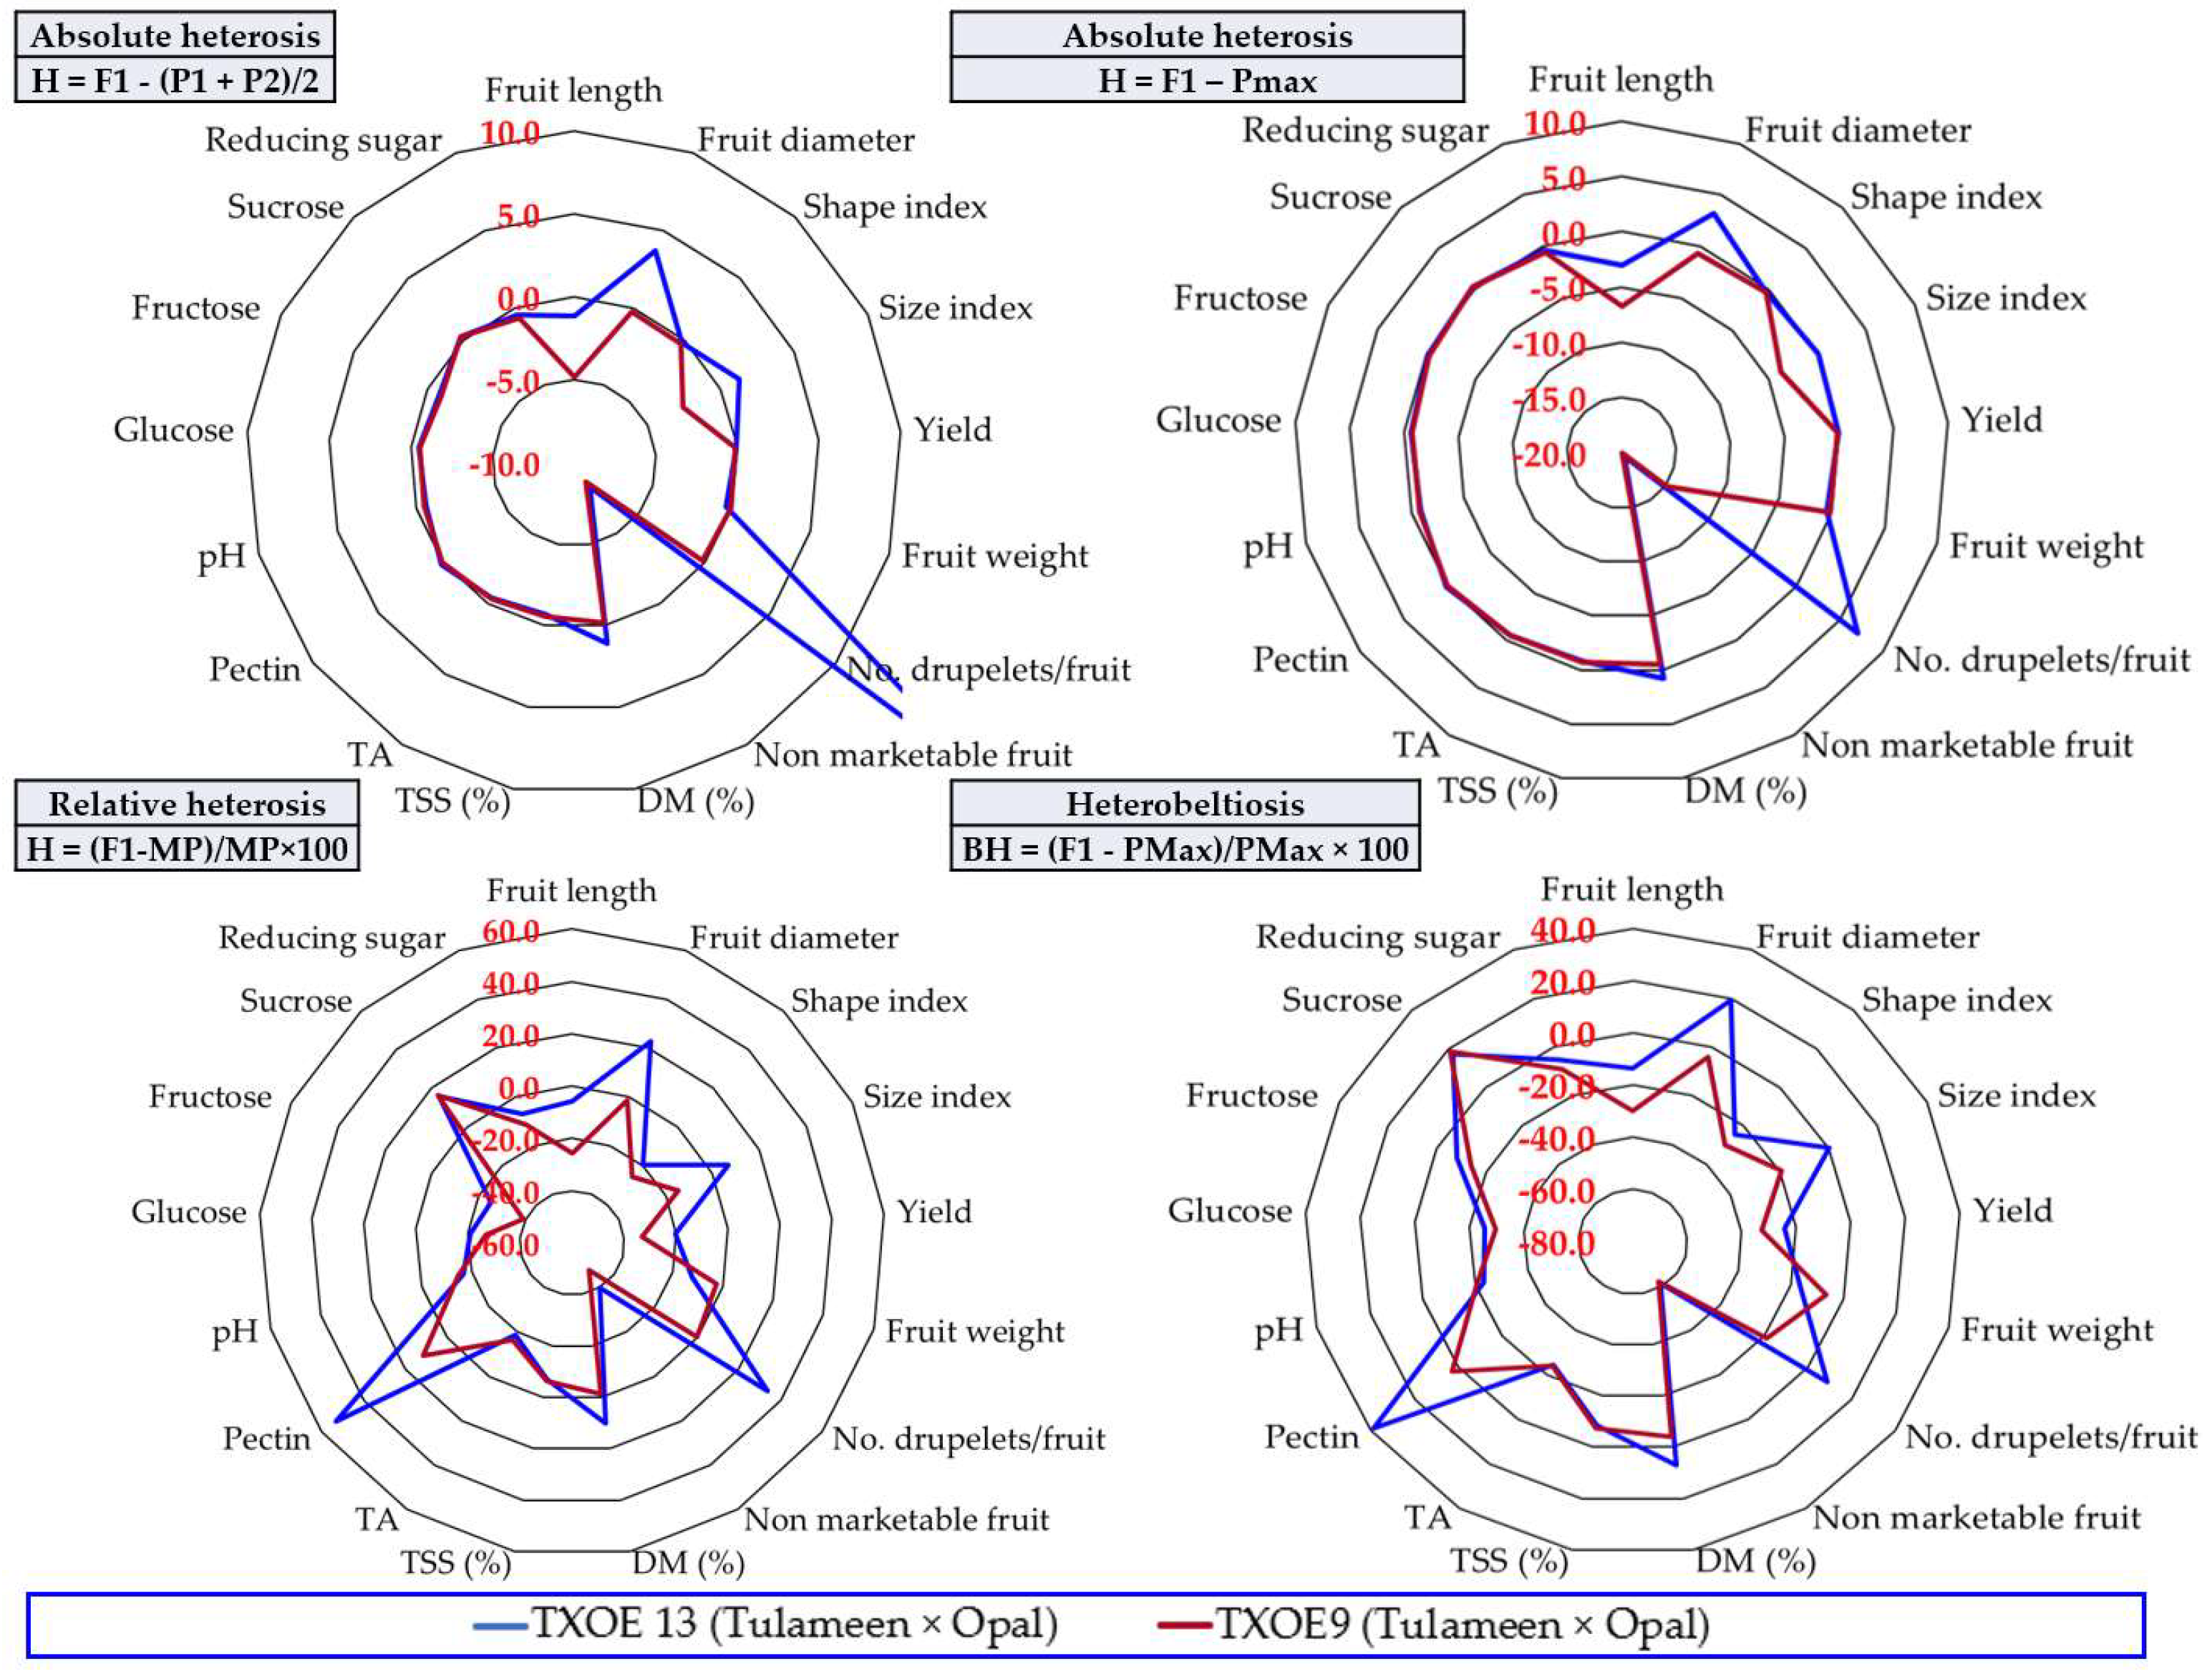
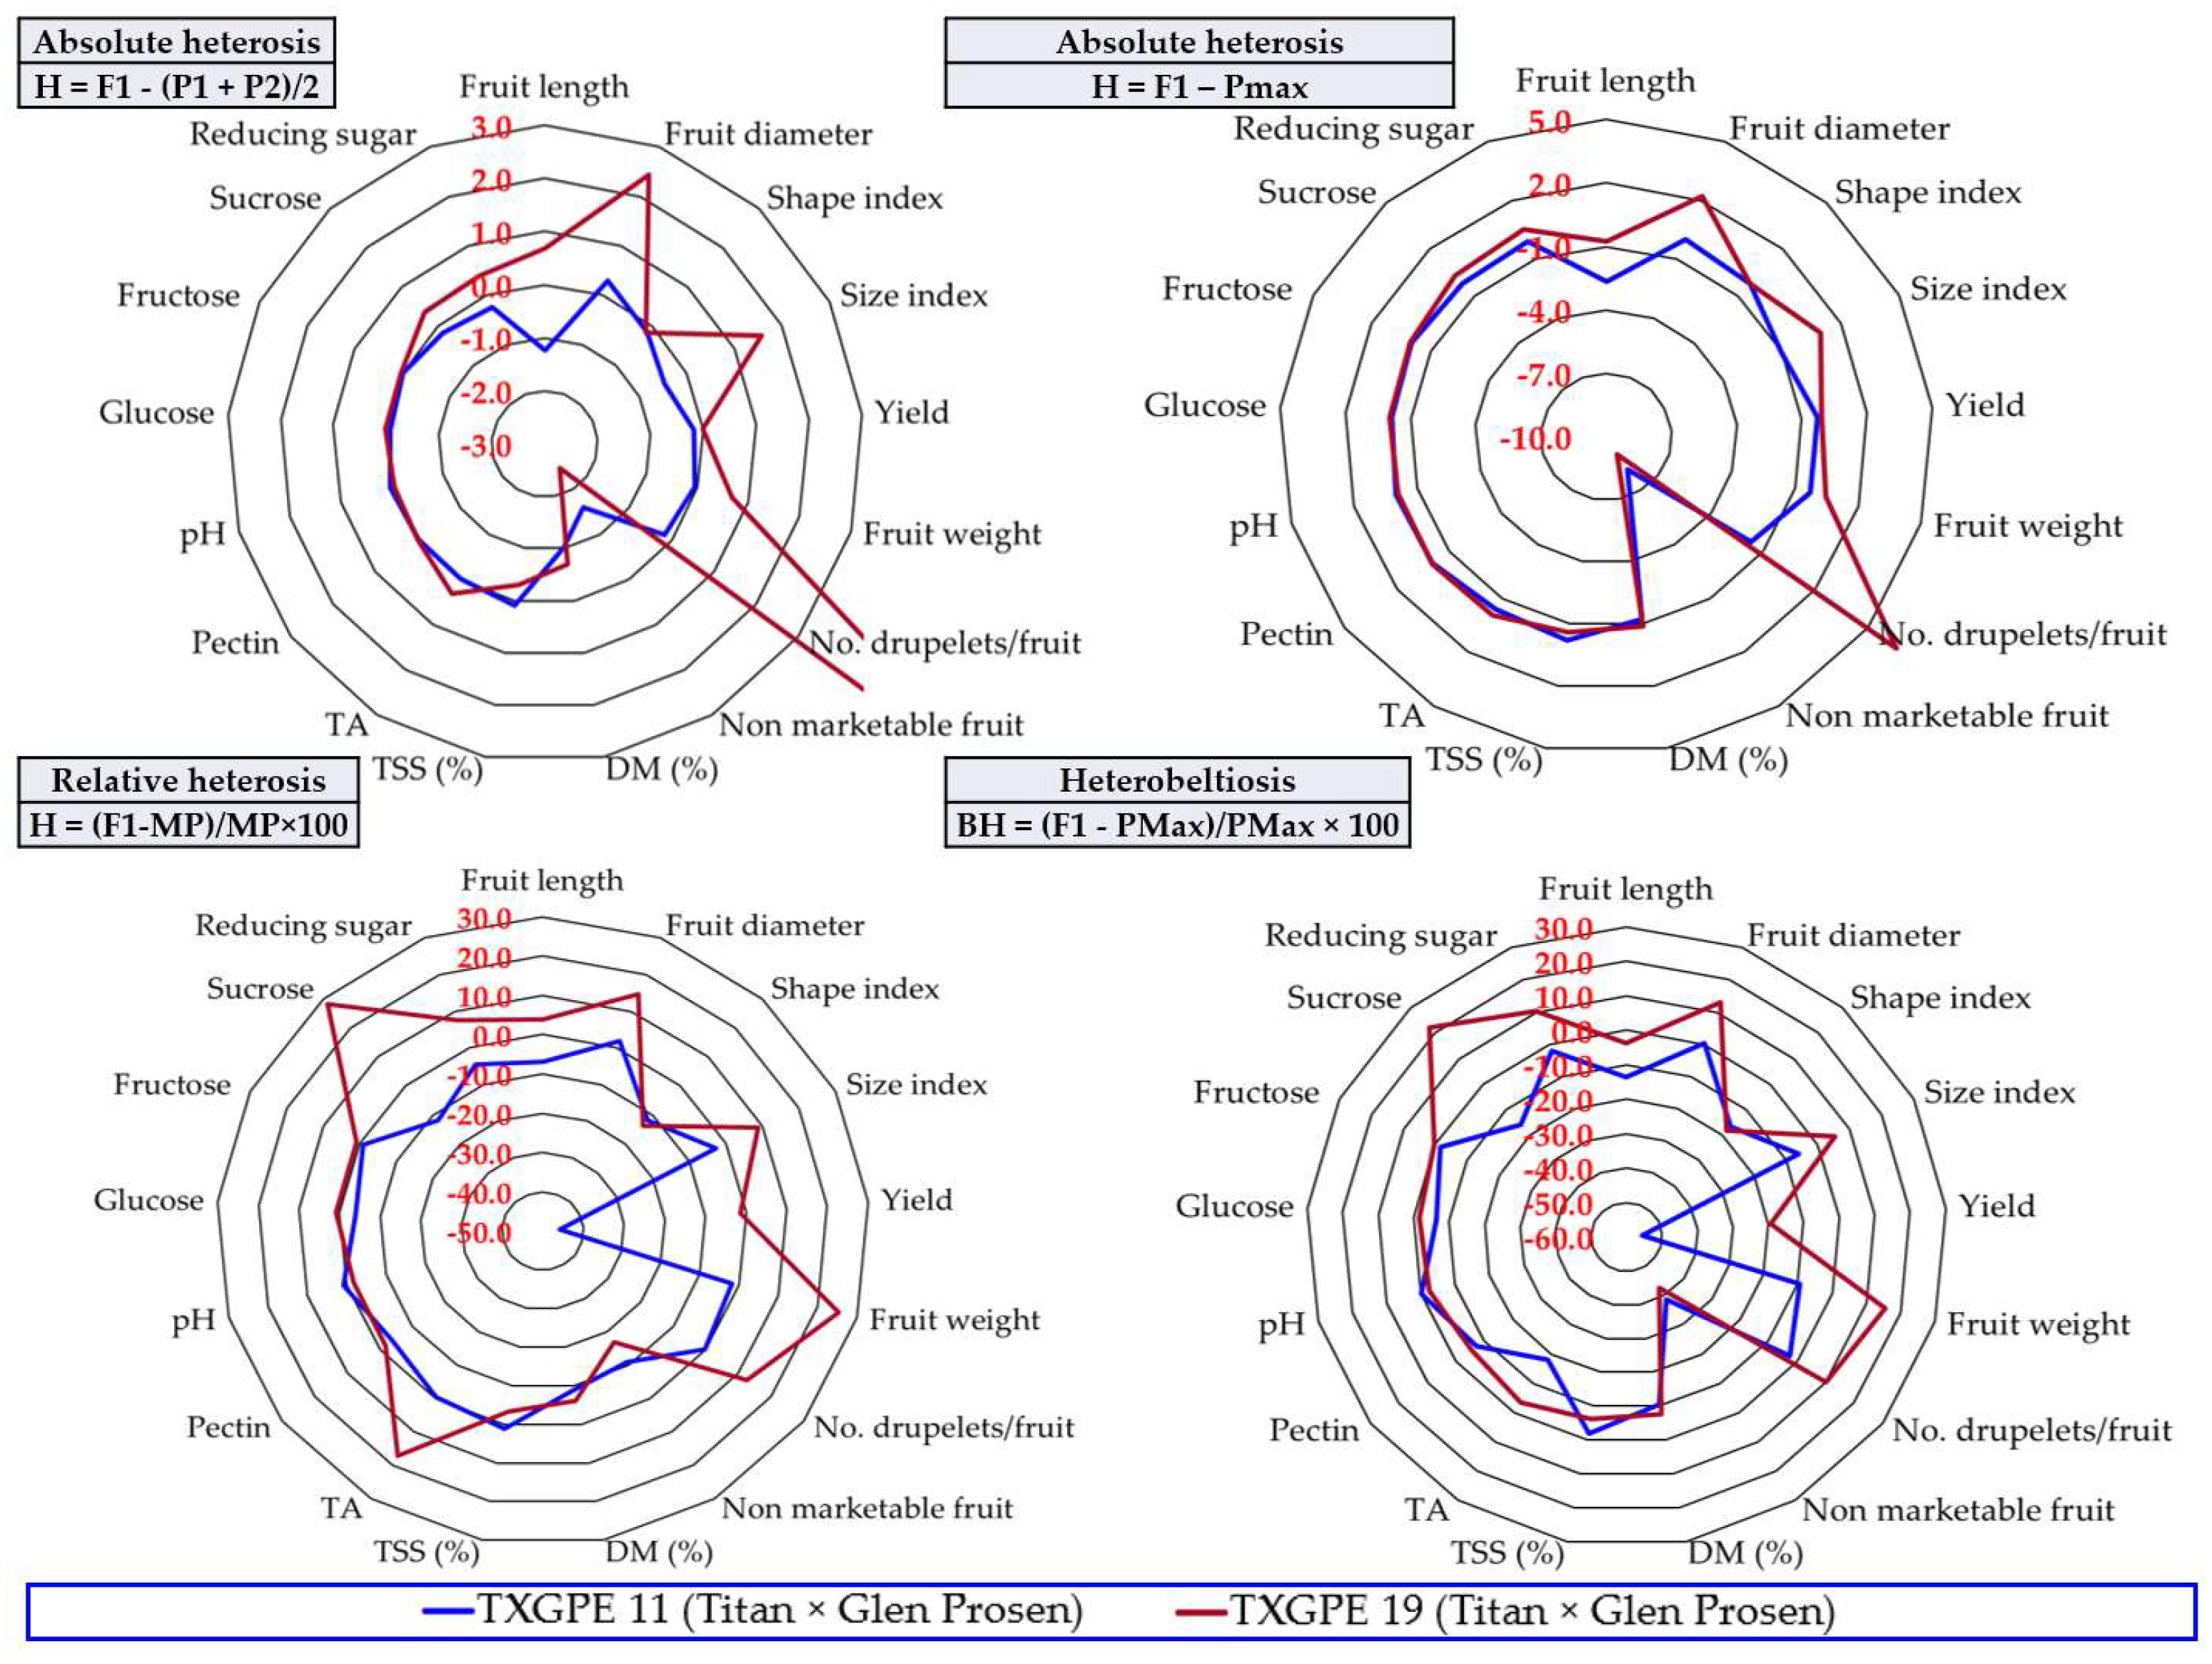
3.6. The Heterosis Effect
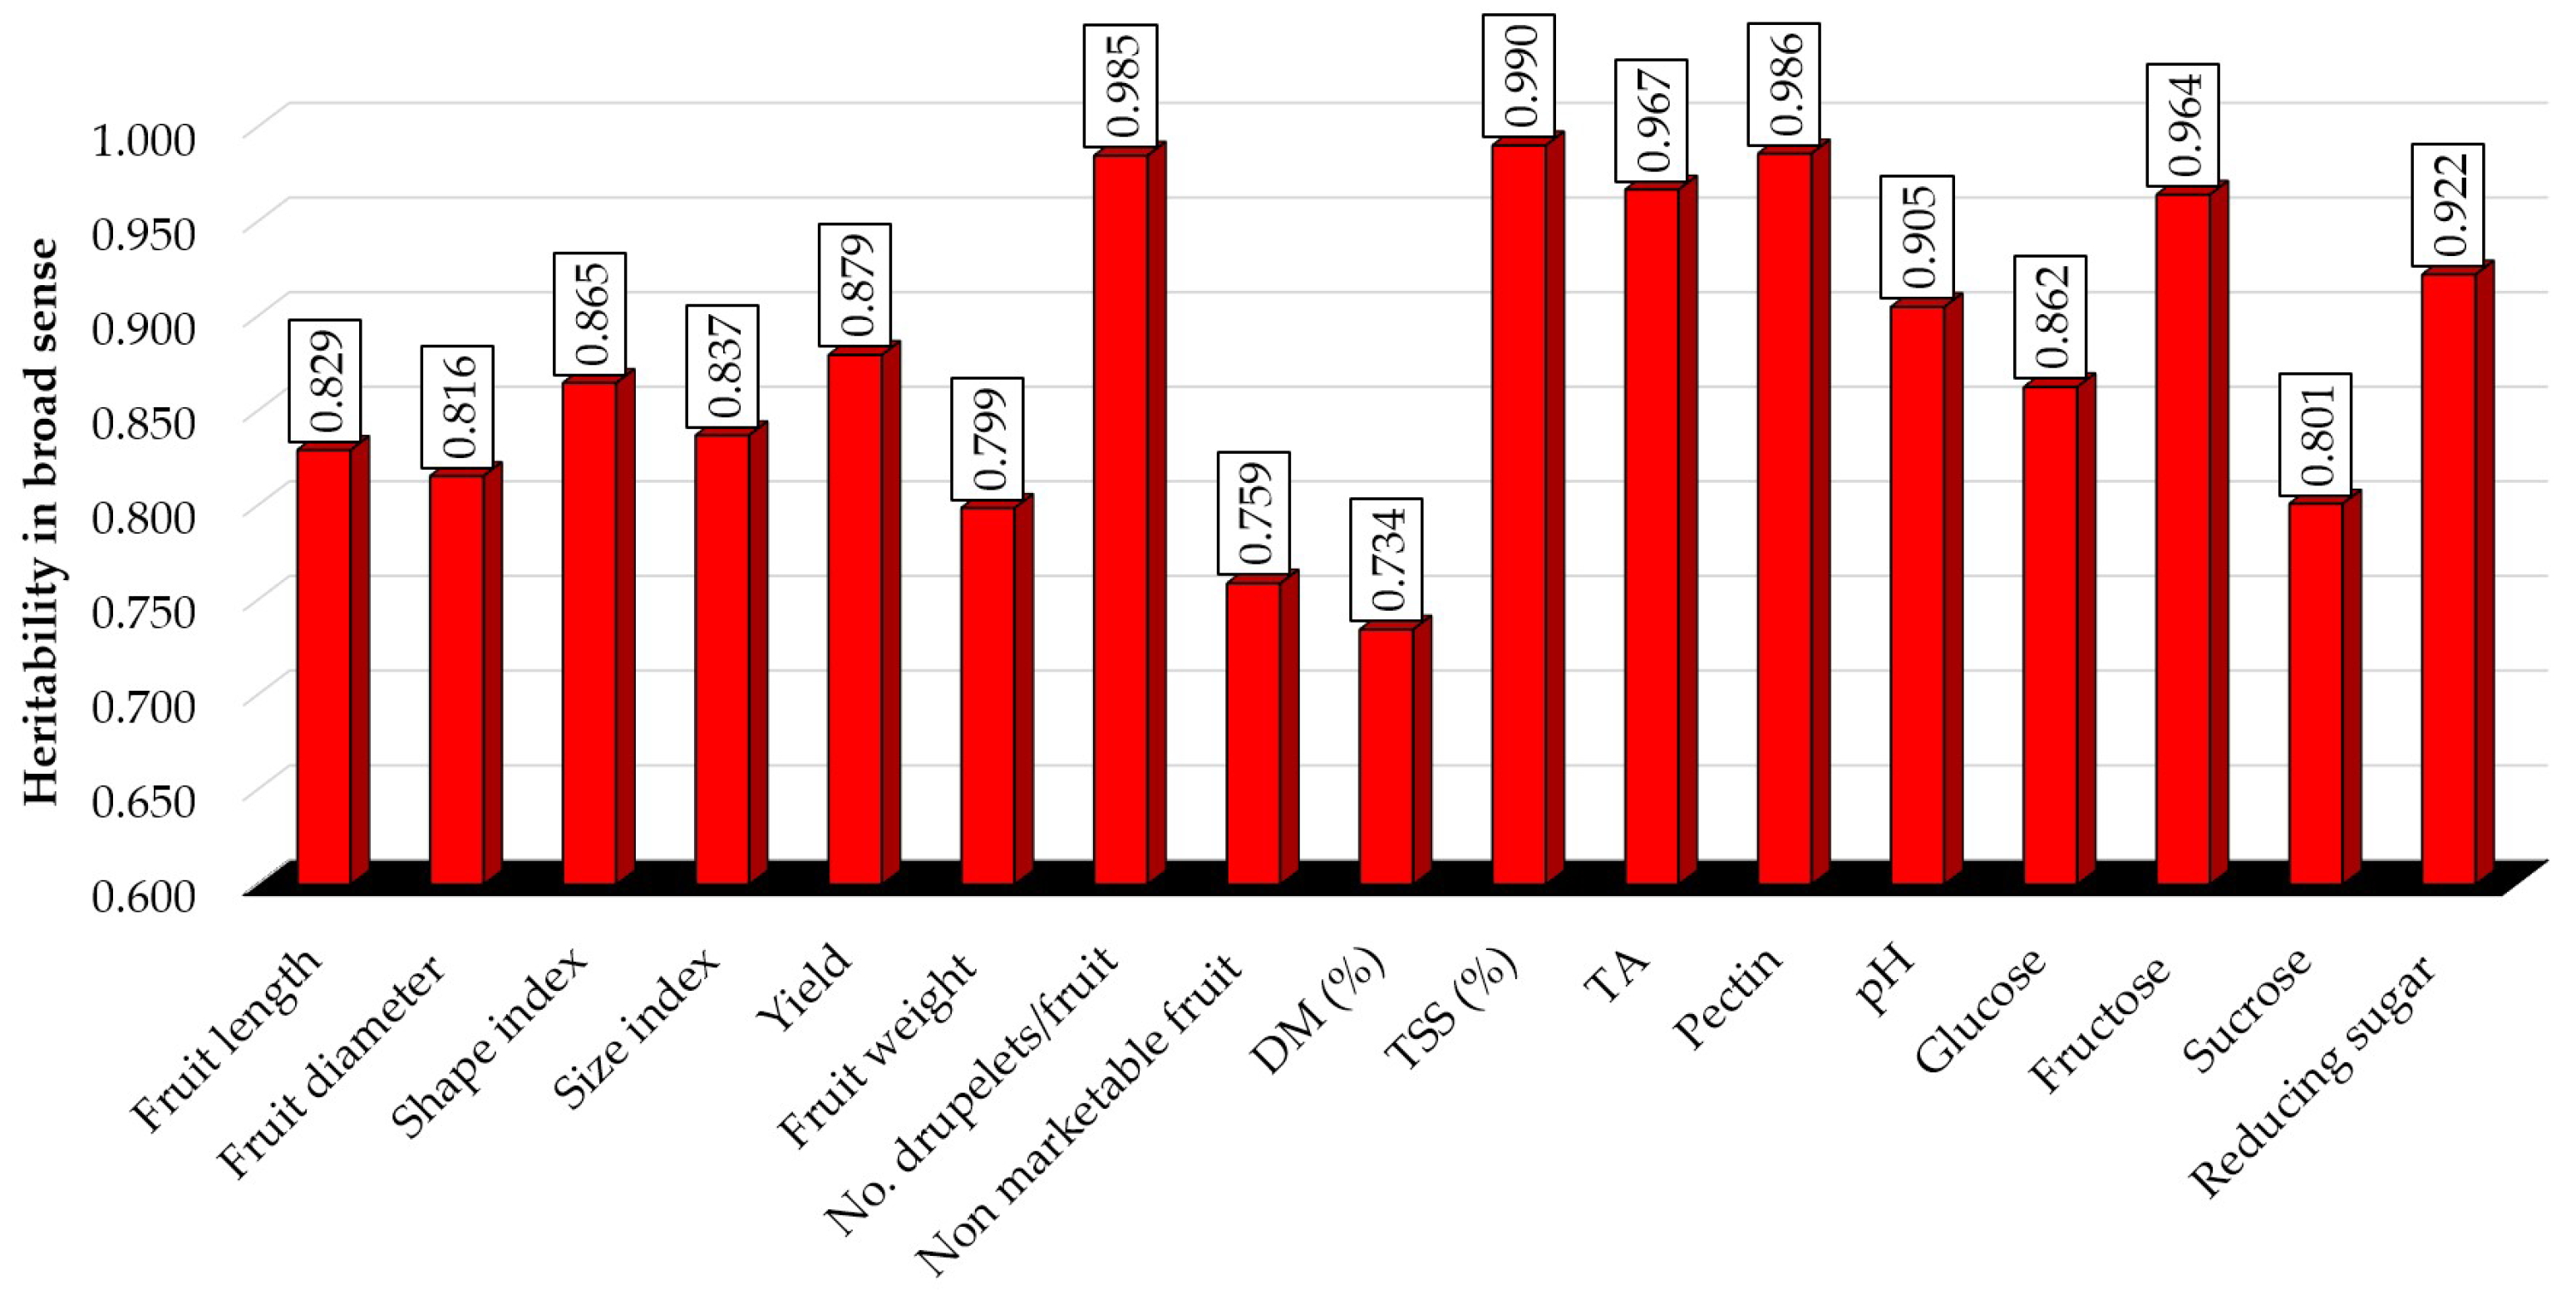
In general, the four types of heterosis calculated for the characteristics analyzed in the hybrid selections and their parental forms had some common features. Thus, in all cases, a similarity between the graphs was noted for at least two contrasting characteristics: non-marketable fruit, with negative heterosis of all types, and the number of drupelets per fruit, at the opposite pole with the highest positive values in terms of heterosis. Another aspect is the similarity between the resulting graphs in terms of the two types of absolute heterosis. When reporting heterosis to the average of the parental forms, as well as to the best parent, the appearance of the graphs is relatively similar for all hybrid offspring.
In the three selections obtained from the Tulameen × Autumn Bliss hybridization (Figure 6), one may identify an absolute positive heterosis concerning the number of drupelets, fruit diameter, and size index for the T 38 and T 34 hybrid selections. In the majority of the studied traits, T 34 seems to exhibit the highest relative heterosis and heterobeltiosis.
Analysis of the absolute heterosis effect in the three hybrids selected from Glen Moy × Tulameen cultivars (Figure 7) shows the highest value for the number of drupelets, followed by reducing sugar and fructose (mainly concerning the GLT 18 selection). GLT 18 shows the highest relative heterosis and heterobeltiosis for pectin and fructose content.
The hybrids WXVE 8 and WXVE 16, which resulted from crossing the Willamette and Veten cultivars, emphasize absolute heterosis mainly in terms of fruit diameter and size index (Figure 8). WXVE 16 exhibited relative heterosis and heterobeltiosis for pectin, the number of drupelets per fruit, fruit weight, and titratable acidity, while WXVE 8 exhibited considerable relative heterosis and heterobeltiosis for fruit diameter, size index, and glucose.
The absolute heterosis of TXPE 3 and TXPE 6 (resulting from crossings between the Tulameen and Pathfinder cultivars) was appreciable for fruit diameter and the number of drupelets (Figure 9). Relative heterosis was manifested mainly in the number of drupelets, fruit diameter, and sucrose and pectin content (in TXPE 6). Heterobeltiosis was pronounced mainly for fruit weight, fruit diameter, pH, titratable acidity, dry matter, and the number of drupelets in the TXPE 3 selection and the number of drupelets, fruit diameter, sucrose content, titratable acidity, dry matter, total soluble solids, pectin content, and pH in TXPE 6.
The crossings performed between Tulameen and Opal cultivars exhibited absolute heterosis for fruit diameter and the number of drupelets in the TXOE 13 and TXOE 9 hybrid selections, though mainly in the former (Figure 10). As with absolute heterosis, relative heterosis and heterobeltiosis were mainly present in the TXOE 13 hybrid, influencing in a positive manner fruit diameter, the number of drupelets, pectin content, DM, and sucrose content.
Regarding both hybrids obtained from the hybridization of Titan and Glen Prosen cultivars, absolute positive heterosis produced improvements in fruit diameter, size index, and the number of drupelets for TXGPE 19 (Figure 11), while the effects could hardly be noticed in TXGPE 11. Relative heterosis and heterobeltiosis positively influenced fruit diameter, size index, fruit weight, the number of drupelets, titratable acidity, and sucrose content in the TXGPE 19 hybrid.

3.7. Heritability

Broad-sense heritability, calculated over the entire experiment with the hybrids chosen and considered as perspective selections, ranged between 0.734 (dry matter) and 0.990 (total soluble solids) (Figure 12). Besides the lowest heritability value observer for dry matter, low broad-sense heritability was also recorded for non-marketable fruit (0.759) and fruit weight (0.799). These values reflect a high ratio of total genetic variance to phenotypic variance, and therefore the considerable influence of hereditary dowry on trait expression. In addition, along with total soluble solids, high heritability was observed for the number of drupelets (0.985), as well as pectin content (0.986), titratable acidity (0.967), and fructose content (0.964).
Broad-sense heritability (H2) and narrow-sense heritability (h2), when calculated for the common parent represented by the Tulameen cultivar (used as a mother—♀ or father—♂ in half-sibling families [(3♀ × Autumn Bliss) + (Glen Moy × 3♂) + (2♀ × Pathfinder) + (2♀ × Opal)]), oscillated strongly (Figure 13). Apart from glucose content, other characteristics stood out by exhibiting a high share of the genotype’s contribution to their phenotypic manifestation through both H2 and h2 values. Consequently, a significant genetic contribution was registered for titratable acidity, reducing sugar, fructose, sucrose, pectin, and the number of drupelets, all these traits being important in raspberry breeding.
It should be stated that the differences between the H2 values in the two figures are due to both the biological material and the calculation models used for clones in Figure 12 and the partitioning of genetic variances in the families of half-siblings in Figure 13.

4. Discussion

4.1. Raspberry Breeding Objectives: General and Topical Considerations Related to the Current Study

In raspberries, there are many breeding objectives, among which yield capacity, the quality of the fruits, shelf life, and the response of the plants to the main abiotic and biotic stress factors are the most important [48,57]. Each of these aims depends on genotype, environment (including technical aspects and culture), and genotype–environment interaction. Productivity depends on the growth vigor of plants, fruiting capacity, the number of fruits, fruit size, and stress and cultural responses. For fruits meant for fresh consumption, quality is impacted by commercial needs, attractive appearance, size, shape, color, intrinsic fruit traits, firmness, taste, flavor, food and nutritional value, increased human health properties, etc. [57,58].
New requirements in the culture, upgrade, and spread of raspberry crops (such as expanded production, ‘extended season production’, different fructification and ripening periods, crops that can be grown in protected areas (i.e., under glass or plastic structures), organic production, fruit that can be harvested by machine, etc.) presuppose other elements of breeding and the components of the new genotypes [2,48,58]. These new factors must be added to the desired genotypes while maintaining those that enable high yield, production quality, and economic efficiency. Thus, new cultivars should be produced with the aim of improving fruit output, quality, stress response, and responsiveness to technology and growing conditions [48,57,58].
In addition, raspberries may have good ecological plasticity. Depending on the cultivar, relatively high yields and suitably sized fruits have been obtained under various environmental conditions, such as colder areas, arid high-altitude areas, or even areas with tropical climates [59,60,61]. For example, raspberry varieties such as Glen Ample, Glen Magna, and Laszka, studied in the center of Russia, were characterized by a medium–hardy response to frost and high actual yields above 15 t/ha. Glen Ample produced very large fruits with an average weight practically double that obtained by this cultivar in our experiment [60]. The same cultivar, in the conditions of the Intermountain West region of North America, produced fruits with an average weight of 2.42 g and soluble solid content of 10.02% [62]. Undoubtedly, cultivars such as Glen Ample, Tulameen, and Willamette, as well as the other cultivars used as parental forms in our study, are well appreciated and recognized for their value, yield, high quality, and other valuable agronomic traits, as well as their economic importance [57,63] and widespread nature in raspberry crops [64,65]. Together with the other cultivars from the present study, they also proved their value and potential as suitable parents in new breeding work. In a study of the adaptability of some selections to tropical conditions, the weight of the raspberry genotypes varied from 2.74 to 5.37 g [59]. The fruit sizes were considered by the authors to be small and medium, though suitable for fruit export in various international markets. The study demonstrated the adaptability of certain genotypes to tropical culture, thus presenting an option for cultivation in those specific areas that could enable fresh consumption [59]. Under the agro-environmental conditions of western Serbia, the biological and chemical properties of Willamette were contrasted with those of Tulameen and other cultivars. Soluble solids (%) and sugars in Tulameen were 11.85% and 7.47%, respectively, which was significantly higher than Willamette, with 10.11% and 6.33%, respectively. Acid content (%), pectin content (%), and anthocyanin content (g/L) was lower in Tulameen (1.59%, 0.37%, and 0.40 g/L) than Willamette (1.89%, 0.42% and 0.76 g/L); however, during an organoleptic assessment of fresh fruits, both cultivars were most appreciated by the tasters among the fruits analyzed [66].
The chemical profiles of fruits under specific Norwegian agroclimatic conditions showed that raspberry phytochemical composition depends on the cultivar and agricultural practice, although different extraction procedures can yield different results [67]. Obviously, these factors complicate the breeder’s work; however, as with other species whose fruits are consumed [53,68], raspberry breeding must ensure high fruit quality that meets the needs of the market and fruit processors, the characteristic flavor of these exceptional fruits for consumers, and a prospective, anticipatory character [69].

4.2. The Usefulness of Information Provided by Calculating Heterosis to Raspberry Breeding

Heterosis is a genetic phenomenon, also known as hybrid vigor, that is characterized by the superior performance of seminal descendants (hybrids) compared to the parents from which they belong [70]. Hernández-Bautista et al. [49], studying the agronomic performance of some raspberry families, summarized the three hypotheses that explain the phenomenon of heterosis as follows: (a) The dominance hypothesis, widely accepted, states that the recessive genes of each inbred parent are masked by the dominant genes when they are inherited by the offspring F1. (b) The overdominance hypothesis states that heterozygous genotypes are superior to both of their homozygous parents due to gene overexpression. (c) The epistasis effects hypothesis states that heterosis is caused by gene interactions and situations in which one gene can overexpress. Epistatic dominance effects, notably dominance–dominance, cause heterosis in this third genetic model [71].
Evaluating vegetative and fruit traits in F1 hybrids from 28 families, Hernández-Bautista et al. [49] obtained the most values of heterosis negative both for mid-parent and better parent heterosis. The level of heterosis was dependent on the pedigree of the parents and their degree of relatedness. However, other hybrids demonstrated obvious positive heterosis for traits of relevance, such as yield, fruit size, or soluble solid content, showing that some cultivars can be useful parents in raspberry breeding projects. In breeding programs with genetically diverse parents, parental genetic distance is advised since it is connected to heterosis and F1 hybrid agronomic performance [47].
Heterosis may have an important influence on quantitative traits such as fruit size because, as Haskell noted in 1960 [46], hybrids with large fruits can be obtained “either in the sib families or a backcross”. In addition, considerable segregation occurs even in selfed families, which allows for the selection of progeny with large fruits [46]. In our study, the hybrid selection T 34 (Tulameen × Autumn Bliss) showed an obvious heterosis effect for fruit diameter, yield, fruit weight, number of drupelets per fruit, and sucrose content. However, T 38, of the same origin, had even greater heterosis for fruit diameter, fruit weight, number of drupelets per fruit, total soluble solids, pectin, and sucrose. In the selections from Tulameen × Pathfinder, heterosis was observed for the number of drupelets per fruit, and in those from Tulameen × Opal, heterosis was observed for pectin and sucrose content. The three selections derived from Glen Moy × Tulameen showed consistent positive heterosis for fruit weight and pectin content, but negative heterosis for non-marketable fruit. As a result, transgressive segregations could be beneficial for both positive and negative heterosis traits. Heterosis varied by attribute, value, and unit. However, comparative study provides useful information that reflects the influence of parental genotypes and their ability to transmit their valuable characteristics to hybrid offspring.
Negative heterosis was found for numerous variables of agronomic interest, even though the calculations were performed for elite hybrids that became clonal selections in the testing process. If all hybrids from all populations were calculated, negative heterosis would have been higher. The results show how difficult it is to enhance features that have been under significant selection pressure in raspberry breeding in relation to the creation of new cultivars. Such traits include those that contribute to productivity and production quality, some of the traits analyzed in our study or in other previous studies on other species [53], and those that confer resistance to abiotic and biotic stress factors [54]. The highly heterozygous nature of Rubus idaeus [58], the possibility of using suitable genetic resources as parents in crosses and their artificial hybridization [63], the relatively short duration in which the selection of hybrid offspring can be carried out, the vegetative propagation of the elites selected, and the fixation of heterosis in the resulting clones [72] are important assets that breeders can use to obtain new valuable raspberry cultivars.

4.3. The Usefulness of Information Provided by Heritability Coefficients to Raspberry Breeding

Selecting proper breeding parents is crucial to creating new raspberry cultivars. Their ability to pass on beneficial traits will determine the success of the selection [73]. Raspberry breeding programs must choose parents based on their phenotypic performance, understand the genetic mechanisms that drive trait inheritance, and understand how genetic and environmental factors affect trait expression [74,75]. Thus, identifying hybrids with high fruiting capacity and high-quality fruits, as well as other desirable features, might lead to profitable new cultivars [47,49,59,73].
Broad-sense heritability (H2), which represents the proportion of genetic variance participating in total phenotypic variance, respectively the ratio of total genotypic variance (additive, dominance, epistatic) to phenotypic variance [76], had quite different values for the same character (Figure 12 and Figure 13). In general, H2 was higher when calculated across all 14 hybrid selections (Figure 12) than when calculated for half-sibling families (Figure 13). There were also situations where H2 was higher in half-sibling families, for example in the case of some characteristics where the genotype contributed decisively to their phenotypic manifestation (the number of drupelets, reducing sugar, etc.).
However, in both cases, characteristics such as the number of drupelets, reducing sugar, total soluble solids, titratable acidity, pectin, glucose, and fructose had strong genetic determinism (oscillating between 0.862 and 0.990 for hybrid selections and 0.845 and 0.996 for half-sibling families), while total soluble solids, shape index, and especially altered fruit appeared less influenced by the genotype and were instead under a stronger influence from the environment (H2 was only 0.075 in half-sibling families, which means the contribution of genes was only 7.5% in the phenotypic manifestation of the character). Broad-sense heritability (H2) values can differ strongly depending on the characteristics analyzed, the biological material (hybrids or clones), and the calculation model. Nestby [77] considered the H2 values in raspberry offspring and clones to be low in terms of freeze tolerance (0.27), medium in terms of total soluble solids (0.39) and fruit size (0.42), and high in terms of fruit color (0.59) and firmness (0.78). Expressing heritability in relative values (in percentage values between 0 and 100% instead of absolute values between 0 and 1), Fotirić-Akšić et al. [75] obtained wide variation that depended on the analyzed characteristics, with H2 values being between 6.38% for titratable acidity and 85.17% for fruit weight. Marchi et al. [74] obtained broad-sense heritability values for raspberry genotypes that were considered to be low to moderate in terms of the quantitative characteristics of plants, fruits, and chemical compounds of fruits, with values ranging from 12% at the beginning of fruit harvesting to 46% for plant height and 20% for dry mass of pruning; however, fruit weight revealed moderate heritability (58%) and anthocyanin content demonstrated high heritability (87%).
The heritability coefficient for narrow-sense heritability, which expresses the participation of only additive genetic variance (effect of the additive genes) in total phenotypic variance [76,78], oscillated strongly in half-sibling families between 0.003 (altered fruit) and 0.442 (glucose). High values were also obtained for the number of drupelets, pectin, reducing sugar, titratable acidity, and fructose. However, h2 values were relatively low compared to those obtained by Dosset et al. [79] for different phenological, vegetative, and fruit chemistry characteristics calculated in black raspberry families in an incomplete partial diallel mating scheme (e.g., h2 was 0.68 for titratable acidity, 0.79 for pH, and 0.38 for percent soluble solids). Dossett et al. [79] observed what they considered to be moderate to high values for narrow-sense heritability, between 0.30 and 0.91, indicating the possibility of genetic inheritance of the desired characteristics for 23 of the 24 quantitative characteristics analyzed. An exception was registered for the size of the fruits, where SCA (specific combining ability) effects were slightly larger than GCA (general combining ability) effects and h2 was calculated to be negative. Conversely, Connor et al. [80] calculated high narrow-sense heritability values in raspberry for fruit weight, which did not vary between years (h2 between 0.66 and 0.72), and this value was even higher for combined years (0.77).
Narrow-sense heritability for ten different yield components obtained by González [81] was over 0.5 in seven cases, and the limits were between 0.27 for marketable fruit yield and 0.70 for cane number per seedling. For berry weight, the calculated h2 value was 0.52. Conversely, Hernández-Bautista et al. [47] obtained a higher value for fruit weight (h2 = 0.35) but lower values for other characteristics (0.18 for soluble solid content, 0.12 for fruit diameter, and 0.20 for fruit length). Similar h2 variation limits for different characteristics of interest in raspberries were also calculated by Stephens et al. [82], with mean values across three study years ranging between 0.22 and 0.73. The h2 values were different from one year to another. If total yield oscillated between 0.18 and 0.29 in the three successive years of study, soluble solids had a wider variation (between 0.58 and 0.81). In the same three years of study, h2 for berry weight had values of 0.63, 0.75, and 0.70 [83].
The relativity of heritability coefficients is also reflected by the experiences of Cash [76], where narrow-sense heritability (h2) ranged from 0.00 to 1.00 and broad-sense heritability (H2) ranged from 0.21 to 1.00. The difference between the two coefficients (H2 and h2), attributed to non-additive genetic variances (dominance and epistasis variances), is considerable in the case of some characteristics important to productivity or fruit quality (e.g., fruit production, fruit weight, total soluble solids, glucose, fructose, sucrose, reducing sugar). Even while such traits have strong inheritance, only the genetic impacts of additivity, illustrated by h2, are transmissible. Instead, dominance and epistasis genetically influence character phenotypes. Based on the results, raspberry breeding traits with high heritability values, especially h2, are easier to transfer to hybrids through parent selection. For various quantitative traits of interest in raspberry breeding, Connor et al. [80] considered that the hybrid populations obtained through artificial pollination ensured substantial variation, and as a result favorable for selection. In addition, the high heritability of traits such as fruit weight offers potential genetic gain and efficient selection. These hypotheses were also issued in previous research, even if the broad-sense heritability of fruit weight was lower than the narrow-sense heritability observed by Connor et al. [80], e.g., 0.58 [84] and 0.42 [77]. In addition, in the hybrid populations resulting from diallel crosses, the predominantly additive inheritance of fruit weight was identified, though the heredity of the trait also included a significant non-additive component [85]. In order to increase the efficiency of raspberry breeding, the use of diallel hybridization models that allow for the calculation of GCA and SCA are extremely useful [73,76,81]. They also allow for calculation of the narrow-sense heritability coefficient, which is extremely useful for determining the effectiveness of breeding and selection strategies and for predicting the response to selection in breeding programs [47,81]. Maximum breeding progress can be obtained in raspberries by crossing parents that bring together a diversity of genes with favorable effects and a high level of heterozygosity in the offspring [57].

4.4. The Usefulness of Information Provided by the Calculation of Correlation Coefficients and Multivariate Analyses to Raspberry Breeding

To increase the efficiency of raspberry breeding, in addition to extremely useful genetic parameters (including heritability and heterosis), multivariate analyses and correlations can be particularly useful. Multivariate analyses and correlations are useful for the evaluation of germplasm resources and their appropriate use in raspberry breeding [86]. Quantitative traits such as yield and fruit quality are complex, each being influenced by several factors, components or elements (e.g., productivity is influence by elements such as plant growth vigor, the number of fruits per plant, fruit weight, etc.), which are also polygenic traits that contribute to their manifestation and phenotypic expression [57,58]. Therefore, some of these components may be useful predictors of improved productivity, fruit quality, or other objectives of interest in the breeding of new cultivars, and such information contributes to the establishment of effective breeding and selection strategies in breeding programs [47].
As with other species, correlations can be used in raspberry breeding as indices of indirect selection [73]. For example, since large fruit size is often strongly correlated with high yield, selection for the first trait will also ensure the second. The ‘large fruit’ trait is easily identified by the breeder, and the choice of hybrid plants based on this trait, respectively selecting the elites with larger fruit size, will simultaneously ensure improvements in productivity [72,74,83,87]. Consequently, indirect selection through component traits of agronomic interest would be an advisable strategy to increase the efficiency of selection [49].
The correlations between components of interest, such as between fruit weight and yield, are complex and depend on numerous factors, i.e., on the degree of genetic diversity of the investigated genotypes or the population, on the particularities of fruiting, floricane or primocane types, etc. [49]. Thus, productivity–fruit weight correlations ranged from very close to not statistically significant [49,74,81,86], as was observed in our study.
Since phenotypic correlations express associations between traits that may be due to hereditary effects but also the environment, genotypic correlations provide information to breeders that has greater potential. Genetic correlations can be due to pleiotropy or very close linkage, linkage disequilibrium, or correlation of both traits of interest with a third, unmeasured trait [88,89]. In raspberries, genotypic correlations were calculated in many studies where the applied models allowed for the decomposition of genetic variance (e.g., in diallel hybridizations or in half-sibling families), and the genotypic correlations generally confirmed phenotypic relations if they were strongly positive, or negative [80,81,82,83].
To identify correlations of interest in raspberry breeding, Radovich et al. [86] used principal component analysis (PCA), which provides useful information that can help reduce the number of analyzed traits in raspberry hybrid populations. Therefore, PCA can be applied to the evaluation of genetic resources and the diversity of cultivars, as well as to hybrid populations. The main information revealed by principal components PC1 and PC2 in PCA obtained by Haffner et al. [90] was explained by cultivars originating from the same source, which were grouped according to their physical and chemical traits. Multivariate analysis was used in order to evaluate genetic resources of interest in raspberry breeding by Lacis et al. [6]. They analyzed 41 plant and fruit traits in different genotypes using PCA, including some well-known cultivars (e.g., Autumn Bliss, Tulameen, Willamette) that were also used in our study, and the results highlighted some common points. Yu et al. [91] used PCA and cluster analysis (CA) in a comprehensive study to evaluate the quality of 24 red raspberry varieties in Northeast China. Based on the information obtained regarding the physicochemical properties, bioactive compounds, and sensory characteristics of the berries, the authors identified genotypes suitable for fresh eating and processing as juice or other products. Additionally, Bradish et al. [92] suggested that PCA can be useful in raspberry breeding by allowing for the selection and rapid screening of hybrids whose fruits have high nutritional value, high levels of bioactive compounds, and high concentrations of phytochemicals.
Our study supports other research on identifying and promoting raspberry cultivars with excellent production capacity, fruit quality, and nutritional value. This also helps breeders evaluate germplasm collections and choose the best genetic resources for raspberry breeding. Thus, selecting new cultivars with desirable agronomic traits becomes more efficient. Raspberry breeding must meet the growing demand for high-quality, chemically valuable fruit from consumers, the fresh fruit industry, and processors.

5. Conclusions

According to the results presented in our research, the ten selections with the potential to become new cultivars demonstrated that the resulting variability in the progeny of six hybrid combinations was adequate for the application of effective selection. The yield and morphological and biochemical characteristics of the fruits of these new selections obtained by artificial hybridization were generally close to those of the parental ones or another well-known and valuable cultivar that used as a control (Glen Ample). The cultivars used as parental forms in artificial crosses also demonstrated their hereditary ability to transmit favorable characteristics with sufficient fidelity to the generative descendants. Therefore, in addition to their valuable phenotype, cultivars such as Tulameen, Willamette, Autumn Bliss, and Veten have produced progeny that have inherited valuable traits and from which promising selections have been identified that have the potential to become new cultivars. Important indices relating to the phenotypic and genetic analysis of quantitative traits of agronomic interest, such as heritability, heterosis, correlations, and multivariate analysis, can be useful in raspberry breeding and help increase the efficiency of creating new cultivars.

Author Contributions

Conceptualization, I.T., R.E.S. and A.F.S.; methodology, I.T., M.M. and A.F.S.; software, I.A.R. and A.F.S.; validation, I.A.R., M.B., R.E.S., M.M. and S.E.; formal analysis, C.N., M.S. and E.I.; investigation, I.T., C.N. and M.S.; resources, I.T., M.M. and A.F.S.; data curation, I.T., I.A.R., C.N., E.I. and R.P.; writing—original draft preparation, I.T. and I.A.R.; writing—review and editing, R.E.S., M.M. and A.F.S.; visualization, R.P. and S.E.; supervision, M.B., M.M. and S.E.; project administration, I.T.; funding acquisition, A.F.S. All authors have read and agreed to the published version of the manuscript.

Funding

This publication was supported by funds from the Research Institute for Fruit Growing Pitesti, Mărăcineni (RIFGP), and the University of Agricultural Sciences and Veterinary Medicine of Cluj-Napoca (USAMVCN). This research was partially funded by an I.A.R. grant (No. 14134/16.07.2021) from the University of Agricultural Sciences and Veterinary Medicine of Cluj-Napoca.

Data Availability Statement

Not applicable.

Conflicts of Interest

The authors declare no conflict of interest.

References

  1. Hummer, K.E. Rubus diversity. HortScience 1996, 31, 182–183. [Google Scholar] [CrossRef] [Green Version]
  2. Foster, T.M.; Bassil, N.V.; Dossett, M.; Worthington, M.L.; Graham, J. Genetic and genomic resources for Rubus breeding: A roadmap for the future. Hortic. Res. 2019, 6, 116. [Google Scholar] [CrossRef] [PubMed] [Green Version]
  3. Dale, A.; Moore, P.P.; McNicol, R.J.; Sjulin, T.M.; Burmistrov, L.A. Genetic diversity of red raspberry varieties throughout the-world. J. Am. Soc. Hortic. Sci. 1993, 118, 119–129. [Google Scholar] [CrossRef]
  4. Veljković, B.; Šoštarić, I.; Dajić-Stevanović, Z.; Liber, Z.; Šatović, Z. Genetic structure of wild raspberry populations in the central Balkans depends on their location and on their relationship to commercial cultivars. Sci. Hortic. 2019, 256, 108606. [Google Scholar] [CrossRef]
  5. Dulf, F.V.; Andrei, S.; Bunea, A.; Socaciu, C. Fatty acid and phytosterol contents of some Romanian wild and cultivated berry pomaces. Chem. Pap. 2012, 66, 925–934. [Google Scholar] [CrossRef]
  6. Lācis, G.; Kota-Dombrovska, I.; Strautiņa, S. Evaluation of red raspberry cultivars used for breeding and commercial growing in the Baltic region. Proc. Latv. Acad. Sci. Sect. B 2017, 71, 203–210. [Google Scholar] [CrossRef] [Green Version]
  7. Milivojevic, J.M.; Nikolic, M.D.; Maksimovic, J.J.D.; Radivojevic, D.D. Generative and fruit quality characteristics of primocane fruiting red raspberry cultivars. Turk. J. Agric. For. 2011, 35, 289–296. [Google Scholar] [CrossRef]
  8. Kula, P.J. Raspberry Pi 2 Server Essentials; PACKT Publishing: Birmingham, UK, 2016. [Google Scholar]
  9. Qiu, C.; Xu, Q.; Gaudreau, L.; Gosselin, A.; Gauthier, L.; Van Sterthem, A.; Desjardins, Y. Yield improvement of red raspberry by soilless cultivation with two propagation methods under northern Canadian climate. Acta Hortic. 2016, 1133, 195–200. [Google Scholar] [CrossRef]
  10. Palonen, P.; Pinomaa, A.; Tommila, T. The influence of high tunnel on yield and berry quality in three floricane raspberry cultivars. Sci. Hortic. 2017, 214, 180–186. [Google Scholar] [CrossRef] [Green Version]
  11. Stavang, J.A.; Freitag, S.; Foito, A.; Verrall, S.; Heide, O.M.; Stewart, D.; Sønsteby, A. Raspberry fruit quality changes during ripening and storage as assessed by colour, sensory evaluation and chemical analyses. Sci. Hortic. 2015, 195, 216–225. [Google Scholar] [CrossRef]
  12. Anttonen, M.J.; Karjalainen, R.O. Environmental and genetic variation of phenolic compounds in red raspberry. J. Food Compos. Anal. 2005, 18, 759–769. [Google Scholar] [CrossRef]
  13. Remberg, S.F.; Sønsteby, A.; Aaby, K.; Heide, O.M. Influence of postflowering temperature on fruit size and chemical composition of glen ample raspberry (Rubus idaeus L.). J. Agric. Food Chem. 2010, 58, 9120–9128. [Google Scholar] [CrossRef] [PubMed]
  14. Mazur, S.P.; Nes, A.; Wold, A.-B.; Remberg, S.F.; Aaby, K. Quality and chemical composition of ten red raspberry (Rubus idaeus L.) genotypes during three harvest seasons. Food Chem. 2014, 160, 233–240. [Google Scholar] [CrossRef] [PubMed]
  15. Miletić, N.; Leposavić, A.; Popović, B.; Mitrović, O.; Kandić, M. Chemical and antioxidant properties of fully matured raspberry fruits (Rubus idaeus L.) picked in different moments of harvesting season. Acta Hortic. 2015, 1099, 211–218. [Google Scholar] [CrossRef]
  16. Leposavić, A.; Đurović, D.; Keserović, Z.; Jevremović, D. Vegetative and yield potential of cultivars and selection of raspberry cultivated in conditions of West Serbia. Bulg. J. Agric. Sci. 2015, 21, 153–159. [Google Scholar]
  17. Stanisavljevic, M.; Mitrovic, O.; Gavriloviç-Damjanoviç, J. Comparative studies on raspberry cultivars. Acta Hortic. 2002, 585, 241–245. [Google Scholar] [CrossRef]
  18. Sønsteby, A.; Myrheim, U.; Heiberg, N.; Heide, O.M. Production of high yielding red raspberry long canes in a northern climate. Sci. Hortic. 2009, 121, 289–297. [Google Scholar] [CrossRef]
  19. Woznicki, T.L.; Heide, O.M.; Remberg, S.F.; Sønsteby, A. Effects of controlled nutrient feeding and different temperatures during floral initiation on yield, berry size and drupelet numbers in red raspberry (Rubus idaeus L.). Sci. Hortic. 2016, 212, 148–154. [Google Scholar] [CrossRef]
  20. Cañas-Gutiérrez, G.P.; Alcaraz, L.; Hormaza, J.I.; Arango-Isaza, R.E.; Saldamando-Benjumea, C.I. Diversity of avocado (Persea americana Mill.) cultivars from Antioquia (Northeast Colombia) and comparison with a worldwide germplasm collection. Turk. J. Agric. For. 2019, 43, 437–449. [Google Scholar] [CrossRef]
  21. Zivotic, A.; Micic, N.; Zabic, M.; Bosancic, B.; Cvetkovic, M. Precision cane meristem management can influence productivity and fruit quality of floricane red raspberry cultivars. Turk. J. Agric. For. 2019, 43, 405–413. [Google Scholar] [CrossRef]
  22. Durán-Soria, S.; Pott, D.M.; Will, F.; Mesa-Marín, J.; Lewandowski, M.; Celejewska, K.; Masny, A.; Żurawicz, E.; Jennings, N.; Sønsteby, A.; et al. Exploring genotype-by-environment interactions of chemical composition of raspberry by using a metabolomics approach. Metabolites 2021, 11, 490. [Google Scholar] [CrossRef] [PubMed]
  23. Peinado, I.; Rosa, E.; Heredia, A.; Andrés, A. Rheological characteristics of healthy sugar substituted spreadable strawberry product. J. Food Eng. 2012, 113, 365–373. [Google Scholar] [CrossRef] [Green Version]
  24. Koraqi, H.; Durmishi, N.; Rizani, K.L.; Rizani, S. Chemical composition and nutritional value of raspberry fruit (Rubus idaeus L.). In Proceedings of the UBT International Conference, Pristina, Kosovo, 26–28 October 2019; p. 397. [Google Scholar]
  25. Ponder, A.; Hallmann, E. The nutritional value and vitamin C content of different raspberry cultivars from organic and conventional production. J. Food Compos. Anal. 2020, 87, 103429. [Google Scholar] [CrossRef]
  26. Tosun, M.; Ercisli, S.; Karlidag, H.; Sengul, M. Characterization of red raspberry (Rubus idaeus L.) genotypes for their physicochemical properties. J. Food Sci. 2009, 74, C575–C579. [Google Scholar] [CrossRef] [PubMed]
  27. Kirina, I.B.; Belosokhov, F.G.; Titova, L.V.; Suraykina, I.A.; Pulpitow, V.F. Biochemical assessment of berry crops as a source of production of functional food products. IOP Conf. Series Earth Environ. Sci. 2020, 548, 82068. [Google Scholar] [CrossRef]
  28. Bošnjak, D.; Marković, M.; Agić, D.; Vinković, T.; Tkalec Kojić, M.; Ravnjak, B.; Stanisavljević, A. The influence of nutrient media modification on the morphological parameters in raspberry (Rubus idaeus L.) micropropagation in the liquid and semi-solid media. Poljoprivreda 2021, 27, 22–29. [Google Scholar] [CrossRef]
  29. Burton-Freeman, B.M.; Sandhu, A.K.; Edirisinghe, I. Red raspberries and their bioactive polyphenols: Cardiometabolic and neuronal health links. Adv. Nutr. Int. Rev. J. 2016, 7, 44–65. [Google Scholar] [CrossRef] [Green Version]
  30. Lopez-Corona, A.V.; Valencia-Espinosa, I.; González-Sánchez, F.A.; Sánchez-López, A.L.; Garcia-Amezquita, L.E.; Garcia-Varela, R. Antioxidant, anti-inflammatory and cytotoxic activity of phenolic compound family extracted from rasp-berries (Rubus idaeus): A general review. Antioxidants 2022, 11, 1192. [Google Scholar] [CrossRef]
  31. Shoukat, S.; Mahmudiono, T.; Al-Shawi, S.G.; Abdelbasset, W.K.; Yasin, G.; Shichiyakh, R.A.; Iswanto, A.H.; Kadhim, A.J.; Kadhim, M.M.; Al-Rekaby, H.Q. Determination of the antioxidant and mineral contents of raspberry varieties. Food Sci. Technol. 2022, 42, e118521. [Google Scholar] [CrossRef]
  32. De Souza, V.R.; Pereira, P.A.P.; Da Silva, T.L.T.; De Oliveira Lima, L.C.; Pio, R.; Queiroz, F. Determination of the bioactive compounds, antioxidant activity and chemical composition of Brazilian blackberry, red raspberry, strawberry, blueberry and sweet cherry fruits. Food Chem. 2014, 156, 362–368. [Google Scholar] [CrossRef] [Green Version]
  33. Fu, Y.; Zhou, X.; Chen, S.; Sun, Y.; Shen, Y.; Ye, X. Chemical composition and antioxidant activity of Chinese wild raspberry (Rubus hirsutus Thunb.). LWT Food Sci. Technol. 2014, 60, 1262–1268. [Google Scholar] [CrossRef]
  34. Duarte, W.F.; Dias, D.R.; Oliveira, J.M.; Vilanova, M.; Teixeira, J.A.; e Silva, J.B.A.; Schwan, R.F. Raspberry (Rubus idaeus L.) wine: Yeast selection, sensory evaluation and instrumental analysis of volatile and other compounds. Food Res. Int. 2010, 43, 2303–2314. [Google Scholar] [CrossRef]
  35. Wang, S.Y.; Chen, C.-T.; Wang, C.Y. The influence of light and maturity on fruit quality and flavonoid content of red raspberries. Food Chem. 2009, 112, 676–684. [Google Scholar] [CrossRef]
  36. Maro, L.A.C.; Pio, R.; Guedes, M.N.S.; De Abreu, C.M.P.; Moura, P.H.A. Environmental and genetic variation in the post-harvest quality of raspberries in subtropical areas in Brazil. Acta Sci. Agron. 2014, 36, 323–328. [Google Scholar] [CrossRef] [Green Version]
  37. Gecer, M.K.; Kan, T.; Gundogdu, M.; Ercisli, S.; Ilhan, G.; Sagbas, H.I. Physicochemical characteristics of wild and cultivated apricots (Prunus armeniaca L.) from Aras valley in Turkey. Genet. Resour. Crop Evol. 2020, 67, 935–945. [Google Scholar] [CrossRef]
  38. Maeda, H.; Akagi, T.; Tao, R. Quantitative characterization of fruit shape and its differentiation pattern in diverse persimmon (Diospyros kaki) cultivars. Sci. Hortic. 2018, 228, 41–48. [Google Scholar] [CrossRef]
  39. Ozkan, G.; Ercisli, S.; Zeb, A.; Agar, G.; Sagbas, H.I.; Ilhan, G.; Gundogdu, M. Some morphological and biochemical characteristics of wild grown Caucasian whortleberry (Vaccinium arctostaphylos L.) genotypes from northeastern Turkey. Not. Bot. Horti Agrobot. Cluj-Napoca 2019, 47, 378–383. [Google Scholar] [CrossRef] [Green Version]
  40. Sestras, R.E.; Pamfil, D.; Ardelean, M.; Botez, C.; Sestras, A.F.; Mitre, I.; Dan, C.; Mihalte, L. Use of phenotypic and MAS selection based on bulk segregant analysis to reveal the genetic variability induced by artificial hybridization in apple. Not. Bot. Horti Agrobo. Cluj-Napoca 2009, 37, 273–277. [Google Scholar] [CrossRef]
  41. Evdokimenko, S.N.; Podgaetskiy, M.A. Current status and prospects of raspberry breeding. Hortic. Vitic. 2022, 4, 5–15. [Google Scholar] [CrossRef]
  42. Puskás, M.; Höfer, M.; Sestras, R.E.; Peil, A.; Sestras, A.F.; Hanke, M.-V.; Flachowsky, H. Molecular and flow cytometric evaluation of pear (Pyrus L.) genetic resources of the German and Romanian national fruit collections. Genet. Resour. Crop. Evol. 2016, 63, 1023–1033. [Google Scholar] [CrossRef]
  43. Dan, C.; Sestras, A.F.; Bozdog, C.; Sestras, R.E. Investigation of wild species potential to increase genetic diversity useful for apple breeding. Genetika 2015, 47, 993–1011. [Google Scholar] [CrossRef]
  44. Robbins, J.; Moore, P.P. Fruit morphology and fruit strength in a seedling population of red raspberry. HortScience 1991, 26, 294–295. [Google Scholar] [CrossRef] [Green Version]
  45. Sagbas, H.I.; Ilhan, G.; Zitouni, H.; Anjum, M.A.; Hanine, H.; Necas, T.; Ondrasek, I.; Ercisli, S. Morphological and biochemical characterization of diverse strawberry tree (Arbutus unedo L.) genotypes from northern Turkey. Agronomy 2020, 10, 1581. [Google Scholar] [CrossRef]
  46. Haskell, G. Biometrical characters and selection in cultivated raspberry. Euphytica 1960, 9, 17–34. [Google Scholar] [CrossRef]
  47. Hernández-Bautista, A.; Lobato-Ortiz, R.; García-Zavala, J.J.; Rocandio-Rodríguez, M.; Mejía-Contreras, J.A.; Chávez-Servia, J.L.; García-Velazquez, J.A. Relationship of parental genetic distance with agronomic performance, specific combining ability, and predicted breeding values of raspberry families. Euphytica 2018, 214, 37. [Google Scholar] [CrossRef]
  48. Evdokimenko, S.; Kulikov, I.; Podgaetsky, M. Some aspects of raspberry breeding with predominant fruiting on annual shoots. E3S Web Conf. 2021, 254, 1019. [Google Scholar] [CrossRef]
  49. Bautista, A.H.; Ortiz, R.L.; Mejía-Contreras, J.A.; García-Zavala, J.J.; Chávez-Servia, J.L.; Rocandio-Rodríguez, M.; Bautista, A.L.H.; Castañeda-Villa, A.M.; Rodríguez-Bautista, G. Heterosis and agronomic performance of raspberry families: Breeding raspberry. Agro Product. 2022, 15, 3–11. [Google Scholar]
  50. AOAC. Official Methods of Analysis; Association of Official Analytical Chemists: Washington, DC, USA, 2002. [Google Scholar]
  51. Shelukhina, N.P.; Fedichkina, L.G. A rapid method for quantitative determination of pectic substances. Acta Bot. Neerlandica 1994, 43, 205–207. [Google Scholar] [CrossRef]
  52. Hammer, Ø.; Harper, D.A.T.; Ryan, P.D. PAST: Paleontological statistics software package for education and data analysis. Palaeontol. Electron. 2001, 4, 4–9. [Google Scholar]
  53. Felföldi, Z.; Ranga, F.; Socaci, S.A.; Farcas, A.; Plazas, M.; Sestras, A.F.; Vodnar, D.C.; Prohens, J.; Sestras, R.E. Physico-chemical, nutritional, and sensory evaluation of two new commercial tomato hybrids and their parental lines. Plants 2021, 10, 2480. [Google Scholar] [CrossRef]
  54. Sestras, A.F.; Pamfil, D.; Dan, C.; Bolboaca, S.D.; Jäntschi, L.; Sestras, R.E. Possibilities to improve apple scab (Venturia inaequalis (Cke.) Wint.) and powdery mildew [Podosphaera leucotricha (Ell. et Everh.) Salm.] resistance on apple by increasing genetic diversity using potentials of wild species. Aust. J. Crop Sci. 2011, 5, 748–755. [Google Scholar]
  55. Falconer, D.S.; Mackay, T.F. Introduction to Quantitative Genetics; Longman Group Ltd.: London, UK, 1996. [Google Scholar]
  56. Mărcășan, L.I.S.; Hulujan, I.B.; Florian, T.; Alpar, S.P.; Militaru, M.; Sestras, A.F.; Oltean, I.; Sestras, R.E. The importance of assessing the population structure and biology of psylla species for pest monitoring and management in pear orchards. Not. Bot. Horti Agrobot. Cluj-Napoca 2022, 50, 13022. [Google Scholar] [CrossRef]
  57. Hall, H.; Hummer, K.E.; Jamieson, A.; Jennings, S.N.; Weber, C. Raspberry breeding and genetics. In Plant Breeding Reviews; Janick, J., Ed.; Wiley-Blackwell: Hoboken, NJ, USA, 2009; Volume 32. [Google Scholar]
  58. Graham, J.; Jennings, S.N. Raspberry breeding. In Breeding Tree Crops; Jain, S.M., Priyadarshan, M., Eds.; IBH & Science Publication: Oxford, UK, 2009; pp. 233–248. [Google Scholar]
  59. Hernández-Bautista, A.; Lobato-Ortiz, R.; García-Zavala, J.J.; Contreras, J.A.M.; Chávez-Servia, J.L.; Rodríguez, M.R.; Cruz-Izquierdo, S.; Velázquez, J.A.G. Adaptability of raspberry primocane genotypes in a tropical environment and its implication in the raspberry production in Mexico. J. Berry Res. 2019, 9, 155–163. [Google Scholar] [CrossRef]
  60. Ozherelieva, Z.E.; Lupin, M.V.; Bogomolova, N.I. Study of raspberry genotypes by biologically valuable traits under conditions of central Russia. Agronomy 2022, 12, 630. [Google Scholar] [CrossRef]
  61. Black, B.L.; Lindstrom, T.; Heflebower, R.; Hunter, B.; Olsen, S.; Alston, D.G. Adaptability of primocane raspberry cultivars to a high-elevation arid climate. J. Am. Pomol. Soc. 2013, 67, 47–56. [Google Scholar]
  62. Hansen, S.; Black, B.; Alston, D.; Lindstrom, T.; Olsen, S. A comparison of nine primocane fruiting raspberry cultivars for suitability to a high-elevation, arid climate. Int. J. Fruit Sci. 2021, 21, 500–508. [Google Scholar] [CrossRef]
  63. Hall, H.K.; Kempler, C. Raspberry breeding. Fruit Veg. Cereal Sci. Biotech. 2011, 5, 44–62. [Google Scholar]
  64. Zejak, D.; Glisic, I.; Spalevic, V.; Maskovic, P.; Dudic, B. Sustainable management of fruit growing in rural areas of Montenegro: The impact of location on the phenological and nutritional properties on raspberry (Rubus idaeus L.). Agronomy 2021, 11, 1663. [Google Scholar] [CrossRef]
  65. Zejak, D.; Radović, A.; Spalevic, V.; Glišić, I. Production of planting material of raspberry variety Glen Ample in the North Montenegro. Agric. For. Poljopr. I Sumar. 2021, 67, 245–259. [Google Scholar] [CrossRef]
  66. Leposavić, A.; Janković, M.; Đurović, D.; Veljković, B.; Keserović, Z.; Popović, B. Fruit quality of red raspberry cultivars and selections grown in western Serbia. Hortic. Sci. 2013, 40, 154–161. [Google Scholar] [CrossRef] [Green Version]
  67. Akšić, M.F.; Nešović, M.; Ćirić, I.; Tešić, Ž.; Pezo, L.; Tosti, T.; Gašić, U.; Dojčinović, B.; Lončar, B.; Meland, M. Chemical fruit profiles of different raspberry cultivars grown in specific Norwegian agroclimatic conditions. Horticulturae 2022, 8, 765. [Google Scholar] [CrossRef]
  68. Dan, C.; Șerban, C.; Sestraş, A.F.; Militaru, M.; Morariu, P.; Sestraş, R.E. Consumer perception concerning apple fruit quality, depending on cultivars and hedonic scale of evaluation—A case study. Not. Sci. Biol. 2015, 7, 140–149. [Google Scholar] [CrossRef] [Green Version]
  69. Lebedev, V.G.; Subbotina, N.M.; Maluchenko, O.P.; Krutovsky, K.V.; Shestibratov, K.A. Assessment of genetic diversity in differently colored raspberry cultivars using SSR markers located in flavonoid biosynthesis genes. Agronomy 2019, 9, 518. [Google Scholar] [CrossRef] [Green Version]
  70. Acquaah, G. Principles of Plant Genetics and Breeding; Blackwell Publishers: Oxford, UK, 2007; p. 1166. [Google Scholar]
  71. Yu, S.B.; Li, J.X.; Xu, C.G.; Tan, Y.F.; Gao, Y.J.; Li, X.H.; Zhang, Q.; Maroof, M.A.S. Importance of epistasis as the genetic basis of heterosis in an elite rice hybrid. Proc. Natl. Acad. Sci. USA 1997, 94, 9226–9231. [Google Scholar] [CrossRef] [Green Version]
  72. Kempler, C.; Hall, H.; Finn, C.E. Raspberry. In Fruit Breeding; Badenes, M.L., Byrne, D.H., Eds.; Springer: Boston, MA, USA, 2012; pp. 263–304. [Google Scholar]
  73. Hernández-Bautista, A.; Lobato-Ortíz, R.; García-Zavala, J.J.; Servia, J.L.C.; Mejía-Contreras, J.A.; García-Velazquez, J.A. Breeding potential of raspberry primocane selections based on their combining abilities. Can. J. Plant Sci. 2018, 98, 28–37. [Google Scholar] [CrossRef] [Green Version]
  74. Marchi, P.; Carvalho, I.; Höhn, D.; Carra, B.; Szareski, V.; Dini, M.; Vizzotto, M.; Antunes, L. Research article genetic parameters prediction (REML/BLUP) for morphological, physical-chemical, phytochemical, and mineral components of primocane-fruiting raspberries. J. Genet. Mol. Res. 2019, 18, 18254. [Google Scholar] [CrossRef]
  75. Fotirić-Akšić, M.; Radović, A.; Milivojević, J.; Nikolić, M.; Nikolić, D. Genetic parameters of yield components and pomo-logic properties in raspberry seedlings. Genetika 2011, 43, 667–674. [Google Scholar] [CrossRef]
  76. Cash, C.B. Studies of Linkage Mapping, Trait Heritability, and Pedigrees for Breeding Improvement of Southeastern Black and Red Raspberry. Ph.D. Thesis, North Carolina State University, Raleigh, NC, USA, 2016. [Google Scholar]
  77. Nestby, R. Heritability estimates in raspberry breeding. In Progress in Temperate Fruit Breeding. Developments in Plant Breeding; Schmidt, H., Kellerhals, M., Eds.; Springer: Dordrecht, The Netherlands, 1994; Volume 1. [Google Scholar]
  78. Fehr, W.R. Heterosis. In Principles of Cultivar Development: Theory and Techniques; Macmillan Publishing Company: New York, NY, USA, 1987; Volume 1. [Google Scholar]
  79. Dossett, M.; Lee, J.; Finn, C.E. Inheritance of phenological, vegetative, and fruit chemistry traits in black raspberry. J. Am. Soc. Hortic. Sci. 2008, 133, 408–417. [Google Scholar] [CrossRef] [Green Version]
  80. Connor, A.M.; Stephens, M.J.; Hall, H.K.; Alspach, P.A. Variation and heritabilities of antioxidant activity and total phenolic content estimated from a red raspberry factorial experiment. J. Am. Soc. Hortic. Sci. 2005, 130, 403–411. [Google Scholar] [CrossRef] [Green Version]
  81. González, M. Heritability of primocane-yield components in red raspberry. Acta Hortic. 2016, 1133, 75–80. [Google Scholar] [CrossRef]
  82. Stephens, M.J.; Alspach, P.A.; Beatson, R.A.; Winefield, C.; Buck, E.J. Genetic parameters and development of a selection index for breeding red raspberries for processing. J. Am. Soc. Hortic. Sci. 2012, 137, 236–242. [Google Scholar] [CrossRef] [Green Version]
  83. Stephens, M.J.; Alspach, P.A.; Beatson, R.A.; Winefield, C.; Buck, E.J. Genetic parameters and breeding for yield in red raspberry. J. Am. Soc. Hortic. Sci. 2012, 137, 229–235. [Google Scholar] [CrossRef] [Green Version]
  84. Fejer, S.O.; Spangelo, L.P.S. Three generations of inbreeding and S2 factorial test crosses in red raspberry cultivars. Can. J. Genet. Cytol. 1974, 16, 419–432. [Google Scholar] [CrossRef]
  85. Fejer, S.O. Inheritance of yield, yield components and fall fruiting habit in red raspberry diallel crosses. Can. J. Genet. Cytol. 1977, 19. [Google Scholar] [CrossRef]
  86. Radovich, A.; Fotirich Aksich, M.; Rakonjac, V.; Milivojevich, J.; Nikolich, D.; Nikolich, M. Diversity and relationship of yield components and fruit quality in promising floricane raspberry hybrids. Bulg. J. Agric. Sci. 2013, 19, 750–755. [Google Scholar]
  87. Cormack, M.R.; Woodward, P.J. Raspberry cultivar assessments at the national fruit trials and the scottish horticultural research institute. Expt. Hort. 1977, 29, 1–14. [Google Scholar]
  88. Clark, A. Senescence and the genetic-correlation hang-up. Am. Nat. 1987, 129, 932–940. [Google Scholar] [CrossRef]
  89. Sgrò, C.M.; Hoffmann, A. Genetic correlations, tradeoffs and environmental variation. Heredity 2004, 93, 241–248. [Google Scholar] [CrossRef]
  90. Haffner, K.; Rosenfeld, H.J.; Skrede, G.; Wang, L. Quality of red raspberry Rubus idaeus L. cultivars after storage in controlled and normal atmospheres. Postharvest Biol. Technol. 2002, 24, 279–289. [Google Scholar] [CrossRef]
  91. Yu, Y.; Yang, G.; Sun, L.; Song, X.; Bao, Y.; Luo, T.; Wang, J. Comprehensive evaluation of 24 red raspberry varieties in northeast China based on nutrition and taste. Foods 2022, 11, 3232. [Google Scholar] [CrossRef]
  92. Bradish, C.M.; Perkins-Veazie, P.; Fernandez, G.E.; Xie, G.; Jia, W. Comparison of flavonoid composition of red raspberries (Rubus idaeus L.) grown in the southern United States. J. Agric. Food Chem. 2012, 60, 5779–5786. [Google Scholar] [CrossRef]
Figure 1. Boxplots of the main morphological features of the fruits of 24 raspberry genotypes over three consecutive years (2015, 2016, and 2017) starting from the second year after the establishment of the plantation: (a) fruit length (mm); (b) fruit diameter (mm); (c) fruit weight (g); (d) shape index; (e) size index; (f) the number of drupelets/fruit (berry). Each boxplot represents minimum, lower quartile, median, upper quartile, and maximum values.
Horticulturae 09 00050 g001
Figure 2. Pearson correlation coefficients (‘r’ value) between the analyzed characteristics of the 24 raspberry genotypes. DM represents dry matter, TSS represents total soluble solids, and TA represents titratable acidity. Positive correlations are displayed in yellow and green with negative correlations in blue and violet. Color intensity and the size of the circle are proportional to the correlation coefficients. The boxes with a grey border illustrate statistically assured values of ‘r’ at an alpha level below 0.05.
Horticulturae 09 00050 g002
Figure 3. Principal component analysis (PCA) plot: the multivariate analysis performed for 24 raspberry genotypes (14 promising selections (clones), their parents, and Glen Ample cultivar as control) based on analyzed characteristics.
Horticulturae 09 00050 g003
Figure 4. The correspondence analysis (CA) of the 17 characteristics analyzed in the 24 raspberry genotypes (14 promising selections (clones), their parents, and Glen Ample cultivar as control).
Horticulturae 09 00050 g004
Figure 5. Hierarchical clustering analyses of the 24 raspberry genotypes (14 promising selections, their parents, and Glen Ample cultivar as control) based on 17 analyzed characteristics assessed via paired group UPGMA, the Gover similarity index. DM represents dry matter, TSS represents total soluble solids, and TA represents titratable acidity.
Horticulturae 09 00050 g005
Figure 6. The heterosis effect upon the 17 analyzed characteristics in three promising selections obtained from the hybridization of Tulameen × Autumn Bliss.
Horticulturae 09 00050 g006
Figure 7. The heterosis effect upon the 17 analyzed characteristics in three promising selections obtained from the hybridization of Glen Moy × Tulameen.
Horticulturae 09 00050 g007
Figure 8. The heterosis effect upon the 17 analyzed characteristics in two promising selections obtained from the hybridization of Willamette × Veten.
Horticulturae 09 00050 g008
Figure 9. The heterosis effect upon the 17 analyzed characteristics in two promising selections obtained from the hybridization of Tulameen × Pathfinder.
Horticulturae 09 00050 g009
Figure 10. The heterosis effect upon the 17 analyzed characteristics in two promising selections obtained from the hybridization of Tulameen × Opal.
Horticulturae 09 00050 g010
Figure 11. The heterosis effect upon the 17 analyzed characteristics in two promising selections obtained from the hybridization of Titan × Glen Prosen.
Horticulturae 09 00050 g011
Figure 12. Broad-sense heritability of the 17 traits analyzed in the experiment with 14 raspberry hybrids. DM represents dry matter, TSS represents total soluble solids, and TA represents titratable acidity.
Horticulturae 09 00050 g012
Figure 13. Broad-sense heritability (H2) and narrow-sense heritability (h2) of the 17 traits analyzed in the experiment with the selections belonging to the common parent represented by the Tulameen cultivar (used as mother—♀ or father—♂ genitor [(3♀ × Autumn Bliss) + (Glen Moy × 3♂) + (2♀ × Pathfinder) + (2♀ × Opal)] in half-sibling families). DM represents dry matter, TSS represents total soluble solids, and TA represents titratable acidity.
Horticulturae 09 00050 g013
Table 1. The average values of fruit length, fruit diameter, shape index, and size index for 24 raspberry genotypes (14 promising selections (clones), their parents, and Glen Ample cultivar as control).
No.GenotypeFruit Length
(mm)
Fruit Diameter
(mm)
Shape
Index
Size
Index
Mean ± SEMMean ± SEMMean ± SEMMean ± SEM
1Tulameen22.54 a ± 0.1216.58 d ± 0.331.36 a ± 0.0319.56 b ± 0.18
2Autumn Bliss19.51 a,b ± 0.1915.99 d ± 0.291.22 b ± 0.0217.75 c ± 0.17
3T 38 (Tulameen × Autumn Bliss)22.43 a ± 0.3922.21 a ± 0.521.01 d ± 0.0422.32 a ± 0.29
4T 25 (Tulameen × Autumn Bliss)23.10 a ± 0.4817.04 d ± 0.411.36 a ± 0.0620.07 b ± 0.25
5T 34 (Tulameen × Autumn Bliss)20.75 a,b ± 0.6219.32 c ± 0.421.07 d± 0.0220.03 b ± 0.47
6Glen Moy19.61 a,b ± 0.2015.89 d ± 0.29 1.23 b ± 0.0217.75 c ± 0.18
7GLT 18 (Glen Moy × Tulameen)21.69 a ± 0.3619.71 c ± 0.411.10 c ± 0.0320.70 b ± 0.34
8GLT 15 (Glen Moy × Tulameen)22.78 a ± 0.4220.85 a ± 0.351.09 c ± 0.0221.82 a ± 0.35
9GLT 12 (Glen Moy × Tulameen)20.81 a,b ± 0.6718.50 c ± 0.861.12 b,c ± 0.0319.66 b ± 0.54
10Willamette18.18 c ± 0.2617.24 d ± 0.201.05 c ± 0.0317.71 c ± 0.15
11Veten17.30 c,d ± 0.6415.60 d ± 0.261.11 b,c ± 0.0416.45 c,d ± 0.12
12WXVE 8 (Willamette × Veten)19.25 b ± 0.7420.88 a ± 0.390.92 e ± 0.0620.06 b ± 0.36
13WXVE 16 (Willamette × Veten)19.07 b ± 0.7219.48 b,c ± 0.410.98 d ± 0.0419.27 b ± 0.42
14Pathfinder18.34 b ± 0.4415.95 d ± 0.311.15 b ± 0.0417.14 c ± 0.30
15TXPE 3 (Tulameen × Pathfinder)18.78 b ± 0.2719.00 b,c ± 0.150.99 d ± 0.0118.89 b ± 0.15
16TXPE 6 (Tulameen × Pathfinder)19.03 b ± 0.2618.93 c ± 0.161.01 d ± 0.0118.98 b ± 0.15
17Opal18.75 b ± 0.4615.64 d ± 0.261.19 b ± 0.0317.20 c ± 0.24
18TXOE 13 (Tulameen × Opal)19.45 b ± 0.4319.81 b,c ± 0.340.98 d ± 0.0119.63 b ± 0.14
19TXOE 9 (Tulameen × Opal)15.77 b ± 0.3115.87 d ± 0.410.99 d ± 0.0215.82 d ± 0.18
20Titan16.45 d ± 0.1716.89 d ± 0.250.97 d ± 0.0216.67 c,d ± 0.12
21Glen Prosen19.28 b ± 0.2516.36 d ± 0.271.18 b ± 0.0217.82 c ± 0.22
22TXGPE 11 (Titan × Glen Prosen)16.63 d ± 0.2016.92 d ± 0.270.97 d ± 0.0216.78 c ± 0.22
23TXGPE 19 (Titan × Glen Prosen)18.54 b ± 0.2219.07 b,c ± 0.170.98 d ± 0.0118.80 b,c ± 0.14
24Glen Ample19.40 a,b ± 0.3315.83 d ± 0.171.23 b ± 0.0317.61 c ± 0.18
For each trait, any two means in a column followed by the same letter are not significantly different (Duncan’s test, α < 0.05). The horizontally separated lines separate half-sibling families and parental forms or cultivar(s) used as control.
Table 2. The average values for fruit production, fruit weight, number of drupelets per fruit, and non-marketable fruit per cane for 24 raspberry genotypes (14 promising selections (clones), their parents, and Glen Ample cultivar as control).
No.GenotypeYield
(kg/cane)
Fruit Weight
(g)
No. Drupelets/FruitNon-Marketable Fruit (g/cane)
Mean ± SEMMean ± SEMMean ± SEMMean ± SEM
1Tulameen0.42 a ± 0.052.97 c ± 0.0279.44 c ± 1.2732.07 a ± 4.03
2Autumn Bliss0.33 c ± 0.012.84 c ± 0.0268.35 d± 5.0226.63 b ± 1.63
3T 38 (Tulameen × Autumn Bliss)0.41 a ± 0.014.31 a ± 0.10105.91 a ± 0.9210.89 d ± 0.68
4T 25 (Tulameen × Autumn Bliss)0.28 c,d ± 0.043.13 c ± 0.06102.58 a ± 1.2811.04 d ± 4.70
5T 34 (Tulameen × Autumn Bliss)0.43 a ± 0.034.07 a,b ± 0.0890.03 b ± 1.0819.62 b,c ± 7.16
6Glen Moy0.38 b ± 0.012.79 c ± 0.0874.43 c ± 4.1431.93 a ± 4.01
7GLT 18 (Glen Moy × Tulameen)0.41 a ± 0.004.86 a± 0.1795.16 a ± 0.2221.73 b ± 9.71
8GLT 15 (Glen Moy × Tulameen)0.32 c ± 0.034.90 a ± 0.1473.16 c ± 0.8810.42 d ± 5.12
9GLT 12 (Glen Moy × Tulameen)0.31 c ± 0.023.95 a,b ± 0.2871.67 c ± 0.7715.13 c ± 5.97
10Willamette0.32 c ± 0.032.97 c ± 0.0380.58 b,c ± 1.8123.43 b ± 3.93
11Veten0.46 a ± 0.022.90 a ± 0.1979.19 c ± 0.6717.82 c ± 9.72
12WXVE 8 (Willamette × Veten)0.30 c ± 0.042.55 d ± 0.0960.26 b,c ± 0.2211.19 d ± 4.30
13WXVE 16 (Willamette × Veten)0.38 b ± 0.013.11 c ± 0.0680.58 b,c ± 0.7013.32 c,d ± 3.72
14Pathfinder0.35 b ± 0.012.85 c ± 0.0555.98 e ± 4.0414.53 c ± 9.27
15TXPE 3 (Tulameen × Pathfinder)0.39 b ± 0.013.96 b ± 0.0485.97 b ± 0.2914.12 c ± 5.36
16TXPE 6 (Tulameen × Pathfinder)0.19 d ± 0.022.52 d ± 0.0897.41 a ± 0.426.17 d ± 1.20
17Opal0.39 b ± 0.012.72 c ± 0.0650.09 f ± 0.37 9.36 d ± 2.70
18TXOE 13 (Tulameen × Opal)0.32 c ± 0.022.49 d ± 0.0386.51 b ± 0.2312.48 c,d ± 5.24
19TXOE 9 (Tulameen × Opal)0.29 c,d ± 0.022.77 c ± 0.0764.57 d ± 0.3912.11 c,d ± 3.82
20Titan0.30 c ± 0.052.40 d ± 0.0366.41 d ± 2.958.03 d ± 2.59
21Glen Prosen0.47 a ± 0.042.85 c ± 0.0563.30 d ± 4.3421.17 b ± 4.55
22TXGPE 11 (Titan × Glen Prosen)0.21 d ± 0.012.58 c ± 0.1064.70 d ± 0.1613.00 c,d ± 4.03
23TXGPE 19 (Titan × Glen Prosen)0.38 b ± 0.013.29 c ± 0.0873.07 c ± 0.3112.14 c,d ± 3.41
24Glen Ample0.42 a ± 0.033.05 c ± 0.0577.9 c ± 5.3136.30 a ± 2.09
For each trait, any two means in a column followed by the same letter are not significantly different (Duncan’s test, α < 0.05). The horizontally separated lines separate half-sibling families and parental forms or cultivar(s) used as control.
Table 3. The average values for different chemical compounds and pH in the fruits of 24 raspberry genotypes (14 promising selections (clones), their parents, and Glen Ample cultivar as control).
No.GenotypeDry Matter
(%)
Total Soluble Solids (%)Titratable Acidity (g/L Tartaric Acid)Pectin
(%)
pH
Mean ± SEMMean ± SEMMean ± SEMMean ± SEMMean ± SEM
1Tulameen11.27 a ± 0.279.24 b ± 0.291.89 b ± 0.010.37 d ± 0.113.16 a ± 0.04
2Autumn Bliss10.83 a ± 0.338.87 c ± 0.272.28 a ± 0.150.47 d ± 0.042.87 b ± 0.04
3T 38 (Tulameen × Autumn Bliss)10.77 a ± 0.159.85 a ± 0.141.05 d ± 0.020.56 d ± 0.023.10 a ± 0.06
4T 25 (Tulameen × Autumn Bliss)10.92 a ± 0.068.98 c ± 0.032.17 a ± 0.040.36 d ± 0.033.10 a ± 0.01
5T 34 (Tulameen × Autumn Bliss)10.00 b ± 0.469.03 c ± 0.022.14 a ± 0.030.38 d ± 0.023.02 a ± 0.04
6Glen Moy11.17 a ± 0.128.94 c ± 0.201.81 b ± 0.090.45 d ± 0.042.97 a,b ± 0.02
7GLT 18 (Glen Moy × Tulameen)10.90 b ± 0.069.47 b ± 0.150.93 d ± 0.032.00 a ± 0.062.51 c ± 0.02
8GLT 15 (Glen Moy × Tulameen)11.70 a ± 0.129.01 c ± 0.010.80 d ± 0.091.41 b ± 0.122.88 b ± 0.31
9GLT 12 (Glen Moy × Tulameen)11.30 a ± 0.219.32 b ± 0.011.37 c ± 0.021.05 c ± 0.012.81 b ± 0.13
10Willamette10.03 b ± 0.188.62 d ± 0.292.07 a ± 0.070.33 d ± 0.063.20 a ± 0.00
11Veten12.70 a ± 0.478.90 c ± 0.202.65 a ± 0.140.36 d ± 0.034.47 a ± 0.01
12WXVE 8 (Willamette × Veten)11.93 a ± 0.048.83 c ± 0.102.06 a ± 0.020.23 d ± 0.013.26 a ± 0.04
13WXVE 16 (Willamette × Veten)10.17 b ± 0.079.02 c ± 0.011.75 b ± 0.050.39 d ± 0.013.22 a ± 0.02
14Pathfinder10.20 b ± 0.648.83 c ± 0.141.88 b ± 0.020.30 d ± 0.063.25 a ± 0.03
15TXPE 3 (Tulameen × Pathfinder)11.11 a ± 0.059.10 c ± 0.061.63 b ± 0.020.24 d ± 0.013.22 a ± 0.01
16TXPE 6 (Tulameen × Pathfinder)10.80 a ± 0.129.13 c ± 0.081.84 b ± 0.090.37 d ± 0.033.33 a ± 0.01
17Opal10.63 a ± 0.149.51 b ± 0.102.22 a ± 0.010.30 d ± 0.053.74 a ± 0.03
18TXOE 13 (Tulameen × Opal)12.07 a ± 0.468.72 c,d ± 0.021.67 b ± 0.030.51 d ± 0.022.87 b ± 0.04
19TXOE 9 (Tulameen × Opal)10.80 a ± 0.158.80 c ± 0.091.69 b ± 0.020.38 d ± 0.012.97 a,b ± 0.02
20Titan11.50 a ± 0.269.41 b ± 0.112.17a ± 0.010.46 d ± 0.022.90 a,b ± 0.01
21Glen Prosen11.13 a ± 0.358.85 c ± 0.011.41 c ± 0.010.50 d ± 0.002.86 b ± 0.02
22TXGPE 11 (Titan × Glen Prosen)10.30 a,b ± 0.069.23 b,c ± 0.121.78 b ± 0.010.46 d ± 0.022.90 a,b ± 0.01
23TXGPE 19 (Titan × Glen Prosen)10.62 a,b ± 0.068.83 c ± 0.012.10 a ± 0.010.47 d ± 0.032.83 b ± 0.02
24Glen Ample10.53 a,b ± 0.478.90 c ±0.201.94 a,b ± 0.040.28 d ± 0.023.25 a ± 0.05
For each trait, any two means in a column followed by the same letter are not significantly different (Duncan’s test, α < 0.05). The horizontally separated lines separate half-sibling families and parental forms or cultivar(s) used as control.
Table 4. The average values for glucose, fructose, sucrose, and reducing sugar in the fruits of 24 raspberry genotypes (14 promising selections (clones), their parents, and Glen Ample cultivar as control).
No.GenotypeGlucose
(g/100 g)
Fructose
(g/100 g)
Sucrose
(g/100 g)
Reducing Sugar (g/100 g)
Mean ± SEMMean ± SEMMean ± SEMMean ± SEM
1Tulameen2.33 b ± 0.163.73 c ± 1.141.45 b ± 0.176.37 c ± 0.06
2Autumn Bliss2.10 c ± 0.362.21 d ± 0.051.59 a,b ± 0.195.90 c ± 0.17
3T 38 (Tulameen × Autumn Bliss)1.87 d ± 0.032.60 d ± 0.011.77 a ± 0.016.24 c ± 0.03
4T 25 (Tulameen × Autumn Bliss)2.12 c ± 0.052.44 d ± 0.131.74 a ± 0.026.30 c ± 0.11
5T 34 (Tulameen × Autumn Bliss)1.63 d ± 0.122.35 d ± 0.081.72 a ± 0.015.70 c,d ± 0.10
6Glen Moy1.77 d ± 0.022.20 d ± 0.051.48 b ± 0.285.45 d ± 0.30
7GLT 18 (Glen Moy × Tulameen)2.40 b ± 0.067.34 a ± 0.071.83 a ± 0.1011.57 a ± 0.11
8GLT 15 (Glen Moy × Tulameen)2.72 a ± 0.126.13 b ± 0.081.27 c ± 0.0410.12 b ± 0.18
9GLT 12 (Glen Moy × Tulameen)1.61 d ± 0.032.86 d ± 0.031.44 b ± 0.035.91 c,d ± 0.11
10Willamette1.91 c ± 0.272.61 d ± 0.051.46 b ± 0.295.97 c,d ± 0.17
11Veten2.46 b ± 0.013.07 c ± 0.051.78 a ± 0.016.64 c ± 0.33
12WXVE 8 (Willamette × Veten)2.40 b ± 0.022.64 d ± 0.061.35 b,c ± 0.026.39 c ± 0.06
13WXVE 16 (Willamette × Veten)1.64 d ± 0.022.67 d ± 0.031.43 b ± 0.025.74 c,d ± 0.07
14Pathfinder1.68 d ± 0.052.22 d ± 0.061.45 b ± 0.115.35 d ± 0.15
15TXPE 3 (Tulameen × Pathfinder)1.74 d ± 0.032.23 d ± 0.071.35 b,c ± 0.035.32 d ± 0.12
16TXPE 6 (Tulameen × Pathfinder)1.78 d ± 0.022.31 d ± 0.011.68 a ± 0.025.77 c,d ± 0.02
17Opal2.06 c ± 0.042.56 d ± 0.051.49 b ± 0.026.11 c ± 0.47
18TXOE 13 (Tulameen × Opal)1.73 d ± 0.012.36 d ± 0.031.70 a ± 0.015.79 c,d ± 0.09
19TXOE 9 (Tulameen × Opal)1.63 d ± 0.062.21 d ± 0.011.72 a ± 0.065.56 c,d ± 0.09
20Titan1.83 c,d ± 0.032.07 d ± 0.041.22 c ± 0.055.12 d ± 0.05
21Glen Prosen1.92 c ± 0.102.10 d ± 0.011.35 b,c ± 0.175.38 c,d ± 0.28
22TXGPE 11 (Titan × Glen Prosen)1.80 c,d ± 0.022.07 d ± 0.041.13 c ± 0.025.01 d ± 0.04
23TXGPE 19 (Titan × Glen Prosen)1.89 c,d ± 0.022.11 d ± 0.011.65 a,b ± 0.025.65 c,d ± 0.09
24Glen Ample1.74 d ± 0.062.25 d ± 0.071.60 a,b ± 0.095.60 c,d ± 0.20
For each trait, any two means in a column followed by the same letter are not significantly different (Duncan’s test, α < 0.05). The horizontally separated lines separate half-sibling families and parental forms or cultivar(s) used as control.
Disclaimer/Publisher’s Note: The statements, opinions and data contained in all publications are solely those of the individual author(s) and contributor(s) and not of MDPI and/or the editor(s). MDPI and/or the editor(s) disclaim responsibility for any injury to people or property resulting from any ideas, methods, instructions or products referred to in the content.

