Article

The Application of Nitrogen, Phosphorus, and Potassium Regulate the Growth and Morphological Development of Torreya grandis (Taxaceae) Saplings

College of Forestry and Landscape Architecture, Anhui Agricultural University, Hefei 230036, China
*
Authors to whom correspondence should be addressed.
These authors contributed equally to this work.
Horticulturae 2023, 9(11), 1203; https://doi.org/10.3390/horticulturae9111203
Submission received: 26 September 2023 / Revised: 30 October 2023 / Accepted: 3 November 2023 / Published: 5 November 2023
(This article belongs to the Special Issue New Insight of Horticultural Crops Growth Regulation)

Abstract

:
Torreya grandis Fort. ex Lindl. cv. “Merrillii” is an important woody oil crop, and the development of plantations relies on the cultivation of high-quality saplings. For this study, 6-year-old grafted T. grandis saplings, which will soon be planted on the mountain, were selected to investigate the regulatory effects of nitrogen (N), phosphorus (P), and potassium (K) on their growth and morphology. To determine the optimal dosage and ratio of N–P–K fertilizer for sapling cultivation, we employed a three-factor four-level L16 (43) orthogonal experiment design. The experiment included a total of 17 treatments—a control group where no fertilizer was applied and 16 treatments with varying levels of NPK supply. We conducted a one-season experiment under a prescribed fertilizer regime and measured root collar diameters and sapling heights, the root, shoot, leaf biomass, total biomass, and the nutritional status of plant organs (root, shoot, leaf). From these measurements, we calculated the root–shoot ratio (RS) and seedling quality index (QI). The application of N–P–K fertilizer exhibited significant benefits for T. grandis sapling cultivation, promoted their growth and biomass accumulation and altered the nutrient allocation patterns in organs. Ultimately, we determined the ideal N–P–K ratio for T. grandis growth to be 1:0.46:0.75, with a fertilizer application of 1.38 g·sapling−1 of N, 0.64 g·sapling−1 of P (P2O5), and 1.04 g·sapling−1 of K (K2O).

1. Introduction

Adequate management is critical for the growth of saplings. Proper fertilization is pivotal when sowing forestry crops as it ensures robust sapling growth and enhances their quality [1]. Nutritional elements serve as the cornerstone for plant metabolic activities [2]. The application of fertilizer not only supplements essential nutrients but also maintains soil fertility, which leads to rapid growth and improved sapling quality [3].
Considering the limited supply of soil nutrients, it is essential to properly supplement the “three essential elements of fertilizers”: nitrogen (N), phosphorus (P), and potassium (K) [4,5,6,7]. Nutrient limitations arise when the available soil nutrients fail to meet the potential nutrient requirements of forests [3]. Nitrogen contributes significantly, as it accounts for 40–50% of plant growth and serves as a crucial building block for proteins, nucleic acids, chlorophyll, and certain growth hormones in plants, which profoundly impact photosynthesis levels [8,9]. Phosphorus is a prevalent nutrient limitation for plant growth. It is not only essential for the synthesis of nuclear proteins and phospholipids, but it also stimulates cell division and energy transport. Additionally, it promotes both aboveground and belowground growth and has a central role in various aspects of plant metabolism [10,11,12,13,14]. Potassium has a significant impact on plant growth, development, and metabolism and extensively participates in the activation of enzymes that are important for growth and modification and regulate cellular osmosis [15,16]. Moreover, K enhances photosynthesis, affects product quality, and mitigates the adverse effects of abiotic stressors [15,17,18]. The excessive application of fertilizer diminishes its utilization efficacy, raises production costs, contributes to soil and water pollution, and escalates the incidence of plant diseases and pests. In contrast, the insufficient application of fertilizer hinders normal plant growth and development [19,20,21,22]. Fertilization has emerged as a vital intervention strategy in forestry [23], as it stimulates robust sapling growth and enhances afforestation success rates; thus, enhancing tree nutrient supplies through fertilization is a practical approach [1]. Forest fertilization accelerates the growth of established stands, reduces the rotation period, and mitigates projected wood shortages [24]. It is well established that fertilizing nutrient-limited locations, particularly those with limited N and P, improves tree productivity by enhancing both short-term photosynthesis and long-term leaf area [25,26].
Torreya grandis “Merrillii” is a relic species of the Taxaceae family and an ancient evergreen coniferous tree that is renowned for its unique presence in the subtropical regions of China. It has been designated as a second-level protected plant in the country [27,28], with its fruits containing diverse unsaturated fatty acids and proteins, offering medicinal properties, such as antifungal and anticancer effects [29,30]. Consequently, this species holds significant value for both consumption and medicinal purposes as an important and extensively cultivated tree species in Southeastern China [31]. Torreya grandis has significant economic value and can be utilized for its fruits, oil extraction, medicinal applications, and as an ornamental tree. Moreover, its economic benefits have the potential to endure for centuries or even millennia. Additionally, it contributes to ecological conservation by promoting soil and water preservation, regulating the climate, and safeguarding biodiversity [32]. Although the cultivated area of T. grandis has expanded in recent years, the lack of precise forest management due to variations in geographical environments, climate conditions, sapling cultivation methods, and maintenance practices in different planting regions has resulted in the inconsistent growth quality of T. grandis saplings, thereby affecting their subsequent cultivation efficiency.
The development of appropriately balanced fertilization strategies is critical for improving plant quality while meeting environmental requirements. Moreover, proper nutrient ratios have the potential to reduce fertilizer usage [33,34,35]. Each balanced fertilization model possesses unique characteristics that are suitable for specific regions, plant species, and fertilizer types. An assessment of the adaptability of widely used balanced fertilization models in Europe revealed that no single model is universally applicable to all plants [36,37]. Hence, it is necessary to investigate and identify the optimal N–P–K fertilization approach for T. grandis.
For this study, to meet the demand for a scientifically-based fertilization model for T. grandis, orthogonal experiments were conducted to observe 6-year-old saplings. The objective of this work was to investigate the impacts of various fertilization ratios on the growth and morphological development of T. grandis. We analyzed the growth and morphological changes, as well as the nutrient levels of N, P, and K, in plant organs (leaves, shoots, and roots) under fertilization. The principal component analysis (PCA) method was utilized to analyze the fertilizer management system of T. grandis, aiming to provide a theoretical basis for determining the optimal fertilizer method for T. grandis saplings.

2. Materials and Methods
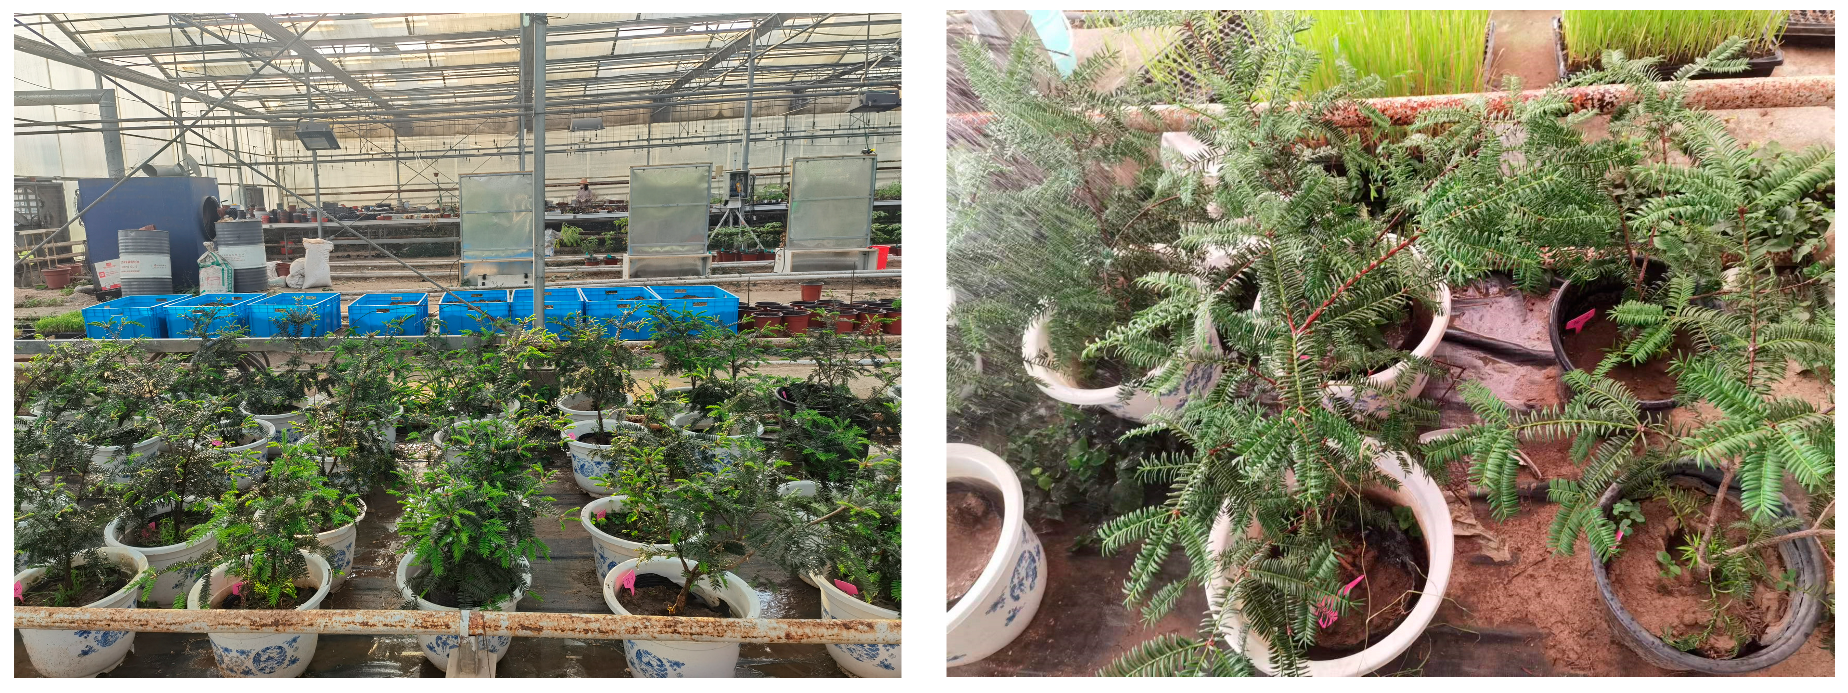
2.1. Study Area

The experiment was conducted in a greenhouse of the Nongcui Garden of Anhui Agricultural University in Hefei, Anhui Province (31°83′ N, 117°25′ E), China, which falls under a North Subtropical Monsoon Climate. In the last 10 years, this region has experienced an average annual temperature that ranges from 15.6 °C to 17.1 °C and receives an annual precipitation of from 900 to 1100 mm. The frost-free period lasts for ~228 days, and the annual sunlight duration is ~2000 h. A drip irrigation system was implemented for irrigation purposes, which was activated when the soil moisture content dropped below 85% of the saturation level. The experiment took place in a greenhouse where the daytime temperature remained at 26 °C for 16 h, followed by a night-time temperature of 16 °C for 8 h. The relative humidity was recorded at 80%, and the light intensity measured was 90 Wm−2.

2.2. Materials

The experimental saplings comprised 6-year-old grafted T. grandis that demonstrated relatively consistent growth. The rootstock was a 2-year-old wild T. grandis, and the grafting process proceeded for 4 years (Figure 1). A total of 102 saplings were included in the study, and no significant differences were observed in terms of their plant height and root diameter (average plant height: 64.5 ± 2.05 cm, average root collar diameter: 19.85 ± 0.98 mm). The sapling containers were black polyethylene plastic (Ø22 cm upper × Ø20 cm lower × 18 cm high) that were filled with mountain yellow-brown soil, and prior to transplantation, ~100 g of decomposed rapeseed cake fertilizer was applied. The following table presents the specific soil properties (Table 1).

2.3. Experimental Design

The experiment employed an L16 (43) orthogonal design with three factors (N, P, and K) at four levels each. There were 17 treatments with 6 replicates for each treatment, including a control group (CK) with no fertilization, as well as 16 other treatments with varying NPK supply levels. The chemicals employed were urea (CO(NH4)2), superphosphate (Ca(H2PO4)2), and potassium sulphate(K2SO4). Fertilization was applied on four occasions (September and December 2021, March and early June 2022). The amount of applied fertilizer remained consistent for each fertilization event. The specific fertilizer amounts utilized are detailed in Table 2. Water-soluble fertilizer was applied using a premeasured ratio mixed with 1 liter of water (the CK used an equal amount of water) and then irrigated around the base of the saplings after loosening the soil prior to fertilization.

2.4. Measured Sapling Attributes

2.4.1. Height and Root Collar Diameter of Saplings

Sapling height and root collar diameter measurements were conducted every three months starting from September 2021, for a total of four times. To ensure the consistency of measurements and growth stages, the assessments were performed on the last day of each month. Sapling heights were measured using a steel tape measure with an accuracy of 0.1 cm, while root collar diameters were measured using a vernier caliper with an accuracy of 0.01 mm.

2.4.2. Determination of Biomass

At the end of August 2022, three randomly selected experimental saplings from each treatment were used for biomass determination. The saplings were carefully removed from their containers and rinsed with distilled water. Subsequently, the fresh weights of roots, branches, and leaves were measured using an electronic balance. The samples were then placed in a drying oven at 105 °C for 30 min to achieve blanching, followed by drying at 75 °C until a constant weight was obtained. Finally, the dry weights of each organ were measured with an accuracy of 0.01 g.

2.4.3. Determination of N, P, and K

After measuring the biomass of the plants, the plant samples were placed in an oven and dried at a temperature of 75 °C until a constant weight was reached. The different tissue samples were dried and sieved through 60 mesh (<0.25 mm) after being crushed. The samples (0.2 g) were weighed and then digested using sulfuric acid–hydrogen peroxide. After the digestion of the samples, measurements were carried out using instrumental standard methods. The total N and P were determined using an AA3 continuous flow analyzer (SEAL, Norderstedt, Germany). The total K was quantified via a flame photometer (FP6400, Shanghai, China). Each treatment sample was measured three times.

2.5. Data Processing and Analysis

2.5.1. Calculation of Comprehensive Index

Based on the sapling growth data (height, root collar diameter, and roots, shoots, and leaves dry weights), the following indices were calculated:
  • Sapling root–shoot ratio (RS) = root biomass (g)/(stem biomass + leaves biomass) (g);
  • Seedling quality index (QI) = TM/(HD + SR) [38,39,40].
TM: Total biomass of seedling (g); HD: Seedling height (cm)/seedling root collar diameter (mm); SR: Stem biomass (g)/root biomass (g).

2.5.2. Data Analysis

Shapiro–Wilk and Levene tests revealed that the data conformed to the normal distribution and had an equal variance. Excel 2021 and SPSS 26.0 (Chicago, IL, USA) statistical software programs were used for statistical analysis. A factorial analysis of variance (ANOVA), range analysis, principal component analysis, and the Duncan test were performed to analyze variances and for multiple comparisons (α = 0.05). Graphs were rendered using GraphPad Prism 9 (GraphPad Software Inc., San Diego, CA, USA) software.

3. Results

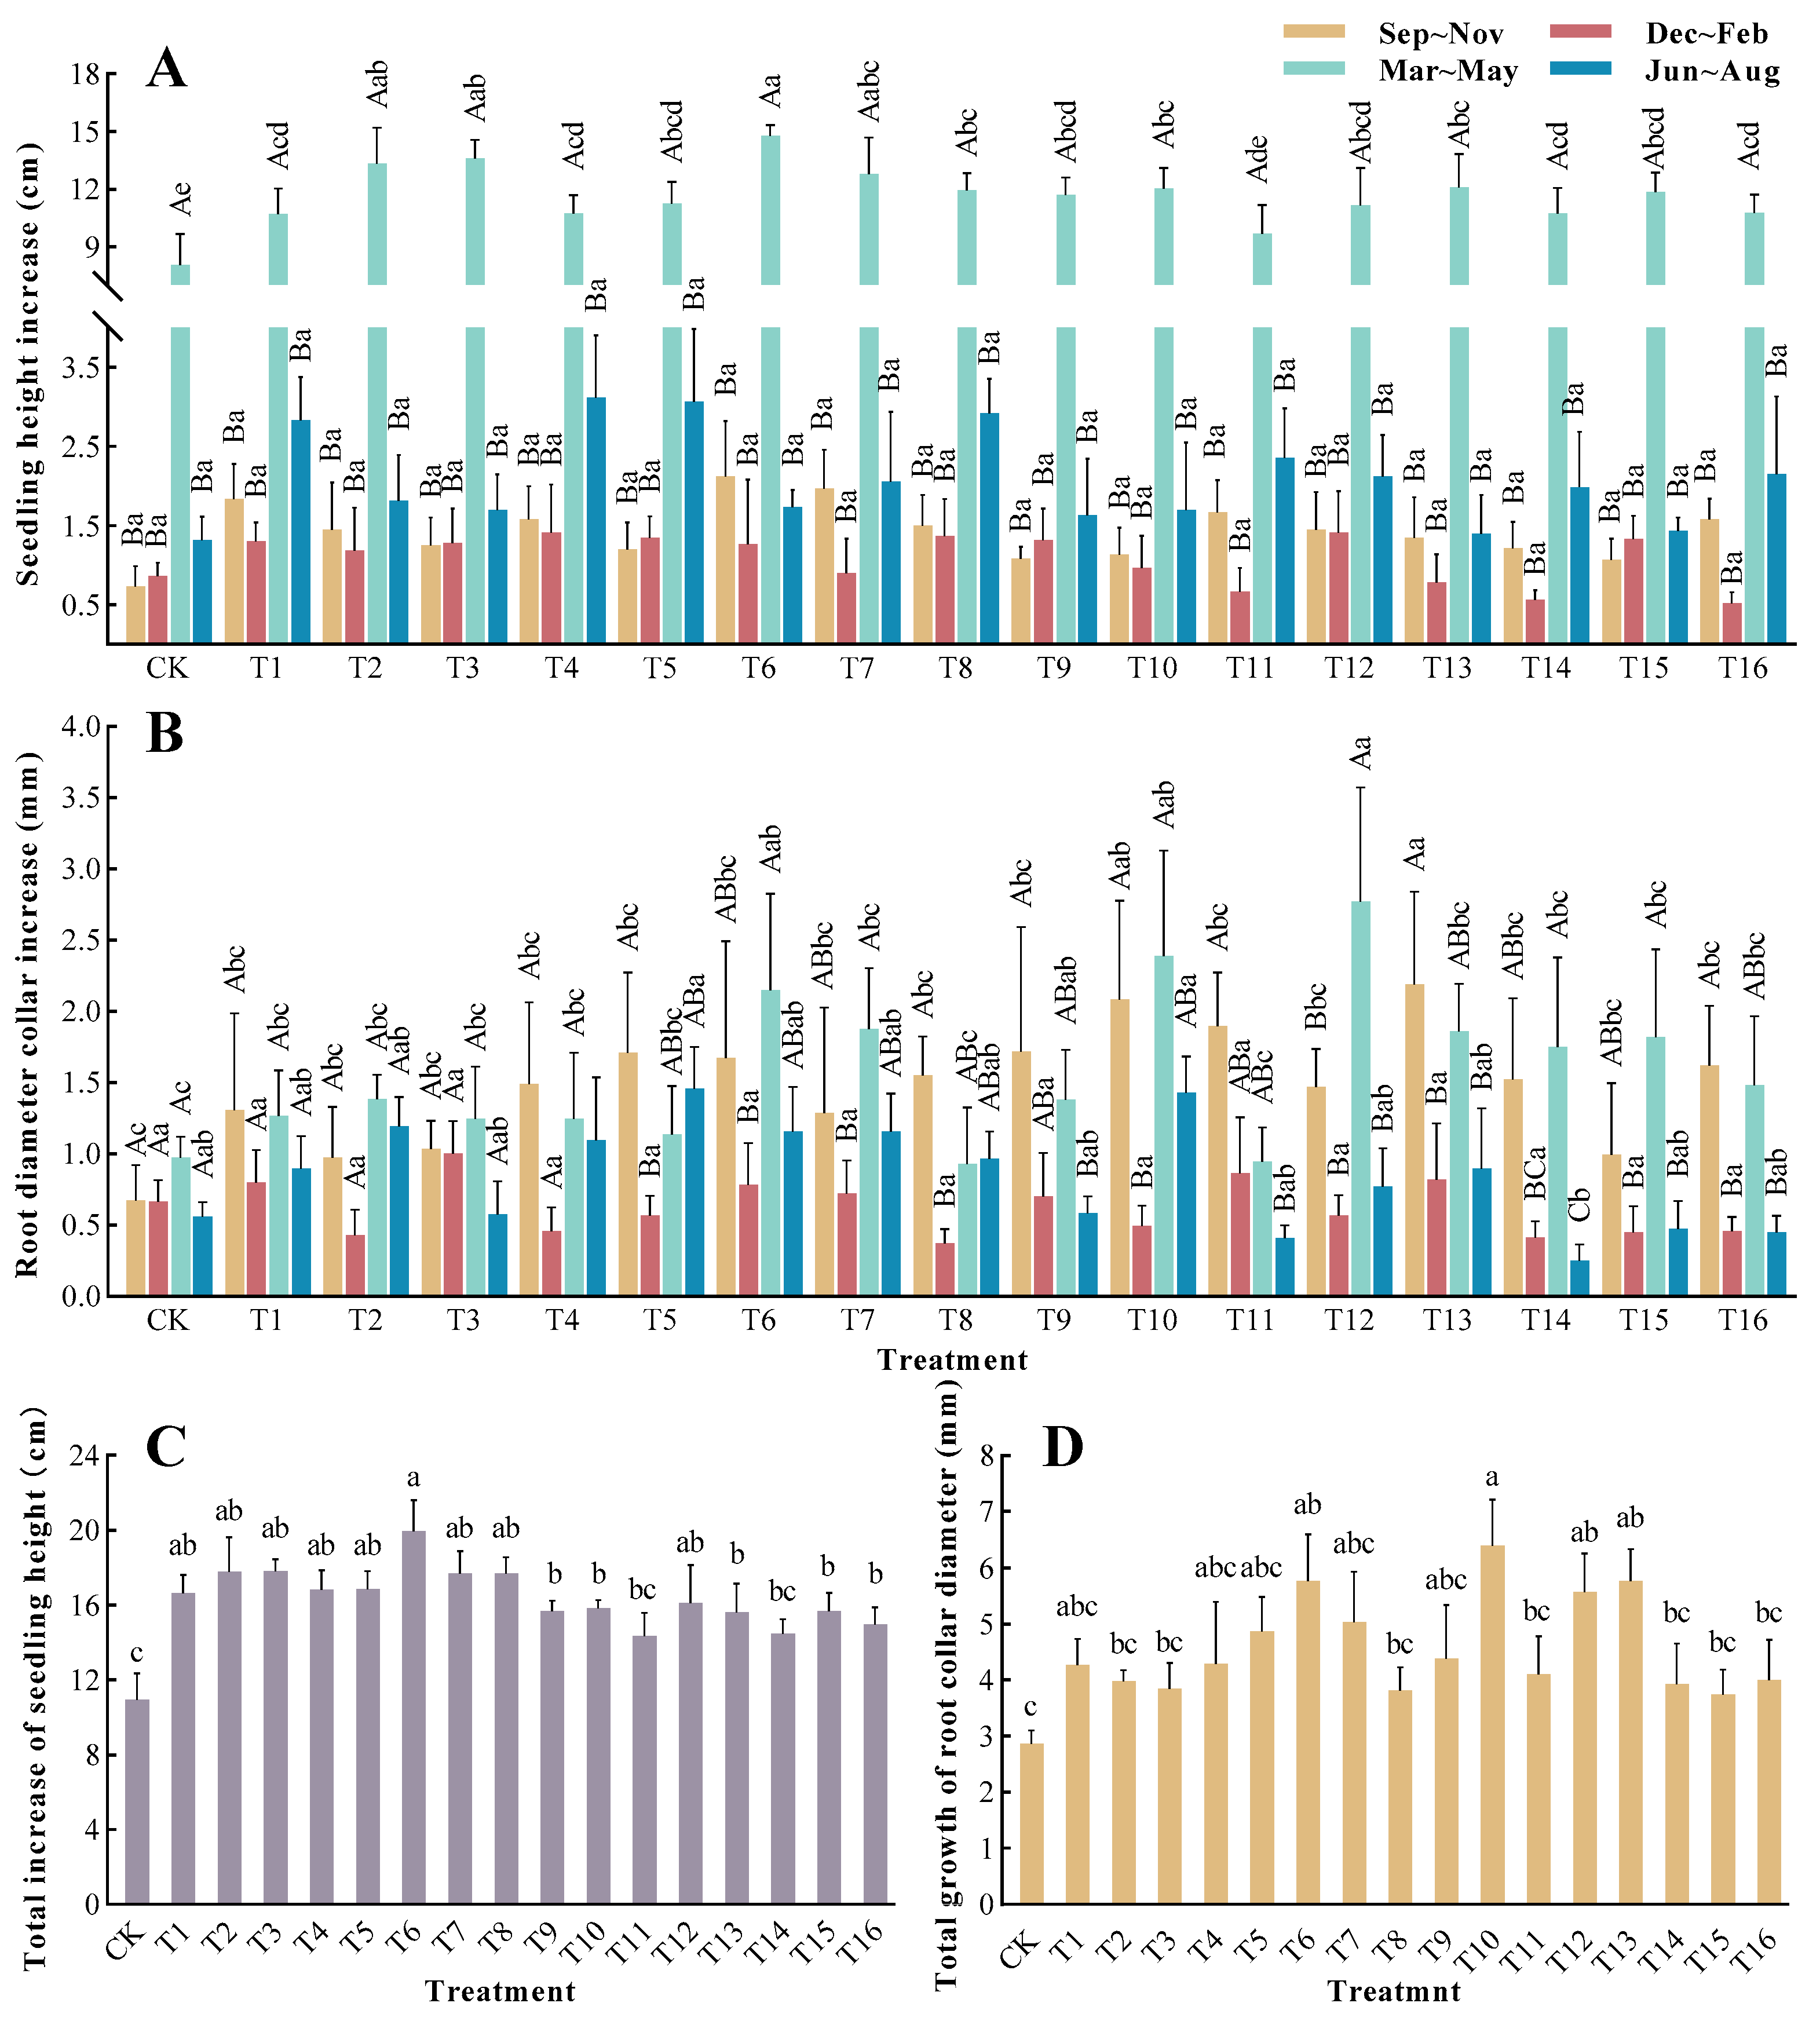
3.1. Effects of Different Fertilization Treatments on the Growth of Torreya grandis

Different growth periods had significant impacts on sapling height increments (p < 0.01), as did different fertilizer ratios on their total height increment (THI) (Figure 2). There is a tendency to promote sapling growth during the two fertilization periods, from September to February; however, there were no significant differences between the various treatments (p > 0.05). From March to May, except for the T11 group, there were significant differences between the CK (p < 0.05) and the other treatment groups. Among them, the T6 treatment group exhibited the best growth, with an increase of 84.31% in sapling height, in contrast to the CK. From June to August, the T4 treatment group showed the greatest increment in sapling height, and there were no significant variations between the different treatments. The THI of all treatment groups was higher than that of the CK, except for the T11 and T14 groups, and the differences between the CK and the other treatment groups were significant. Among them, the THI of the T6 treatment group was the highest (19.91 cm), which was an increase of 81.82% compared with the CK.
The results of the main effects and range analyses of the three factors (N, P, and K) indicated that only the N fertilizer had a significant impact on the THI (p < 0.01) (Table 3 and Table 4). The range analysis results indicated that the factors that influenced the growth of T. grandis THI were ranked in the following order: N > P > K.
A comparison of the growth trends of the root collar diameter after each fertilization revealed that it was basically consistent with the increase in sapling height. The different time periods had significant impacts on the root collar diameter increments (p < 0.01), and different ratio treatments had a significant impact on the total root collar diameter increment (TDI) (p < 0.05) (Figure 2). During the September to November fertilization period, the T13 treatment group had the highest increment, and there was a significant difference compared with the CK. From December to February, the growth of the root collar diameter was slow, and there were no significant differences between the treatments (p > 0.05). From March to May, the root collar diameters of T. grandis saplings entered a rapid growth stage, and there were significant differences between the T6, T10, and T12 groups compared to the CK group. From June to August, the growth rate gradually slowed down, with higher increments in the T5 and T10 groups. The TDI of the T6, T10, T12, and T13 groups showed significant differences compared with the CK group, where the T10 treatment group had the highest TDI (6.29 mm), which was 123.43% higher than the TDI of the CK group. The T12 treatment group, which had the lowest increase, also showed an improvement of 30.77% compared with the CK group.
The analysis of variance for the main effects of N, P, and K revealed that only the K fertilizer had a significant influence on the TDI (p = 0.055) (Table 3 and Table 4). The range analysis results indicated that the factors that influenced the growth of T. grandis TDI were ranked in the following order: K > N > P.

3.2. Impacts of Different Fertilization Treatments on Root–Shoot Ratio, Sapling Biomass and Seedling Quality Index

Besides the root–shoot ratio (RS), the various fertilization treatments significantly influenced the biomass of organs and the seedling quality index (QI) (p < 0.01) (Figure 3). Among the treatment groups, T7 exhibited the highest accumulation of leaf, shoot, root biomass, and total biomass, with increases of 71.96%, 77.85%, 118.62%, and 96.34%, respectively, compared with the CK. All differences were statistically significant (p < 0.05). Except for the T5, T13, and T16 treatment groups, the RS of the other treatment groups were higher than those in the CK group. However, only the T3 treatment group exhibited a significant difference. The T13 treatment group had the lowest QI, followed by the CK group; however, there was no significant difference between the two. The QI of the T3, T4, T5, T6, T7, T9, and T12 treatment groups was significantly higher than that of the CK group. The T7 treatment group exhibited the highest QI, which was 167.31% higher than that of the CK group.
The analysis of variance and range analysis revealed that the main factors that influenced the biomass and QI of T. grandis saplings were ranked in the following order: N > P > K.

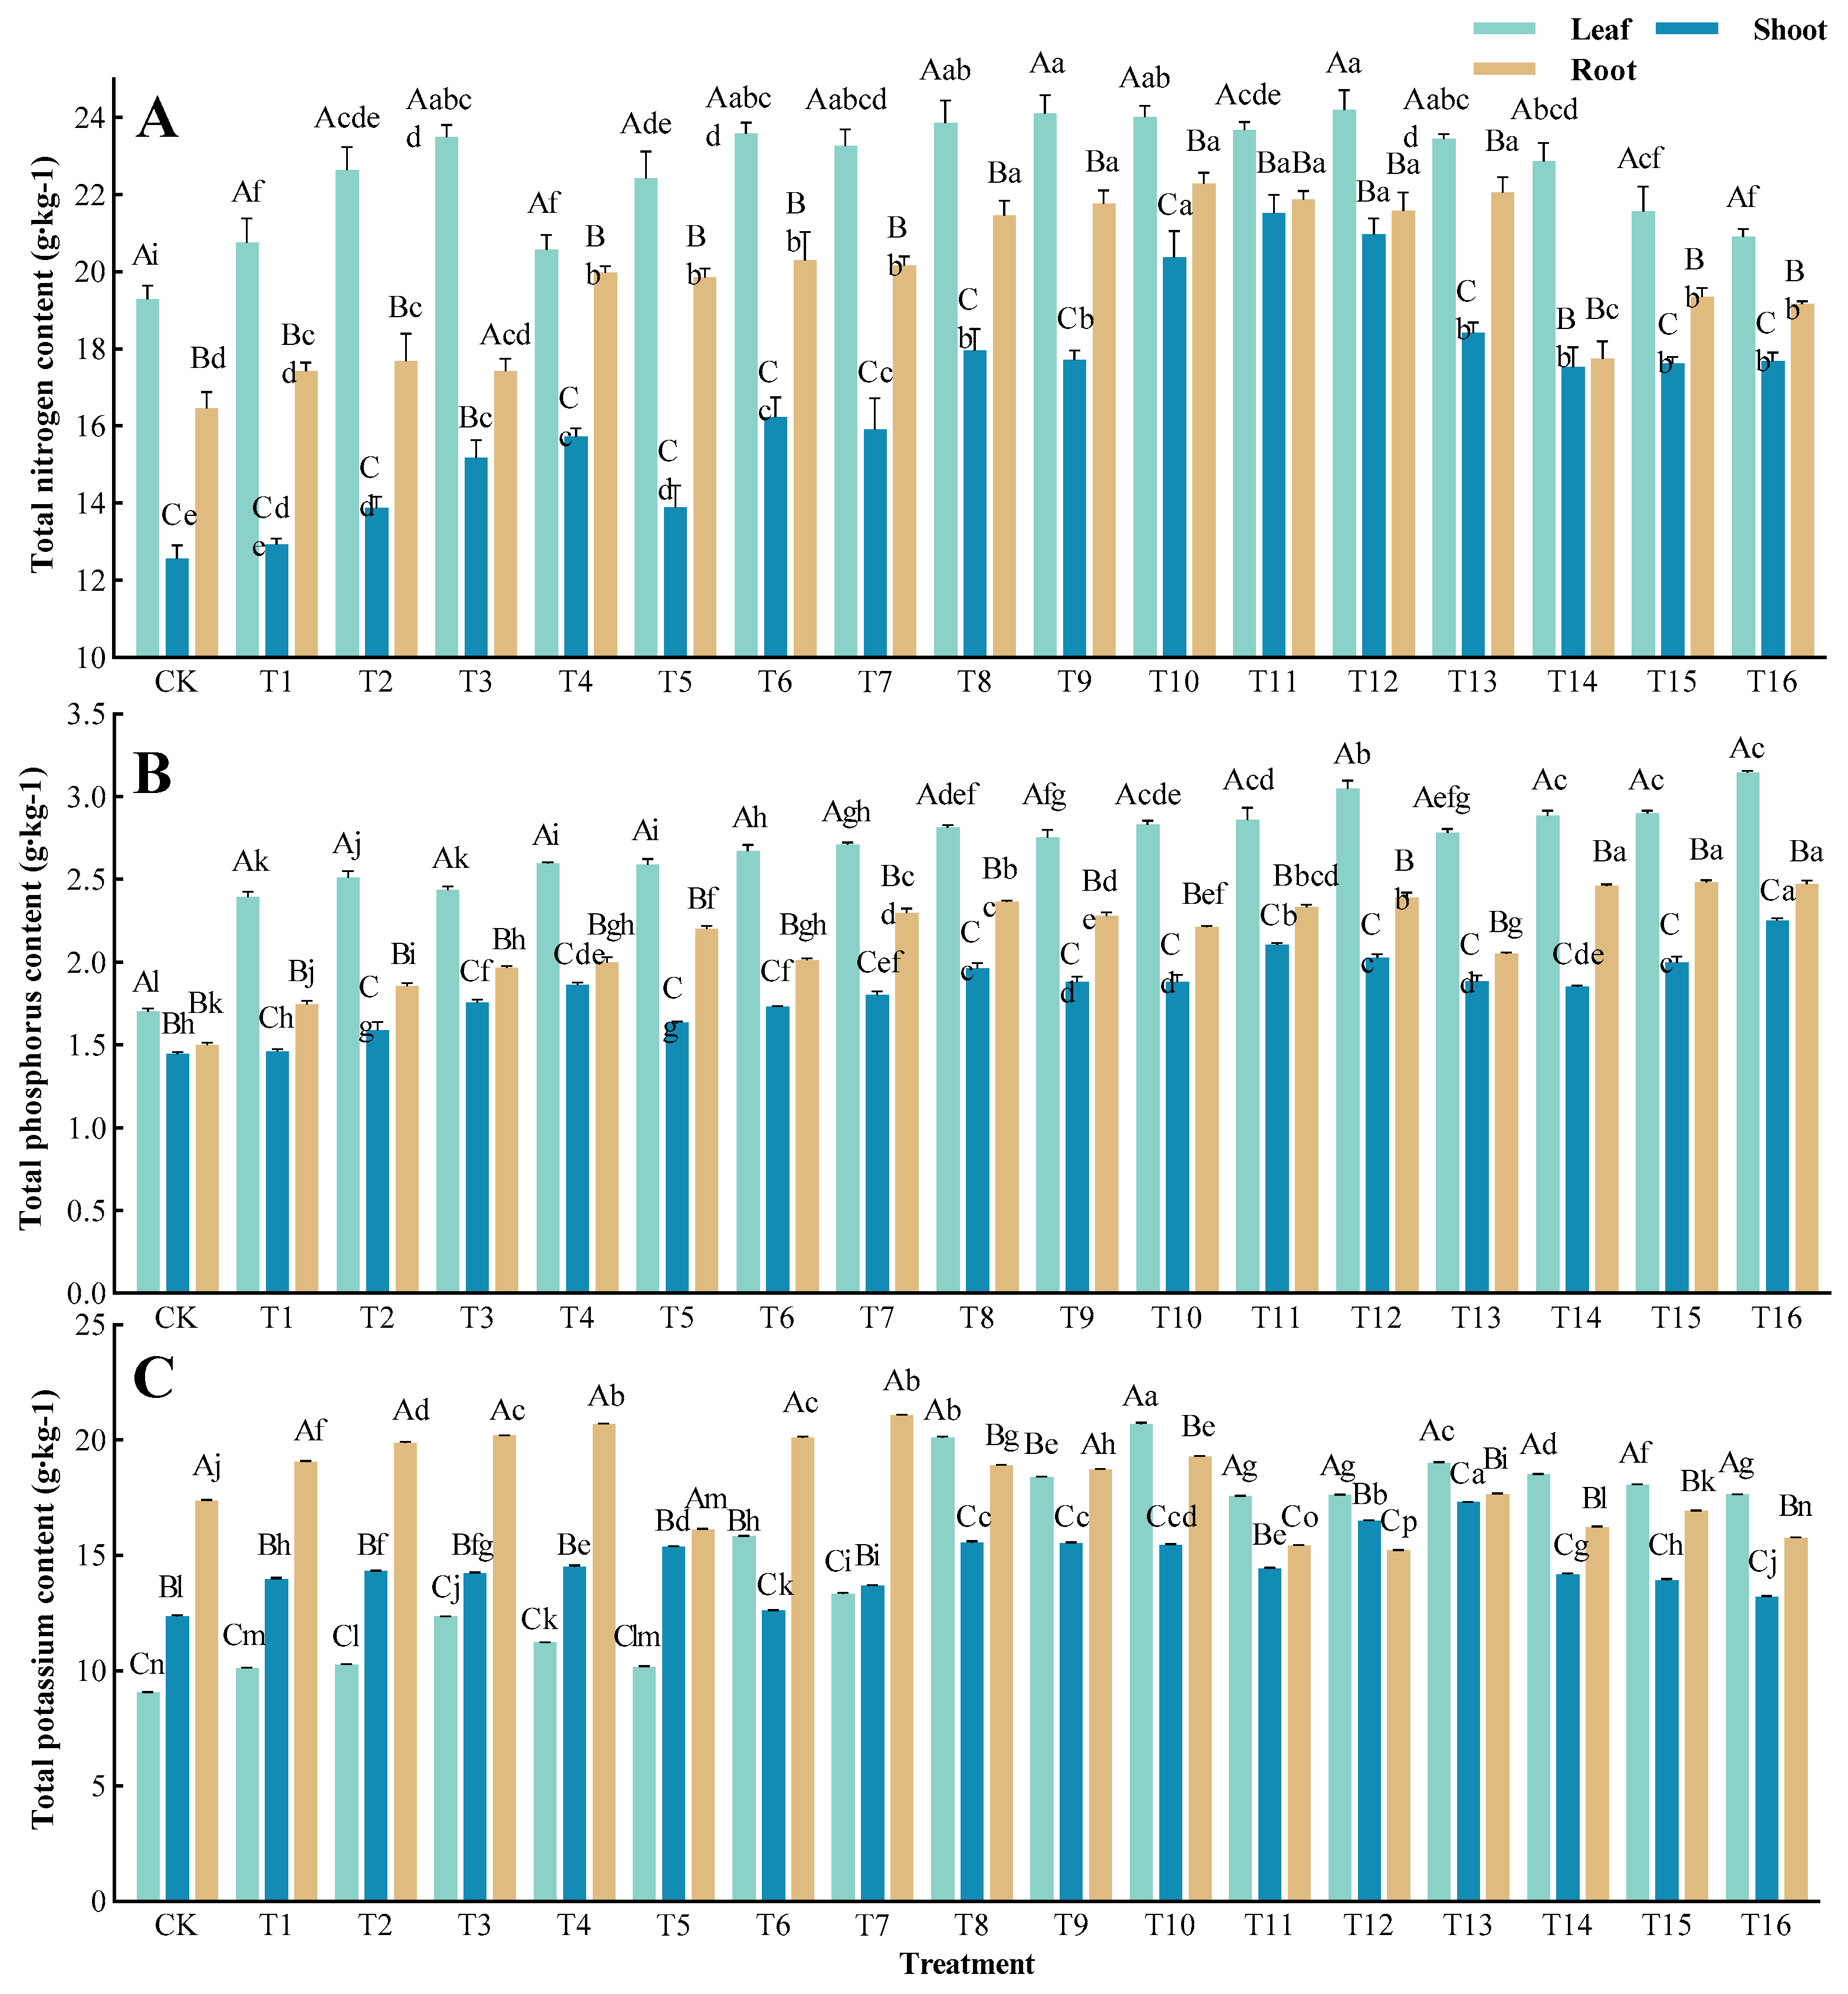
3.3. Impacts of Different Fertilization Treatments on the Nutrient Content of Sapling Organs

To assess the impacts of different fertilization treatments on saplings, we focused on comparing the nutrient content of each organ during biomass harvest (Figure 4). Significant interactions were observed between different ratio treatments and organs, which greatly influenced the nutrient content (p < 0.01). Regarding the Total nitrogen (TN) content and Total phosphorus (TP) content, the nutrients followed the pattern of shoot < root < leaf. The TN content ranged between 19.29 to 24.20 g·kg−1 in the leaves, 12.57 to 21.51 g·kg−1 in the shoots, and 16.46 to 22.29 g·kg−1 in the roots. The T12 treatment group had the highest TN content in the leaves (125.45% of CK), while the T11 and T10 treatment groups had the highest shoot (171.12% of CK) and root (135.42% of CK) TK content, respectively. Although variations in the TP content were negligible, fertilization significantly increased the TP content of all organs. The T16 treatment group exhibited the highest increase in TP content in the leaves (185.29% of CK) and shoots (155.17% of CK). The T15 treatment group had the highest TP content in the roots, showing a 0.98 g·kg−1 increase compared to the CK. For the Total potassium (TK) content, the untreated T. grandis saplings exhibited a pattern of leaf < shoot < root, while under some fertilization treatments, the pattern shifted to shoot < root < leaf. All treatment groups showed a significant deviation from the CK. The T10 treatment group had the highest TK content in the leaves (228.59% of CK), while the T13 and T7 treatment groups had the highest shoots (137.45% of CK) and roots (121.37% of CK) TK content, respectively.

3.4. Comprehensive Analysis

The seedling quality index (QI) is a quantitative criterion for evaluating saplings based on the seedling height, collar diameter, and dry weight, which provides a visual reflection of the sapling’s growth status. Generally, a higher QI indicates better seedling quality. Among the 17 fertilization treatments, those with the highest QI values were T7, T12, and T9 (Figure 3).
As the indices measured in this study were too great, and the change rules of these indices were not very consistent under different NPK ratios and fertilization frequencies, a comprehensive analysis of the measured indices was performed using the principal component analysis (PCA) method. PCA is a statistical analysis method that divides the plurality of original variables into a few comprehensive indicators, replacing the original variables with fewer new variables by utilizing the correlations between the original variables. Moreover, as the data reflected from the original variables were retained in these few new variables as much as possible, the complexity of the resulting variables decreased.
Based on the results of the PCA, the Kaiser–Meyer–Olkin (KMO) test yielded a value of 0.176, while the Bartlett sphericity test resulted in a significant result (p < 0.01), indicating the possibility of further conducting an eigenvalue analysis. Thus, four principal components with eigenvalues of >1 were retained. As these four principal components account for 86.15% of the variance in the original variables, the scores derived from these components accurately reflected the results. Table 5 presents the final scoring formulas for each principal component. Based on the ranking and final scores of the principal components in Table 6, the T12, T10, and T8 treatments achieved relatively high comprehensive scores. Therefore, the optimal fertilization treatment for T. grandis saplings was T12, with N–P–K fertilizer rates of 1.38 g·sapling−1 N, 0.64 g·sapling−1 (P2O5), and 1.04 g·seedlin−1 (K2O).

4. Discussion

4.1. Fertilization Promotes Plant Growth

Fertilization is one of the main practices in container sapling nurseries, which functions to improve sapling quality [41]. Important indicators of sapling quality include sapling height and root collar diameter, and changes in these indicators can provide insights into the impacts of fertilization [42]. Yang et al. [41] found that fertilization significantly increased the sapling heights and root collar diameters of Phoebe bournei (Hemsl.), along with nutrient accumulation and utilization, which aligned with the conclusions of this study. In our study, as the fertilization quantity increased, both the sapling height and root collar diameter of T. grandis exhibited remarkable growth. The largest increase in sapling height was observed under the T6 treatment, while the T10 treatment resulted in the greatest increase in the root collar diameter. However, under excessive fertilization, the sapling height and root collar diameter growth decelerated or even declined as it had a toxic effect [41]. Thus, the proper application of N, P, and K can stimulate the vertical growth and root collar diameter expansion of saplings [43].
Torreya grandis is a slow-growing tree species, with more rapid growth observed during the spring and summer seasons, particularly in the spring when all organ tissues exhibit rapid growth. In contrast, the growth rate is slower during the autumn and winter seasons, thus presenting a “slow-fast-slow” trend throughout the annual cycle [44]. This study demonstrated that the sapling height and root collar diameter increments of T. grandis responded differently to fertilization with varying N–P–K ratios. Moreover, the growth rates varied significantly for different time periods. Fertilization strongly influenced various growth indicators from March to August, which implied its positive impact on sapling growth without altering its seasonal growth characteristics [1]. However, the effects of fertilization on T. grandis growth from September to the following February were less apparent. This may have been attributed to the lower plant metabolism under the colder conditions of a temperate climate, which resulted in a delay of nutrient accumulation in the soil, thus exhibiting a certain lag effect [45,46,47].

4.2. Effects of Fertilization on the Biomass and Nutrient Status of Torreya grandis

The accumulation of plant biomass has been demonstrated to be intimately related to the increased availability of nutrients [48]. Biomass not only reflects the productivity of saplings but also indicates the relationships between the development and distribution of plant organs [49]. Various fertilization treatments exhibit different distribution patterns, with moderate fertilization being beneficial for the accumulation of biomass in various plant organs. However, excessive fertilization can translate to a reduction in plant biomass and even result in inconsistent organ proportions [50,51,52], which was similar to the findings of this study. The impacts of fertilization on plant growth, development, and biomass largely depends on the coordination of nutrient absorption, assimilation, and distribution in plant organs [53,54]. In this experiment, the biomass of each organ and the total biomass were highest under the T7 fertilization treatment. However, as the fertilization level increased, the biomass of each organ and the total biomass decreased, with a greater proportion of biomass being allocated to belowground organs or certain aboveground organs, leading to severe resource imbalances and a decline in sapling quality. Under such resource imbalances, the distribution of nutrients in organs also underwent changes, which was likely due to nutrients exceeding the optimal range and entering the toxic range [41]. It is known that N plays an essential role in the accumulation of nutrients in T. grandis organs, while P and K dominate in the stem thickness-to-root crown ratios of its saplings [41,55]. This was consistent with the results of this study and further indicated that the appropriate application of N–P–K fertilizer can improve the growth quality of saplings.
Research has shown that fertilization can alter the nutrient distribution patterns of sapling organs, with more nutrients being transported to the roots and shoots, thereby expanding the range of nutrient uptake and enhancing resource utilization [56]. Fertilization accelerates nutrient absorption and utilization to ensure the adequate production required for sapling growth and development [2]. Our results demonstrated that during the growth of T. grandis saplings, more nutrients were allocated to leaves and roots, and certain fertilization treatments altered the distribution patterns of K in organs. This is due to the leaves and roots, which serve as primary organs for the absorption and utilization of nutrients in plants, and more nutrients will be distributed to the leaves and roots [57]. Following the application of K, the proportion of N and biomass allocation to sapling roots increased. When the efficacy of N and P in the soil increased, any additional N and P were allocated to the roots, thereby enhancing the absorption of other soil resources to meet the growth and development demands of saplings [56,58,59,60].

4.3. Effects of Fertilization on the Quality Index of T. grandis Saplings

An ideal root–crown ratio is a desirable plant attribute, and QI is one way to assess the balance of seedling morphologies [39]. In this experiment, the T7 fertilization treatment had the highest QI; however, as the fertilization level increased, the QI decreased, which indicated that the moderate application of N, P, and K fertilizers could improve the QI. This is because N, P, and K are major nutrients required for normal plant growth and development, which play various roles in different physiological processes. Moderate N can enhance photosynthetic N fixation capacities, promote the synthesis of photosynthetic pigments in leaves, accelerate photosynthesis, and facilitate the production of non-structural carbohydrates [8,9]. Appropriate P levels can promote root growth, while K can increase root biomass, promote stem growth, and facilitate the belowground transport of photosynthetic products [16]. When nutrient concentrations reach excessively high levels, the growth of T. grandis saplings can be hindered. This indicates that excessively high nutrient concentrations reach toxic levels, which may increase the stem-to-crown ratio and reduce the QI [61,62]. Excessive N can promote the growth of shoots and leaves while inhibiting root development, which can lead to poor root growth [63]. Excessive P limits plant growth, resulting in stunted growth and abnormal or deformed root development [12]. Excessive K can cause plants to become overly vigorous, with thicker stems and more leaves, while inhibiting root development [64,65]. Within the scope of fertilization for this experiment, N had the greatest impact on QI, followed by P and K (N > P > K). In contrast, Yang et al. [41] found that N had the greatest effect on QI, followed by K and then P, which may have been due to species variations and different fertilization ranges. The fertilization treatments in this study enabled us to determine the optimal nutrient range to maximize the QI of T. grandis.

5. Conclusions

This experiment investigated the effects of the combined application of N, P, and K on the growth and morphological development of T. grandis saplings. The results confirmed that fertilization is an important management measure for the cultivation of T. grandis saplings. Fertilization promoted the growth of T. grandis and improved various growth indicators, as well as the accumulation of nutrients. Based on the measurements of T. grandis growth, an optimal fertilization ratio and amount were determined: N:P2O5:K2O ratio of 1:0.46:0.75 and fertilization amount of 1.38 g·sapling−1 (N), 0.64 g·sapling−1 (P2O5), and 1.04 g·sapling−1 (K2O). It is recommended to apply fertilization 1–2 times from March to August to allocate more resources during this period. The findings of this study have practical significance for regulating the morphological development of T. grandis, optimizing fertilization techniques, and formulating sapling cultivation protocols. They provide a reference for improving the growth quality of T. grandis saplings, as well as for afforestation and landscape gardening in mountain areas and parks.

Author Contributions

Conceptualization, S.F.; methodology, X.M. (Xiaomin Ma); software, D.H. and C.H.; formal analysis, Y.T. and F.Y.; investigation, X.M. (Xiaoxiang Ma), D.H. and Y.T.; resources, H.L.; data curation, C.H. and X.M. (Xiaomin Ma); writing—original draft preparation, X.M. (Xiaomin Ma) and D.H.; writing—review and editing, S.F.; visualization, X.M. (Xiaomin Ma); supervision, S.F. All authors have read and agreed to the published version of the manuscript.

Funding

This research was funded by the Key Research Program of the Anhui Provincial Department of Education (grant number KJ2019A0218) and the Huzhou Natural Science Foundation Project (2022YZ19).

Data Availability Statement

Not applicable.

Acknowledgments

The authors would like to thank Xiaoliang Ren and Yuanyuan Chen (Anhui Agricultura University) for their support in the collection of field data.

Conflicts of Interest

The authors declare no conflict of interest.

References

  1. Deng, S.; Shi, K.; Ma, J.; Zhang, L.; Ma, L.; Jia, Z. Effects of Fertilization Ratios and Frequencies on the Growth and Nutrient Uptake of Magnolia wufengensis (Magnoliaceae). Forests 2019, 10, 65. [Google Scholar] [CrossRef]
  2. Asante, M.O.O.; Ahiakpa, J.K.; Amoatey, C.; Adjei-Nsiah, S. Effect of shade and level of fertilizer application on nutrient uptake and dry matter partitioning in cocoyam (Xanthosoma sagittifolium L.). J. Plant Nutr. 2017, 40, 2312–2325. [Google Scholar] [CrossRef]
  3. Haque, M.M.; Biswas, J.C.; Islam, M.R.; Islam, A.; Kabir, M.S. Effect of long-term chemical and organic fertilization on rice productivity, nutrient use-efficiency, and balance under a rice-fallow-rice system. J. Plant Nutr. 2019, 42, 2901–2914. [Google Scholar] [CrossRef]
  4. Pennazio, S. Mineral nutrition of plants: A short history of plant physiology. Riv. Di. Biol. 2005, 98, 215–236. [Google Scholar]
  5. Meharg, A. Marschner′s Mineral Nutrition of Higher Plants. 3rd edition. Edited by P. Marschner. Amsterdam, Netherlands: Elsevier/Academic Press (2011), pp. 684, USA124.95. ISBN 978-0-12-384905-2. Exp. Agr. 2012, 48, 305. [Google Scholar] [CrossRef]
  6. Elser, J.J.; Bracken, M.E.; Cleland, E.E.; Gruner, D.S.; Harpole, W.S.; Hillebrand, H.; Ngai, J.T.; Seabloom, E.W.; Shurin, J.B.; Smith, J.E. Global analysis of nitrogen and phosphorus limitation of primary producers in freshwater, marine and terrestrial ecosystems. Ecol. Lett. 2007, 10, 1135–1142. [Google Scholar] [CrossRef]
  7. Aerts, R.; Chapin, F.S. The Mineral Nutrition of Wild Plants Revisited: A Re-evaluation of Processes and Patterns. In Advances in Ecological Research; Academic Press: Cambridge, MA, USA, 1999; Volume 30, pp. 1–67. [Google Scholar]
  8. Luo, J.; Qin, J.; He, F.; Li, H.; Liu, T.; Polle, A.; Peng, C.; Luo, Z.B. Net fluxes of ammonium and nitrate in association with H+ fluxes in fine roots of Populus popularis. Planta 2013, 237, 919–931. [Google Scholar] [CrossRef] [PubMed]
  9. Gusewell, S. N: P ratios in terrestrial plants: Variation and functional significance. New Phytol. 2004, 164, 243–266. [Google Scholar] [CrossRef]
  10. Warren, C.R. How does P affect photosynthesis and metabolite profiles of Eucalyptus globulus? Tree Physiol. 2011, 31, 727–739. [Google Scholar] [CrossRef]
  11. Marschner, C. Book Review. J. Plant Physiol. 1995, 148, 765. [Google Scholar] [CrossRef]
  12. Gan, H.; Jiao, Y.; Jia, J.; Wang, X.; Li, H.; Shi, W.; Peng, C.; Polle, A.; Luo, Z.B. Phosphorus and nitrogen physiology of two contrasting poplar genotypes when exposed to phosphorus and/or nitrogen starvation. Tree Physiol. 2016, 36, 22–38. [Google Scholar] [CrossRef]
  13. Burman, U.; Garg, B.K.; Kathju, S. Effect of Phosphorus Application on Clusterbean under Different Intensities of Water Stress. J. Plant Nutr. 2009, 32, 668–680. [Google Scholar] [CrossRef]
  14. Dos Santos, M.G.; Ribeiro, R.V.; de Oliveira, R.F.; Machado, E.C.; Pimentel, C. The role of inorganic phosphate on photosynthesis recovery of common bean after a mild water deficit. Plant Sci. 2006, 170, 659–664. [Google Scholar] [CrossRef]
  15. Li, X.; Mu, C.; Lin, J.; Wang, Y.; Li, X. Effect of Alkaline Potassium and Sodium Salts on Growth, Photosynthesis, Ions Absorption and Solutes Synthesis of Wheat Seedlings. Exp. Agr. 2013, 50, 144–157. [Google Scholar] [CrossRef]
  16. Coskun, D.; Britto, D.T.; Kronzucker, H.J. The physiology of channel-mediated K+ acquisition in roots of higher plants. Physiol. Plant 2014, 151, 305–312. [Google Scholar] [CrossRef] [PubMed]
  17. Mäser, P.; Gierth, M.; Schroeder, J.I. Molecular mechanisms of potassium and sodium uptake in plants. Plant Soil 2002, 247, 43–54. [Google Scholar] [CrossRef]
  18. Cakmak, I. The role of potassium in alleviating detrimental effects of abiotic stresses in plants. J. Plant Nutr. Soil Sci. 2005, 168, 521–530. [Google Scholar] [CrossRef]
  19. Glass, A.D.M. Nitrogen Use Efficiency of Crop Plants: Physiological Constraints upon Nitrogen Absorption. Criti. Rev. Plant Sci. 2010, 22, 453–470. [Google Scholar] [CrossRef]
  20. Raun, W.R.; Solie, J.B.; Johnson, G.V.; Stone, M.L.; Mullen, R.W.; Freeman, K.W.; Thomason, W.E.; Lukina, E.V. Improving Nitrogen Use Efficiency in Cereal Grain Production with Optical Sensing and Variable Rate Application. Agron. J. 2002, 94, 815–820. [Google Scholar] [CrossRef]
  21. Bussi, C.; Smith, M.A.L. Effects of nitrogen and potassium fertilization on the growth, yield and pitburn of apricot (cv. Bergeron). J. Hort. Sci. Bio. 1998, 73, 387–392. [Google Scholar] [CrossRef]
  22. Bussi, C.; Besset, J.; Girard, T. Effects of fertilizer rates and dates of application on apricot (cv Bergeron) cropping and pitburn. Sci. Hortic. 2003, 98, 139–147. [Google Scholar] [CrossRef]
  23. Fox, T.R.; Lee Allen, H.; Albaugh, T.J.; Rubilar, R.; Carlson, C.A. Tree Nutrition and Forest Fertilization of Pine Plantations in the Southern United States. S. J. Appl. Fores. 2007, 31, 5–11. [Google Scholar] [CrossRef]
  24. Wertz, S.; Leigh, A.K.K.; Grayston, S.J. Effects of long-term fertilization of forest soils on potential nitrification and on the abundance and community structure of ammonia oxidizers and nitrite oxidizers. FEMS Microbiol. Ecol. 2012, 79, 142–154. [Google Scholar] [CrossRef] [PubMed]
  25. Gough, C.M.; Seiler, J.R.; Maier, C.A. Short-term effects of fertilization on loblolly pine (Pinus taeda L.) physiology. Plant Cell Environ. 2004, 27, 876–886. [Google Scholar] [CrossRef]
  26. King, N.T.; Seiler, J.R.; Fox, T.R.; Johnsen, K. Post-fertilization physiology and growth performance of loblolly pine clones. Tree Physiol. 2008, 28, 703–711. [Google Scholar] [CrossRef]
  27. FAO. Kuaijishan Ancient Chinese Torreya, China. Available online: http://www.fao.org/giahs/giahsaroundtheworld/designated-sites/asia-and-the-acific/kuajishan-ancient-chinese-torreya/en (accessed on 10 May 2021).
  28. MOA. Available online: http://www.moa.gov.cn/ztzl/zywhycsl/dypzgzywhyc/ (accessed on 10 May 2021).
  29. Huang, Y.; Wang, J.; Li, G.; Zheng, Z.; Su, W. Antitumor and antifungal activities in endophytic fungi isolated from pharmaceutical plants Taxus mairei, Cephalataxus fortunei and Torreya grandis. FEMS Immunol. Med. Microbiol. 2001, 31, 163–167. [Google Scholar] [CrossRef] [PubMed]
  30. Chen, B.Q.; Cui, X.Y.; Zhao, X.; Zhang, Y.H.; Piao, H.S.; Kim, J.H.; Lee, B.C.; Pyo, H.B.; Yun, Y.P. Antioxidative and acute antiinflammatory effects of Torreya grandis. Fitoterapia 2006, 77, 262–267. [Google Scholar] [CrossRef] [PubMed]
  31. Tang, H.; Hu, Y.-Y.; Yu, W.-W.; Song, L.-L.; Wu, J.-S. Growth, photosynthetic and physiological responses of Torreya grandis seedlings to varied light environments. Trees 2015, 29, 1011–1022. [Google Scholar] [CrossRef]
  32. Han, Y.; Wang, G.G.; Wu, T.; Chen, W.; Ji, Y.; Jin, S. Fertilization Failed to Make Positive Effects on Torreya grandis in Severe N-Deposition Subtropics. Sustainability 2021, 13, 9736. [Google Scholar] [CrossRef]
  33. Chu, H.; Lin, X.; Fujii, T.; Morimoto, S.; Yagi, K.; Hu, J.; Zhang, J. Soil microbial biomass, dehydrogenase activity, bacterial community structure in response to long-term fertilizer management. SBB 2007, 39, 2971–2976. [Google Scholar] [CrossRef]
  34. Kanchikerimath, M.; Singh, D. Soil organic matter and biological properties after 26 years of maize–wheat–cowpea cropping as affected by manure and fertilization in a Cambisol in semiarid region of India. Agr. Eco. Env. 2001, 86, 155–162. [Google Scholar] [CrossRef]
  35. Cai, Z.C.; Qin, S.W. Dynamics of crop yields and soil organic carbon in a long-term fertilization experiment in the Huang-Huai-Hai Plain of China. Geoderma 2006, 136, 708–715. [Google Scholar] [CrossRef]
  36. Osmond, D.L. Nitrogen fertilizer requirements for maize produced in the tropics: A comparison of three computer-based recommendation systems. Agric. Syst. 1996, 50, 37–50. [Google Scholar] [CrossRef]
  37. Konde, N.M.; Kanase, N.M.; Jadhao, S.M.; Goud, V.V. Yield targetting equation for soybean with conjoint use of manure and chemical fertilizer based on fertility gradient approach. Ann. Plant Physiol. 2009, 23, 210–214. [Google Scholar]
  38. Dickson, A.; Leaf, A.L.; Hosner, J.F. Quality Appraisal of White Spruce and White Pine Seedling Stock in Nurseries. For. Chron. 1960, 36, 10–13. [Google Scholar] [CrossRef]
  39. Dickson, A.; Leaf, A.L.; Hosner, J.F. Seedling Quality—Soil Fertility Relationship of White Spruce, and Red and Whit Pine iin Nurseries. For. Chron. 1960, 36, 48–52. [Google Scholar]
  40. Puttonen, P. Criteria for using seedling performance potential tests. New For. 1989, 3, 67–87. [Google Scholar] [CrossRef]
  41. Yang, Z.-J.; Wu, X.-H.; Grossnickle, S.C.; Chen, L.-H.; Yu, X.-X.; El-Kassaby, Y.A.; Feng, J.-L. Formula Fertilization Promotes Phoebe bournei Robust Seedling Cultivation. Forests 2020, 11, 781. [Google Scholar] [CrossRef]
  42. Valinger, E.; Sjögren, H.; Nord, G.; Cedergren, J. Effects on stem growth of Scots pine 33 years after thinning and/or fertilization in northern Sweden. Sca. J. For. Res. 2018, 34, 33–38. [Google Scholar] [CrossRef]
  43. Guo, J.; Wu, Y.; Wang, B.; Lu, Y.; Cao, F.; Wang, G. The Effects of Fertilization on the Growth and Physiological Characteristics of Ginkgo biloba L. Forests 2016, 7, 293. [Google Scholar] [CrossRef]
  44. Thomas, A.; Priault, P.; Piutti, S.; Dallé, E.; Marron, N. Growth dynamics of fast-growing tree species in mixed forestry and agroforestry plantations. For. Ecol. Manag. 2021, 480, 118672. [Google Scholar] [CrossRef]
  45. Yang, Z.-J.; Wu, X.-H.; Chen, L.-H.; Huang, L.-M.; Chen, Y.; Wu, J.; El-Kassaby, Y.A.; Grossnickle, S.C.; Feng, J.-L. Fertilization Regulates Accumulation and Allocation of Biomass and Nutrients in Phoebe bournei Seedlings. Agriculture 2021, 11, 1187. [Google Scholar] [CrossRef]
  46. López-Sandoval, D.C.; Duarte, C.M.; Agustí, S. Nutrient and temperature constraints on primary production and net phytoplankton growth in a tropical ecosystem. Limnol. Oceanogr. 2021, 66, 2923–2935. [Google Scholar] [CrossRef]
  47. Jankovska-Bortkevič, E.; Gavelienė, V.; Koryznienė, D.; Jankauskienė, J.; Mockevičiūtė, R.; Jurkonienė, S. Response of winter oilseed rape to imitated temperature fluctuations in autumn-winter period. Environ. Exp. Bot. 2019, 166, 103801. [Google Scholar] [CrossRef]
  48. Kamil, K.R.; Anita, K. Evaluation of a different fertilisation in technology of corn for silage, sugar beet and meadow grasses production and their impact on the environment in Poland. Afr. J. Agr. Res. 2015, 10, 1351–1358. [Google Scholar] [CrossRef]
  49. Hedwall, P.-O.; Gong, P.; Ingerslev, M.; Bergh, J. Fertilization in northern forests—Biological, economic and environmental constraints and possibilities. Sca. J. For. Res. 2014, 29, 301–311. [Google Scholar] [CrossRef]
  50. Dinesh, T.; Zuzana, M. Rhizome trait scaling relationships are modulated by growth conditions and are linked to plant fitness. Ann. Bot. 2022, 137, 116253. [Google Scholar]
  51. Zaczek, J.J.; Baer, S.G.; Dalzotto, D.J. Fire and Fertilization Effects on the Growth and Spread of Rhizome-Transplanted Giant Cane (Arundinaria gigantea). Restor. Ecol. 2010, 18, 462–468. [Google Scholar] [CrossRef]
  52. Guarise, M.; Borgonovo, G.; Bassoli, A.; Ferrante, A. Effect of Fertilization on Yield and Quality of Sisymbrium officinale (L.) Scop. Grown as Leafy Vegetable Crop. Agronomy 2019, 9, 401. [Google Scholar] [CrossRef]
  53. Soratto, R.P.; Fernandes, A.M. Phosphorus Effects on Biomass Accumulation and Nutrient Uptake and Removal in Two Potato Cultivars. Agron. J. 2016, 108, 1225–1236. [Google Scholar] [CrossRef]
  54. Malhi, S.S.; Johnston, A.M.; Schoenau, J.J.; Wang, Z.L.; Vera, C.L. Seasonal biomass accumulation and nutrient uptake of wheat, barley and oat on a Black Chernozem Soil in Saskatchewan. Can. J. Plant Sci. 2006, 86, 1005–1014. [Google Scholar] [CrossRef]
  55. Khalofah, A.; Ghramh, H.A.; Al-Qthanin, R.N.; L′Taief, B. The impact of NPK fertilizer on growth and nutrient accumulation in juniper (Juniperus procera) trees grown on fire-damaged and intact soils. PLoS ONE 2022, 17, 14. [Google Scholar] [CrossRef] [PubMed]
  56. Zhao, Q.; Guo, J.; Shu, M.; Wang, P.; Hu, S. Impacts of drought and nitrogen enrichment on leaf nutrient resorption and root nutrient allocation in four Tibetan plant species. Sci. Total Env. 2020, 723, 138106. [Google Scholar] [CrossRef]
  57. Sardans, J.; Grau, O.; Chen, H.Y.H.; Janssens, I.A.; Ciais, P.; Piao, S.; Peñuelas, J. Changes in nutrient concentrations of leaves and roots in response to global change factors. Glob. Chang. Biol. 2017, 23, 3849–3856. [Google Scholar] [CrossRef]
  58. Chen, Z.; Ma, H.; Xia, J.; Hou, F.; Shi, X.; Hao, X.; Hafeez, A.; Han, H.; Luo, H. Optimal pre-plant irrigation and fertilization can improve biomass accumulation by maintaining the root and leaf productive capacity of cotton crop. Sci. Rep. 2017, 7, 17168. [Google Scholar] [CrossRef]
  59. Wang, X.; Bian, S.; Chang, P.; Wang, N.; Xuan, L.; Zhang, M.; Dong, B.; Zhang, C.; Wu, J.; Ying, Y.; et al. The effects of different nitrogen sources on camptothecin content and related gene expression in Camptotheca acuminata seedlings. J. For. Res. 2019, 31, 1347–1357. [Google Scholar] [CrossRef]
  60. Barunawati, N.; Giehl, R.F.; Bauer, B.; von Wiren, N. The influence of inorganic nitrogen fertilizer forms on micronutrient retranslocation and accumulation in grains of winter wheat. Front. Plant Sci. 2013, 4, 320. [Google Scholar] [CrossRef] [PubMed]
  61. Caroline, D.T.; Bart, V.; Bruno, V.; Sarah, O.; Tim, D.M.; Jill, D.V.; Peter, D.; Lieven, C.; Tina, K.; Jane, D. Chitin in strawberry cultivation: Foliar growth and defense response promotion, but reduced fruit yield and disease resistance by nutrient imbalances. MPMI 2020, 34, 227–239. [Google Scholar]
  62. Saloner, A.; Bernstein, N. Effect of Potassium (K) Supply on Cannabinoids, Terpenoids and Plant Function in Medical Cannabis. Agronomy 2022, 12, 1242. [Google Scholar] [CrossRef]
  63. Ordóñez, R.A.; Castellano, M.J.; Danalatos, G.N.; Wright, E.E.; Hatfield, J.L.; Burras, L.; Archontoulis, S.V. Insufficient and excessive N fertilizer input reduces maize root mass across soil types. Field Crops Res. 2021, 267, 108142. [Google Scholar] [CrossRef]
  64. Ou, X.; Cui, X.; Zhu, D.; Guo, L.; Liu, D.; Yang, Y. Lowering Nitrogen and Increasing Potassium Application Level Can Improve the Yield and Quality of Panax notoginseng. Front. Plant Sci. 2020, 11, 595095. [Google Scholar] [CrossRef] [PubMed]
  65. Daoud, B.; Pawelzik, E.; Naumann, M. Different potassium fertilization levels influence water-use efficiency, yield, and fruit quality attributes of cocktail tomato—A comparative study of deficient-to-excessive supply. Sci. Hortic. 2020, 272, 109562. [Google Scholar] [CrossRef]
Figure 1. Torreya grandis sapling growth under different N–P–K fertilization.
Horticulturae 09 01203 g001
Figure 2. Changes in the growth of T. grandis under different formula fertilization treatments: (A) sapling height increase; (B) root diameter increase; (C) total increase in sapling height; (D) total growth of root diameter. The presented data refer to calculated mean values ± SE. Different lowercase letters indicate significant differences between various treatments (p < 0.05), and different uppercase letters indicate significant variants between different periods (p < 0.05), as determined by Duncan’s multiple range test.
Horticulturae 09 01203 g002
Figure 3. Biomass, root–shoot ratio, and seedling quality index of T. grandis under different formula fertilization treatments: (A): leaf biomass; (B): shoot biomass; (C): root biomass; (D): total biomass; (E): root–shoot ratio; (F): seedling quality index. The presented data refer to calculated mean values ± SE. Different lowercase letters indicate significant differences between various treatments (p < 0.05), as determined by Duncan’s multiple range test.
Horticulturae 09 01203 g003
Figure 4. Organ nutrient content of T. grandis under different formula fertilization treatments: (A) Total N content; (B) Total P content; (C) Total K content. The presented data refer to calculated mean values ± SE. Different lowercase letters indicate significant differences between various treatments (p < 0.05), and different uppercase letters indicate significant variants between different periods (p < 0.05), as determined by Duncan’s multiple range test.
Horticulturae 09 01203 g004
Table 1. Basic indices of container sapling soil.
pHNH4-N
(mg·kg−1)
NO3-N
(mg·kg−1)
AP
(mg·kg−1)
TN (g·kg−1)TP
(g·kg−1)
TK
(g·kg−1)
6.15 ± 0.050.99 ± 0.140.14 ± 0.0216.96 ± 0.131.31 ± 0.050.46 ± 0.017.10 ± 0.16
Table 2. Orthogonal design of three factors and four levels for formula fertilization test of T. grandis.
No.Treatment N (g · Sapling−1) P2O5 (g · Sapling−1) K2O (g · Sapling−1)
CKN0P0K0000
T1N1P1K11.0 (0.46)1.0 (0.16)1.0 (0.52)
T2N1P2K21.02.0 (0.32)2.0 (1.04)
T3N1P3K31.03.0 (0.48)3.0 (1.56)
T4N1P4K41.04.0 (0.64)4.0 (2.08)
T5N2P1K22.0 (0.92)1.02.0
T6N2P2K12.02.01.0
T7N2P3K42.03.04.0
T8N2P4K32.04.03.0
T9N3P1K33.0 (1.38)1.03.0
T10N3P2K43.02.04.0
T11N3P3K13.03.01.0
T12N3P4K23.04.02.0
T13N4P1K44.0 (1.84)1.04.0
T14N4P2K34.02.03.0
T15N4P3K24.03.02.0
T16N4P4K14.04.01.0
Note: The number before the brackets refers to the fertilizer amount, while the number in the bracket refers to the actual element content for the chosen amount.
Table 3. Range analyses of T. grandis sapling attributes were measured at the end of the trial in response to the 17 fertilization treatments.
IndicatorNPK
THI (cm)2.860.80.18
TDI (mm)1.020.831.38
LB (g)20.545.464.56
SB (g)11.44.023.34
RB (g)43.5517.3917.06
TB (g)75.4924.0211.29
RS0.180.190.3
QI1.930.360.32
Note: “THI” represents the total increment of sapling height; “TDI” represents the total increment of root collar diameter; “LB, SB, RB, TB” represent leaves, shoots, roots, and total biomass; “RS” refers to root-shoot ratio; “QI” refers to seedling quality index. The R-value of the range analysis is shown in the table. The larger the R-value, the better the factor.
Table 4. Analysis of variance of three main effects of growth indices of T. grandis under different formula fertilization treatments.
IndicatorNPK
F-Value p-ValueF-Valuep-ValueF-Valuep-Value
THI5.3650.0020.3430.7940.0160.997
TDI1.7710.1591.1650.3282.6360.055
LB11.568<0.0011.1280.3500.7140.550
SB5.7370.0021.0280.3910.5970.621
RB9.750<0.0011.6560.1931.3930.260
TB14.926<0.0011.5310.2220.3600.782
RS1.3760.2651.7480.1743.5870.022
QI10.023<0.0010.5420.6570.2630.851
Note: “THI” represents the total increment of sapling height; “TDI” represents the total increment of root collar diameter; “LB, SB, RB, TB” represent leaves, shoots, roots, and total biomass; “RS” refers to root-shoot ratio; “QI” refers to seedling quality index. “p < 0.05” refers to significant difference, and “p < 0.01” refers to extremely significant difference.
Table 5. Final score formula for the four principal components.
Principal ComponentScore Formula
1Y = −0.128x1 + 0.106x2 + 0.147x3 + 0.345x4 + 0.244x5 + 0.292x6 + 0.324x7 +
0.280x8 + 0.342x9 + 0.222x10 − 0.264x11 − 0.261x12 − 0.223x13 − 0.218x14
0.24x15 − 0.071x16 − 0.188x17
2Y = 0.315x1 + 0.249x2 + 0.323x3 + 0.169x4 + 0.253x5 + 0.218x6 + 0.124x7 +
0.187x8 + 0.145x9 + 0.125x10 + 0.155x11 + 0.260x12 + 0.235x13 + 0.326x14 +
0.320x15 + 0.219x16 + 0.323x17
3Y = 0.042x1 + 0.346x2 + 0.203x3 + 0.020x4 + 0.129x5 − 0.256x6 − 0.299x7 − 0.391x8 + 0.046x9 + 0.390x10 + 0.297x11 − 0.219x12 − 0.368x13 − 0.000x14 − 0.116x15 + 0.267x16 − 0.045x17
4Y = −0.072x1 − 0.346x2 − 0.000x3 + 0.104x4 − 0.260x5 + 0.001x6 + 0.170x7 +
0.109x8 + 0.175x9 − 0.313x10 + 0.141x11 − 0.268x12 − 0.267x13 + 0.242x14 +
0.044x15 + 0.635x16 + 0.023x17
Note: The scores of each indicator on the four principal components are represented by the four formulas in the table. The variable x represents the mean value of each indicator.
Table 6. Comprehensive score for each sapling treatment.
TreatmentsF1F2F3F4FRanking
CK−2.63−6.520.630.49−3.5517
T1−3.40−1.340.15−0.76−1.9916
T2−2.44−0.940.21−0.81−1.4315
T3−2.530.960.912.02−0.3912
T4−1.53−0.030.470.55−0.5513
T5−1.430.08−1.05−2.91−0.9314
T6−2.322.980.200.250.268
T7−2.743.42−1.00−0.080.1110
T81.181.540.070.591.163
T90.082.41−0.080.120.996
T102.161.631.79−0.331.692
T112.610.17−1.27−0.241.005
T122.752.040.540.102.001
T133.75−1.612.48−1.581.024
T142.09−1.70−0.181.930.367
T151.74−1.21−1.290.660.179
T162.66−1.90−2.580.000.1011
Note: “F1, F2, F3, and F4” represent the score of each treatment on that principal component, respectively. “F“ is the overall score.
Disclaimer/Publisher’s Note: The statements, opinions and data contained in all publications are solely those of the individual author(s) and contributor(s) and not of MDPI and/or the editor(s). MDPI and/or the editor(s) disclaim responsibility for any injury to people or property resulting from any ideas, methods, instructions or products referred to in the content.

