Abstract
Berberis microphylla (calafate) is an evergreen shrub that grows spontaneously in the Argentinean and Chilean Patagonia with a very harsh climate. This Sub-Antarctic zone is affected by the “El Niño” and “La Niña” pattern, which is measured using the Oceanic Niño Index (ONI). The objective of this study was to analyze the floral phenology and its pollinator insects, in relation to the climatic conditions observed. This work was developed in Ushuaia (Argentina) during 2010, 2014, 2015, and 2016. Significant differences were observed for the development of flower bud and floral phenology between the four years studied. On 26 October, between 84 and 100% of flower buds was recorded in the shrubs tested during the years 2010, 2014, and 2015 and then decreased abruptly in 2010 and more slowly in 2014 and 2015. However, in 2016 on the same date, it was recorded 70% of button flowers increasing to 90% on 5 November and then slowly evolving towards the anthesis phase. On the other hand, the anthesis phase was developed rapidly for 2010 and 2015 and slower for 2014 and 2016. A peak in anthesis occurred on 2 November in 2010, while in the other years, it was observed later in 16 November. The hoverflies of the genus Carposcalis and Allograpta, both insects verified to be responsible for the pollination of calafate, were registered between 2014 and 2016. Carposcalis was significantly more present in 2014, while in 2015 and 2016, Allograpta was predominant. The insect activity was also related with the climatic conditions, i.e., air temperature, air relative humidity, wind speed, and gust of wind along the day during the anthesis phase, and which also modified its life cycle. So, it was observed in 2016, the year with winter temperatures higher than normal, that adult hoverflies ended their hibernation period earlier and began to lay eggs on the juvenile calafate sprouts; hence, the emerging larvae ate the pollen grain of button flowers, causing a decrease in future fruits harvested. The results presented show that the “La Niña” and “El Niño” effects in these latitudes are the opposite of those expected. Spring 2016 developed under a strong “La Niña” effect, as occurred in 2010 with temperatures warmer than in 2014 and 2015, where both years developed under the “El Niño” effect. This study showed how climatic conditions can modify the floral phenology of B. microphylla and its pollinator insect frequency, their activity, and their life cycle.
1. Introduction
Berberis microphylla (calafate) is an evergreen shrub that grows spontaneously in the Argentinean and Chilean Patagonia (Figure 1). It lives for many years and forms clumps from 2 to 3 m wide by 2 m high. The phenology and shoot growth of this species has been described [1,2]. Plant rest comprises from April to September, then the flowering period is extended to middle November, when the fruit set was accomplished and new sprouts enlarge [2]. The evolution of the flower in its morphological and histological aspect [3,4] as well as the plant productivity in relation with the floral bud development and the fruit set [5] were also studied. The small blue fruits contain carbohydrates, organic acids, and phenolic compounds, with an important antioxidant activity [6]. These properties make it a nutritional and medicinal fruit that has been used by the ancestral people, and today, it is preserved and marketed freeze-dried [7,8]. At present, this Patagonian native berry is still an underutilized fruit species and its development into a new crop is relevant for the diversification of agricultural production in Argentina [9].
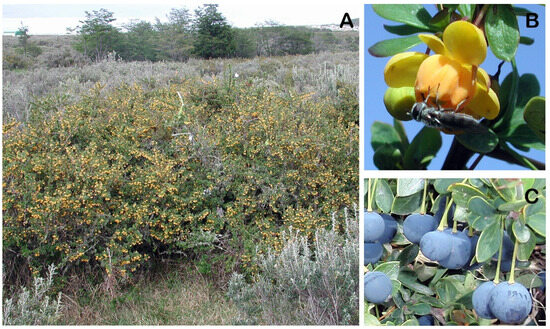
Figure 1.
Berberis microphylla (calafate) grown in Tierra del Fuego. (A) Shrub with flowers; (B) flower in anthesis phase with Carposcalis sp. sucking nectar; and (C) details of fruits.
In this Sub-Antarctic zone of southern Patagonia, the climate is very harsh, temperatures are low throughout the year, snow can still occur in spring and summer, and the variation in the photoperiod is very pronounced, with 7 h of light per day in winter and more than 16 h in summer. It has been studied how changes in light, nutrient supply, and seasonal climatic variations affect the content of leaf pigments in B. microphylla, suggesting that this species has a high plasticity [10], as was also observed by Radice et al. [5]. However, few studies have been performed on the population and activity of hoverflies in this region [11]. In fact, bees do not survive in this climate, so the hoverflies perform the function of pollinating the calafate flowers indirectly by touching the stamens when introduce their heads into the flower to take nectar. Thus, pollen is adhered and can be transferred to another flower [11].
Climate effect has gained more attention due to global warming. Hence, we decided to resume the results already published by our team on the phenology of this species, to better analyze the cyclical climatic variations in the continent caused by the “El Niño” and “La Niña” effects in relation to pollinator insects [5,12] with the integration of new original data on climate and insect activity.
“El Niño” and “La Niña” are the warm and cool phases of a recurring climate pattern across the tropical Pacific, respectively, called the El Niño–Southern Oscillation (ENSO). Both phenomena affect South America, including Patagonia. Some authors consider that an increase in the continent and oceans’ temperature significantly affected many natural systems [13,14]. Phenology is the science that studies biological phenomena that occur periodically, coupled to seasonal rhythms, and are related in general to the climate and, more specifically, to the annual course of weather in a particular location, where it has been highlighted how native species are especially suitable to notify these changes [15,16]. For this reason, the USA National Phenology Network (USA-NPN; www.usanpn.org, accessed on 22 October 2023) was created in 2007 in order to collect phenological data of plants. An example of the relevance of this approach is the demonstration that the monitoring of variation in the Quercus robur foliar mass and the presence of the caterpillar Opheroptera brumata are an indicator of food abundance for Parus major, a bird widespread in European forests [17]. For this reason, wild plant phenology is considered an important biological indicator in understanding the behavior of ecosystems and how they respond to environmental changes [18]. Therefore, the objective of this study was to show the floral phenology of B. microphylla and its pollinator insects in relation to climatic conditions in order to assess the response of plants and insects to the cyclical climatic variations caused by the “El Niño” and “La Niña” effects in Tierra del Fuego.
2. Materials and Methods
Climatic conditions. Ushuaia (Tierra del Fuego) is a city with a cold climate in general since the temperature varies from −1 °C to 13 °C and rarely goes below −5 °C or rises above 17 °C. A large part of the days of the year are cloudy, humid (relative humidity is 77% on average), and with very frequent winds from S—SW coming from the Antarctic. Winters are snowy with a regular occurrence of frost and the annual precipitation is 628 mm (https://www.weather-atlas.com/es/argentina/ushuaia-clima, accessed on 22 October 2023).
The mean, maximum, and minimum air temperature, the mean relative air humidity, and the mean wind speed and maximum wind speed (gust) were registered hourly every day during October and November for the years studied along the flowering period of the calafate. Also, the mean air temperature of the winter months (June, July, August, and September) prior to flowering were considered. The data were provided by a weather station of CADIC—CONICET (54°49′21″ S, 68°19′25″ W and 24 m asl).
The cumulative growing degree days [19] were calculated as the sum of mean air daily temperatures above 0 °C, from September 1 until 26 October and 2 November for the 2010, 2014, 2015, and 2016 years. According to the optimal evolution of floral phenology of the year 2010, with concentrated phases, the dates 26 October (button flower peak) and 2 November (anthesis peak) were selected to calculate the cumulative growing degree-days for both dates and the four years studied.
The Oceanic Niño Index (ONI) supplied by the National Oceanic and Atmospheric Administration (NOAA) were taken on consideration for this evaluation since it is the index that indicates the intensity of the effects of “El Niño” (warm) y “La Niña” (cool) according to the sea surface temperature (SST) of the eastern tropical Pacific. The events are defined as five consecutive overlapping 3-month periods at or above the +0.5° anomaly for warm (El Niño) events, and at or below the −0.5° anomaly for cool (La Niña) events. (https://ggweather.com/enso/oni.htm, accessed on 22 October 2023).
Plant Material. Plants of B. microphylla G. Forst. growing near Ushuaia city (Tierra del Fuego (54°49′21″ S, 68°19′25″ W and 24 m asl) were selected as described in a previous work [20]. One-year-old shoots (eight per plant) were chosen in the spring of 2010, 2014, 2015, and 2016 from the North, East, South, and West orientations (two shoots from each sector), as reported by Radice and Arena [5]. Floral phenology, in particular the development of button flowers and the anthesis phases, was registered according to Radice [21], during all-spring seasons, and the data were recorded twice a week for every reproductive shoot selected. Finally, the number of harvested fruits per shoot was registered in February of every year. Values are expressed in percentage (harvestable fruits/flowers × 100).
Pollinator insects. Previous research showed that Berberis microphylla shrubs are visited during the studied phenological stages by two hoverflies identified as Carposcalis (ex Platycheirus) and Allograpta, and on a lesser extent, by a butterfly of the genus Tatochila [22]. The frequency of visits of both hoverflies in the B. microphylla shrubs were registered in 2014, 2015, and 2016 and expressed in percentage of each one. Also, the activity of the three insects mentioned was registered by time of day (records at one-hour intervals) and by duration of the activity (measured in seconds). The insect activity and recording data in the field was made in the period of full bloom, from 9:00 to 17:00 between 20 and 29 October in 2014. A total of 6120 cases of insect activity were counted among the three species and expressed in percentage.
The number of infected flowers by Carposcalis and Allograpta hoverflies was evaluated in the 2014, 2015, and 2016 years (n = 300 each year), as the percentage of flower infection of each plant. Also, the incidence of Mizus persicae (green aphid) was observed during the flowering time of calafate.
Statistical analysis. Climate data were analyzed for each variable via ANOVA and Tukey’s Test. The results of the phenology, presence, and activity of insects were analyzed via Χ2 and a post hoc test. Pearson correlations between the presence of every pollinator insect and the air temperature, air relative humidity, wind speed, and maximum wind speed registered at the time of the activity were also made. SPSS Statistics 29 were used for all analyses.
3. Results
3.1. Climatic Conditions
The mean air temperatures of October were significantly superior for 2016 with respect to the other three years, while November 2014 was the month with significantly lower mean air temperatures in relation with the other years (Table 1). Negative minimum air temperatures were registered in October 2010, 2014, and 2015, while October and November 2016 showed minimum air temperatures above 0 °C, the same as November 2015. In addition, the 2014, 2015, and 2016 spring period was interrupted by snowfall, accumulating 21.1, 15.1, and 16.4 cm, respectively (Table 2). Several days of October 2014 were affected by snow, although most of them were in the pre-growth period of button flowers. Regarding the mean relative air humidity, spring 2010 showed significantly lower values compared to the other three years studied (Table 1). Conversely, spring 2016 was significantly more humid with respect to the others. The mean wind speed was significantly the lowest for October 2010 and the highest for October 2016, although the maximum wind speed were similar for all years during October and significantly lesser in November 2016 with respect to the other years (Table 1).

Table 1.
Mean (Mean), maximum (Max) and minimum (Min) air temperature (°C), mean air relative humidity (%) (RH), and mean wind speed (Km/h) (Mean Wind Speed) and maximum wind speed (Km/h) (Wind Gust) registered during October and November 2010, 2014, 2015, and 2016 years in Ushuaia (Argentina).
Table 2.
Snowfall (cm) registered in October and November of 2010, 2014, 2015, and 2016 years in Ushuaia (Argentina).
The cumulative growing degree-days were different according to the years. Significantly higher values were observed in 2016 compared with the other three years. The values obtained for 2015 were significantly lower with respect to the 2010 and 2016 values (Table 3).
Table 3.
Cumulative growing degree-days (°C) from September 1 to October 26 and November 2 of 2010, 2014, 2015, and 2016 years.
The mean air temperatures of the winter months were also considered. Several differences were observed among the years studied. The mean air temperatures in June and September 2016 were significantly higher than the same months of the other years (Table 4). On the other hand, July, August, and September 2015 were the months with the lowest mean air temperatures with respect to the same months of 2010, 2014, and 2016.
Table 4.
Mean air temperature (°C) registered on June, July, August, and September of 2010, 2014, 2015, and 2016 years in Ushuaia (Argentina).
The analyzed four years performed in very different global climate situations. As reported in Table 5, the spring of 2010 was progressed in the climate of a strong “La Niña” condition, while the spring of 2014 was under a strong “El Niño” effect which continued throughout the year 2015 and ended in the autumn of 2016. The “La Niña” pattern appeared again during spring 2016.
Table 5.
Warm (red) and cold (blue) periods based on a threshold of +/−0.5 °C for the Oceanic Niño Index (ONI) [3-Month Mean SST anomaly for the “El Niño” 3.4 region (i.e., 5° N–5° S, 120°–170° W)]. Spring period signed by gray shading. Values taken from Golden Gate Weather Service (https://ggweather.com/enso/oni.htm, accessed on 22 October 2023). Months are signed by the first capital letter, i.e., DJF: December–January–February.
3.2. Floral Phenology
Significant differences were observed for the flower bud development between the four years studied (Figure 2A). The proportion of button flowers decreased strongly in the year 2010 from 26 October, disappearing after 2 November. The proportion of button flowers was not significantly different between the 2010, 2014, and 2015 years, and similar trends were observed for the years 2014 and 2015 with a high button flower quantity on 26 October and a rapid decline thereafter. On the contrary, in the spring of 2016, a long period of permanence of the button flower phase was observed, with a maximum peak on 5 November and still 50% of them on 16 November. Significant differences were observed between the button flower quantity on 26 October for 2010 and 2016.
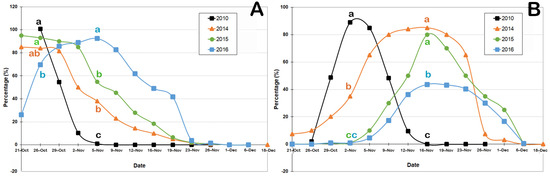
Figure 2.
Phenology of Berberis microphylla (calafate) growing in the Ushuaia bay during 2010, 2014, 2015, and 2016 spring periods. (A) Evolution of button flowers; (B) evolution of flowers in anthesis phase. Values are expressed in percentage. Different letters among years show significant differences according to χ2 and post hoc test (p ≤ 0.05).
Anthesis phase started on 28 October for the 2010 and 2014 years, although the evolution of this phase was very different. While in 2010, the maximum values were observed between 2 and 5 November, but in 2014, more than 60% of the flowers in the anthesis phase was observed between 5 and 25 November (Figure 2B). In 2015, the anthesis phase began on 5 November with a fast increment to 16 November, followed by a rapid decrease in the flower ratio. The anthesis phase of 2016 showed a similar evolution to 2014, but with a longer onset delay and poorer rates, with a maximum value below 50%. A peak in anthesis occurred on 2 November in 2010, while it was observed later in 16 November in the other years. As a result, the button flower and anthesis phases were more concentrated in 2010, 2014, and 2015 with respect to 2016.
3.3. Pollinator Insects
Although the proportion of hoverfly visits was not evaluated in 2010, Carposcalis was the hoverfly variety that was significantly more frequent (85%) than Allograpta (15%) in 2014, while Allograpta had significantly more visits (61 and 79%) than Carposcalis (39 and 21%) in 2015 and 2016, respectively. Shrub productivity was evaluated by registering the proportion of branches with ripe fruits, that is to say, the fruits that are harvestable to the end of the different productive cycles, as reported in Table 6. In 2010, the proportion of branches with harvestable fruits was the highest (75%), while this value decreased significantly in the followings years (25, 41, and 11%).
Table 6.
Frequency of visits of Carposcalis and Allograpta hoverflies in different years and branches with harvestable fruits (BHF). Values are expressed in percentage.
When the hoverfly activity was evaluated in relation with the temperature on spring 2014, it was noticed that hoverflies were present when the temperature was superior to 7.4 °C. Carposcalis was observed in a greater range of air temperature, air relative humidity, wind speed, and inclusive gusts of wind with respect to the other two insects (Figure 3). In fact, the most frequent activity (60%) was shown between 8 and 10 °C (Figure 3A), and continued working with winds of up to 30 Km/h (Figure 3B) and gusts of wind at 54.7 Km/h (Figure 3C). Allograpta was observed on plants at 8 °C and the highest frequency of this insect was observed between 8 and 10 °C. It was active with winds of 10 to 20 Km/h and with standard gusts of up to 40.2 Km/h. Nevertheless, Tatochila autodice, the butterfly, was very restricted to a range of temperature of 11.6–14.1 °C and a wind speed minor than 3.2 Km/h, with eventual gusts of wind at 14.5 Km/h (Figure 3).
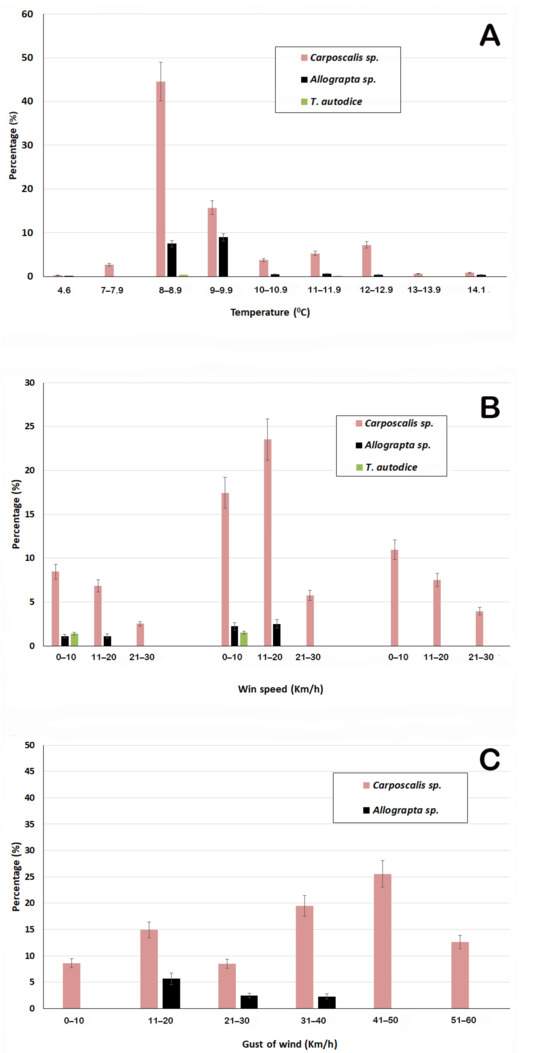
Figure 3.
Frequency of pollinator hoverflies (% of hoverfly visit with respect to the total number of insect visits) measured in spring of 2014 according to (A) temperature; (B) wind speed and gust of wind. (C) Values are expressed in percentage ± error bar according to χ2 and post hoc test (p ≤ 0.05).
As shown in Table 7, there was a negative and significant correlation between air temperature and air relative humidity for the three pollinator–insect, which was particularly strong for the butterfly. However, there was a positive effect with the wind speed for the two hoverflies (namely 25.7 Km/h for Carposcalis and 12.9 Km/h for Allograpta). T. autodice activity, as seen in Figure 3B, was very poor and negatively correlated with the wind speed and gust of wind.
Table 7.
Pearson Correlation between every pollinator insect and the climatic parameters at the time of insect activity registered. Air temperature (°C) (Air Temp), air relative humidity (%) (RH), wind speed (Km/h) (Wind Speed), and maximum wind speed (Km/h) (Wind Gust).
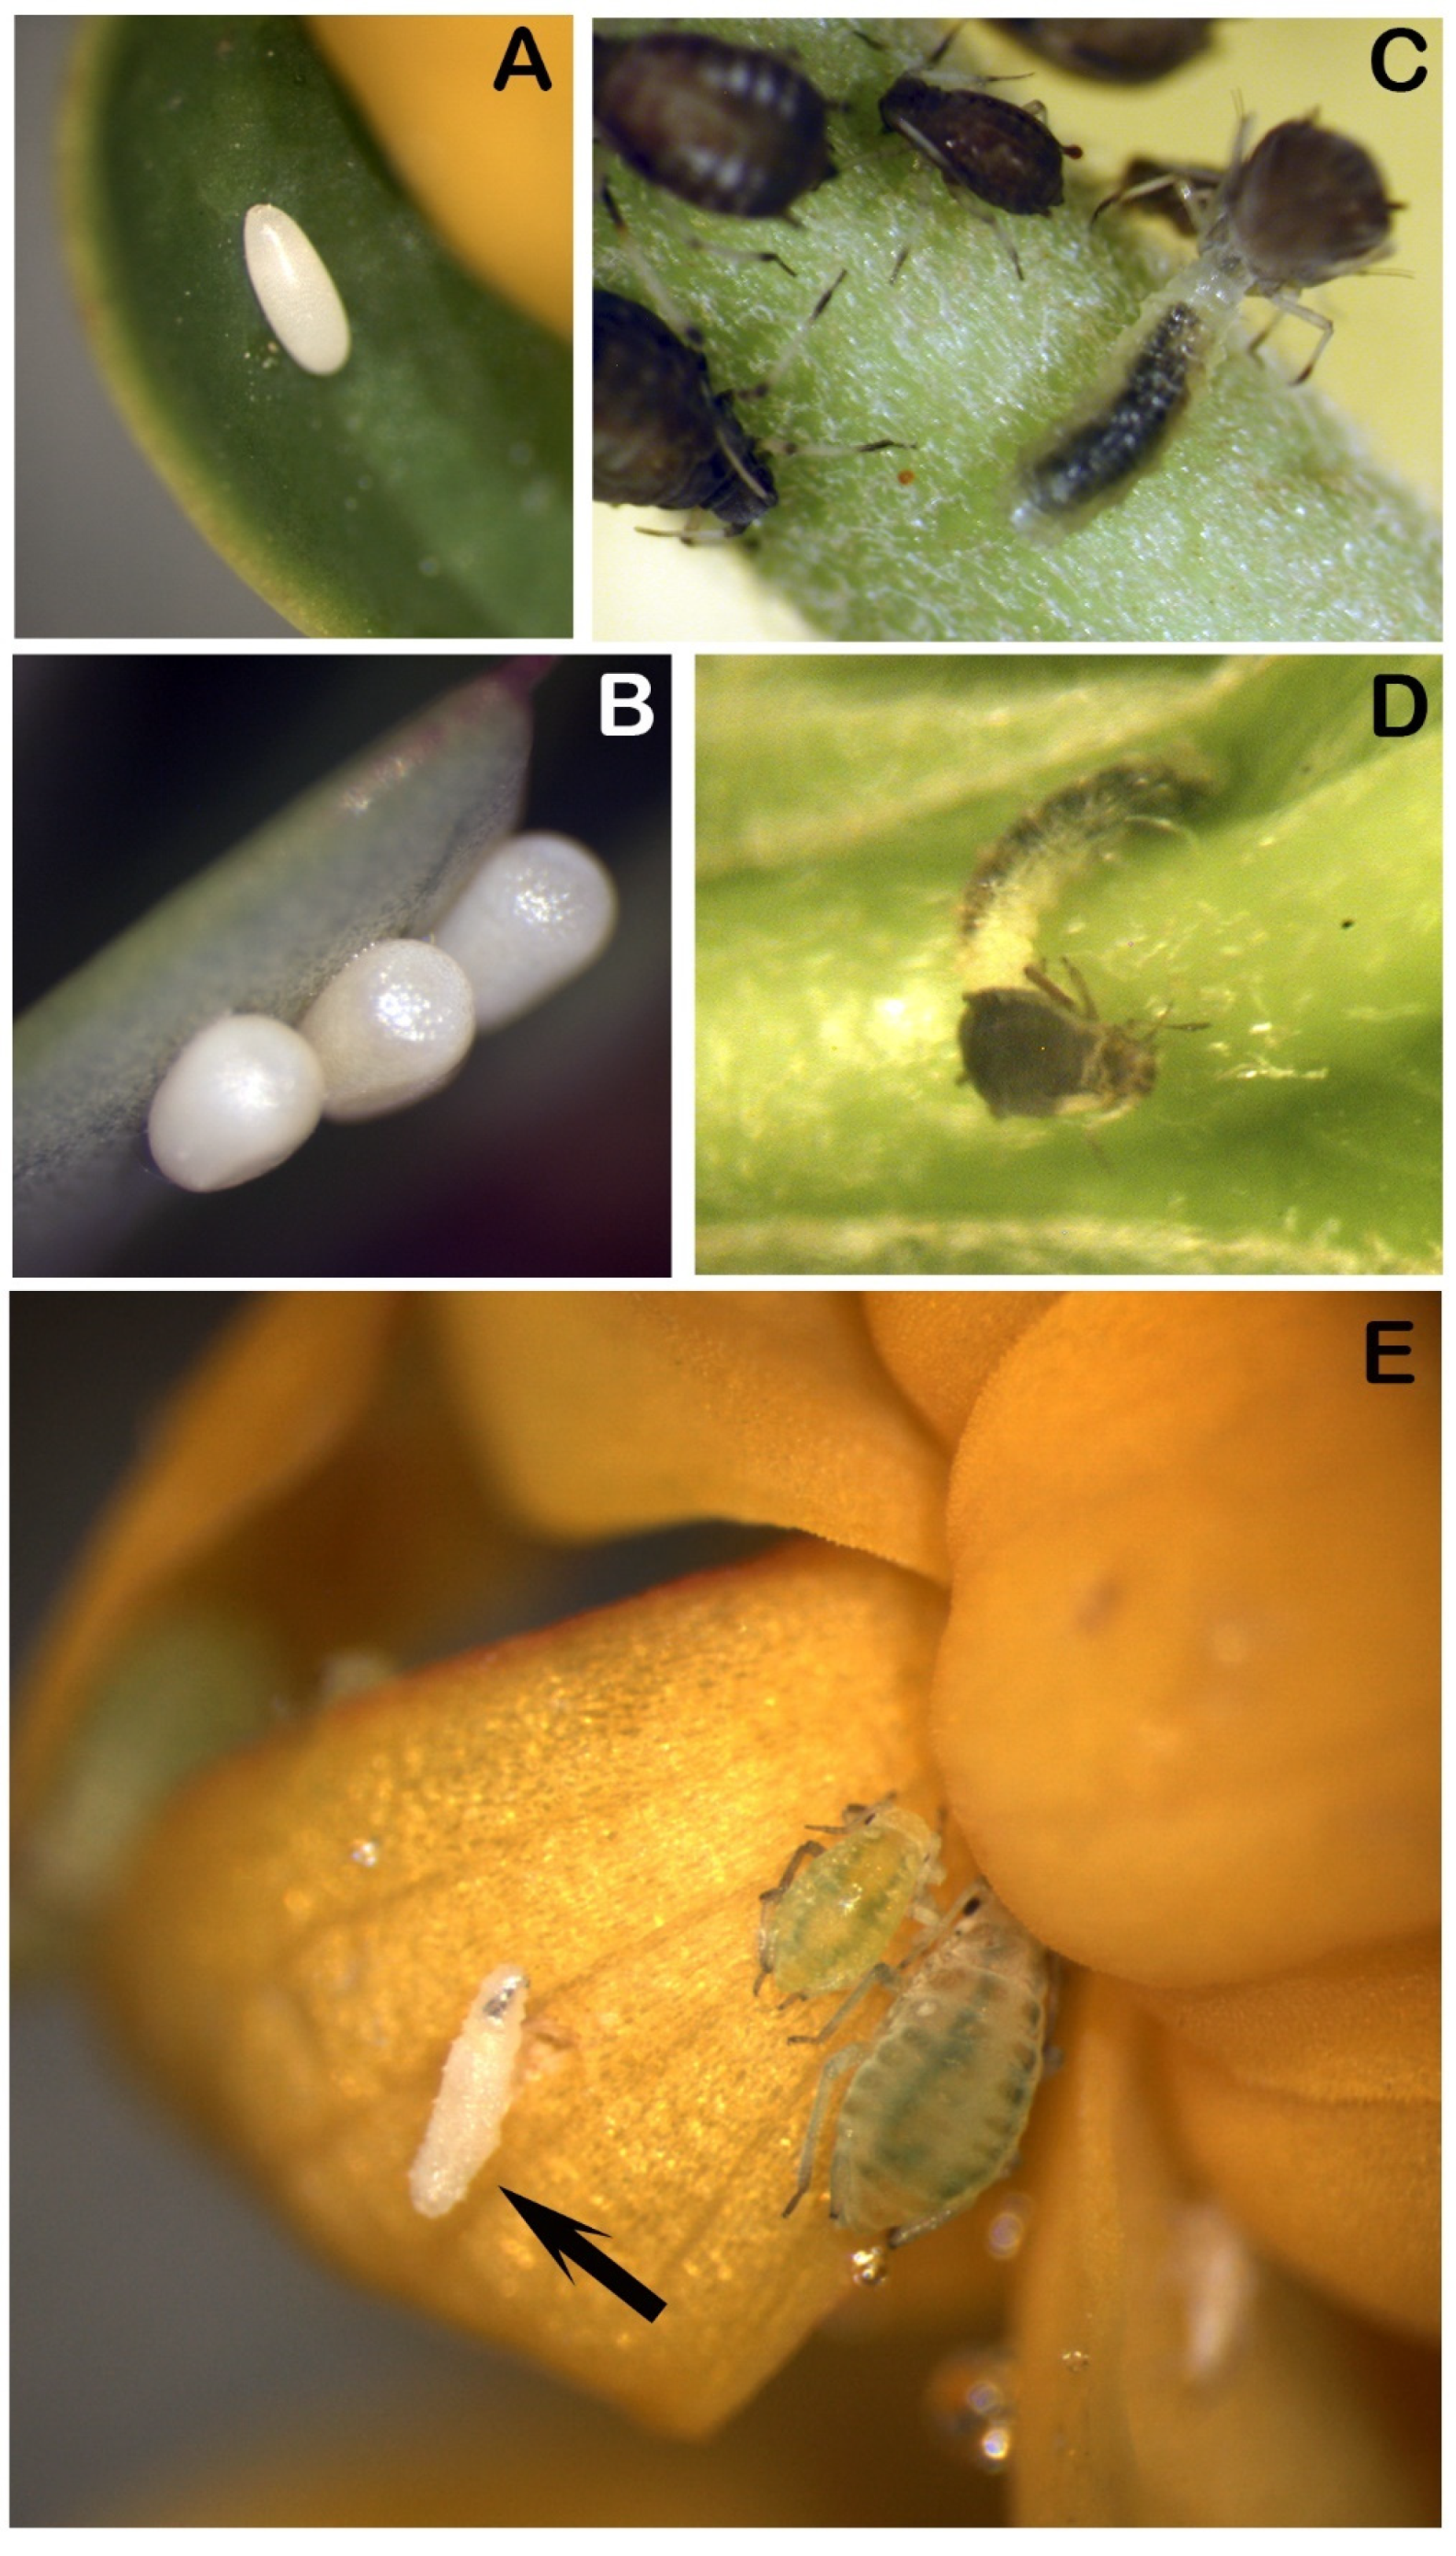
On the other hand, larvae belonging to the previously mentioned hoverflies were found in the flowers of calafate (Figure 4). A wide variation in the number of infected flowers was observed between the year 2016 (65%) and the other three years studied (<5%). In 2016, 34.8% and 44.5% of flowers were observed as infected by Carposcalis and Allograpta larvae, respectively [22].

Figure 4.
Presence of insects on Berberis microphylla. (A,B) Eggs of hoverflies over leaf of calafate; (C,D) hoverflies larvae feeding on an aphid; and (E) hoverflies larvae (arrow).
The cycle of pollinator insects of calafate was modified. In this study, it was observed that the years with temperatures higher than normal, as occurred in 2016, the adult hoverflies ended their hibernation period earlier and began to lay eggs on the juvenile calafate sprouts; hence, emerging larvae ate the pollen grain of button flowers, causing a decrease in future fruits’ production. Additionally, in the spring of the same year, the infection by green aphids, a parasite very frequent in this species, began, which settled mainly on the flowers, while in the other years, this aphid appeared later when flowering ends.
4. Discussion
Climatic conditions. During the studied period, the weather conditions varied with the years, i.e., the springs of 2010 and 2016 were warmer than those of 2014 and 2015, although in November 2016, the occurrence of snowfall was atypical. As a result, relating the climatic conditions with the “El Niño” and “La Niña” cycles, in these latitudes, the “La Niña” phenomenon produces a warmer climate, while “El Niño” is associated with a cooler climate, in agreement with the observations in earlier years by Arena et al. [10]. In any case, B. microphylla has shown a great physiological and anatomical adaptation to extreme situations of temperature and a lack of humidity [23]. Temperature is one of the primary microclimatic factors driving the rates of growth and leaf area development [24].
Phenology. Although phenology in general terms regards the timing of the annual cycles of plants and animals for different aspects, this study focused only on the reproductive phases of calafate and some aspects of the pollinator visits and activity. These phases are extremely sensitive to climate changes, but not all species are responding at the same speed or in the same way. This can alter the way species interact and the way ecosystems function in general (e.g., plants may flower before butterflies emerge to pollinate them). Climate warming has the potential to substantially influence the structure, composition, and function of ecosystems [14].
Woody species flower earlier than herbaceous species only in response to increasing annual temperatures, and a significantly greater phenological response to warming yearly average temperatures was observed in spring blooming species [25].
Nevertheless, there are different responses to climate warming; Bradley et al. [26] support that flowering is related to the photoperiod and phenological responses may be accentuated at more polar latitudes, that is to say, plants can sprout in advance but then slow down to flower when they reach their photoperiodic level. Snowfalls that occurred in October of 2014 and November of 2015 and 2016 strongly influenced the start of the anthesis phase. Coincidentally, on 26 October of the years 2010 and 2014, the proportion of flowers in the anthesis phase was the same, but the maximum expression in 2014 was reached 10 days later than in 2010. The anthesis phase in 2015 was delayed even more, possibly due to the very low temperatures that occurred in September of that year. On the other hand, the fertility of the flowers could be damaged due to the sensitiveness of their reproductive organs during this stage to the low temperatures, and, as a consequence, the plants could produce less fruits [27]. During the year 2016, a quite abnormal floral phenology was registered, with a very long period of permanence of floral buds and also a delayed and prolonged anthesis phase. Too low temperatures occurred on 4 and 6 November, together with snowfall, that could affect the normal phenology. Also, although there are no studies on how many hours of cold are necessary to break plant dormancy, the temperatures above the normal averages recorded during the winter months were possibly not enough to meet such physiological requirements. In fact, plants that grow in cold winter climates only resume growth in spring once their chilling requirements have been fulfilled, leading to a later onset of spring phases [28]. In addition, the anthesis phase was delayed by late snowfalls that further altered the development of flowers. Similar results were observed in grapevines [24].
The date of bloom is so important that the U.S. Environmental Protection Agency has included it as an indicator variable of climatic change [28]. It is well known that insects are strongly affected by the environmental temperatures disturbing their phenology [29,30], whereby, we hypothesize that winter and early spring warming accelerated the growth of aphids that are normally present when calafate reached the fruit set stage. Although, the flowering of calafate in the town of Ushuaia normally occurs in the months of October and November, but winter temperatures also have an important effect on this period, which is why it is necessary to consider them.
Pollinator Insects. The visits and activity of pollinator insects was conditioned by the air temperature, humidity, wind speed, and particularly, by gusts of wind that are very frequent in the Ushuaia Bay. The Allograpta and Carposcalis (ex Platycheirus) genus are two hoverflies recognized by Radice and Arena [22] as specific syrphid pollinators of B. microphylla. Although Allograpta is present with average winds of up to 10 Km/h, gusts of the same intensity are not enough to help it fly, given that it is heavier than Carposcalis. According to Lucas [31], an abundance of pollinator hoverflies is usually observed at a temperature between approximately 14 °C and 15 °C, while it is reduced at both higher and lower temperatures. In our study, similar results were observed with respect to the air temperature. Also, an activity increase was noted at the same rate as the insolation hours. On the other hand, syrphid flight was affected by spring temperature variation [32,33,34]. Conversely, climatic changes affect hoverfly phenology, namely on the variation in emergence dates, flight periods, and voltinism [35,36]. For some authors, the phenology of hoverflies and the species they pollinate are synchronous [37]; however, in our observations, they seem to differ. Additionally, Lucas [31] observed a significantly different abundance of hoverflies between the two years and three different sites studied, related to insolation, mean daily temperature, and mean rainfall. According to the results presented on the calafate, the dynamics of the populations of these two hoverflies is linked to periods of drought and humidity, as stated by Wolda [38]. According to Ball and Morris [39], dry conditions favor a higher presence of hoverflies, while other authors observed that moderate levels of rain increase hoverfly abundance because they improve the insect’s body temperature and provide the offer of nectar from the flowers [40,41]. According to all these results, it can be said that significant phenology changes under climate variations can have strong impacts on community structures and ecosystem functions [16].
Finally, it is possible to highlight that the development of floral phenology observed in 2010 was desired in any production system, which is to say, with an intense floral expression concentrated in a relatively short period. Coincidentally, that year developed under climatic conditions that favored sunny and dry days with a great activity of insects that quickly pollinated the flowers. Consequently, at the end of the reproductive cycle, the highest proportion of branches with harvestable fruits was observed.
In addition of being essential for the pollination of calafate, syrphids are also important natural enemies of aphids, whiteflies, and other agricultural and forestry pests [42,43]. A single hoverfly larva can eat 20 to 30 aphids a day and up to 400 during its development [42]. The supply of food for hoverflies in Ushuaia at the beginning of spring is not very diversified, especially in years with a mild winter when adult syrphids shorten their lethargy. So, the first laid eggs are placed on the leaves close to the flower buds. Then, the first larvae introduce into the button flowers feed on pollen and successively on the aphids that appear on the pedicels and floral pieces. Something similar was observed by Huang and Lin [44] in Allograpta micrura Ali, finding larval stages inside flower buds, flowers, and fruiting structures. In addition, the appearance of green aphid adults was brought forward during the spring of 2016 due to the higher records of temperature and especially the relative humidity for the adult phase as described in peach green aphid by Ramadam et al. [45].
Hoverflies overwintering as adults in the forest are those flying around during the first warm days in spring and laying their eggs on aphid-infested plants. It also happens that those hoverflies that hibernated, as larva hidden in the ground, appear as adults later in the spring and lay eggs in the same places too [46]. For some authors, winter temperatures affect the life cycle of hoverflies more than spring temperatures [47,48]. They claim that early winter snowfalls advance the first adult flights in spring. On the other hand, hoverfly pupae generally require dampness or relatively high humidity to successfully mature into adults, since in dry conditions, larvae migrate to the ground looking for moisture [48]. This fact could explain the end of the larvae cycle in button flowers during the spring of 2016, which was very humid, as a consequence showing in the reduced number of not-damaged flowers that was observed.
5. Conclusions
The present study demonstrates that variation in climatic conditions in Ushuaia (Argentina) significantly modifies the reproductive phenology of B microphylla and its pollinator insects. Although the spring of 2016 developed under a strong “La Niña”, as in 2010, it could be that this effect delayed its expression in Ushuaia due to a long preceding period of strong “El Niño” (19 months in 2014–2016), with cooler temperatures leaving the environment and the soil saturated with humidity. The differences observed from a phenological point of view are not only due to the different cold requirements of these species, but also due to the temperatures during the spring. On the other hand, it is shown that the described climate change can significantly alter the population of pollinating insects, given that there is an early appearance when winter temperatures are higher than normal. However, this effect causes greater infection of calafate flowers by syrphid larvae, which can reduce the production of harvestable fruit. This study showed how climatic conditions can modify the floral phenology of B. microphylla and the frequency and activity of its pollinator insects.
Author Contributions
Conceptualization, S.R. and M.E.A.; methodology, S.R. and M.E.A.; software, S.R.; validation, S.R. and M.E.A.; formal analysis, S.R. and E.G.; investigation, S.R. and M.E.A.; resources, S.R.; data curation, S.R.; writing—original draft preparation, S.R.; writing—review and editing, S.R., M.E.A. and E.G.; visualization, S.R.; supervision, S.R. and E.G.; project administration, S.R.; funding acquisition, S.R. All authors have read and agreed to the published version of the manuscript.
Funding
This research was funded by MINCYT: PICTO UM 003 grant number. The APC did not receive external funding.
Data Availability Statement
Data are contained within the article.
Conflicts of Interest
The authors declare no conflict of interest.
References
- Arena, M.E.; Giordani, E.; Radice, S. Phenological growth and development stages of the native Patagonian fruit species Berberis buxifolia Lam. J. Food Agric. Environ. 2013, 11, 1323–1327. [Google Scholar]
- Arena, M.E.; Radice, S. Shoot growth and development of Berberis buxifolia Lam. in Tierra del Fuego (Patagonia). Sci. Hortic. 2014, 165, 5–12. [Google Scholar] [CrossRef]
- Radice, S.; Arena, M.E. Characterization and evaluation of Berberis microphylla G. Forst pollen grains. Adv. Hortic. Sci. 2016, 30, 31–37. [Google Scholar] [CrossRef]
- Radice, S.; Arena, M.E. Flower anatomy related to blooming development of Berberis microphylla G. Forst (Berberidaceae). Adv. Hortic. Sci. 2017, 30, 39–44. [Google Scholar] [CrossRef]
- Radice, S.; Arena, M.E. Reproductive shoots of Berberis microphylla G. Forst. in relation with the floral bud development and the fruit set. Heliyon 2018, 4, e00927. [Google Scholar] [CrossRef]
- Arena, M.E. Estudio de Algunos Fenómenos Morfofisiológicos y Cambios Bioquímicos en Berberis microphylla G. Forst. (sinónimo B. buxifolia Lam.) Asociados a la Formación y Maduración de Frutos en Tierra de Fuego y Su Relación con la Producción de Metabolitos Útiles. Ph.D. Thesis, Universidad Nacional del Sur, Bahía Blanca, Argentina, 2016. [Google Scholar]
- Pintos, F.M.; Flores, M.C.; Rodoni, L.; Radice, S.; Arena, M. Efecto de la liofilización en la retención de antocianinas de los frutos de calafate (Berberis microphyla G. Forst.) y su incorporación en cerveza. Investig. Cienc. Univ. 2019, 3, 48. Available online: http://sedici.unlp.edu.ar/handle/10915/94836 (accessed on 22 October 2023).
- Gutiérrez, R.S.; Pincheira, C.G. Description of the antioxidant capacity of Calafate berries (Berberis microphylla) collected in southern Chile. Food Sci. Technol. 2020, 41, 864–869. [Google Scholar] [CrossRef]
- Arena, M.E.; Lencinas, M.V.; Radice, S. Variability in floral traits and reproductive success among and within populations of Berberis microphylla G. Forst., an underutilized fruit species. Sci. Hortic. 2018, 241, 65–73. [Google Scholar] [CrossRef]
- Arena, M.E.; Pastur, G.M.; Lencinas, M.V.; Soler, R.; Bustamante, G. Changes in the leaf nutrient and pigment contents of Berberis microphylla G. Forst. in relation to irradiance and fertilization. Heliyon 2020, 6, e03264. [Google Scholar] [CrossRef]
- Suárez, F.J. Polinización en Berberis microphylla G. Forst. Estudio de la Participación de los Insectos en Esta Fase de Desarrollo. Graduation Thesis, Universidad de Morón, Buenos Aires, Argentina, 2015. [Google Scholar]
- Arena, M.E.; Giordani, E.; Radice, S. Flowering, fruiting and leaf and seed variability in Berberis buxifolia, a Patagonian native fruit species. In Native Species: Identification, Conservation and Restoration, 1st ed.; Marin, L., Kovaè, D., Eds.; Nova Science Publishers, Inc.: Hauppauge, NY, USA, 2011; Chapter 4; pp. 117–136. ISBN 978-1-161470-613-7. [Google Scholar]
- Parry, M.L.; Canziani, O.F.; Palutikof, J.P.; van der Linden, P.J.; Hanson, C.E. Climate Change 2007: Impacts, Adaptation and Vulnerability; Contribution of Working Group II to the Fourth Assessment Report of the Intergovernmental Panel on Climate Change; Cambridge University Press: Cambridge, UK, 2007. [Google Scholar]
- McEwan, R.W.; Brecha, R.J.; Geiger, D.R.; John, G.P. Flowering phenology change and climate warming in southwestern Ohio. Plant Ecol. 2011, 212, 55–61. [Google Scholar] [CrossRef]
- Sherry, R.A.; Zhou, X.; Gu, S.; Arnone, J.A., III; Schimel, D.S.; Verburg, P.S.; Wallace, L.L.; Luo, Y. Divergence of reproductive phenology under climate warming. Proc. Natl. Acad. Sci. USA 2007, 104, 198–202. [Google Scholar] [CrossRef] [PubMed]
- Piao, S.; Liu, Q.; Chen, A.; Janssens, I.A.; Fu, Y.; Dai, J.; Liu, L.; Lian, X.; Shen, M.; Zhu, X. Plant phenology and global climate change: Current progresses and challenges. Glob. Chang. Biol. 2019, 25, 1922–1940. [Google Scholar] [CrossRef] [PubMed]
- Visser, M.E.; Both, C. Shifts in phenology due to global climate change: The need for a yardstick. Proc. R. Soc. B Biol. 2005, 1581, 2561–2569. [Google Scholar] [CrossRef] [PubMed]
- Cosmulescu, S.; Ștefănescu, D.; Stoenescu, A.M. Variability of phenological behaviours of wild fruit tree species based on discriminant analysis. Plants 2021, 11, 45. [Google Scholar] [CrossRef] [PubMed]
- Souza, P.R. Algunos aspectos de influencia do clima e temperatura sobre a cultura do arroz irrigado no sul do Brasil. Lavoura Arrozeira 1990, 43, 9–11. [Google Scholar]
- Giordani, E.; Muller, M.; Gambineri, M.; Paffetti, D.; Arena, M.E.; Radice, S. Genetic and morphological analysis of Berberis microphylla G. Forst. accessions in southern Tierra del Fuego. Plant Biosyst. 2017, 151, 715–728. [Google Scholar] [CrossRef]
- Radice, S. Biología Floral y Reproductiva del Cultivar Forastero [Prunus persica (L.) Batsch] Rosaceae, Prunoideae, en Estiones Crecidos Sobre Pies Francos o Clonales Macro y Micropropagados. Ph.D. Thesis, Facultad de Ciencias Exactas y Naturales UBA, Buenos Aires, Argentina, 2005. [Google Scholar]
- Radice, S.; Arena, M.E. Effect of different pollination treatments on Berberis microphylla G. Forst, a Patagonian barberry. Acta Hortic. 2019, 1231, 75–80. [Google Scholar] [CrossRef]
- Radice, S.; Alonso, M.; Arena, M.E. Berberis microphylla: A species with Phenotypic Plasticity in Different Climatic Conditions. Int. J. Agric. Biol. 2018, 20, 2221–2229. [Google Scholar]
- Keller, M.; Tarara, J.M. Warm spring temperatures induce persistent season-long changes in shoot development in grapevines. Ann. Bot. 2010, 106, 131–141. [Google Scholar] [CrossRef]
- Geissler, C.; Davidson, A.; Niesenbaum, R.A. The influence of climate warming on flowering phenology in relation to historical annual and seasonal temperatures and plant functional traits. Peer J 2023, 11, e15188. [Google Scholar] [CrossRef]
- Bradley, N.L.; Leopold, A.C.; Ross, J.; Huffaker, W. Phenological changes reflect climate change in Wisconsin. Proc. Natl. Acad. Sci. USA 1999, 17, 9701–9704. [Google Scholar] [CrossRef] [PubMed]
- Zinn, K.E.; Tunc-Ozdemir, M.; Harper, J.F. Temperature stress and plant sexual reproduction: Uncovering the weakest links. J. Exp. Bot. 2010, 61, 1959–1968. [Google Scholar] [CrossRef]
- Yu, H.; Luedeling, E.; Xu, J. Winter and spring warming result in delayed spring phenology on the Tibetan Plateau. Proc. Natl. Acad. Sci. USA 2010, 107, 22151–22156. [Google Scholar] [CrossRef]
- Menzel, A. Phenology: Its importance to the global change community. Clim. Chang. 2002, 54, 379. [Google Scholar] [CrossRef]
- Forrest, J.R. Complex responses of insect phenology to climate change. Curr. Opin. Insect Sci. 2016, 17, 49–54. [Google Scholar] [CrossRef] [PubMed]
- Lucas, A.M. Hoverfly Communities in Semi-Natural Grasslands, and Their Role in Pollination. Ph.D. Thesis, Swansea University, Swansea, UK, 2017. [Google Scholar]
- Magnusson Rundqvist, M. Examining the Link between Temperature and Flight Phenology in Hoverflies (Diptera: Syrphidae) Using Swedish Citizen Science Data. Bachelor’s Thesis, Linköpings Universitet, Linköpings, Sweden, 2021. [Google Scholar]
- Van Rijn, P.C.J.; Wäckers, F.L. Nectar accessibility determines fitness, flower choice and abundance of hoverflies that provide natural pest control. J. Appl. Ecol. 2016, 53, 925–933. [Google Scholar] [CrossRef]
- Correa, J. Syrphidae: A Guide to Natural History and Identification of Common Genera in Santa Cruz County. Bachelor’s Thesis, University of California, Santa Cruz, CA, USA, 2019. [Google Scholar]
- Graham-Taylor, L.G.; Stubbs, A.E.; Brook, M. de L. Changes in phenology of hoverflies in a central England garden. Insect Conserv. Divers. 2009, 2, 29–35. [Google Scholar] [CrossRef]
- Hassall, C.; Owen, J.; Gilbert, F. Phenological shifts in hoverflies (Diptera: Syrphidae): Linking measurement and mechanism. Ecography 2016, 40, 853–863. [Google Scholar] [CrossRef]
- Freitas, L.; Sazima, M. Daily blooming pattern and pollination by syrphids in Sisyrinchium vaginatum (Iridaceae) in southeastern Brazil. J. Torrey Bot. Soc. 2003, 130, 55–61. [Google Scholar] [CrossRef]
- Wolda, H. Altitude, habitat and tropical insect diversity. Biol. J. Linn. Soc. 1987, 30, 313–323. [Google Scholar] [CrossRef]
- Ball, S.; Morris, R. Britain’s Hoverflies; An Introduction to the Hoverflies of Britain; Princeton University Press: Princeton, NJ, USA, 2013; Volume 9, ISBN 9780691156590. [Google Scholar]
- Petanidou, T.; Smets, E. Does temperature stress induce nectar secretion in Mediterranean plants? New Phytol. 1996, 133, 513–518. [Google Scholar] [CrossRef]
- Bressin, S.; Willmer, P.G. Estimation of thermal constants: The importance of using equilibrium temperature rather than ambient temperature demonstrated with hoverflies (Diptera, Syrphidae, genus Eristalis). J. Exp. Biol. 2000, 203, 2511–2517. [Google Scholar] [CrossRef] [PubMed]
- Rojo, S.; Gilbert, F.; Marcos-García, M.A.; Nieto, J.M.; Mier, M.P. A World Review of Predatory Hoverflies (Diptera, Syrphidae: Syrphinae) and Their Prey, 1st ed.; Centro Iberoamericano de la Biodiversidad (CIBIO), Ed.; Universidad de Alicante: Alicante, Spain, 2003; 219p. [Google Scholar]
- Zheng, Z.; Liu, H.; Wang, X.; Wu, X.; Chen, Y.; Deng, J.; Chen, X.; Li, Y.; Pu, D. Development and reproduction of the hoverfly Eupeodes corollae (Diptera: Syrphidae). J. Earth Sci. Environ. Stud. 2019, 4, 654–660. [Google Scholar]
- Huang, W.; Lin, J. Morfología Comparativa de las Tibias Posteriores Modificadas de los Machos en Cuatro Géneros de Abejas Euglosinas (apinae: Euglossini) y Biología de una Larva Polinívora, Allograpta micrura (diptera: Syrphidae), en Flores de Castilleja talamancensis (Scrhophulariaceae). Master’s Thesis, Universidad de Costa Rica, San Pedro de Montes de Oca, Costa Rica, 2005. [Google Scholar]
- Ramadan, M.M.; Bayoumy, M.H.; Afifi, M. Ecological studies on the Peach green aphid, Myzus persicae and its natural enemies. J. Plant Prot. Pathol. 2022, 13, 29–35. [Google Scholar] [CrossRef]
- Bugg, R.L.; Colfer, R.G.; Chaney, W.E.; Smith, H.A.; Cannon, J. Flower Flies (Syrphidae) and Other Biological Control Agents for Aphids in Vegetable Crops; ANR Publication 8285; University of California ANR: Davis, CA, USA, 2008; pp. 1–25. [Google Scholar] [CrossRef]
- Iler, A.M.; Inouye, D.W.; Høye, T.T.; Miller-Rushing, A.J.; Burkle, L.A.; Johnston, E.B. Maintenance of temporal synchrony between syrphid flies and floral resources despite differential phenological responses to climate. Glob. Chang. Biol. 2013, 19, 2348–2359. [Google Scholar] [CrossRef] [PubMed]
- Buxton, P.A. Terrestrial insects and the humidity of the environment. Biol. Rev. 1932, 7, 275–320. [Google Scholar] [CrossRef]


Disclaimer/Publisher’s Note: The statements, opinions and data contained in all publications are solely those of the individual author(s) and contributor(s) and not of MDPI and/or the editor(s). MDPI and/or the editor(s) disclaim responsibility for any injury to people or property resulting from any ideas, methods, instructions or products referred to in the content. |
© 2023 by the authors. Licensee MDPI, Basel, Switzerland. This article is an open access article distributed under the terms and conditions of the Creative Commons Attribution (CC BY) license (https://creativecommons.org/licenses/by/4.0/).