Article

Phenotypic and Molecular Diversity of Wild Populations of Acca sellowiana (Berg.) Burret in the Southern Area of Natural Distribution

1
Departamento de Biología Vegetal, Facultad de Agronomía, Universidad de la República, Avda. E. Garzón 780, Montevideo CP 12900, Uruguay
2
Departamento de Sistemas Agrarios y Paisajes Culturales, Centro Universitario Regional del Este, Universidad de la República, Ruta 15 y Ruta 9, Rocha CP 27000, Uruguay
3
Departamento Territorio, Ambiente y Paisaje, Centro Universitario Regional del Este, Universidad de la República, Av. Cachimba del Rey entre Bvar. Artigas y Av. Aparicio Saravia, Maldonado CP 20000, Uruguay
4
Departamento de Biometría, Estadística y Computación, Facultad de Agronomía, Universidad de la República, Avda. E. Garzón 780, Montevideo CP 12900, Uruguay
*
Author to whom correspondence should be addressed.
Horticulturae 2024, 10(4), 360; https://doi.org/10.3390/horticulturae10040360
Submission received: 8 March 2024 / Revised: 25 March 2024 / Accepted: 27 March 2024 / Published: 5 April 2024

Abstract

:
Acca sellowiana is a subtropical tree in the myrtle family (Myrtaceae) native to southern Brazil and northeastern Uruguay. It is recognized for its value as a fruit-bearing, ornamental, and medicinal species. Based on distinctive characteristics of fruits, seeds, and leaves, as well as its geographical distribution pattern, two variants of the species are distinguished: the “Brazilian type” and the “Uruguayan type”. The objective of this study was to characterize, for the first time, the diversity of 202 individuals from four wild populations in Uruguay, representative of the species’ most southern natural distribution. Twenty-three morphological descriptors (leaf, flower, and fruit) and 204 RAPD (Random Amplified Polymorphic DNA) markers were used. The morphological data collected validated the main criteria that distinguish “Uruguayan type” populations from “Brazilian type” populations, such as lower seed weight and fruit size, thin and slightly rough skin, high pulp percentage, and hairy white abaxial leaf surfaces. Analyses of both morphological and molecular data indicated wide diversity and strong population structuring, which is relevant information for designing conservation plans, sustainable utilization, and genetic improvement of the plant genetic resources of this species.

1. Introduction

The species Acca sellowiana (Berg.) Burret (2n = 2x = 22) is a tree or shrub in the myrtle family (Myrtaceae), native to southern Brazil and northeastern Uruguay, with dispersion in the province of Misiones in Argentina [1,2,3]. It is recognized for its value as a fruit-bearing, ornamental, and medicinal species. In Uruguay, it is known as “guayabo del país”, “guayaba”, or “guayaba de monte”, in Brazil as “goiabeira-serrana”, and internationally as “feijoa” or “pineapple guava”. The fruits, with distinctive flavor and aroma, are suitable for fresh consumption and for the development of various food products such as juices, chutneys, jams, cakes, wines, and yogurts [2,4,5,6]. The nutraceutical characteristics that distinguish the fruits of this species [7,8,9,10,11,12,13] have been reported, and its use as an ornamental species is also appreciated [14]. Based on its natural geographical distribution area and the expression of morphological characteristics, two groups have been proposed within the species: the “Brazilian type” and the “Uruguayan type”. The former is found in the Atlantic Forest biome, distributed at altitudes higher than 400 m in the southern Brazilian plateau, on basaltic soils. It is characterized by large seeds, fruits with hard and dry skin, and leaves with a light green abaxial surface and sparse, whitish pilosity. The latter belongs to the Pampa biome and is strictly distributed in Uruguay and in the southern part of the state of Rio Grande do Sul in Brazil at lower altitudes than the “Brazilian type” plants. These plants have small seeds, fruits with soft and succulent skin, and leaves with a grayish white abaxial surface with dense and white pilosity [1,15,16]. According to high-resolution maps of Koppen–Geiger climate classification [17], the climatic types are Cfb and Cfa for the distribution areas of the “Brazilian type” and the “Uruguayan type”, respectively.
In Uruguay, wild populations of A. sellowiana are part of the “Eastern Flora”, a floristic region of the woody flora. They are exclusively distributed in the northeast and east of the country, where evergreen species belonging to the Paranaense phytogeographic province predominate, with a clear continuity with the flora of southern Brazil [18]. The “Eastern Flora” is further divided into two disjointed areas: the North Core in the northwest of the departments of Tacuarembó and Rivera, and the South Core along the hilly zone that connects the north of the department of Cerro Largo, at the border with Brazil, with the department of Maldonado on the Atlantic Ocean in a NE-SW direction. In each core, a primary nucleus is recognized in which A. sellowiana is one of the 18 exclusive species that define it [18].
The main cultivation areas are not located in the original region of the feijoa; they are found in New Zealand, the United States (California), and Colombia, among other countries [10,19,20,21]. Some cultivars of A. sellowiana, widely distributed internationally, derive from a small number of introductions of “Uruguayan type” plants [2,16,22,23]. In 1890, Professor Edouard André introduced a specimen or a few specimens of the species from Uruguay to France, which, according to Popenoe [24], were the origin of the seedlings introduced in California, and later reached New Zealand [1]. Subsequently, Colombia introduced materials from various parts of the world [25].
On the other hand, in Brazil and Uruguay, the development of cultivation is incipient and recent, driven by research institutions and interested farmers themselves. Traditionally, cultivation has been maintained on a small scale, while household consumption of fruits is carried out from wild plants, guarded, and in some cases, possibly semi-domesticated [6,20,26,27,28]. Genetic improvement based on local germplasm has been initiated in both countries in recent decades, leading to the development of the first cultivars [21,29,30,31], although with limited use of wild germplasm.
Although the high genetic diversity of semi-domesticated populations of feijoa distributed in Brazil and Uruguay has been noted, information on diversity of wild feijoa populations has been produced mostly in Brazil, with scarce data from Uruguay [32,33,34,35,36,37,38,39,40]. Therefore, systematic studies on the genetic and morphological characterization of wild feijoa populations in Uruguay, located in the southernmost natural distribution area of the species need to be undertaken.
The objective of this study is to look into the diversity among and within wild populations of A. sellowiana through the characterization of morphological and molecular diversity of plants from four wild populations in northeastern Uruguay, aiming to develop strategies for conservation, sustainable utilization, and genetic improvement.

2. Materials and Methods
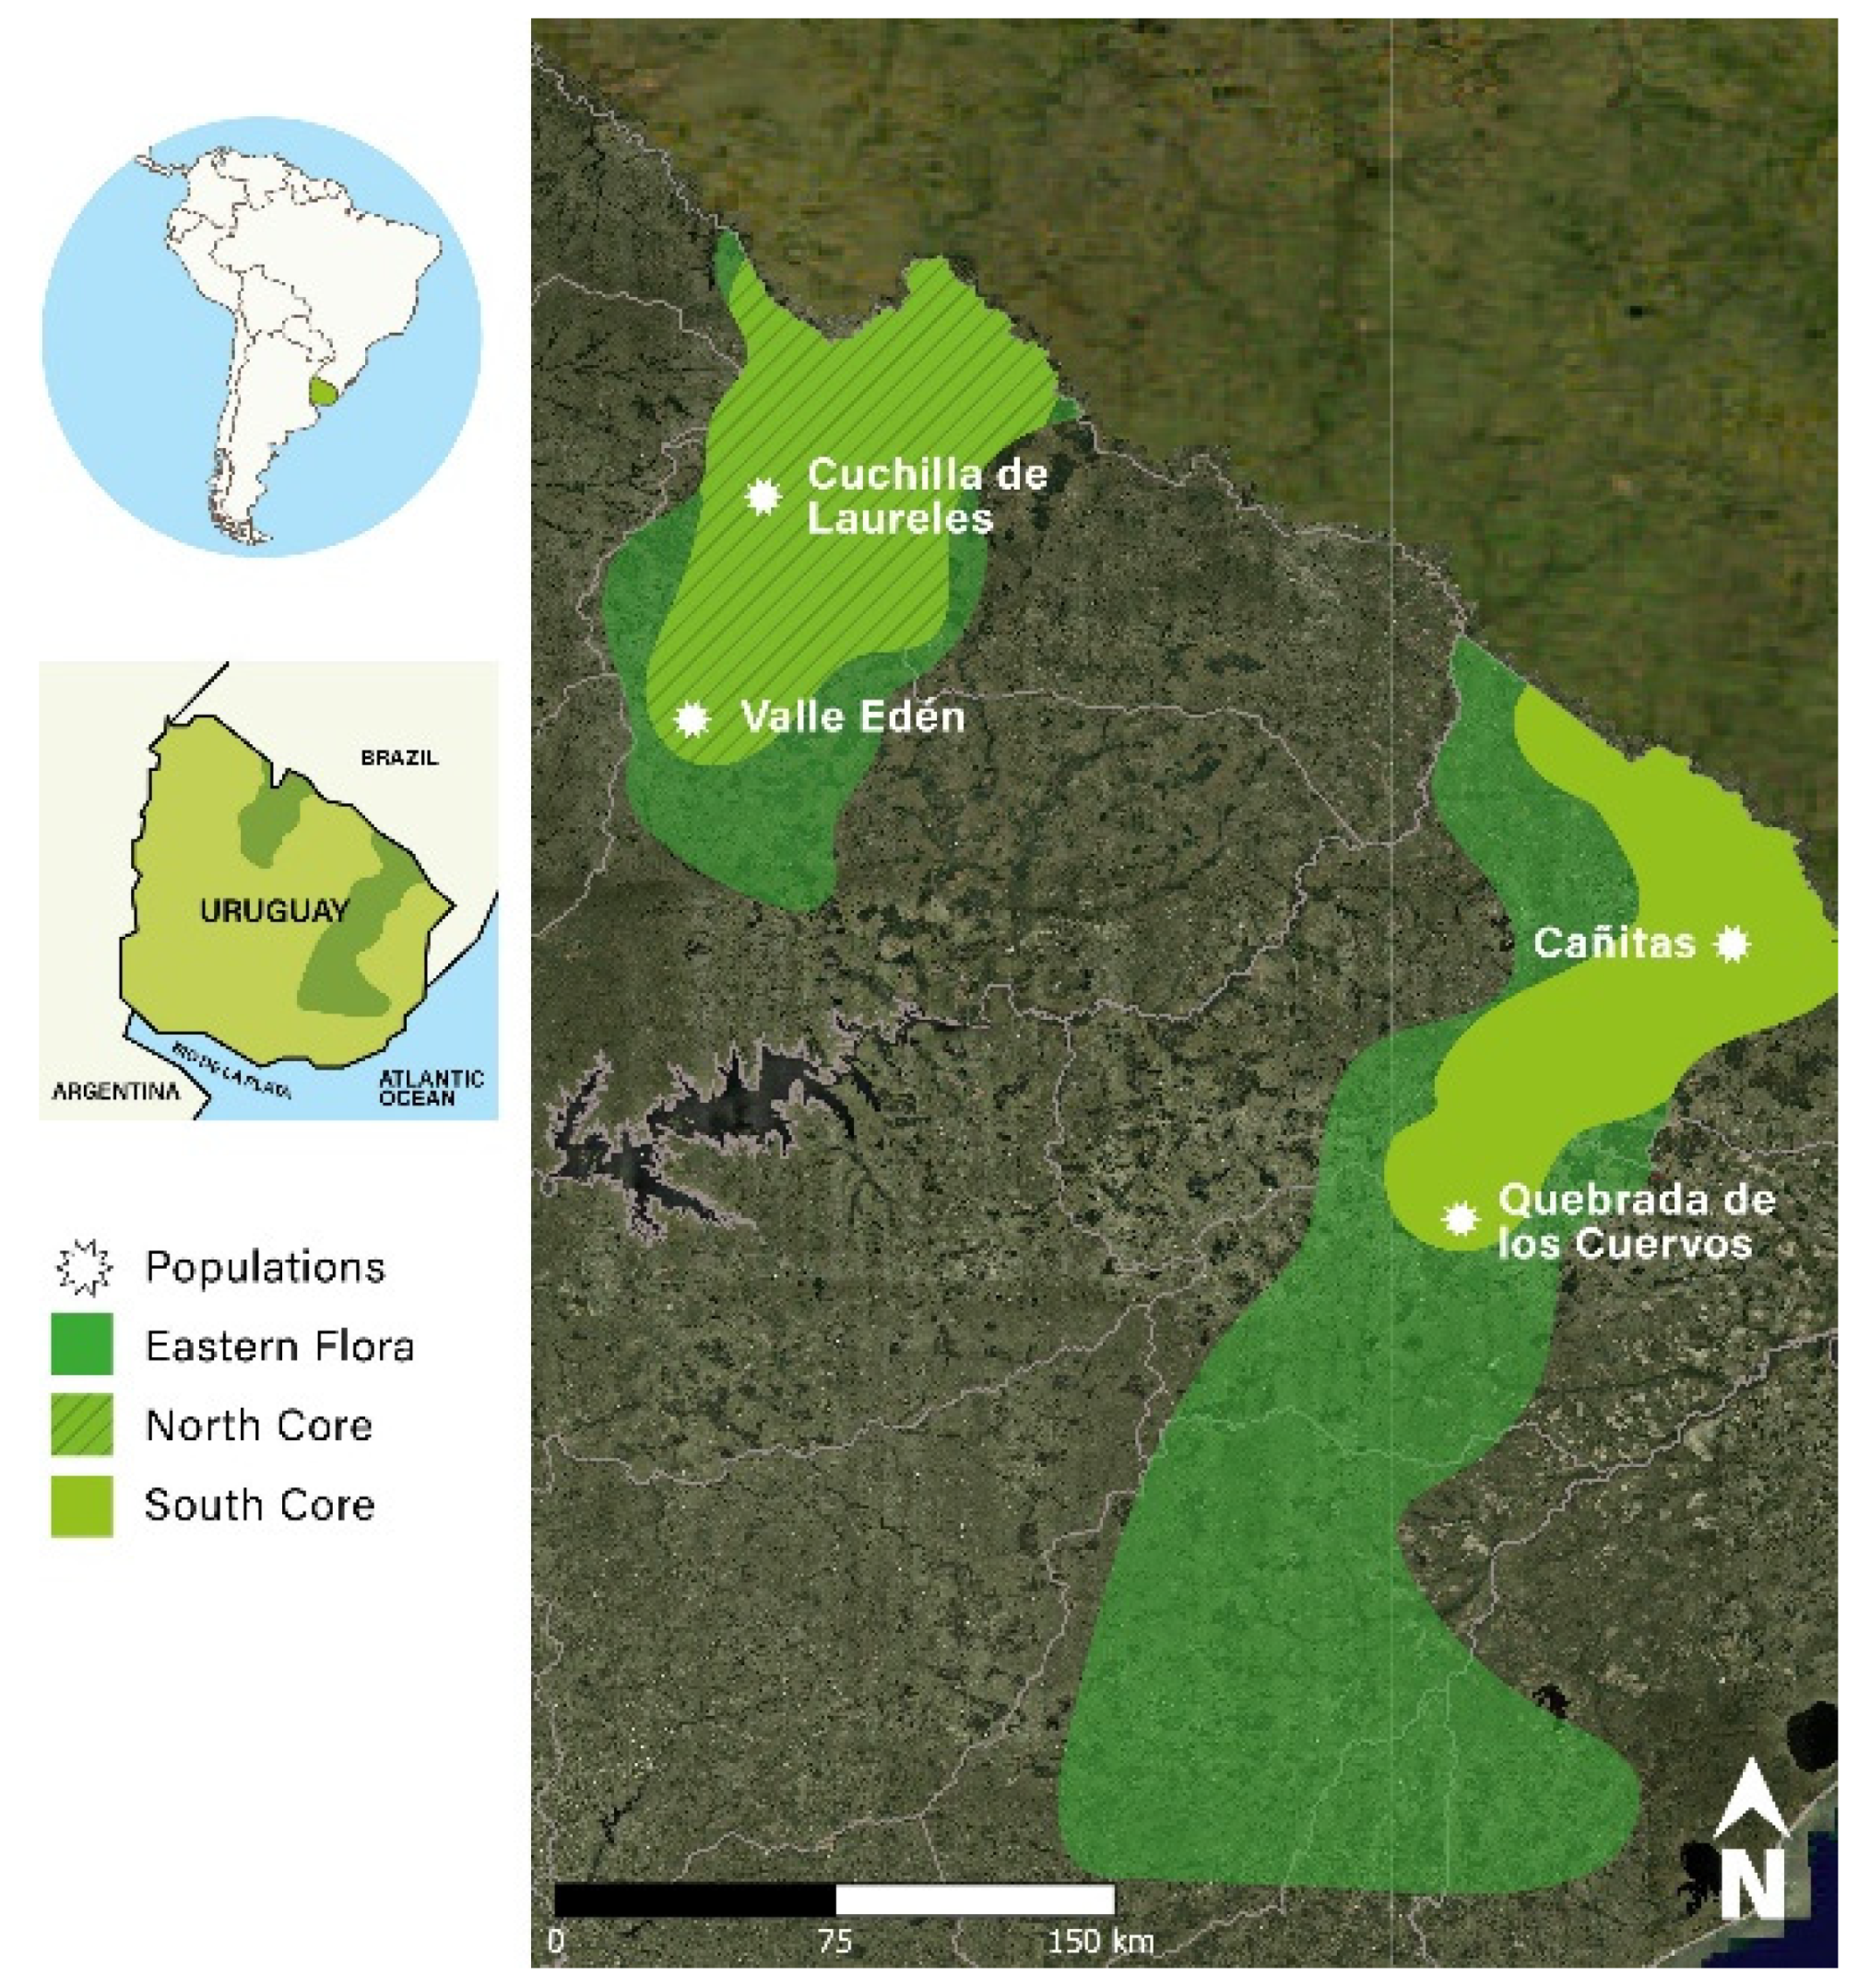
2.1. Plant Material

Four wild populations of A. sellowiana were identified in northeastern Uruguay, the natural distribution area of the species [1,41]. They are included in the distribution area of the “Eastern Flora” for tree and arborescent species [18]. The populations of Quebrada de los Cuervos (QC) and Cañitas (CA) are distributed in the South Core of this flora and are located in an eco-region/landscape known as “Eastern Sierras” [42,43]. The populations of Valle Edén (VE) and Cuchilla de Laureles (CL) are found in the Northern Core. The VE population is located in an eco-region known as “Gondwanic sedimentary basin” or “Northeastern sedimentary basin” [43]. The CL population is situated in the eco-region of the “Basaltic ridge” [42,43]. The minimum geographical distances between sites occur within each floristic core and are 85.4 km (QC–CA) and 54.9 km (VE–CL), while distances between populations from different floristic cores are 225.8 km (CL–CA), 224 km (CL–QC), 219.3 km (VE–CA), and 196.4 km (VE–QC) (Figure 1, Supplementary Table S1, Supplementary Figure S1). The climate is classified as Cfa according to the updated Koppen–Geiger classification [17].
In each population, between 49 and 54 individuals were identified and georeferenced, following the sampling strategy proposed by Brown and Marshall [44]. The selection of individuals was carried out randomly as the survey of each site was conducted. In this way, representatives of each population were obtained across a range of ages, growth conditions, and health states.

2.2. Phenotypic Characterization

For each individual, a total of 23 descriptors (vegetative and reproductive) corresponding to nine qualitative and 14 quantitative descriptors, previously identified by Puppo et al. [45] for A. sellowiana, were recorded (Table 1). Ten leaves, 10 flowers, and 10 fruits were collected from each individual in a single growth cycle. It was not always possible to collect the total number of flowers and fruits, so for some plants, data for all variables were not available. The leaves, fully developed, were collected in autumn from the middle sector of the shoot and the middle part of the canopy. Flowers were collected in spring at phenological stage F2 [46], corresponding to a fully open flower. Fruits collected per tree were at maturity stage, taking the moment when it becomes easy to separate the fruit from the peduncle as the maturity index [47]. The methodology of data collection was previously described by Puppo et al. [45].

2.3. Molecular Characterization

Total DNA was extracted from dried leaf samples using silica gel and collected from individual plants of the four populations (Supplementary Table S1). The extraction was performed using the protocol described by Doyle and Doyle [48], modified by Quezada [34]. Essentially, 25 mg of dried plant material, previously pulverized with liquid nitrogen, was incubated with 500 µL of extraction buffer (4% CTAB, 100 mM Tris pH 8.0, 1.4 M NaCl, 20 mM EDTA) for two hours at 55 °C. After treatment with RNase and extraction with chloroform, the DNA was precipitated with 0.6 volumes of isopropanol for 12 h at −20 °C. After ethanol washing, the purified pellet was resuspended in 100 µL of TE buffer (10 mM Tris-HCl pH 7.5, 1 mM EDTA). The samples were diluted to 25 ng/µL and stored at −20 °C.
A total of 10 random decamer primers (Operon Technologies, Alameda, CA, USA), previously used by Dettori and Palombi [23], were evaluated, of which 8 were finally selected for diversity analysis (Supplementary Table S2). Polymerase Chain Reaction (PCR) reactions were performed in a total volume of 25 µL containing genomic DNA (25 ng), decamer primer (2 µM), dNTPs (0.2 mM), Taq polymerase buffer 1X (10 mM Tris-HCl pH 8.8, 2 mM MgCl2), and 1 U of Taq DNA polymerase. The amplification process was performed in a Thermal Cycler (Corbett, model C61-96) with the following temperature profile: 5 min at 94 °C followed by 44 cycles of 1 min at 94 °C, 1 min at 35 °C, and 2 min at 72 °C. The final elongation step of the reaction was 7 min at 72 °C. The amplification products were separated on 2% agarose gels with 1X Tris Borate EDTA (TBE) buffer at 80 V for 2 h and photographed under UV. All amplification reactions were analyzed in duplicate. Each gel included a molecular weight marker (1 kb, Fermentas, MD, USA) in triplicate and amplifications corresponding to the primer under study from three reference individuals (VE9, CA19, CL32) corresponding to different populations (CL, QC, CA, VE) to facilitate comparison of results between gels. Band selection was performed using the CrossChecker program 2.91 [49].

2.4. Statistical Analysis of the Phenotypic Data

A statistical analysis was conducted using the SAS OnDemand for Academics program. A total of 23 descriptors and 202 individuals were analyzed. For each quantitative variable, a linear model was used to compare populations. From this model, the means of each population were estimated, and Tukey–Kramer tests were performed to test mean differentiation. The significance of differences in frequency distribution among the four populations was analyzed for qualitative descriptors using the chi-square test.
Multivariate analyses were conducted using the R program 4.3.3. [50] for 77 out of the 202 plants, which had complete data for 20 out of the 23 analyzed descriptors (flower descriptors were not included). A total of 18, 17, 19, and 23 plants from the CA, CL, QC, and VE populations, respectively, were included. To jointly analyze qualitative and quantitative variables from different plant organs, a Hierarchical Multiple Factor Analysis (HMFA) was conducted using FactoMineR, where variable types are nested according to whether they are from fruit or leaf [51,52].
Using the coordinates of each observation in each of the three dimensions generated by HMFA, a discriminant analysis was performed to calculate the probability of individuals belonging to each population and estimate Mahalanobis distances between populations. The clustering pattern among the 77 individuals was also analyzed through cluster analysis, using Euclidean distances between individuals in the first three dimensions and applying the minimum variance method within groups [53].

2.5. Molecular Data Analysis

Only clear, repeatable bands between 250 and 2000 bp were recorded as present (1) or absent (0) in A. sellowiana plants. RAPD markers with frequencies greater than 0.05 were considered polymorphic. Markers and/or individuals with more than 10% missing data were eliminated. The percentage of polymorphic RAPD markers was calculated for each primer.
For the analysis of genetic relationships among individuals, a distance matrix was constructed using the distance coefficient proposed by Jaccard [54]. The frequency distribution of distances and their respective medians was analyzed for each population. To visualize clustering patterns, a cluster analysis was performed using the Neighbor Joining (NJ) method, and the data were presented in a dendrogram. The stability of the nodes of each group was estimated using bootstrap resampling (1000 times). Diversity patterns among individuals were also analyzed using Principal Component Analysis (PCA). The “vegan” [55], “ape” [56], and “adegenet” [57] programs in R [50] were used for genetic distance estimation, NJ and PCA analyses.
Analysis of Molecular Variance (AMOVA) tested the significance of variance components: within populations, among populations, and between floristic nuclei: north and south [58]. The significance of variance components was tested using 1000 permutation tests. The level of genetic differentiation among populations was estimated using the specific population fixation index (Fst), pairwise Fst estimation between populations, and the average number of migrants per generation as a measure of gene flow. These analyses were conducted using the “adegenet” [57] and “hierfstat” [59] programs in R [50].
Genetic structure based on models was analyzed using the STRUCTURE v.2.3 program [60]. An “admixture” model based on correlated allele frequencies without using prior population information was employed. Under this model, the individual probability of assignment to each group (Q) can be interpreted as the proportion of the individual genome originating from that group. For each possible value of K from 1 to 10, 10 independent runs were implemented with a burn-in of 50,000 iterations followed by 100,000 replicates of MCMC (Markov Chain Monte Carlo). The consensus result for each K was obtained from independent runs using CLUMPAK [61]. The most probable value of K was determined using the Delta k value [62] calculated using STRUCTURE HARVESTER 0.6.94 [63].

3. Results

3.1. Characterization of Phenotypic Diversity

This study reports, for the first time, the diversity among plants and populations for fourteen quantitative and nine qualitative descriptors of the four studied wild populations of A. sellowiana in Uruguay (Table 2).
The variance among the four populations was significant for all 14 quantitative variables analyzed. Tukey–Kramer analyses for paired populations (Supplementary Table S3) showed significant differences in five to thirteen variables. The smallest differences occurred between the VE and CL populations, corresponding to the descriptors AF, DF, SST, AH, and AFL. In contrast, the QC population differed from the other three populations in nine descriptors, including AF, DF, PF, NSEM, P100, LH, LH/AH, AFL, and LPIST.
In the case of P100 (0.082–0.327 g), the QC and CA populations had the highest averages, with QC being higher. Conversely, the lower values of VE and CL do not differ from each other (Table 2). The ECAS had an average of 2.6 mm (1.1–6.7 mm), with the widest ranges corresponding to QC and CA, in contrast to the narrow range presented by VE with a lower mean. Regarding PF, the average was 9.8 g with a wide range from 1.9 to 51.8 g. The highest average PF occurs in the QC population, which shows significant differences with the other three studied populations (Supplementary Table S3). In contrast, the minimum PF, and the narrower range of variation, corresponds to the VE population. For the SST variable with an average value of 15.1 °Brix, the VE population stands out with significantly higher values than the other three populations. The average RP was 35.6%, and all populations showed wide and similar ranges for this variable. In this case, the CA population stands out with a lower value for this variable due to a relatively smaller fruit size and thicker pericarp.
The VE–CL populations did not show significant differences for NSEM, LH, and LH/AH, while for AH, the populations that did not show significant differences were the QC–CA populations. For flower descriptors, the DISTEE had an average value of 3.7 mm (−5.2 and 7.8 mm), finding only significant differences between QC–VE and VE–CA. The other two flower variables, AFL (1.1–3.9 mm) and LPIST (1.8–3.5 mm), showed diversity both among and within populations.
The frequency distribution for eight of the nine qualitative variables (Table 3) indicated diversity within and among the four wild populations of A. sellowiana. The RUG of the fruits, although it did not show significant differences between populations (p < 0.05; Table 3), was distributed among materials with smooth skin, somewhat rough, and rough, without observing fruits with very rough skin. With the exception of CA, each population presented three states of FFRUT (oval, oblong, and round), with the oval form being the most prevalent and the elongated state not being found. Regarding RCAS, globally, the highest percentage (68%) of fruits were concentrated between soft, soft-medium, and medium, with the remainder being hard and very hard fruits. CL stands out for not presenting the categories of greater hardness. On the other hand, fruits also show diversity for SEP, COLP, and COLINT. The most abundant pulp color category was cream white 3 followed by amber white 2.
The most frequent leaf shape (FORH) was obovate (92%), and the leaf apex form (FORAPH) was predominantly rounded (63%) and obtuse (35%). All plants exhibited the underside of the leaf with dense ash-white pilosity.
The stamen distribution (DEST) showed both radial (65%) and random (35%) states, with differences observed between populations. While VE and CL had over 80% radial distribution, QC showed that over 90% had random distribution, and in CA, the frequencies of both states were similar.

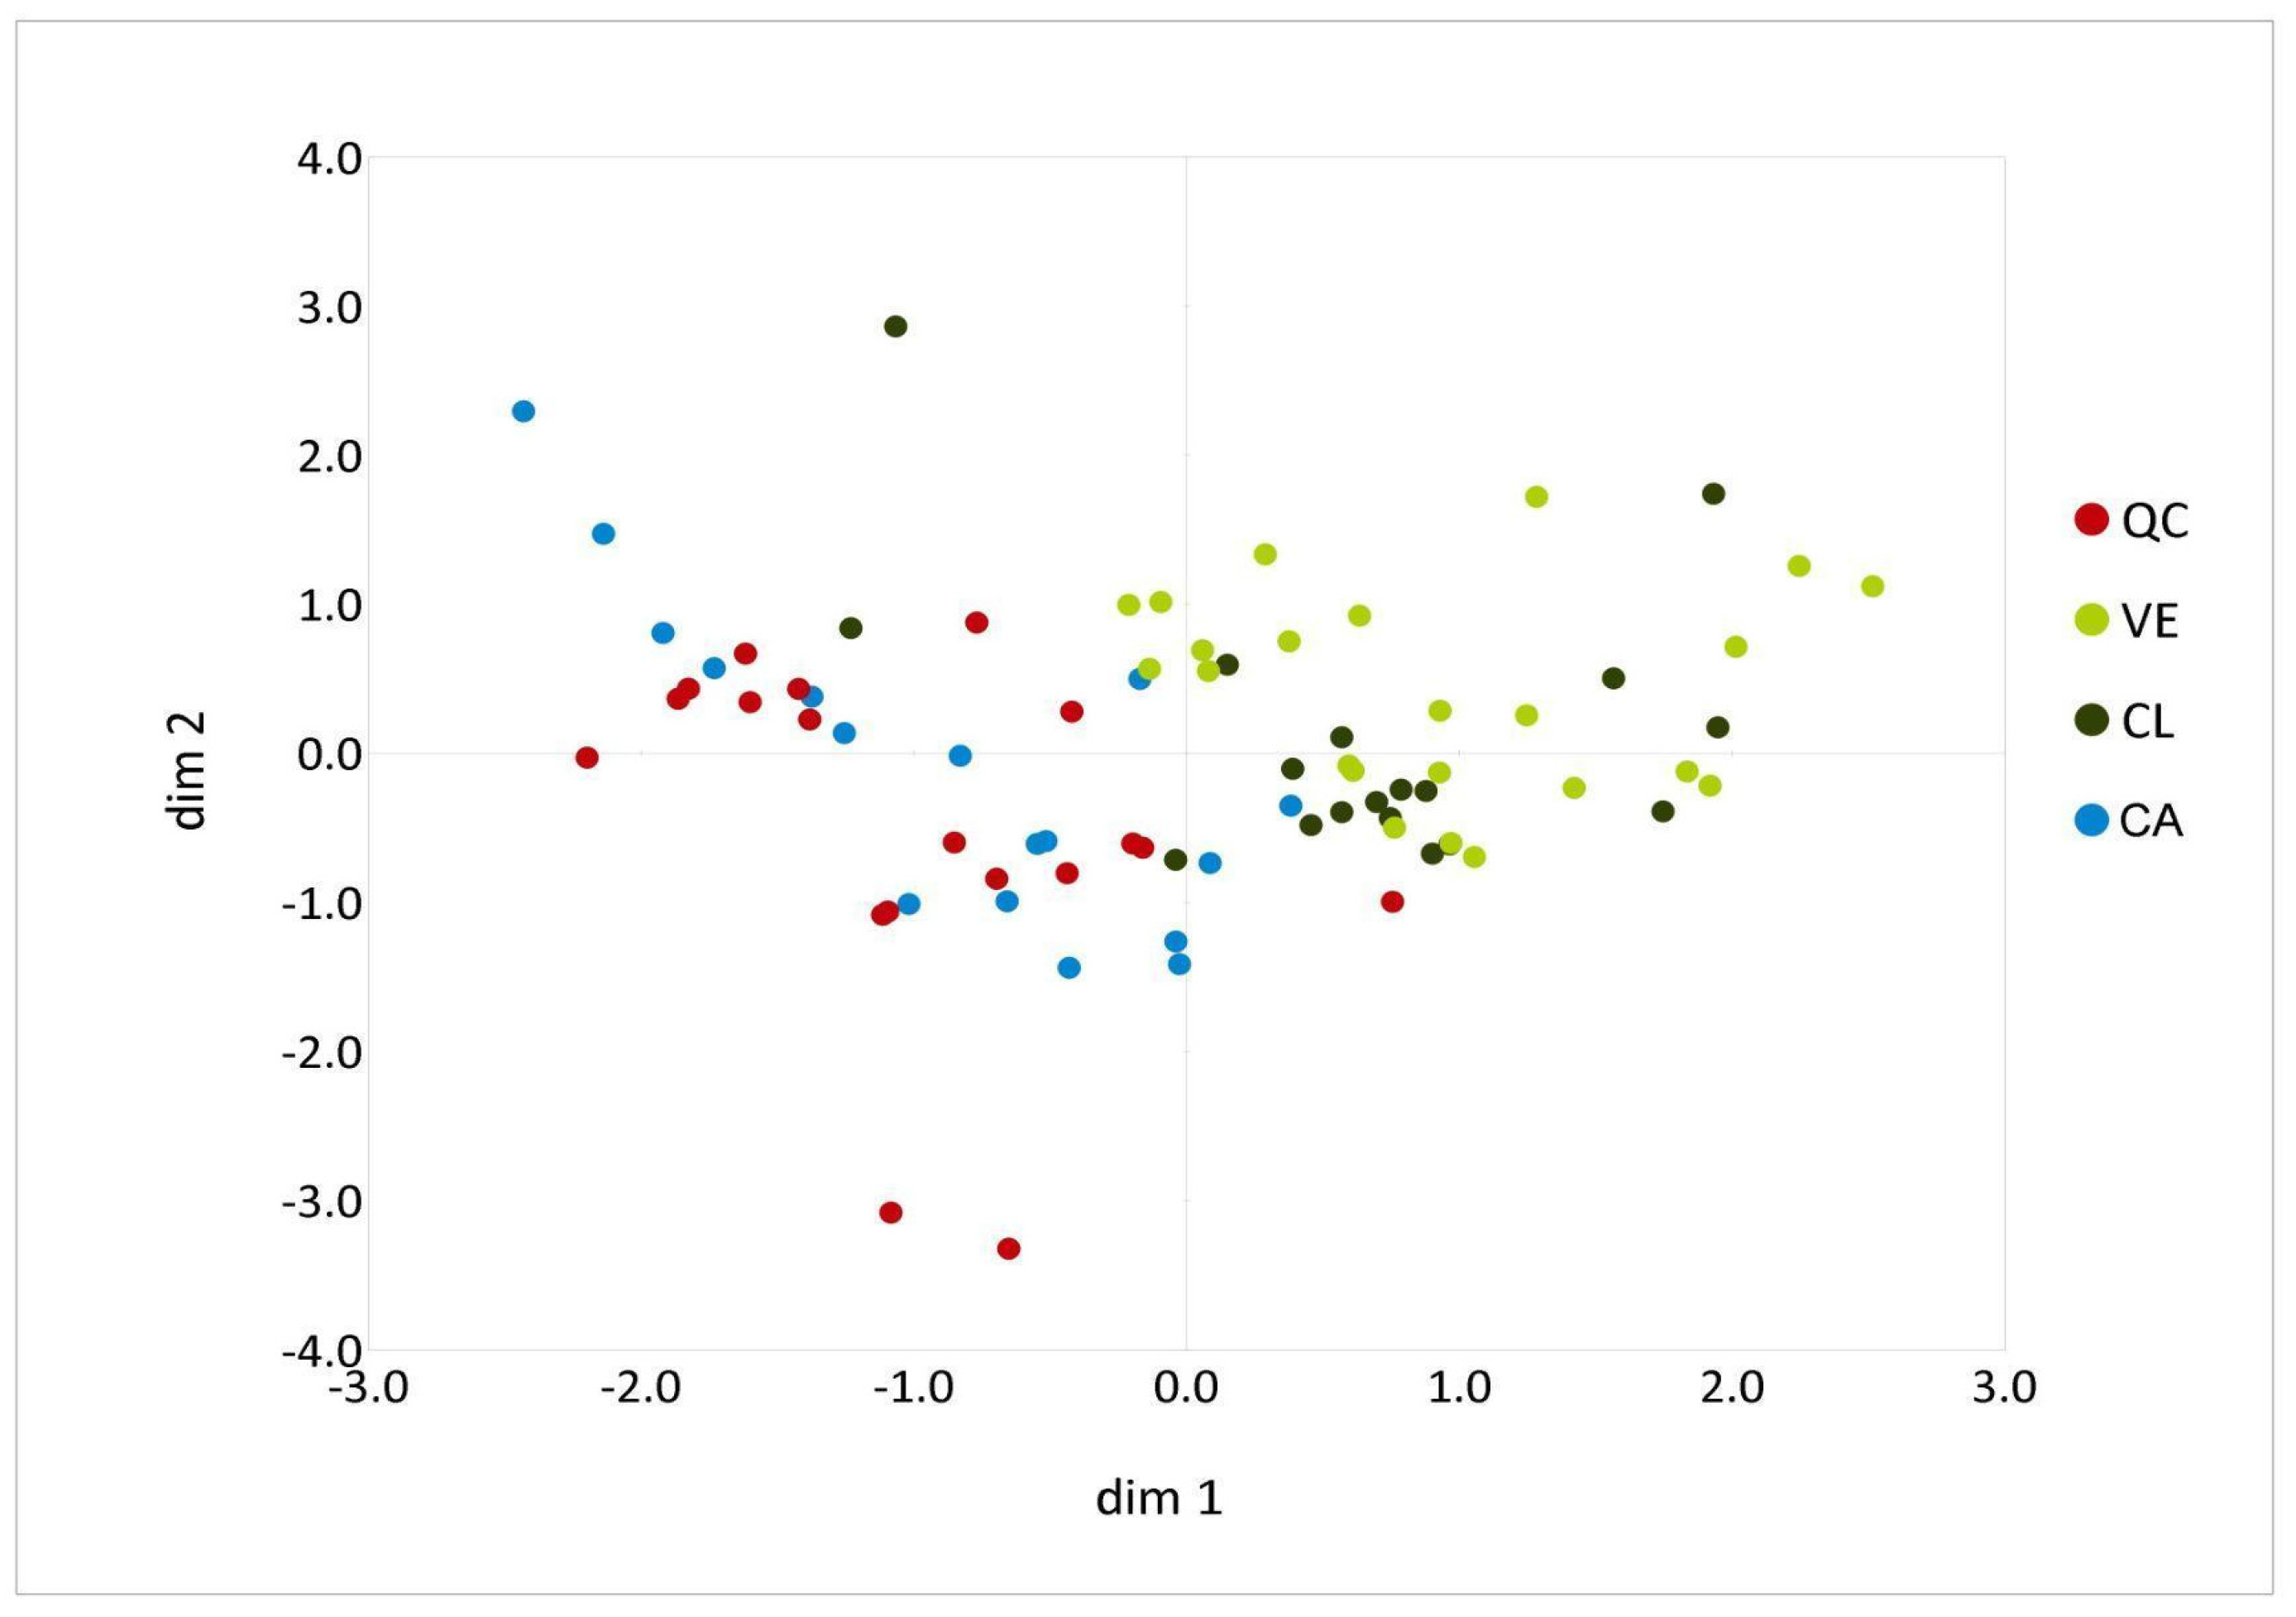
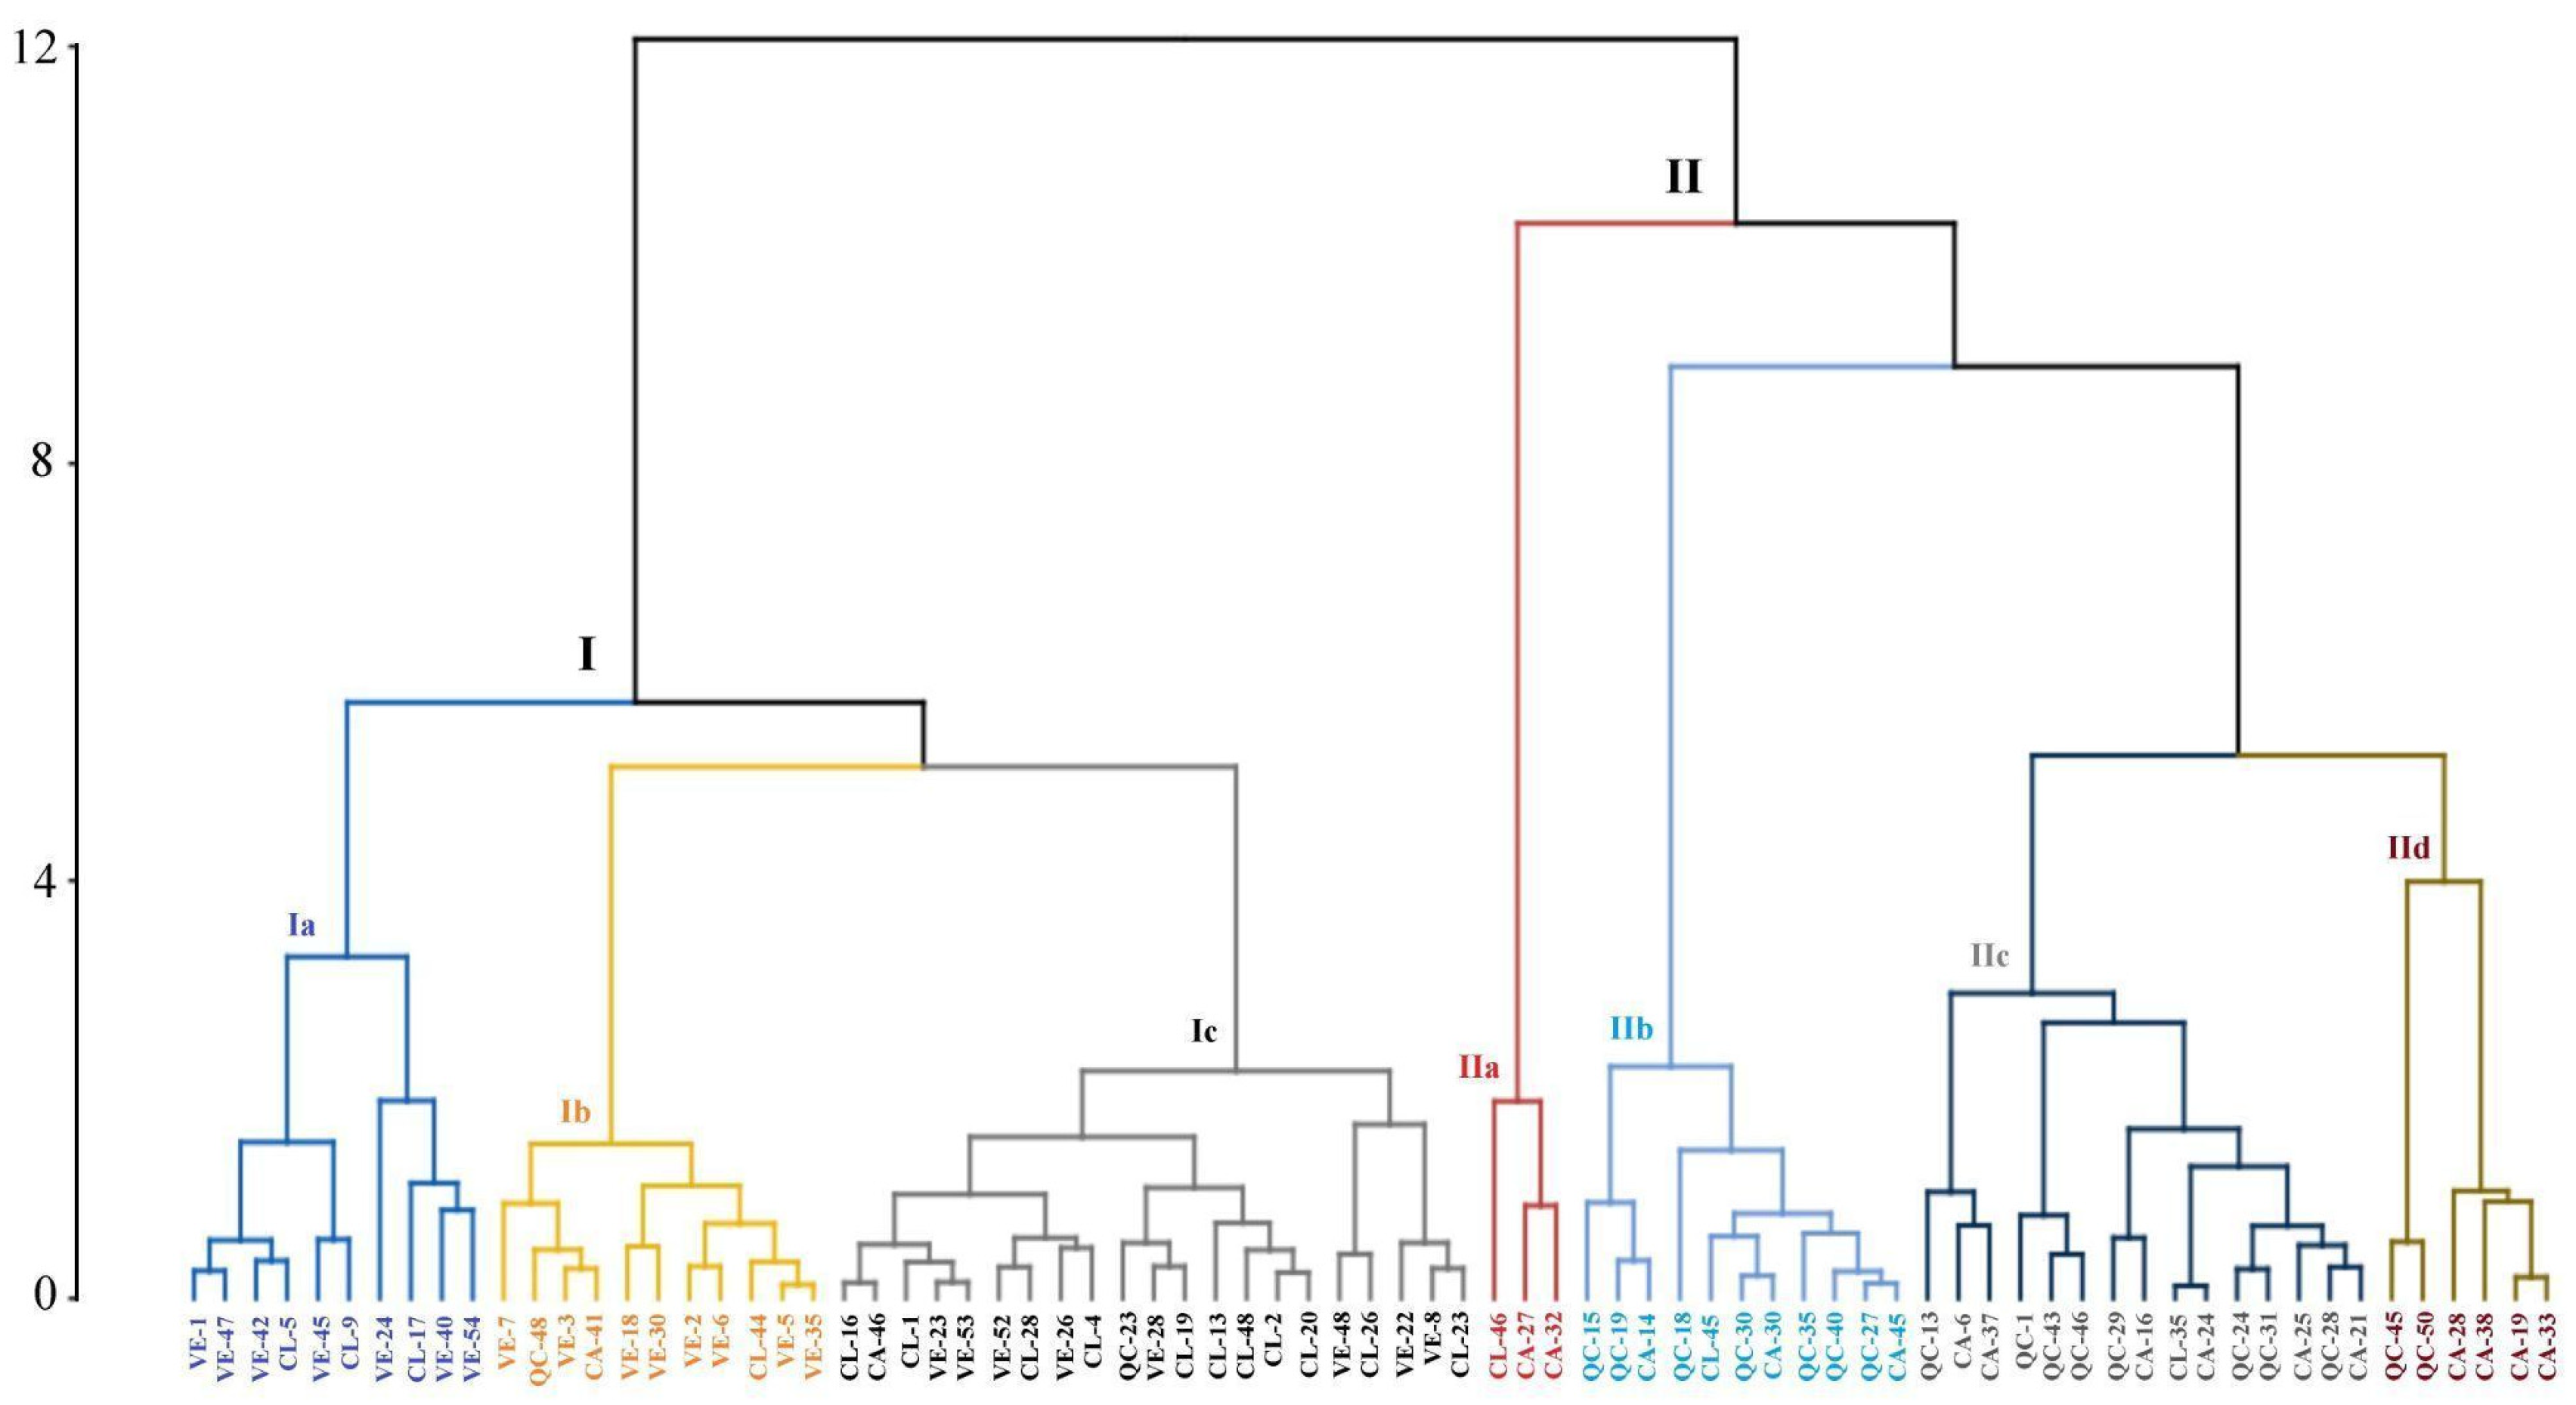
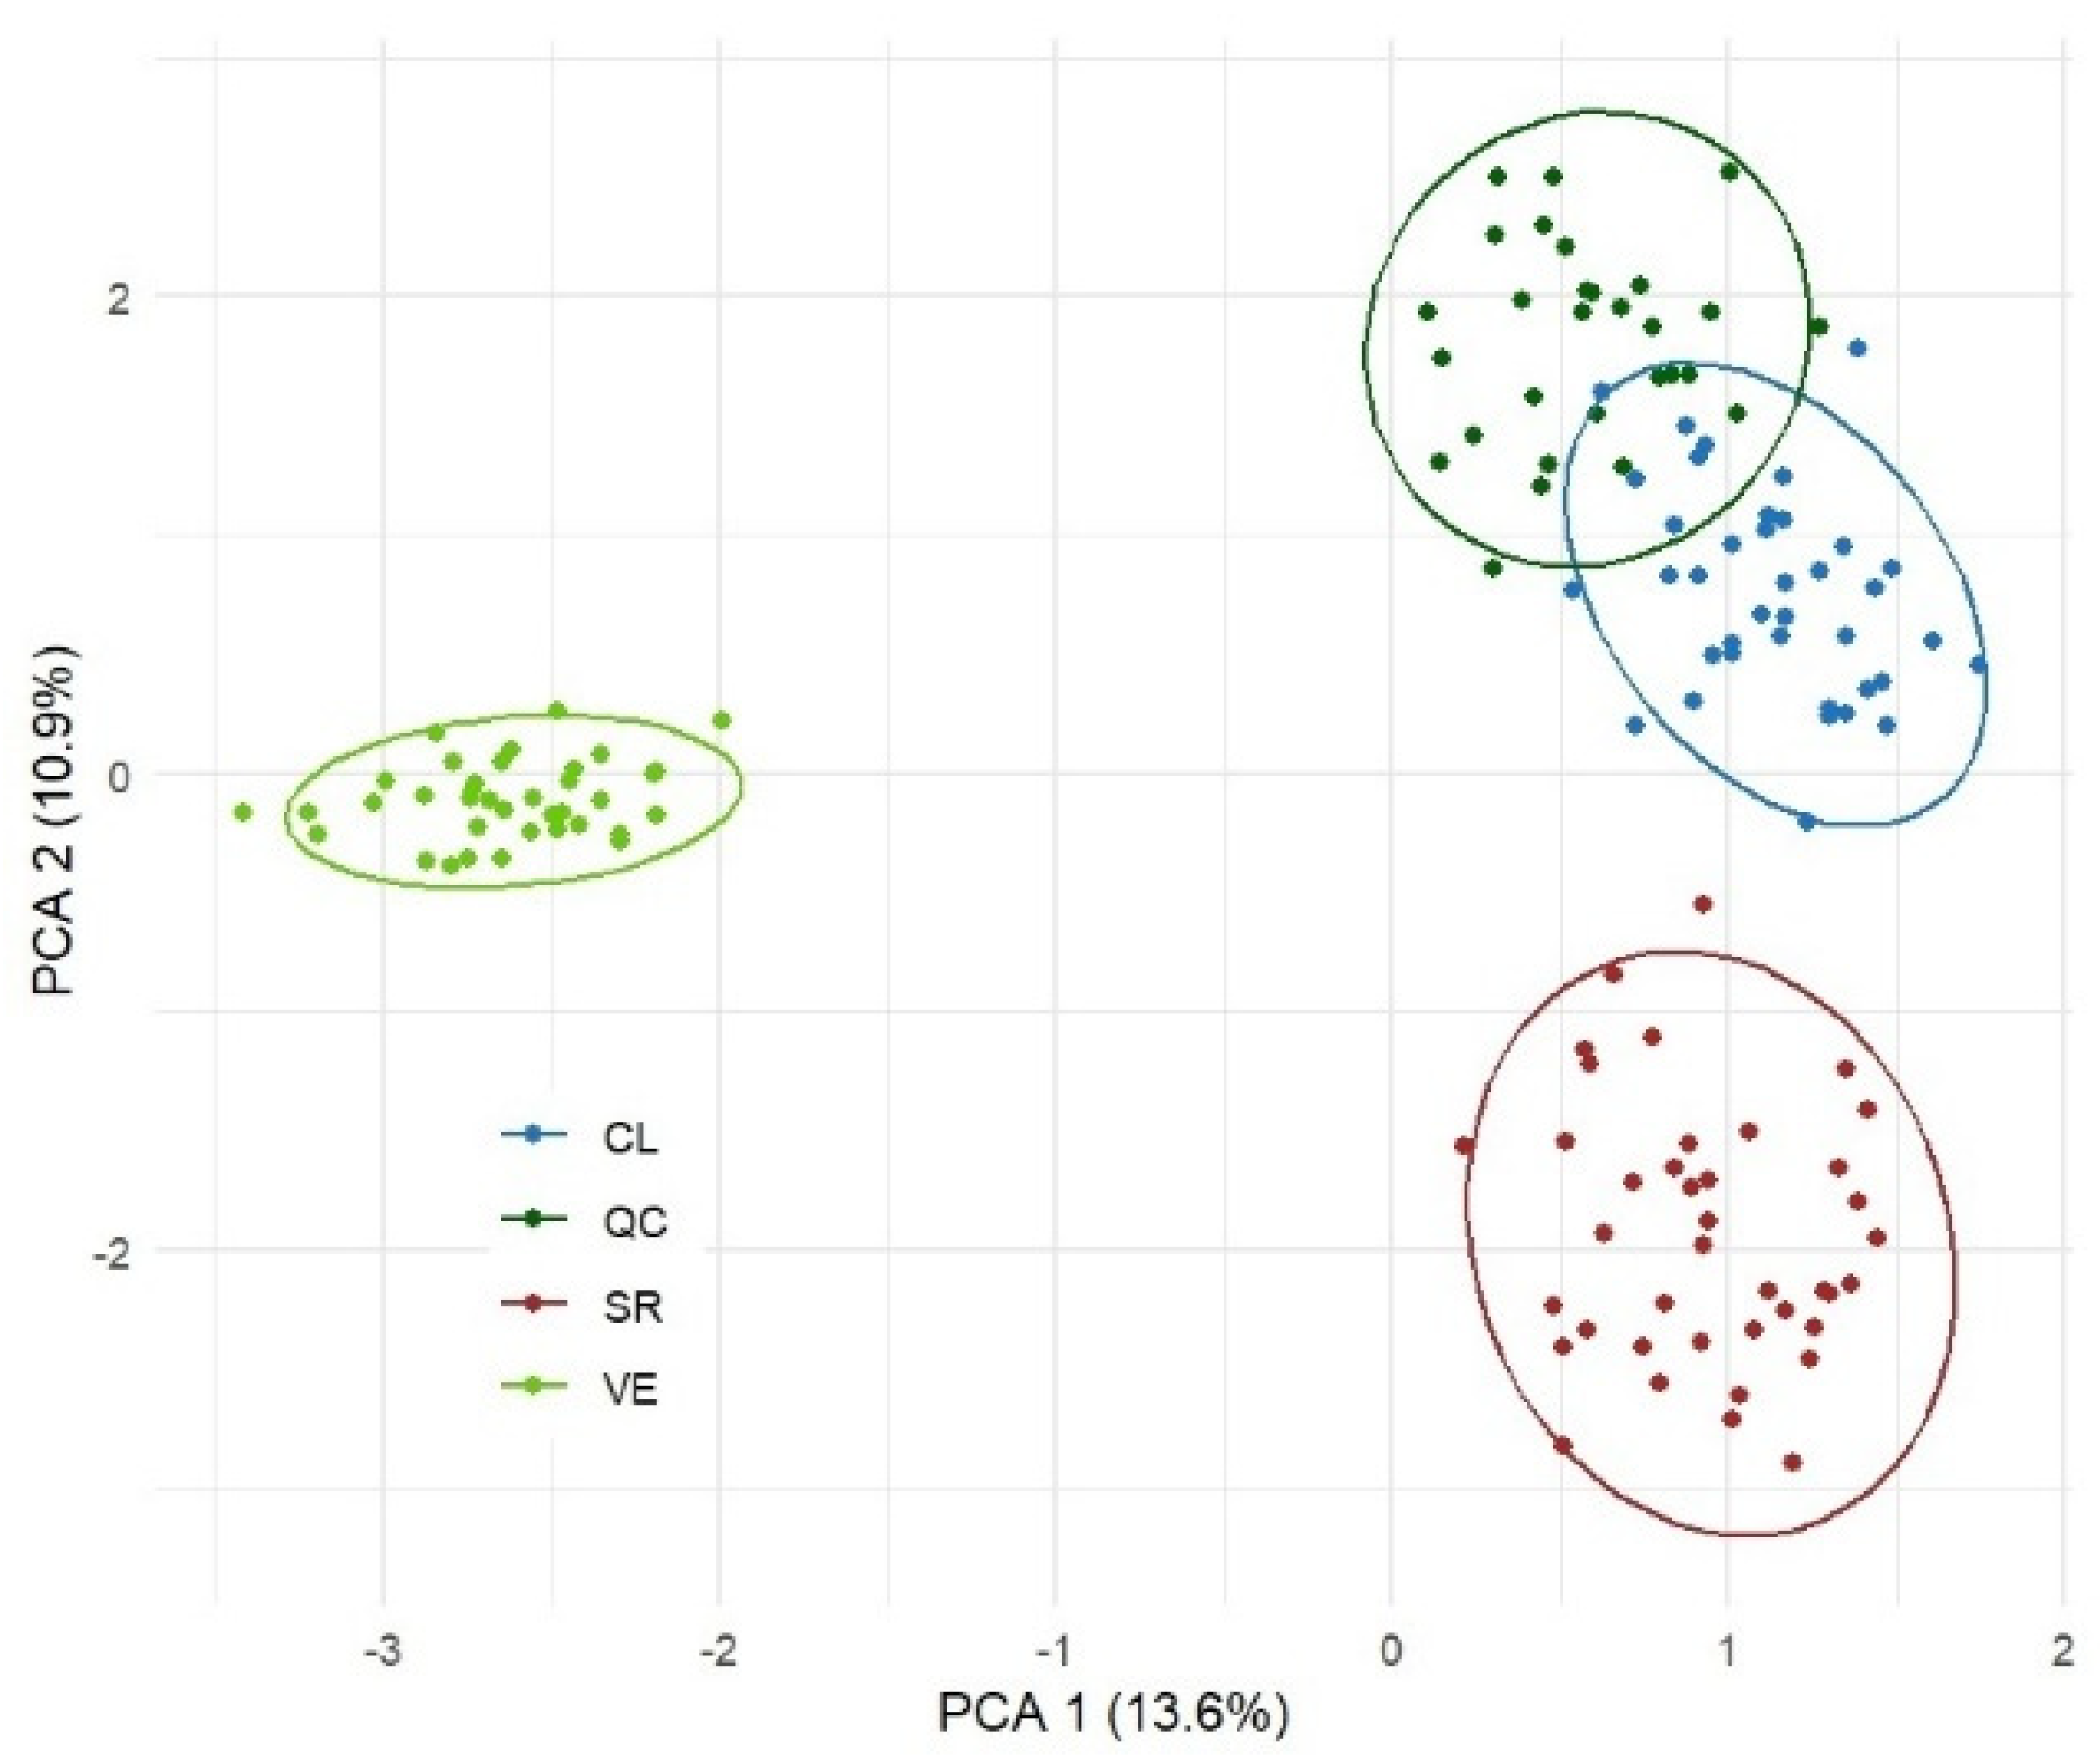
3.2. Multivariate Analysis of Phenotypic Diversity

In the Hierarchical Multiple Factor Analysis (HMFA) of principal coordinates, the first dimension was primarily associated with qualitative fruit descriptors (46%) and quantitative leaf descriptors (54%), while the second dimension was mostly linked to qualitative leaf descriptors (80%). It is observed that the first dimension forms two groups that could be mostly explained by the geographical location and distance between populations (Figure 2). Thus, populations VE and CL were mostly located in the right quadrants, while QC and CA were situated on the left side of the figure, with CA showing greater dispersion. However, two individuals from CL were located near CA + QC; likewise, one from QC and one from CA were located near VE + CL.
The discriminant analysis showed that the percentage of individuals’ membership to their original population was very high, with values of 100.0%, 94.4%, 89.5%, and 87.0% for CA, CL, QC, and VE, respectively. In all cases, the Mahalanobis distances between paired populations showed significant differences (p < 0.0001) The greatest Mahalanobis distances occurred in the QC–VE and VE–CA pairs, coinciding with greater geographical distance between them.
The cluster analysis based on morphological data (Figure 3) showed two main clusters. Cluster I includes all individuals from VE and 83.0% (15/18) of individuals from CL. Cluster II includes 89.5% (17/19) of individuals from QC and 88.2% (15/17) of individuals from CA. In Cluster I, subgroups Ia, Ib, and Ic are observed, which mainly comprised individuals from the Northern Floristic Core. Similarly, Cluster II, with four subgroups, mainly comprised individuals from the Southern Floristic Core.

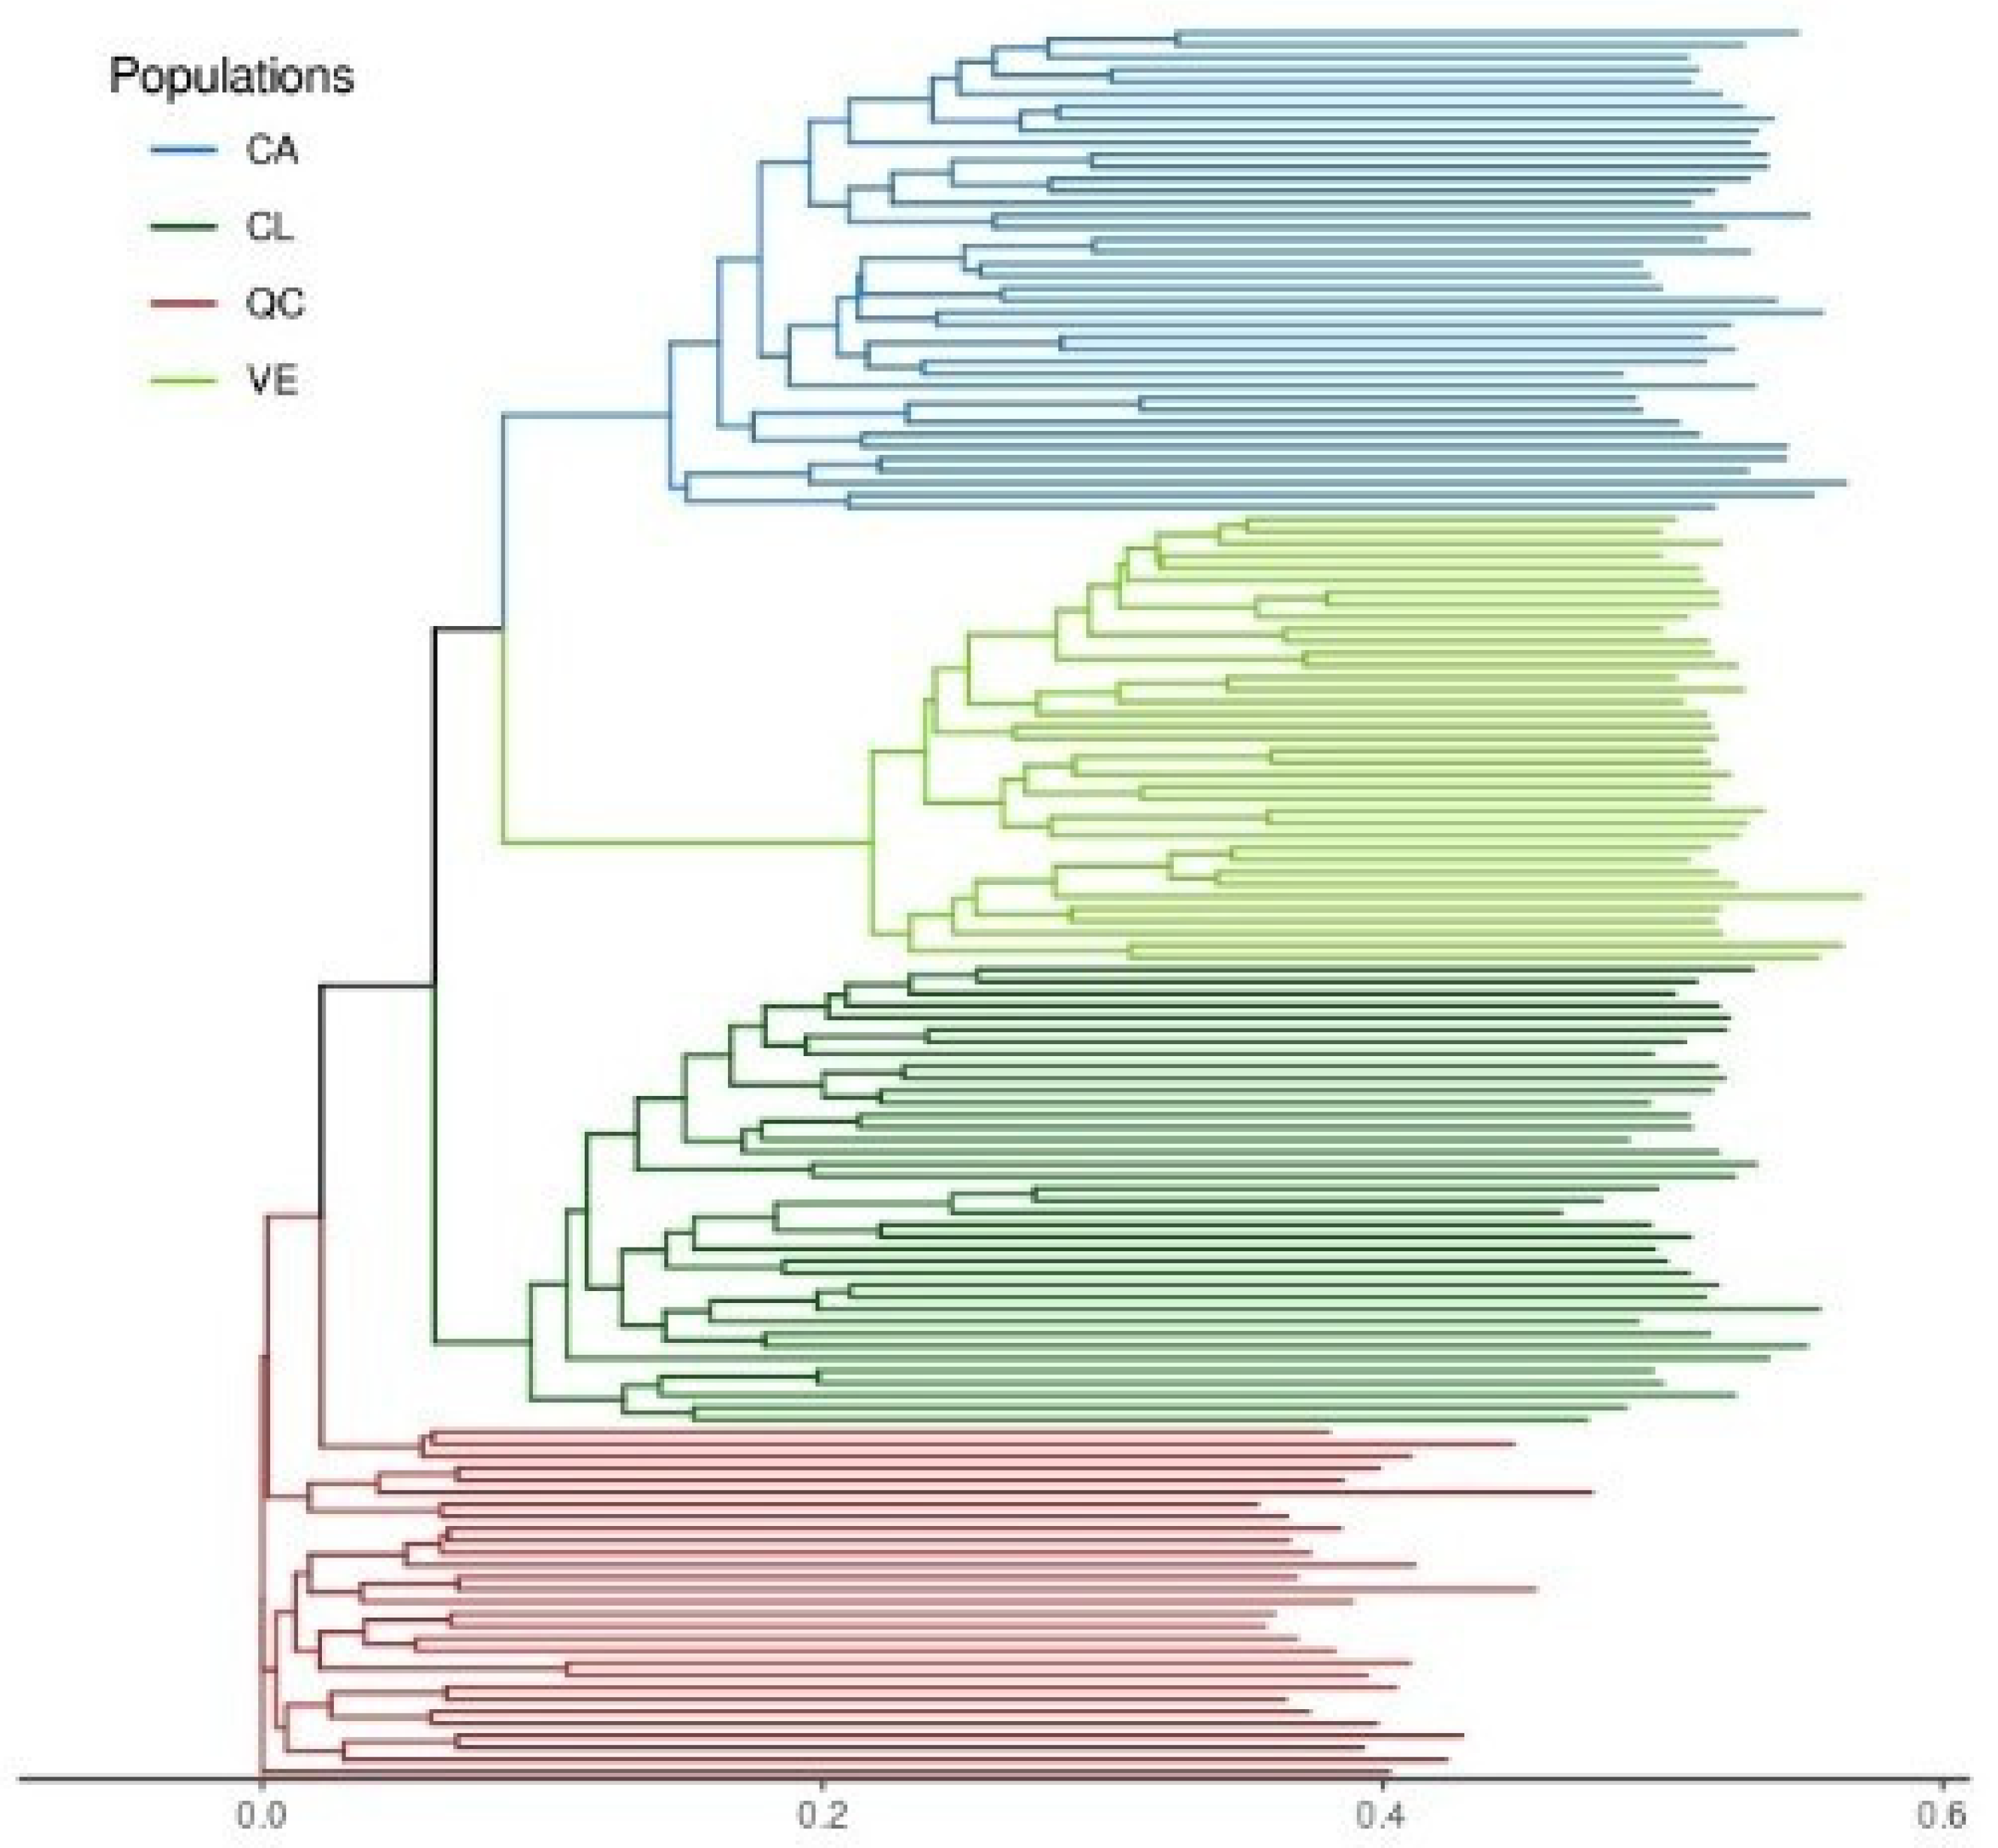
3.3. Characterization of Molecular Diversity

Out of the 202 individuals morphologically analyzed, 154 were characterized with eight RAPD primers. After eliminating those with more than 10% missing data, 144 individuals were retained. A total of 204 RAPD markers (250 to 2000 bp) were detected. On average, there were twenty-six markers per primer, with a minimum of nine for primer OPA17 and a maximum of forty-four for primer OD3. The percentage of polymorphic markers was 62% (127/204). Regarding polymorphic markers per population, it was 25.5% for VE, 34.3% for CA, 42.7% for CL, and 56.3% for QC. Exclusive markers to a single population represented 16.5% of the total polymorphic markers (21/127), while those shared by two, three, and four populations corresponded to 38.6%, 29.9%, and 15.0%, respectively.

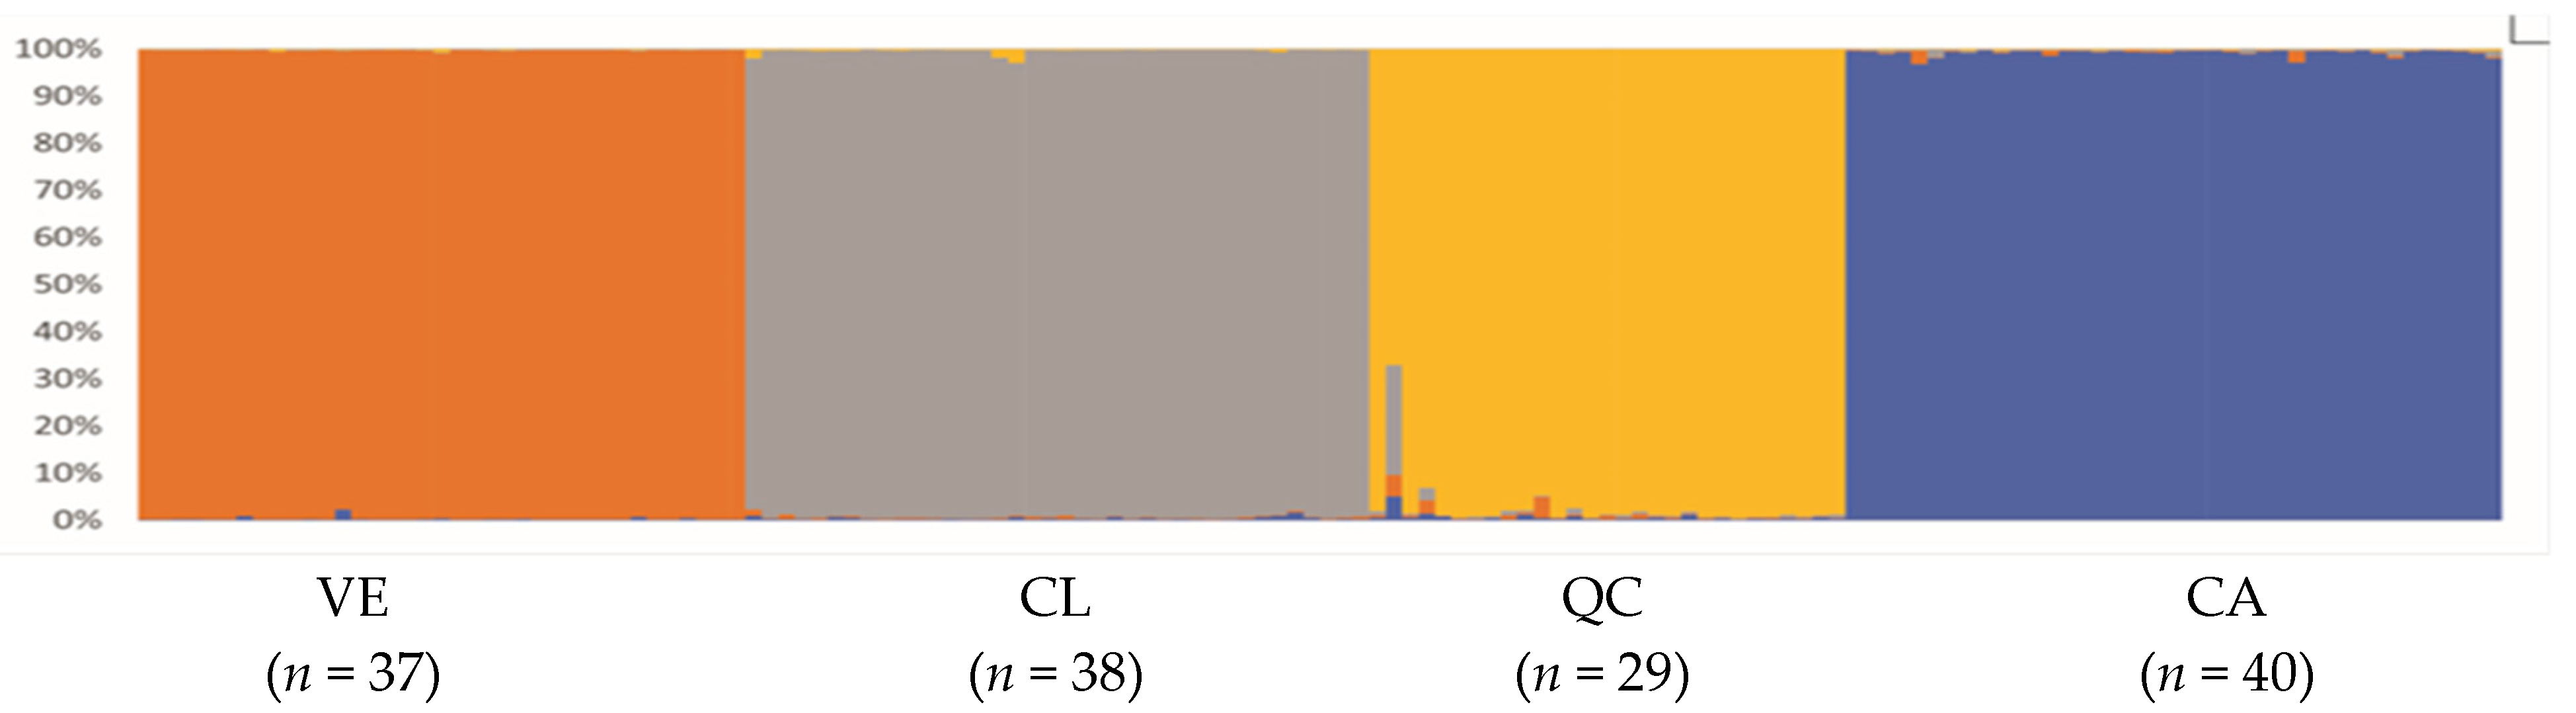
3.4. Estimation of Genetic Diversity per Population

The median genetic distances (Jaccard coefficient) per population varied between 0.53 for VE and 0.78 for CL. Additionally, CA exhibited the widest range of distances between individuals (0.55), while the narrowest range was observed for QC (0.36).
In the dendrogram resulting from the Neighbor Joining (NJ) clustering method, the occurrence of four groups is clearly observed, supported by high Bootstrap values (Figure 4). The groups consisted exclusively of individuals from the same geographical origin (population). In the Principal Component Analysis (PCA), the first two coordinates explained 24.5% of the total variance (Figure 5). Consistent with this analysis, the populations of VE and CA are clearly differentiated, while QC and CL are more related. The greatest genetic relationship between individuals occurs in VE in both PCA and NJ, which is consistent with the lowest median genetic distance per population. The STRUCTURE analysis was run for 144 individuals using 127 RAPD markers. The maximum delta (K) value was obtained for K = 4, representing the most appropriate number of groups. For K = 4, 100% of the individuals were assigned to one of the four groups, with very high membership percentages (Figure 6). Each group consisted exclusively of individuals from the same origin (VE, CA, QC, and CL).
The AMOVA analysis indicated that the floristic nucleus component was not significant However, both the between-population and within-population components were significant (Table 4). The highest percentage of total molecular variance was observed within populations (62.25%), while between populations it was 34.75%. The Wright’s fixation index was Fst = 0.3419, indicating high differentiation among populations associated with different geographical origins.
The paired Fst values (indicators of differentiation between two populations) described in Table 5 indicated that the least differentiated population pairs were QC–CL and the most differentiated were VE–CA, with paired Fst values of 0.240 and 0.430, respectively. Furthermore, the levels of gene flow, based on M [64], were values of M = 1.583 and M = 0.664 for QC–CL and VE–CA, respectively.

4. Discussion

4.1. Molecular and Phenotypic Diversity

The results obtained in this study on the characterization of the phenotypic and molecular diversity of four wild populations of A. sellowiana from Uruguay substantially expand the information on the genetic pool of this species in the southern area of its natural distribution. The characterization of 202 individuals with 23 morphological descriptors represents an advancement compared to the limited data previously reported [1,15,16]. The detection of high levels of phenotypic diversity (Table 2 and Table 3, Supplementary Table S3) indicates a high potential as a genetic resource and relativizes previous reports of lower diversity for this pool [16,38,39]. Additionally, the high value of polymorphism detected with molecular markers and the high level of genetic diversity found agree with the high value of the median Jaccard genetic distance per population.
The distinction between “Brazil” and “Uruguay” types [15,16,38,65], initially made with a small number of individuals from Uruguay, is confirmed in this study for a large number of plants. The “Uruguayan” germplasm presents distinctive characteristics such as lower 100-seed weight, thinner pericarp and fruit weight, higher pulp yield percentage, and total soluble solids (Table 2). The average values generally coincide with descriptions for the “Uruguay” type [32,45,66]; however, the ranges of variation in this study are greater than previously reported for these variables. Furthermore, all 202 individuals exhibited dense ash-white pilosity on the underside of the leaf, confirming that this trait is an excellent descriptor for identifying the “Uruguay” type.
Regarding the weight of 100 seeds (0.082–0.327 g), populations QC and CA have, on average, a higher seed weight, while populations VE and CL do not differ from each other for this variable (Supplementary Table S3). The pericarp thickness, with an average of 2.6 mm (1.1–6.7 mm), also confirms the Uruguayan type [38,65,67], although some “off-type” individuals occur more frequently in populations QC and CA. The fruit weight variable with an average of 9.8 g agrees with the description of the “Uruguay” type. However, the wide range of fruit weights found (1.9–51.8 g) also indicates the potential of these plants to achieve high fruit weights under wild conditions and without any care. Population QC explains the observed wide range and has the highest value (51.8 g), contrasting with similarly low and narrow values present in VE, CL, and CA (Table 2). For the variable total soluble solids with a modal value of 12.6 °Brix, population VE stands out, showing significant differences from the other populations. Regarding the pulp yield percentage with an average of 35.6%, Uruguayan populations present a somewhat higher value than the “Brazil” type [38]. Smaller fruit size and thinner pericarp are highlighted by [38] as the most relevant characteristics for grouping Uruguayan populations.
For other variables, there are no previous records of possible differences between the “Brazil” and “Uruguay” types. However, the range found in this study for stigma–stamen distance (−5.2 and 7.8 mm) is novel for the species, as previously reported values in the “Brazil” type were from 0 to 14 mm [68,69] and from 4 to 9 mm in Uruguayan materials. The discovery of two plants whose flowers have the stigma below the stamens would probably indicate the occurrence of autogamy, a characteristic that can be useful for both breeding and studies on the reproductive system and population structure of this species, which is predominantly allogamous with entomophilous–ornythophilous pollination [70] and with some level of post-zygotic genetic incompatibility [69,71]. Pistil length (LPIST) and floral aperture diameter (AFL) also showed singularities, as the average values are lower than those obtained with Brazilian germplasm [68].
The detailed characterization of a group of characteristics highlighted for their relevance to genetic improvement, such as those related to skin type, total soluble solids values, pulp yield percentage, and lower seed weight, indicates that plants of the “Uruguay” type are different and represent outstanding plant genetic resources within the species. Although the smaller fruit size of Uruguayan populations is considered a negative characteristic for conventional genetic improvement, this study found some plants with fruits around 50 g under wild conditions and without any care. Recently in Uruguay, the first three cultivars of A. sellowiana (INIA-Fagro Isleña, INIA-Fagro Cerrillana, and INIA-Fagro Artillera) were released, with an average fruit weight of 60 g [31], one of them derived from a cross and the other two directly from safeguarded or semi-domesticated plants of local germplasm. Cultivars obtained by EPAGRI–UFSC in Brazil have fruit weight averages between 80 (Alcantara), 90 (Nonante), and 150 g (Mattos and Helena) [65], while the collection presents a range of variation between 30.5 and 183.7 g [65]. In Colombia, the fruit weight of the Quimba cultivar varies between 21.1 and 98.9 g [72,73]. An average fruit weight of 73 ± 16.7 g for American and New Zealand cultivars was obtained by [10], which are believed to have originated from the same ancestors and probably from “Uruguay” type plants [16,23,24]. The results obtained in this study justify continuing the exploration of new populations, expanding the representation of these materials in active banks of A. sellowiana in Uruguay for their characterization, evaluation, and selection of materials.

4.2. Population Structure and Geographic Distribution

The analyses conducted, both with morphological and molecular data, indicate a high degree of population differentiation according to their geographic origin. The discriminant analysis with morphological characteristics showed that the degree of affiliation of the individuals to the populations of origin is very high, and in agreement, the molecular diversity analyses demonstrated that the four populations form four highly differentiated genetic groups composed solely of individuals belonging to the same population. Likewise, the results of AMOVA (Table 4) also indicated a high degree of genetic differentiation among populations (FST = 0.3419; p < 0.001), with the component associated with genetic variance within populations being higher (65.25% of the total variance) than between populations (34.75% of the total variation). The relationship between variances between and within populations is consistent with the allogamous reproductive system of feijoa and previous studies [33,45].
However, the analyses of HMFA dimensions and cluster analysis based on phenotypic data (Figure 2 and Figure 3) revealed a population structure mostly explained by the membership of populations to each of the floristic nuclei of the Eastern Flora of woody species of Uruguay. Populations VE and CL, from the northern floristic nucleus, differ only in five of the fourteen quantitative variables and generally exhibit a higher degree of membership to the “Uruguay” type due to their smaller seeds, thin skin, and lighter fruit. They have lower diversity than populations QC and CA belonging to the southern floristic nucleus, which would mainly be attributed to the greater phenotypic diversity of population QC and its higher number of significant differences with the other populations.
The southern floristic nucleus of the Eastern Flora is located in the “Eastern Sierras” eco-region [43], which continues with the southeastern hills of Brazil on soils originating from the Crystalline Basement. Meanwhile, the region where the northern floristic nucleus is located is a continuation of the Depressão Central Gaúcha of Brazil, and its contact limit with basalts, where soils of basaltic origin coexist with sandstones from the sedimentary basin. Thus, the natural distribution of A. sellowiana in Uruguay occurs on soils of different origins, not exclusively on soils originated from the crystalline basement, as previously published [2].
Both nuclei, south and north, correspond to biological corridors through which the Paranaense flora is distributed and coincide in phytogeographical terms with the designation of a “Riograndense Formation” [74] and with the denomination “Campos del Norte” for this region [75,76].
The phenotypic differences between nuclei of A. sellowiana populations could be associated with founder effects. Biological corridors connecting the Paranaense flora of Brazil and Uruguay would have allowed the entry of the species independently into the territories of floristic nuclei [18]. The current diversity could be the result of species dispersion, strong founder events and/or bottlenecks, landscape fragmentation with loss of connectivity between populations, natural selection processes, and the possible occurrence of unconscious anthropic effects or incipient selection processes during the last 10,000 years bp, the estimated date of human arrival in this region.
Although molecular analyses clearly support the identity of each population, principal components (Figure 5) and paired Fst and M values (Table 5) would indicate a greater similarity between populations belonging to different floristic nuclei. Populations QC and CL, despite being separated by 220 km, exhibit genetic closeness (Fst = 0.240). These results would suggest the current or ancestral existence of gene flow between QC and CL, in agreement with the significant number of migrants per generation estimated. Furthermore, populations VE and CL, separated by 50 km, show paired Fst values comparable to VE–CA, despite the latter being 222 km apart. The results indicate that VE exhibits greater divergence from the other populations, suggesting restrictions on gene flow between VE and the rest of the populations, although it is also indicated by morphological descriptors and molecular markers as the least diverse population.
Although the differentiation of wild populations between floristic nuclei described in this study is not equally supported by morphological and molecular variables, it is important to note that this study aimed to conduct an initial survey of wild populations of A. sellowiana. It is possible that a survey in broader areas, incorporating new populations, and the use of nuclear and chloroplastic markers based on sequences may help clarify this result. Moreover, the inconsistency between structure analyses using molecular and morphological markers has been previously cited [77,78].
To further investigate the evolutionary processes of the species in the southernmost area of its natural distribution, it is considered relevant to deepen the prospection and phenotypic and molecular characterization of A. sellowiana populations both from Uruguay and southern Rio Grande do Sul (Brazil).

4.3. Conservation and Utilization

Developing a strategy for the conservation of a species requires understanding the eco-geographical distribution of genetic diversity and the processes operating in its evolutionary potential. In this sense, despite some degree of phenotypic similarity observed among populations of the same floristic nucleus, the results consistently pointed to the identity of each of the four studied populations. The strong genetic structure evidenced by molecular data results from marked differences in allele frequencies among populations (FST = 0.376), low to moderate levels of gene flow, and the presence of exclusive alleles, but without revealing a clear geographical pattern. Thus, each population would require specific management measures for its conservation, although it is necessary to continue with the prospection and characterization of new populations.
The four populations are located in landscapes recognized for their environmental and cultural values, so it would be advisable to design specific measures for the conservation of A. sellowiana, beyond the Uruguayan legal prohibition to cut or damage specimens of the species as members of the native forest. Population QC is located in the “Quebrada de los Cuervos and Sierras del Yerbal” Protected Landscape [79], population CA in the adjacent area of the “Paso Centurión and Sierra de Ríos” Protected Landscape [80], population CL in the area of influence of the “Bioma Pampa—Quebradas del Norte” Biosphere Reserve [81], and population VE in a territory recognized for its historical and cultural heritage [82].
The farming families, who basically carry out livestock activities in the areas surveyed in this study, protect and value A. sellowiana through ecotourism activities, product development (liqueurs, sweets, feijoa in syrup, gummies, and filled chocolates, among others), and its use in gastronomy. However, for the wild populations of feijoa in the country to be effectively conserved in situ in the long term, it is necessary to develop and implement adequate management plans for this purpose, which consider the integrity of ecosystems, including the protection of pollinators and seed dispersers. It is also relevant to consider that the territories where the country’s feijoa populations are located are biocultural landscapes, so promoting and supporting activities in a context of conservation through sustainable use is a priority [83].
Ex situ conservation, as a complementary strategy to in situ conservation, is particularly relevant to facilitate the use of germplasm in genetic improvement. Propagation by cuttings as the main mechanism of vegetative propagation in tree species is somewhat limiting because the success of the technique depends on the genotype in the case of A. sellowiana due to differences in its capacity to form adventitious roots [84]. Although other vegetative propagation techniques are possible, they are less efficient, so it is a priority to continue adjusting the cutting technique to establish introduction gardens with the clones found in situ populations.
Seed conservation in the medium and long term still requires further in-depth studies to standardize the conditions that ensure their conservation. The species would have orthodox seeds [85,86], although it has also been noted that they exhibit intermediate behavior [87].
Regarding genetic improvement of feijoa, it is considered of interest to expand its gene pool by incorporating wild feijoa germplasm, which, as this study demonstrates, has desirable characteristics for both conventional breeding and participatory breeding, and the development of productive alternatives [4,88].
In addition, there is an increasing interest of food and pharmaceutical industries for flavonoid and gallic acid derivative compounds present in feijoa leaves, fruit, and buds [13]. Most data have been so far generated from a low number and mostly domesticated feijoa plants, where strong genetic diversity was found for chemical composition [9,10,89,90]. Preliminary studies on chemical composition for a limited number of wild feijoa of Uruguay has been reported [91,92]. Bioprospection for secondary metabolites based on well-designed ex situ, common garden trials as well as in situ sampling might be considered in order to account for interactions of edafo-climatic variability on chemical composition and quantification.

5. Conclusions

The results of the research revealed a high phenotypic and molecular diversity in the four wild populations of A. sellowiana in the southern region of the species’ natural range. The distinction of the “Uruguay type” of feijoa is corroborated on the basis of a high number of individuals.
Individuals cluster in a very high proportion according to their population of origin, both from phenotypic and molecular data. A certain degree of phenotypic resemblance is observed between populations of the same floristic core of the eastern flora.
The results of the work constitute valuable input for the development of a strategy for the conservation and sustainable use of these genetic resources.

Supplementary Materials

The following supporting information can be downloaded at: https://www.mdpi.com/article/10.3390/horticulturae10040360/s1, Figure S1: Environment where the four populations of Acca sellowiana are found. (a) Quebrada de los Cuervos, (b) Valle Edén, (c) Cuchilla de Laureles, (d) Cañitas; Table S1: Wild populations of Acca sellowiana, geographical origin, altitude, floristic core, eco-region, number of individuals analyzed for morphological characters (N), number of individuals analyzed with RAPD molecular markers (nRAPD); Table S2. RAPD primers, amplified DNA bands, and informativeness parameters of each primer; Table S3. Probability of mean comparison using Tukey-Kramer test between the four populations of Acca sellowiana for the 14 quantitative descriptors. QC (Quebrada de los Cuervos), VE (Valle Edén), CL (Cuchilla Laureles), CA (Cañitas). NS: non significant (p value > 0.05).

Author Contributions

Conceptualization, M.R. and C.P.; formal analysis, J.F., M.P., M.Q., M.R. and C.P.; funding acquisition C.P.; investigation, M.R., M.P., E.B. and M.Q.; supervision, M.R. and C.P.; validation, M.R. and C.P.; visualization M.Q. and M.P.; writing—original draft, M.R. and C.P.; writing—review and editing, M.R., M.P., E.B., M.Q., J.F. and C.P. All authors have read and agreed to the published version of the manuscript.

Funding

This study was supported by the Ministry of Education and Culture of Uruguay PDT-DINACYT project ‘Primer estudio sistemático de poblaciones silvestres de Acca sellowiana de Uruguay (PDT 32)’.

Data Availability Statement

The data presented in this study are available on request from the corresponding author. The data are not publicly available due to privacy.

Acknowledgments

The authors would like to thank the staff of SNAP in Quebrada de los Cuervos; to Andrés Berrutti for providing assistance in sampling procedures as well as useful information; to Néstor Rios for assistance in STRUCTURE analysis; to Dario Fros and family from Cuchilla de Laureles, as well as all other farmer families that enabled access to their properties.

Conflicts of Interest

The authors declare no conflicts of interest.

References

  1. Ducroquet, J.P.H.J.; Hickel, E.R.; Nodari, R.O. Goiabeira-Serrana (Feijoa sellowiana); FUNEP: Jaboticabal, Brazil, 2000. [Google Scholar]
  2. Thorp, G.; Bieleski, R. Feijoas: Origins, Cultivation and Uses; HortResearch: Auckland, New Zealand; David Bateman: Auckland, New Zealand, 2002. [Google Scholar]
  3. Keller, H.A.; Tressens, S.G. Presencia en Argentina de dos especies de uso múltiple: Acca sellowiana (Myrtaceae) y Casearia lasiophylla (Flacourtiaceae). Darwiniana 2007, 45, 204–212. [Google Scholar]
  4. Rivas, M.; Ayres, C.; Zoppolo, R.; Cabrera, D.; Dellacassa, E.; Bellenda, B.; García, M.; Silveira, A.C.; Vignale, B.; Záccari, F.; et al. Valorización de los recursos genéticos del guayabo del país. Rev. INIA 2010, 23, 38–41. [Google Scholar]
  5. Rampoldi, C.; Ruíz, M.F.; Burzaco, P.; Arcia, P.; Sosa, J.; Irisity, M.; Ayres, C.; Rivas, M. Productos de Frutos Nativos: Guayabo del País (Acca sellowiana); ANII: Montevideo, Uruguay, 2013; 24p. [Google Scholar]
  6. Santos, K.L.; Ciotta, M.N.; Almeida, E.B.C.; Pasa, M.S. Importancia social e económica. In A Cultura de Goiabeira Serrana; Ciotta, M.N., Arioli, C.J., Pinto, F.A.M.F., Santos, K.L., Araujo, L., Pasa, M.S., Eds.; Epagri: Florianópolis, Brazil, 2018; pp. 201–215. 216p. [Google Scholar]
  7. Ielpo, M.T.; Basile, A.; Miranda, R.; Moscatiello, V.; Nappo, C.; Sorbo, S.; Laghi, E.; Ricciardi, M.M.; Ricciardi, L.; Vuotto, M.L. Inmunopharmacological properties of flavonoids. Fitoterapia 2000, 71, 101–109. [Google Scholar] [CrossRef]
  8. Lim, T.K. Acca sellowiana . In Edible Medicinal and Non-Medicinal Plants; Fruits; Springer: Dordrecht, The Netherlands, 2012; Volume 3, pp. 601–608. [Google Scholar]
  9. Silveira, A.C.; Záccari, F.; Oyarzún, D.; Rivas, M. Determinación de algunos atributos de calidad en frutos de guayabo del país [Acca sellowiana (Berg) Burret] en diferentes estados de maduración. Agrociencia 2015, 19, 24–30. [Google Scholar] [CrossRef]
  10. Pasquariello, M.S.; Mastrobuoni, F.; Di Patre, D.; Zampella, L.; Capuano, R.L.; Scortichini, M.; Petriccione, M. Agronomic, nutraceutical and molecular variability of feijoa (Acca sellowiana (O. Berg) Burret) germplasm. Sci. Hortic. 2015, 191, 1–9. [Google Scholar] [CrossRef]
  11. Beyhan, O.; Elmastas, M.; Gedikli, F. Total phenolic compounds and antioxidant capacity of leaf, dry fruit and fresh fruit of feijoa (Acca sellowiana, Myrtaceae). J. Med. Plants Res. 2010, 4, 1065–1072. [Google Scholar]
  12. Weston, R.J. Bioactive products from fruit of the feijoa (Feijoa sellowiana, Myrtaceae): A review. Food Chem. 2010, 121, 923–926. [Google Scholar] [CrossRef]
  13. Zhu, F. Chemical and biological properties of feijoa (Acca sellowiana). Trends Food Sci. 2018, 81, 121–131. [Google Scholar] [CrossRef]
  14. Sazima, I.; Sazima, M. Petiscos florais: Pétalas de Acca sellowiana (Myrtaceae) como fonte alimentar para aves em área urbana no Sul do Brasil. Biota Neotrop. 2007, 7, 307–311. [Google Scholar] [CrossRef]
  15. Mattos, J.R. A Goiabeira Serrana; Instituto de Pesquisas de Recursos Naturais Renováveis: Porto Alegre, Brazil, 1986; 84p. [Google Scholar]
  16. Nodari, R.O.; Guerra, M.P.; Meler, K.; Ducroquet, J.P. Genetic variability of Feijoa sellowiana germplasm. Acta Hortic. 1997, 452, 41–46. [Google Scholar] [CrossRef]
  17. Peel, M.C.; Finlayson, B.L.; Mcmahon, T.A. Updated world map of the Koppen-Geiger climate classification. Hydrol. Earth Syst. Sci. Discuss. Eur. Geosci. Union 2007, 11, 1633–1644. [Google Scholar] [CrossRef]
  18. Grela, I. Geografía Florística de las Especies Arbóreas de Uruguay. Propuesta para la Delimitación de Dendrofloras. Master’s Thesis, PEDECIBA, Isidoro de María, Uruguay, 2004; 97p. [Google Scholar]
  19. Fischer, G.; Miranda, D.; Cayón, G.; Mazorra, M. Cultivo, Poscosecha y Exportación de la Feijoa (Acca sellowiana Berg.); Universidad Nacional de Colombia, Fondo Nacional de Fomento Hortifrutícola, Asociación Hortifrutícola de Colombia: Bogotá, Colombia, 2003. [Google Scholar]
  20. Moretto, S.P.; Nodari, E.S.; Nodari, R.O. A introdução e os usos da Feijoa ou Goiabeira Serrana (Acca sellowiana): A perspectiva da história ambiental. Front. J. Soc. Technol. Environ. Sci. 2014, 3, 67–69. [Google Scholar] [CrossRef]
  21. Santos, K.L.; Ciotta, M.N.; Donazzolo, J.; Borsuk, L.J.; Nodari, R.O. Domesticaçao da especie. In A Cultura de Goiabeira Serrana; Ciotta, M.N., Arioli, C.J., Pinto, F.A.M.F., Santos, K.L., Araujo, L., Pasa, M.S., Eds.; Epagri: Florianópolis, Brazil, 2018; 216p. [Google Scholar]
  22. Sharpe, R.H.; Sherman, W.B.; Miller, E.P. Feijoa history and improvement. Proc. Fla. State Hortic. Soc. 1993, 106, 134–139. [Google Scholar]
  23. Dettori, M.T.; Palombi, M.A. Identification of Feijoa sellowiana Berg. accessions by RAPD markers. Sci. Hortic. 2000, 86, 279–290. [Google Scholar] [CrossRef]
  24. Popenoe, F.W. Feijoa sellowiana: Its history, culture and varieties. Pomona Coll. J. Econ. Bot. 1912, II, 217–242. [Google Scholar]
  25. Miranda, D. Sistemas de propagación y establecimiento del cultivo de feijoa. In Cultivo, Poscosecha y Exportación de la Feijoa (Acca sellowiana Berg.); Fischer, G., Miranda, D., Cayón, G., Mazorra, M., Eds.; Universidad Nacional de Colombia, Fondo Nacional de Fomento Hortofrutícola, Asociación Hortofrutícola de Colombia: Bogotá, Colombia, 2003; pp. 27–48. [Google Scholar]
  26. Vignale, B.; Bisio, L. Selección de frutales nativos en Uruguay. Agrociencia 2005, 9, 35–39. [Google Scholar]
  27. Santos, K.L.; Peroni, N.; Guries, R.P.; Nodari, R.O. Traditional knowledge and management of Feijoa (Acca sellowiana) in southern Brazil. Econ. Bot. 2009, 63, 204–214. [Google Scholar] [CrossRef]
  28. Cabrera, D.; Vignale, B.; Pritsch, C. Acca sellowiana Berg. Burret; PROCISUR/IICA: Montevideo, Uruguay, 2018; Available online: https://www.procisur.org.uy/adjuntos/80ca732ba9b2_Guayabo-PROCISUR.pdf (accessed on 1 March 2024).
  29. Ducroquet, J.P.H.J.; Santos, K.L.; Andrade, E.R.; Boneti, J.I.S.; Bonin, V.; Nodari, R.O. As Primeiras Cultivares Brasileiras de Goiabeira serrana: SCS 411 Alcantara e SCS 412 Helena. Rev. Agropecu. Catarin. 2007, 20, 77–80. [Google Scholar]
  30. Ducroquet, J.P.H.J.; Nunes, E.C.; Guerra, M.P.; Nodari, R.O. Novas cultivares brasileiras de goiabeira serrana: SCS 414-Mattos, SCS 415 Nonante. Rev. Agropecu. Catarin. 2008, 21, 79–82. [Google Scholar]
  31. Cabrera, D.; Vignale, B.; Machado, G.; Rodríguez, P.; Zoppolo, R.; Nebel, J.P. Primeras selecciones registradas de guayabo del país en Uruguay. Rev. INIA 2008, 52, 29–32. [Google Scholar]
  32. Cunda, N. Caracterización de Plantas de Guayabo del País (Acca sellowiana (Berg.) Burret) Desde un Enfoque Frutícola. Bachelor’s Thesis, Tesis Ing. Agr., Universidad de la República, Montevideo, Uruguay, 2006; 98p. [Google Scholar]
  33. Puppo, M. Prospección y Caracterización de Poblaciones Silvestres de Acca sellowiana (Berg) Burret. (Guayabo del País). Bachelor’s Thesis, Universidad de la República, Montevideo, Uruguay, 2008; 127p. [Google Scholar]
  34. Quezada, M. Estudio de la Diversidad Genética de una Colección de Acca sellowiana (Berg.) Burret con alto Potencial Agronómico Mediante el uso de Marcadores Moleculares RAPD. Bachelor’s Thesis, Universidad de la República, Montevideo, Uruguay, 2008. [Google Scholar]
  35. Santos, K.L.; Ducroquet, J.P.H.J.; Nodari, R.O. Caracterização genética de populações naturais de goiabeira serrana (Acca sellowiana) com marcadores microssatélites heterólogos. Biotemas 2011, 24, 75–83. [Google Scholar] [CrossRef]
  36. Baccino, E. Estructura Genética de Cuatro Poblaciones Silvestres de Acca sellowiana (Berg.) Burret Situadas en el Noreste de Uruguay. Bachelor’s Thesis, Universidad de la República, Montevideo, Uruguay, 2011; 77p. [Google Scholar]
  37. Donazzolo, J. Conservação Pelo Uso e Domesticação da Feijoa na Serra Gaúcha. Ph.D. Thesis, Tese de Doutorado apresentada ao Programa de Pós-Graduação em Recursos Genéticos Vegetais, Universidade Federal de Santa Catarina, Florianópolis, Brazil, 2012; 312p. [Google Scholar]
  38. Borzuk, L.J.; Saifert, L.; Otalora, J.M.; Sánchez, F.D.; Nodari, R.O. Phenotypic variability in Feijoa fruits (Acca sellowiana (O. Berg.) Burret) on indigenous lands, quilombolas communities and protected areas in the south of Brazil. Rev. Bras. Frutic. 2017, 39, e-699. [Google Scholar] [CrossRef]
  39. Donazzolo, J.; Stefenon, V.M.; Guerra, M.P.; Nodari, R.O. On farm management of Acca sellowiana (Myrtaceae) as a strategy for conservation of species genetic diversity. Sci. Hortic. 2020, 259. [Google Scholar] [CrossRef]
  40. Saifert, L.; Sánchez-Mora, F.D.; Borzuk, L.J.; Donazzolo, J.; Freitas da Costa, N.C.; Nunes Ribeiro, H.; Nodari, R.O. Evaluation of the genetic diversity in the feijoa accessions maintained at Santa Catarina, Brazil. Crop Sci. 2020, 60, 345–356. [Google Scholar] [CrossRef]
  41. Legrand, D. Las Mirtáceas de Uruguay, III; Boletín Facultad de Agronomía: Montevideo, Uruguay, 1968; 80p. [Google Scholar]
  42. Evia, G.; Gudynas, E. Ecología del Paisaje del Uruguay; Junta de Andalucía, AECI: Sevilla, Spain, 2000; 173p. [Google Scholar]
  43. Brazeiro, A. Eco-Regiones de Uruguay: Biodiversidad, Presiones y Conservación; Aportes a la Estrategia Nacional de Biodiversidad, Facultad de Ciencias, CIEDUR, VS-Uruguay, SZU: Montevideo, Uruguay, 2015; 122p. [Google Scholar]
  44. Brown, A.H.D.; Marshall, D.R. A basica sampling strategy: Theory and practice. In Collecting Plant Genetic Diversity: Technical guidelines; Guarino, L., Ramanatha Rao, V., Reid, R., Eds.; Publisher CAB International: Wallingford, UK, 1995; pp. 75–91. [Google Scholar]
  45. Puppo, M.; Rivas, M.; Franco, J.; Barbieri, R.L. Propuesta de descriptores para Acca sellowiana (Berg.) Burret. Rev. Bras. De Frutic. 2014, 36, 957–970. [Google Scholar] [CrossRef]
  46. Ducroquet, J.P.H.J.; Ribeiro, P.A. Goiabeira serrana: Velha conocida, nova alternativa. Rev. Agropecu. Catarin. 1991, 4, 27–29. [Google Scholar]
  47. Kader, A. Feijoa, Recommendations of Maintaining Postharvest Quality; University of California: Davis, CA, USA, 2005; Available online: https://postharvest.ucdavis.edu/ (accessed on 20 December 2023).
  48. Doyle, J.J.; Doyle, J.L. Isolation of plant DNA from fresh tissue. Focus 1990, 12, 13–15. [Google Scholar]
  49. Buntjer, J.B. Cross Checker Fingerprint Analysis Software v2.9; Wageningen University and Research Centre: Wageningen, The Netherlands, 1999. [Google Scholar]
  50. R Core Team. R: A Language and Environment for Statistical Computing; R Foundation for Statistical Computing: Vienna, Austria, 2022; Available online: https://www.R-project.org/ (accessed on 7 March 2024).
  51. LeDien, S.; Pagés, J. Analyse factorielle multiple hiérarchique. Rev. Stat. Appl. 2003, 51, 41–73. [Google Scholar]
  52. Franco, J.; Crossa, J.; Desphande, S. Hierarchical multiple factor analysis for classifying genotypes and forming core subsets based on phenotypic and genetic data. Crop Sci. 2010, 50, 105–117. [Google Scholar] [CrossRef]
  53. Ward, J.H., Jr. Hierarchical grouping to optimize an objective function. J. Am. Stat. Assoc. 1963, 58, 236–244. [Google Scholar] [CrossRef]
  54. Jaccard, P. Contribution au problème de l’immigration post-glaciaire de la flore alpine. Bull. Soc. Vaudoise Sci. Nat. 1900, 37, 547–579. [Google Scholar]
  55. Oksanen, J.; Simpson, G.; Blanchet, F.; Kindt, R.; Legendre, P.; Minchin, P.; O’Hara, R.; Solymos, P.; Stevens, M.; Szoecs, E.; et al. Vegan: Community Ecology Package. R Package Version 2.6-4. 2022. Available online: https://CRAN.R-project.org/package=vegan (accessed on 15 October 2023).
  56. Paradis, E.; Schliep, K. Ape 5.0: An environment for modern phylogenetics and evolutionary analyses in R. Bioinformatics 2019, 35, 526–528. [Google Scholar] [CrossRef]
  57. Jombart, T. Adegenet: A R package for the multivariate analysis of genetic markers. Bioinformatics 2008, 24, 1403–1405. [Google Scholar] [CrossRef]
  58. Excoffier, L.; Smouse, P.E.; Quattro, J.M. Analysis of molecular variance inferrednfrom metric distances among DNA haplotypes: Application to human mitochondrialDNA restriction data. Genetics 1992, 131, 479–491. [Google Scholar] [CrossRef]
  59. Goudet, J.; Jombart, T. Hierfstat: Estimation and Tests of Hierarchical F-Statistics. R Package Version 0.5-11. 2022. Available online: https://CRAN.R-project.org/package=hierfstat (accessed on 15 October 2023).
  60. Pritchard, J.K.; Stephens, M.; Donnelly, P. Inference of population structure using multilocus genotype data. Genetics 2000, 155, 945–959. [Google Scholar] [CrossRef]
  61. Kopelman, N.M.; Mayzel, J.; Jakobsson, M.; Rosenberg, N.A. CLUMPAK: A program for identifying clustering modes and packaging population structure inferences across K. Mol. Ecol. Res. 2015, 15, 1179–1191. [Google Scholar] [CrossRef]
  62. Evanno, G.; Regnaut, S.; Goudet, J. Detecting the number of clusters of individuals using the software STRUCTURE: A simulation study. Mol. Ecol. 2005, 14, 2611–2620. [Google Scholar] [CrossRef] [PubMed]
  63. Earl, D.A.; Vonholdt, B.M. Structure Harvester: A website and program for visualizing STRUCTURE output and implementing the Evanno method. Conserv. Genet. Resour. 2012, 4, 359–361. [Google Scholar] [CrossRef]
  64. Slatkin, M. Isolation by distance in equilibrium and non-equilibrium populations. Evolution 1993, 47, 264–279. [Google Scholar] [CrossRef] [PubMed]
  65. Sánchez-Mora, F.D.; Saifert, L.; Borsuk, L.J.; Otalora Villamil, J.M.; Nodari, R.O. Avaliação de frutos de goiabeira-serrana cultivados no meio oeste de Santa Catarina, Brasil. Biotemas 2020, 33, 1–9. [Google Scholar] [CrossRef]
  66. Thorp, T.G. DSIR’s feijoa breeding programme goes to South America. Orchard. N. Z. 1988, 61, 213–215. [Google Scholar]
  67. Amarante, C.V.T.; Steffens, C.A.; Ducroquet, J.P.H.J.; Sasso, A. Fruit quality of feijoas in response to storage temperature and treatment with 1-methylcyclopropene. Pesqui. Agropecu. Bras. 2008; 43, 1683–1689. [Google Scholar]
  68. Degenhardt, J.; Orth, A.I.; Guerra, M.P.; Ducroquet, J.P.; Nodari, R.O. Morfología floral da Goiabeira serrana (Feijoa sellowiana) e suas implicações na polinização. Rev. Bras. Frutic. 2001, 23, 718–721. [Google Scholar] [CrossRef]
  69. Mara, V. Aportes al Conocimiento de la Biología Floral y Reproductiva y Caracterización de Guayabo del País (Acca sellowiana (Berg) Burret). Bachelor’s Thesis, Universidad de la República, Montevideo, Uruguay, 2012; 64p. [Google Scholar]
  70. Ducroquet, J.P.H.J.; Hickel, E.R. Birds as pollinators of Feijoa (Acca sellowiana Berg). Acta Hortic. 1997, 452, 37–40. [Google Scholar] [CrossRef]
  71. Finatto, T.; Santos, K.L.; Steiner, N.; Bizzocchi, L.; Holderbaum, D.; Ducroquet, J.P.H.J.; Guerra, M.; Nodari, R.O. Late-acting self-incompatibility in Acca sellowiana (Myrtaceae). Aust. J. Bot. 2011, 59, 53–60. [Google Scholar] [CrossRef]
  72. Martínez-Vega, R.R.; Fischer, G.; Herrera, A.; Chaves-Córdoba, B.; Quintero, O.C. Características físico-químicas de frutos de feijoa influenciadas por la posición en el canopi. Rev. Col. Cienc. Hortic. 2008, 2, 21–32. [Google Scholar] [CrossRef]
  73. Parra-Coronado, A.; Fischer, G.; Chaves-Córdoba, B. Tiempo térmico para estados fenológicos reproductivos de la feijoa (Acca sellowiana (O. Berg) Burret). Acta Biol. Colomb. 2015, 20, 163–173. [Google Scholar] [CrossRef]
  74. Chebataroff, J. La Vegetación del Uruguay y sus Relaciones Fitogeográficas con la del resto de la América del sur. Rev. Geogr. 1942, 2, 49–90. [Google Scholar]
  75. Soriano, A. “Río de la Plata grasslands,” in Natural Grasslands; Coupland, R.T., Ed.; Elsevier: Amsterdam, The Netherlands, 1991; pp. 367–407. [Google Scholar]
  76. Bilenca, D.; Miñarro, F. Identificación de Áreas Valiosas de Pastizal (AVPs) en las Pampas y Campos de Argentina, Uruguay y sur de Brasil; Fundación Vida Silvestre Argentina: Buenos Aires, Argentina, 2004; 323p. [Google Scholar]
  77. Cabrera-Toledo, D.; Mendoza-Galindo, E.; Larranaga, N.; Herrera-Estrella, A.; Vásquez-Cruz, M.; Hernández-Hernández, T. Genomic and Morphological Differentiation of Spirit Producing Agave angustifolia Traditional Landraces Cultivated in Jalisco, Mexico. Plants 2022, 11, 2274. [Google Scholar] [CrossRef]
  78. Ruiz-Chután, J.A.; Kalousová, M.; Maňourová, A.; Degu, H.D.; Berdúo-Sandoval, J.E.; Villanueva-González, C.E.; Lojka, B. Core Collection Formation in Guatemalan Wild Avocado Germplasm with Phenotypic and SSR Data. Agronomy 2023, 13, 2385. [Google Scholar] [CrossRef]
  79. Ministerio de Ambiente. Available online: https://www.gub.uy/ministerio-ambiente/politicas-y-gestion/paisaje-protegido-quebrada-cuervos-sierras-del-yerbal-treinta-tres (accessed on 7 March 2024).
  80. Ministerio de Ambiente. Available online: https://www.gub.uy/ministerio-ambiente/politicas-y-gestion/paisaje-protegido-paso-centurion-sierra-rios-cerro-largo (accessed on 7 March 2024).
  81. Unesco. Available online: https://www.unesco.org/en (accessed on 7 March 2024).
  82. Proyecto REDD+ Uruguay. Informe Población Indígena en Uruguay y su Vínculo con el Bosque; Rodríguez, P., Baccino, E., Carro, I., Justo, C., Martino, D., Miguel, C., y Olivera, J., Eds.; Ministerio de Ganadería, Agricultura y Pesca-Ministerio de Vivienda, Ordenamiento Territorial y Medio Ambiente: Montevideo, Uruguay, 2019. [Google Scholar]
  83. Puppo, M.; Gianotti, C.; Calvete, A.; Leal, A.; Rivas, M. Landscape, agrobiodiversity, and local knowledge in the protected area “Quebrada de los Cuervos y Sierras del Yerbal,” Uruguay. Front. Sustain. Food Syst. 2023, 7, 1240991. [Google Scholar] [CrossRef]
  84. Ross, S.; Speroni, G.; Souza-Pérez, M.; Ávila, N.; Pietro, F.; González, A.M.; Speranza, P. Stem-cutting anatomy and biochemical responses associated with competence for adventitious root differentiation in Acca sellowiana (Myrtaceae). Trees 2021, 35, 1221–1232. [Google Scholar] [CrossRef]
  85. Donazzolo, J.; Sanches, T.O.; Bizzocchi, L.; Vilperte, V.; Nodari, R.O. O Armazenamento refrigerado prolonga a viabilidade de sementes de Goiabeira-serrana. Rev. Bras. Frutic. 2015, 37, 748–754. [Google Scholar] [CrossRef]
  86. Voss, L.C.; Filippi, M.; Sohne, A.E.; Danner, M.A.; Giesel, A.; Donazzolo, J. Classification and quality of Acca sellowiana (O. Berg) Burret seeds as to tolerance to desiccation. Res. Soc. Dev 2020, 9. [Google Scholar] [CrossRef]
  87. Gomes, J.P.; Oliveira, L.M.; Saldanha, A.P.; Manfredi, S.; Ferreira, P.I. Secagem e Classificação de Sementes de Acca sellowiana (O. Berg) Burret—Myrtaceae quanto à Tolerância à Dessecação e ao Armazenamento. Floresta Ambiente 2013, 20, 207–215. [Google Scholar] [CrossRef]
  88. Calvete, A. Contribución al Mejoramiento Genético Participativo de Guayabo del País (Acca sellowiana (Berg. Burret)) en el Paisaje Protegido Quebrada de los Cuervos. Bachelor’s Thesis, Universidad de la República, Montevideo, Uruguay, 2013; 86p. [Google Scholar]
  89. Phan, A.D.T.; Chaliha, M.; Sultanbawa, Y.; Netzel, M.E. Nutritional Characteristics and Antimicrobial Activity of Australian Grown Feijoa (Acca sellowiana). Foods 2019, 8, 376. [Google Scholar] [CrossRef] [PubMed]
  90. do Amarante, C.V.T.; de Souza, A.G.; Beninca, T.D.T.; Steffens, C.A. Phenolic content and antioxidant activity of the fruit in Brazilian genotypes of feijoa. Pesqui. Agropecu. Bras. 2017, 52, 1223–1230. [Google Scholar] [CrossRef]
  91. Silveira, A.C.; Oyarzún, D.; Rivas, M.; Záccari, F. Evaluación de la calidad poscosecha en frutos de guayabo del país [Acca sellowiana (Berg) Burret]. Agrocienc. Urug. 2016, 20, 14–21. [Google Scholar] [CrossRef]
  92. Silveira, A.C.; Záccari, F. An analysis of the postharvest behavior of four genetic materials of feijoa (Acca sellowiana Berg). Rev. Bras. Frutic. 2023, 45, e-974. [Google Scholar] [CrossRef]
Figure 1. Geographical distribution of the four populations of Acca sellowiana, Eastern Flora, and Floristic Cores South and North.
Horticulturae 10 00360 g001
Figure 2. Distribution of individuals from the four populations of Acca sellowiana according to the first two HMFA dimensions.
Horticulturae 10 00360 g002
Figure 3. Cluster analysis of 77 individuals belonging to the four populations of Acca sellowiana, based on morphological data.
Horticulturae 10 00360 g003
Figure 4. Genetic similarity pattern obtained for four wild populations of Acca sellowiana considering 204 RAPD amplification products. The dendrogram was obtained using the NJ clustering criterion based on the Jaccard similarity index. On the right, the designation of each individual with its population of origin is indicated.
Horticulturae 10 00360 g004
Figure 5. Principal Component Analysis for four wild populations of Acca sellowiana based on molecular data.
Horticulturae 10 00360 g005
Figure 6. Population structure of 144 individuals of Acca sellowiana using 127 RAPD markers inferred by STRUCTURE for K = 4. Each individual is represented by a vertical bar. In each case, the length of the orange, gray, yellow, and blue segments represents the percentage of membership (Q) to each group K. Genotypes are sorted according to their population of origin.
Horticulturae 10 00360 g006
Table 1. Morphological descriptors used according to Puppo et al. [45].
Morphological DescriptorCodeUnit/Scale
LeafLeaf shapeFORHnominal scale (3 states)
Apex shapeFORAPHnominal scale (4 states)
LengthLHmm
WidthAHmm
Length/Width ratio LH/AHRatio
FlowerStamens distributionDESTnominal scale (2 states)
Distance stigma-stamensDISTEEmm
Flower (stamens) openingAFLmm
Pistil lengthLPISTmm
FruitFruit shapeFFRUTnominal scale (4 states)
Shell hardnessRCASnominal scale (6 states)
Position of sepalsSEPnominal scale (3 states)
RugosityRUGnominal scale (4 states)
Pulp colorCOLPnominal scale (4 states)
Internal color of shellCOLINTnominal scale (4 states)
HeightAFmm
DiameterDFmm
WeightPFg
Pulp yieldRP%
Pericarp thicknessECASmm
Total soluble solidsSST°Brix
100 seed weightP100g
Number of seedsNSEMNumber
Table 2. Mean, minimum, and maximum (in parentheses) for 14 quantitative descriptors of four populations of A. sellowiana. QC (Quebrada de los Cuervos), VE (Valle Edén), CL (Cuchilla Laureles), CA (Cañitas), General Mean (all populations).
QCVECLCAGeneral *
AF (mm)33.9 22.9 27.7 24.6 27.2
(24.6–52.8)(16.3–29.8)(20.3–42)(18.0–33.6)(16.3–52.8)
DF (mm)29.8 18.9 23.3 21.3 23.2
(21.2–41.9)(12.4–26.3)(17.4–33.9)(15.1–29.7)(12.4–41.9)
PF (g)18.1 5.2 8.8 7.2 9.8
(7.9–51.8)(1.9–10.7)(3.7–25.4)(2.4–16.7)(1.9–51.8)
RP (%)36.3 35.6 39.030.7 35.3
(23.6–68.5)(11.7–68.8)(30.8–59.7)(24.1–44.0)(11.7–68.8)
ECAS (mm)3.2 2.0 2.3 2.9 3
(1.3–6.7)(1.1–2.7)(1.2–4.0)(1.3–5.1)(1.1–6.7)
SST (°Brix)14.3 18.2 14.7 13.1 15.1
(11.8–16.9)(11.2–23.6)(11.0–19.0)(10.6–15.5)(10.6–23.6)
NSEM (number)41.0 55.1 61.4 29.8 46.4
(17.0–72.0)(20.0–98.0)(39.0–114.0)(15.0–52.0)(14.9–113.7)
P100 (g)0.22 0.14 0.15 0.19 0.18
(0.16–0.33)(0.08–0.19)(0.10–0.26)(0.10–0.31)(0.08–0.33)
LH (mm)42.3 50.4 49.3 39.7 45.6
(33.8–56.5)(40.5–69.5)(35.5–62.1)(30.6–47.2)(30.6–69.5)
AH (mm)25.4 29.228.0 24.6 26.9
(21.2–31.1)(23.1–39.1)(21.2–33.7)(19.5–27.9)(19.5–39.1)
LH/AH
(ratio)
1.70 1.70 1.80 1.601.70
(1.47–1.95)(1.53–2.08)(1.57–2.02)(1.45–1.79)(1.45–2.08)
DISTEE (mm)3.4 4.4 3.8 3.2 3.7
(0.5–7.3)(1.3–7.8)(0.5–7.6)(−5.2–6.5)(−5.2–7.8)
AFL (mm)3.1 2.4 2.1 1.5 2.3
(2.3–3.9)(1.6–3.7)(1.6–2.8)(1.1–1.8)(1.1–3.9)
LPIST (mm)2.6 2.3 2.3 2.1 2.3
(2.3–3.5)(2.2–2.4)(2.1–2.5)(1.8–2.3)(1.8–3.5)
* Significance differences between populations (probabilities ranged from 0.0055 to 0.0001).
Table 3. Distribution of the percentages of individuals according to the states of the nine qualitative descriptors of the four populations of Acca sellowiana. QC (Quebrada de los Cuervos), VE (Valle Edén), CL (Cuchilla Laureles), CA (Cañitas). Chi2: significance of the comparison of frequency distribution between populations.
Classes/StatesQuebrada de los Cuervos (%)Valle Edén (%)Cuchilla de Laureles (%)Cañitas (%)Total Population (%)Chi Square
FFRUTround39.126.911.135290.0192
oval56.546.272.26559
oblong4.426.916.7013
SEPopen39.151.983.368.4590.0051
semi-open34.840.711.15.325
erect26.17.45.626.316
RUGsmooth20.818.522.225210.0795
somewhat rough5070.477.87066
rough29.211.10512
COLP 1greenish white 30411.103<0.0001
cream white 337.59255.68067
amber white 258.3011.11021
naples yellow 44.2422.2109
COLINT 1amber white 45822222132<0.0001
naples yellow 1900217
naples yellow 43356785855
honey yellow 4022007
RCASsoft9191116140.0491
medium-soft97606
medium3441834248
medium-hard1370118
hard262203121
very hard94003
FORHoval2026.130.0264
obovate95.990.48893.992
elliptic29.610011
FORAPHrounded46.973.16861.2630.0381
acute00201
obtuse44.926.93036.735
emarginated8.20023
DESTradial7.486.188.647.165<0.0001
random92.613.911.452.935
1 Société française des chrysanthemistes (1905).
Table 4. Analysis of Molecular Variance (AMOVA) calculated for 144 individuals belonging to four wild populations of Acca sellowiana.
Source of VariationdfSum of SquaresVariance ComponentsPercentage of Variation
Between populations3 (P−1)808.25387.14332934.75%
Within populations140 (nP)1878.182013.41558565.25%
Total143 (n−1)2686.435820.558914
Table 5. Estimation of differentiation between pairs of populations of Acca sellowiana. Individual classification was based on their geographical origin. All values were significant. For each population, the specific Fst value is indicated. Paired Fst values are shown below the diagonal, and gene flow (M) values are shown above.
VECACLQC
VE 0.6640.7630.760
CA0.430 1.3351.016
CL0.3960.272 1.583
QC0.3970.3300.240
Specific Fst0.5980.3710.2130.185
Disclaimer/Publisher’s Note: The statements, opinions and data contained in all publications are solely those of the individual author(s) and contributor(s) and not of MDPI and/or the editor(s). MDPI and/or the editor(s) disclaim responsibility for any injury to people or property resulting from any ideas, methods, instructions or products referred to in the content.

