Article

Transcriptome Analyses Reveal Distinct Defense Strategies in Chili Plants under Soilborne Disease Intervention

1
Department of Biology and Engineering of Environment, Guiyang University, Guiyang 550005, China
2
Vegetable Research Institute, Guangdong Academy of Agricultural Sciences, Guangzhou 510640, China
3
Guangdong Key Laboratory for New Technology Research of Vegetables, Guangzhou 510640, China
4
Key Laboratory of Green Prevention and Control of Tropical Plant Disease and Pests, Ministry of Education and College of Plant Protection, Hainan University, Haikou 570228, China
*
Authors to whom correspondence should be addressed.
Horticulturae 2023, 9(12), 1267; https://doi.org/10.3390/horticulturae9121267
Submission received: 9 October 2023 / Revised: 18 November 2023 / Accepted: 19 November 2023 / Published: 25 November 2023

Abstract

:
Chili (Capsicum annuum L.) is highly susceptible to soilborne diseases, thereby presenting a significant threat that results in considerable yield losses in chili production. The exploration of genes conferring resistance and the underlying defense mechanisms presents a promising strategy for bolstering plant disease control. In this study, we selected two distinct cultivars, the disease-sensitive ‘Hailan 99’ and the disease-tolerant ‘Sanxiaqing’, to elucidate the molecular basis of their responses to soilborne disease intervention. We conducted a comprehensive analysis of root morphological characteristics and transcriptome profiles under stress conditions. Our findings revealed that, when subjected to soilborne disease intervention, these two cultivars exhibited contrasting root system characteristics and responses, reflecting diverse defense strategies. The disease-resistant cultivar demonstrated superior adaptability, possibly owing to its capacity for swift recognition of pathogen effectors, activation of defense responses, and effective containment of infection at localized sites, thus impeding disease progression. Noteworthy genes such as T459_04053, implicated in effector recognition; MSTRG.26158, MSTRG.30886, and T459_22510, associated with secondary metabolite biosynthesis; and T459_05615, partaking in the autophagy pathway, along with other differentially expressed genes linked to effector recognition, immune activation, and modulation of cell death processes, offer valuable insights into enhancing soilborne disease resistance in chili. Furthermore, these findings contribute to an enhanced understanding of the molecular mechanisms underlying soilborne disease resistance in diverse plant crops.

1. Introduction

Chili (Capsicum annuum L.) is a pivotal vegetable of global significance with noteworthy nutritional and medicinal attributes [1,2]. Its substantial economic value underscores the need for an enhanced crop production strategy [3]. However, chili plants remain susceptible to a multitude of pathogens, including viruses, bacteria, fungi, and nematodes [4,5]. In the absence of sufficiently resistant varieties, soilborne diseases pose a substantial threat, causing considerable yield reductions in chili production by perturbing the plant’s customary metabolic pathways [6,7]. In addition, secondary metabolites were observed to be either partially or entirely relinquished in many domesticated crops [8], which makes disease resistance more challenging.
Chemical interventions remain the prevalent and favored approach for control because managing soilborne diseases is still particularly difficult, with a wide array of susceptible hosts and persistence in the soil [5]. Therefore, it is imperative to explore genetic resources and develop novel resistant varieties and other ecologically sound control strategies.
Manipulating resistance genes to engineer disease-resistant crops with enhanced yields has emerged as a prevalent strategy [9,10,11]. Several scientists have attempted to identify reservoirs of resistance for global seed banks with the intent of facilitating breeding programs that emphasize traits linked to resistance mechanisms against diverse biotic stressors [5,12]. Furthermore, researchers have explored candidate genes responsible for imparting resistance against a spectrum of pathogens and have delved into the mechanisms governing plant defense.
Several genes associated with resistance to various diseases have been identified in chili pepper [13]. According to a report, the PCPME6 gene, encoding pectin methylesterase, has been associated with the pathogenesis of P. capsici in pepper plants [14]. Studies have revealed that the functional loss of two genes, CaMlo1 and CaMlo2, results in diminished disease susceptibility, implicating these genes in conferring resistance to powdery mildew in pepper [15]. CAPOA1 has been linked to oxidative stress tolerance in plants and resistance to oomycete pathogens [16,17]. Two genes, CaMsrB2 and CaRGA2, have emerged as pivotal components in the activation of plant defense responses. Studies have indicated that silencing CaMsrB2 stimulates the generation of reactive oxygen species (ROS), thereby mediating cellular demise [18,19]. This implies that the regulation of pathogen defense and oxidative stress is orchestrated by the accumulation or depletion of ROS. Reports also indicate that genes encoding pathogen-related proteins have pivotal significance in plants and the pathogen-related protein genes can be triggered by both biotic and abiotic stressors, including signaling molecules such as ethylene, jasmonic acids, salicylic acids, and nonpathogenic bacteria [20].
In chili peppers, the activation of hypersensitive response genes to counteract pathogens can be initiated by different environmental factors and diverse pathways, which leads to the synthesis of various proteins and secondary metabolites that bolster the immune system of plants [21,22]. These secondary metabolites, including tropane, nicotinoid, pyridine, and terpenoid alkaloids, are effective in reducing fungal or bacterial infections in seeds, fruits, and foliage. Moreover, they possess the capacity to exhibit toxicity or repellency towards insects and vertebrate herbivores, thus contributing to disease and pest mitigation in plants [23].
Additionally, various sets of valuable genes found in chili peppers can be successfully transferred to other plant species while maintaining their functionality [5]. A previous study showed that overexpression of the pepper gene CaSAR82A in transgenic Arabidopsis plants could expedite plant growth and heighten tolerance to both biotic and abiotic stressors [24]. The incorporation of CABPR1 and CAPOA1 into transgenic tomato plants results in enhanced resistance against P. capsica [17]. Pepper esterase (PepEST) gene has been identified as the agent responsible for inhibiting fungal hyphal development. The transfer of PepEST into bentgrass resulted in resistance against pathogens such as P. capsici and Rhizoctonia solani [25,26]. Therefore, Capsicum genus can serve as valuable models for understanding the mechanisms in plant chemical defenses [27,28], which has great significance for both chili plants and other plant crops. However, our current understanding of the precise mechanisms through which specific plant chemical defenses in various Solanaceous crops remains incomplete [8]. Additionally, the impact of specific secondary metabolites on reproductive processes, overall plant viability, and intricate interactions within plant defense mechanisms is still in its infancy. Furthermore, though root systems exhibit a high degree of plasticity [29,30], shaped by both developmental and environmental factors [31], which play a pivotal role in plant growth and survival [32,33], the modulation of root system architecture and its responses to soilborne diseases in chili peppers have remained unclear.
Therefore, in this study, to further elucidate the molecular mechanism of disease response in chili plants, we selected both disease-sensitive and disease-tolerant cultivars for root traits and transcriptome analysis. More attention is paid on the analysis of activation of hypersensitive response genes and secondary metabolites based on the RNA-seq data. The results will enhance our understanding of the molecular mechanisms underlying soilborne disease resistance. The valuable genetic information for augmenting resistance against soilborne diseases, as identified in this study, will not only benefit chili plants but also hold relevance for other plant crops.

2. Materials and Methods

2.1. Soil Extract Solution Preparation

According to the report from Xiuwen County Agriculture and Rural Affairs Bureau (www.xiuwen.gov.cn (accessed on 19 September 2020)), a chili field situated in Xiuwen, Guizhou, China, at 26.85° N and 106.72° E, at an elevation of 1400 m above sea level has a history of severe soilborne diseases. We also found that the chili plants suffered severe soilborne diseases in this field, performing downward drooping and disease spot of leaves, dumping off, wilting, as well as root and stem rot in this field, which indicated that the complex symptoms in this field were not caused by just one pathogen. Therefore, we prepared a soil extract solution from the infected field in order to simulate soilborne disease intervention in the actual situations.
To simulate the soilborne disease intervention, the soil samples were collected from the topmost 20 cm layer of soil, excluding the uppermost 0.5 cm layer in this infected field, and a 20% (w/w) soil extract solution was prepared, which was based on a modified extraction technique. This method exclusively involved water and gentle stirring for 3 days at room temperature [34].

2.2. Plant Materials

In our previous experiments, after being treated with the infected soil extract solution, the distribution of soil microbe in rhizosphere soil showed that the range of pathogens afflicting chili pepper was broad and included fungi (e.g., Fusarium and Verticillium dahliae) and bacteria (Pseudomonas, Ralstonia, Corynebacterium, and Xanthomonas); under the simulation of soilborne disease intervention at seedling stage, two released chili cultivars, Hailan 99 and Sanxiaqing, were selected based on the highest or lowest severity of leaf wilting and the worst or best growth of root and the whole plant, which refer to a disease-sensitive and disease resistance cultivar, respectively. These cultivars served as our chosen materials for germination tests, morphological assessments, and transcriptome analysis.

2.3. Plant Sample Preparation and Identification at the Germination Stage

A total of 300 seeds, selected for their relatively consistent size and appearance, were used for the germination experiments and subsequent morphological assessments for each chili cultivar. Seeds were randomly distributed into three distinct groups for further processing. The sterilization process for seeds from both Hailan 99 and Sanxiaqing were sterilized consistently. All seeds were subjected to a triple sterilization procedure involving immersion in a 2.5% (v/v) sodium hypochlorite solution. Each immersion cycle lasted 30 s and was vigorously stirred. Following sterilization, seeds were meticulously rinsed with sterile distilled water [34,35].
Subsequently, 100 seeds from each cultivar were placed in plastic containers measuring 12 × 12 × 8 cm and positioned on filter paper. These seeds were subjected to two different treatments: one group received 6 mL of distilled water (designated as the control, CK), whereas the other group received 6 mL of the soil extract solution (designated as the disease treatment). The containers were then closed and maintained under specific conditions, including 0 h of light and 24 h of darkness, at a consistent humidity level of 70%, and a temperature of 25 °C. This growth environment was maintained for 7 days. Following this period, germination rates were assessed and root morphological characteristics were documented.

2.4. Plant Sample Preparation and Identification at the Seedling Stage

A total of 50 seeds from both chili cultivars were germinated and initially cultivated in distilled water within plastic containers for 5 days. Following this incubation period, seedlings were transplanted into the same organic substrate. The transplantation took place under a photoperiod comprising 16 h of light and 8 h of darkness, with humidity levels consistently maintained at 70%, and the temperature was maintained at 25 °C. When the seedlings reached the four-leaf stage, the plants from both cultivars were subjected to separate irrigation treatments. One group was irrigated with distilled water (referred to as HCK for Hailan 99 and SCK for Sanxiaqing), whereas the other group received irrigation with a 20% (w/w) soil extract solution (designated as HT for Hailan 99 and ST for Sanxiaqing).
When the plants had developed 6–8 leaves, three plants from each treatment group were randomly selected for root morphological identification. The plants were carefully extracted from the growth substrates to prevent root damage and then placed in water to facilitate separation from the substrates. Subsequently, the roots were thoroughly cleaned and dried using tissue paper. Diagrams illustrating root morphological characteristics for each treatment were generated using a scanner. To determine the root dry weight, triplicate samples were oven-dried at 80 °C for 3 h. Root diagram and traits data were processed and analyzed by using an online root analysis platform accessible at http://www.irootanalysis.cn (accessed on 19 August 2022).
Concurrently, 10–15 plants from each treatment group were randomly chosen and subdivided into three distinct groups for root sample collection. Root samples were prepared using identical methods and rapidly frozen in liquid nitrogen. They were then stored at −80 °C to facilitate subsequent analysis.

2.5. RNA Extraction and Transcriptome Sequencing

Total RNA was extracted from the sampled root tissues using a TRIzol reagent kit (Invitrogen, Carlsbad, CA, USA) following the manufacturer’s protocol. The quality of the extracted RNAs was assessed by RNase-free agarose gel electrophoresis and evaluated using an Agilent 2100 Bioanalyzer (Agilent Technologies, Palo Alto, CA, USA).
Subsequently, total mRNA was enriched using Oligo(dT) beads and then fragmented into shorter fragments using a fragmentation buffer. These RNA fragments were reverse-transcribed into cDNA using the NEBNext Ultra RNA Library Prep Kit for Illumina (NEB #7530, New England Biolabs, Ipswich, MA, USA).
Purified double-stranded cDNA fragments were subjected to end repair, A-tailing, and ligation using Illumina sequencing adapters. The ligation reaction was purified using AMPure XP Beads (1.0×) and subjected to PCR amplification to construct a library for subsequent sequencing. Transcriptome sequencing was performed on an Illumina Novaseq6000 platform by Gene Denovo Biotechnology Co. (Guangzhou, China).

2.6. Quantification of Gene Expression

Capsicum annuum cv. CM334 v2.47 was used as the reference to assemble the mapped reads [36]. The mapped reads for each sample were assembled using StringTie v1.3.1, following a reference-based approach. Subsequently, RSEM software was used to calculate the gene expression levels, which were quantified as fragments per kilobase of transcript per million mapped reads (FPKM) values for each transcription region.

2.7. Differential Expression Analysis

Differential expression analysis of RNAs between the two distinct groups was conducted using DESeq2 software. Genes meeting the criteria of a false discovery rate < 0.05 and |log2(FoldChange)| ≥ 2 were identified as DEGs. To gain insights into the biological functions of the identified DEGs, all DEGs were annotated using the GO (http://www.geneontology.org/ (accessed on 1 July 2022)) and KEGG (http://www.genome.jp/kegg/ (accessed on 1 July 2022)) databases. Additionally, protein–protein interaction network analysis was performed using String v10, and the results were visualized using Cytoscape (v3.7.1) software.

2.8. Quantitative Real-Time PCR Validation

Root samples were also prepared to validate the RNA-seq results. A total of 10 DEGs were randomly selected for qRT-PCR. Each gene was subjected to three biological replicates, and three technical replicates were performed within each replicate. Actin-7 served as the internal control. The sequence of housekeeping gene is shown in Table S1. The primer sequences used for qRT-PCR are listed in Table S2. The qRT-PCR experiments employed ChamQ SYBR qPCR Master Mix (High ROX Premixed) and were conducted using the TianLong 988 Real-Time PCR Detection System. The fold-change in the expression levels of the target genes was calculated using relative quantification (2−ΔΔCT).

2.9. Statistical Analysis

Root trait results were processed using SPSS 26.0. Means from individual treatments were determined using Duncan’s multiple range test. Statistical significance was set at p < 0.05.

3. Results

3.1. Evaluation of Germination Rates and Root Morphological Characteristics

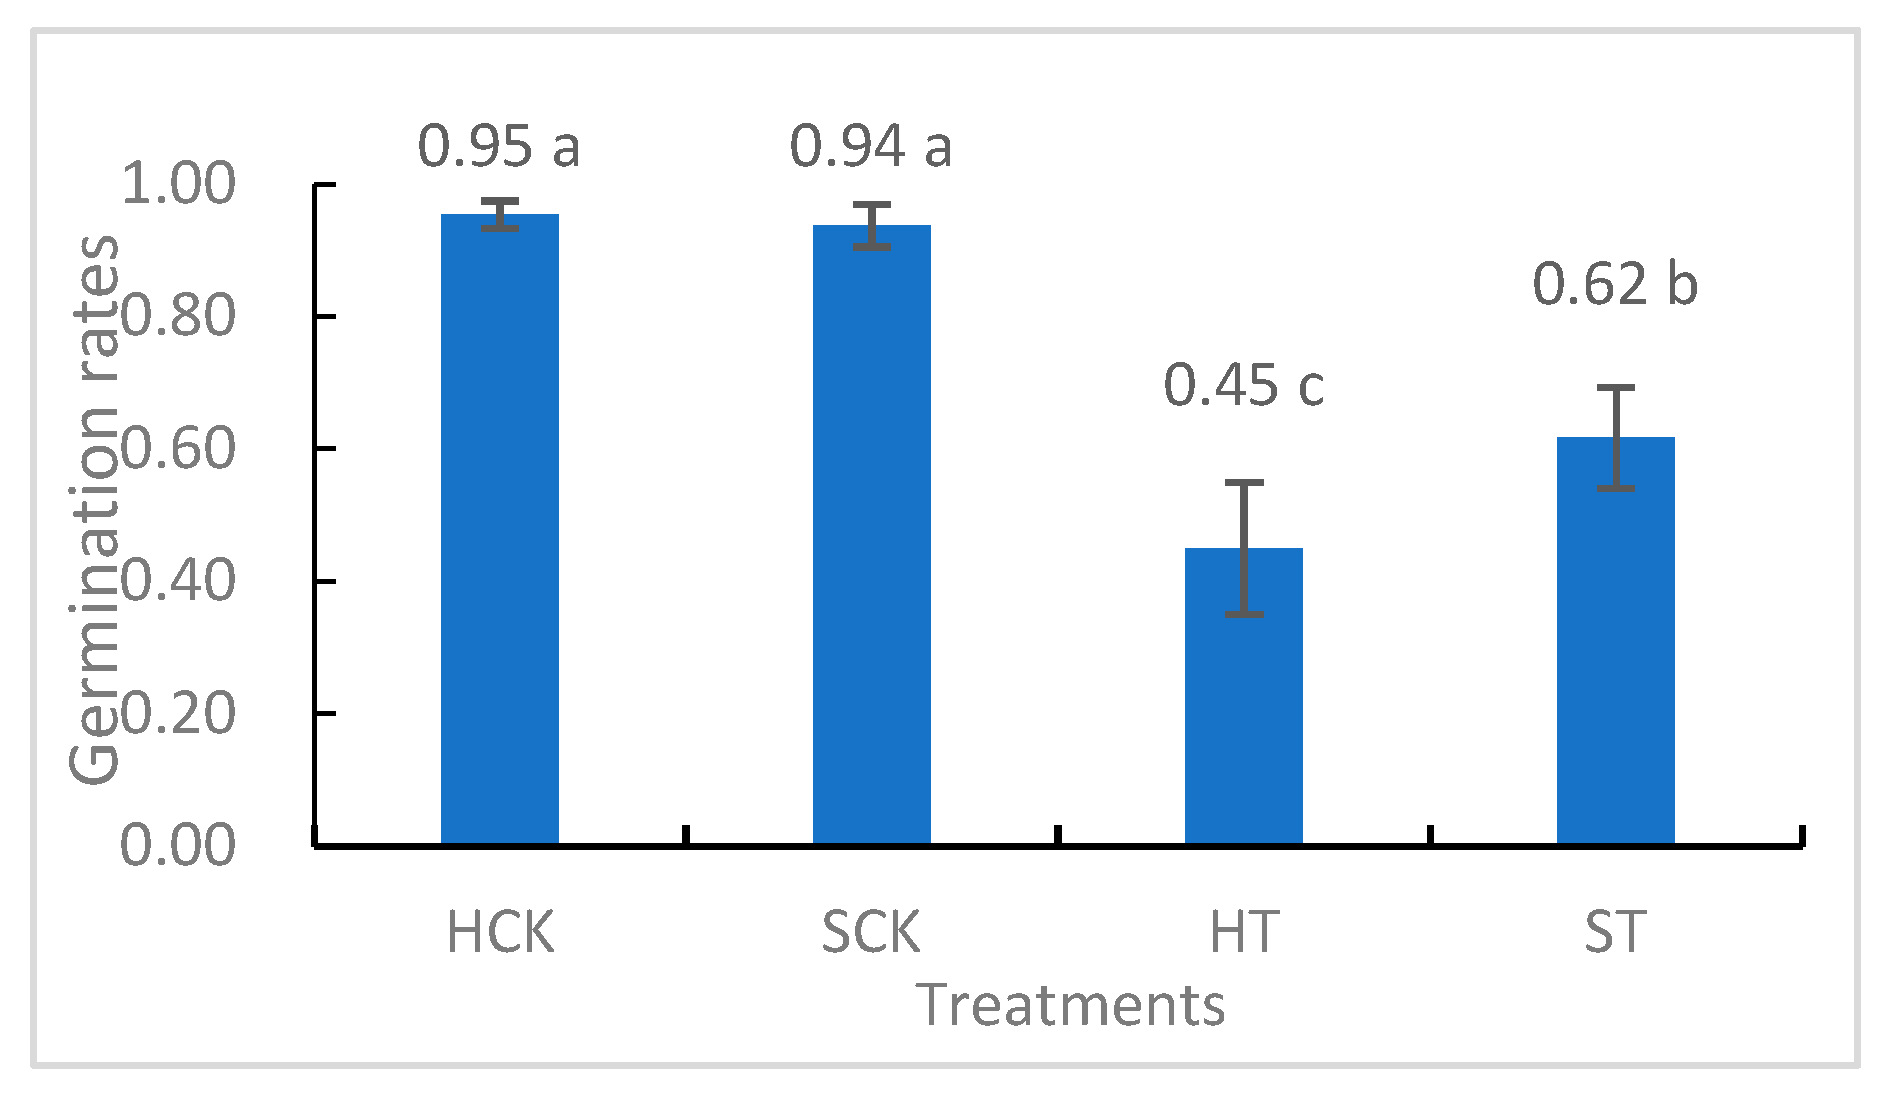
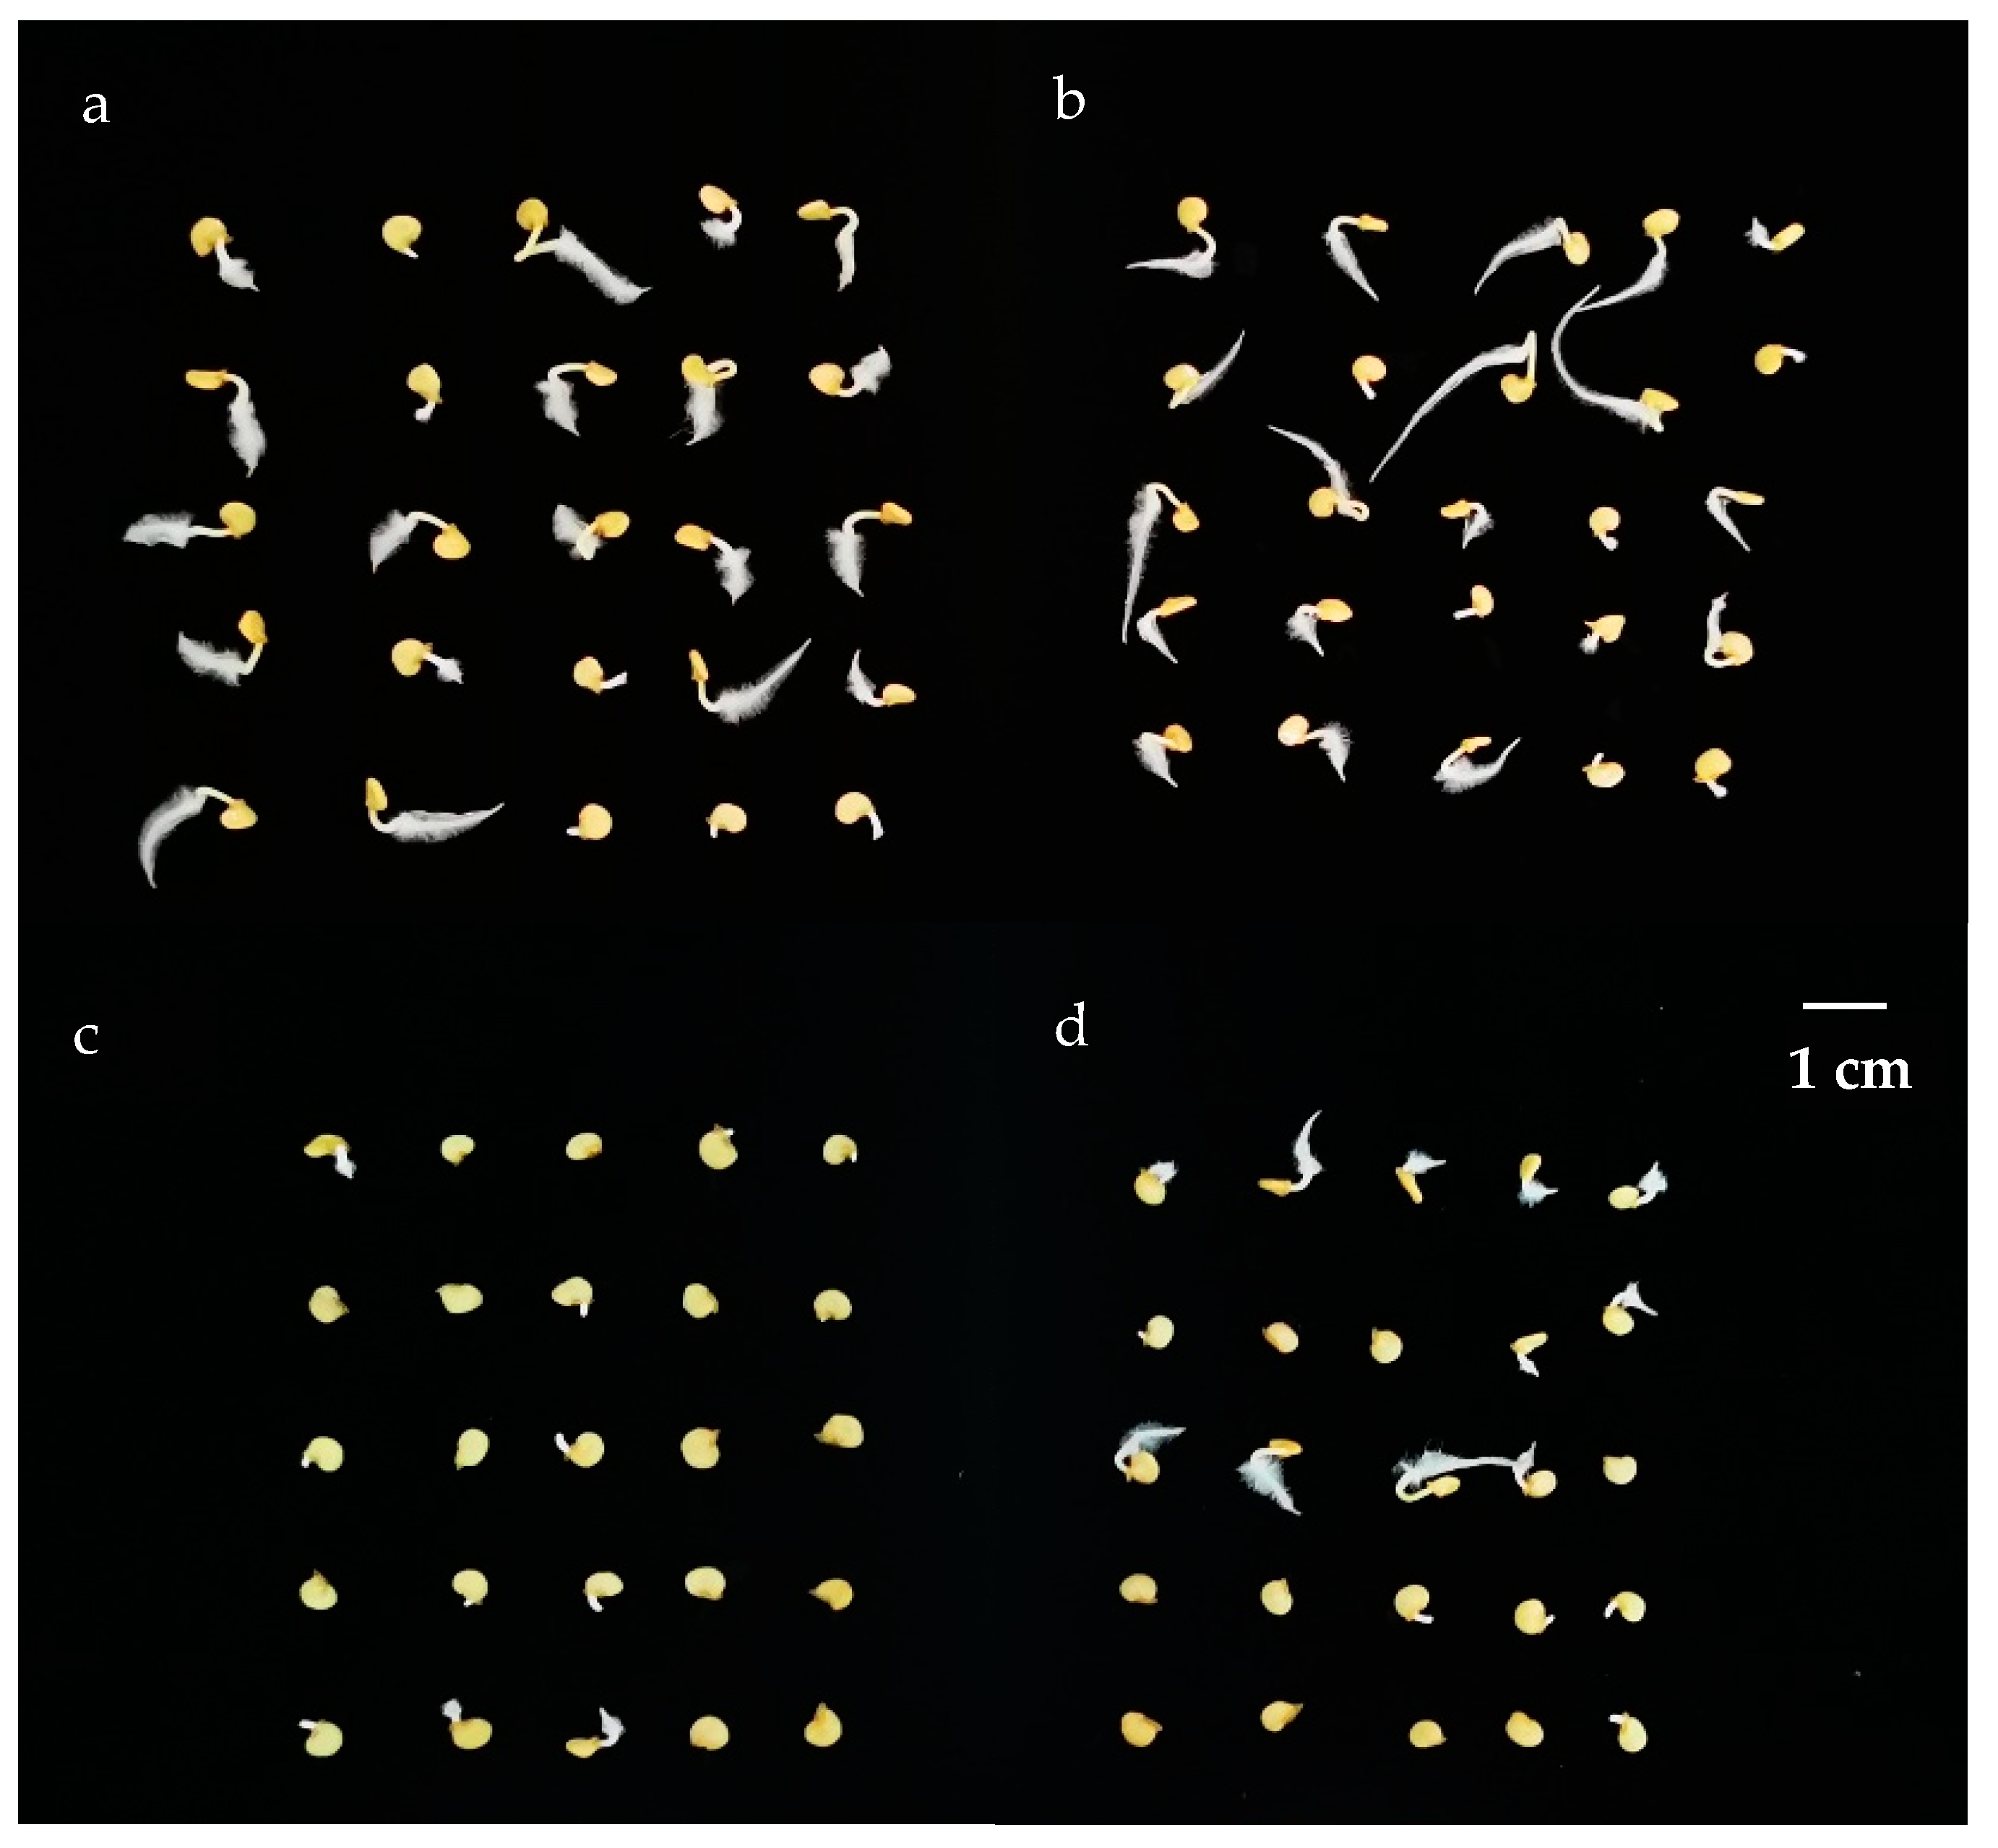
3.1.1. Germination Stage

In the control groups, Hailan 99 and Sanxiaqing were designated HCK and SCK, respectively. In the groups exposed to 20% (w/w) soil extract solution treatment, Hailan 99 and Sanxiaqing were denoted as HT and ST, respectively. In both HCK and SCK, the mean germination rates consistently remained high at approximately 0.94–0.95, signifying a noteworthy 1.1-fold increase and a 0.5-fold increase over those observed in HT and ST, respectively (Figure 1). Furthermore, it is noteworthy that the mean germination rate in ST significantly surpassed that in HT, with a notable 0.37-fold increase.
As illustrated in Figure 2 and Figure 3, cultivars in the control groups displayed more robust root development than those in the treatment groups. This was evident from their extended primary root lengths, elevated root hair densities, augmented root volumes, and expanded surface areas. Remarkably, ST exhibited superior performance in this regard compared to HT.

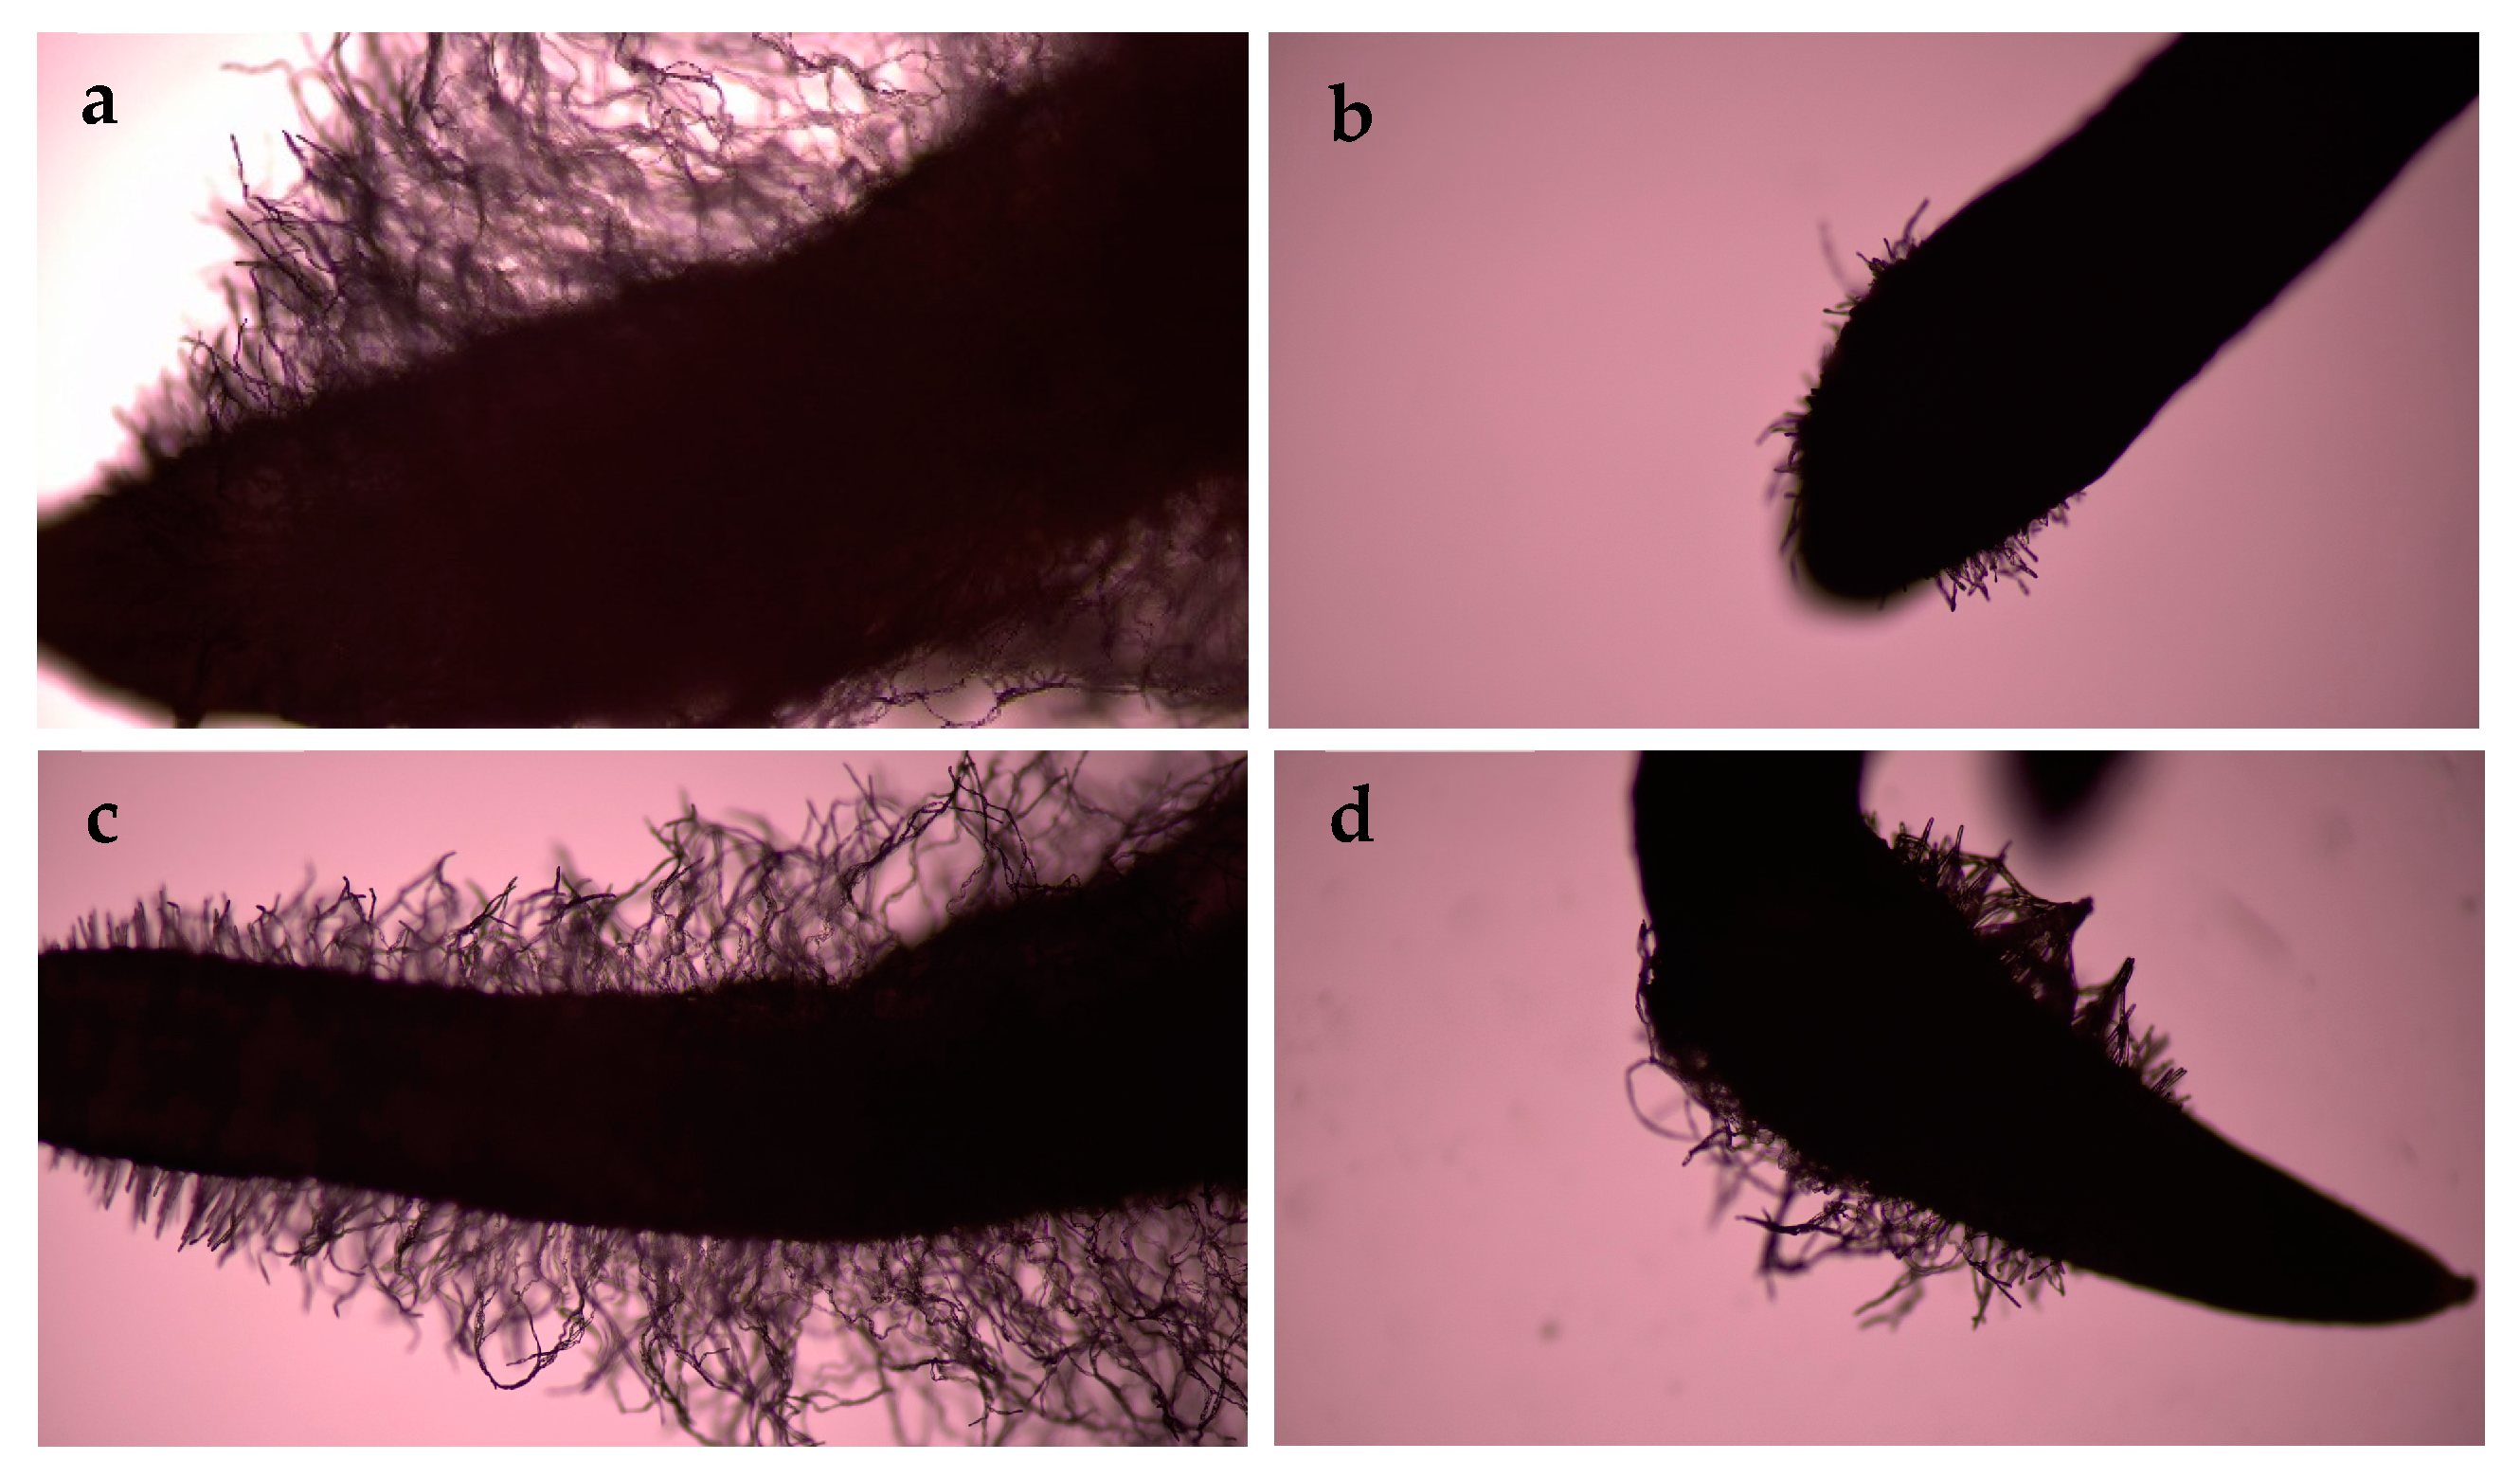
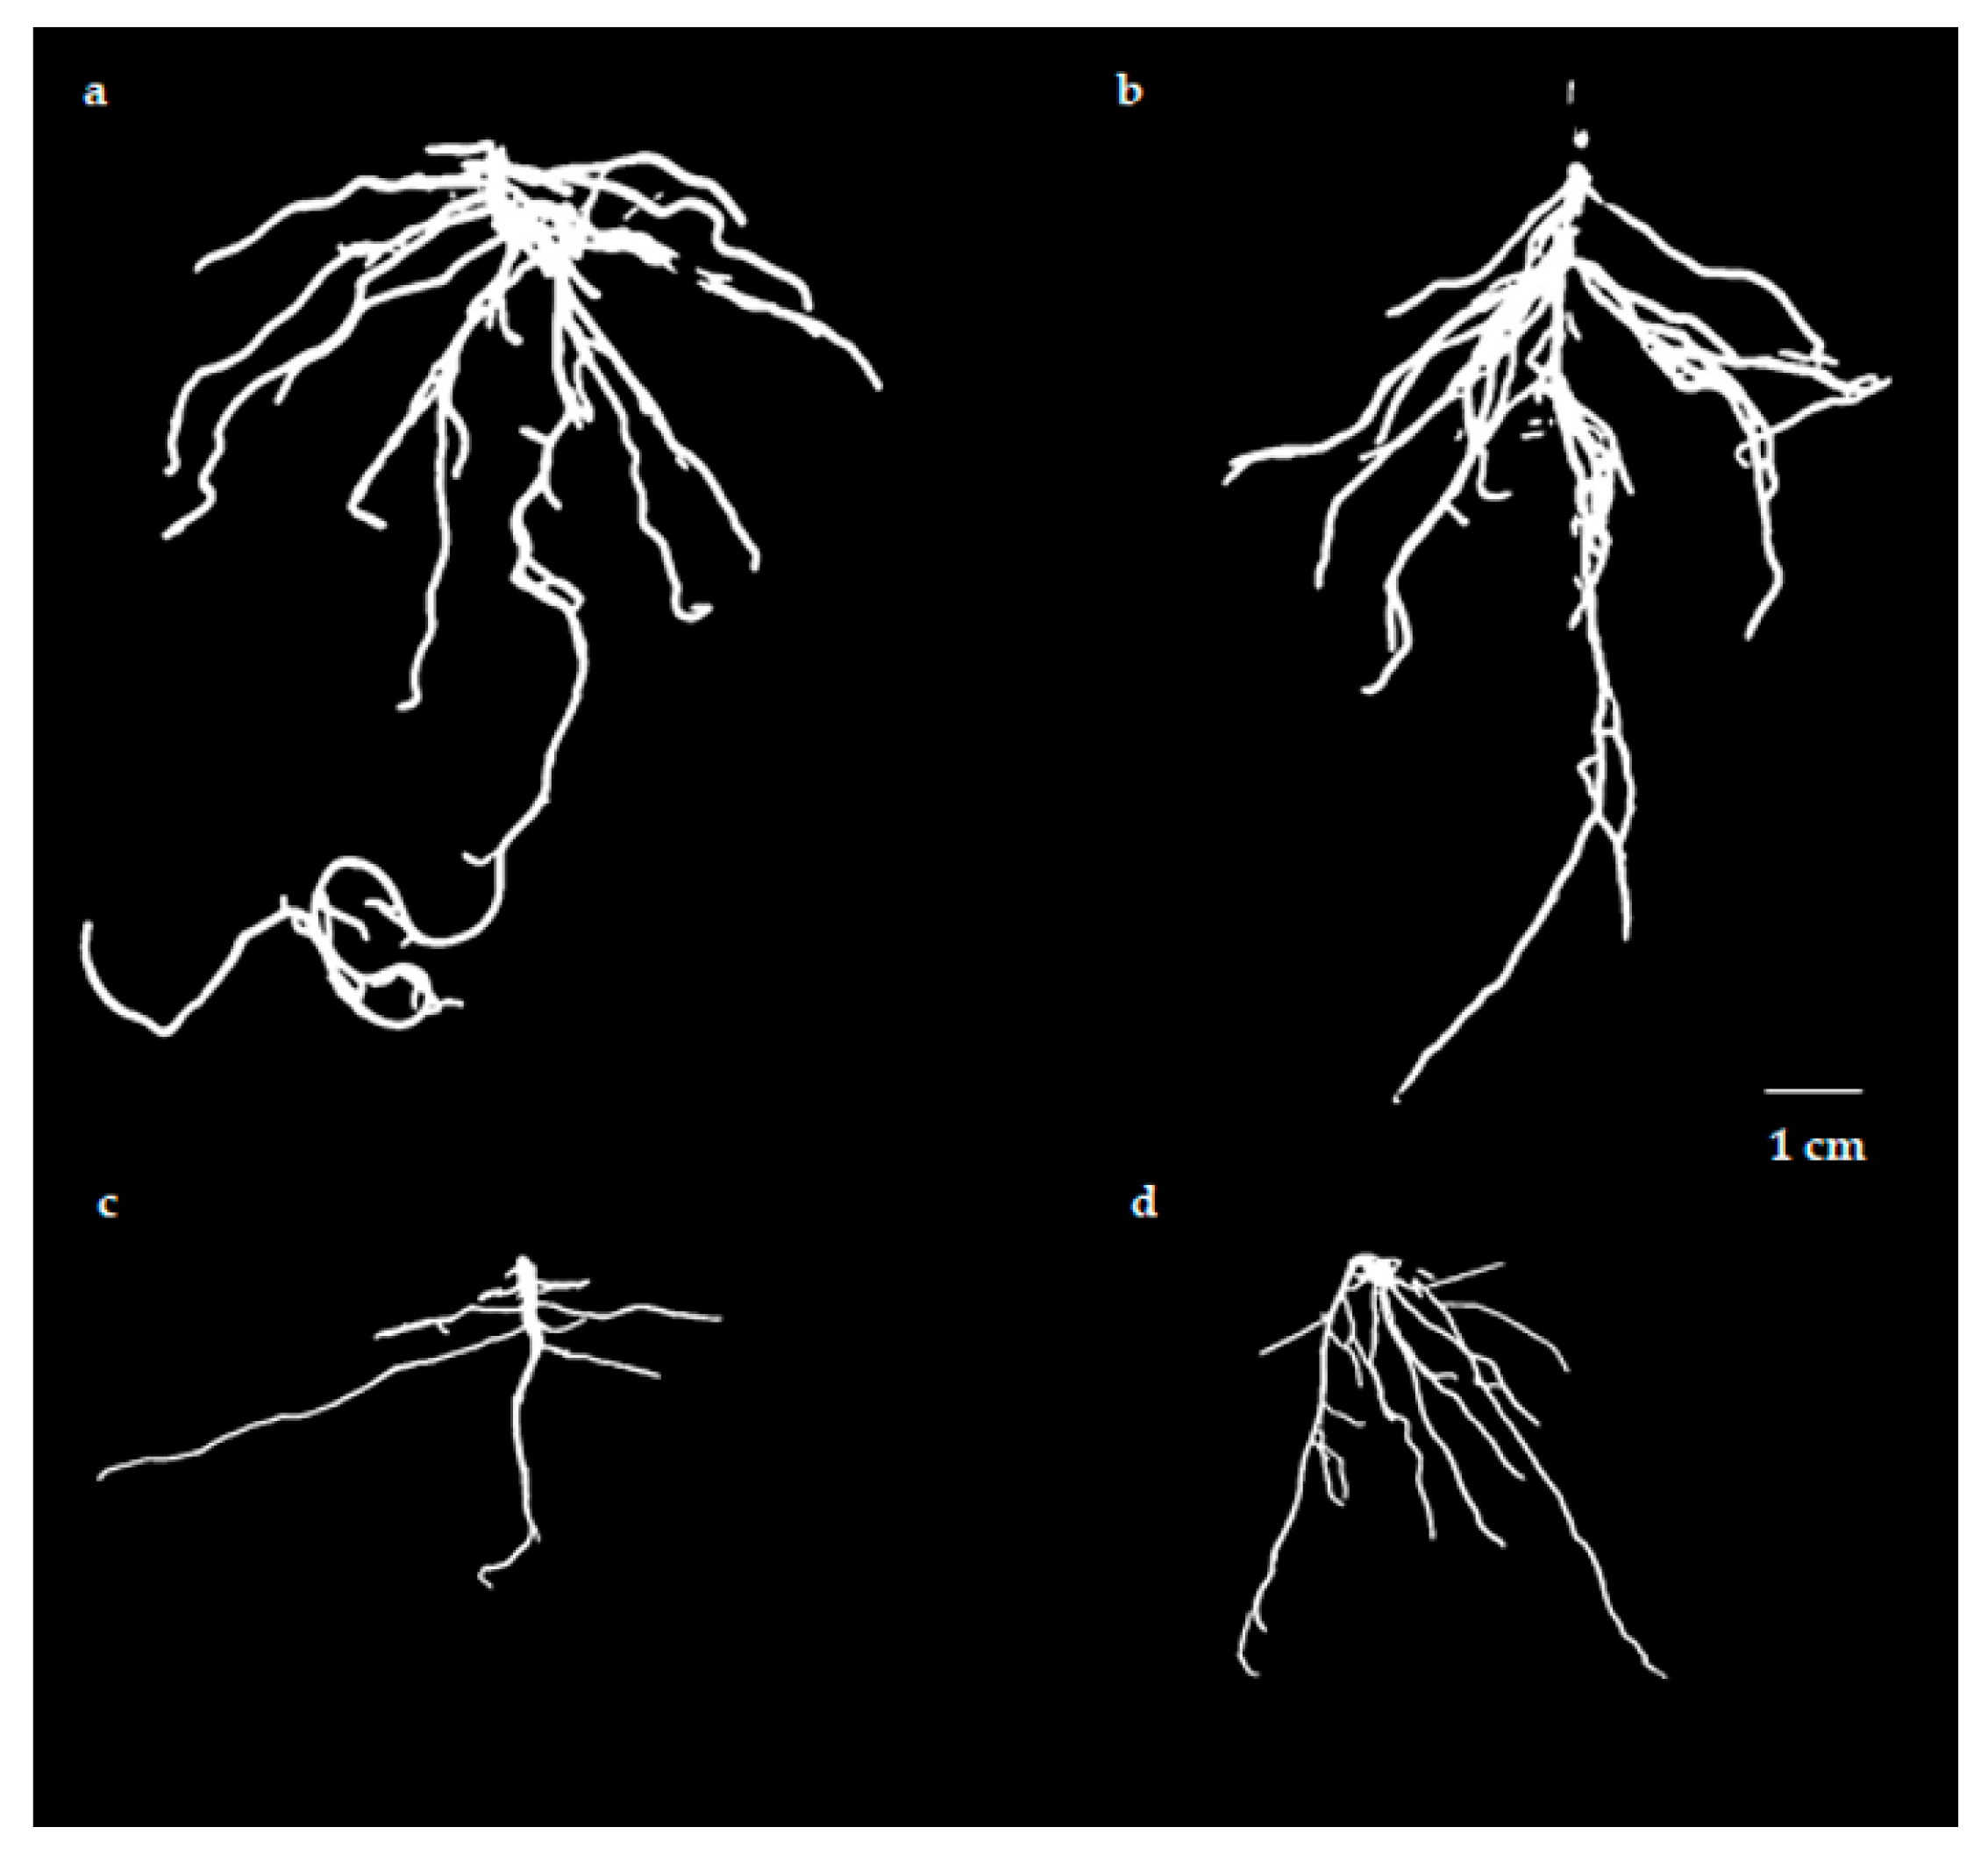
3.1.2. Seedling Stage

Root system traits were also assessed during the seedling stage, yielding results that aligned with those observed at the germination stage. In general, plants from HCK and SCK exhibited more pronounced root development than those from HT and ST, and ST also outperformed HT, as illustrated in Figure 4. Table 1 provides detailed insights into these findings. Notably, the HCK plants demonstrated the most robust performance in terms of root characteristics, with the largest total root length, average diameter, surface area, total volume, total tips, and the highest dry weight. SCK displayed slightly lower values for these traits than HCK (Table 1). Additionally, all the measured root traits in ST surpassed those in HT, including total root length, average diameter, surface area, total volume, total tips, and dry weight. It is worth noting that, in comparison to HCK, the root system architecture in SCK exhibited a narrower angle against the stem, resulting in a more compact root system.

3.2. RNA Sequencing Analysis

Twelve RNA-seq libraries were prepared, encompassing two distinct cultivars subjected to CK (control) conditions and 20% (w/w) soil extract solution treatment. Each experiment had three biological replicates. Notably, each sample yielded approximately 44 million clean reads, with low-quality reads accounting for less than 0.5% of each sample (Table S3). Following the filtration process, it was evident that the percentage of Q30 bases within the high-quality clean reads exceeded 92%, while the Q20 bases exceeded 97%. Additionally, the GC content of each sample was approximately 42.5% (Table S4). Subsequent to the alignment process involving ribosomal RNA (rRNA) and the reference genome (Capsicum annuum cv. CM334 v2.47), 27,650 genes were comprehensively annotated. This annotation encompassed 22,822 sequenced reference genes, representing approximately 72.22% of the total reference genes, along with the identification of 4828 novel genes (Table S5). These findings confirm the adequacy and suitability of the sequencing data and reference genome for subsequent analytical endeavors.

3.3. Analysis of Differentially Expressed Genes (DEGs) in Chili Roots under Different Treatments

To discern the distinctive strategies employed by different chili cultivars in response to soilborne diseases, a comparative analysis of gene expression profiles was conducted using chili root samples from various cultivars subjected to CK (control) and soilborne disease interventions. In this study, a total of 1594 differentially expressed genes (DEGs) were identified between HCK and SCK, of which 889 were upregulated and 705 were downregulated in SCK, while 1116 DEGs were identified between HT and ST, of which 601 were upregulated and 515 were downregulated in ST, as depicted in Figure 5. Additionally, 698 DEGs were observed between HCK and HT, consisting of 471 upregulated genes and 227 downregulated genes in HT; 199 DEGs were identified between SCK and ST, comprising 140 upregulated and 59 downregulated genes in ST. It is noteworthy that, in general, a higher number of DEGs were observed between different cultivars than between the different treatments. Additionally, there was a greater abundance of DEGs in the disease-sensitive cultivar (Hailan 99) than in the disease-resistant cultivar (Sanxiaqing) under various treatments. Collectively, these findings imply that gene expression was significantly induced in response to soilborne disease interventions, with distinct transcriptional responses observed among different chili cultivars.

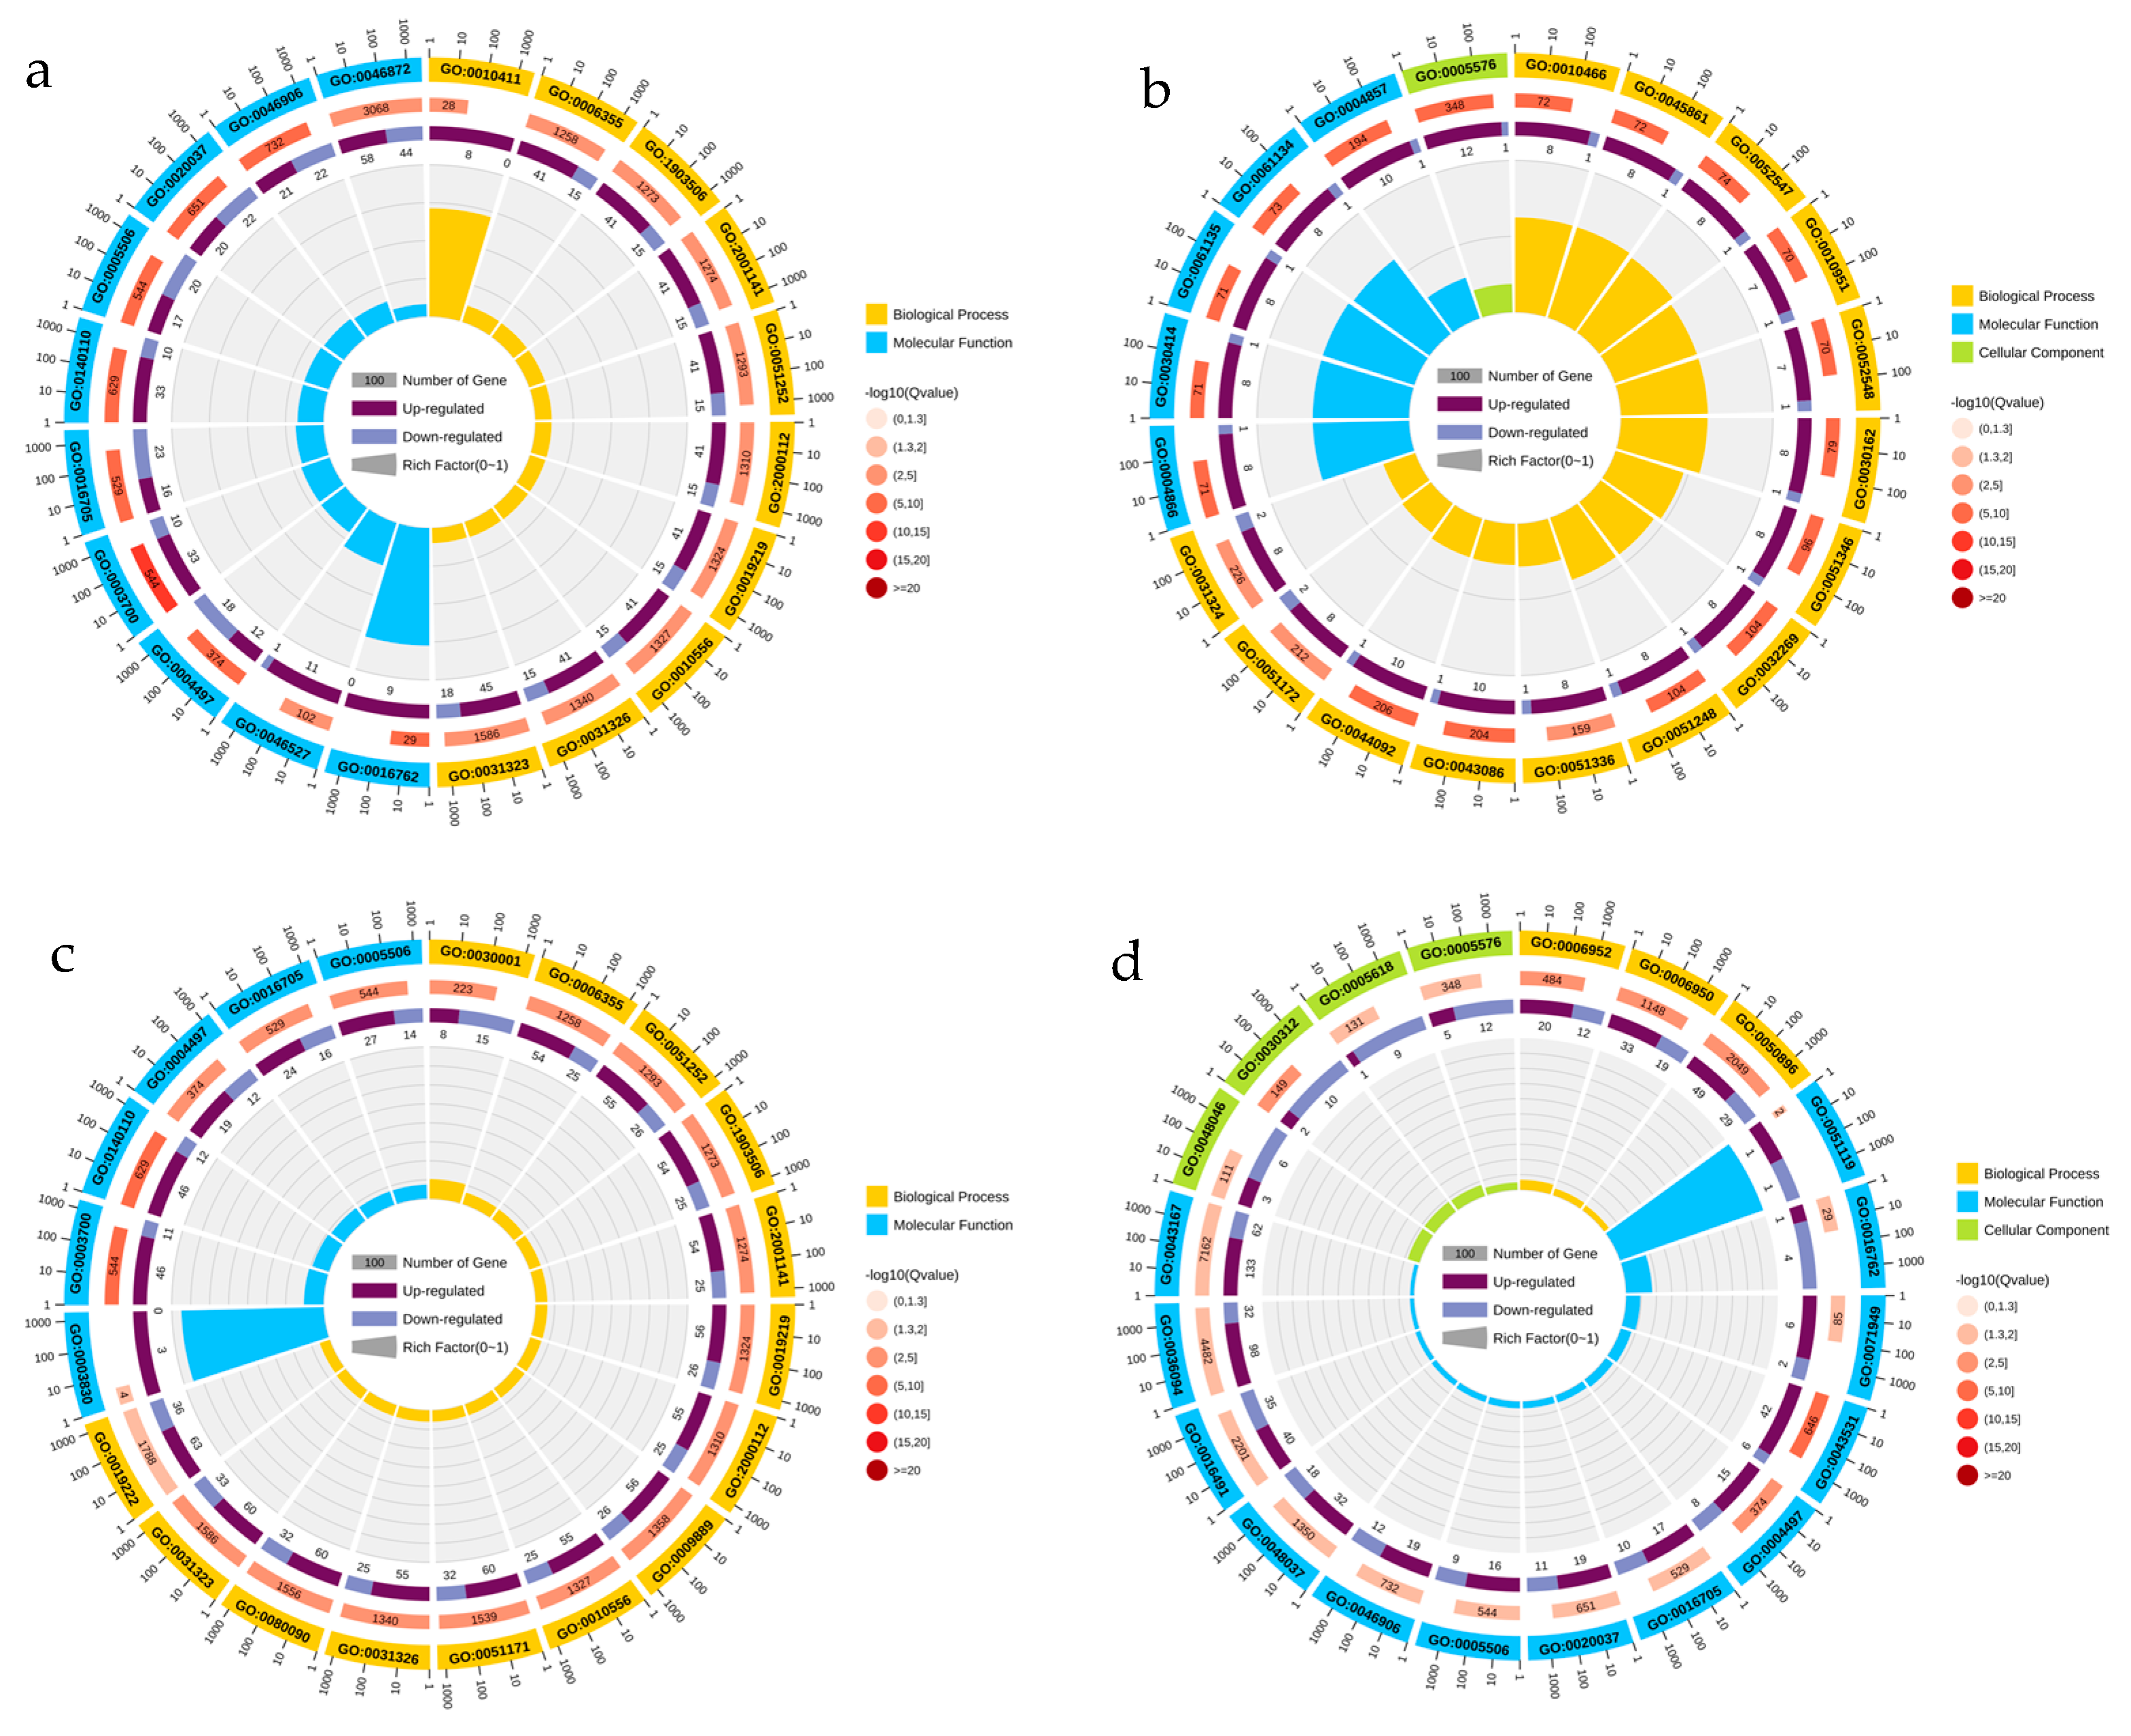
3.4. Gene Ontology Enrichment Analysis

A total of 24,958 genes were annotated in the GO database. Among these, 12,287 genes were associated with cellular components, 20,139 genes were linked to molecular functions, and 15,908 genes were involved in biological processes within the ontology. The top 20 GO terms derived from DEGs in various treatments are presented in Figure 6 and relative information is shown in Table S6.
Based on the GO enrichment results, a comparison between HCK and HT unveiled DEGs associated with four significantly enriched cellular component GO terms, namely ‘apoplast’, ‘extracellular region’, ‘cell wall’, and ‘external encapsulating structure’; DEGs were significantly enriched in 30 molecular function GO terms and 46 biological process GO terms. Similarly, when contrasting SCK with ST, DEGs were enriched in two cellular component GO terms, 25 molecular function GO terms, and 72 biological process GO terms. When comparing HCK and SCK, DEGs were enriched in 1 cellular component GO term, 16 molecular function GO terms, and 25 biological process GO terms. Lastly, in the comparison between HT and ST, DEGs were found to be enriched in 4 cellular component GO terms, 13 molecular function GO terms, and 3 biological process GO terms. Remarkably, it was evident that a greater number of DEGs identified between SCK and ST were significantly enriched in GO terms related to complex regulatory processes when compared with those in the disease-sensitive group. Notably, in biological process entries, DEGs between HT and ST were significantly enriched in ‘defense response’ and ‘response to stress’; specifically, 70% (19/27) of the DEGs related to defense response were upregulated in ST and 75% (3/4) of the DEGs related to response to stress were upregulated in ST.

3.5. KEGG Pathway Analysis

A total of 7706 genes were annotated in the Kyoto Encyclopedia of Genes and Genomes (KEGG) pathway database, and the top 20 KEGG pathways involving DEGs in various treatments are presented in Figure 7 and relative information is shown in Table S7. The enrichment analysis revealed that the DEGs from different treatments were significantly enriched in ‘Plant-pathogen interaction’, ‘MAPK signaling pathway plant’, ‘sesquiterpenoid and triterpenoid biosynthesis’, and ‘plant hormone signal transduction’. Notably, when focusing on the comparisons of HCK vs. HT and SCK vs. ST, DEGs related to ‘phenylpropanoid biosynthesis’ and ‘biosynthesis of secondary metabolites’ assumed a more prominent role in the disease-resistant groups.

3.6. Screening and Analysis of DEGs in Important Biological Processes

3.6.1. DEGs Involved in Effector Recognition and Immunity Triggering in Plants

Based on the FPKM values obtained from the transcriptomic data, we identified RPM1 (T459_29365) and RPS2 (T459_04053), which are closely associated with effector recognition in plant defense, in the KEGG enrichment analysis. In this study, when comparing HCK to HT, T459_29365 was found to be upregulated in HT. Conversely, when comparing HT to ST, T459_04053 was upregulated in ST. Additionally, a previously unidentified gene (MSTRG.22201) encoding the molecular chaperone HtpG (HSP90A) was upregulated in ST when compared to HT.
In the comparison of transcriptomic data between the CK and treatment groups, numerous DEGs were significantly enriched in GO entries related to ion transport, including ‘calcium-transporting ATPase activity’, ‘calcium ion transmembrane transporter activity’, and ‘metal ion transmembrane transporter activity’. These processes are intimately associated with triggering plant immune responses. Moreover, it is worth noting that there was a higher abundance of DEGs involved in ion transport in the disease-sensitive group than in the disease-resistant group.
Furthermore, DEGs were significantly enriched in pathways such as ‘plant hormone signal transduction’, ‘MAPK signaling pathway-plant’, and ‘plant-pathogen interaction’. Within these pathways, numerous DEGs related to transcription factors and signal transduction systems have been identified, indicating their integral role in plant immunity. Specifically, WRKY genes, including T459_00219, T459_17066, and T459_21855, as well as the MYC gene (T459_04029), OXI1 kinase gene (T459_02659), calmodulin gene (T459_22923), and jasmonate ZIM domain-containing protein gene (T459_19535), were upregulated in HT when compared to HCK. Additionally, a novel calcium-dependent protein kinase gene (MSTRG.25559) was upregulated in chili from ST when compared to those from HT. Similarly, a greater number of DEGs related to transcription factors and signal transduction were identified in disease-sensitive groups.

3.6.2. DEGs Related to Metabolic Processes and the Biosynthesis of Antimicrobial Secondary Metabolites

The transcriptomic data revealed that, when comparing CK to the treatment, a substantial number of DEGs were significantly associated with the regulation of metabolic processes, encompassing terms such as the ‘regulation of biosynthetic processes’ and ‘biological regulation’. However, in the comparisons between HCK vs. HT and SCK vs. ST, it was observed that a significantly higher number of DEGs were related to the negative regulation of metabolism and the biosynthesis of critical secondary metabolites in SCK vs. ST. Specifically, DEGs linked to active oxygen metabolism processes, including ‘ROS metabolic process’, ‘phenylpropanoid biosynthesis’, and ‘hydrogen peroxide metabolic process’, were identified. Additionally, DEGs involved in the biosynthesis of toxic substances, such as ‘drug catabolic process’, ‘cellular oxidant detoxification’, ‘cellular detoxification’, ‘hydrogen peroxide metabolic process’, ‘detoxification’, and ‘antibiotic metabolic process’, were prominent. Furthermore, DEGs associated with phenylpropanoid biosynthesis processes, including ‘phenylpropanoid catabolic process’, ‘phenylpropanoid metabolic process’, ‘lignin catabolic process’, ‘lignin metabolic process’, ‘cellular glucan metabolic process’, ‘glucan metabolic process’, ‘indolalkylamine metabolic process’, ‘aromatic compound catabolic process’, ‘indole-containing compound metabolic process’, and ‘indoleacetic acid metabolic process’, were identified exclusively in SCK vs. ST (not in HCK vs. HT).
Notably, DEGs were significantly enriched in the ‘phenylpropanoid biosynthesis’ pathway exclusively in HT vs. ST (not in SCK vs. ST), further highlighting the distinct resistance strategies between disease-sensitive and disease-resistant cultivars. Specifically, compared with HT, a new 4-coumarate-CoA ligase gene (MSTRG.26158) and a new shikimate O-hydroxycinnamoyltransferase gene (MSTRG.30886) were upregulated in ST.

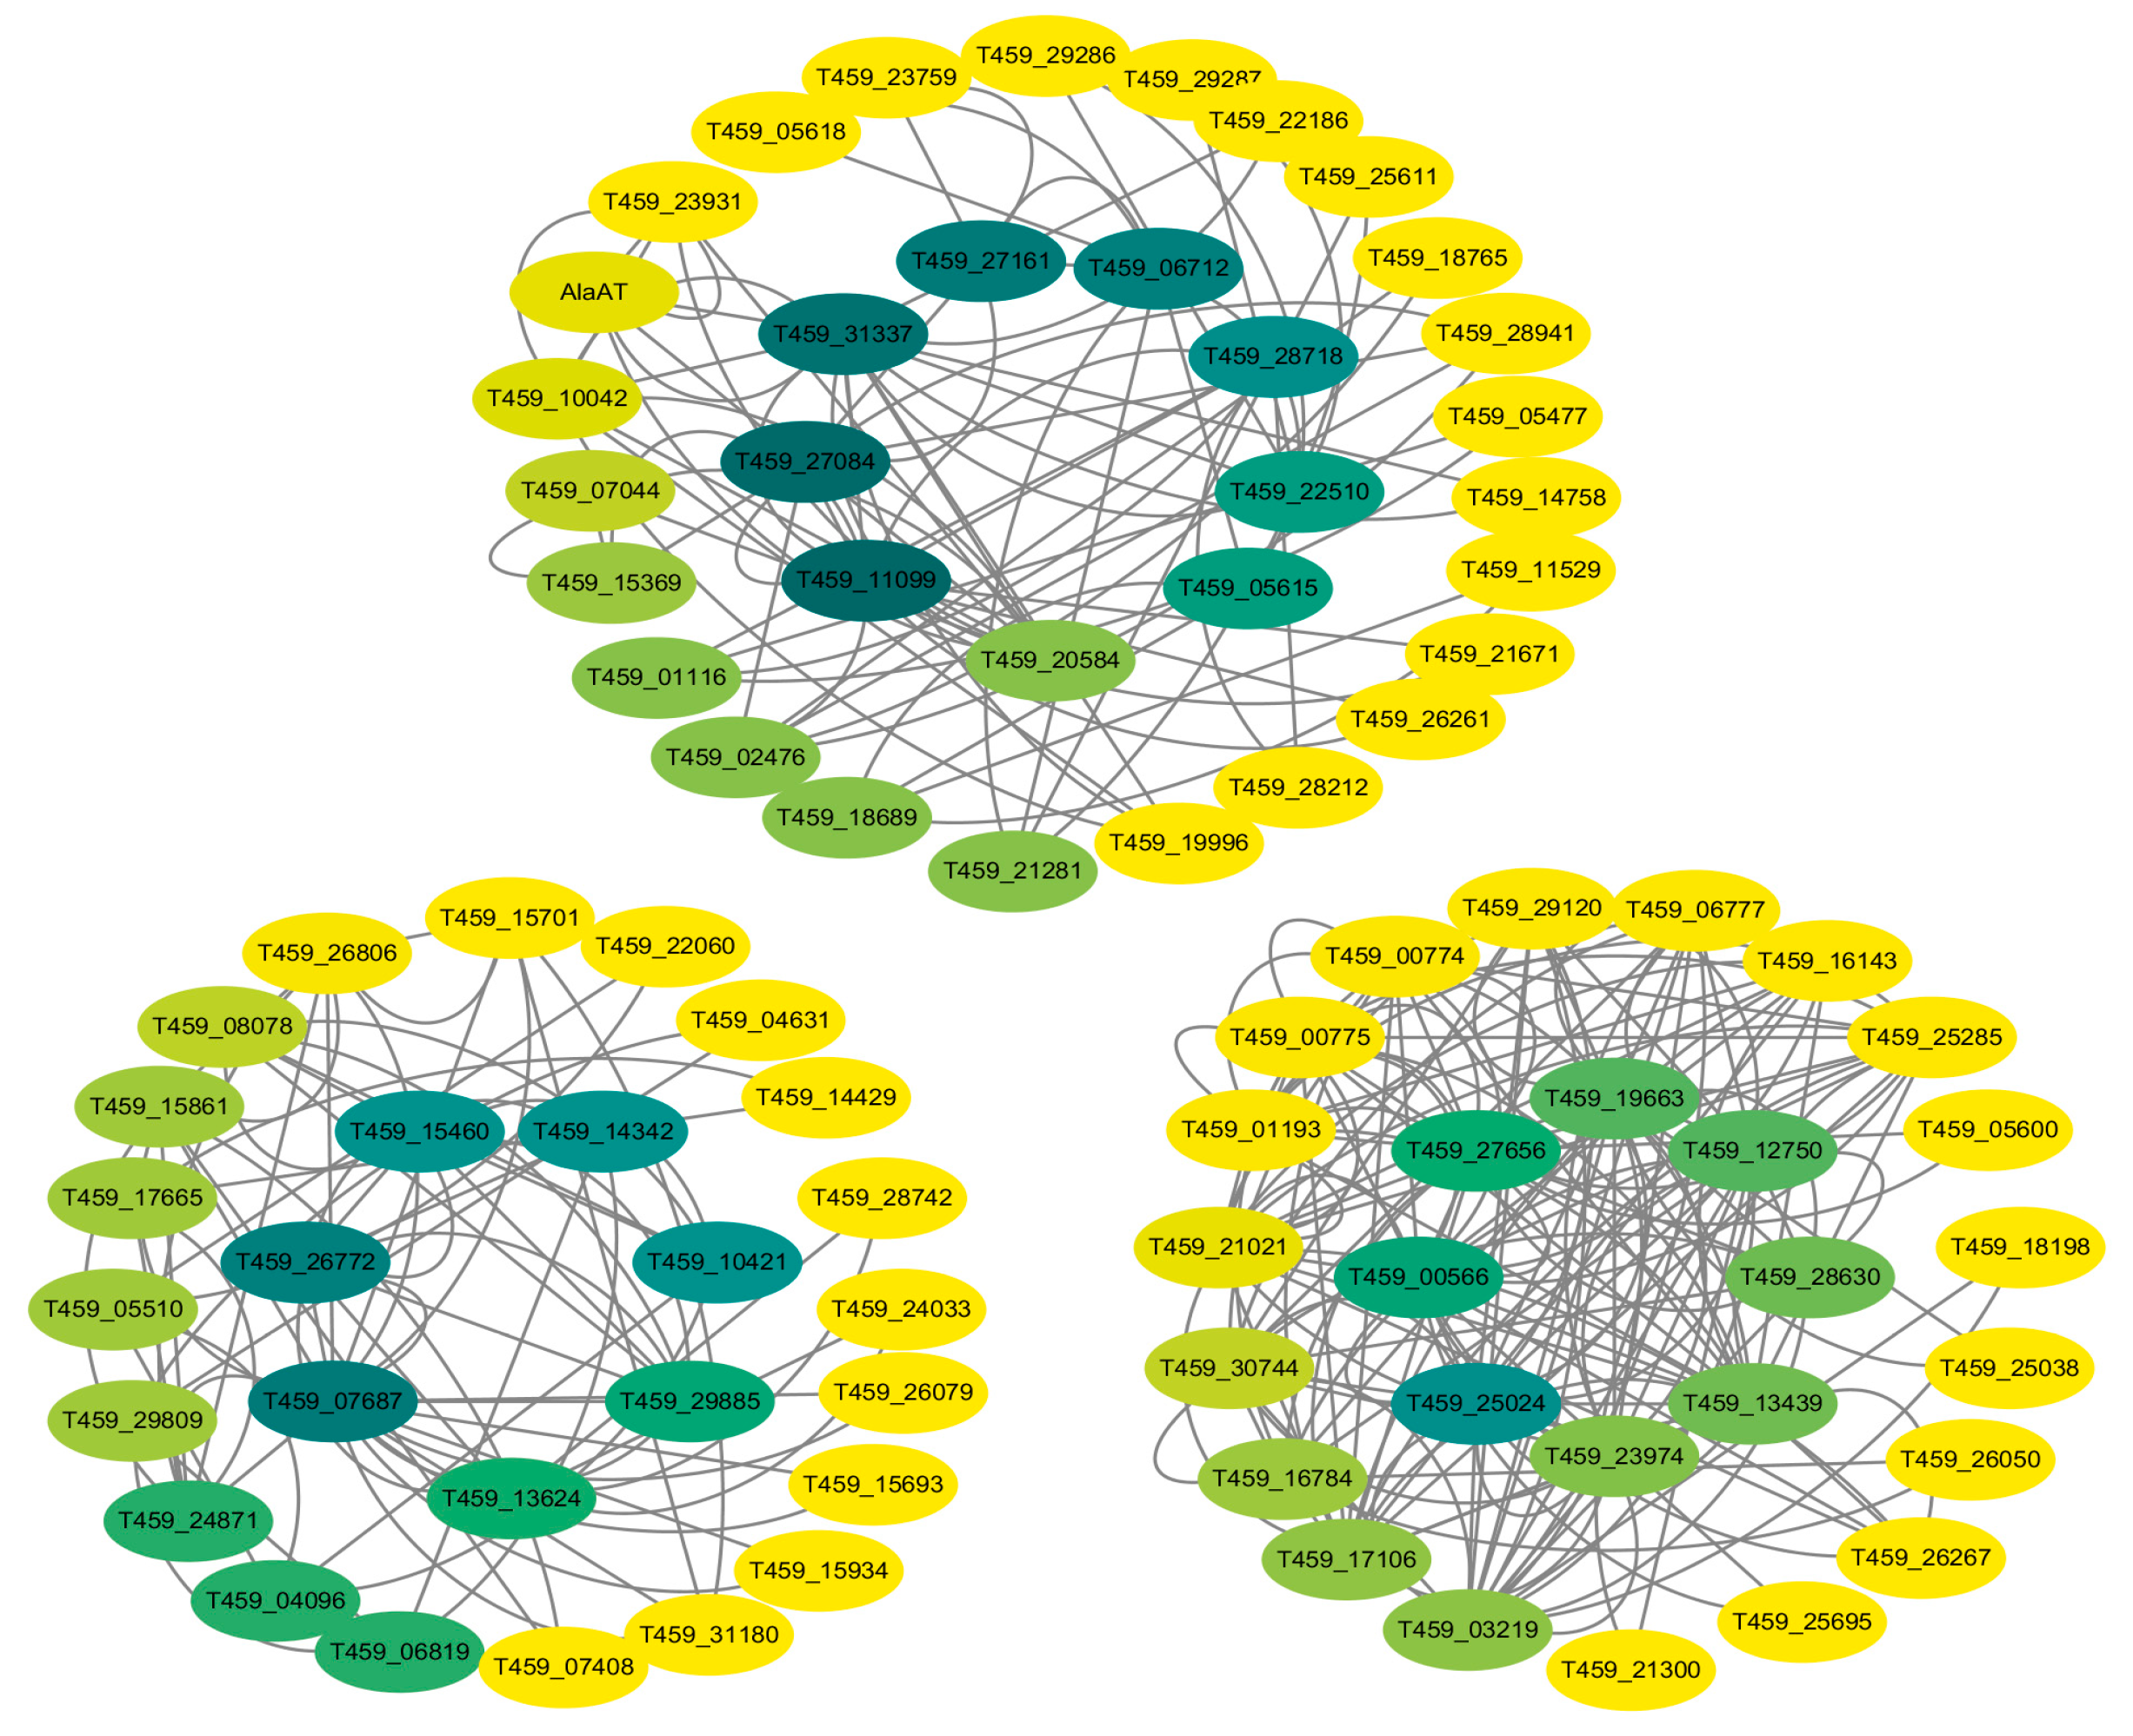
3.6.3. Co-Expression Network Analysis of the DEGs

To delve deeper into the investigation and analysis of the differential strategies employed by disease-sensitive and disease-resistant cultivars under soilborne disease interventions, protein–protein interaction network analysis was conducted between HT and ST using String v10 and Cytoscape (v3.7.1). By applying the threshold values of betweenness > 70, closeness > 0.002, and degree > 10, 25 hub genes were selected from the HT vs. ST group. The DEGs from HT vs. ST were subsequently organized into three distinct modules (as shown in Figure 8). Genes in Module 1 were associated with the regulation of enzyme activity, genes in Module 2 were linked to molecular binding, and genes in Module 3 were involved in transport processes.
Though only 28% of the selected genes exhibited upregulation in ST compared with HT, two upregulated DEGs were noteworthy. One was significantly enriched in the autophagy pathway, described as the serine/threonine-protein kinase mTOR gene (T459_05615), and the other one was significantly enriched in the biosynthesis of secondary metabolites, described as a threonine dehydratase gene (T459_22510). These findings also indicated that autophagy and biosynthesis of secondary metabolites played critical roles in the defense mechanisms of chili peppers under soilborne disease interventions.

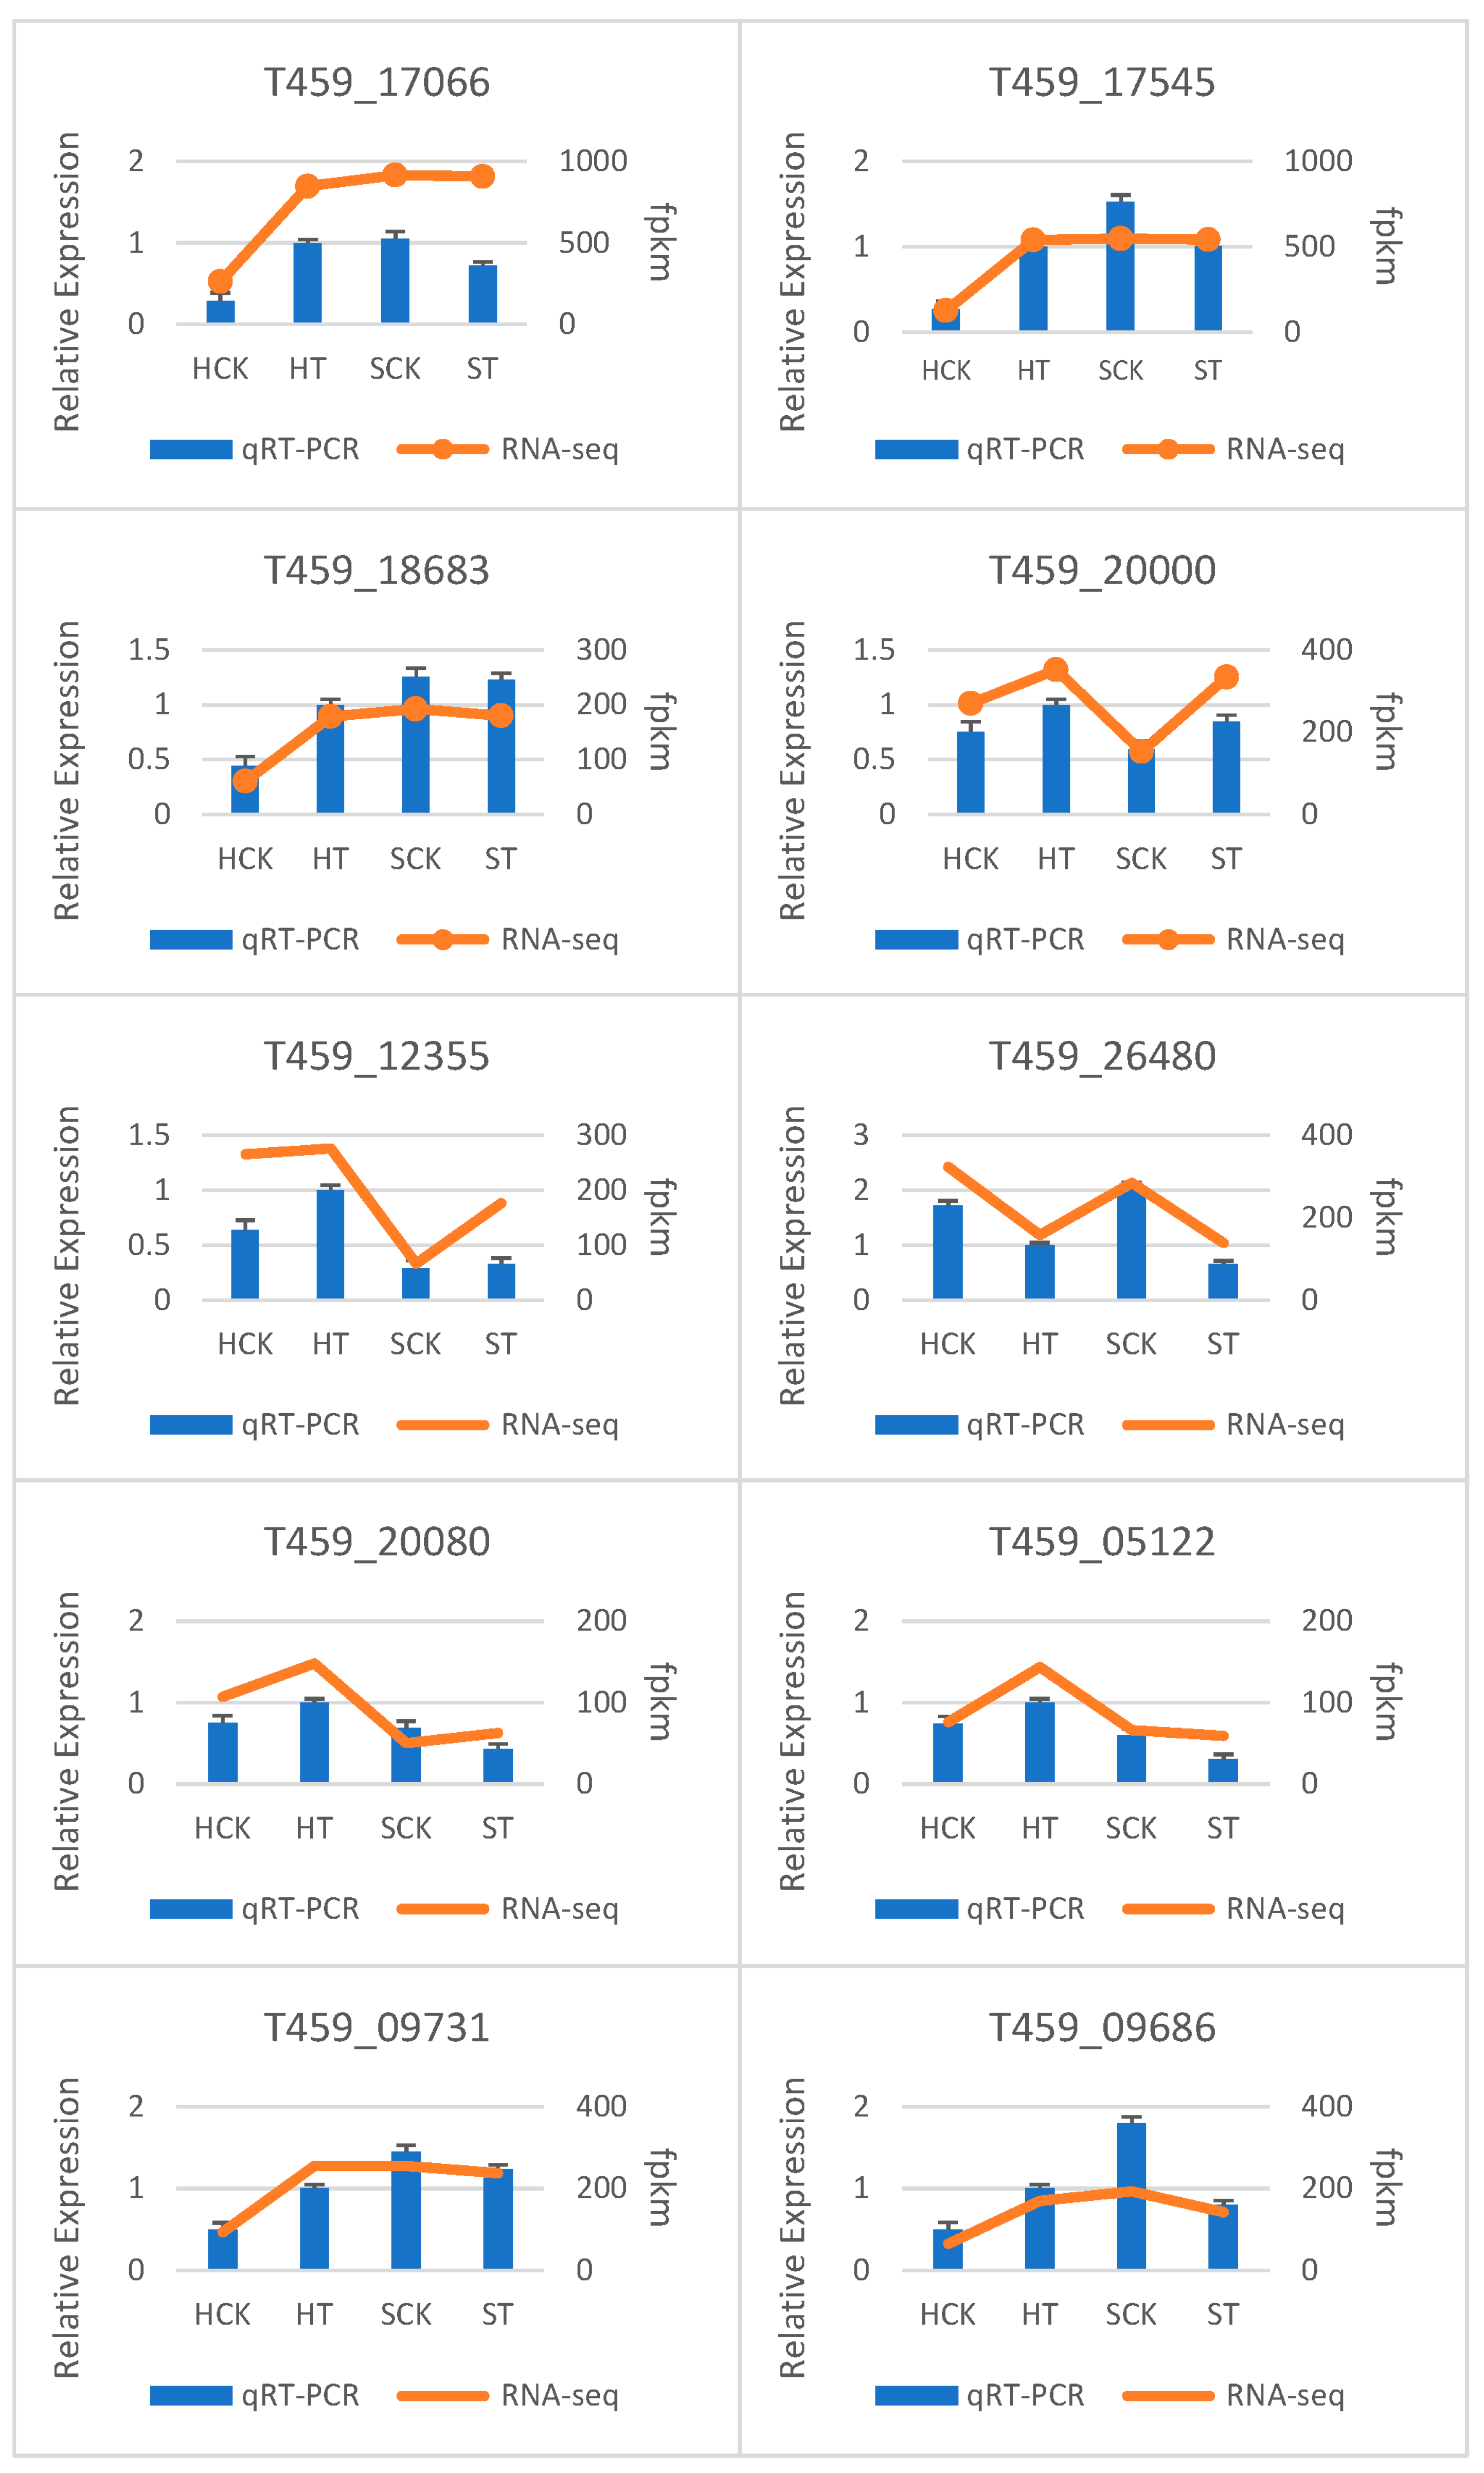
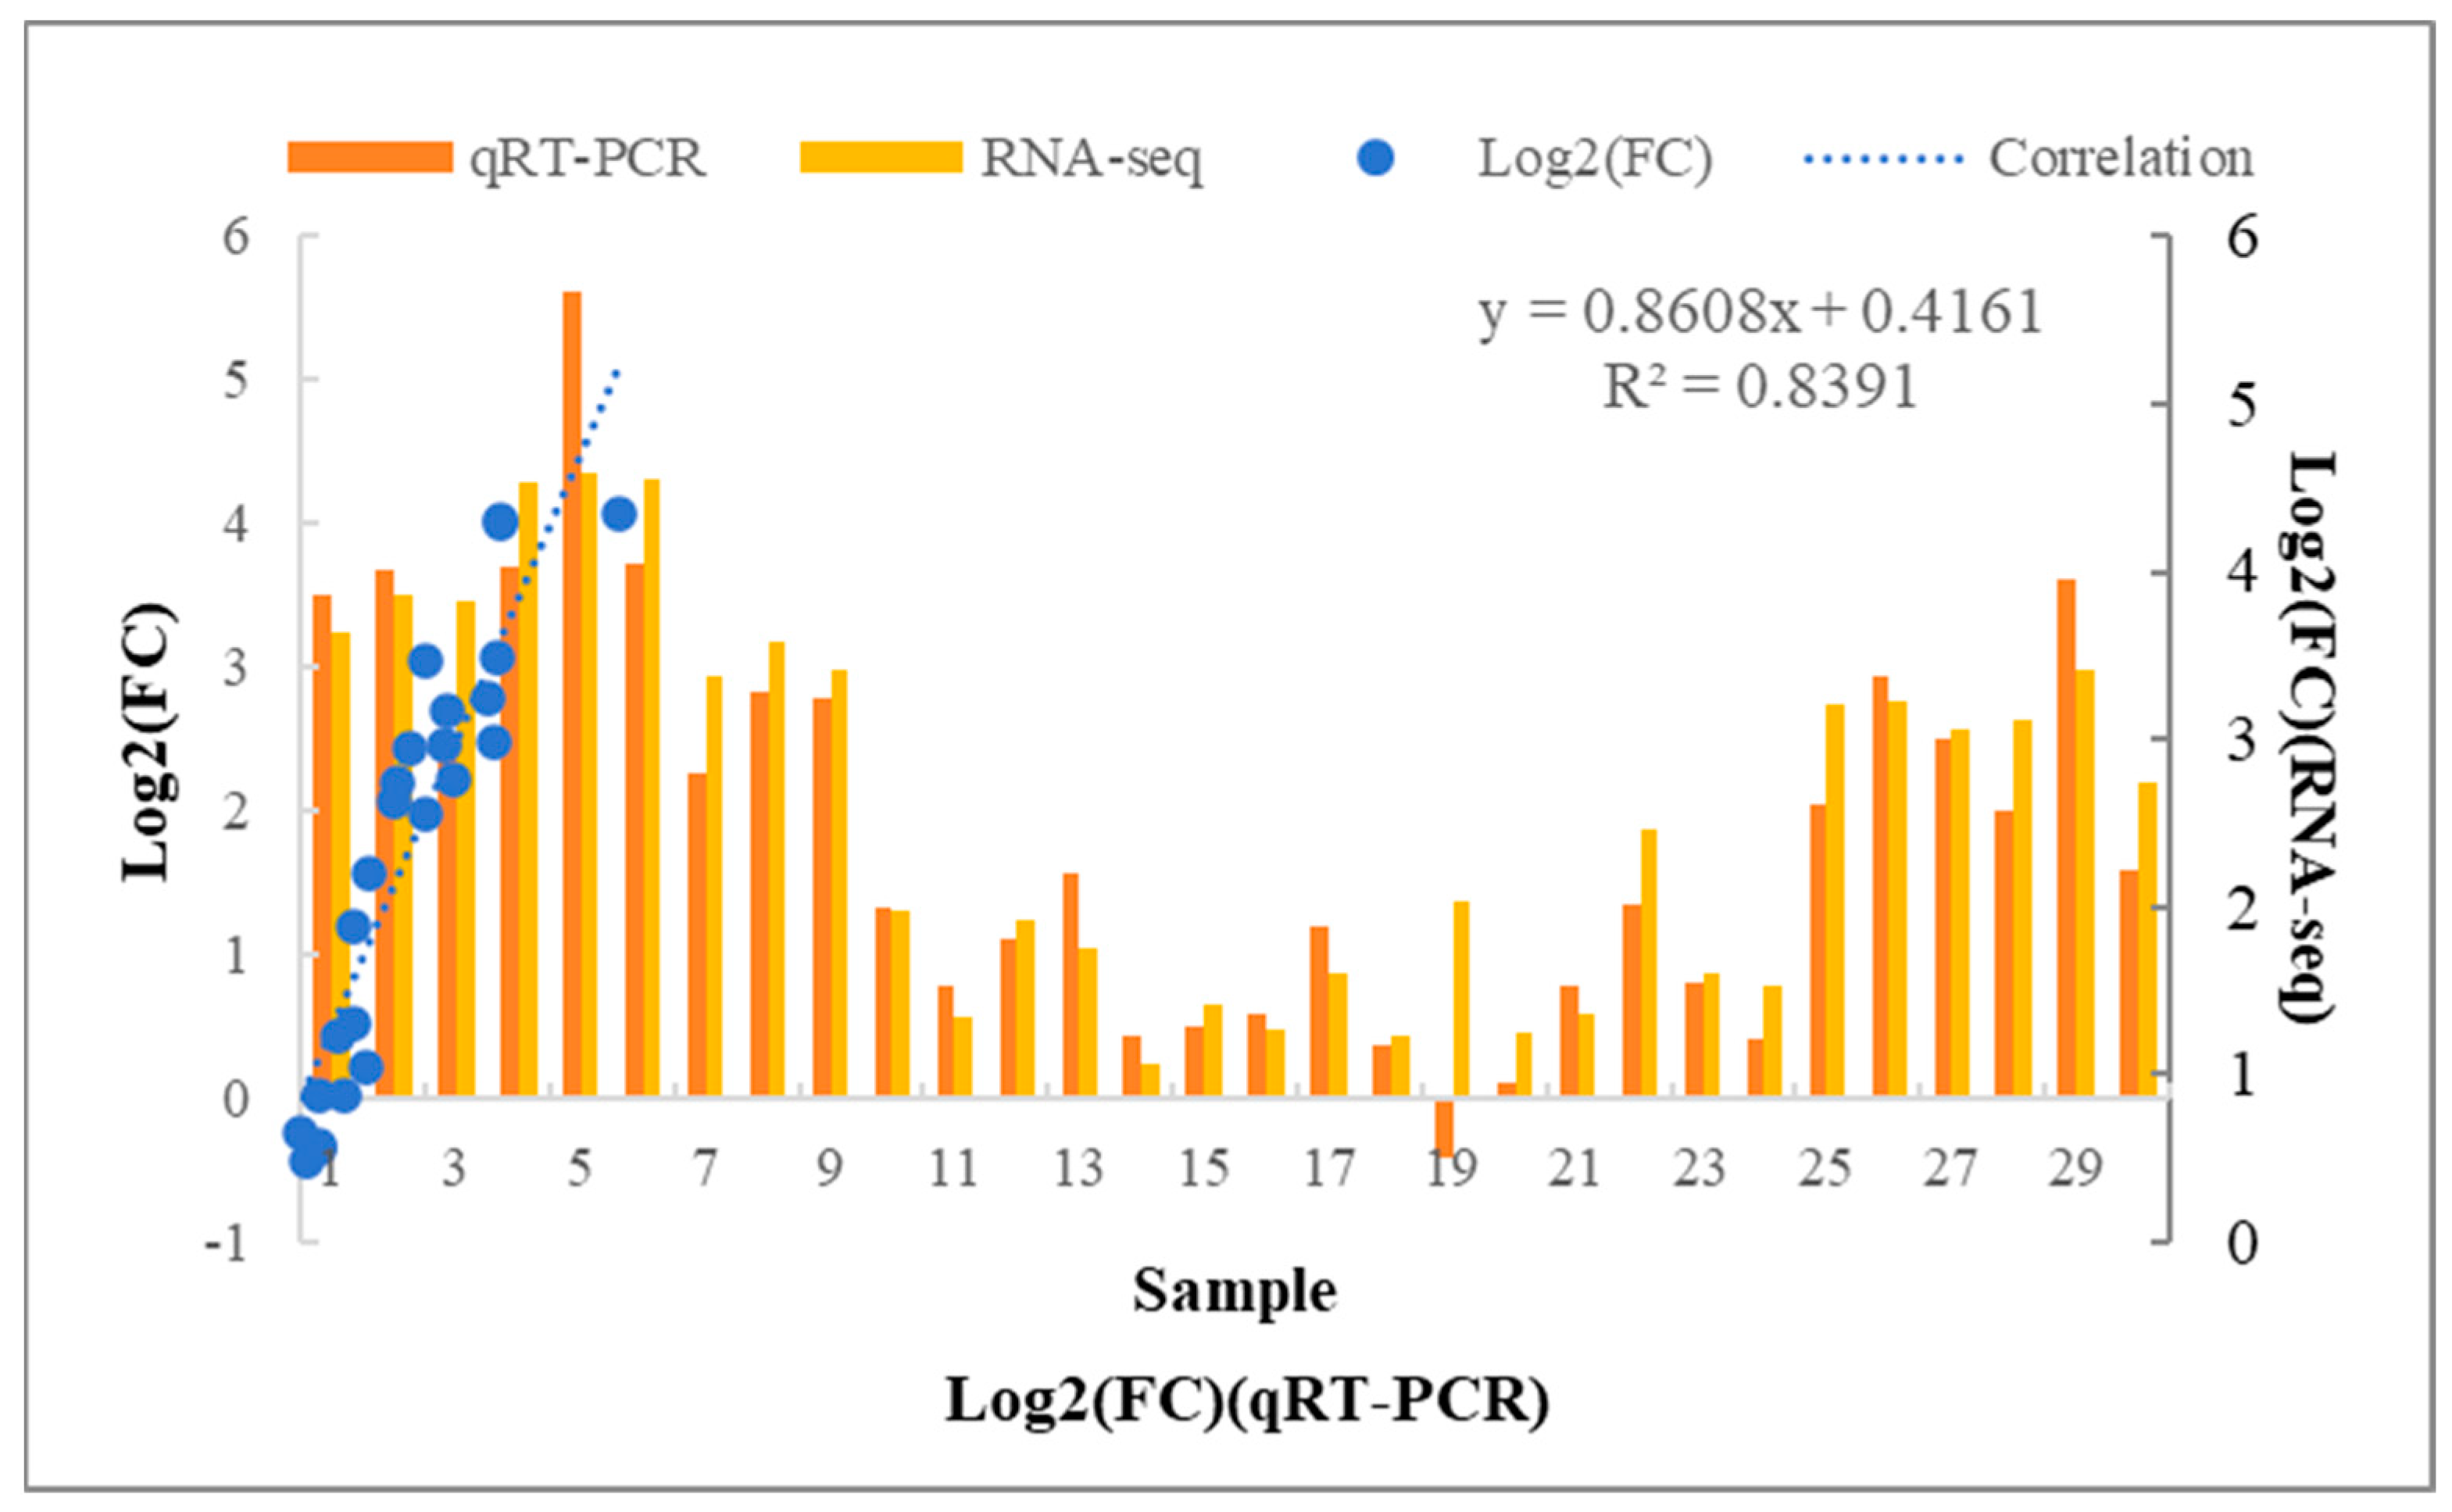
3.7. qRT-PCR Validation

To ascertain the reliability of the RNA-seq findings, a validation process was performed using quantitative real-time polymerase chain reaction (qRT-PCR). For this validation, a set of 10 genes was randomly chosen. The results of qRT-PCR analysis demonstrated that the observed expression trends were highly congruent with the RNA-seq data (as presented in Figure 9). A significantly positive correlation between the RNA-seq and qRT-PCR data was revealed via linear regression analysis (as shown in Figure 10), which also confirmed the reliability of the transcriptomic analysis.

4. Discussion

It is widely acknowledged that the utilization of diverse genetic resources derived from various cultivars, coupled with well-defined genetic information, holds substantial importance in breeding new plant varieties. Several studies have underscored the significance of the chili pepper as an exceptionally valuable model system for assessing the efficacy, diversity, and effectiveness of plant defense mechanisms [8]. Nevertheless, the molecular mechanisms governing the modulation of chili pepper root systems in response to soilborne diseases remain unclear [31].
Hence, it is of profound significance to identify valuable genetic resources and pertinent insights from chili peppers, a species renowned for its extensive germplasm variability. In this study, we conducted a comprehensive analysis of the responses exhibited by the roots of two chili cultivars, Hailan 99 and Sanxiaqing, when subjected to disease treatment. Our findings revealed that these two cultivars exhibited diverse defense strategies when subjected to soilborne disease intervention.

4.1. Root Morphological Characteristics at Different Stages

The findings of our study indicate that the root system of the disease-resistant cultivar exhibited significantly enhanced development when subjected to stress treatments. This enhancement was evident in the form of higher germination rate, longer root length, greater root hair density, larger root volume, and expanded surface area [37]. These results are in agreements with the research conducted by Klein et al. in 2020, who reported that a root system characterized by thickness, branching, and depth, coupled with a high root-to-shoot ratio, can augment a plant’s resistance capabilities [38]. The increase in root length, root number, and root hair density is recognized for its role in expanding both root volume and rhizosphere volume, making it an optimal root system architecture and a successful strategy beneficial for both plants and rhizosphere bacteria [37,39].
These findings collectively suggest that the selected disease-resistant cultivar exhibits superior adaptation to stressful environmental conditions, employing more effective strategies for soil exploration and acquisition of edaphic resources. This adaptation was particularly suitable for further analysis. Additionally, the disease-resistant cultivar displayed a narrower root system architecture. A similar observation has been reported, and it has been proposed that a root ideotype characterized by narrow roots is well suited for efficient nitrogen acquisition [40,41]. It is conceivable that the disease-resistant cultivar employs a more efficient strategy to establish a favorable rhizosphere environment and enhance nutrient acquisition, which, in turn, contributes to its robust resistance against soilborne diseases. Clearly, it is important to determine the specific resistance strategy employed by disease-resistant cultivars.

4.2. Changes in Defense Processes among Different Chili Cultivars under Stress Treatments

Plants are continuously exposed to microbial invasions and, when environmental conditions surpass a plant’s adaptive capacity, programmed cell death becomes a triggered response. To ensure survival, plants have developed a highly efficient defense system, primarily aimed at minimizing damage at the site of invasion. In plants, the process of cell death associated with resistance is commonly referred to as the hypersensitivity response. Following pathogen invasion, three categories of genes play pivotal roles in genetic processes related to the hypersensitivity response. These categories encompass trigger genes responsible for initiating cell death responses, genes associated with regulating the extent of cell death, and genes involved in the integration of cell death mechanisms with other plant defense mechanisms [23]. Significantly, a greater number of DEGs were found in the disease-sensitive cultivar than in the disease-resistant cultivar under varying treatments. Many studies reported similar findings that the genes, especially involved in regulating responses to stimulus and biological regulation processes, usually maintained higher expression levels in the tolerant cultivars, regardless of the presence or absence of stress treatments, which exhibited highly stable gene expression levels in tolerant cultivars [42].

4.2.1. Transcriptional Changes Related to Effectors Recognized in Plants

It is reported that RPM1 and RPS2 play crucial roles in relation to effectors recognized in plant defense [23]. In Arabidopsis, the membrane protein RIN4 is targeted by three effector proteins, AvrRpt2, AvrRpm1, and AvrB. RIN4 interacts with non-race-specific disease resistance protein 1 within the plant, subsequently inducing the synthesis of salicylic acid [43]. RPM1 recognizes phosphorylated RIN4, which initiates the defense signaling pathway. In contrast, RPS2 typically forms a complex with RIN4 and, following the cleavage of RIN4 by AvrRpt2 protease, RPS2 is released, allowing it to activate the defense response [23,43,44].
In this study, we identified RPM1 (T459_29365) and RPS2 (T459_04053) genes. T459_29365 was upregulated in HT compared to HCK, while T459_04053 was upregulated in ST compared to HT. These findings shed light on disparities in the strategies employed for effector recognition between disease-sensitive and disease-resistant cultivars. Additionally, it is noteworthy that, in comparison to HT, a new gene (MSTRG.22201) related to HSP90A, implicated in the plant–pathogen interaction pathway, was significantly upregulated in ST. This observation suggests the potential role of HSP90A in bolstering the hypersensitive response [45]. Consequently, HSP90A may enhance effector recognition and trigger immunity in disease-resistant cultivars.

4.2.2. Transcriptional Changes Related to Immunity Trigger in Plants

The flow of ions plays a pivotal role in the hypersensitive response, with the transmembrane exchange of H+/K+ considered an initial indicator of the hypersensitive response, leading to apoplast alkalinization [23]. Research has demonstrated that the movement of calcium ions from the endoplasmic reticulum and organelles across the cytoplasmic membrane into the cytoplasm represents a complex and crucial initiation pathway for cell death [46,47]. A significant consequence of calcium ion flux is the generation of ROS, which can exert direct toxicity on cells and simultaneously function as signaling molecules [48]. In this study, we identified numerous DEGs that were significantly enriched in ion transport processes, including ‘calcium-transporting ATPase activity’, ‘calcium ion transmembrane transporter activity’, and ‘metal ion transmembrane transporter activity’.
However, it is noteworthy that a greater number of DEGs related to ion transport processes were identified in disease-sensitive groups than in disease-resistant groups, while a greater number of DEGs related to complex regulatory processes were identified in disease-resistant groups. This heightened initial immune response, characterized by the movement of numerous ions, increases the complexity of signal transduction and activates the plant defense system. Genes expressed at later stages of this process often encode proteins involved in modulating and integrating cell death mechanisms [23,49]. They assist in delivering proteins to proteasomes for degradation, which may promote plant defense by regulating negative regulatory factors or reactivating the defense system to recognize and respond to newly arriving pathogens [23]. These results suggest that, when suffering disease stress, defensive responses in the disease-sensitive and disease-resistant cultivars do not occur simultaneously. In comparison with disease-sensitive cultivars, it is plausible that the defense responses occur earlier in disease-resistant cultivars. Notably, the subsequent analyses confirmed this inference. First, a greater number of DEGs related to the negative regulation of metabolism were observed in SCK vs. ST. Second, genes enriched in the autophagy pathway were upregulated in ST compared to HT. Therefore, it will provide great information to investigate changes in defensive responses between disease-sensitive and disease-resistant chili cultivars at different developmental stages in the future research.

4.2.3. Transcriptional Changes Related to Modulating and Integrating the Extent of Cell Death

Plants possess a remarkable ability to rapidly synthesize and accumulate a diverse array of antimicrobial secondary metabolites as part of their response to adverse environmental conditions [50,51]. Secondary metabolites, such as phenols, including flavonoids, coumarins, monolignols, lignans, phenylpropanoids, and other volatile aromatics, have been extensively documented for their involvement in plant defense mechanisms [37].
The concept of an oxygen burst pertains to the rapid generation of a substantial quantity of ROS within a few hours of pathogen infection, serving as a trigger for the hypersensitive response and subsequent cell death [48]. In our study, we identified numerous genes that were significantly enriched in processes related to ROS metabolism, biosynthesis of toxic substances, and secondary metabolites. Notably, a new gene encoding 4-coumarate-CoA ligase (MSTRG.26158), involved in the phenylpropanoid biosynthesis pathway, was upregulated in ST compared to HT. This gene plays a pivotal role in the phenylpropanoid pathway and regulates the abundance of all phenolic compounds [23], which, in turn, governs disease resistance. These findings strongly suggest that the upregulation of key genes related to secondary metabolites may serve as a driving force in modulating and integrating the extent of cell death, ultimately enabling disease-resistant chili cultivars to successfully limit harm at the site of pathogen invasion under soilborne disease conditions.

5. Conclusions

In response to soilborne disease intervention, Hailan 99 and Sanxiaqing exhibited distinct root system characteristics and development patterns, indicative of divergent defense strategies. The heightened adaptability of the disease-resistant cultivar can be attributed to its more rapid recognition of pathogenic effectors and subsequent activation of precise defense responses. This swift and well-regulated response effectively confines infection to a localized site, impeding disease progression. Several genes identified in this study are considered potential key factors in soilborne disease resistance. Notably, T459_04053 was implicated in effector recognition, whereas MSTRG.26158, MSTRG.30886, and T459_22510 were associated with the biosynthesis of secondary metabolites. Additionally, T459_05615, linked to the autophagy pathway, and various other DEGs involved in effector recognition, immunity triggering, and modulation of cell death processes are likely contributors to improved soilborne disease resistance. The identification of these valuable genes within chili peppers holds promise for enhancing soilborne disease resistance, not only in chili plants but also in a broader spectrum of plant crops.

Supplementary Materials

The following supporting information can be downloaded at: https://www.mdpi.com/article/10.3390/horticulturae9121267/s1, Table S1: Description and sequence of housekeeping gene used for qRT-PCR validation; Table S2: Primers used for qRT-PCR validation; Table S3: Data filtering statistics of transcriptome data; Table S4: Quality control analysis of transcriptome data; Table S5: Gene testing statistics of transcriptome data. Table S6-1–4: The top 20 GO terms derived from different treatments; Table S7-1–4: The top 20 KEGG pathways derived from different treatments.

Author Contributions

Y.Z., Z.C., F.C. and J.Y. designed the experiments. Y.Z., Z.C., F.C. and J.Y. performed most of the experiments; J.W.(Junyu Wu), J.W.( Jie Wang) and S.G. performed the rest of experiments; Y.Z. and Z.C. analyzed the data; Y.Z. and F.C. drafted the paper, Y.Z. and J.Y. reviewed and revised the paper. All authors have read and agreed to the published version of the manuscript.

Funding

This research was funded by Guizhou Provincial Department of Education Youth Science and Technology Talent Development Project (QJH-KYZ [2019]098); Doctoral Research Start-up Fund project of Guiyang University (0221001002010133); Special Fund for Scientific Innovation Strategy-construction of High Leveled Academy of Agricultural Sciences (R2021YJ-YB2004, R2023PY-JX007); Special Funding of Guiyang Science and Technology Bureau (GYU-KYZ(2019-2020)ZZ-02); and College Student Innovation and Entrepreneurship Training Program (0223003005010001004) for financial support.

Data Availability Statement

All the sequencing data were deposited in the National Center for Biotechnology Information (NCBI) Sequence Read Archive (SRA) database under the accession number SAMN37654853-SAMN37654864, as associated with the PRJNA1023474.

Acknowledgments

The authors would like to thank Gene Denovo Biotechnology Co. (Guangzhou, China) for assistance with raw data processing and bioinformatics analyses.

Conflicts of Interest

The authors declare no conflict of interest.

References

  1. Jarret, R.L.; Barboza, G.E.; da Costa Batista, F.R.; Berke, T.; Chou, Y.; Hulse-Kemp, A.; Ochoa-Alejo, N.; Tripodi, P.; Veres, A.; Garcia, C.C.; et al. Capsicum-An Abbreviated Compendium. J. Am. Soc. Hortic. Sci. 2019, 144, 3–22. [Google Scholar] [CrossRef]
  2. Herath, H.M.S.N.; Rafii, M.Y.; Ismail, S.I.; JJ., N.; Ramlee, S.I. Improvement of Important Economic Traits in Chilli through Heterosis Breeding: A Review. J. Hortic. Sci. Biotechnol. 2021, 96, 14–23. [Google Scholar] [CrossRef]
  3. Karim, K.M.R.; Rafii, M.Y.; Misran, A.B.; Ismail, M.F.B.; Harun, A.R.; Khan, M.M.H.; Chowdhury, M.F.N. Current and Prospective Strategies in the Varietal Improvement of Chilli (Capsicum annuum L.) Specially Heterosis Breeding. Agronomy 2021, 11, 2217. [Google Scholar] [CrossRef]
  4. Yin, J.; Jackson, K.L.; Candole, B.L.; Csinos, A.S.; Langston, D.B.; Ji, P. Aggressiveness and Diversity of Phytophthora Capsici on Vegetable Crops in Georgia. Ann. Appl. Biol. 2012, 160, 191–200. [Google Scholar] [CrossRef]
  5. Majid, M.U.; Awan, M.F.; Fatima, K.; Tahir, M.S.; Ali, Q.; Rashid, B.; Rao, A.Q.; Nasir, I.A.; Husnain, T. Phytophthora Capsici on Chilli Pepper (Capsicum annuum L.) and Its Management through Genetic and Bio-Control: A Review. Zemdirb.-Agric. 2016, 103, 419–430. [Google Scholar] [CrossRef]
  6. Sanogo, S.; Ji, P. Water Management in Relation to Control of Phytophthora capsici in Vegetable Crops. Agric. Water Manag. 2013, 129, 113–119. [Google Scholar] [CrossRef]
  7. Naves, E.R.; de Ávila Silva, L.; Sulpice, R.; Araújo, W.L.; Nunes-Nesi, A.; Peres, L.E.P.; Zsögön, A. Capsaicinoids: Pungency beyond Capsicum. Trends Plant Sci. 2019, 24, 109–120. [Google Scholar] [CrossRef]
  8. de Jesus Luna-Ruiz, J.; Nabhan, G.P.; Aguilar-Meléndez, A. Shifts in Plant Chemical Defenses of Chile Pepper (Capsicum annuum L.) Due to Domestication in Mesoamerica. Front. Ecol. Evol. 2018, 6, 48. [Google Scholar] [CrossRef]
  9. Djian-Caporalino, C.; Palloix, A.; Fazari, A.; Marteu, N.; Barbary, A.; Abad, P.; Sage-Palloix, A.-M.; Mateille, T.; Risso, S.; Lanza, R.; et al. Pyramiding, Alternating or Mixing: Comparative Performances of Deployment Strategies of Nematode Resistance Genes to Promote Plant Resistance Efficiency and Durability. BMC Plant Biol. 2014, 14, 53. [Google Scholar] [CrossRef]
  10. Parisi, M.; Alioto, D.; Tripodi, P. Overview of Biotic Stresses in Pepper (Capsicum spp.): Sources of Genetic Resistance, Molecular Breeding and Genomics. Int. J. Mol. Sci. 2020, 21, 2587. [Google Scholar] [CrossRef]
  11. Pitrat, M. Vegetable Crops in the Mediterranean Basin with an Overview of Virus Resistance. In Advances in Virus Research, Viruses and Virus Diseases of Vegetables in the Mediterranean Basin; Génétique et Amélioration des Fruits et Légumes; Academic Press: Montfavet, France, 2012; pp. 1–29. [Google Scholar]
  12. Ramchiary, N.; Kehie, M.; Brahma, V.; Kumaria, S.; Tandon, P. Application of Genetics and Genomics towards Capsicum Translational Research. Plant Biotechnol. Rep. 2014, 8, 101–123. [Google Scholar] [CrossRef]
  13. Wang, D.; Bosland, P.W. The genes of Capsicum. HortScience 2006, 41, 1169–1187. [Google Scholar] [CrossRef]
  14. Feng, B.; Li, P.; Wang, H.; Zhang, X. Functional Analysis of Pcpme6 from Oomycete Plant Pathogen Phytophthora capsici. Microb. Pathog. 2010, 49, 23–31. [Google Scholar] [CrossRef] [PubMed]
  15. Zheng, Z.; Nonomura, T.; Appiano, M.; Pavan, S.; Matsuda, Y.; Toyoda, H.; Wolters, A.-M.A.; Visser, R.G.F.; Bai, Y. Loss of Function in Mlo Orthologs Reduces Susceptibility of Pepper and Tomato to Powdery Mildew Disease Caused by Leveillula taurica. PLoS ONE 2013, 8, e70723. [Google Scholar] [CrossRef] [PubMed]
  16. Sarowar, S.; Kim, E.N.; Kim, Y.J.; Ok, S.H.; Kim, K.D.; Hwang, B.K.; Shin, J.S. Overexpression of a Pepper Ascorbate Peroxidase-like 1 Gene in Tobacco Plants Enhances Tolerance to Oxidative Stress and Pathogens. Plant Sci. 2005, 169, 55–63. [Google Scholar] [CrossRef]
  17. Sarowar, S.; Kim, Y.J.; Kim, E.N.; Kim, K.D.; Choi, J.Y.; Hyung, N.I.; Shin, J.S. Constitutive Expression of Two Pathogenesis-Related Genes in Tomato Plants Enhanced Resistance to Oomycete Pathogen Phytophthora capsici. Plant Cell Tissue Organ Cult. 2006, 86, 7–14. [Google Scholar] [CrossRef]
  18. Oh, S.K.; Baek, K.H.; Seong, E.S.; Joung, Y.H.; Choi, G.J.; Park, J.M.; Cho, H.S.; Kim, E.A.; Lee, S.; Choi, D. CaMsrB2, Pepper Methionine Sulfoxide Reductase B2, Is a Novel Defense Regulator against Oxidative Stress and Pathogen Attack. Plant Physiol. 2010, 154, 245–261. [Google Scholar] [CrossRef] [PubMed]
  19. Zhang, Y.L.; Jia, Q.L.; Li, D.W.; Wang, J.E.; Yin, Y.X.; Gong, Z.H. Characteristic of the Pepper CaRGA2 Gene in Defense Responses against Phytophthora capsici Leonian. Int. J. Mol. Sci. 2013, 14, 8985–9004. [Google Scholar] [CrossRef]
  20. Van der Ent, S.; Van Wees, S.C.M.; Pieterse, C.M.J. Jasmonate Signaling in Plant Interactions with Resistance-Inducing Beneficial Microbes. Phytochemistry 2009, 70, 1581–1588. [Google Scholar] [CrossRef]
  21. Hong, J.K.; Choi, H.W.; Hwang, I.S.; Kim, D.S.; Kim, N.H.; Choi, D.S.; Kim, Y.J.; Hwang, B.K. Function of a Novel GDSL-Type Pepper Lipase Gene, CaGLIP1, in Disease Susceptibility and Abiotic Stress Tolerance. Planta 2008, 227, 539–558. [Google Scholar] [CrossRef]
  22. Choi, H.W.; Hwang, B.K. The Pepper Extracellular Peroxidase CaPO2 Is Required for Salt, Drought and Oxidative Stress Tolerance as Well as Resistance to Fungal Pathogens. Planta 2012, 235, 1369–1382. [Google Scholar] [CrossRef]
  23. Buchanan, B.; Gruissem, W.; Jones, R.L. Biochemistry & Molecular Biology of Plants; Science Press: Beijing, China, 2021; pp. 938–997, 1124–1149. [Google Scholar]
  24. Lee, S.C.; Hwang, B.K. CASAR82A, a Pathogen-Induced Pepper SAR8.2, Exhibits an Antifungal Activity and Its Overexpression Enhances Disease Resistance and Stress Tolerance. Plant Mol. Biol. 2006, 61, 95–109. [Google Scholar] [CrossRef] [PubMed]
  25. Ko, M.K.; Jeon, W.B.; Kim, K.S.; Lee, H.H.; Seo, H.H.; Kim, Y.S.; Oh, B.-J. A Colletotrichum Gloeosporioides-Induced Esterase Gene of Nonclimacteric Pepper (Capsicum annuum) Fruit during Ripening Plays a Role in Resistance against Fungal Infection. Plant Mol. Biol. 2005, 58, 529–541. [Google Scholar] [CrossRef] [PubMed]
  26. Cho, K.C.; Han, Y.J.; Kim, S.J.; Lee, S.S.; Kim, J.I. Resistance to rhizoctonia solani ag-2-2 (IIIB) in creeping bentgrass plants transformed with pepper esterase gene pepest. Plant Pathol. 2011, 60, 631–639. [Google Scholar] [CrossRef]
  27. Kraft, K.H.; Brown, C.H.; Nabhan, G.P.; Luedeling, E.; de Jesus Luna-Ruiz, J.; Coppens d’Eeckenbrugge, G.; Hijmans, R.J.; Gepts, P. Multiple Lines of Evidence for the Origin of Domesticated Chili Pepper, Capsicum annuum, in Mexico. Proc. Natl. Acad. Sci. USA 2014, 111, 6165–6170. [Google Scholar] [CrossRef] [PubMed]
  28. Carrizo García, C.; Barfuss, M.H.J.; Sehr, E.M.; Barboza, G.E.; Samuel, R.; Moscone, E.A.; Ehrendorfer, F. Phylogenetic Relationships, Diversification and Expansion of Chili Peppers (Capsicum, Solanaceae). Ann. Bot. 2016, 118, 35–51. [Google Scholar] [CrossRef]
  29. Potters, G.; Pasternak, T.P.; Guisez, Y.; Jansen, M.A.K. Different Stresses, Similar Morphogenic Responses: Integrating a Plethora of Pathways. Plant Cell Environ. 2009, 32, 158–169. [Google Scholar] [CrossRef] [PubMed]
  30. Potters, G.; Pasternak, T.P.; Guisez, Y.; Palme, K.J.; Jansen, M.A.K. Stress-Induced Morphogenic Responses: Growing out of Trouble? Trends Plant Sci. 2007, 12, 98–105. [Google Scholar] [CrossRef]
  31. Villalobos, D.P.; Hardtke, C.S. Natural genetic variation of root system architecture from arabidopsis to brachypodium: Towards adaptive value. Philos. Trans. R. Soc. Lond. B Biol. 2012, 367, 1552–1558. [Google Scholar] [CrossRef]
  32. Osmont, K.S.; Sibout, R.; Hardtke, C.S. Hidden Branches: Developments in Root System Architecture. Annu. Rev. Plant Biol. 2007, 58, 93–113. [Google Scholar] [CrossRef]
  33. Aiken, R.M.; Smucker, A.J.M. Root System Regulation of Whole Plant Growth. Annu. Rev. Phytopathol. 1996, 34, 325–346. [Google Scholar] [CrossRef]
  34. Martinez, L.; Pouvreau, J.-B.; Montiel, G.; Jestin, C.; Delavault, P.; Simier, P.; Poulin, L. Soil Microbiota Promotes Early Developmental Stages of Phelipanche ramosa L. Pomel during Plant Parasitism on Brassica napus L. Plant Soil 2023, 483, 667–691. [Google Scholar] [CrossRef]
  35. Lechat, M.M.; Pouvreau, J.B.; Peron, T.; Gauthier, M.; Montiel, G.; Veronesi, C.; Todoroki, Y.; Le Bizec, B.; Monteau, F.; Macherel, D.; et al. PrCYP707A1, an ABA Catabolic Gene, Is a Key Component of Phelipanche Ramosa Seed Germination in Response to the Strigolactone Analogue GR24. J. Exp. Bot. 2012, 63, 5311–5322. [Google Scholar] [CrossRef] [PubMed]
  36. Kim, S.; Park, M.; Yeom, S.-I.; Kim, Y.-M.; Lee, J.M.; Lee, H.-A.; Seo, E.; Choi, J.; Cheong, K.; Kim, K.-T.; et al. Genome Sequence of the Hot Pepper Provides Insights into the Evolution of Pungency in Capsicum Species. Nat. Genet. 2014, 46, 270–278. [Google Scholar] [CrossRef] [PubMed]
  37. Rouhallah, S.; Choong, M.R. Revisiting bacterial volatile-mediated plant growth promotion: Lessons from the past and objectives for the future. Ann. Bot. 2018, 122, 349–358. [Google Scholar]
  38. Klein, S.P.; Schneider, H.M.; Perkins, A.C.; Brown, K.M.; Lynch, J.P. Multiple Integrated Root Phenotypes Are Associated with Improved Drought Tolerance. Plant Physiol. 2020, 183, 1011–1025. [Google Scholar] [CrossRef] [PubMed]
  39. Pii, Y.; Mimmo, T.; Tomasi, N.; Terzano, R.; Cesco, S.; Crecchio, C. Microbial Interactions in the Rhizosphere: Beneficial Influences of Plant Growth-Promoting Rhizobacteria on Nutrient Acquisition Process. A Review. Biol. Fertil. Soils 2015, 51, 403–415. [Google Scholar] [CrossRef]
  40. Lynch, J.P. Harnessing Root Architecture to Address Global Challenges. Plant J. 2022, 109, 415–431. [Google Scholar] [CrossRef]
  41. Zinta, R.; Tiwari, J.K.; Buckseth, T.; Thakur, K.; Goutam, U.; Kumar, D.; Challam, C.; Bhatia, N.; Poonia, A.K.; Naik, S.; et al. Root system architecture for abiotic stress tolerance in potato: Lessons from plants. Front. Plant Sci. 2022, 13, 926214. [Google Scholar] [CrossRef]
  42. Zhang, Y.; Gao, X.; Li, J.; Gong, X.; Yang, P.; Gao, J.; Wang, P.; Feng, B. Comparative Analysis of Proso Millet (Panicum miliaceum L.) Leaf Transcriptomes for Insight into Drought Tolerance Mechanisms. BMC Plant Biol. 2019, 19, 397. [Google Scholar] [CrossRef]
  43. Belkhadir, Y.; Nimchuk, Z.; Hubert, D.A.; Mackey, D.; Dangl, J.L. Arabidopsis RIN4 Negatively Regulates Disease Resistance Mediated by RPS2 and RPM1 Downstream or Independent of the NDR1 Signal Modulator and Is Not Required for the Virulence Functions of Bacterial Type III Effectors AvrRpt2 or AvrRpm1. Plant Cell 2004, 16, 2822–2835. [Google Scholar] [CrossRef]
  44. Li, Z.; Huang, J.; Wang, Z.; Meng, F.; Zhang, S.; Wu, X.; Zhang, Z.; Gao, Z. Overexpression of Arabidopsis Nucleotide-Binding and Leucine-Rich Repeat Genes RPS2 and RPM1 (D505V) Confers Broad-Spectrum Disease Resistance in Rice. Front. Plant Sci. 2019, 10, 417. [Google Scholar] [CrossRef]
  45. Jackson, S.E. Hsp90: Structure and Function. In Topics in Current Chemistry, Molecular Chaperones; Springer: Berlin/Heidelberg, Germany, 2012; pp. 155–240. [Google Scholar]
  46. Khlopkov, A.; Sherstneva, O.; Ladeynova, M.; Grinberg, M.; Yudina, L.; Sukhov, V.; Vodeneev, V. Participation of Calcium Ions in Induction of Respiratory Response Caused by Variation Potential in Pea Seedlings. Plant Signal. Behav. 2021, 16, 1869415. [Google Scholar] [CrossRef] [PubMed]
  47. Otulak, K.; Garbaczewska, G. Cellular Localisation of Calcium Ions during Potato Hypersensitive Response to Potato Virus Y. Micron 2011, 42, 381–391. [Google Scholar] [CrossRef] [PubMed]
  48. Apel, K.; Hirt, H. Reactive Oxygen Species: Metabolism, Oxidative Stress, and Signal Transduction. Annu. Rev. Plant Biol. 2004, 55, 373–399. [Google Scholar] [CrossRef] [PubMed]
  49. Burke, R.; Schwarze, J.; Sherwood, O.L.; Jnaid, Y.; McCabe, P.F.; Kacprzyk, J. Stressed to Death: The Role of Transcription Factors in Plant Programmed Cell Death Induced by Abiotic and Biotic Stimuli. Front. Plant Sci. 2020, 11, 1235. [Google Scholar] [CrossRef]
  50. Bailly, A.; Groenhagen, U.; Schulz, S.; Geisler, M.; Eberl, L.; Weisskopf, L. The Inter-kingdom Volatile Signal Indole Promotes Root Development by Interfering with Auxin Signalling. Plant J. 2014, 80, 758–771. [Google Scholar] [CrossRef] [PubMed]
  51. Castulo-Rubio, D.Y.; Alejandre-Ramírez, N.A.; del Carmen Orozco-Mosqueda, M.; Santoyo, G.; Macías-Rodríguez, L.I.; Valencia-Cantero, E. Volatile Organic Compounds Produced by the Rhizobacterium Arthrobacter agilis UMCV2 Modulate Sorghum bicolor (Strategy II Plant) Morphogenesis and SbFRO1 Transcription In Vitro. J. Plant Growth Regul. 2015, 34, 611–623. [Google Scholar] [CrossRef]
Figure 1. Germination rates changes under different treatments of Hailan 99 and Sanxiaqing. Hailan 99 and Sanxiaqing seeds were subjected to 20% (w/w) soil extract solution (treatments, HT and ST, respectively) or kept in water (control, HCK and SCK, respectively). After treatments for 7 days, germination rates from different cultivars under different treatments were identified. All data are shown as mean value. Different lowercase letters indicate significant differences between treatments (Duncan test; p < 0.05).
Horticulturae 09 01267 g001
Figure 2. Different performance of Hailan 99 and Sanxiaqing under different treatments at germination stage. (a) Germination performance of Hailan 99 under control. (b) Germination performance of Sanxiaqing under control. (c) Germination performance of Hailan 99 subjected to 20% (w/w) soil extracts solution. (d) Germination performance of Sanxiaqing subjected to 20% (w/w) soil extract solution.
Horticulturae 09 01267 g002
Figure 3. Root morphological characteristics of Hailan 99 and Sanxiaqing under different treatments at germination stage (microscopic image 4×). (a) Root morphological characteristics of Hailan 99 under control condition at germination stage. (b) Root morphological characteristics of Hailan 99 subjected to 20% (w/w) soil extract solution at germination stage. (c) Root morphological characteristics of Sanxiaqing under control condition at germination stage. (d) Root morphological characteristics of Sanxiaqing subjected to 20% (w/w) soil extract solution at germination stage.
Horticulturae 09 01267 g003
Figure 4. Root diagram of Hailan 99 and Sanxiaqing under different treatments at seedling stage. (a) Root diagram of Hailan 99 under control condition at seedling stage. (b) Root diagram of Sanxiaqing under control condition at seedling stage. (c) Root diagram of Hailan 99 subjected to 20% (w/w) soil extract solution at seedling stage. (d) Root diagram of Sanxiaqing subjected to 20% (w/w) soil extract solution at seedling stage.
Horticulturae 09 01267 g004
Figure 5. Summary of the number of differentially expressed genes (DEGs) in the presence and absence of soilborne disease interventions. DEGs were selected based on a cut-off of FDR ≤ 0.05 and |log2 FC| ≥ 1.
Horticulturae 09 01267 g005
Figure 6. GO enrichment circular of the top 20 GO terms derived from DEGs in different treatments. (a) The top 20 GO terms derived from HCK vs. HT; (b) the top 20 GO terms derived from SCK vs. ST; (c) the top 20 GO terms derived from HCK vs. SCK; (d) the top 20 GO terms derived from HT vs. ST. Circle 1: the first 20 GO terms derived from DEGs; the co-ordinate of the number of DEGs exhibited outside the circle; different colors represent different ontologies. Circle 2: the number of DEGs of this GO term and their Q-values; the higher the number of DEGs, the longer the bar shape; the smaller the Q-value, the redder the color. Circle 3: the ratio of up-/downregulated DEGs exhibited by the bar chart; dark purple represents upregulated genes and light purple represents downregulated genes; the specific value is displayed below. Circle 4: rich factor of each GO term; based on background grid lines, each cell represents 0.1.
Horticulturae 09 01267 g006
Figure 7. KEGG enrichment circle of the top 20 KEGG pathways derived from DEGs in different treatments. (a) The top 20 KEGG pathways derived from HCK vs. HT; (b) the top 20 KEGG pathways derived from SCK vs. ST; (c) the top 20 KEGG pathways derived from HCK vs. SCK; (d) the top 20 KEGG pathways derived from HT vs. ST. Circle 1: the first 20 KEGG pathways derived from DEGs; the co-ordinate of the number of DEGs exhibited outside the circle; different colors represent different KEGG-A-Class. Circle 2: the number of DEGs of this KEGG pathway and their Q-values; the higher the number of DEGs, the longer the bar shape; the smaller the Q-value, the redder the color. Circle 3: the ratio of up-/downregulated DEGs exhibited by the bar chart; dark purple represents upregulated genes and light purple represents downregulated genes; the specific value is displayed below. Circle 4: rich factor of each KEGG pathway; based on background grid lines, each cell represents 0.1.
Horticulturae 09 01267 g007
Figure 8. Co-expression network analysis of the DEGs in different treatments. Different colors correspond to different betweennessl values, with darker shades indicating larger betweenness. (a) Genes in Module 1 appeared to be related to the regulation of enzyme activity; (b) genes in Module 2 were associated with molecular binding; (c) genes in Module 3 were linked to transport. The protein–protein interaction network analysis was conducted between HT and ST using String v10 and Cytoscape (v3.7.1). Based on the threshold values of betweenness > 70, closeness > 0.002, and degree > 10. The DEGs from HT vs. ST were clustered into 3 modules.
Horticulturae 09 01267 g008
Figure 9. Expression patterns of 10 candidate transcripts measured in Hailan 99 and Sanxiaqing via qRT-PCR and RNA-seq.
Horticulturae 09 01267 g009
Figure 10. Correlation between qRT-PCR and RNA-seq based on their respective data from the 10 candidate genes.
Horticulturae 09 01267 g010
Table 1. Root system traits of Hailan 99 and Sanxiaqing under different treatments at seedling stage.
TreatmentsRoot Length
(cm)
Surface Area (cm2)Average Diameter (mm)Volume (cm3)Total TipsDry Weight (g)
HCK70.7 ± 2.560 a24.8 ± 3.065 a1.17 ± 0.055 a0.94 ± 0.048 a47 ± 2.517 a0.015 ± 0.003 a
SCK59.8 ± 3.750 b22.1 ± 1.702 a1.16 ± 0.036 a0.85 ± 0.020 b39 ± 1.528 b0.014 ± 0.003 ab
HT17.2 ± 1.657 d5.5 ± 1.541 b0.62 ± 0.089 b0.09 ± 0.007 c15 ± 1.732 d0.009 ± 0.002 b
ST28.0 ± 1.976 c7.6 ± 1.630 b0.60 ± 0.019 b0.12 ± 0.013 c21 ± 1.528 c0.010 ± 0.002 ab
± All data are shown as mean ± standard error. Different lowercase letters indicate significant differences between treatments (Duncan test; p < 0.05).
Disclaimer/Publisher’s Note: The statements, opinions and data contained in all publications are solely those of the individual author(s) and contributor(s) and not of MDPI and/or the editor(s). MDPI and/or the editor(s) disclaim responsibility for any injury to people or property resulting from any ideas, methods, instructions or products referred to in the content.

