Abstract
Floral fragrance, as one of the evaluation indicators for ornamental plants, influences people’s perception of these plants. To explore the volatile compounds and their application value in different parts of Iris typhifolia and to investigate the contributions of each part to the floral aroma, an AIRSENSE electronic nose, principal component analysis (PCA), linear discriminant analysis (LDA), and loading analysis (Loading) are employed to study the differences in floral components among the various parts. Samples from the stamen, pistil, flag petal, and pendant petal are qualitatively and quantitatively analyzed using solid-phase microextraction (SPME) and gas chromatography–mass spectrometry (GC-MS) techniques, combined with spectral library retrieval, cluster analysis, and Odor Activity Value (OAV) calculation. The results show that the electronic nose significantly distinguished the aromas from different parts, and there are significant differences in aroma composition. Through cluster analysis and OAV calculation, it is found that the pistil makes the primary contribution to the floral profile of Iris typhifolia, due to the presence of caproaldehyde, 2-methoxy-3-sec-butylpyrazine, and abundant terpenes. This research provides a valuable reference for reconstructing the floral aroma profile, extracting bioactive substances, and exploring aromatherapy with Iris typhifolia.
1. Introduction
Floral fragrances are composed of various secondary metabolites emitted by natural flowers; thus, a unique aroma is given. Floral fragrance plays a crucial role in attracting pollinators, communicating with them [1], enhancing plant esthetics, and contributing to the secondary metabolism of ornamental plants. Iris, one of the “three root-rooted flowers in the world”, is a well-known fragrant flower with significant decorative value [2,3,4]. Iris typhifolia Kitag, a perennial herb in the Iris family, is mainly distributed in Heilongjiang, Jilin, Liaoning, and Inner Mongolia in China. Due to its landscape value, Iris typhifolia is often used to decorate flower beds and edge meadows and can also be scattered in streams, pools, and lakes. It has a prominent role in regulating the microclimate, soil and water conservation, and wind and dust prevention and contributes to maintaining environmental balance, improving urban ecological environment, and enhancing community stability [5].
It is worth noting that Iris typhifolia can also produce a unique floral fragrance, which not only increases the ornamental value of flowers but also has high economic and medicinal value, such as being used to make perfume, soap, cosmetics, etc. As a tobacco additive, irisone can improve the flavor and quality of tobacco [6]. Therefore, it is crucial to determine the main fragrant parts of Iris typhifolia.
Currently, the primary methods for studying the components of Iris typhifolia are distillation extraction, gas chromatography–mass spectrometry (GC-MS), solid-phase microextraction (SPME), and electronic nose sniffing. For example, Baser et al. extracted the flower essential oils of Iris seudacorus and Iris kerneriana by distillation and detected 52 and 54 volatile components by GC-MS, among which the contents of alkanes and acids were the highest [7]. However, the distillation extraction process may lead to the loss of some substances, which cannot reflect the original components of flowers. In contrast, the solid-phase microextraction method simulates the release process of flowers in nature. This method requires fewer samples but is more efficient, convenient, and sensitive, making it promising to extract the volatile components of flowers [8]. A total of 75 compounds were detected from yellow Iris lutescens by SPME combined with GC-MS, while 69 compounds were detected from purple Iris lutescens, and it was found that terpenes were the main volatile components [9]. Yuan et al. applied SPME-GC-MS and found that the main volatile components of Iris barbata were caryophyllene, linalool, citronella, methyl cinnamate, β-cydene, rohanperene, methyl myristate, linalool acetate, isosafrole, nerolol, and geraniol [10].
So far, studies on the floral components of Iris typhifolia have only focused on the whole flower, without examining the separation of different parts of the flower, which greatly limits studies on the floral components of Iris typhifolia and is not conducive to the development and subsequent utilization of different fragrance varieties. In this study, we used solid-phase microextraction (SPME), gas chromatography–mass spectrometry (GC-MS), and an electronic nose to compare the volatile components of Iris typhifolia and determine the source of the fragrance-releasing substances of Iris typhifolia. The research results can identify the specific fragrance-releasing site of Iris typhifolia and lay a foundation for the future breeding of new varieties. The data involved in this study can be found in the Supplementary Materials.
2. Materials and Methods
2.1. Plant Materials
In this study, 8 Iris typhifolia bud stage samples, 8 bloom stage samples, and 8 decay stage samples were collected and used, while there were 24 stamen samples, 8 pistil samples, 8 flag petal samples, and 8 pendant petal samples that were isolated from the bloom stage of Iris typhifolia. Flower harvesting criteria during the bloom period: the flowers have transitioned from bud stage, with fully extended petals, and their edges have not yet begun to curl due to wilting.
Sampling methods: Wear disposable nitrile gloves and cut samples. Then, the samples were loaded into 50 mL sterile transparent plastic centrifuge tubes, which were pre-cooled with liquid nitrogen (centrifuge tubes and caps were deodorized with 75% ethanol in advance), and sealed with tin foil. After that, these tubes were tightened, marked, and placed in liquid nitrogen for temporary storage. Also, all samples were transferred to −80 °C ultra-low temperature refrigerator for freezing as soon as possible. All samples used in the experiment were collected from Cao Xinzhuang experimental farm of Northwest A&F University in Yangling, Shaanxi Province. The experimental farm belongs to the temperate continental climate, with an average altitude of 530 m and an average annual temperature of 12.9 °C. Samples were collected on the mornings of 28 and 29 April 2023. Experimental subjects were selected at the bloom stage, characterized by fully opened petals, rather than in bud form, with no observable inward curling or signs of withering at the petal edges. The plant specimens were in a healthy state, showing no indications of infestation by pests or diseases.
2.2. Research Methodology
2.2.1. Electronic Nose
The samples were placed in 15 mL bottles at room temperature. Wearing gloves and masks, the researchers were allowed to stand for 30 min in a quiet environment with no odors and a small number of participants. The aroma compositions were determined by the PEN3 electronic nose from AIRSENSE, Germany. The parameters of the electronic nose were set as follows: gas flow rate 400 mL/min, cleaning time 60 s, zeroing time 5 s, preparation time 5 s, and measurement time 120 s. The built-in WinMuster software on the PEN3 was used for data collection, measurement, and analysis. In the preliminary experiments, it was observed that the curve of the G/G0 ratio tends to stabilize toward the end of the injection period, so the data were analyzed by averaging the response values of the electronic nose from 115 s to 117 s. Three sets of replicates were made for each flowering stage, and each experiment was conducted to ensure that the height and relative position of the two probes in the bottle were as consistent as possible. In this context, the electronic nose response value is defined as the dimensionless ratio of the resistance value, G, of each sensor to the air resistance value, G0. The response of electronic nose sensors to different types of compounds is shown in Table 1.

Table 1.
Response characteristics of each sensor of PEN3 electronic nose.
2.2.2. SPME-GC-MS Analysis
SPME Condition: Place approximately 1.0 g of frozen stored sample in a 50 mL solid-phase microextraction vial and record the exact mass. Add 15 mL of saturated saline solution to immerse the sample. Seal the vial with aluminum foil and tighten the cap. And then add 10 μL of 2-nonanone at a concentration of 0.008 μL/mL using a micro-adjustable pipette against the wall at the bottom of the extraction bottle; after that, seal the mouth of the extraction bottle with tin foil and cap the extraction bottle. Utilize the SPME extraction head from German company Supelco, model DVB/CAR/PDMS, with a diameter of 50/30 um. Place the extraction vial in the center of a preheated constant-temperature extraction apparatus set to 40 °C and start the timer. After an equilibration period of 10 min, adjust the extraction head support to the appropriate position and insert the extraction head into the vial. Slide the knob to extend the fiber head 2 cm above the liquid surface and allow it to adsorb for 30 min at 40 °C. When the time is up, retract the fiber head, swiftly remove the adsorbed extraction head, and await injection into the gas chromatograph [11].
GC-MS Analysis: Insert the manual headspace injector into the GC-MS injection port, and after a 2.5-min equilibration period at 250 °C, the aroma components were fully released into the GC-MS system. The chromatographic column used was an Rtx-1MS (30 m × 0.32 mm × 0.25 μm) column with the following temperature settings: inlet temperature at 250 °C and initial column temperature at 40 °C for 2 min, followed by a linear increase at a rate of 8 °C/min to 130 °C for 4 min, and then a further increase at 15 °C/min to 250 °C for 3 min [12]. Nitrogen (99.999%) was employed as the carrier gas with a flow rate of 2.41 mL/min and a split ratio of 1:5. The mass spectrometry conditions included an electron impact (EI) ionization mode with an electron energy of 70 eV, ion source temperature of 200 °C, and interface temperature of 230 °C. Mass spectra were acquired in a scanning range from 45 to 450 atomic mass units (amu).
2.2.3. Identification and Analysis Methods
Qualitative method: Each individual component was retrieved and compared against the NIST 2017 mass spectrometry and standard information database, and their identification was cross-verified with the relevant literature. They were identified and analyzed together using the related literature. By using the carbon standard method and the same column as well as rising and cooling procedure as GC-MS, the mixed standard of C7-C30 normal alkane was used as the standard to calculate the linear retention index (Formula (1)) of various aroma components of Iris typhifolia samples. The results were compared with those of NIST spectrum database. Starting from the first stable peak according to the ion peak diagram, the stable peak corresponds to the first place of a variety of substances under the same RT value, and the selected substances should appear under the same RT value in the three basic biological repeats and rank in the top three.
LRI = 100 z + 100 (RT − RTz)/(RT (z + n) − RTz)
Quantitative method: Internal standard substance method. First, 2-nonone was selected as the internal standard material, and the density was 0.82 g/mL. The volume of the internal standard substance (μL) added was 10 times the sample mass (g) in numerical terms. All kinds of aroma components in the Iris typhifolia sample were quantized, (Formula (2)), and the average value was obtained after three biological repeats.
Mi = C0 × V0 × Ai ÷ (A0 × M)
In Formula (2), Mi is the content of each aroma component (μg/g), and C0 is the internal standard substance concentration (μg/μL), while V0 is the internal standard substance volume (μL). Ai is the peak area of the desired aroma component, A0 is the internal standard substance peak area, and M is the sample mass (g).
OAV value: the ratio of the mass concentration of the substance (Formula (3)) to the threshold value of the substance in water (Formula (4)) is regarded as a standard to evaluate the contribution of the substance to the overall aroma profile of the sample, thus selecting out the standard sample for aroma reconstruction from it, in which the substance with OAV ≥ 1 is the characteristic aroma component [13].
Ci = C0 × Ai ÷ A0
In Formula (3), Ci is the mass concentration of each aroma component (μg/mL), and C0 is the internal standard substance concentration (μg/μL). Ai and A0 are the peak area and internal standard substance peak area of the aroma component, respectively.
OAV = Ci ÷ OTi
In Formula (4), OTi is the threshold value of the aroma component in water (μg/mL) [14]. If there is no numerical value for the threshold of a compound in water, then the value of the closest medium by properties to water should be selected.
3. Results
Figure 1 shows the radar map of the characteristic response of Iris typhifolia during the bloom stage and each part of Iris typhifolia in the bloom stage. The resistance ratio of the response values of the volatile substances in the bloom stage and the different parts in the bloom stage to the 10 sensors is significantly different, with the response values ranging from 0 to 3.5. The response values of the volatile substances of the flag petal to W1S (broad–methane), W1W (sulphur–organic), and W2W (sulph–chlor) sensors are higher than those of other sensors, indicating that the volatiles in this stage mainly contain short-chain alkanes, inorganic sulfide, organic sulfide, and other substances. The response values of the pendant petal substances to W1S, W1W, W2W, and W3C (aromatic) sensors are relatively high, indicating that the volatiles in this stage include methyl compounds, inorganic sulfides, organic sulfides, ammonia, and other substances. W3C shows high response values only in the volatile material samples of the vertical lobe.
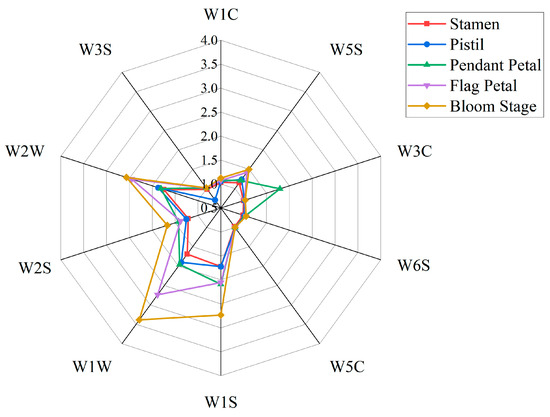
Figure 1.
Radar map of the characteristic response of the volatile components in Iris typhifolia.
The response values of the volatile substances in stamens to W1S, W1W, and W2W sensors are relatively high, indicating that the volatile substances in this stage contain methyl compounds, inorganic sulfides, and organic sulfides. The response values of pistil volatile substances to W1S, W1W, and W2W sensors are relatively high, showing that the volatile substances contain methyl compounds, inorganic sulfides, and organic sulfides in this stage.
In the bloom-stage Iris samples, the response values of W1S, W1W, W2S, and W2W sensors are higher than those of other sensors, which indicates that the volatile components in this stage mainly contain methane, inorganic sulfide, alcohol, and organic sulfide. The above four parts made certain contributions to these results.
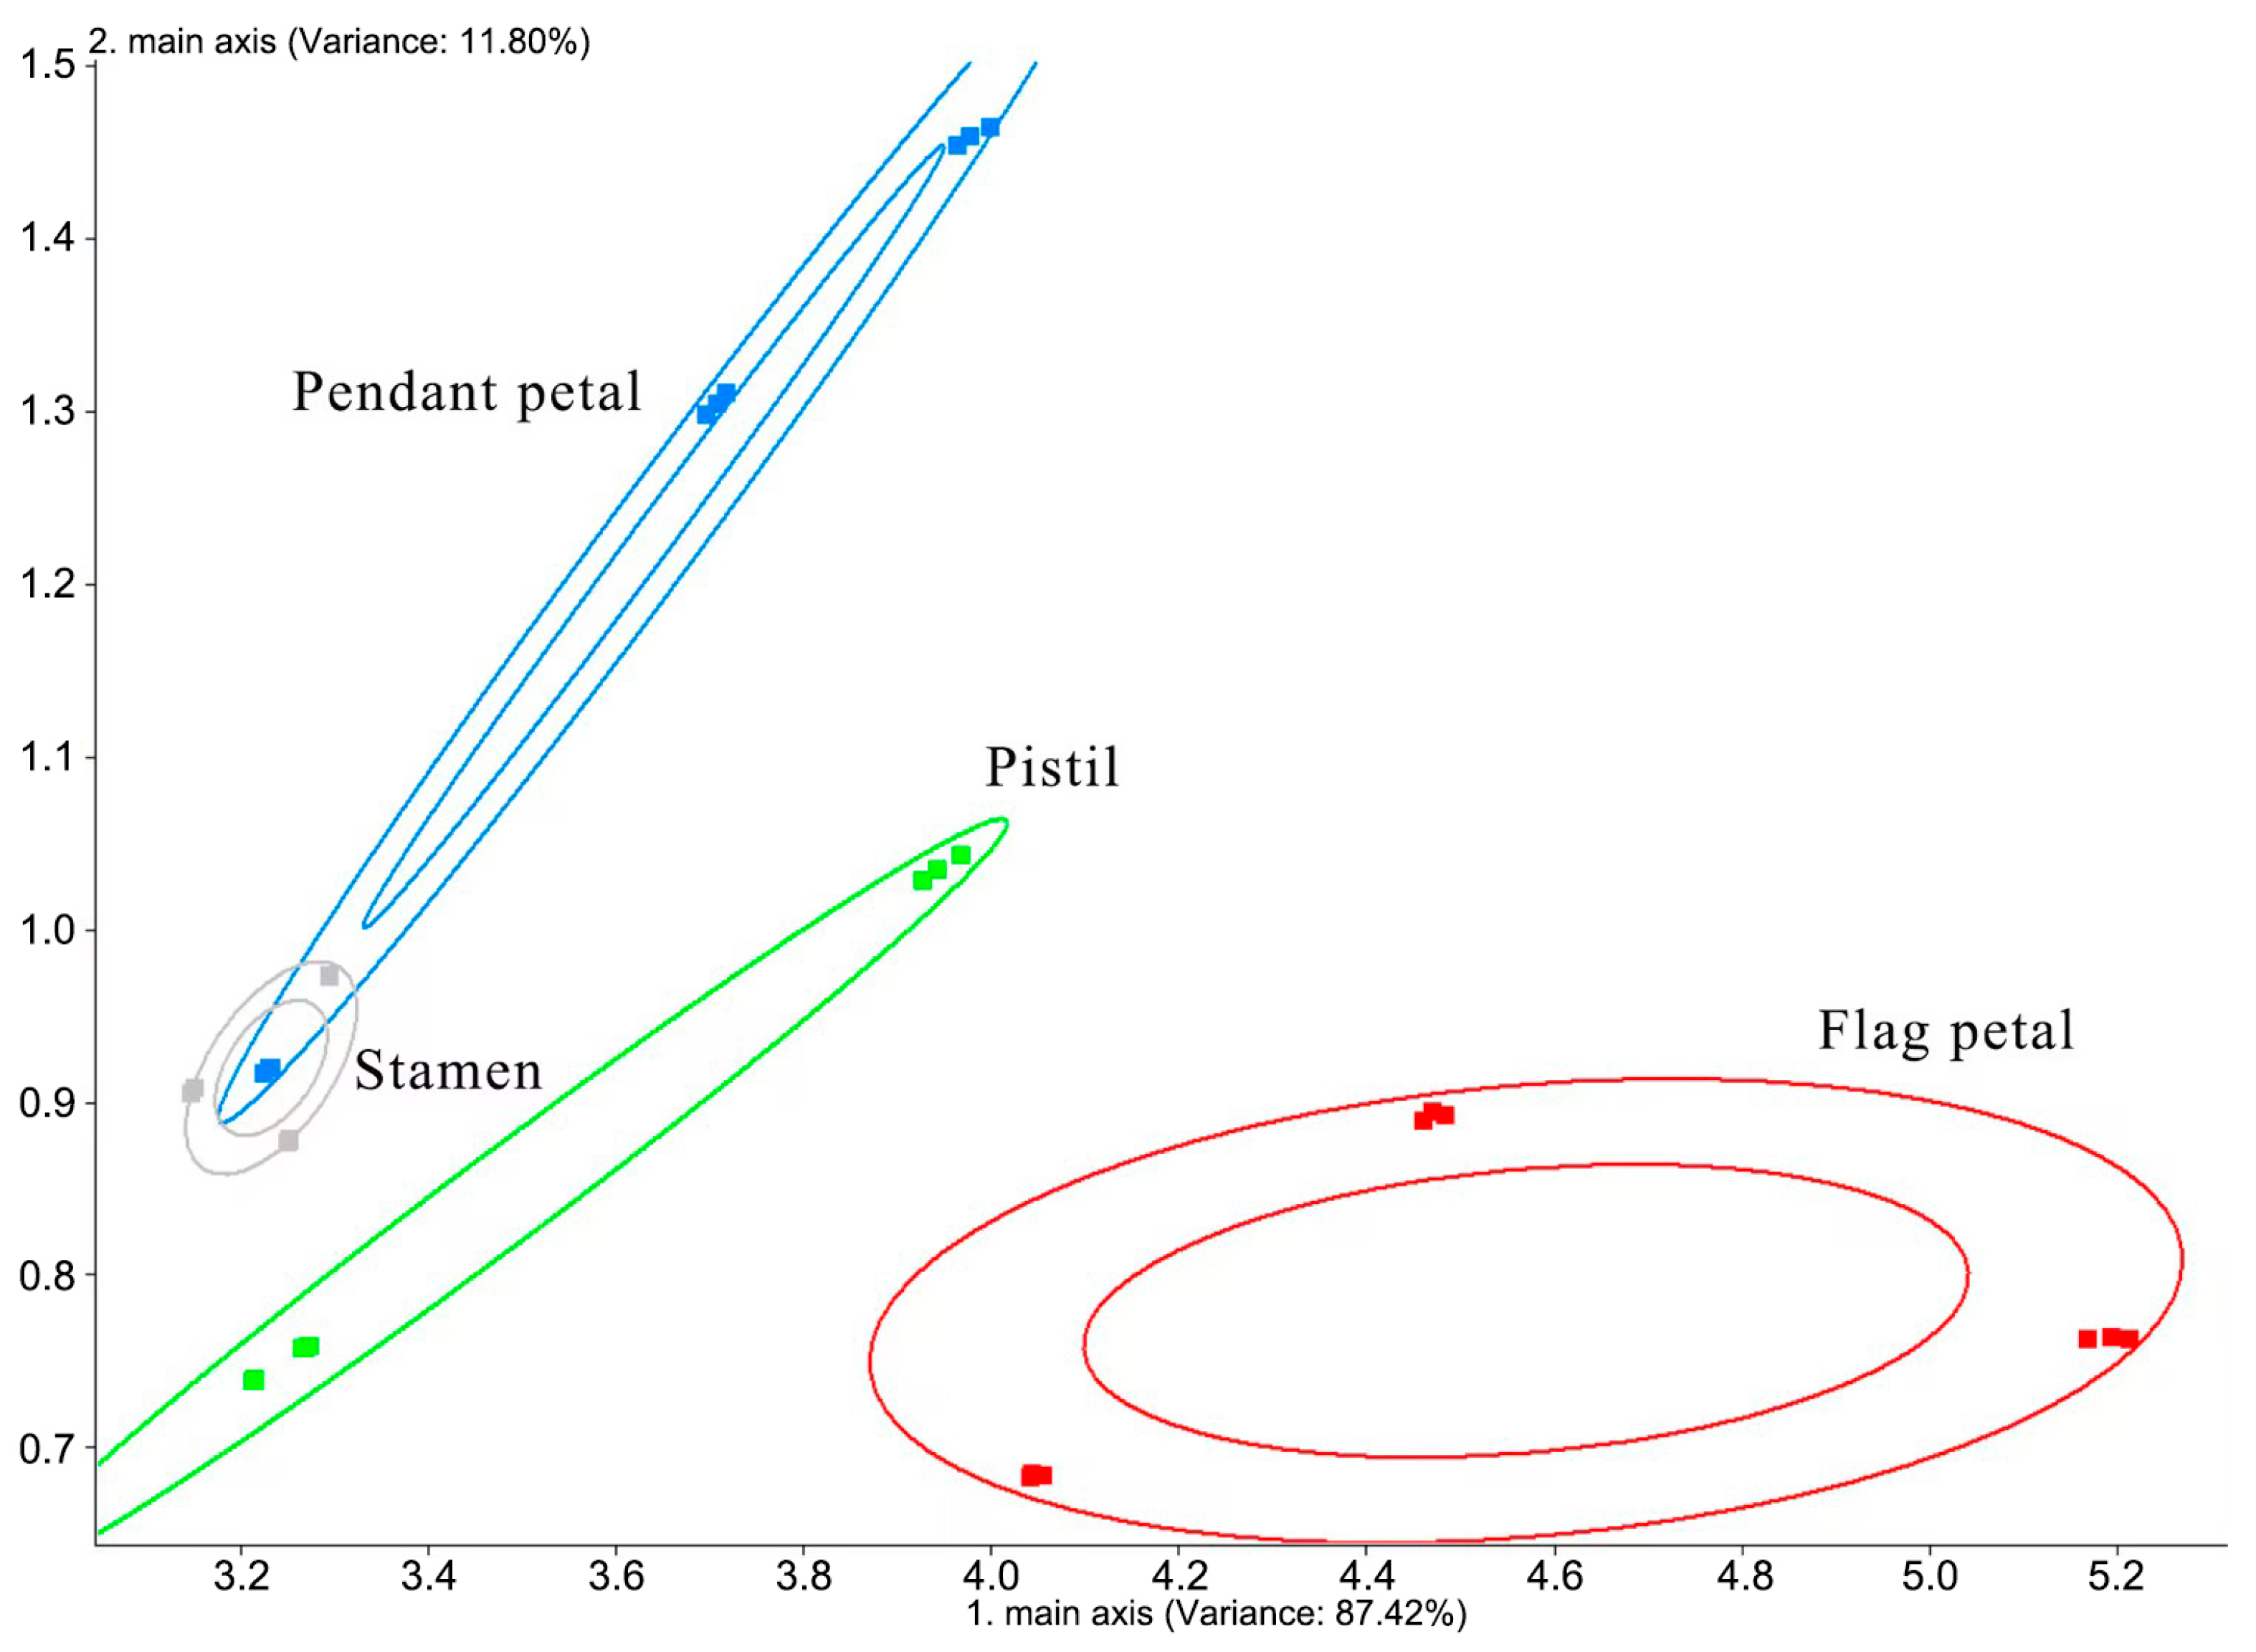
The principal component analysis (PCA) results of the flag petal, pendent petal, stamen, and pistil of Iris typhifolia are shown in Figure 2. The contribution rate of the first principal component is 87.42% and of the second principal component is 11.80%. Together, the cumulative contribution rate of the two principal components is 99.22%. Therefore, these two principal components basically represent the main information characteristics of the sample. As can be seen from Figure 2, the stamen and pendent petal of Iris typhifolia cannot be clearly distinguished by principal component analysis. That is because the floral odors of the stamen and pendent petal are close to each other. The pendant petal, pistil, and flag petal can be distinguished in this model. It turns out that the floral scents of the pendant petal, pistil, and flag petal of Iris typhifolia are different.
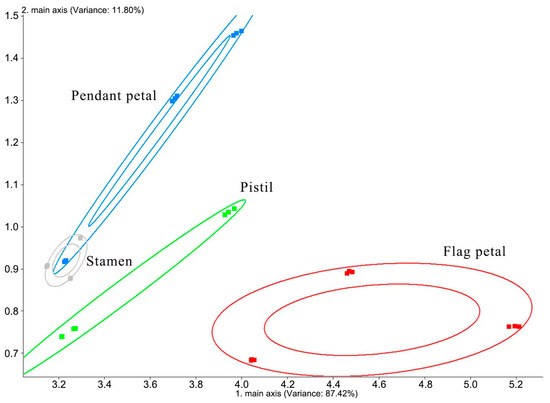
Figure 2.
PCA result of the volatile components in Iris typhifolia.
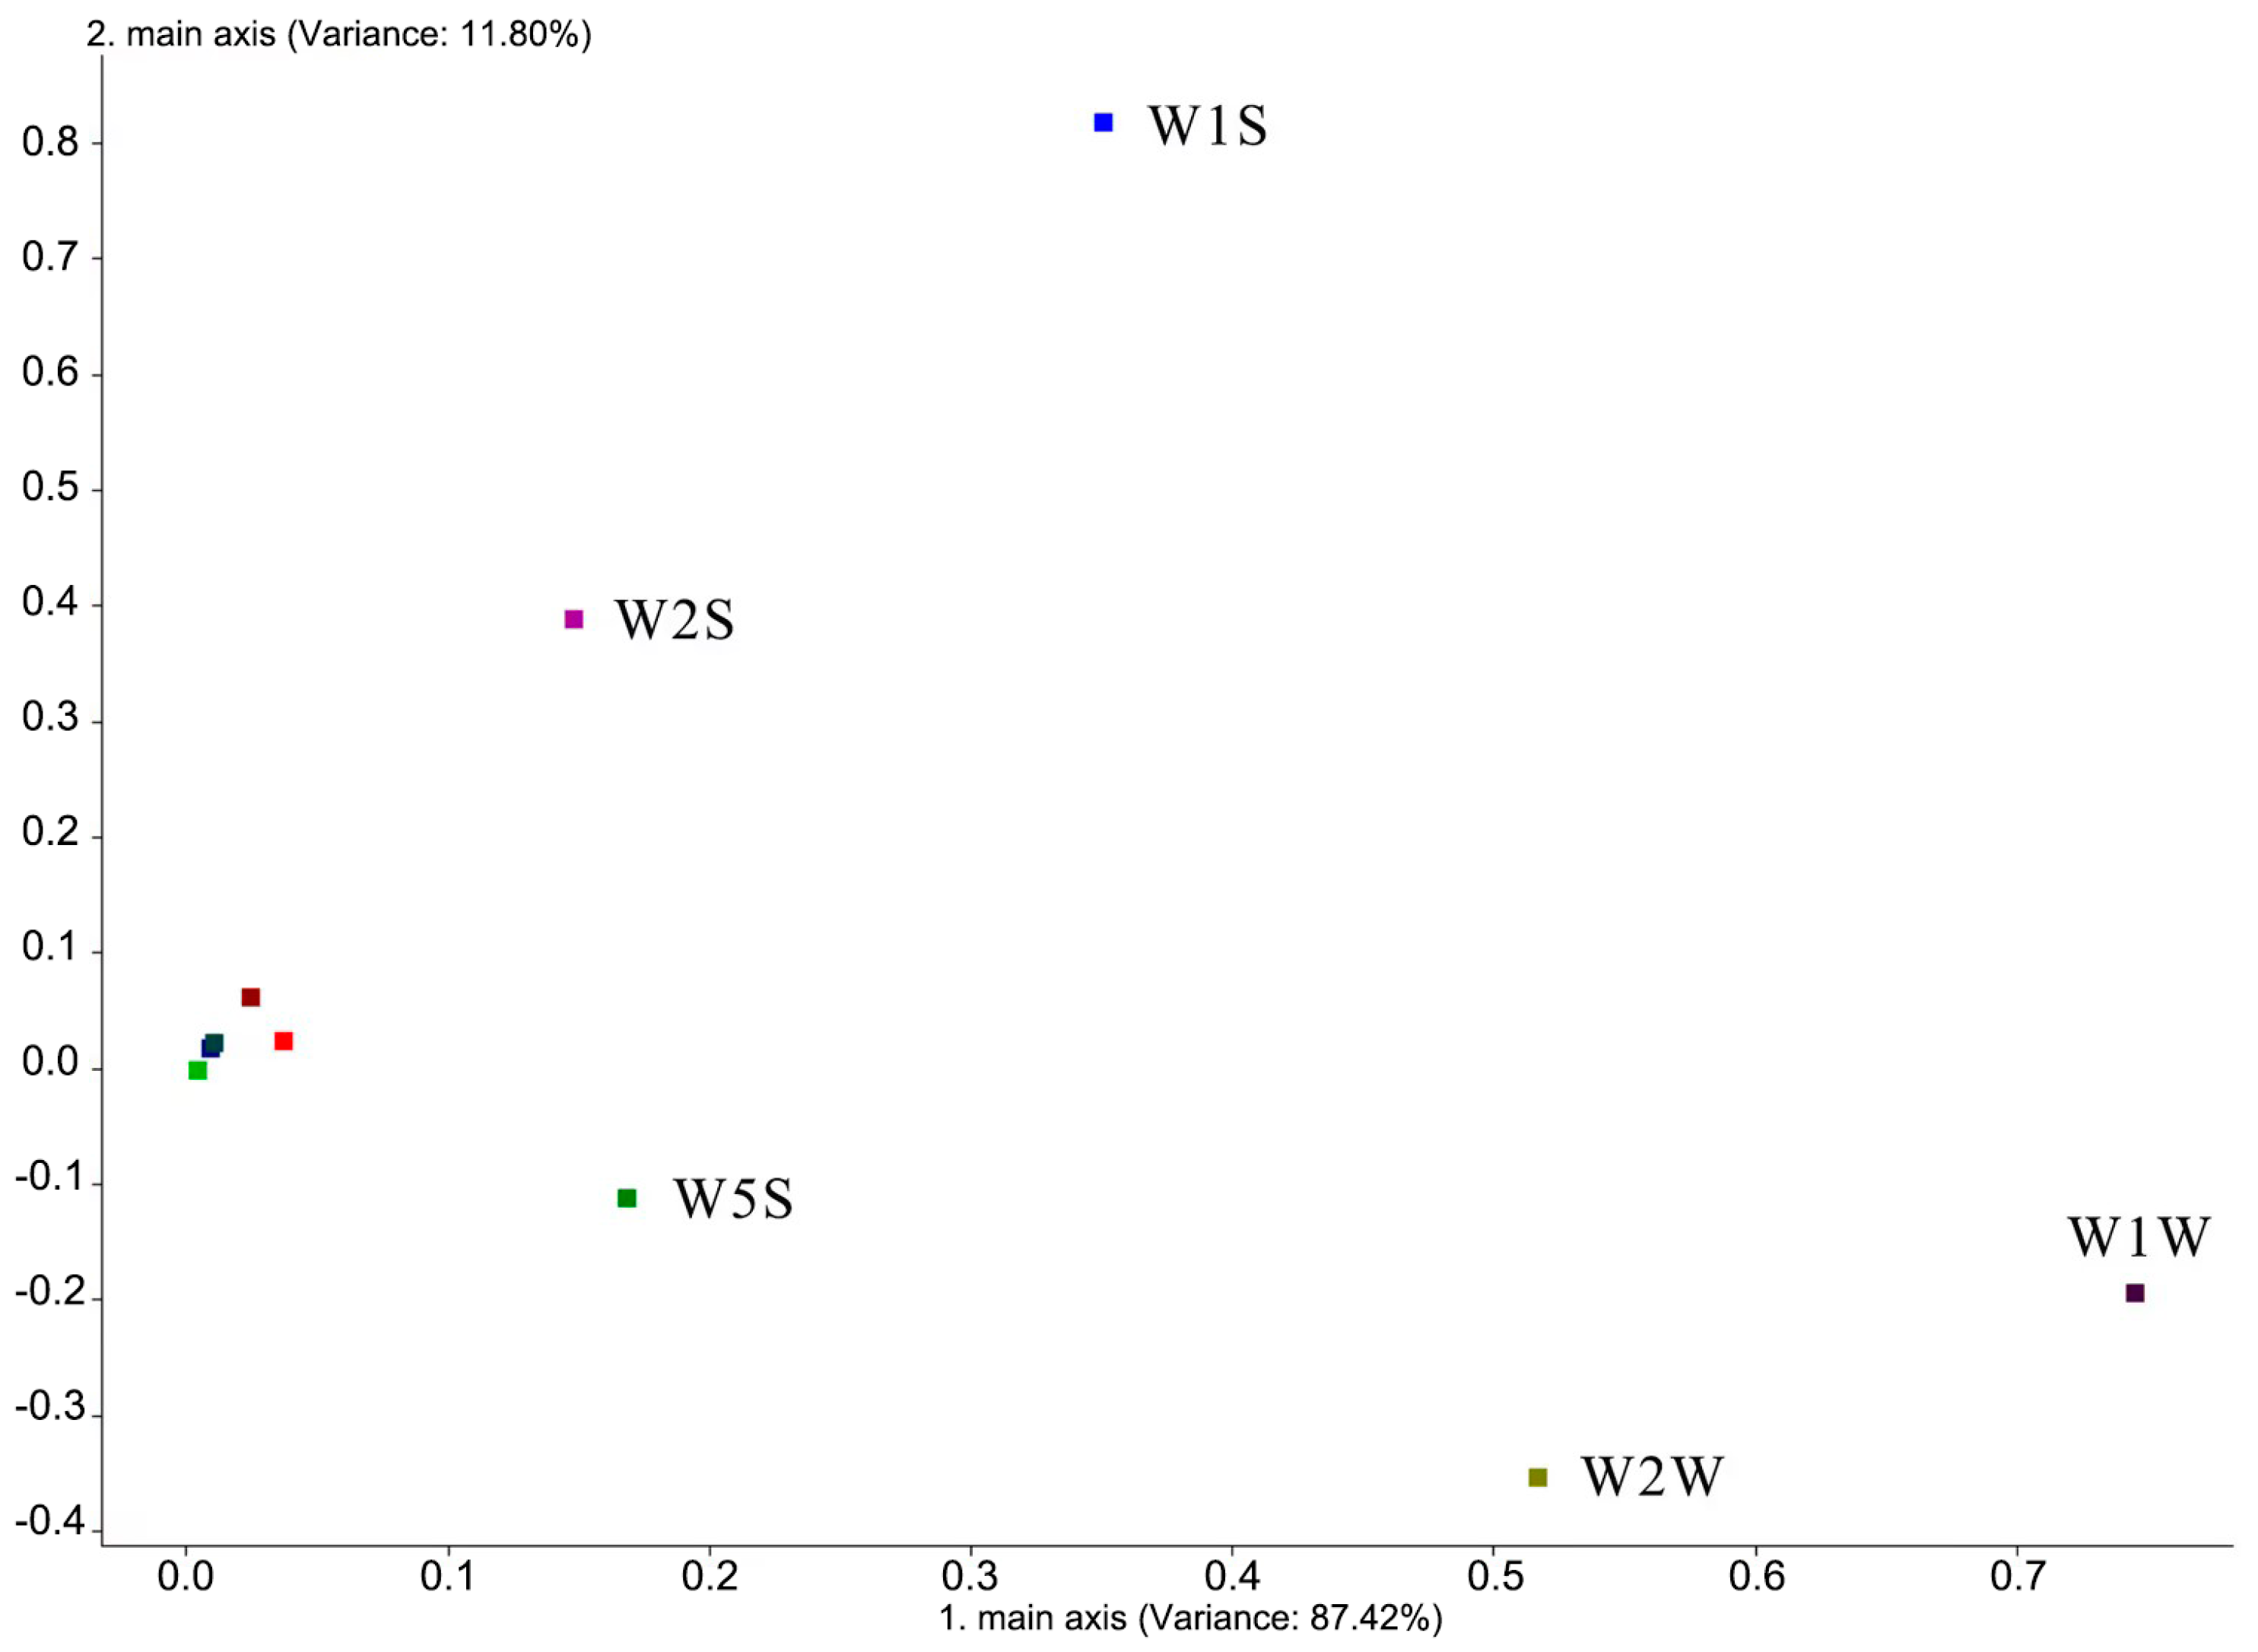
Electronic nose loading analysis is a research method for electronic nose sensors to distinguish volatile substances in samples, which mainly aims to investigate which gas substances in the sample play a major role in distinguishing and determining the contribution rate. The bloom stage of Iris typhifolia and the electronic nose load analysis results of each part in the bloom stage are shown in Figure 3. Sensor W1W (sensitive to sulfides and terpenes), sensor W2W (sensitive to organic sulfides and aromatics), sensor W1S (sensitive to methane), sensor W5S (sensitive to nitrogen oxides), and sensor W2S (sensitive to alcohols and some aromatics) are far from the origin. This shows that the five sensors, W1W, W2W, W1S, W5S, and W2S, are important sensors to distinguish volatile components in different parts. It also shows that the difference in the floral components in different parts is mainly related to volatile substances such as sulfide, terpenes, organic sulfide, aromatic compounds, methane, nitrogen oxides, and alcohols [15].

Figure 3.
Loading result of the volatile components in Iris typhifolia.
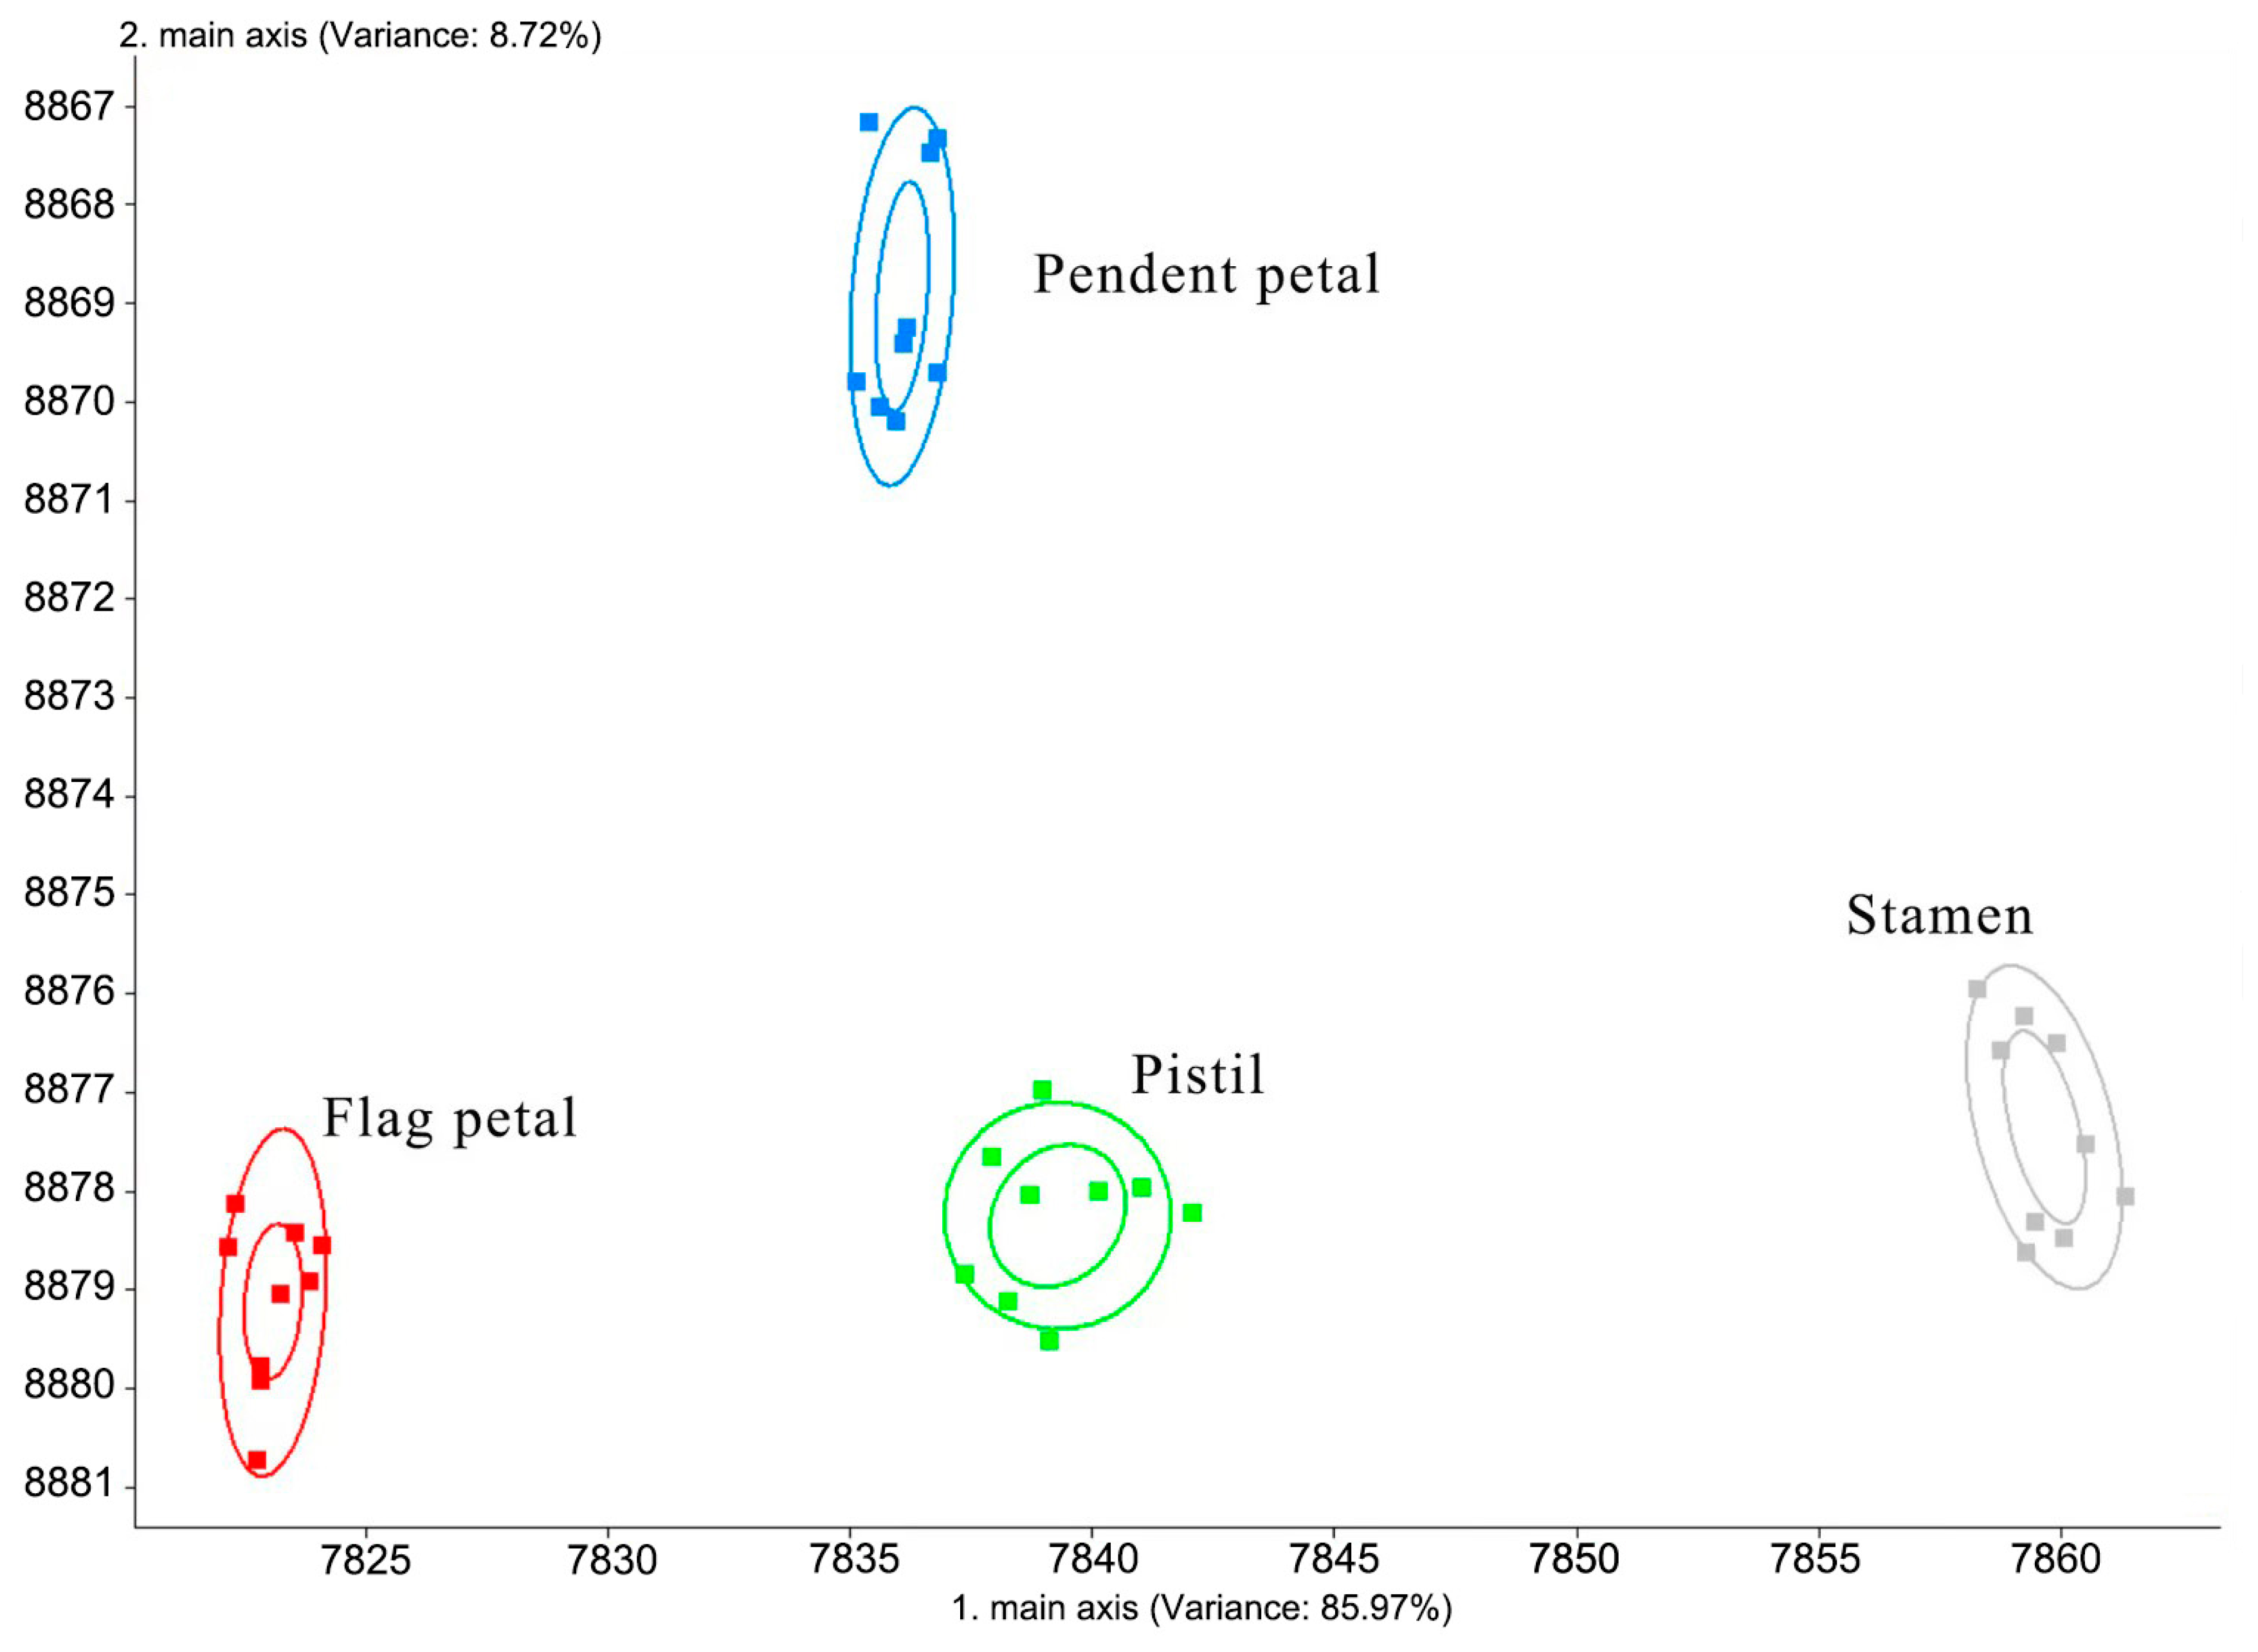
The results of linear discrimination analysis (LDA) of Iris typhifolia at the bloom stage and of different parts at the bloom stage are shown in Figure 4. The contribution rate of the first-line discrimination factor is 85.97%, and the contribution rate of the second linear discrimination factor is 8.72%. The cumulative contribution rate is 94.69%. Therefore, it basically represents the main information characteristics of the sample. As can be seen from the figure, linear discriminant analysis can completely distinguish the aroma of each part. Compared with principal component analysis, the distribution areas that linear discriminant analysis deals with are more concentrated, and the distinguishing effect is obviously higher than that of principal component analysis.
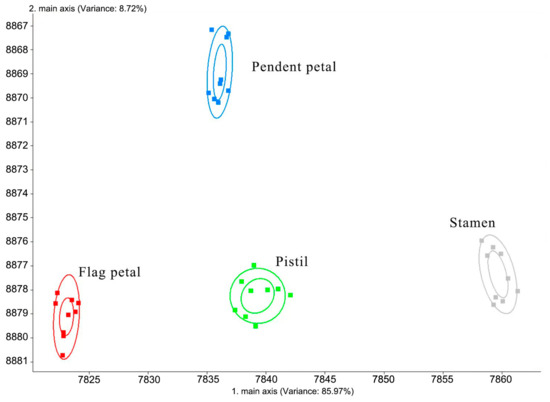
Figure 4.
LDA result of the volatile components in Iris typhifolia.
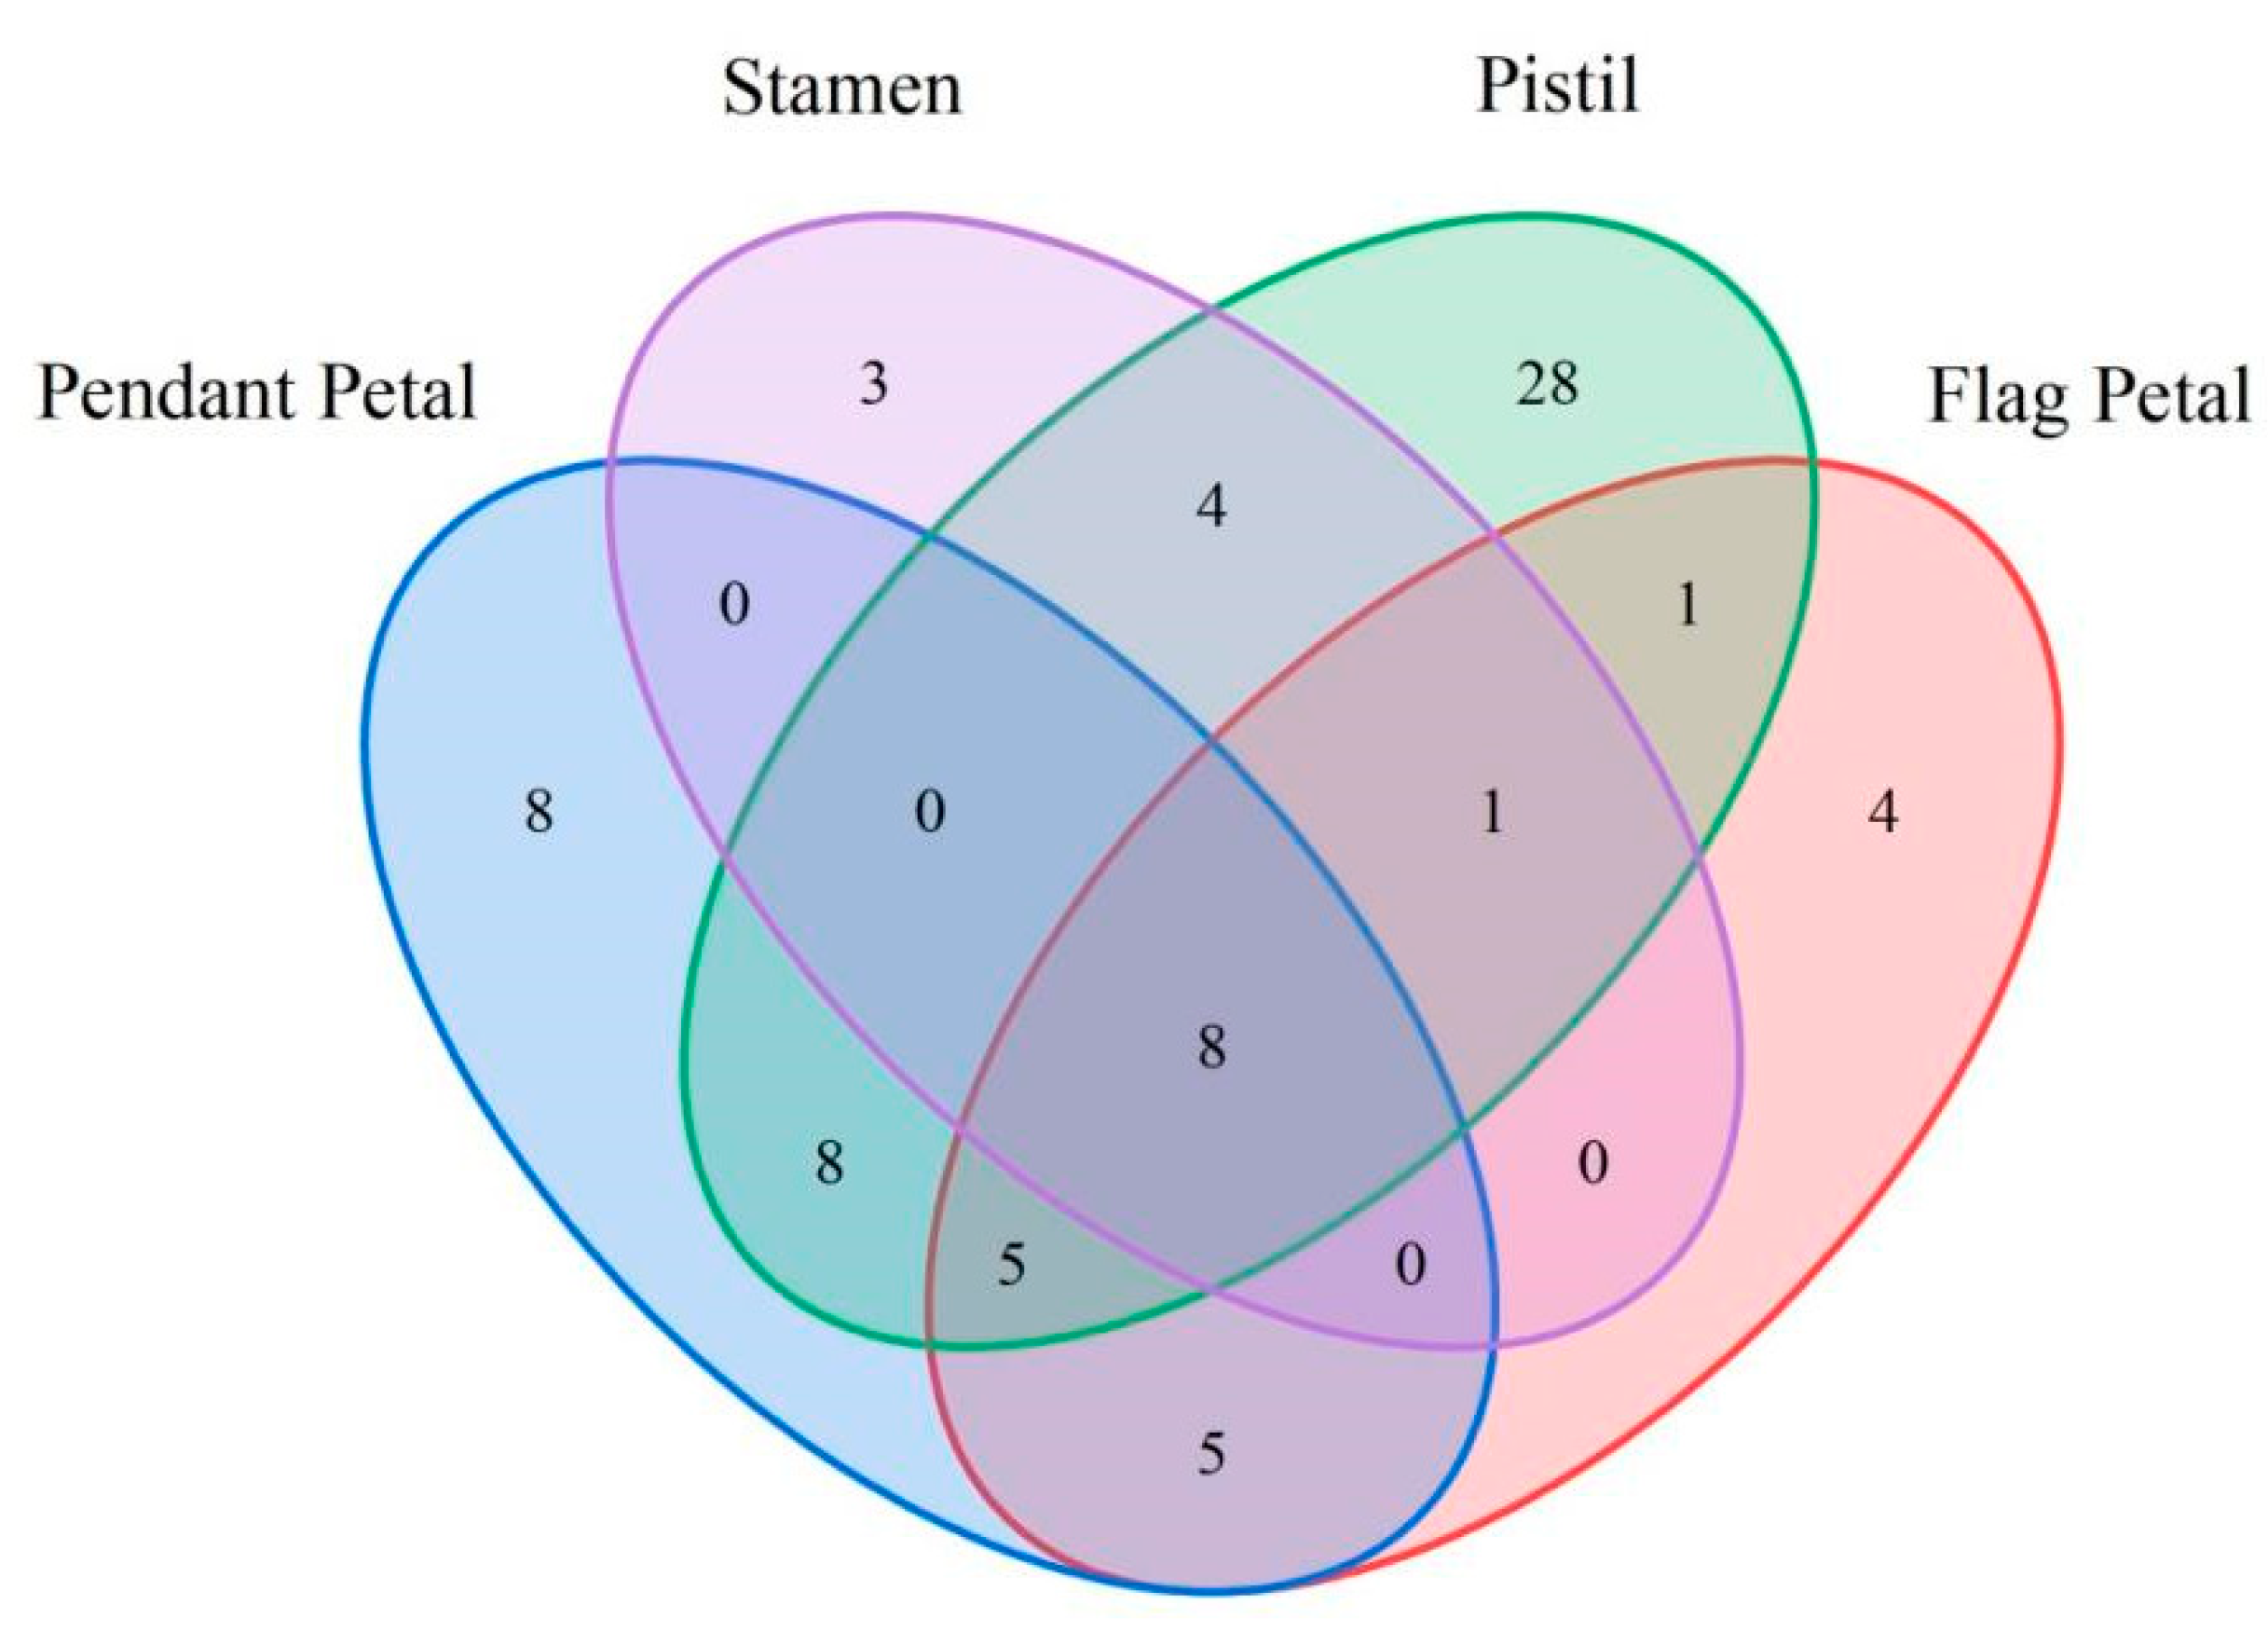
The volatile components of Iris typhifolia were qualitatively and quantitatively determined with gas chromatography–mass spectrometry (GC-MS) and the spectroscopic retrieval method [16,17,18]. A total of 75 substances were detected in the four parts of Iris typhifolia, with some substances yet to be named. In total, 34 substances were detected in the pendant petal, 24 in the flag petal, 16 in the stamen, and 55 in the pistil. Figure 5 shows a Venn diagram about the floral fragrance components of different parts. All four parts contain eight of the same floral components. The pendant petal has 8 kinds of floral components, the stamen has 3 kinds of floral components, the pistil has 28 kinds of floral components, and the flag petal has 4 kinds of floral components. It can be found that the pistil has the largest contribution to the floral material types of Irises. Figure 6 and Figure 7 respectively illustrate the types and mass fractions of various volatile components present in four different parts of Iris typhifolia.
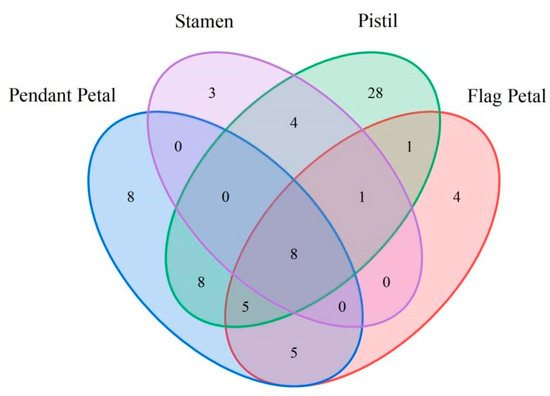
Figure 5.
The Venn diagram of the numbers of volatile components in Iris typhifolia.
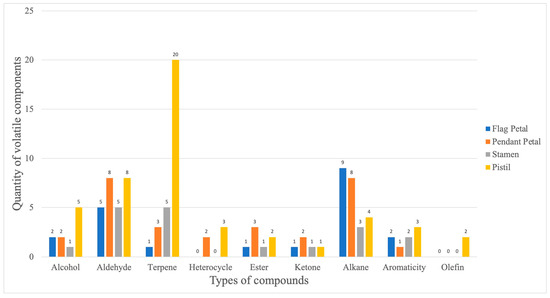
Figure 6.
The number of volatile compounds in different parts of Iris typhifolia.
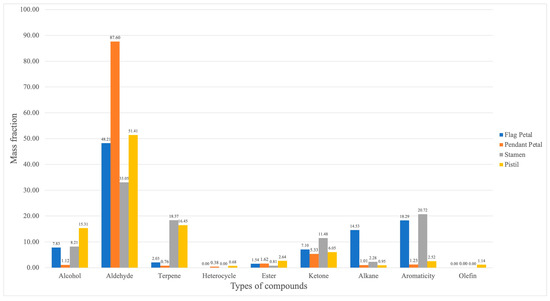
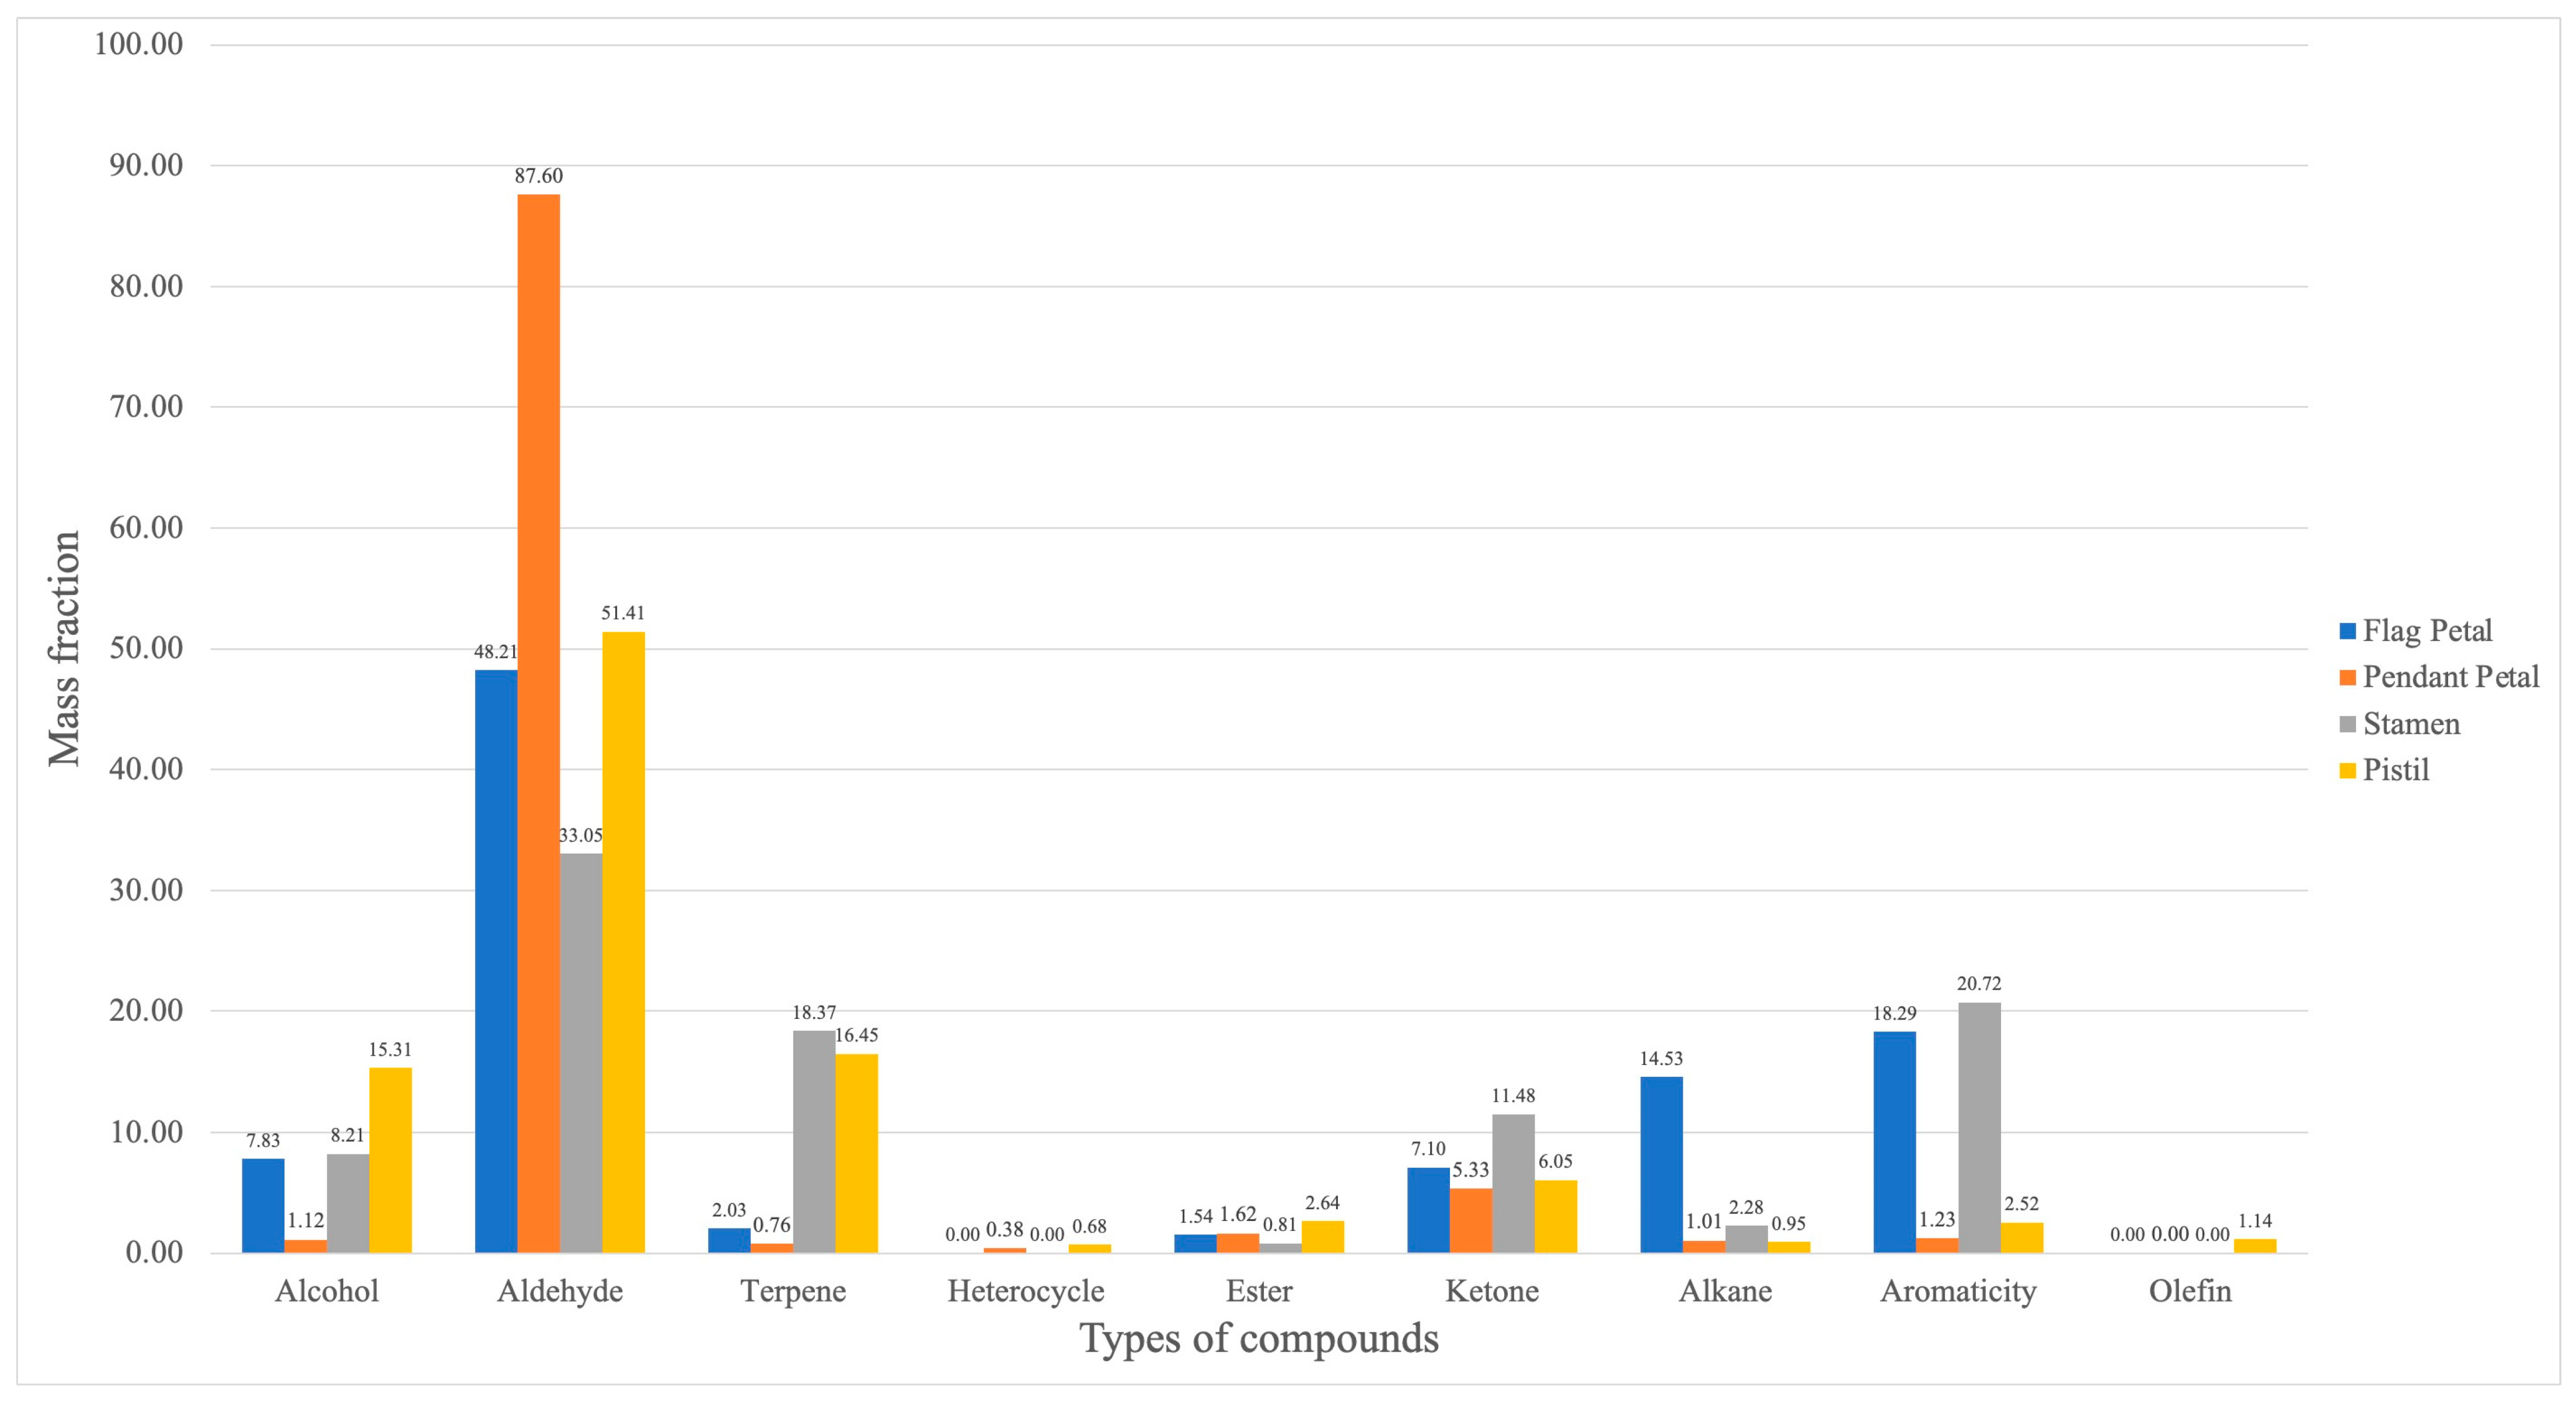
Figure 7.
The mass fraction of volatile compounds in different parts of Iris typhifolia.
A total of 62 named compounds were detected in Iris typhifolia using the GC-MS technique. Among them, aldehydes, terpenes, and alkanes were the most abundant chemical classes across different parts of the plant. Moreover, the pistil contained as many as 20 different terpene compounds. Aldehydes showed relatively higher mass fractions in all parts, with the pendant petal’s aldehyde mass fraction constituting 87.60% of the total.
The data in Table 2 represent the percentage of mass concentration of a specific volatile substance relative to the total mass. As can be seen, 2, 4-di-tert-butylphenol is the substance whose mass fraction is greater than 1% in all detected parts. Some certain volatile components are relatively high in one part of Iris typhifolia but low or even undetectable in the other parts. For example, the mass fractions of 3-carene and 2-pinene are 1.98% and 3.96% in the stamen, respectively, but are not detected in the pistil, flag petal, or pendant petal. The mass fractions of (-) -alpha-pinene and n-tetradecane are 1.08% and 2.03% in the stamen, respectively, but cannot be detected in the pistil, flag petal, or pendant petal. Terpenes are the main aroma source of a large number of ornamental flowers, and they can be detected in almost all plant floral components, such as basil with its sweet fragrance and α-pinene with its fresh grass flavor. In this study, D-terpendiene is detected in the stamen and pistil of Iris typhifolia, and the mass fractions are 9.26% and 3.75%, respectively, while the pistil is rich in terpenes such as basil.
Table 2.
The mass fraction of the compound in different parts of Iris typhifolia (%).
There are also significant differences in the substances among different clusters, with a total of four clusters identified. Cluster 1 exhibits compounds with the highest content in the stamen and moderately high content in the pistil. In Cluster 2, compounds show the highest content in the pistil. It is noteworthy that Cluster 2 contains a relatively higher abundance of terpenes, which is often associated with attracting pollinators [19]. This finding aligns with the function of the pistil. Cluster 3 demonstrates the highest content of compounds in the pendant petal. Lastly, Cluster 4 shows the highest content of compounds in the flag petal [20].
The four parts can be divided into three categories based on the first-level clusterings. The flag petal is most similar to the pendant petal, and they are grouped together. In the second-level clustering, the stamens are grouped with two types of petals and are ultimately arranged alongside the pistil. From the heatmap, it is evident that there are significant differences in both the types and quantities of volatile compounds among the four parts. Moreover, in terms of the mass fraction, the pistil contains substantially higher levels of volatile compounds compared with the other parts. The clustering analysis results are consistent with those obtained from linear discriminant analysis (LDA), indicating a precise classification of aroma compounds among the different parts of Iris typhifolia. Additionally, the pistil is regarded as the primary contributor to the types and amounts of the volatile compounds in Iris typhifolia.
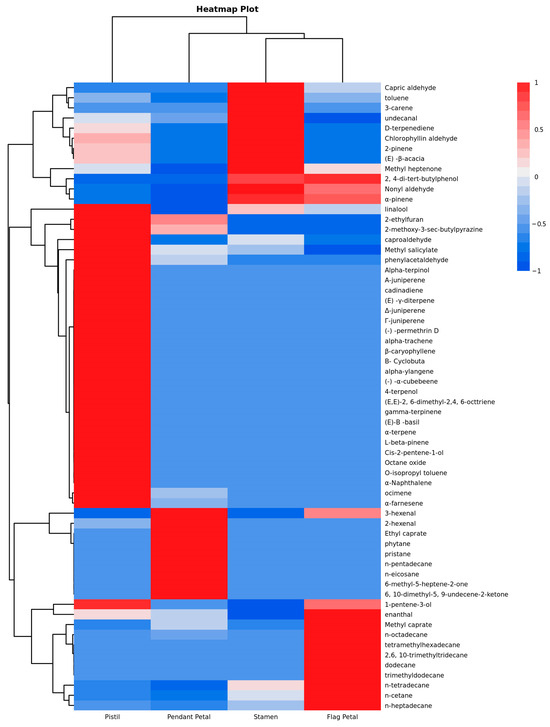
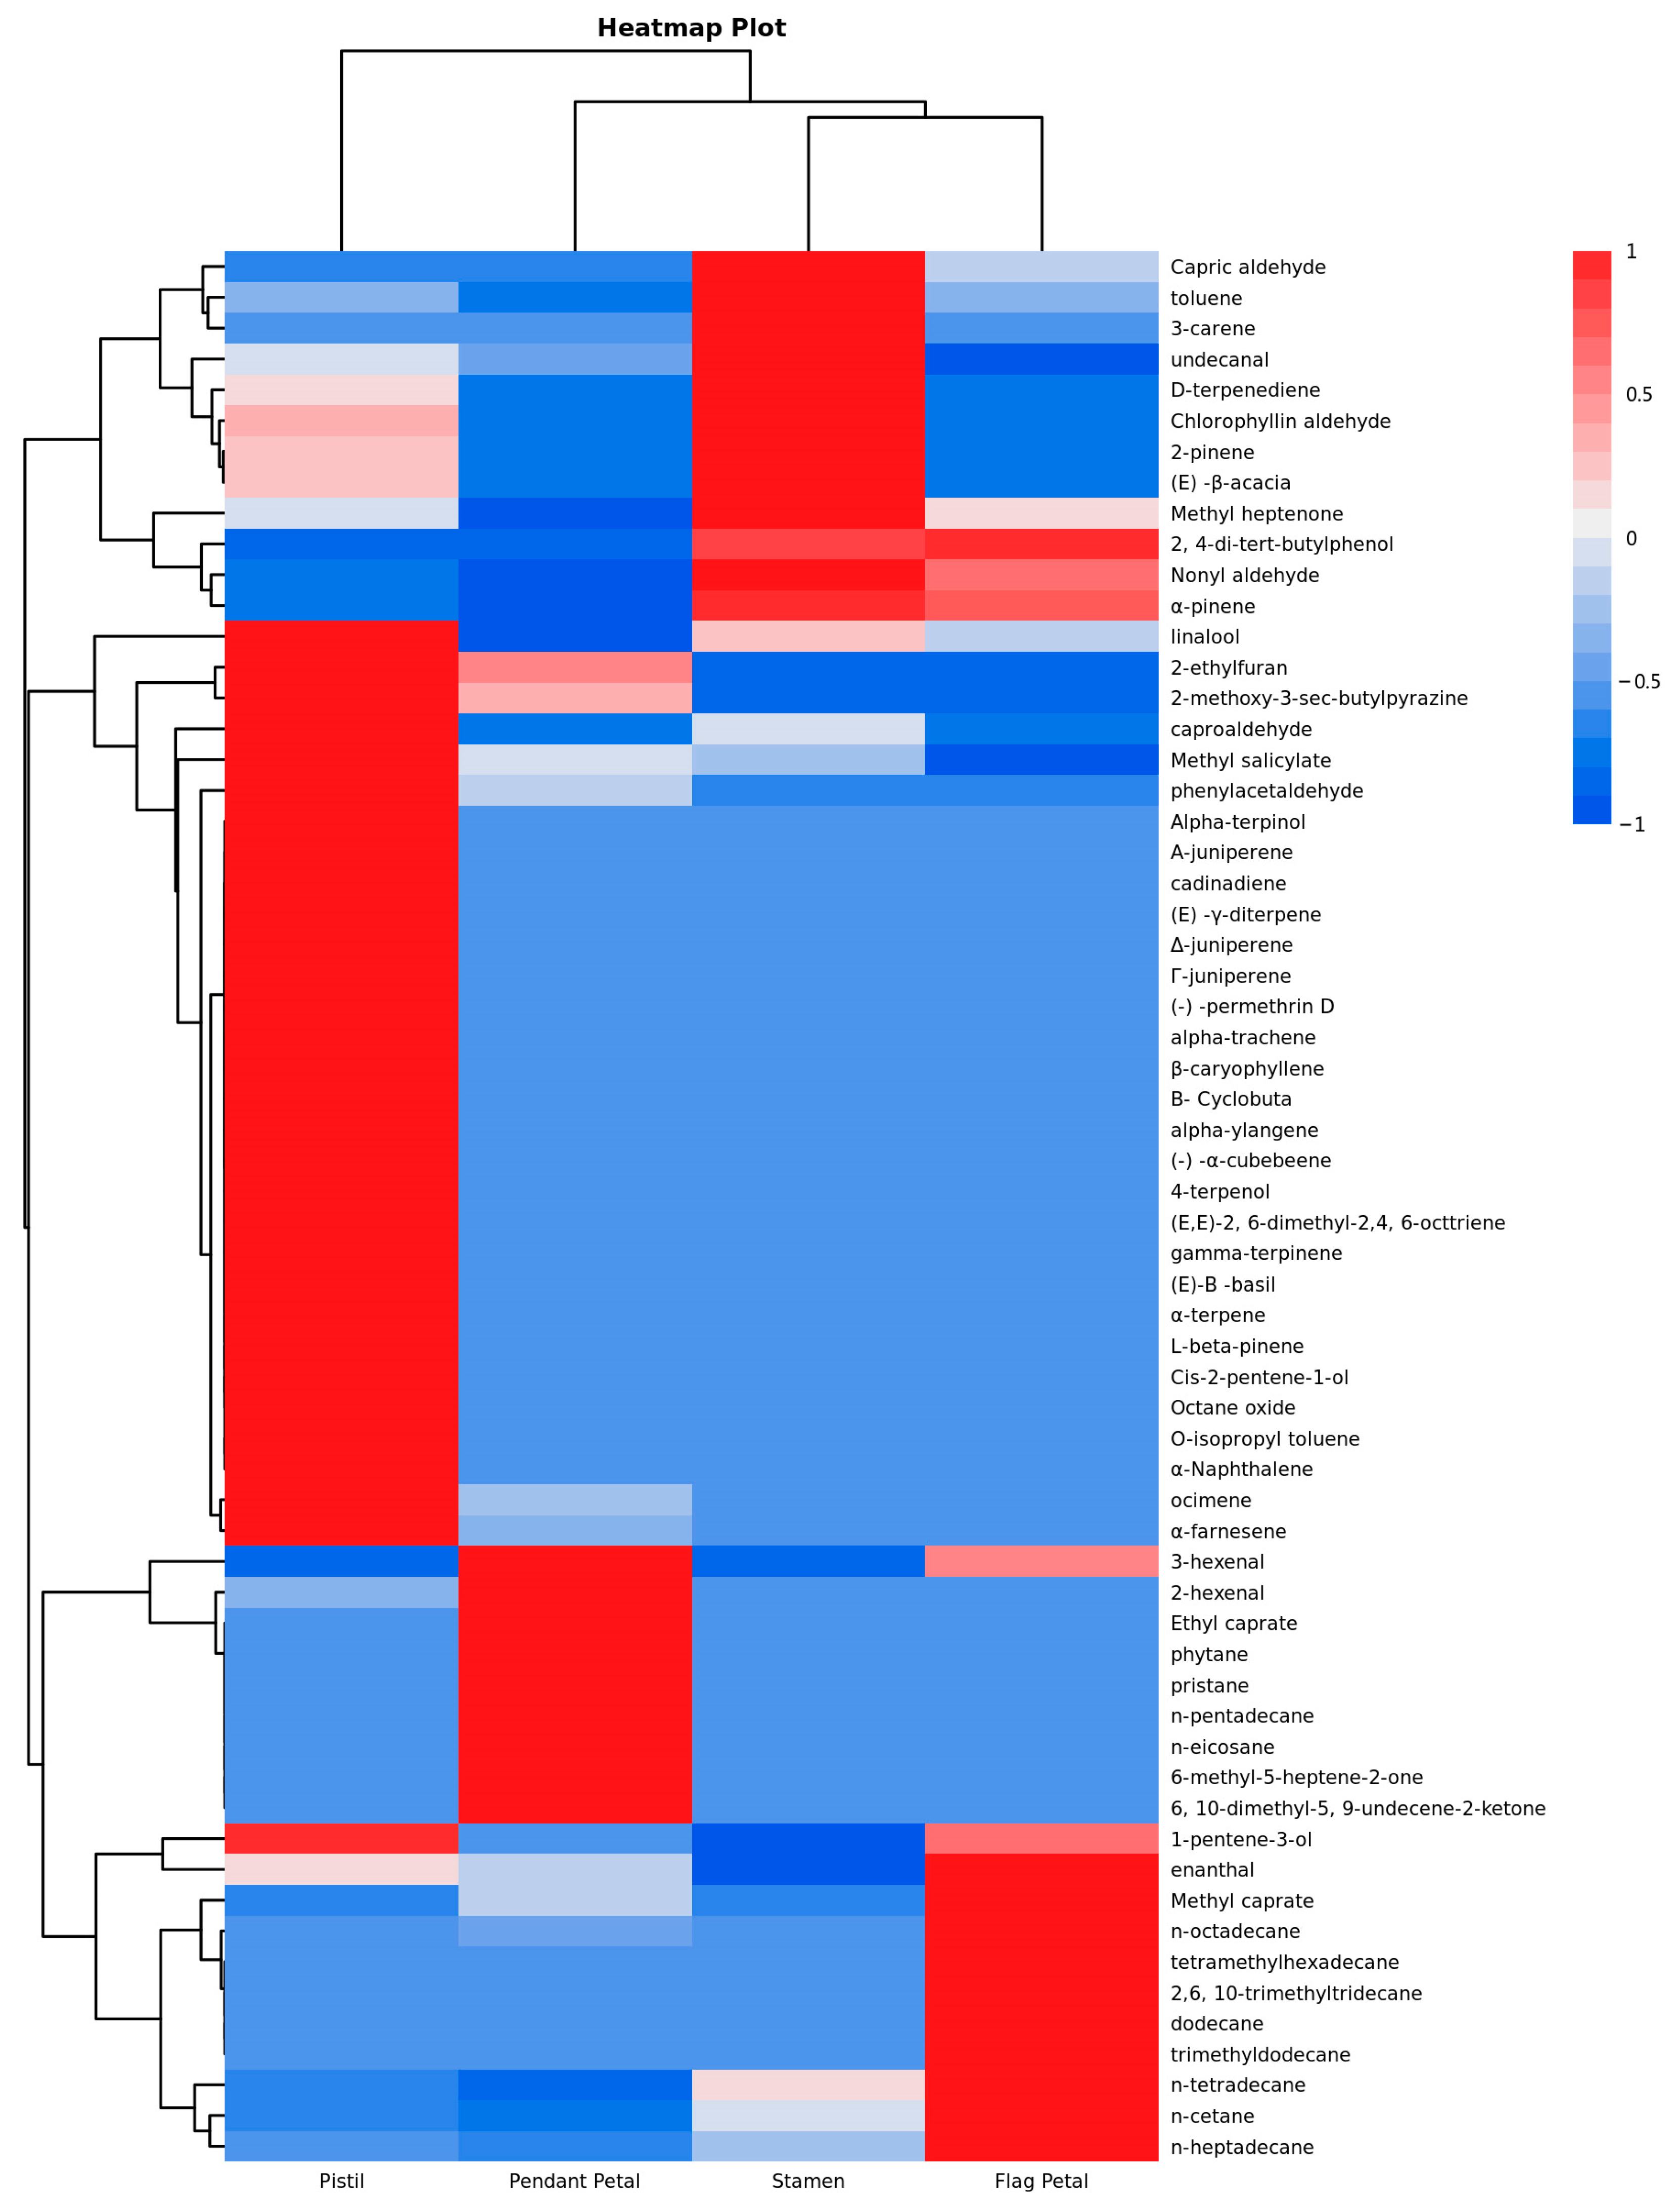
Figure 8.
The cluster analysis heatmap plot of volatile compounds in different parts of Iris typhifolia. * The mass fractions of various volatile components were standardized in rows, meaning that each value is subtracted by the row mean and then divided by the row standard deviation. This standardization ensures that the resulting values are distributed between [−1, 1]. The color gradient from blue to red indicates that the standardized values increase from smaller to larger magnitudes. The Odor Activity Value (OAV) is the primary criterion used to determine the overall contribution of volatile compounds to the aroma of a sample [21]. Based on previously reported aroma threshold values, the OAV values for different parts of Iris typhifolia were calculated. In total, 15 compounds were found to have OAV values greater than 1 in at least one part, including 7 aldehydes, 3 terpenes, 2 ketones, 1 alcohol, 1 ester, and 1 heterocyclic compound. These compounds significantly contribute to the aroma profile of the sample.
The odor activity values, concentration thresholds, and aroma descriptors for the four parts of Iris typhifolia can be found in Table 3. In the stamen, a total of 10 characteristic aroma substances were detected and quantified. Among them, linalool, nonyl aldehyde, and capric aldehyde had relatively high OAV values, giving the fragrances of lilac, fat, and sweet orange, respectively. These compounds also constitute the main aromatic substances in the flag petal, which includes five characteristic aroma compounds.
Table 3.
The OAV of volatile compounds in different parts of Iris typhifolia.
In the pistil, a total of eight characteristic aroma substances were detected and quantified. Notably, 2-methoxy-3-sec-butylpyrazine and caproaldehyde had exceptionally high OAV values, providing the aromas of fresh legumes and fruits, respectively. These two substances showed the highest OAV values among all the aroma components in the different parts, emphasizing the significant contribution of pistils to the overall aroma profile.
In the pendant petal, a total of nine characteristic aroma substances were detected and quantified. Among them, 2-hexenal and methyl heptenone were unique to this part, giving the aromas of leaves and lemongrass, respectively. Additionally, 2-methoxy-3-sec-butylpyrazine and trans-2-hexenal had relatively high OAV values, and the latter primarily contributed to the apple-like aroma.
Among the characteristic aromatic compounds detected above, 2-hexenal can be utilized in food additives and organic synthesis intermediates [22]. 2-methoxy-3-sec-butylpyrazine exhibits physiological or pharmacological activity and can serve as a sensory stimulant [23]. Linalool can be utilized in the production of basil alcohol and is appreciated for its anti-inflammatory and antimicrobial properties [21]. Nonyl aldehyde, capric aldehyde, caproaldehyde, and methyl heptenone are primarily employed in the preparation of perfumes and flavorings.
4. Discussion
In this study, flag petals, pendant petals, stamens, and pistil samples of Iris typhifolia in the bloom stage were used as experimental materials, and electronic nose technology together with solid-phase microextraction (SPME) and gas chromatography–mass spectrometry (GC-MS) were used to explore the differences of floral components in different parts. In order to explore whether volatile substances in different parts can be significantly distinguished, this study used principal component analysis (PCA), linear discriminant analysis (LDA), and sensor differentiation contribution rate analysis (Loading) for detection. The results showed that the cumulative contribution rate of principal components 1 and 2 of the four parts reached 99.22% after principal component analysis, but, due to the similarity of the pendant petals and pistil odor, they could not be significantly distinguished by this method. By using linear discriminant analysis, the cumulative contribution rate reached 94.69%, which could completely distinguish the floral components of each part. According to the analysis of the contribution rate of sensor differentiation, it was found that W1W, W2W, W1S, W5S, and W2S were the most sensitive sensors for the recognition of flowers in different parts of Iris typhifolia and played the main role in differentiation. The results showed that there were significant differences in floral odor, and the differences of floral components were mainly related to sulfur compounds, terpenes, organic sulfur compounds, aromatic compounds, methane, nitrogen oxides, alcohols, and other substances. This conclusion provides the theoretical basis and evidence for the subsequent GC-MS.
Solid-phase microextraction and gas chromatography–mass spectrometry (GC-MS) confirmed that there were significant differences in the volatile components of Iris typhifolia. In addition, nonylaldehyde, capric aldehyde, and 2, 4-di-tert-butylphenol were the main volatile substances in all phases. Pistil is rich in hexal, linalool, methyl heptenone, d-terfenadine, and other substances. The mass fractions of 3-hexenal, trans-2-hexenal, and 2, 4-di-tert-butylphenol were higher in flag petals and pendant petals. Stamens contain 2, 4-di-tert-butylphenol, hexal, methylheptenone, and other substances. These high-content volatile substances provide ideas and reference for extraction, utilization, and development.
In this study, the volatile substances detected in various parts of Iris typhifolia are mostly aldehyde, aromaticity, terpene, alcohol, and alkane. In cluster analysis, the pistils are grouped together with the other three parts only in the third-tier classification, due to their higher content of terpenes. By calculating the Odor Activity Value (OAV), it is found that the two substances with the highest OAV values are contained in the pistils, indicating that the pistils are the primary contributor to the aroma components and aroma profile of Iris typhifolia.
In this study, the following compounds with higher mass fractions are detected in various parts of Iris typhifolia during the bloom stage. 3-hexenal is commonly used as a flavor because of its strong grass and apple aroma [24]; 2-hexenal can be utilized in creating flavors of apple, strawberry, berry, and other fruits [22]. Chlorophyll aldehyde has a fresh green leaf fragrance, which can be used in artificial flowers, essential oils, and various kinds of floral fragrances [25]. Linalool is used in fragrances, deodorants, anti-caries, and insecticides [26]; 2-pinene can serve as a solvent for paints and varnishes and as a raw material for synthetic fragrances [27]. (+)-Dipentene and methylheptenone are allowed to be used as edible flavors, mainly for the preparation of flavors [28,29]. 2, 4-di-tert-butylphenol can be used as antioxidant, stabilizer, and ultraviolet absorber intermediate [30]; nonylaldehyde is widely used in flavor formulations, and it can also be used as a food flavor [31]. Basil can be used to produce the flavor basil enol, and it can also be used for daily chemical flavor [32]; 1, 2-dichloroethane can be employed as a solvent for oil, fat, gum, resin, etc., and can also be used as a raw material to synthesize fungicides, insecticides, and plant growth regulators [33]; methyl salicylate is the precursor to synthesize aspirin [34]; phenylacetaldehyde is valued in the fragrance industry as an important raw material for modulating floral flavors [35]. This proves that Iris typhifolia has high economic and medicinal value in addition to its known ornamental value.
5. Conclusions
In the present study, two methods were used to corroborate each other to analyze the floral fragrance components of Iris typhifolia at different flowering stages. Linalool, nonyl aldehyde, and capric aldehyde had relatively high OAV values in the stamen. In the pistil, 2-methoxy-3-sec-butylpyrazine and caproaldehyde had exceptionally high OAV values. All in all, the pistil is the main contributor to the fragrance of Iris typhifolia. The characteristics of other Iris species, such as the fragrant-releasing position and rhythm, need further study. Through the deeper investigation of Iris, the other characteristics of Iris can be studied based on the findings of this research.
Supplementary Materials
The following supporting information can be downloaded at: https://www.mdpi.com/article/10.3390/horticulturae9121268/s1.
Author Contributions
Conceptualization, K.C.; software, W.J.; formal analysis, K.C. and W.J.; investigation, K.C., K.T., Z.B. and H.X.; resources, Y.Z.; data curation, Z.B. and W.J.; writing—original draft, K.C.; writing—review and editing, H.C.; visualization, K.T.; supervision, H.C.; project administration, H.C.; funding acquisition, Y.Z. and H.C. All authors have read and agreed to the published version of the manuscript.
Funding
This work was financially supported by the National Natural Science Foundation of China (31701962) and the Beijing Municipal Park Management Center Science and Technology Project “Breeding and Evaluation of Drought-resistant Iris Excellent Varieties” (ZX2019010).
Data Availability Statement
Data is available in the Supplementary Materials.
Conflicts of Interest
The authors declare no conflict of interest.
References
- Brunoa, M.; Maggioa, A.; Sajeva, M. Floral scent in Iris planifolia (Iridaceae) suggests food reward. Phytochemistry 2019, 158, 86–90. [Google Scholar] [CrossRef]
- Krick, W.; Marner, F.J.; Jaenicke, L. Isolation and Structure Determination of the Precursors of a-and y-Irone and Homologous Compounds from Iris pallida and Iris florentina. Z. Für Naturforschung C 1983, 38, 179–184. [Google Scholar] [CrossRef]
- Marner, F.J.; Hanisch, B. Hoogianal, a β-Irone Precursor from Iris hoogiana Dykes (Iridaceae). Helv. Chim. Acta 2001, 84, 933–938. [Google Scholar] [CrossRef]
- Cai, K.; Feng, C.; Xu, S.; Sun, Y.; Lou, Q.; Sun, J.; Chen, H. The volatile components in different flowering stages of Iris uniflora. J. Northeast. For. Univ. 2023, 51, 53–58. [Google Scholar]
- Xiang, Q.; Duan, F.; Zou, Y.; Zhang, H. Research progress of Iris plants in China. Rural. Sci. Technol. 2020, 11, 2. [Google Scholar]
- Nan, H. Isolation and Identification of Aroma-Producing Strains from Iris Rhizomes and Biosynthesis of Irone. Ph.D. Thesis, Zhejiang University, Hangzhou, China, 2019; pp. 78–81. [Google Scholar]
- Başer, K.H.; Demirci, B.; Orhan, I.E.; Kartal, M.; Sekeroglu, N.; Sener, B. Composition of Volatiles from Three Iris Species of Turkey. J. Essent. Oil Res. 2011, 23, 66–71. [Google Scholar] [CrossRef]
- Ascrizzi, R.; Flamini, G. Iris lutescens on serpentine soil: Volatile emission profiles in different organs of its two colour morph. Plant Biosyst. Int. J. Deal. All Asp. Plant Biol. 2021, 155, 406–414. [Google Scholar] [CrossRef]
- Wang, H.; Conchou, L.; Bessiere, J.-M.; Cazals, G.; Schatz, B.; Imbert, E. Flower color polymorphism in Iris lutescens (Iridaceae): Biochemical analyses in light of plant-insect interactions. Phytochemistry 2013, 94, 123–134. [Google Scholar] [CrossRef]
- Yuan, Y.; Sun, Y.; Zhao, Y.; Liu, C.; Chen, X.; Li, F.; Bao, J. Identification of Floral Scent Profiles in Bearded Irises. Molecules 2019, 24, 1773. [Google Scholar] [CrossRef]
- Sheng, X.; Lin, Y.; Cao, J.; Ning, Y.; Pang, X.; Wu, J. Comparative evaluation of key aroma-active compounds in sweet osmanthus (Osmanthus fragrans Lour.) with different enzymatic treatments. J. Agric. Food Chem. 2021, 69, 332–344. [Google Scholar] [CrossRef]
- Xu, Y.Q.; Wang, C.; Li, C.W.; Liu, S.H.; Zhang, C.X.; Li, L.W.; Jiang, D.H. Characterization of Aroma-Active Compounds of Pu-erh Tea by Headspace Solid-Phase Microextraction (HS-SPME) and Simultaneous Distillation-Extraction (SDE) Coupled with GC-Olfactometry and GC-MS. FAM 2016, 9, 1188–1198. [Google Scholar] [CrossRef]
- Feng, Y.; Cai, Y.; Fu, X.; Zheng, L.; Xiao, Z.; Zhao, M. Comparison of aroma-active compounds in broiler broth and native chicken broth by aroma extract dilution analysis (AEDA), odor activity value (OAV) and omission experiment. Food Chem. 2018, 265, 274–280. [Google Scholar] [CrossRef] [PubMed]
- Zhu, J.; Niu, Y.; Xiao, Z. Characterization of the key aroma compounds in Laoshan green teas by application of odour activity value (OAV), gas chromatography-mass spectrometry-olfactometry (GC-MS-O) and comprehensive two-dimensional gas chromatography-mass spectrometry (GC × GC-qMS). Food Chem. 2021, 339, 128136. [Google Scholar] [CrossRef] [PubMed]
- Fan, J.; Zhang, W.; Zhou, T.; Zhang, D.; Zhang, D.; Zhang, L.; Cao, F. Discrimination of Malus taxa with different scent intensities using electronic nose and gas chromatography–mass spectrometry. Sensors 2018, 18, 3429. [Google Scholar] [CrossRef] [PubMed]
- Yang, L.; Ren, J.; Wang, Y.; Hu, Q. Diurnal fluctuation of volatile compounds emitted from four seasons rose (Rosa damascena Mill.) cultivated in Beijing. J. Appl. Bot. Food Qual. 2014, 87, 9–15. [Google Scholar]
- Awano, K.; Honda, T.; Ogawa, T.; Suzuki, S.; Matsunaga, Y. Volatile components of Phalaenopsis schilleriana Rehb. f. Flavour Fragr. J. 1997, 12, 341–344. [Google Scholar] [CrossRef]
- Kong, Y.; Bai, J.; Lang, L.; Bao, F.; Dou, X.; Wang, H.; Shang, H. Variation in floral scent compositions of different lily hybrid groups. J. Am. Soc. Hortic. Sci. 2017, 142, 175–183. [Google Scholar] [CrossRef]
- Schiestl, F.P. The evolution of floral scent and insect chemical communication. Ecol. Lett. 2010, 13, 643–656. [Google Scholar] [CrossRef]
- Dong, X.; Wei, C.; Wang, W. Comprehensive profiling and natural variation of flavonoids in rice. J. Integr. Plant Biol. 2014, 56, 876–886. [Google Scholar] [CrossRef]
- Wang, X.; Xie, K.; Zhuang, H.; Ye, R.; Fang, Z.; Feng, T. Volatile flavor compounds, total polyphenolic contents and antioxidant activities of a China gingko wine. Food Chem. 2015, 182, 41–46. [Google Scholar] [CrossRef]
- Hyun, J.; Lee, J.G.; Yang, K.-Y.; Lim, S.; Lee, E.J. Postharvest Fumigation of (E)-2-Hexenal on Kiwifruit (Actinidia chinensis cv. ‘Haegeum’) Enhances Resistance to Botrytis cinerea. Postharvest Biol. Technol. 2022, 187, 111854. [Google Scholar] [CrossRef]
- Shimizu, Y.; Imayoshi, Y.; Kato, M.; Maeda, K.; Iwabuchi, H.; Shimomura, K. New eudesmane-type sesquiterpenoids and other volatile constituents from the roots of Gynura bicolor DC. Flavour Fragr. J. 2011, 26, 55–64. [Google Scholar] [CrossRef]
- Gutbrod, P.; Yang, W.; Grujicic, G.V.; Peisker, H.; Gutbrod, K.; Du, L.F.; Dörmann, P. Phytol derived from chlorophyll hydrolysis in plants is metabolized via phytenal. J. Biol. Chem. 2021, 296, 100530. [Google Scholar] [CrossRef] [PubMed]
- León, D.C.S.; Ortíz, D.K.R.; González, D.F.J. Sensory approach and chiral analysis for determination of odour active compounds from feijoa (Acca sellowiana). Food Chem. 2020, 317, 126383. [Google Scholar] [CrossRef] [PubMed]
- Satoh, M.; Kusumoto, N.; Matsui, N.; Makino, R.; Hashida, K.; Arai, D.; Iiduka, Y.; Ashitani, T. Antitermitic and antifungal properties of enantiopure linalool and furanoid linalool oxide confirmed in Lindera umbellata var. membranacea. J. Wood Chem. Technol. 2021, 42, 37–45. [Google Scholar] [CrossRef]
- Castellar, A.; Oliveira, D.R.; Leitão, S.G.; Bizzo, H.R.; Soares, M.d.L.C.; Kinupp, V.F.; Veiga-Junior, V.F. Essential oil from Philodendron fragrantissimum, an aromatic Araceae from Amazonia, Brazil. J. Essent. Oil Res. 2013, 25, 194–197. [Google Scholar] [CrossRef]
- Fan, J.; Zhang, W.; Zhang, D.; Wang, G.; Cao, F. Flowering Stage and Daytime Affect Scent Emission of Malus ioensis “Prairie Rose”. Molecules 2019, 24, 2356. [Google Scholar] [CrossRef] [PubMed]
- Lesage, P.; Candy, J.P.; Hirigoyen, C.; Humblot, F.; Basset, J.M. Selective dehydrogenation of dipentene (R-(+)-limonene) into paracymene on silica supported palladium assisted by α-olefins as hydrogen acceptor. J. Mol. Catal. A Chem. 1996, 112, 431–435. [Google Scholar] [CrossRef]
- Al-Onazi, W.; Al-Mohaimeed, A.M.; Amina, M.; El-Tohamy, M.F. Identification of Chemical Composition and Metal Determination of Retama raetam (Forssk) Stem Constituents Using ICP-MS, GC-MS-MS, and DART-MS. J. Anal. Methods Chem. 2021, 2021, 6667238. [Google Scholar] [CrossRef]
- Wang, J.; Wang, F.; Wang, F.; Huang, A. Identification and analysis of the aroma components of different species of Matcha by electronic nose. Food Ferment. Ind. 2019, 45, 270–276. [Google Scholar]
- Sowmyal, R.S.; Sugrivl, G.; Annapure, U.S. Effect of basil herb on cookies development and its effect on the nutritive, elemental, phytochemical, textural and sensory quality. Food Sci. Technol. 2022, 59, 3482–3491. [Google Scholar] [CrossRef]
- Rudnicki, K.; Sobczak, K.; Kaliszczak, M.; Sipa, K.; Powałka, E.; Skrzypek, S.; Poltorak, L.; Herzog, G. Voltammetric study of cefotaxime at the macroscopic and miniaturized interface between two immiscible electrolyte solutions. Microchim. Acta 2021, 188, 413. [Google Scholar] [CrossRef] [PubMed]
- Chaia, K.; Wang, X.; She, G. Biotransformation and metabolism of three methyl salicylate glycosides by gut microbiota in vitro. J. Pharm. Biomed. Anal. 2023, 233, 115474. [Google Scholar] [CrossRef]
- Li, X.; Tieman, D.; Alseekh, S.; Fernie, A.R.; Klee, H.J. Natural variations in the Sl-AKR9 aldo/keto reductase gene impact fruit flavor volatile and sugar contents. Plant J. 2023, 115, 1134–1150. [Google Scholar] [CrossRef] [PubMed]


Disclaimer/Publisher’s Note: The statements, opinions and data contained in all publications are solely those of the individual author(s) and contributor(s) and not of MDPI and/or the editor(s). MDPI and/or the editor(s) disclaim responsibility for any injury to people or property resulting from any ideas, methods, instructions or products referred to in the content. |
© 2023 by the authors. Licensee MDPI, Basel, Switzerland. This article is an open access article distributed under the terms and conditions of the Creative Commons Attribution (CC BY) license (https://creativecommons.org/licenses/by/4.0/).