Article

Nondestructive Detecting Maturity of Pineapples Based on Visible and Near-Infrared Transmittance Spectroscopy Coupled with Machine Learning Methodologies

1
Institute of Facility Agriculture, Guangdong Academy of Agricultural Sciences, Guangzhou 510640, China
2
Guangdong Laboratory for Lingnan Modern Agriculture, Guangzhou 510640, China
3
Guangdong Academy of Agricultural Sciences, Guangzhou 510640, China
4
Institute of Quality Standard and Monitoring Technology for Agro-Products, Guangdong Academy of Agricultural Sciences, Guangzhou 510640, China
5
School of Food and Biological Engineering, Jiangsu University, Zhenjiang 212013, China
*
Author to whom correspondence should be addressed.
Horticulturae 2023, 9(8), 889; https://doi.org/10.3390/horticulturae9080889
Submission received: 4 July 2023 / Revised: 27 July 2023 / Accepted: 3 August 2023 / Published: 4 August 2023

Abstract

:
Pineapple is mainly grown in tropical regions and consumed fresh worldwide due to its attractive flavor and health benefits. With increasing global production and trade volume, there is an urgent need for nondestructive techniques for accurate and efficient detection of the internal quality of pineapples. Therefore, this study is dedicated to developing a nondestructive method for real-time determining the internal quality of pineapples by using VIS/NIR transmittance spectroscopy technique and machine learning methodologies. The VIS/NIR transmittance spectrums ranging in 400–1100 nm of total 195 pineapples were collected from a dynamic experimental platform. The maturity grade and soluble solids content (SSC) of individual pineapples were then measured as indicators of internal quality. The qualitative model for discriminating maturity grades of pineapple achieved a high accuracy of 90.8% by the PLSDA model for unknown samples. Meanwhile, the quantitative model for determining SSC also reached a determination coefficient ( R P 2 ) of 0.7596 and a root mean square error of prediction (RMSEP) of 0.7879 °Brix by the ANN-PLS model. Overall, high model performance demonstrated that using VIS/NIR transmittance spectroscopy technique coupled with machine learning methodologies could be a feasible method for nondestructive and real-time detection of the internal quality of pineapples.

1. Introduction

Pineapple (Ananas comosus [L.] Merr.) is a popular tropical fruit and consumed all over the world owing to its unique flavor and odor, as well as substances beneficial to human health, including minerals, vitamins, and dietary fibers [1,2]. Global pineapple production amounted to approximately 28.65 million metric tons in 2021. It is reported that the world exports of pineapple were about 3.3 million tons in 2021, an increase of 7% from 2020 [3]. China is one of the major producers of pineapple and has a large consumer market. It produces about two million metric tons a year and imports more than 10% of its annual production for domestic consumption [4,5]. Generally, pineapple is mainly consumed fresh worldwide. In this case, taste quality becomes a crucial factor when evaluating the quality of pineapple. As maturity is a comprehensive indicator that directly impacts the sensory evaluation of pineapple [2,6], determining the maturity for harvesting, transportation, and storage is important for growers, dealers, and consumers [7,8]. On the one hand, the times at which the pineapple florets open and the maturity times vary [9]. Hence, detecting the maturity of pineapples and sorting pineapples for different consumer demands could help growers reduce production loss and increase economic efficiency [10]. On the other hand, accurate knowledge of the maturity of pineapples could provide better-quality monitoring during transportation and shelf-life phase for dealers [11]. Ultimately, the good shelf-life quality of pineapples ensures that consumers can enjoy high-quality pineapples at a reasonable price.
As far as we know, the practical methods to determine the internal quality of pineapples still rely on manual inspection, which might be subject to human judgment and damage to fruits. Hence, there is an urgent need for nondestructive technologies and automation equipment for detection of the internal quality of pineapples. Efforts have, therefore, been exerted towards the development of novel technologies for rapid and nondestructive detection of the internal quality of pineapples [12,13]. Generally, appearance features, such as color and texture, would be first considered for detection of internal quality because of the correlation between external characteristics and internal qualities. According to the appearance images of pineapples, Bakar et al. [14] developed a fuzzy logic classification algorithm, that could identify fully ripe pineapples at a 100% rate. The features extracted from the appearance images could even be used to identify the pineapple maturity in fields based on color images and deep learning methods [9,15]. However, appearance features could not directly reflect the internal quality, and, therefore, could not represent the real taste quality [16]. Sornsrivichai et al. [16] reported that the electronic acoustic sensing technique and X-ray CT imaging showed significant correlation with the pineapple maturities due to the different densities of pineapples. Since the compounds of fruits, including soluble solids content (SSC), titratable acidity (TA), as well as the ratio of SSC and TA, were generally measured to assess the internal quality of fruits [17,18], it has garnered a great deal of attention of researchers on using spectroscopy-based techniques to detect these indices of pineapples. Tantinantrakun et al. [3] reported that both reflectance near-infrared hyperspectral image (935–1720 nm) and transmittance NIR spectroscopy (665–955 nm) gave reliable performance in detecting pineapples maturity index (calculated as the ratio between TSS and TA), and the optimal partial least squares regression (PLSR) model generated an R C V 2 of 0.72 and an RMSECV of 1.68. The SSC was also found to be the relevant factor to maturity grades and further related to the taste quality [19]. Chia et al. [20] trained a feedforward back-propagation artificial neural network (ANN) model based on visible and shortwave near-infrared reflectance spectroscopy (650–1000 nm) for predicting SSC values of pineapples and obtained a r P range of 0.68–0.74 and a RMSEP range of 0.87–1.03 °Brix. Rahim et al. [21] built predictive models for analyzing the SSC in pineapples by using reflectance spectroscopy (650–1100 nm), which provided an r C V of 0.75 and an RMSECV of 0.81 °Brix. Amuah et al. [22] used a portable NIR spectrometer (740–1070 nm) to predict TSS with the results of R P = 0.854 and RMSEP = 0.842 °Brix by a PLSR model. In recent years, transmittance spectroscopy techniques have been increasingly studied for detection of the internal quality of fruits, including pomegranate [23], watermelon [24], pomelo [25], pear [26], apple [27,28], which showed the potential application prospect of such techniques coupled with appropriate modeling algorithms. Among these modeling algorithms, the PLS, ANN, and support vector machine (SVM) have been commonly used in spectral analyses for quantitative or qualitative analysis purposes. Particularly, the PLSR method was more widely adopted for establishing a quantitative model of SSC content. To sum up, the present studies suggest that spectroscopy-based techniques coupled with machine learning methods possess the potential to achieve rapid, nondestructive, and accurate detection of pineapple internal quality and addresses the problem of time-consuming, laborious, and subjective bias of humans from conventional procedures.
To date, there are few reports on the study of real-time for detection of the internal quality of pineapples based on spectroscopy-based techniques. In this study, we attempted to establish detection models based on VIS/NIR transmittance spectroscopy data, which would be embedded into a detection system for nondestructively and real-time determining the internal quality of pineapples. This research goal was mainly achieved through the following four steps: (1) A platform system for acquiring VIS/NIR transmittance spectroscopy (400–1100 nm) of pineapple was built, (2) qualitative models were established for discriminating maturity grades of pineapples, (3) quantification models were calibrated for determining SSC values of pineapples, (4) conduct independent validation set of samples to verify the established models.

2. Materials and Methods

2.1. Sample Collection

A total of 195 pineapple samples in different maturity grades from cultivar “Comte de Paris” (Ananas comosusr cv. Yellow Mauritius), which is the main planting cultivar in China [29], were harvested in Qujie Town, Xuwen County Zhanjiang City, Guangdong Province, China, in May 2021. Pineapples in a weight range from 1.5 to 2 kg were considered in this experiment to ensure that the samples were relatively homogeneous. Meanwhile, the pineapple samples without defects of exterior damage or symptoms of rot were selected. All pineapple samples were prepared by removing the stem but keeping the crown for spectral data acquisition. The pineapple samples were harvested and taken to a laboratory within 5 km of the pineapple orchard and then stored at 26 ± 1 °C environment for six hours before acquiring spectral data.

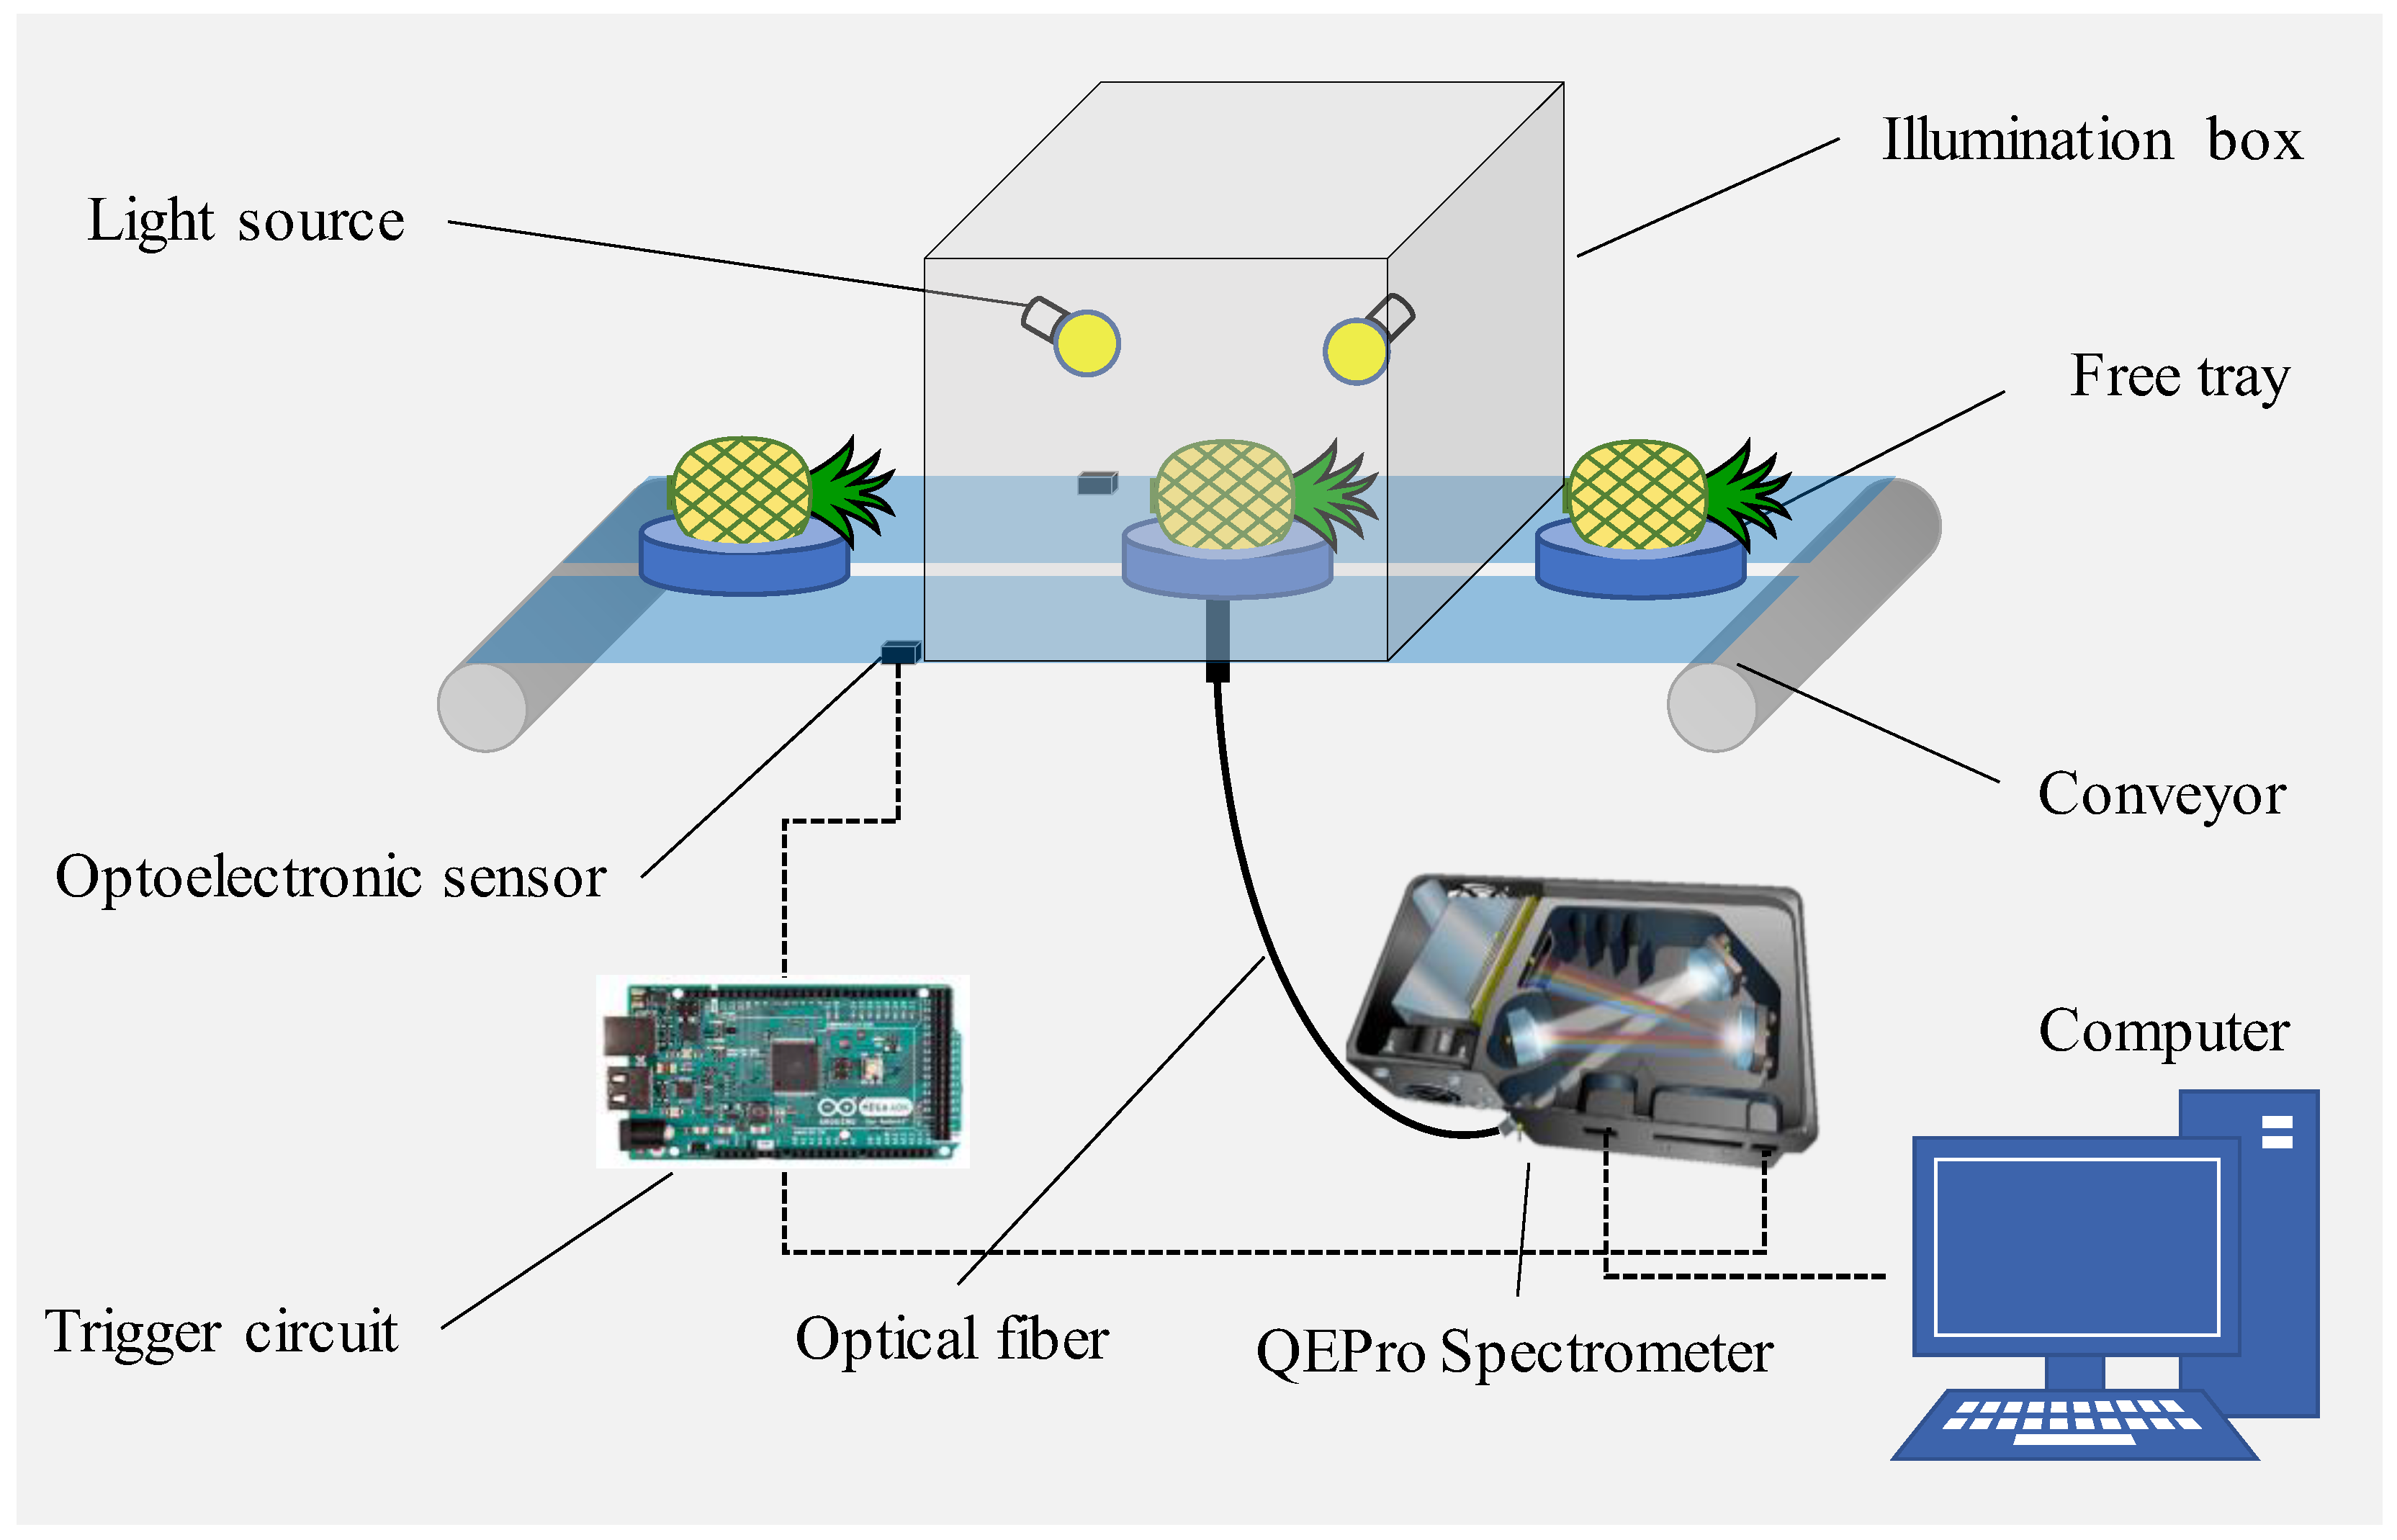
2.2. VIS/NIR Transmittance Spectroscopy Acquisition

A platform system for acquiring VIS/NIR transmittance spectroscopy of pineapple is shown in Figure 1. The platform had a conveyor driven by a motor for continuously transferring pineapple samples. The free tray was designed to stabilize the pineapple on the conveyor, it could also block the light leaking through the contact surface between the pineapple and the tray. There was a hole in the bottom of the tray with a diameter of 50 mm. Each pineapple was put on a tray, when transferred, it passed through the spectrum acquisition channel. In order to eliminate interference from environmental background radiation, the whole spectroscopy acquisition process was conducted in a dark environment composed of an illumination box and curtain. In this box, light sources were comprised of six 100 W tungsten halogen lamps (LM-100, MORITEX Company, Yokohama, Japan). An integrating sphere, which jointed optical fiber connecting to a commercial miniature fiber optic spectrometer QE PRO (Ocean Optics Inc., Orlando, USA), was used to collect the diffuse transmittance spectroscopy of samples through the hole of the free tray. The spectrometer could cover the wavelengths of 400–1100 nm, as it was found useful for detection of the internal translucency degrees of pineapple [30].
While acquiring VIS/NIR transmittance spectroscopy of a pineapple, the pineapple was manually loaded on a free tray and fed onto the conveyor belt. The conveyor belt carried the tray and moved into the illumination box at a speed of 0.1 m/s. The spectrometer was set to capture spectroscopy automatically in an integration time of 300 ms under external trigger mode. The optoelectronic sensors transmitted an electrical signal to the spectrometer as well as the computer when the tray arrived at the set position for spectroscopy acquisition. Reference and dark spectrums were measured before sample spectral measurement. The reference was measured using a cylinder of Teflon material. The spectral measurement was expressed by spectrometer parameter settings, and spectrums collection and storage were carried out via software developed based on OmniDriver® SDK (Ocean Optics Inc., Orlando, USA) and C++ programming language in Microsoft Visual Studio IDE. Finally, the average spectrum from 5 measurements of each individual pineapple was used for further analysis.

2.3. Maturity Assessment and SSC Determination

After acquiring spectrums of all samples, the maturity grade and SSC value of individual pineapples were then manually measured by cutting through the pineapples. Related methods [19,30] were referenced for assessing maturity grades, the pineapples were cut lengthwise into eight equal slices from stem side to crown side after removing the crown of the fruits. First, the ratio of the translucent area and the total two sides of the sliced area for each slice was evaluated. Second, the total ratio of the whole pineapple was summed up. Thirdly, all pineapple samples were classified into three maturity grades (as shown in Figure 2), namely immature, mature, and overmature, as the ratios of the translucent area were no more than 5%, over 5% but no more than 20%, over 20%, respectively.
After maturity assessment, two slices opposite each other of pineapple were used for obtaining juice and measuring SSC values. By removing the outer 1 cm of pericarp and the core part of the pineapple, pineapple meat weas chopped up and the juice was squeezed into a glass beaker through a filter gauze. Two drops of juice were taken to measure the SSC values using a digital refractometer (PAL-BX/ACID9; ATAGO Co. Ltd., Tokyo, Japan) with a °Brix range of 0–60 and ±0.1 °Brix. Each sample was measured three times, and the average of these three values was used as sample SSC value. Between each measurement, the refractometer was calibrated with distilled water.

2.4. Spectral DataSets Preprecessing

All spectral data were first corrected to obtain relative transmittance spectrums using reference and dark spectrums by Equation (1):
T = T o r i g i n a l I d a r k I r e f e r e n c e I d a r k
where T o r i g i n a l is the original collected transmittance spectrum of pineapple, I r e f e r e n c e and I d a r k are the reference and dark spectrums, respectively.
The Beer–Lambert law tells that there is a linear absorption relationship between the spectral absorbance and compounds concentration. Therefore, all the transmittance spectrums were converted into the absorbance spectrums regression analysis according to Equation (2):
A = log ( 1 T )
where T is the relative transmittance spectrum of a pineapple.
Preprocessing the spectral data is necessary ahead of the modeling process to weaken the influence of noise on the model results. Systemic jitter noise and light scattering noise are two main forms of noise included in spectral data. This part of noise signal is generally considered useless for modeling analysis, which should be reduced from the spectral data to improve the robustness and accuracy of the prediction model. In this study, Savitzky–Golay smoothing treatment (21-point width and first-order polynomial) was applied to all spectral data to reduce the high-frequency part of the noise. Then, multiplicative scatter correction (MSC) was also used to deduct the additive and multiplicative effects of light scattering in the spectral data. In order to calibrate and validate the prediction model, one-third of the samples (one spectrum chosen from every three spectrums in the collected spectral dataset) were selected as a validation set, while the remaining two-thirds were used as a calibration set for establishing the models. Notably, the validation set was only used to validate the performance of established models and did not interfere with building the models. All data analyses were performed using MATLAB R2017b software (Math-Works Inc., Natick, MA, USA).

2.5. Modeling Algorithms

In this study, quantitative models were calibrated to determine SSC values, and qualitative models were established to classify the maturity grades of pineapples. In order to investigate high-performance models, PCR, PLSR, and ANN modeling algorithms were tested to calibrate quantitative models. Meanwhile, KNN, PLSDA and SVMDA modeling algorithms were applied for building qualitative models. For the whole modeling process, the ten-fold cross-validation method was used to determine the optimal model parameters by examining whether the model was underfitting or overfitting within the calibration set.

2.5.1. Quantitative Models

As the Beer–Lambert law describes a linear relationship between the spectral absorbance and the relative concentration of components, the linear regression models would be first considered for quantifying the SSC by using absorbance spectrums. However, using all spectral variables to establish multiple linear regression models could lead to unstable inversions because of the multivariate collinearity in spectral data. Moreover, a large number of spectral variables relative to a small size of sample would even lead to an underdetermined situation while directly calculating regression coefficients of spectral variables. In view of this typical problem, it is necessary to compress the spectral variables and extract useful information for calibrating regression models. In this study, two widely used linear modeling algorithms with compression functions, namely principal components regression (PCR) and partial least squares regression (PLSR) algorithms, were applied. In principle, PCR model found orthogonal principal components according to the variance of the spectral matrix and then regressed onto the measured SSC values. Therefore, the key step of calibrating PCR model was to determine the optimal number of principal components. Similarly, PLSR sought to find latent variables, which both capture variance and achieve correlation between the spectral variables as predictors and SSC values as response variables. In other words, the PLSR model attempted to maximize the covariance of predictors and response variables during the modeling process, which integrated the advantages of multiple linear regression and PCR. Likewise, the number of latent variables also needs to be optimized by using the cross-validation method.
Besides, the ANN models using backpropagation network (BPN) were further trained to investigate better performance models by using the same principal components from the PCR model and latent variables from PLSR model severally. The parameters learn rate and learn cycles for training were set to 0.125 and 20, respectively. Considering the simple linear relationship between the predictors and response variable, only one hidden layer was used in ANN models. The number of nodes in the hidden layer was optimized by training models, including nodes over a range from 1 to 10, with a step of 1 in this study. The optimal number was finally determined while the model produced a minimum RMSECV during the cross-validation process.
In addition, the F-test method was used to verify the statistical significance of the calibrated regression models by judging the significance of a model at a confidence level of 0.01 according to the calculated p-value.

2.5.2. Qualitative Models

The k-nearest neighbor (KNN) model is commonly used for classification purposes by measuring the distance between the unknown sample and the K nearest samples. The voting mechanism is designed to determine the category of the unknown sample according to the category of these K samples. To obtain optimal K value, this study built KNN models with different K values from 3 to 11 with a step of 2 as well as Euclidean distance for a measure in the calibration set. The parameter K was saved when the model generated the highest overall accuracy.
Partial least-squares discriminant analysis (PLSDA) is also widely used for classification which is developed from the PLSR method. By using constant values as variables of sample categories, PLSDA model adds a threshold for prediction results to achieve discrimination purposes. For multi-class classification purposes in this study, the PLSDA model was composed of three PLSDA models for three maturity grades. To be specific, each sub-model only needed to deal with the binary classification problem by treating the target grade of samples as one category while combining the other samples into another category. In this way, the same number of latent variables for three sub-models was determined from 1 to 20 with a step of 1 by inspecting the overall accuracy during the cross-validation process.
The support vector machine discriminant analysis (SVMDA) algorithm is known for its strong nonlinear fitting ability. The basic idea of SVMDA algorithm is that it first maps the spectral data into higher dimensional spaces and then uses a finite number of samples, called support vector machines, to optimize a hyperplane as a discriminant threshold. Gamma value and penalty coefficient cost are two important parameters while optimizing such a hyperplane. The gamma value belongs to the radial basis function (RBF), which was selected as the mapping function in this study, it controlled the width of the Gaussian kernel and, in turn, determined the shape of the hyperplane. The penalty coefficient cost was a measure that related to all misclassified samples by the present separating hyperplane. Both gamma and cost values were crucial to generate the optimal hyperplane. Hence, the grid-search method was used to search the optimal gamma and cost values from 10−8 to 108 spaced uniformly at one in the log, and the above two parameters of the model that produced the highest overall accuracy for the calibration set in the cross-validation stage were further used to establish final model.

2.6. Evaluation of Model Performance

When quantitative and qualitative analyses were performed, appropriate indicators were used to evaluate the performance.
For quantitative models, the root mean square error (RMSE), the determination coefficient ( R 2 ), and ratio prediction to deviation (RPD) were used as performance indicators for quantitative models. RMSE is the average squared difference between the predicted values and the measured values of the samples, it measures the average magnitude of the errors made by the prediction model. R 2 represented the proportion of the variation in the response variable that was predictable from the spectral variables in this study, it provided a measure of how well observed outcomes were replicated by the prediction model. The formulas to calculate RMSE and R 2 values are shown in Equations (3) and (4):
R M S E ( R M S E C , R E S E C V , R M S E P ) = i n y i ^ y ¯ 2 n
where y i ^ is the SSC value of i t h sample predicted by model (°Brix), y ¯ is the mean SSC value of pineapple samples in data set (°Brix), and n is number of pineapple samples.
R 2 ( R C 2 , R C V 2 , R P 2 ) = i n y i ^ y ¯ 2 i n y i y ¯ 2
where y i is the measured SSC value of i t h sample (°Brix).
RPD is related with the ability of the prediction model to predict unknown samples in relation to the initial variability of the calibration set, it can be calculated according to Equation (5):
R P D = S D R M S E P
where S D is the standard deviation of SSC values of samples in the validation set (°Brix), R M S E P is the root mean square error of prediction for the validation set (°Brix).
For qualitative models, precision, recall, and overall accuracy were used as performance metrics for qualitative models, which were primarily concerned with evaluating the classification performance of machine learning models. These three metrics were calculated from confusion matrix results while predicting the calibration set and the validation set. Precision (from Equation (6)) represented the fraction of relevant instances among the retrieved instances. Recall (from Equation (7)) was the fraction of relevant instances that were retrieved. Overall accuracy (from Equation (8)) was the ratio of the number of correctly classified samples to the total number of samples in the calibration set or validation set.
P r e c i s i o n = T P T P + F P
R e c a l l = T P T P + F N
O v e r a l l   a c c u r a c y = T P + T N T P + T N + F P + F N
where T P , F P , T N , F N represent the add-up number of samples, which are divided into groups of true positive, false positive, true negative, and false negative, respectively.

3. Results and Discussion

3.1. Internal Quality of Pineapple Samples

Table 1 shows a summary of the numbers of pineapple samples in different maturity grades, as well as the statistical results of measured SSC values per each grade in the calibration set and the verification set. A total of 130 samples in the calibration set were prepared that were used for establishing qualitative models and quantitative models for detection of the internal quality of pineapples. Furthermore, an independent validation set including 65 samples was organized to verify the performance of prediction models. In other words, the samples in the validation set did not participate in the modeling process. In the calibration set, the SSC values of a total of 130 samples ranged from 13.40 °Brix to 20.40 °Brix, with a mean of 17.33 °Brix. Meanwhile, the SSC values of a total of 65 samples in the validation set generated a similar distribution to the calibration set, with a mean of 17.28 °Brix, ranging from 13.60 °Brix to 20.27 °Brix. Boxplot diagrams were drawn in Figure 3 to show the distribution details of measured SSC values in different maturity grades. Notably, the mean SSC values of pineapples in the mature grade were slightly higher than those samples in the immature grade. It indicated that pineapples reached a high SSC value before they turned transparent, which was a water-soaked appearance with a flat and overripe flavor [31]. However, the mean SSC values of pineapples judged as overmature grade were much lower than pineapples in immature grade and mature grade. This is mainly because the SSC of a pineapple increased at the anterior ripening stage, but it decreased towards the end of the posterior ripening period [32]. In other words, the taste quality of the overmature pineapple would successively decrease because the SSC was an important factor affecting sensory evaluation. Besides, the SSC range of pineapple samples in this study was different from that reported in previous studies [21] (7.6–13.9 °Brix with a mean of 11.03 °Brix) and [22] (11.90–18.60 °Brix with a mean of 14.81 °Brix). This might result from diverse factors, such as cultivars, planting modes, soil conditions, maturity grades.

3.2. Spectrums of Pineapple Samples

Figure 4 plots the transmittance spectrums of all pineapple samples (n = 195) in the wavelength range of 400–1100 nm. The relative transmittance spectrums after correction with dark and reference spectrums are plotted in Figure 4a. It is evident that the transmittance spectrums of pineapples had a high amplitude in wavelength bands 700–900 nm. The absorbance spectrums, which were converted from the relative transmittance spectrums, are plotted in Figure 4b. In this way, it could be more intuitively observed that the pineapple samples had a lower absorption to light sources in wavelength bands 700–900 nm. In Figure 4b, two absorption valleys at around 730 nm and 810 nm had also appeared in a previous study, while Tantinantrakun et al. [3] applied short wavelength NIR spectroscopy in a range of 665–955 nm for detection of he pineapple maturity index. This was mainly because similar tissue structure and main compounds, such as water, SSC, and other carbohydrates of pineapple determined similar spectral absorptions. The absorbance peak at around 680 nm was the characteristic wavelength of chlorophyll [33].
Because of the irregular shape and cratering of the surface of pineapples, jitter noise, and spectral scattering were obtained from the absorption spectrums in Figure 4b. After preprocessing with smoothing to reduce the jitter noise and MSC treatments for correcting the light scattering, the whole spectrums and the mean spectrums of all samples in three maturity grades are plotted in Figure 4c,d, respectively. The spectral characteristics of pineapples in different maturity grades were mainly concentrated in two wavelength band regions, ranging from 710 to 870 nm and from 930 to 1050 nm. Furthermore, pineapples in different grades showed opposite absorption trends in these two regions. In the range of 710–870 nm, the more mature the pineapples are, the less light source composition the pineapples absorbed. The range of 710–780 nm could be explained as the characteristics of the fourth overtones of the vibrations from the -CH3, -CH2, and -CH functional groups, which relate to carbohydrates. Moreover, the absorption region between 870 and 930 nm is the third overtone vibrational absorptions of -CH, -CH2, and -CH3, and similar functional groups that belong to SSC content, sugar, and other carbohydrates. On the contrary, the pineapples absorbed more of the light source in the wavelength bands 930–1050 nm as the fruits became more mature. Besides, the overmature pineapples generated higher absorbance in wavelength bands 500–680 nm than immature and mature pineapples, while immature and mature pineapples had similar absorbance in these wavelength bands. In this study, the absorbance spectrums preprocessed with combined pretreatments of smoothing and MSC were used for further modeling analysis.

3.3. Qualitative Models for Discriminating Maturity Grades

Table 2 summarizes the results of confusion matrices predicted by KNN, PLSDA, and SVMDA models, the optimal parameters of all models were determined by cross-validation method. The actual pineapple numbers in each maturity grade are recorded in rows for calculating the recall metric. The columns give the number of pineapples that are classified into different grades by prediction models for calculating the precision metric. The intersections of recall and precision in Table 2 were the overall accuracies of models. In general, three models yielded overall accuracies higher than 85.0% both in the calibration set and the validation set. It could be interpreted that all the tested three modeling algorithms could extract effective characteristics from spectrums for detection of pineapple maturities, since visually visible differences of spectrums had been found from three maturity grades in Figure 4. Among the three models, the SVMDA model demonstrated a better fit to the calibration set than the other two models, giving the highest overall accuracy of 94.6%. However, the SVMDA model did not perform equally well for the validation set, only gaving an overall accuracy of 87.7%. The KNN model only generated an overall accuracy of 86.9% for the calibration set, but it resulted in a higher overall accuracy in the validation set of 87.7% just as the SVMDA model did. The PLSDA model generated a higher overall accuracy of 90.8% for the validation set than SVMDA did, which was considered the most robust model of all calibrated models. Besides, the precisions for predicting overmature pineapples all reached 100.0% by three models for the calibration set, the misclassified pineapple samples were mainly between the immature grade and mature grade. Bakar et al. [14] also reported the prediction accuracy for fully ripe pineapples was higher than for unripe and ripe level pineapples. This is mainly because the feature differences between overmature samples and the other samples were large, while the feature differences between immature samples and mature samples were small. Tantinantrakun et al. [3] established quantitative models for determining pineapple maturity based on spectral data while calculating the ratio of total soluble solids (TSS) to titratable acidity (TA) as the maturity index. Their results showed that the PLSR model based on transmittance short wavelength NIR spectroscopy (665–955 nm) generated R C V 2 of 0.70 and RMSECV of 2.16. It might be a helpful way to flexibly set the threshold of maturity index for sorting pineapple toward different consumer demands. As a whole, high overall accuracies from classification models indicated that using the VIS/NIR transmittance spectroscopy technique and machine learning methods could successfully achieve a nondestructive detection of pineapple maturity. Meanwhile, more noise reduction algorithms still need to be developed to improve the prediction accuracy of the model since the structure design of NIR instrument, as well as the environmental conditions under which the NIR instrument operated, would bring noise to the spectral data. Establishing a model with more sample data would be another useful way to improve model performance since the model could handle more diverse unknown samples.

3.4. Quantification Models for Determining SSC Values

Table 3 shows the results of regression models for determining SSC values of pineapples, and Figure 5 shows the prediction details of regression models both for the calibration set and the validation set. The optimum parameters for different models were selected when the model produced the lowest RMSECV value through the cross-validation process. The PCR and PLSR models were first calibrated. As a result, the determination coefficient of prediction ( R P 2 ) from PCR model was 0.7147 when using six principal components, with an RMSEP value of 0.8591 °Brix. The PLSR model using five latent variables could generate slightly better results than the PCR model, with a higher R P 2 of 0.7455 and a lower RMSEP value of 0.8120 °Brix. The PLSR model performed better than PCR model with less compressed components, possibly, mainly because of that the PLS algorithm had a better trade-off to capture the relevant component associated with the output variable rather than the components only with high variance. In a previous study, it was reported that the Bayesian ANN model coupled with the robust principal components achieved satisfactory calibration and prediction performance for determining the SSC of pineapples [20]. In order to investigate better models, the ANN models were also trained by using the same principal component variables and latent variables as input variables like PCR and PLSR did, respectively. Benefiting from the powerful fitting ability of the ANN algorithm, the ANN-PCA model and the ANN-PLS model performed better than the PCR model and the PLSR model both in the calibration set and the validation set. By training with the ANN algorithm, the R P 2 of ANN-PCA model increased the R P 2 to 0.7238 and reduced the RMSEP to 0.8451 °Brix. The R P 2 of ANN-PLS also reached a higher R P 2 value of 0.7596 and lower RMSEP of 0.7879 °Brix than the PLSR model. It was close to the results from Chia et al. [20], where they combined the VIS-SWNIR (650–1000 nm) technique with ANN model for predicting the SSC of pineapple (RMSEP values in a range of 0.71–1.14 °Brix). It could be explained that the ANN model had calculated preferable weights of spectral variables for determining the SSC of pineapples. In summary, four calibrated models could pass the significance test of the F-statistic at a 99.9% confidence level since all p-values were lower than 0.001. All these models produced RPD values in the range between 1.7 and 2.42, which were reported to be usable for screening [34]. These results suggest that VIS/NIR transmittance spectroscopy technique is promising for determining the SSC of pineapples. Noticeably, it is crucial to select an appropriate reference method for accurate detection of SSC values to establish a detection model for the practice production process. Besides, more samples with a broader reference value range are required to build the model. It would be useful to improve model performance while handling more diverse unknown samples.

3.5. Characteristic Spectral Variables for Determining Internal Quality of Pineapple Samples

As the PLS modeling algorithm was applied for calibrating models to detect maturity grades and SSC values, the regression coefficients calculated by the PLS model were used to interpret the characteristic spectral variables for determining pineapple maturity and SSC content of pineapple. The larger the absolute coefficient, the more important the spectral variable was to the prediction model. Since PLSDA combined the other samples in different maturity grades into one category while detecting samples in a single maturity grade, three coefficient vectors were extracted from the PLSDA model and plotted in Figure 6a. Relatively large fluctuations could be observed between 720 and 930 nm, which belonged to the fourth and third overtone vibrational absorptions of functional groups related to carbohydrates. What is more, wavelength bands at around 755, 810, 840, and 915 nm were the characteristic bands identified by the PLS algorithm for classifying pineapple maturities. The wavelength bands at around 840 nm were mainly related to the absorbance of water [3]. It was reasonable that the moisture content of pineapple varied closely with maturity. Figure 6b shows a different pattern of coefficients for SSC determination from those for maturity discrimination. Characteristic wavelength bands at 425, 475, 710, 755, 810, 875, and 955 nm could obtain high absolute values of coefficients, which were more related to the absorption of light source by SSC in pineapples. The similar wavelength bands 754, 950, and 960 nm were also considered useful for determining the total soluble solids (TSS) content of pineapple in a study of Amuah et al. [22]. They reported that these wavelengths were related to functional groups of -CH and -OH, which were attributed to TSS. Besides, 755 and 810 nm were simultaneously identified by the PLSR model and the PLSDA model, showing spectral variables around these two bands were related to SSC content as well as indicating the maturities of pineapples. However, the wavelength bands between 550 and 700 nm did not provide highly relevant information for detection of pineapple maturity and SSC content. This was also reported by Rahim et al. [21] that wavelengths in the vicinity of the spectrum 662–700 nm lacked useful information for the SSC assessment of pineapples.

4. Conclusions

This study established accurate and robust models for detection of the internal quality of pineapples by using VIS/NIR transmittance spectroscopy and machine learning modeling methods. The qualitative model for discriminating maturity grades of pineapple achieved a high accuracy of 90.8% by PLSR model both for the calibration set and the validation set. Meanwhile, the quantitative model for determining soluble solids content (SSC) also reached the high determination coefficient ( R P 2 ) of 0.7596 and low root mean square error of prediction (RMSEP) of 0.7879 °Brix by ANN-PLS model among all tested modeling algorithms. The high performances of the qualitative model and the quantitative model suggested that the VIS/NIR transmittance spectroscopy technique could be successfully applied for rapid and nondestructive detection of the internal quality of pineapples. Additionally, the regression coefficients calculated from the PLS models indicated that the spectral variables around 755 and 810 nm were both related to maturity grades and SSC absorption of pineapples, which verified the correlation between the SSC and pineapple maturities as previous studies reported. Overall, this study demonstrated a feasible method to nondestructively detect the internal quality of pineapples by using VIS/NIR transmittance spectroscopy technique coupled with machine learning methodologies as an effort to bring the spectral techniques developed in the academy closer to meeting the requirements found in practice. The next step could be to integrate the detection models into a pipeline equipment system with detection units and sorting units for practical application research.

Author Contributions

Conceptualization and project administration, H.L.; resources and data curation X.L.; methodology, C.F.; investigation and formal analysis, C.W.; software, visualization and writing—original draft preparation, G.Q.; validation and writing—review and editing, H.L. and S.X.; supervision and writing—review and editing, X.W.; funding acquisition, H.L. and G.Q. All authors have read and agreed to the published version of the manuscript.

Funding

This research was funded by Laboratory of Lingnan Modern Agriculture Project (NT2021009) and also supported by Guangzhou Science and Technology Planning Project (202201010659); Youth Training Program of Guangdong Academy of Agricultural Sciences (No. R2020QD-061); Natural Science Foundation of Guangdong Province (2021A1515010834); New Developing Subject Construction Program of Guangdong Academy of Agricultural Science (202134T); Talent Training Program of Guangdong Academy of Agricultural Science (R2020PY-JJX020); and Young Talent Support Project of Guangzhou Association for Science and Technology.

Data Availability Statement

Not applicable.

Conflicts of Interest

The authors declare no conflict of interest.

References

  1. Siti Rashima, R.; Maizura, M.; Wan Nur Hafzan, W.M.; Hazzeman, H. Physicochemical properties and sensory acceptability of pineapples of different varieties and stages of maturity. Food Res. 2019, 3, 491–500. [Google Scholar]
  2. Mohd, A.M.; Hashim, N.; Abd, A.S.; Lasekan, O. Pineapple (Ananas comosus): A comprehensive review of nutritional values, volatile compounds, health benefits, and potential food products. Food Res. Int. 2020, 137, 109675. [Google Scholar] [CrossRef]
  3. Tantinantrakun, A.; Sukwanit, S.; Thompson, A.K.; Teerachaichayut, S. Nondestructive evaluation of SW-NIRS and NIR-HSI for predicting the maturity index of intact pineapples. Postharvest Biol. Technol. 2023, 195, 112141. [Google Scholar] [CrossRef]
  4. FAO. Major Tropical Fruit Preliminary Results 2020. 2021. Available online: https://www.fao.org/3/cb6196en/cb6196en.pdf (accessed on 15 June 2023).
  5. FAO. Production Quantities of Pineapples in 2021. 2021. Available online: https://www.fao.org (accessed on 15 June 2023).
  6. Steingass, C.B.; Grauwet, T.; Carle, R. Influence of harvest maturity and fruit logistics on pineapple (Ananas comosus [L.] Merr.) volatiles assessed by headspace solid phase microextraction and gas chromatography–mass spectrometry (HS-SPME-GC/MS). Food Chem. 2014, 150, 382–391. [Google Scholar] [CrossRef] [PubMed]
  7. Hussain, A.; Pu, H.; Sun, D. Innovative nondestructive imaging techniques for ripening and maturity of fruits—A review of recent applications. Trends Food Sci. Technol. 2018, 72, 144–152. [Google Scholar] [CrossRef]
  8. Li, B.; Lecourt, J.; Bishop, G. Advances in Non-Destructive Early Assessment of Fruit Ripeness towards Defining Optimal Time of Harvest and Yield Prediction—A Review. Plants 2018, 7, 3. [Google Scholar] [CrossRef] [Green Version]
  9. Chang, C.; Kuan, C.; Tseng, H.; Lee, P.; Tsai, S.; Chen, S. Using deep learning to identify maturity and 3D distance in pineapple fields. Sci. Rep. 2022, 12, 8749. [Google Scholar] [CrossRef] [PubMed]
  10. Ikram, M.M.M.; Ridwani, S.; Putri, S.P.; Fukusaki, E. GC-MS Based Metabolite Profiling to Monitor Ripening-Specific Metabolites in Pineapple (Ananas comosus). Metabolites 2020, 10, 134. [Google Scholar] [CrossRef] [PubMed] [Green Version]
  11. Torri, L.; Sinelli, N.; Limbo, S. Shelf life evaluation of fresh-cut pineapple by using an electronic nose. Postharvest Biol. Technol. 2010, 56, 239–245. [Google Scholar] [CrossRef]
  12. Kaewapichai, W.; Kaewtrakulpong, P.; Prateepasen, A. A Real-Time Automatic Inspection System for Pattavia Pineapples. Key Eng. Mater. 2006, 321–323, 1186–1191. [Google Scholar] [CrossRef]
  13. Ali, M.M.; Hashim, N.; Aziz, S.A.; Lasekan, O. An overview of non-destructive approaches for quality determination in pineapples. J. Agric. Food Eng. 2020, 1, 1–7. [Google Scholar]
  14. Bakar, B.H.A.; Ishak, A.J.; Shamsuddin, R.; Hassan, W.Z.W. Ripeness level classification for pineapple using RGB and HSI colour maps. J. Theor. Appl. Inf. Technol. 2013, 57, 587–593. [Google Scholar]
  15. Cuong, N.H.H.; Trinh, T.H.; Meesad, P.; Nguyen, T.T. Improved YOLO object detection algorithm to detect ripe pineapple phase. J. Intell. Fuzzy Syst. 2022, 43, 1365–1381. [Google Scholar] [CrossRef]
  16. Sornsrivichai, J.; Yantarasri, T.; Kalayanamitra, K. Nondestructive techniques for quality evaluation of pineapple fruits. Acta Hortic. 2000, 529, 337–341. [Google Scholar] [CrossRef]
  17. Vanoli, M.; Buccheri, M. Overview of the methods for assessing harvest maturity. Stewart Postharvest Rev. 2012, 8, 1–11. [Google Scholar]
  18. Wang, H.; Peng, J.; Xie, C.; Bao, Y.; He, Y. Fruit Quality Evaluation Using Spectroscopy Technology: A Review. Sensors 2015, 15, 11889–11927. [Google Scholar] [CrossRef] [Green Version]
  19. Pathaveerat, S.; Terdwongworakul, A.; Phaungsombut, A. Multivariate data analysis for classification of pineapple maturity. J. Food Eng. 2008, 89, 112–118. [Google Scholar] [CrossRef]
  20. Chia, K.S.; Abdul Rahim, H.; Abdul Rahim, R. Prediction of soluble solids content of pineapple via non-invasive low cost visible and shortwave near infrared spectroscopy and artificial neural network. Biosyst. Eng. 2012, 113, 158–165. [Google Scholar] [CrossRef]
  21. Rahim, H.A.; Seng, C.K.; Rahim, R.A. Analysis for Soluble Solid Contents in Pineapples using NIR Spectroscopy. J. Teknol. 2014, 8, 7–11. [Google Scholar]
  22. Amuah, C.L.Y.; Teye, E.; Lamptey, F.P.; Nyandey, K.; Opoku-Ansah, J.; Adueming, P.O. Feasibility Study of the Use of Handheld NIR Spectrometer for Simultaneous Authentication and Quantification of Quality Parameters in Intact Pineapple Fruits. J. Spectrosc. 2019, 2019, 1–9. [Google Scholar] [CrossRef] [Green Version]
  23. Khodabakhshian, R.; Emadi, B.; Khojastehpour, M.; Golzarian, M.R. A comparative study of reflectance and transmittance modes of Vis/NIR spectroscopy used in determining internal quality attributes in pomegranate fruits. J. Food Meas. Charact. 2019, 13, 3130–3139. [Google Scholar] [CrossRef]
  24. Jie, D.; Zhou, W.; Wei, X. Nondestructive detection of maturity of watermelon by spectral characteristic using NIR diffuse transmittance technique. Sci. Hortic. 2019, 257, 108718. [Google Scholar] [CrossRef]
  25. Xu, S.; Lu, H.; Wang, X.; Ference, C.M.; Liang, X.; Qiu, G. Nondestructive Detection of Internal Flavor in Shatian Pomelo Fruit Based on Visible Near Infrared Spectroscopy. Hortscience 2021, 56, 1325–1330. [Google Scholar] [CrossRef]
  26. Zhang, Q.; Huang, W.; Wang, Q.; Wu, J.; Li, J. Detection of pears with moldy core using online full-transmittance spectroscopy combined with supervised classifier comparison and variable optimization. Comput. Electron. Agric. 2022, 200, 107231. [Google Scholar] [CrossRef]
  27. Wang, J.; Guo, Z.; Zou, C.; Jiang, S.; El-Seedi, H.R.; Zou, X. General model of multi-quality detection for apple from different origins by Vis/NIR transmittance spectroscopy. J. Food Meas. Charact. 2022, 16, 2582–2595. [Google Scholar] [CrossRef]
  28. Zhang, K.; Jiang, H.; Zhang, H.; Zhao, Z.; Yang, Y.; Guo, S.; Wang, W. Online Detection and Classification of Moldy Core Apples by Vis-NIR Transmittance Spectroscopy. Agriculture 2022, 12, 489. [Google Scholar] [CrossRef]
  29. Zhang, Q.; Liu, Y.; He, C.; Zhu, S. Postharvest Exogenous Application of Abscisic Acid Reduces Internal Browning in Pineapple. J. Agric. Food Chem. 2015, 63, 5313–5320. [Google Scholar] [CrossRef]
  30. Xu, S.; Ren, J.; Lu, H.; Wang, X.; Sun, X.; Liang, X. Nondestructive detection and grading of flesh translucency in pineapples with visible and near-infrared spectroscopy. Postharvest Biol. Technol. 2022, 192, 112029. [Google Scholar] [CrossRef]
  31. Chen, C.; Paull, R.E. Sugar Metabolism and Pineapple Flesh Translucency. J. Am. Soc. Hortic. Sci. 2000, 125, 558–562. [Google Scholar] [CrossRef] [Green Version]
  32. Shamsudin, R.; Daud, W.R.W.; Takriff, M.S.; Hassan, O. Physicochemical properties of the josapine variety of pineapple fruit. Int. J. Food Eng. 2007, 3, 1–8. [Google Scholar] [CrossRef]
  33. Walsh, K.B.; Blasco, J.; Zude-Sasse, M.; Sun, X. Visible-NIR ‘point’ spectroscopy in postharvest fruit and vegetable assessment: The science behind three decades of commercial use. Postharvest Biol. Technol. 2020, 168, 111246. [Google Scholar] [CrossRef]
  34. Esteve Agelet, L.; Armstrong, P.R.; Romagosa Clariana, I.; Hurburgh, C.R. Measurement of Single Soybean Seed Attributes by Near-Infrared Technologies. A Comparative Study. J. Agric. Food Chem. 2012, 60, 8314–8322. [Google Scholar] [CrossRef] [PubMed]
Figure 1. Schematic drawing of acquisition system for collecting VIS/NIR transmittance spectrums.
Horticulturae 09 00889 g001
Figure 2. Photographs representing maturity grades of pineapple samples: (a) Grade A, immature; (b) Grade B, mature; (c) Grade C, overmature.
Horticulturae 09 00889 g002
Figure 3. Boxplot diagrams of the distribution range of measured SSC values of pineapple samples in calibration set and verification set.
Horticulturae 09 00889 g003
Figure 4. Visible and near-infrared spectral data acquired from pineapple samples: (a) Relative transmittance spectrums of all samples (sample individuals are identified by different color), (b) absorbance spectrums of all samples (sample individuals are identified by different color), (c) absorbance spectrums preprocessed with smoothing and MSC treatments of all samples in three maturity grades, (d) mean spectrums of absorbance spectrums preprocessed with smoothing and MSC treatments in three maturity grades.
Horticulturae 09 00889 g004
Figure 5. The prediction results of different regression models for the calibration set and the validation set: (a) PCR regression model, (b) PLSR regression model, (c) ANN-PCA regression model, (d) ANN-PLS regression model.
Horticulturae 09 00889 g005
Figure 6. Regression coefficients of PLSDA model and PLSR model for detection of the internal quality of pineapple samples: (a) Coefficient vectors for detection of maturity grades of pineapples, (b) coefficient vector for determining SSC values of pineapples.
Horticulturae 09 00889 g006
Table 1. Number of pineapple samples in different maturity grades and statistics of measured SSC values in calibration set and verification set.
Data SetsMaturity GradesNumber of SamplesSSC (°Brix)
MinMaxMeand SD
Calibration set a Grade A5415.7319.8717.800.9826
b Grade B4216.4720.4018.511.0303
c Grade C3413.4017.0015.121.1033
Total13013.4020.4017.331.6983
Validation set Grade A3115.7320.0717.771.1249
Grade B1917.1320.2718.250.9064
Grade C1513.6017.2015.050.9529
Total6513.6020.2717.281.6048
Notes: a Grade A, immature grade; b Grade B, mature grade; c Grade C, overmature grade; and d SD, standard deviation.
Table 2. The confusion matrices of different classification models for discriminating maturity grades during calibration and validation processes.
Models
(Parameters)
Prediction of Calibration SetPrediction of Validation Set
Grade AGrade BGrade CRecall
(%)
Grade AGrade BGrade CRecall
(%)
Actual maturity
KNN
(K = 5)
a Grade A477087.0274087.1
b Grade B933078.6315178.9
c Grade C013397.10015100.0
Precision (%)83.980.5100.086.990.078.993.887.7
PLSDA
(d LVs = 7)
Grade A477087.0292093.5
Grade B438090.5415078.9
Grade C013397.10015100.0
Precision (%)92.282.6100.090.887.988.2100.090.8
SVMDA
(gamma = 10−6, cost = 106)
Grade A522096.3283090.3
Grade B438090.5315178.9
Grade C013397.1011493.3
Precision (%)92.992.7100.094.690.378.993.387.7
Notes: a Grade A, immature grade; b Grade B, mature grade; c Grade C, overmature grade; and d LVs, number of latent variables.
Table 3. The results of different regression models for determining SSC values during calibration and validation processes.
ModelsParametersRMSEC
(°Brix)
R C 2 RMSECV
(°Brix)
R C V 2 RMSEP
(°Brix)
R P 2 RPDp-Value
PCRa PCs = 60.78780.78320.81890.76580.85910.71471.8680<0.001
PLSRb LVs = 50.76740.79420.81070.77060.81200.74551.9763<0.001
c ANN-PCAPCs = 6, nodes = 50.75580.80040.81680.76810.84510.72381.8989<0.001
d ANN-PLSLVs = 5, nodes = 40.70760.82510.80930.77190.78790.75962.0369<0.001
Notes: a PCs, number of principal components; b LVs, number of latent variables; c ANN-PCA, ANN model using principal components compressed by principal component analysis algorithm (PCA) as input variables; d ANN-PLS, ANN model using latent variables compressed by partial least squares algorithm (PLS) as input variables.
Disclaimer/Publisher’s Note: The statements, opinions and data contained in all publications are solely those of the individual author(s) and contributor(s) and not of MDPI and/or the editor(s). MDPI and/or the editor(s) disclaim responsibility for any injury to people or property resulting from any ideas, methods, instructions or products referred to in the content.

