Article

Vermicompost Improves Tomato Yield and Quality by Promoting Carbohydrate Transport to Fruit under Salt Stress

1
College of Land and Environment, Shenyang Agricultural University, Shenyang 110866, China
2
Institute of Plant Nutrition and Environmental Resources, Liaoning Academy of Agricultural Sciences, Shenyang 110866, China
3
Key Laboratory of Protected Horticulture, Shenyang Agricultural University, Ministry of Education, Shenyang 110866, China
*
Authors to whom correspondence should be addressed.
Horticulturae 2023, 9(9), 1015; https://doi.org/10.3390/horticulturae9091015
Submission received: 5 August 2023 / Revised: 28 August 2023 / Accepted: 5 September 2023 / Published: 9 September 2023

Abstract

:
To explore the effect of vermicompost on the yield and quality of tomato cultivated in salty soil, we investigated the soil chemical properties, the yield, vitamin C, organic acid, soluble solids, and nitrate of fruit, photosynthesis, and carbohydrates of plants grown under various salt levels applied with the application of either commercial chemical fertilizers, cow manure, or vermicompost. Results showed that the tomato yield was not increased from the chemical fertilizer application, while there was an increase from the cow manure and vermicompost (increased 31.7% and 65.2%, respectively) under salt stress. Compared to no salt stress, the contents of vitamin C, organic acid, soluble solids, and nitrate increased 26.55%, 40.59%, 46.31%, and 35.08%, respectively, under salt stress (2 g NaCl·kg−1 soil). Compared with the Control, the application of chemical fertilizers failed to improve the sugar/acid ratio but increased nitrate content, while cow manure and vermicompost improved the sugar/acid ratio by 42.0% and 73.1%, respectively. Particularly, vermicompost increased vitamin C and reduced nitrate to the greatest extent among the different fertilizer treatments. The decrease in sodium (Na+) in the roots and leaves, increase in carbohydrates in fruit, and photosynthetic efficiency of leaves imply an amendment effect of vermicompost on salt stress. Moreover, vermicompost also facilitated the transit of carbohydrates from leaves to fruits by increasing the accumulation of nitrogen, phosphate, and potassium in fruits, leaves, and roots, while decreasing proline and soluble protein accumulation in leaves and roots. In conclusion, vermicompost could alleviate the adverse effect of salt stress and improve tomato yield and fruit quality by improving the photosynthetic capacity and promoting carbohydrate transport to fruit. The findings give a new perspective on the beneficial effect of vermicompost on tomato yield and quality.

1. Introduction

The tomato (Solanum lycopersicum L.), a nutrient-rich fruit and vegetable crop, has been widely grown in the world. Excessive chemical fertilizer application and inappropriate irrigation are frequent practices during cultivation to maximize economic benefits. Consequently, this causes secondary soil salinization, resulting in a decrease in soil fertility and fruit quality. Soil salinity has emerged as a major threat to land degradation worldwide and a key contributor to lowering crop yield and quality [1,2,3]. Salinization is thought to be a hazard to about 20% of cultivated land and 50% of irrigated land worldwide [4,5]. A result of rising sea levels and the expansion of arid regions brought on by global warming, the amount of salinized soil is expanding substantially and has become one of the major issues restricting agricultural production [6,7]. Excessive application of solely chemical fertilizer can aggravate salt stress, especially under the conditions of large evaporation of soil water in protected cultivation [8,9]. Using organic manure is a practical way to ensure yield and improve the quality of crops, especially in saline soils [10,11].
Application of organic fertilizer, including cow manure, has been shown to promote the storage of carbon (C) in the soil, improve soil fertility and structural stability, and lessen the environmental issues brought on by chemical fertilizers [10,11,12]. Vermicompost is one of the excellent organic fertilizers, which has a good physical structure, abundant mineral elements, rich and active microbial populations, and contains large numbers of plant hormones and humus [13,14,15]. It is a conventional way to obtain vermicompost by digesting cow dung with earthworm. Previous studies have demonstrated that vermicompost can promote growth and increase the yield in maize [16], wheat [17], and barley [18] under salt stress. However, the promoting effect of vermicompost on plant growth is primarily attributed to the remediation of salty soil’s physical, chemical, and biological properties [16,17,19]. Little attention has been paid to whether vermicompost improves plant physiological and biochemical responses to salt stress. Vermicompost leachate, an aqueous extract of vermicompost, has been found in prior experiments to improve salt tolerance at the seedling stage [20,21]. However, the regulatory effects of vermicompost on the growth, yield, and quality of tomato plants at the full fruit stage under salt stress under conventional fertilizer application remain unknown, especially compared to cow manure.
In general, sodium chloride (NaCl) is the primary salt in salinized soils that is most detrimental to plants. By causing osmotic stress and ion toxicity in tissues, salt stress inhibits plant growth and development [22]. Osmotic stress causes water shortage in plant tissues and induces stomatal closure in leaves, thereby reducing photosynthetic efficiency [23,24]. Meanwhile, organic osmoregulatory substances including proline, soluble carbohydrates, and soluble proteins increased [25,26]. Numerous studies have proven that Na+ is the primary cause of ion toxicity in tomato tissues during salt stress [27,28]. Although the accumulation of Na+ plays a role in osmoregulation, it can also result in a reduction in absorption and imbalances in mineral nutrients [29,30]. In addition to balanced nutrients, vermicompost is rich in plant hormones that are essential for reducing salt stress, including benzoic acid (BzA), salicylic acid (SA), auxin (IAA), and cytokinins (CKs) [21,31]. It was verified that vermicompost can reduce Na+ accumulation in plants under salt stress [21,32].
In addition to well-studied amendment on soil properties, we presume that both vermicompost and cow manure can improve tomato yield and quality by reducing Na+ accumulation, which in turn may regulate the amount of osmoregulatory substances and ions in the plant. Although they help restore saline soil [14,17,19], we suspect a promotion of carbohydrate transport to fruit may be a determinant for improving yield and quality under salt stress. We also assume that the effect of vermicompost is superior to cow manure in alleviating salt stress and improving yield and quality of tomato. Therefore, the effects of vermicompost on soil chemical properties, yield, vitamin C, organic acid, soluble solids, and nitrate of fruit, photosynthesis, and carbohydrates of tomato cultivated in salty soil were investigated. The results obtained might advance our understanding of how vermicompost works to improve tomato yield and quality under salt stress.

2. Materials and Methods

2.1. Experimental Materials

Tomato seeds from a popular variety ‘NO.9 Zhongza’ were used for the current study. Vermicompost used in the experiment was obtained by adding earthworms (Eisenia fetida) to semi-decomposed cow manure and composted for 2 months until the cow manure was decomposed completely. The compost was run through a 2 mm screen to remove earthworms just before use. The chemical fertilizers used in the experiment were commercial fertilizers, and the basic properties are shown in Table 1. According to American Taxonomy, the soil used in the experiment was a non-tillage Hapli-Udic Alfisol soil, and the texture of the soil was sandy loam. After being naturally air-dried, the soil was filtered using a 1 cm sieve to remove contaminants. The basic properties of the original soil were as follows: pH 7.39, electrical conductivity (EC) 122 µS cm−1, organic matter (OM) 18.9 g kg−1, total N 0.947 g kg−1, total P2O5 1.12 g kg−1, total K2O 14.6 g kg−1, C/N 11.6, available N 92.4 mg kg−1, available P2O5 21.5 mg kg−1, available K2O 148 mg kg−1, water-soluble Na 35.4 mg kg−1, and water-soluble salt 0.593 g kg−1.

2.2. Experimental Environment Conditions

A pot experiment was conducted at a greenhouse of the Shenyang Agricultural University in Northeast China (123° 57′ E, 41° 83′ N). Average day/night temperature was 28–22 °C/15–12 °C under natural light, and relative humidity (RH) was 60% from August to December 2021. Same-sized tomato seedlings were chosen and randomly transplanted to pots with various treatments when they reached the fourth-leaf stage. Polyethylene plastic pots with a diameter of 30 cm and a height of 28 cm were used, and each pot contained 12 kg of air-dried soil. Before transplantation, the various soil treatments were blended evenly. The seedlings were irrigated with tap water to the full extent of the field’s water-holding capability before transplanting. The soil moisture was maintained throughout the experiment at roughly 70% of the field’s water-holding capacity, as measured gravimetrically. The position of the pots from each group was rearranged in a random order weekly.

2.3. Experimental Design and Treatments

The experiment had a randomized complete full factorial block design with two factors: fertilizer and salt stress. These salt levels—no added NaCl (S0), 1 g of added NaCl (S1), and 2 g of added NaCl (S2) per kg of soil—were selected for further experiments. There were 12 treatments in total, with each treatment repeated three times. Four fertilization levels were selected: no fertilizer (Control), chemical fertilizer (CF), cow manure (CM), and vermicompost (VM). The amount of chemical fertilizer applied in CF treatment that was mixed evenly was 45 g per pot, which includes 10.4 g of urea, 25.0 g of superphosphate, and 9.60 g of potassium sulfate per pot. Cow manure and vermicompost were both applied at a rate of 144 g per pot. The amount of N, P2O5, and K2O applied to CF, CM, and VM treatments were same to a previous study [33,34,35]. Urea, superphosphate, and potassium sulfate were used to balance the nutrient content of CF, CM, and VM soils, which resulted in nutrient contents of 900 kg of N, 563 kg of P2O5, and 900 kg of K2O per hectare. All fertilizers were applied to the soil before planting.
Soil and plant samples were collected at the seedling stage (15 DAT), flowering stage (40 DAT), fruiting stage (65 DAT), and harvesting stage (90 DAT) based on three independent biological replicates.

2.4. Determination of Soil Chemical Properties

Fresh soil passed through a 2 mm sieve was used to determine ammonium nitrogen (NH4+-N) and nitrate nitrogen (NO3-N) levels, immediately after sampling. Air-dried soil passed through a 0.15 mm sieve was used for the determination of pH, EC, available phosphorus (A-P), and available potassium (A-K).
The soil pH (soil: water, 1:2.5) and EC values (soil: water, 1:5) were measured using a Thunder Magnetic SJ-3F pH Meter (INESA, Shanghai, China) and a DDS-307 conductivity meter (INESA, Shanghai, China), respectively [36].
NH4+-N and NO3-N were extracted from the soil using 2 M KCl (5:1 v/w) and determined using the indophenol blue colorimetry [36] and dual-wavelength ultraviolet spectrophotometry methods, respectively [37]. Soil A-P was determined in sodium bicarbonate extraction following colorimetric measurement, while A-K was determined in an ammonium acetate extraction following flame ionization photometry [36].

2.5. Plant Sampling and Measurements

Plant dry weight (including plant pruning drops), relative chlorophyll content, and fruit, leaf, and root water content of tomato plants were measured at 90 DAT. Chlorophyll content was estimated on the leaf closest to the fruit stalk, using a chlorophyll meter (SPAD-502 Plus, Konica Minolta, Tokyo, Japan). The fresh weights of roots, stems, leaves, and fruits were recorded, and the samples were oven-dried at 105 °C for 30 min and then at 70 °C to a constant weight. The water content of different plant parts was calculated as water content (%) = (fresh weight − dry weight)/(fresh weight).

2.6. Determination of Leaf Gas Exchange Parameters

Leaf gas exchange parameters were measured on the leaf closest to the fruit stalk using a portable photosynthesis measurement system (Li-Cor 6400; LICOR, Lincoln, NE, USA) at 9:30–10:30 a.m. at 15, 40, 65, and 90 DAT. During the measurements, the chamber was maintained at 28 °C, 70% relative humidity (RH), and a CO2 concentration of 400 μmol mol−1. The light source was provided using an LED system delivering 1000 μmol m−2 s−1 PPFD. The leaf gas exchange parameters measured or calculated included net photosynthetic rate (Pn), stomatal conductance (gs), transpiration rate (Tr), intercellular CO2 concentration (Ci), water use efficiency (WUE = Pn/Tr), and stomatal limitation (Ls = 1 − Ci/Ca).

2.7. Determination of Root Activities

Fresh tomato roots were obtained and immediately used to measure root activity at 90 DAT according to the method described by Li, 2000 [38]. A total of 0.5 g of the root tip was treated with 5 mL of 4% 2, 3, 5-triphenyltetrazolium chloride reduction (TTC) solution and 5 mL of 1/15 M phosphate buffer (pH 7) in a plastic container. The mixture was then incubated at 37 °C in the dark for 2 h. The 2, 3, 5-triphenyltetrazolium formazan (TTF) was extracted with ethyl acetate, and the volume was adjusted to 10 mL. Absorbance at 485 nm was then measured. TTC reduction (TTF) per g of fresh root per hour (ug TTF g−1 h−1) was used as an indicator of root activity.

2.8. Yield and Fruit Quality Assays

Fruit fresh weight was used to calculate the yield. Fresh fruit samples (included pericarp, juice, and seeds) that were juiced were utilized to determine the fruit quality. Vitamin C content was expressed in milligrams of vitamin C per 100 g of fresh fruit (mg 100 g−1). Vitamin C content was determined as follows: 5 g of the crushed fresh sample was extracted with 25 mL of 2% oxalic acid solution, oxidized with 1 g of activated carbon, and then filtered. A total of 5 mL of the extract was added and mixed with 5 mL of 2% thiourea solution. A total of 2 mL of diluent was put in a test tube, and 0.5 mL of 2% 2, 4-dinitrophenylhydrazide colorimetry was added and incubated at 37 °C for 3 h, then cooled down to room temperature. A total of 2.5 mL of 85% sulfuric acid was then added, and then the absorbance at 520 nm was measured. The total acidity was determined using the neutralization titration method and expressed as a percentage [38]. Soluble solids were determined using a refractometer and expressed as a percentage (PAL-1, Atago, Tokyo, Japan) [38]. Nitrate was measured using salicylic acid colorimetry [38]. A total of 5 g of the freshly crushed sample was extracted in 30 mL of deionized water at 90 °C for 30 min, cooled, and filtered. A total of 0.1 mL of this extract was added to 0.4 mL of 5% salicylic acid-sulfuric acid solution and left for 20 min, followed by addition of 9.5 mL of 2 M sodium hydroxide solution. After cooling, the absorbance at 410 nm was measured. The sugar acid ratio was calculated as soluble sugar content/organic acid content.

2.9. Determination of N, P, Na+, and K+ in Fruits, Leaves, or Roots

Ground samples (0.2 g) of dried fruit, leaf, or root were dry-ashed and digested in a mixture of HNO3 and H2O2 (2/1, v/v), then diluted to 50 mL with deionized water [30]. The extracts were then quantitatively analyzed for Na+ and K+ using a flame photometer (Flame Photometer 6410, INESA, Shanghai, China). K+/Na+ ratio = K+ content/Na+ content. For N and P content determination, 0.2 g of dried fruits, leaves, and roots were digested with concentrated H2SO4 and H2O2 and diluted to 50 mL with deionized water. N and P content was determined by the Kjeldahl method and vanadium-molybdenum-blue photometric method [36].

2.10. Determination of Proline and Soluble Protein in Leaves and Roots

Proline content was determined according to the method published by Lynn et al. [39]. A total of 0.2 g of fresh leaves or roots was pulverized in a 3% aqueous solution of sulfosalicylic acid. The homogenates were transferred to a graduated test tube, centrifuged at 12,000× g, and then reacted with 3% glacial acetic acid and acid ninhydrin. Samples were incubated at 95 °C for 1 h, then cooled and extracted with 4 mL toluene. The mixture was measured for absorbance at 520 nm using a spectrophotometer.
Soluble protein was determined according to the method of Bradford [40] using bovine serum albumin as the standard. The sample (0.2 g of fresh leaves or roots) was ground in a mortar in a medium containing 50 mM phosphatic buffer solution (pH 7.8) and then centrifuged at 12,000× g at 4 °C. The mixture was measured for absorbance at 595 nm using a spectrophotometer.

2.11. Determination of Soluble Sugars and Starch in Fruits, Leaves, and Roots

Soluble sugars were extracted from 500 mg of fresh fruit and 50 mg of dried leaf or root powders, with 80% (v/v) ethanol at 80 °C for 30 min [41], centrifuged at 12,000× g for 10 min, and the clear solutions analyzed by anthrone colorimetry [42]. Pellets containing starch were oven-dried overnight at 60 °C. Starch in the pellet was first gelatinized by adding 1 mL of 0.2 M KOH and incubated in a boiling water bath for 30 min. After cooling, 0.2 mL of 1 M acetic acid was added, and the solution was incubated with 0.8 mL acetate buffer (pH 4.5) containing amyloglucosidase (6 units, Roche, Basel, Switzerland) at 55 °C for 1 h [43]. The reaction was terminated in a boiling water bath for 1 min and centrifuged, then the clear solutions were analyzed using anthrone colorimetry. Total nonstructural carbohydrates content was the sum of soluble sugar content and starch content.

2.12. Statistical Analyses

SPSS 22.0 (IBM, Chicago, IL, USA) software was used for one-way analysis of variance (ANOVA) between four fertilizer treatments under the same salt stress level, whereas two-way analysis of variance (ANOVA) was used between fertilizer treatments and salt stress level. The post hoc Duncan’s method (at p < 0.05) was used to test the significance of differences between treatments at each time point of each salt level, and significant differences between treatments were indicated using lowercase letters. The p-values of the major effect of fertilizer (F) and salt (S), as well as the interaction effect of the two factors (F × S), were shown. Values presented were means ± standard error (SE) of three independent biological replicates. All graphs were plotted and generated using Origin 8.0 software (OriginLab, Northampton, MA, USA).

3. Results

3.1. Effect of Fertilization on Soil Ph, Ec, and Available Nutrients under Salt Stress

Application of fertilizer and salt both showed main impacts on pH and EC at 15, 40, 65, and 90 DAT, respectively (Table 2). The EC showed a rising trend until 40 DAT; after which, it gradually decreased in each salt level (Figure 1B). Moreover, EC was dramatically higher in CF, CM, and VM treatments than that of Control at each salt level. Compared with that of CF treatments, the pH was obviously higher in VM treatment at 65 and 90 DAT under salt stress (Figure 1A). Compared with that of CF treatments, the EC was obviously lower in VM treatment at 90 DAT under salt stress (Figure 1B).
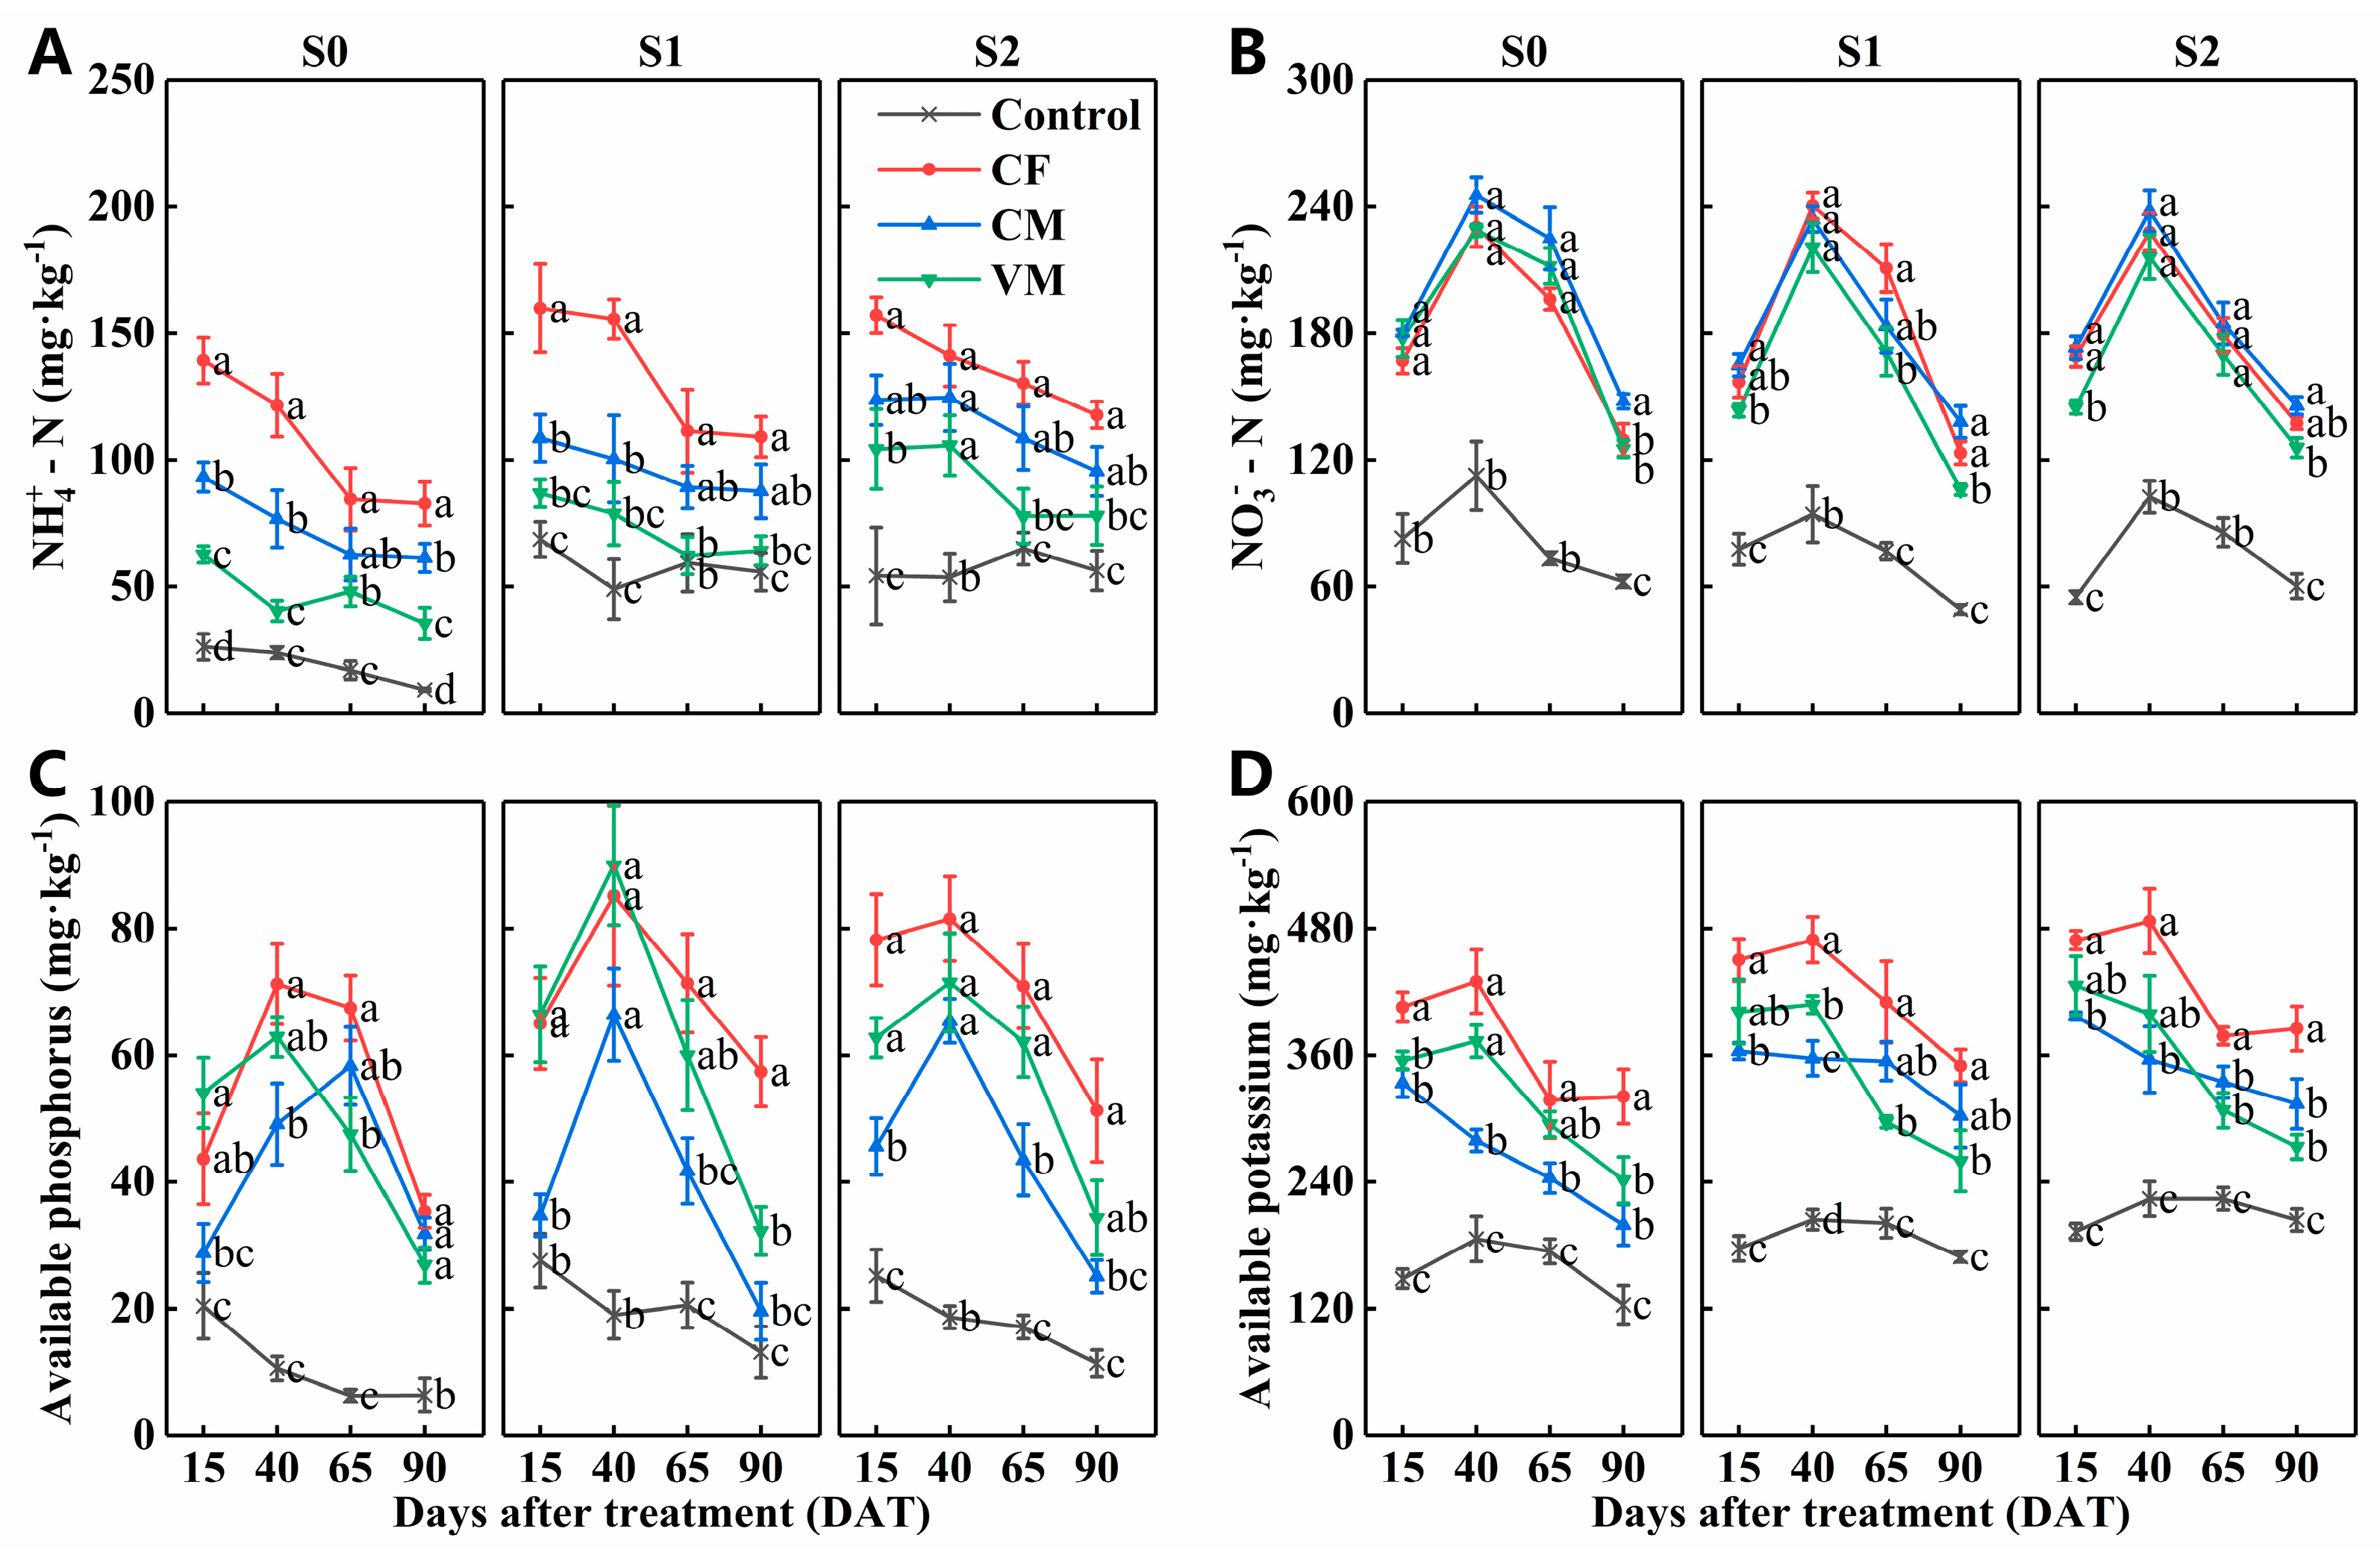
Fertilizer had a significant main effect on NH4+-N, NO3-N, A-P, and A-K at 15, 40, 65, and 90 DAT, respectively. Salt only showed a remarkably main effect on NH4+-N and A-K at 15, 40, 65, and 90 DAT, while the NO3-N was remarkably impacted at 15, 65, and 90 DAT, and the A-P was impacted at 15 and 40 DAT (Table 2). The NO3-N and A-P increased before 40 DAT and subsequently reduced with tomato plant growth, while the NH4+-N and A-K steadily decreased.
The levels of NH4+-N, A-P, and A-K significantly increased under salt stress in comparison to that of S0. The concentrations of NH4+-N, NO3-N, A-P, and A-K of CF treatments were obviously higher than that of the Control at each salt level and at each time point (Figure 2). The NH4+-N differed significantly among CF, CM, and VM treatments, with the effect ranking of CF > CM > VM at each salt level and each time point (Figure 2A). The NO3-N contents of VM treatment were lower than that of CF and CM treatments at 15, 65, and 90 DAT, respectively. The A-P content of CM treatment was obviously lower than that of CF treatment at 65 and 90 DAT under S2 level (Figure 2C). Compared to that of CF treatment, the A-K content of VM treatment was obviously lower than that of CF treatment at 65 and 90 DAT under S1 and S2 levels. Compared to that of CM treatment, the A-K content of VM treatment was obviously higher at 40 DAT under S0 and S1 levels (Figure 2D).

3.2. Effect of Fertilization on Plant Growth, Chlorophyll Content, and Photosynthesis under Salt Stress

Fertilizer and salt treatments had significant main effects on plant dry weight, SPAD, root activity, and the water content of the fruits, leaves, and roots (Figure 3). These parameters were considerably lowered by salt stress. Compared to that of the Control, plant dry weight, SPAD, and root activity remarkably increased in CF, CM, and VM treatments at the S0 level. The plant dry weight and SPAD differed among the four treatments, with the effect ranking as VM > CM > CF > Control at the S1 and S2 levels (Figure 3A,B). Root activity of VM treatment was 34.7% and 32.5% higher than that of the Control at the S1 and S2 levels, respectively. However, the CF treatment slightly decreased root activity by 4.14% than that of the Control at the S2 level (Figure 3C).
There was no significant difference in the water content of the fruits, leaves, and roots among the four treatments at the S0 level (Figure 3D–F). Compared to that of the Control, the fruit water content of the CF, CM, and VM treatments was remarkably reduced at the S1 and S2 levels (Figure 3D). The water content of the leaves and roots of the VM treatment was significantly higher than that of the CF treatment at the S1 level. The root water content of the CM treatment was obviously higher than that of the CF treatment at the S2 level (Figure 3F).
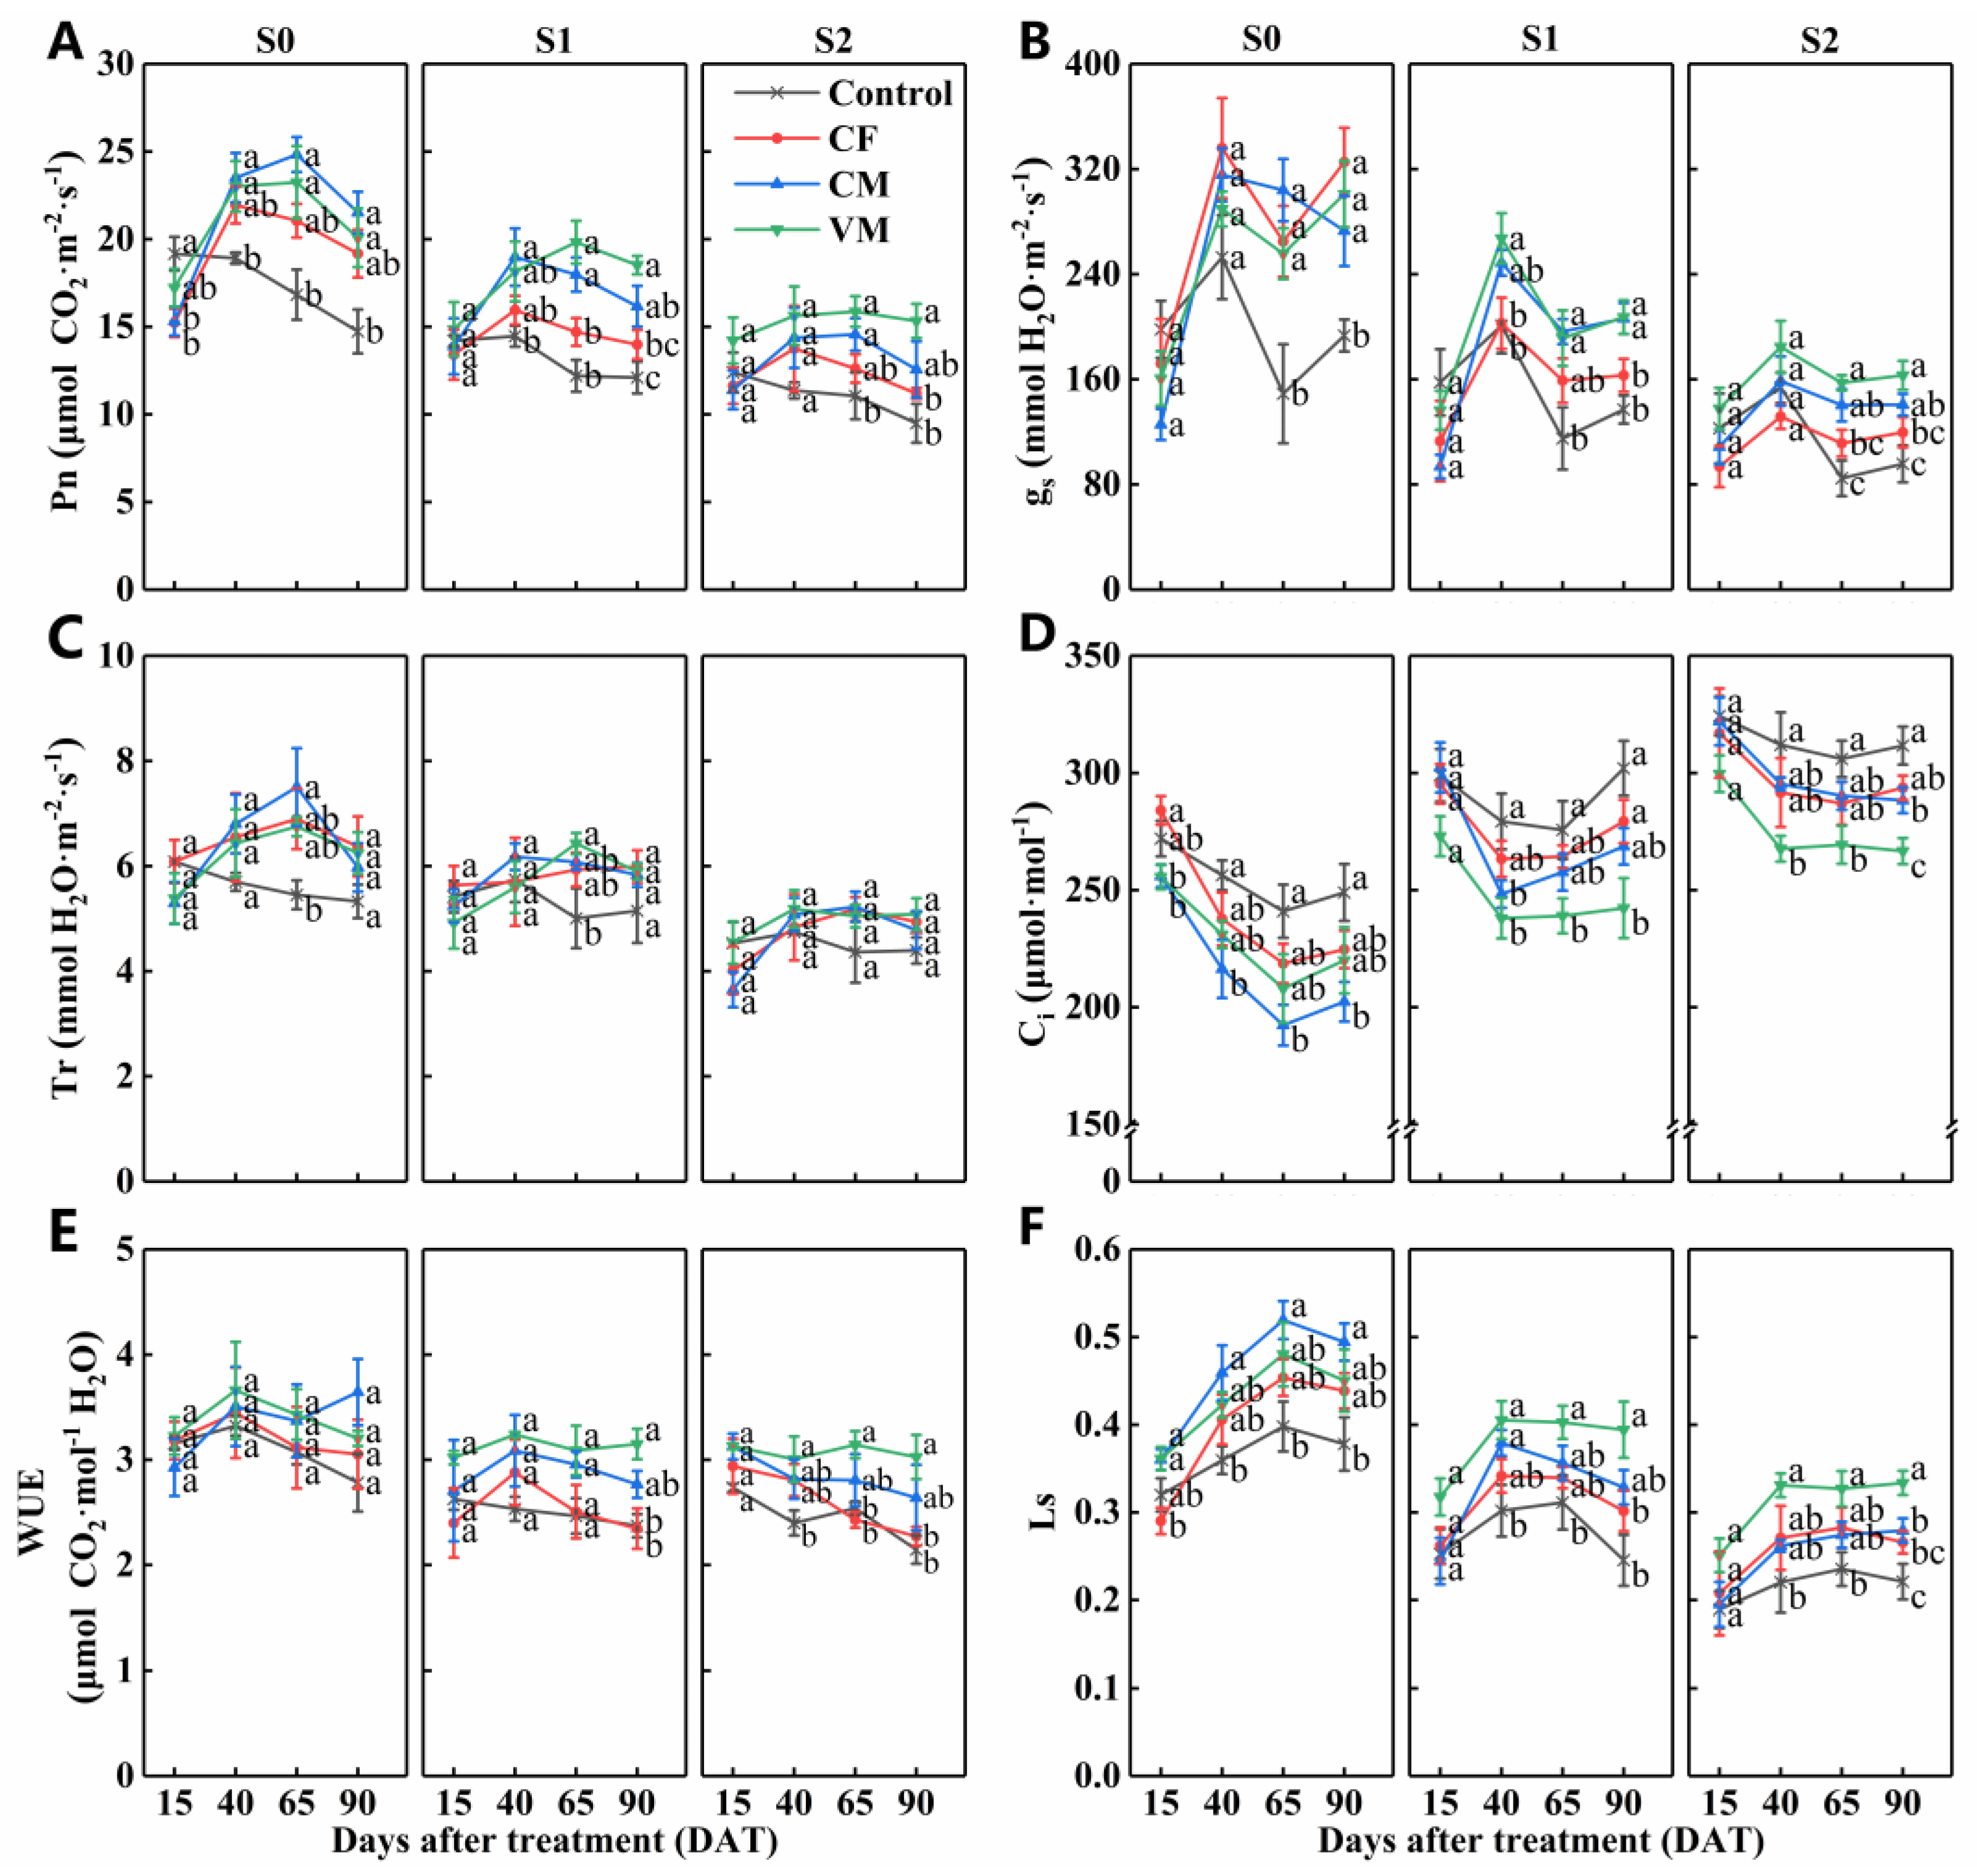
The Pn, gs, Tr, Ci, WUE, and Ls were dramatically influenced by fertilization at 65 and 90 DAT and by salt treatment at 15, 40, 65, and 90 DAT (Table 3). Salt stress significantly reduced Pn, gs, Tr, WUE, and Ls, while remarkably increasing Ci (Figure 4, Table A1). As the tomato plants matured, Pn, gs, Tr, and Ls gradually increased, and Ci gradually decreased at the S0 level, while the degree of increase or decrease became smaller at the S1 and S2 levels. Compared with Control treatment, VM treatments significantly increased Pn, gs, Tr, WUE, and Ls and decreased Ci at 65 and 90 DAT, respectively, at the S2 level (Figure 4).

3.3. Effect of Fertilization on Nonstructural Carbohydrates, Proline, and Soluble Protein in Leaves and Roots under Salt Stress

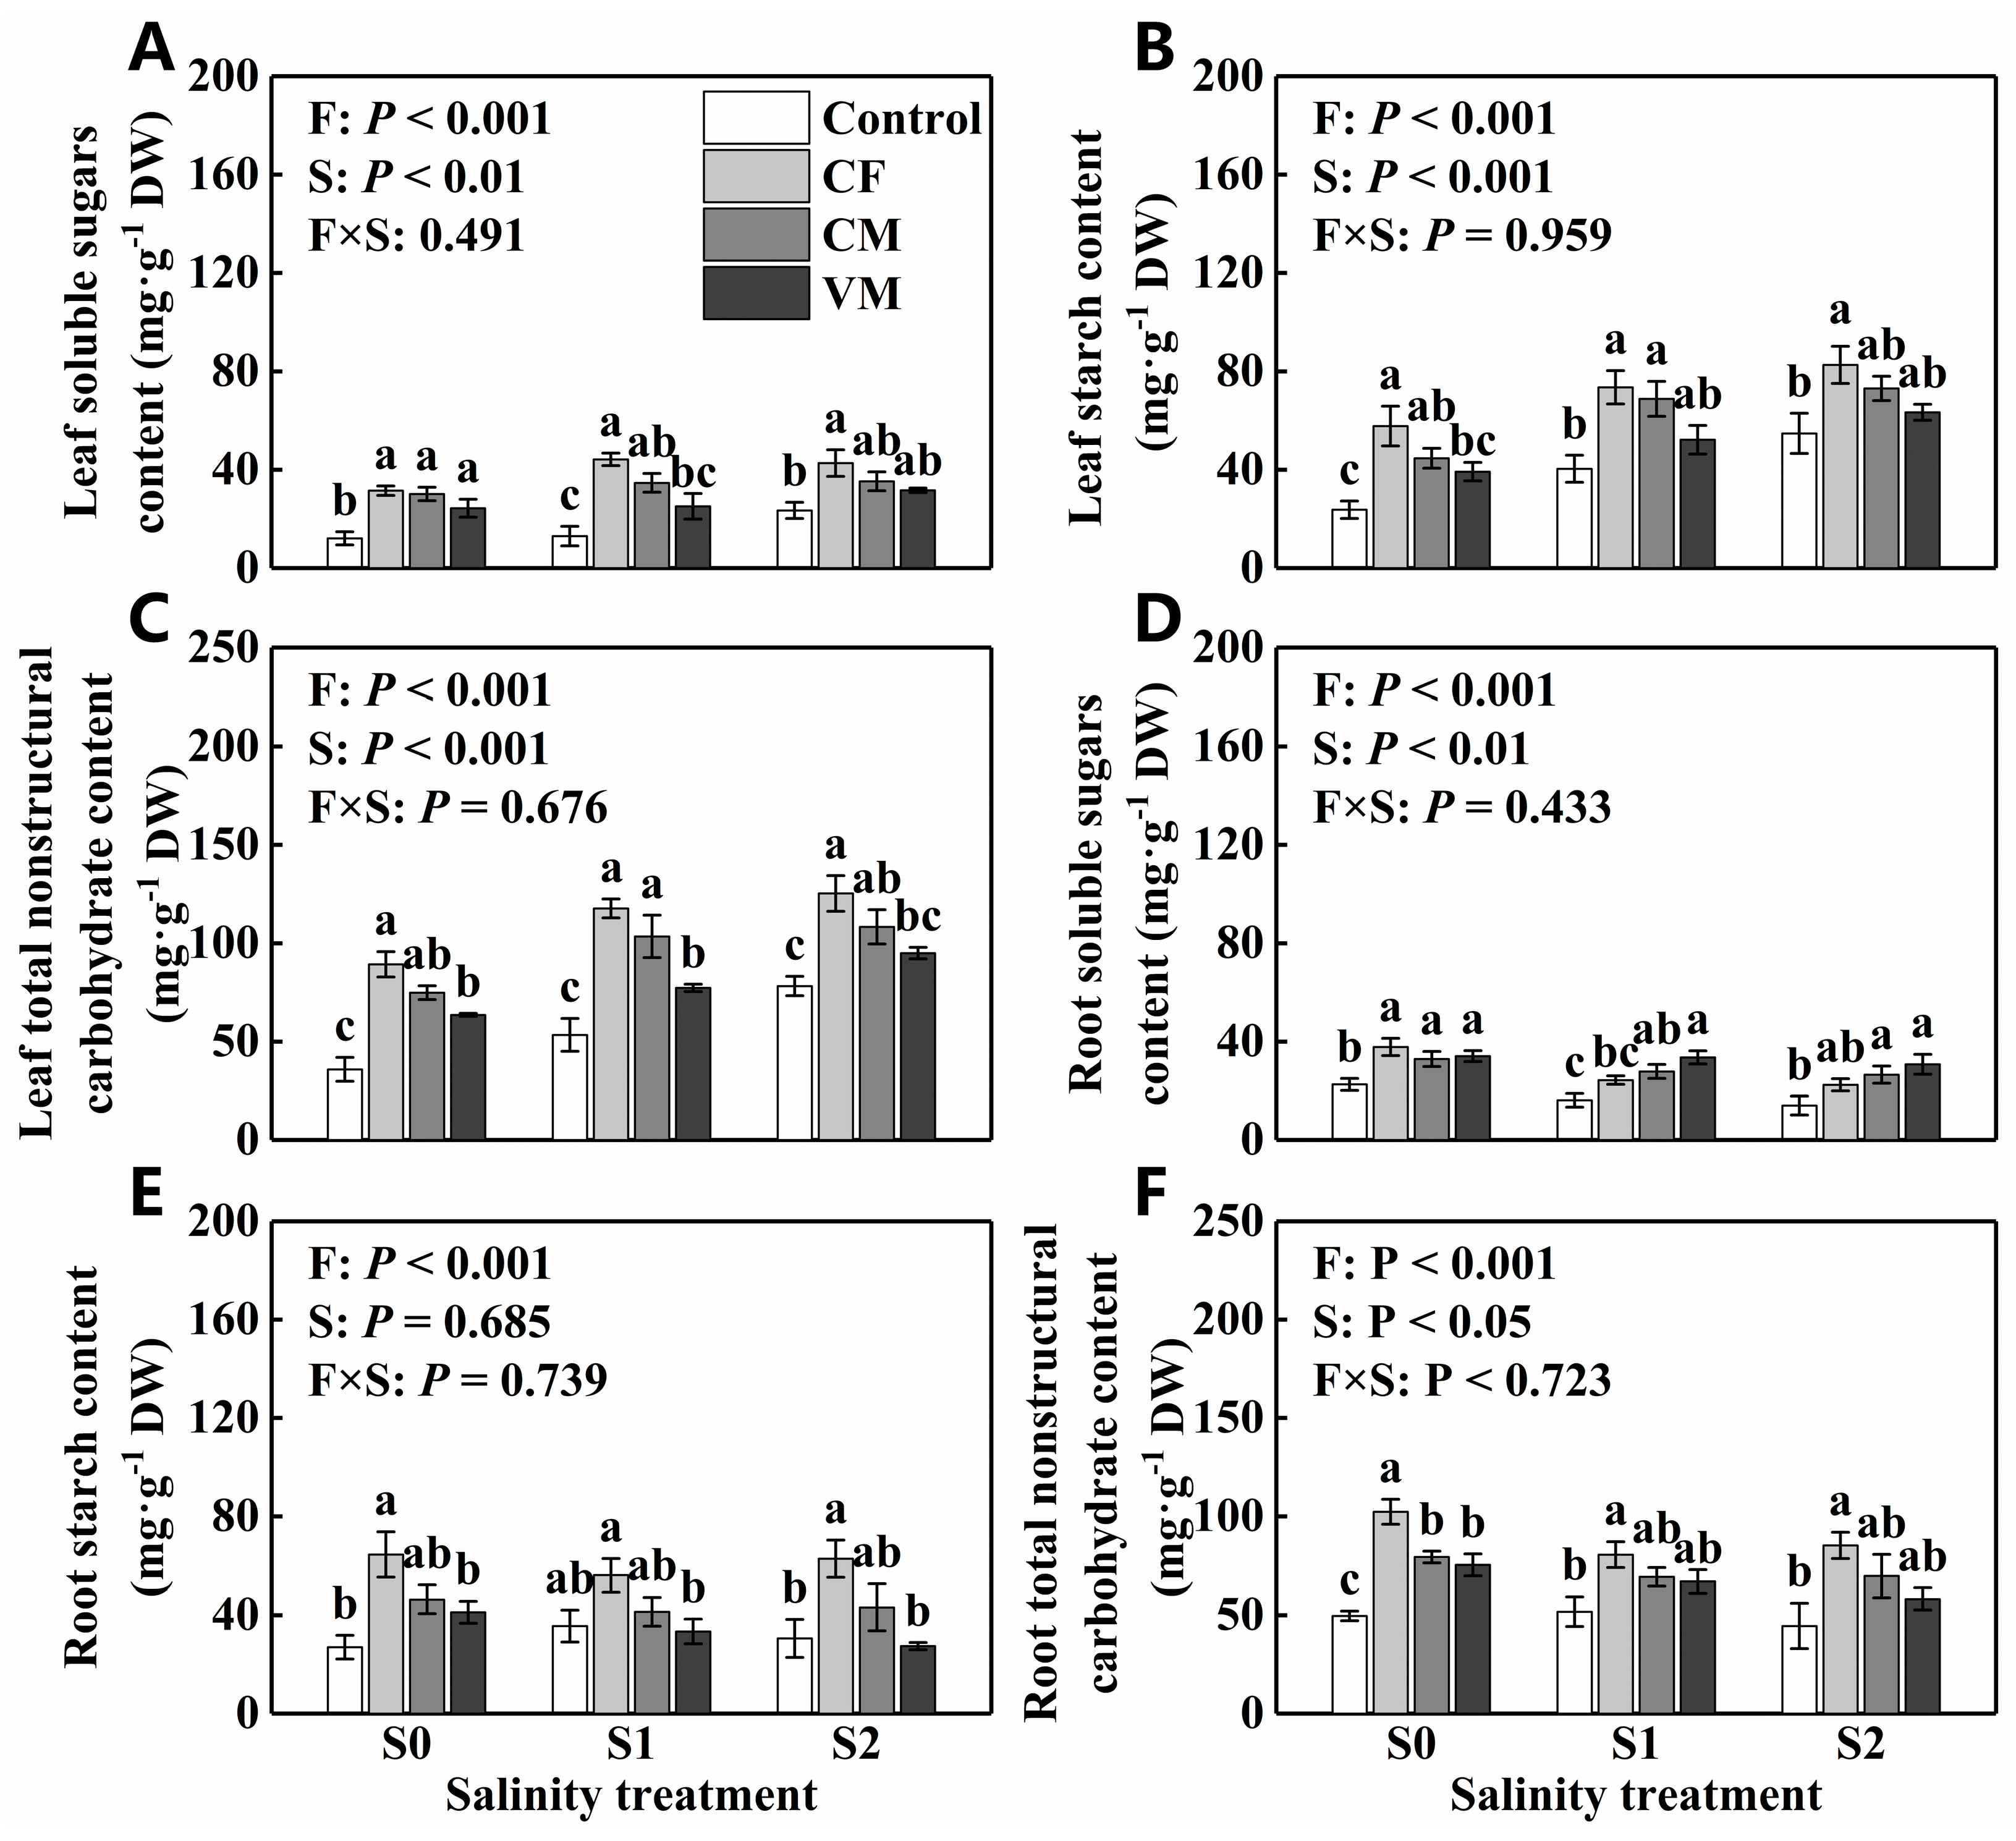
Compared to that of the Control, soluble sugars, starch content, and total carbohydrate content of leaves were significantly increased by CF treatment at every salt stress level (Figure 5A–C). Compared with CF treatment, VM significantly increased the root soluble sugars at the S2 level. Compared to that of the Control, starch content and total carbohydrate content of roots were significantly increased by CF treatment (except root starch content at the S1 level) at each salt level (Figure 5E,F). Starch content in leaves was dramatically increased by the increase in salt stress level (Figure 5B). The total nonstructural carbohydrates of leaves and the starch of roots in VM treatment were remarkably lower than CF treatment at the S1 and S2 levels (Figure 5C,E).
Fertilizer and salt treatments had significant main effects on proline and soluble protein in leaves and roots, with a remarkable interaction effect on proline content in leaves. Salt stress resulted in significant increases in these parameters (Figure 6, Table A1). Compared to that of the Control, leaf proline content, leaf soluble protein, and root proline content in CF and CM treatments were significantly higher at each salt level (Figure 6A–C). The proline and soluble protein contents in leaves and roots were decreased by 21.3%, 23.4%, 44.1%, and 25.2%, respectively, in the VM treatment at the S1 level, while the soluble protein contents in leaves and roots were decreased by 18.2% and 41.1% at the S2 level when compared to those of the CF treatment (Figure 6).

3.4. Effect of Fertilization on Na+, K+, K+ /Na+, N, and P in Fruits, Leaves, and Roots under Salt Stress

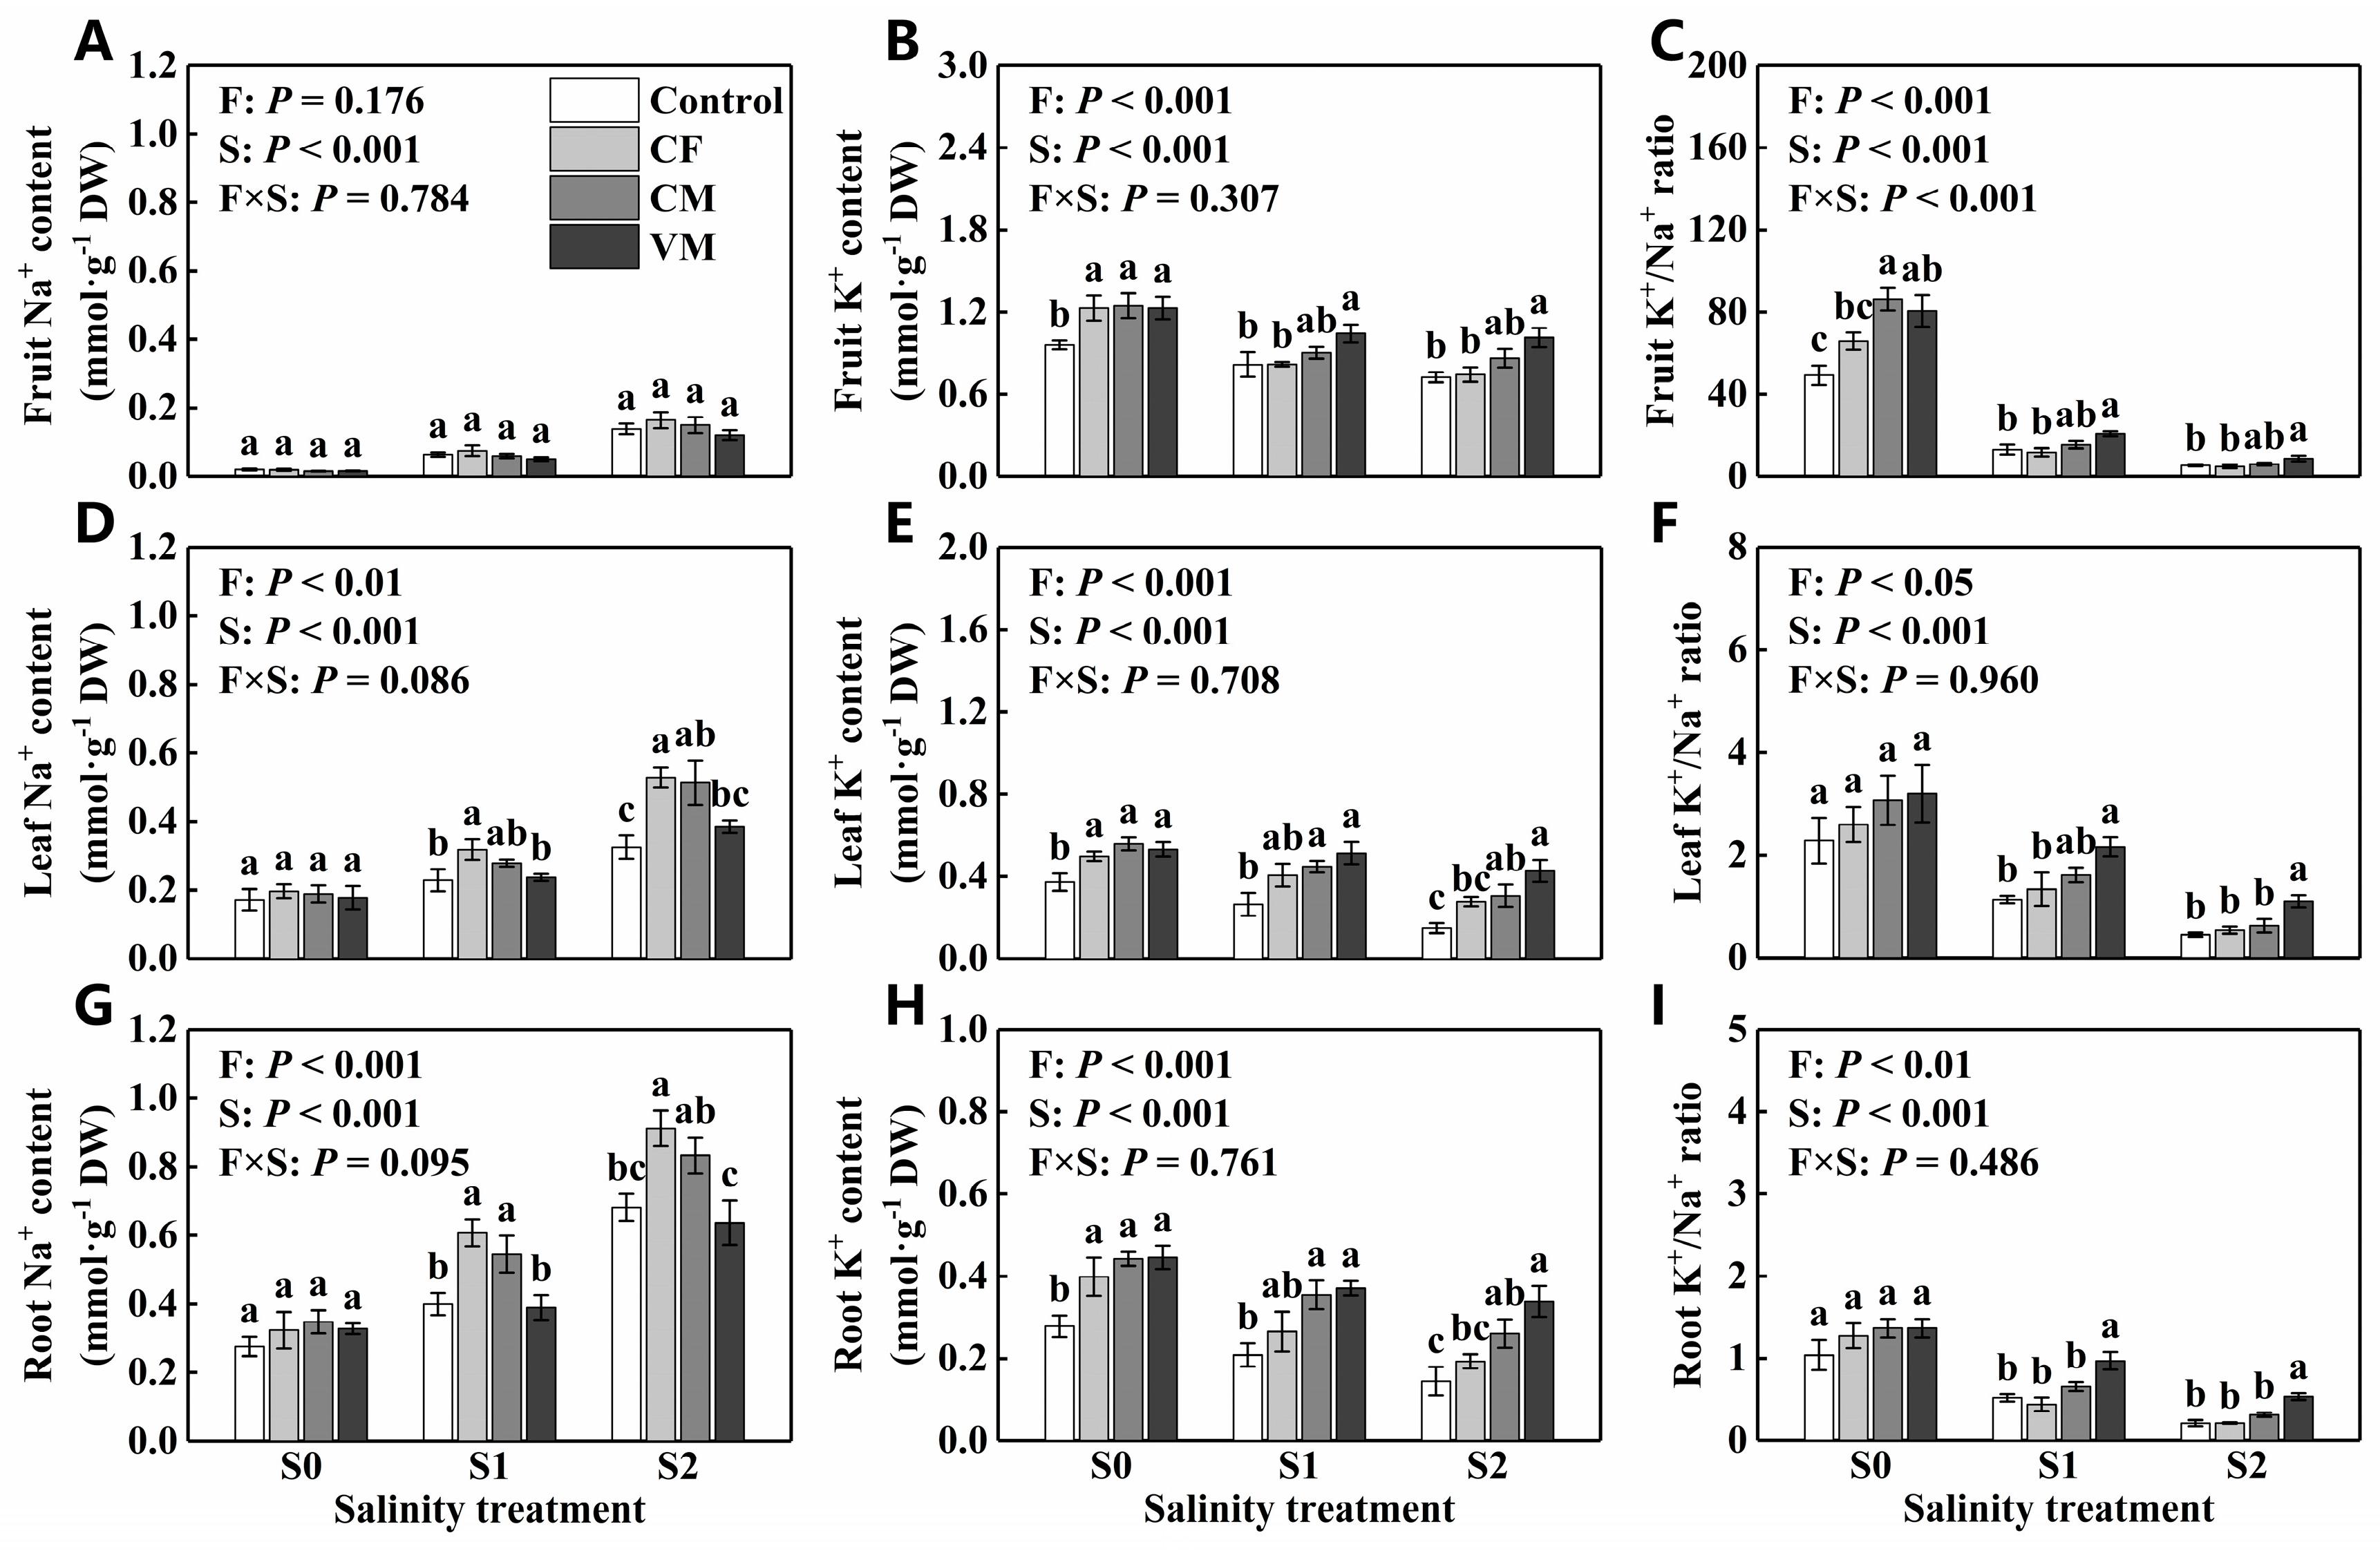
Fertilizer and salt had significant main effects on the contents of Na+ and K+ and the K+/Na+ ratio in fruits, leaves, and roots. Salt had significant interaction effects on Na+, K+, and K+/Na+ ratio in fruit (Figure 7). Salt stress resulted in a remarkable increase in Na+ content and a significant decrease in K+ content and K+/Na+ ratio in fruits, leaves, and roots (Table A1). Compared to that of the Control, the K+ contents of CF, CM, and VM treatments increased by 28.1%, 29.9%, 28.1%, 33.7%, 49.8%, 42.8%, 43.4%, 59.0%, and 60.2%, respectively, in fruits, leaves, and roots at the S0 level. Compared to the Control, the K+/Na+ ratio in fruit was increased by 75.0% and 63.6%, respectively, in CM and VM treatments at the S0 level. The Na+ content of CF treatment was increased by 39.0% and 62.3% in leaves and by 51.8% and 33.8% in roots at the S1 and S2 levels compared to the Control. Compared to that of the CF, the Na+ content of leaves and roots decreased by 12.3% and 10.1% in the CM treatment and by 25.5% and 35.7% in the VM treatment at the S1 level, respectively. Compared to that of the CF, the Na+ content of leaves and roots decreased by 2.84% and 8.66% in the CM treatment and by 27.2% and 30.2% in the VM treatment at the S2 level. Compared to that of the Control, K+ content and K+/Na+ ratio of fruits, leaves, and roots significantly increased in the VM treatment. It is shown that the K+ content and K+/Na+ ratio of fruits, leaves, and roots of the CM treatment were remarkably lower than the VM treatment but higher than the CF treatment (Figure 7).
Fertilizer and salt had significant main effects on the N of leaves and roots. Fertilizer and salt had significant main effects on the P contents of fruits, leaves, and roots, and there were significant interaction effects in the P content of fruit between fertilizer and salt. Salt stress resulted in a remarkable decrease in these parameters (Figure 8, Table A1). Compared to that of the Control, the N and P contents of CF, CM, and VM treatments in fruits, leaves, and roots were dramatically higher at the S0 level. The N content of fruit was significantly higher in the CF, CM, and VM treatments than that of the Control, while the N content of leaves and roots in CM and VM treatments was significantly higher than that of the Control and CF treatments at the S1 and S2 levels (Figure 8A,C,E). The P content of the fruits, leaves, and roots differed significantly among treatments, with the effect ranking of VM > CM > CF > Control at the S1 and S2 levels (Figure 8B,D,F).

3.5. Effect of Fertilization on Yield and Fruit Quality under Salt Stress

Fertilizer and salt had a significant main effect on yield, and there was a dramatic interaction effect between fertilizer and salt stress. Salt stress resulted in a significant reduction in tomato yield (Figure 9A), while a significant increase was observed at CF, CM, and VM treatments at the S0 level. However, CF treatment failed to increase yield at the S1 level and even tended to decrease yield at the S2 level. Compared to that of the Control, the yield of CM and VM treatments increased by 31.3% and 58.6%, respectively, at the S1 level and by 32.4% and 76.7%, respectively, at the S2 level (Figure 9A). Compared to that of CM treatment, the tomato yield of VM treatment increased by 20.9% and 33.6%, respectively, at the S1 and S2 levels.
Fertilizer had a remarkable main effect on sugar acid ratio, vitamin C, organic acid, soluble solids, and nitrate, while salt had a significant main effect and resulted in a significant increase in these parameters except for the sugar acid ratio (Figure 9B–F). Compared to that of the Control, sugar acid ratio, vitamin C, and soluble solids dramatically increased from CF, CM, and VM treatments, while nitrate content significantly increased by CF treatment at the S0 level. The sugar acid ratio, vitamin C, and soluble solids differed dramatically among CF, CM, and VM treatments; the effect ranking was VM > CM > CF at the S1 and S2 levels (Figure 9B,C,E), while the effect ranking of organic acid and nitrate was CF > CM > VM (Figure 9D,F).
Fertilizer had a significant main effect on fruit soluble sugars, starch, and total nonstructural carbohydrates, while salt had a remarkable main effect on fruit soluble sugars and starch. A significant interaction effect between fertilizer and salt was observed in starch and total nonstructural carbohydrates (Figure 9G–I). Salt stress resulted in a remarkable increase in soluble sugars and a dramatic reduction in starch (Figure 9G,H). Both soluble sugars and total nonstructural carbohydrates were significantly higher in CF, CM, and VM treatments than that in the Control at the S0 level (Figure 9G,I). Moreover, the values of the CM treatment were significantly higher than that of CF and VM treatments. Compared to that of the Control and CF treatment, the contents of soluble sugars, starch, and total nonstructural carbohydrates in CM and VM treatments dramatically increased at the S1 level, while at the S2 level, only the VM treatment significantly increased the values when compared with the Control (Figure 9G–I).

4. Discussion

Vermicompost application acts as an amendment to soil properties of salt stress. In our study, salt stress resulted in a significant increase in NH4+-N, NO3-N, A-P, and A-K (Figure 2 and Table 2), inevitably causing a higher EC. Therefore, rather than the soil nutrient supply capacity, salt tolerance may be the major factor toward plant nutrient uptake under salt stress. Previous studies found that vermicompost can significantly improve the physical and chemical properties of beach saline soil [16,18]. In this study, higher soil EC caused by salt stress was reduced by vermicompost application under salt stress (Figure 1). Moreover, VM treatment increased macronutrient uptake (Figure 8), resulting in a decrease in available N and K nutrients in the soil (Figure 2 and Figure 10). We speculate that vermicompost can balance nutrient supply and crop uptake, thus improving fertilizer use efficiency. Interestingly, a significant increase in plant-accumulated P accompanied by a remarkable increase in soil-available P was observed in the VM treatment (Figure 2C and Figure 8). This may be related to the ability of vermicompost to increase soil phosphatase activity [34,44,45].
Vermicompost application changes the accumulation of N, P, K, and Na in tomato plants. Compared to CF and CM applications, vermicompost could decrease the absorption of Na+ by the roots and increase the absorption of K+, N, and P in tomatoes under salt stress (Figure 7D,G and Figure 10). However, there was no remarkable difference in Na+ content in the fruit of vermicompost treatments at any salt levels, which indicated that vermicompost application cannot directly regulate Na+ accumulation in fruit (Figure 7A). Therefore, vermicompost application mainly decreased Na+ uptake by roots and limited the transport of Na+ from root to leaf (Figure 10). Benazzouk et al. demonstrated that a vermicompost leachate application on salt-treated tomato plants helps to limit Na+ translocation from the root to the shoot [21]. Moreover, vermicompost increased the uptake capacity of K+ and the K+/Na+ ratio in plant tissues under salt stress (Figure 7 and Figure 10). An increase in Na+ absorption leads to a decrease in K+ absorption, which disturbs ion homeostasis and induces ion toxicity [46,47,48]. Given that K+ is essential for numerous physiological processes, such as stomatal movement, CO2 assimilation, and respiration [49,50,51], the toxicity of Na+ to plants is damaging. Simultaneously, maintaining ion balance in tomato plants is an effective strategy to improve salt tolerance [30,52]. Vermicompost increased the contents of N and P in plant tissues under salt stress (Figure 8). N and P are vital factors affecting crop yield [53,54]. Although cow manure application could alleviate salt stress, its effect is substantially lower than that of vermicompost, which has abundant plant hormones and microorganisms, as proven by Benazzouk et al. [21].
Vermicompost application promotes root and leaf growth of tomato plants under salt stress. Biomass accumulation, reflecting the plant life-sustaining activities, is an optimum indicator for evaluating various stresses on plants [47]. Vermicompost increased the plant dry matter accumulation and yield of the tomato plant under salt stress (Figure 3A and Figure 9A), which is consistent with the results observed in rice [55] and wheat [17]. Root activity decreased under salt stress but significantly increased by VM application (Figure 3C). The improvement of root activity is beneficial to the selective absorption of nutrients by plants. In this study, reduced absorption of Na+ in roots and increased absorption of K+, N, P, and water were observed under VM treatment. Here, we showed that salt stress resulted in a decline in chlorophyll content, while VM treatment remarkably increased it (Figure 3B). This is consistent with a previous study, where higher SPAD values were obtained in plants treated with vermicompost than in plants treated with other composts [13]. The higher chlorophyll content is conducive to light absorption, which is fundamental for plant growth and yield.
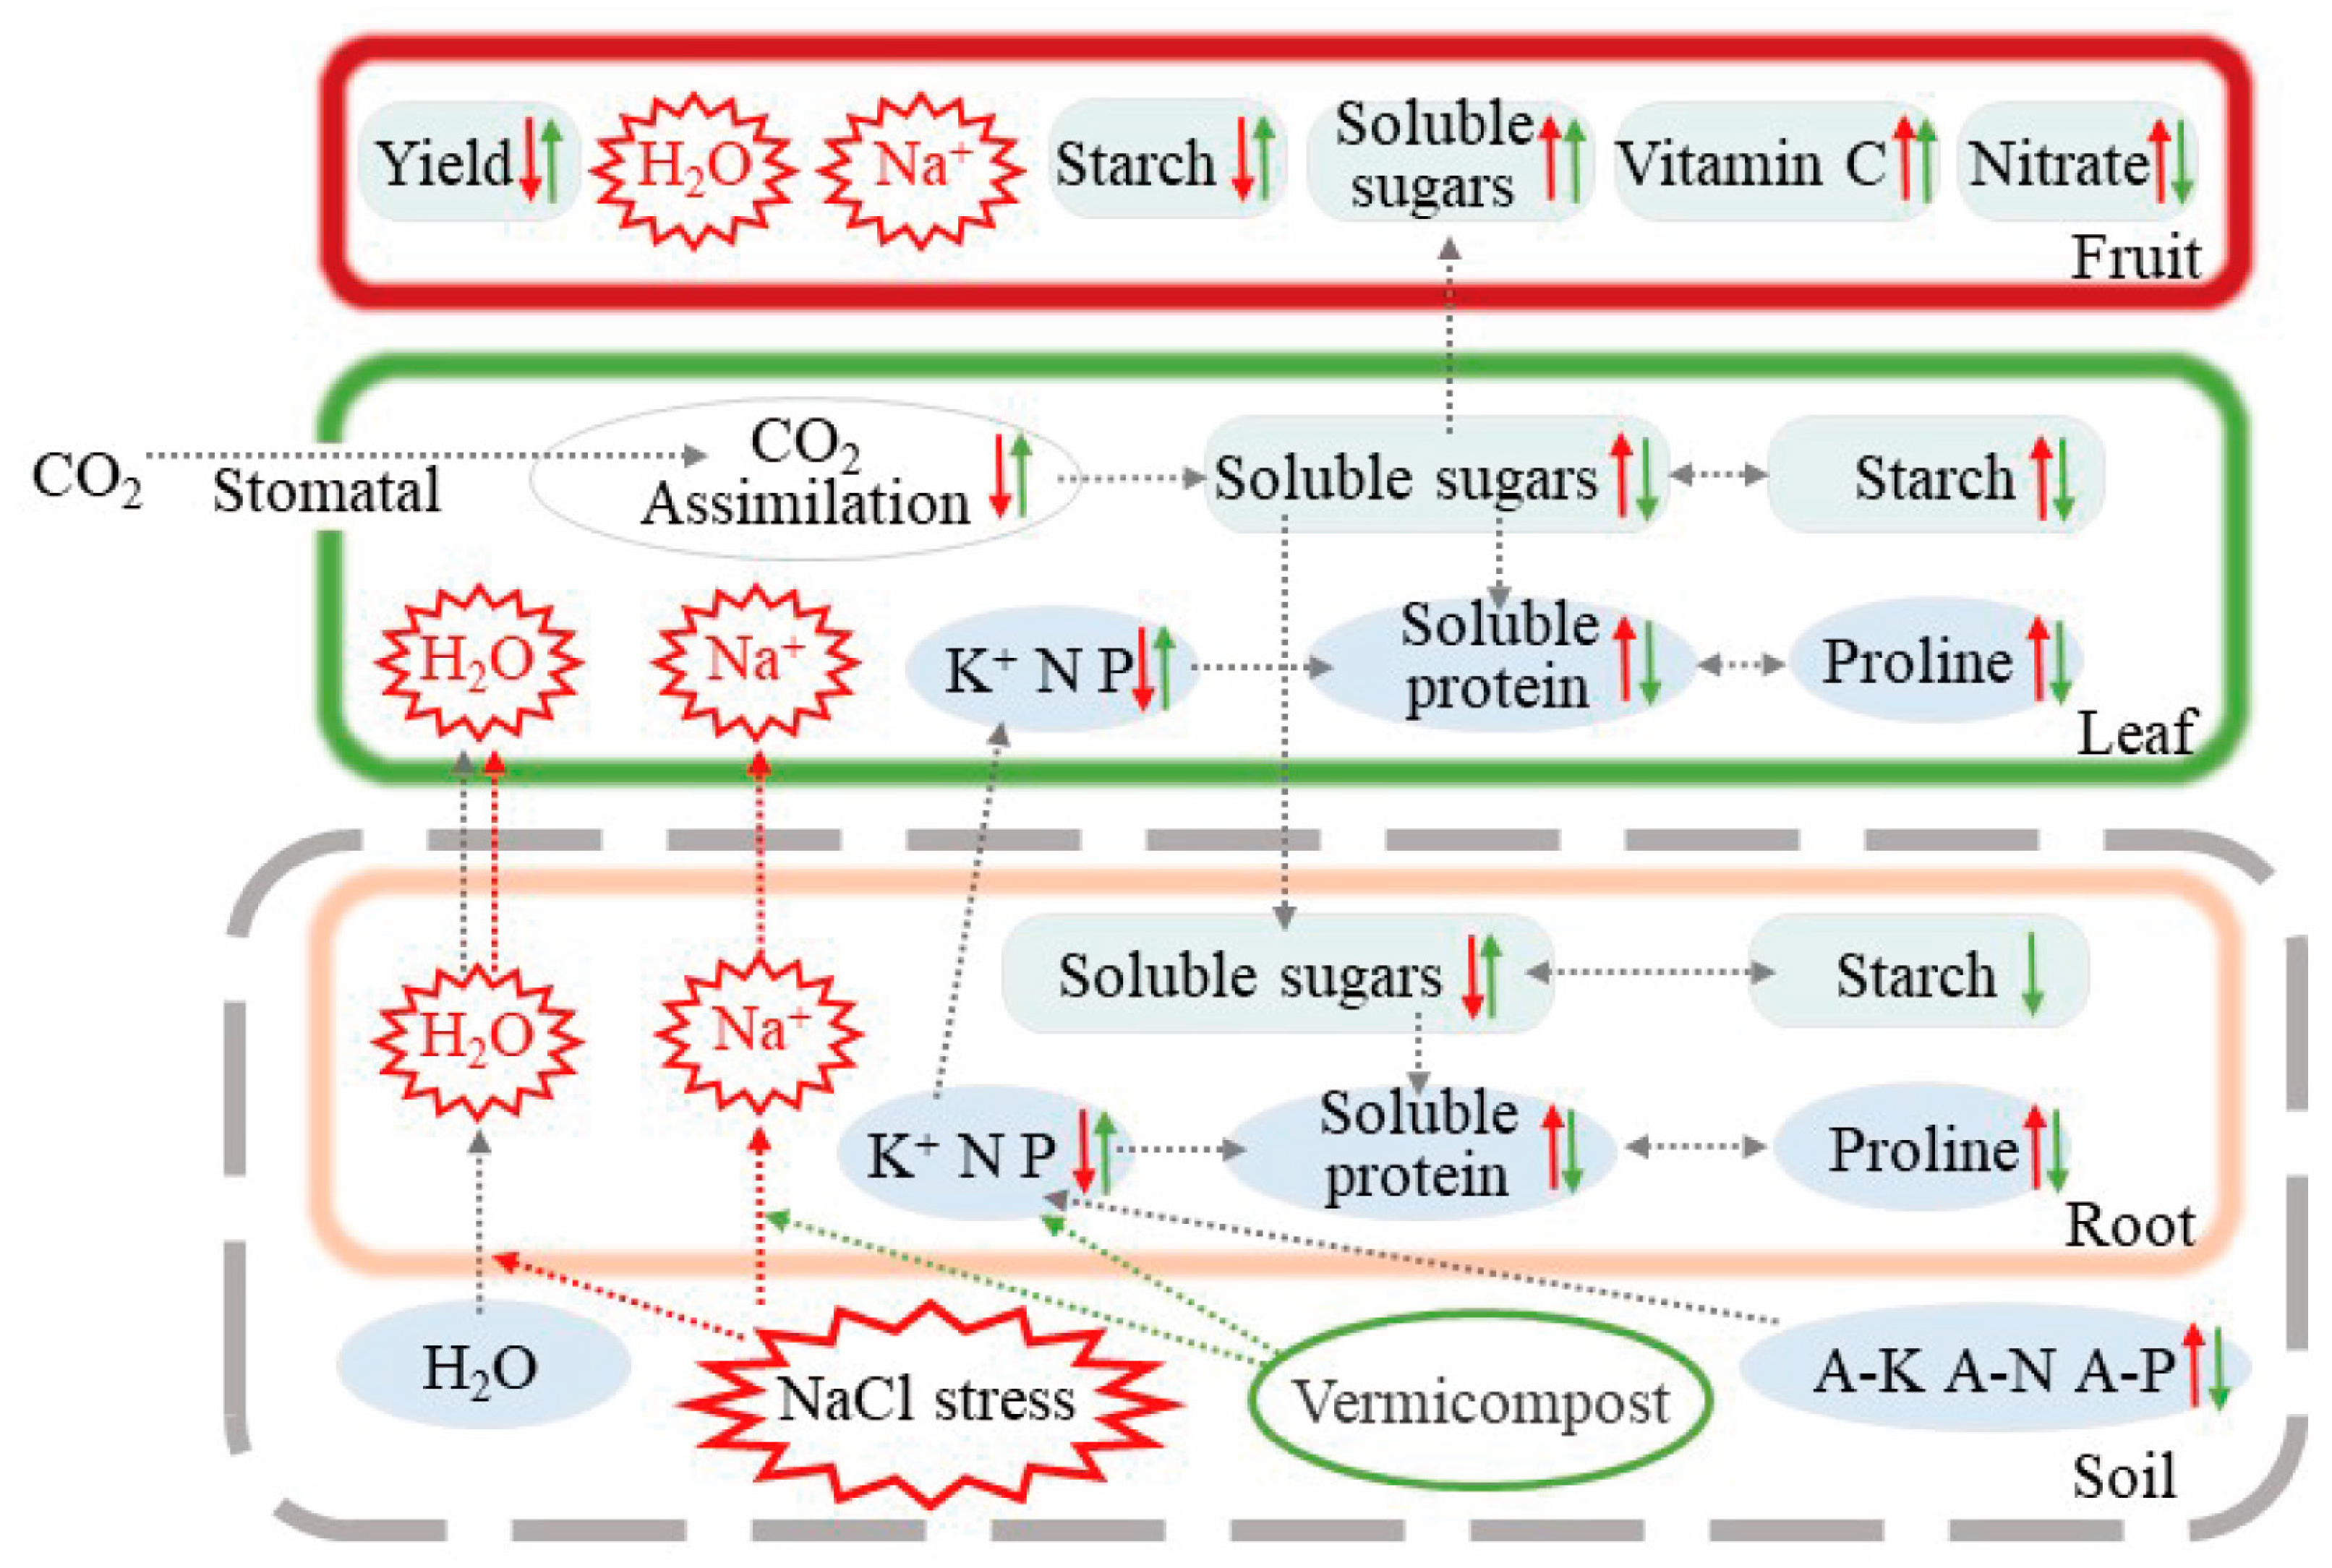
Vermicompost application reduces proline and soluble protein contents in tomato leaves and roots, which facilitates more carbohydrate transport to the fruit. Plants have a limited supply of resources that are divided between competing for physiological functions, resulting in resource allocation trade-offs [56]. When stressed, plants tend to preferentially synthesize metabolites that are tolerant to salt stress and protect themselves from harm [3,57,58]. The increased organic osmotic regulators in roots and leaves consume some mineral elements (including N, P, and K+) and photosynthates (including carbohydrates), resulting in less carbohydrate transport to the fruit [46,59]. Compared to the CF and CM treatments, the VM treatment had the lowest contents of proline and soluble protein in roots and leaves under salt stress (Figure 6 and Figure 10). It indicated that, on one hand, vermicompost application was less stressed than chemical fertilizer and cow manure, and on the other hand, it reduced energy expenditure caused by an accumulation of organic osmoregulatory substances, resulting in more carbohydrate transport to the fruit.
Vermicompost application could remarkably improve the tomato quality better than CM and CF applications under salt stress, as indicated by significantly increased sugar acid ratio, vitamin C, and soluble solids and dramatically decreased nitrate content (Figure 9). Sugar/acid ratio, vitamin C, and nitrate are important indicators of tomato quality [2,33]. In this study, sugar acid ratio, vitamin C, nitrate, and soluble solids were significantly increased by salt stress (Figure 9). The increase in these substances may be related to the need for plants to accumulate osmoregulatory substances under salt stress. Previous studies have shown that nitrate can act as an osmotic regulator [60], and nitrate production increases when plants absorb more nitrogen than is used to produce proteins [61]. We speculate that chemical fertilizers provide limited elemental species, resulting in a large amount of nitrate production. Organic fertilizers provide a balanced nutrient species, allowing plants to synthesize many organic osmoregulatory substances. Vermicompost particularly contains more hormones, which can promote plants to produce more organic osmotic regulators other than nitrate. The distribution and utilization of nitrogen under vermicompost application were significantly better than that of cow manure and chemical fertilizer. In addition, the fruit quality was improved by reduced Na+ uptake and increased K+ uptake in roots by vermicompost application, which guaranteed more K+ supply to fruits and leaves (Figure 7 and Figure 10). K+ plays an important role in the formation of quality tomatoes [62]. The yield and quality of tomatoes grown under VM treatment were better than those of CM and CF treatments under salt stress, which might be attributed to phytohormones or other biological stimulants contained in vermicompost. Some studies have confirmed that vermicompost contains hormones such as IAA, CKs, and ABA [21,63,64]. Plant hormones not only play an important role in regulating plant growth and development but also act as a key point in improving the salt tolerance of plants [31,65].
Compared to CF and CM applications, the vermicompost application could improve photosynthetic activity and promote the transport of carbohydrates to fruit. Photosynthesis, the main process in plants that captures light energy and converts CO2 and H2O into carbohydrates, is strongly affected by salt stress [4,66]. Tomato yield depends on the synthesis, transport, and distribution of photosynthates. The sink–source relationship is one of the most important factors that affect the mode of photosynthate distribution [67,68]. Carbohydrate synthesis occurs in photosynthetically active leaves (sources); sugars are then exported to support sinks for the growth of plants and the formation of yield [69,70]. In the present study, salt stress resulted in higher soluble sugar content and lower starch content in fruits (Figure 9G,H and Figure 10), which may be related to the response of plants to osmotic stress. The tomato fruit preferentially synthesizes soluble sugars and reduces starch synthesis, which subsequently resulted in an increase in soluble sugars and starch contents in tomato leaves under osmotic stress (Figure 5A,B and Figure 10). The increase in soluble sugars and starch content in plant tissues will inhibit carbon assimilation and hinder photosynthesis [41,71]. In addition, the increase in carbohydrate content in leaves may result from the accumulation of Na+ in leaves (Figure 7D and Figure 10), which resulted in the limitation of carbohydrate output. Pn and carbohydrate accumulation in leaves increased by CF, CM, and VM treatments at all salt levels (Figure 4A and Figure 5C). Particularly, VM treatment achieves the highest Pn, Gs, WUE, and Ls and the lowest Ci under salt stress (Figure 4), indicating that vermicompost application could improve photosynthetic system activity. This is consistent with previous findings that vermicompost application was able to maintain the stability of the photosynthetic system [21]. Carbohydrate accumulation was reduced in leaves accompanied by an increase in fruit by vermicompost application (Figure 5, Figure 9 and Figure 10). It might be related to the lower Na+ content in leaves (Figure 7D), resulting in the enhanced transport ability of carbohydrates from source to sink. Starch content decreased in the root and soluble sugars content increased in VM treatment (Figure 5D,E), which is beneficial for increasing root activity.

5. Conclusions

In conclusion, a decrease in tomato yield and fruit quality is attributed to reduced nutrient and water absorption capacity, photosynthetic feedback inhibition, and osmotic regulation under salt stress. Instead of being transported to fruit, carbohydrates are preferentially supplied to the synthesis of organic osmotic regulation substances. The adverse effect of salt stress on yield and fruit quality is aggravated by the sole application of chemical fertilizers, whereas it is reversed significantly by organic fertilizer (vermicompost and cow manure) application. Additionally, the beneficial effects of vermicompost on tomato growth and yield are remarkably better than cow manure. Less absorption and accumulation of Na+, enhanced macronutrients and water absorption capacity, and promotion of carbohydrate transport to fruits account for an improvement in yield and quality of tomatoes cultivated under salt stress and vermicompost application.

Author Contributions

Conceptualization, L.Y. and D.W.; methodology, D.W. and G.Z.; software, D.W.; validation, D.W., C.C. and G.Z.; formal analysis, D.W. and C.C.; investigation, D.W.; resources, L.Y.; data curation, D.W.; writing—original draft preparation, D.W. and G.Z.; writing—review and editing, D.W., Y.L., L.Y. and G.Z.; visualization, D.W.; supervision, L.Y.; project administration, L.Y.; funding acquisition, L.Y. and G.Z. All authors have read and agreed to the published version of the manuscript.

Funding

This research was funded by the Distinguished Professor of Liaoning Province (No. 01062920001) and the National Natural Science Foundation of China (No. 32002114).

Institutional Review Board Statement

Not applicable.

Informed Consent Statement

Not applicable.

Data Availability Statement

Not applicable.

Conflicts of Interest

The authors declare no conflict of interest.

Appendix A

Table A1. Plant properties of tomato plants under different salt levels.
PropertiesSalt Levels
S0S1S2
Plant dry weight (g)38.6 ± 3.65a29.8 ± 2.63b22.9 ± 2.33b
SPAD50.0 ± 2.20a39.0 ± 2.19b34.4 ± 2.27b
Root activity (ug TTF·g−1·h−1)278 ± 15.6a226 ± 11.2b184 ± 9.26c
Fruit water content (%)94.5 ± 0.36a92.4 ± 0.54b90.0 ± 0.59c
Leaf water content (%)87.4 ± 0.47a86.0 ± 0.39b83.9 ± 0.43c
Root water content (%)86.8 ± 0.24a85.4 ± 0.35b85.1 ± 0.32b
Leaf soluble sugars content (g·kg−1 DW)24.5 ± 2.60a29.6 ± 3.87a33.3 ± 2.63a
Leaf starch content (g·kg−1 DW)41.4 ± 4.29b58.7 ± 4.82a68.5 ± 4.14a
Leaf total nonstructural carbohydrate content (g·kg−1 DW) 65.9 ± 6.24b88.0 ± 8.06a102 ± 5.99a
Root soluble sugars content (g·kg−1 DW)31.9 ± 2.09a25.5 ± 2.19ab23.5 ± 2.40b
Root starch content (g·kg−1 DW)44.8 ± 4.87a41.6 ± 3.72a41.0 ± 5.19a
Root total nonstructural carbohydrate content (g·kg−1 DW)76.7 ± 5.97a67.2 ± 4.08a64.5 ± 5.93a
Leaf proline content (ug·g−1 FW)115 ± 13.3b143 ± 13.2ab174 ± 12.61a
Leaf soluble protein content (mg·g−1 FW)9.88 ± 0.89b11.5 ± 0.81ab13.8 ± 0.75a
Root proline content (ug·g−1 FW)41.2 ± 5.49b59.7 ± 9.71ab67.9 ± 9.05a
Root soluble protein content (mg·g−1 FW)4.05 ± 0.49b5.44 ± 0.41ab5.81 ± 0.55a
Fruit Na+ content (mmol·g−1 DW)0.017 ± 0.01c0.062 ± 0.01b0.143 ± 0.01a
Fruit K+ content (mmol·g−1 DW)1.17 ± 0.05a0.896 ± 0.04b0.836 ± 0.04b
Fruit K+/Na+ ratio70.5 ± 4.95c15.3 ± 1.32b6.20 ± 0.61a
Leaf Na+ content (mmol·g−1 DW)0.184 ± 0.01c0.266 ± 0.01b0.438 ± 0.03a
Leaf K+ content (mmol·g−1 DW)0.490 ± 0.03a0.408 ± 0.03a0.290 ± 0.03b
Leaf K+/Na+ ratio2.79 ± 0.23a1.56 ± 0.15b0.678 ± 0.09c
Root Na+ content (mmol·g−1 DW)0.319 ± 0.021c0.486 ± 0.03b0.766 ± 0.04a
Root K+ content (mmol·g−1 DW)0.392 ± 0.02a0.300 ± 0.02b0.234 ± 0.03c
Root K+/Na+ ratio1.24 ± 0.07a0.647 ± 0.07b0.315 ± 0.04c
Fruit N content (mmol·g−1 DW)1.32 ± 0.12a1.21 ± 0.10a1.08 ± 0.07a
Fruit P content (umol·g−1 DW)121 ± 13.51a92.3 ± 10.8ab66.5 ± 7.13b
Leaf N content (mmol·g−1 DW)1.80 ± 0.15a1.43 ± 0.11b1.19 ± 0.09b
Leaf P content (umol·g−1 DW)95.0 ± 8.63a73.5 ± 7.45ab63.3 ± 6.16b
Root N content (mmol·g−1 DW)1.17 ± 0.08a0.942 ± 0.07b0.828 ± 0.08b
Root P content (umol·g−1 DW)64.6 ± 5.22a47.8 ± 5.20b40.4 ± 4.57b
Yield (g·plant−1)735 ± 52.7a464 ± 30.82b262 ± 26.10c
Sugar acid ratio10.6 ± 0.84a11.0 ± 0.98a9.95 ± 0.77a
Vitamin C (mg·100g−1)27.5 ± 2.13b32.0 ± 2.35ab34.8 ± 2.33a
Organic acid (%)0.404 ± 0.01c0.466 ± 0.01b0.568 ± 0.02a
Soluble solid (%)4.47 ± 0.25c5.66 ± 0.24b6.54 ± 0.26a
Nitrate content (mg·kg−1)55.3 ± 3.66b71.4 ± 5.00a74.7 ± 4.54a
Fruit soluble sugars content (g·kg−1 FW)41.9 ± 2.86b50.3 ± 3.31ab55.5 ± 3.40a
Fruit starch content (g·kg−1 FW)15.0 ± 1.07a11.2 ± 1.31b7.38 ± 1.21c
Fruit total nonstructural carbohydrate content (g·kg−1 FW)56.9 ± 3.32a61.5 ± 4.36a62.9 ± 3.85a
The values are shown by mean ± SE. Different letters (a, b, and c) indicate significant (p < 0.05) differences between different salt levels (S0, S1, and S2).

References

  1. Ivushkin, K.; Bartholomeus, H.; Bregt, A.K.; Pulatov, A.; Kempen, B.; de Sousa, L. Global mapping of soil salinity change. Remote Sens. Environ. 2019, 231, 111260. [Google Scholar] [CrossRef]
  2. Zhang, X.; Tang, H.M.; Du, H.; Bao, Z.L.; Shi, Q.H. Sugar metabolic and N-glycosylated profiles unveil the regulatory mechanism of tomato quality under salt stress. Environ. Exp. Bot. 2020, 177, 104145. [Google Scholar] [CrossRef]
  3. Zhao, S.S.; Zhang, Q.K.; Liu, M.Y.; Zhou, H.P.; Ma, C.L.; Wang, P.P. Regulation of plant responses to salt stress. Int. J. Mol. Sci. 2021, 22, 4609. [Google Scholar] [CrossRef]
  4. Yang, X.L.; Li, Y.Y.; Chen, H.B.; Huang, J.; Zhang, Y.M.; Qi, M.F.; Liu, Y.F.; Li, T.L. Photosynthetic response mechanism of soil salinity-induced cross-tolerance to subsequent drought stress in tomato plants. Plants 2020, 9, 363. [Google Scholar] [CrossRef] [PubMed]
  5. Zhou, W.W.; Zheng, W.L.; Wang, W.X.; Lv, H.F.; Liang, B.; Li, J.L. Exogenous pig blood-derived protein hydrolysates as a promising method for alleviation of salt stress in tomato (Solanum lycopersicum L.). Sci. Hortic. 2022, 294, 110779. [Google Scholar] [CrossRef]
  6. Fang, S.M.; Hou, X.; Liang, X.L. Response mechanisms of plants under saline-slkali stress. Front. Plant Sci. 2021, 12, 667458. [Google Scholar] [CrossRef] [PubMed]
  7. Ismail, A.M.; Horie, T. Genomics, physiology, and molecular breeding approaches for improving salt tolerance. Annu. Rev. Plant Biol. 2017, 68, 405–434. [Google Scholar] [CrossRef]
  8. Yang, Y.; Lu, Z.Y.; Li, J.; Tang, L.; Jia, S.K.; Feng, X.M.; Wang, C.G.; Yuan, L.Y.; Hou, J.F.; Zhu, S.D. Effects of Ca(NO3)2 stress on mitochondria and nitrogen metabolism in roots of cucumber seedlings. Agronomy 2020, 10, 167. [Google Scholar] [CrossRef]
  9. Fan, H.F.; Ding, L.; Xu, Y.L.; Du, C.X. Seed germination, seedling growth and antioxidant system responses in cucumber exposed to Ca(NO3)2. Hortic. Environ. Biotechnol. 2017, 58, 548–559. [Google Scholar] [CrossRef]
  10. Cai, A.D.; Xu, M.G.; Wang, B.R.; Zhang, W.J.; Liang, G.P.; Hou, E.P.; Luo, Y.Q. Manure acts as a better fertilizer for increasing crop yields than synthetic fertilizer does by improving soil fertility. Soil Till. Res. 2019, 189, 168–175. [Google Scholar] [CrossRef]
  11. Diacono, M.; Montemurro, F. Long-term effects of organic amendments on soil fertility. A review. Agron. Sustain. Dev. 2010, 30, 401–422. [Google Scholar] [CrossRef]
  12. de Melo, T.R.; Pereira, M.G.; de Cesare Barbosa, G.M.; da Silva Neto, E.C.; Andrello, A.C.; Tavares Filho, J. Biogenic aggregation intensifies soil improvement caused by manures. Soil Tillage Res. 2019, 190, 186–193. [Google Scholar] [CrossRef]
  13. Doan, T.T.; Ngo, P.T.; Rumpel, C.; van Nguyen, B.; Jouquet, P. Interactions between compost, vermicompost and earthworms influence plant growth and yield: A one-year greenhouse experiment. Sci. Hortic. 2013, 160, 148–154. [Google Scholar] [CrossRef]
  14. Liu, M.L.; Wang, C.; Liu, X.L.; Lu, Y.C.; Wang, Y.F. Saline-alkali soil applied with vermicompost and humic acid fertilizer improved macroaggregate microstructure to enhance salt leaching and inhibit nitrogen losses. Appl. Soil Ecol. 2020, 156, 103705. [Google Scholar] [CrossRef]
  15. Wu, D.; Feng, Y.F.; Xue, L.H.; Liu, M.Q.; Yang, B.; Hu, F.; Yang, L.Z. Biochar combined with vermicompost increases crop production while reducing ammonia and nitrous oxide emissions from a Paddy soil. Pedosphere 2019, 29, 82–94. [Google Scholar] [CrossRef]
  16. Liu, M.L.; Wang, C.; Wang, F.Y.; Xie, Y.J. Maize (Zea mays) growth and nutrient uptake following integrated improvement of vermicompost and humic acid fertilizer on coastal saline soil. Appl. Soil Ecol. 2019, 142, 147–154. [Google Scholar] [CrossRef]
  17. Ding, Z.L.; Kheir, A.M.S.; Ali, O.A.M.; Hafez, E.M.; ElShamey, E.A.; Zhou, Z.X.; Wang, B.Z.; Lin, X.; Ge, Y.; Fahmy, A.E.; et al. A vermicompost and deep tillage system to improve saline-sodic soil quality and wheat productivity. J. Environ. Manag. 2021, 277, 111388. [Google Scholar] [CrossRef]
  18. Shen, Z.Y.; Yu, Z.X.; Xu, L.; Zhao, Y.L.; Yi, S.Q.; Shen, C.; Wang, Y.M.; Li, Y.L.; Zuo, W.G.; Gu, C.H.; et al. Effects of vermicompost application on growth and heavy metal uptake of barley grown in mudflat salt-affected soils. Agronomy 2022, 12, 1007. [Google Scholar] [CrossRef]
  19. Goswami, L.; Nath, A.; Sutradhar, S.; Bhattacharya, S.S.; Kalamdhad, A.; Vellingiri, K.; Kim, K.H. Application of drum compost and vermicompost to improve soil health, growth, and yield parameters for tomato and cabbage plants. J. Environ. Manag. 2017, 200, 243–252. [Google Scholar] [CrossRef]
  20. Arthur, G.D.; Aremu, A.O.; Kulkarni, M.G.; Van Staden, J. Vermicompost leachate alleviates deficiency of phosphorus and potassium in tomato seedlings. HortScience 2012, 9, 1304–1307. [Google Scholar] [CrossRef]
  21. Benazzouk, S.; Dobrev, P.I.; Djazouli, Z.E.; Motyka, V.; Lutts, S. Positive impact of vermicompost leachate on salt stress resistance in tomato (Solanum lycopersicum L.) at the seedling stage: A phytohormonal approach. Plant Soil 2019, 446, 145–162. [Google Scholar] [CrossRef]
  22. Zhang, Y.Q.; Kaiser, E.; Li, T.; Marcelis, L.F.M. NaCl affects photosynthetic and stomatal dynamics by osmotic effects, and reduces photosynthetic capacity by ionic effects in tomato. J. Exp. Bot. 2022, 73, 3637–3650. [Google Scholar] [CrossRef] [PubMed]
  23. He, W.J.; Yan, K.; Zhang, Y.; Bian, L.X.; Mei, H.M.; Han, G.X. Contrasting photosynthesis, photoinhibition and oxidative damage in honeysuckle (Lonicera japonica Thunb.) under iso-osmotic salt and drought stresses. Environ. Exp. Bot. 2021, 182, 11. [Google Scholar] [CrossRef]
  24. Katuwal, K.B.; Xiao, B.; Jespersen, D. Physiological responses and tolerance mechanisms of seashore paspalum and centipedegrass exposed to osmotic and iso-osmotic salt stresses. J. Plant Physiol. 2020, 248, 153154. [Google Scholar] [CrossRef]
  25. Siddiqui, M.H.; Alamri, S.; Al-Khaishany, M.Y.; Khan, M.N.; Al-Amri, A.; Ali, H.M.; Alaraidh, I.A.; Alsahli, A.A. Exogenous melatonin counteracts NaCl-induced damage by regulating the antioxidant system, proline and carbohydrates metabolism in tomato seedlings. Int. J. Mol. Sci. 2019, 20, 353. [Google Scholar] [CrossRef]
  26. Yousfi, S.; Rabhi, M.; Hessini, K.; Abdelly, C.; Gharsalli, M. Differences in efficient metabolite management and nutrient metabolic regulation between wild and cultivated barley grown at high salinity. Plant Biol. 2010, 12, 650–658. [Google Scholar] [CrossRef]
  27. Lu, S.W.; Qi, F.; Li, T.L. Effect of NaCl, Na+-salt and Cl-salt stresses on photosynthetic characteristics and sucrose metabolism in tomato leaf. J. Henan Agric. Sci. 2012, 41, 107–112. [Google Scholar] [CrossRef]
  28. Yang, F.J.; Li, T.L.; Su, Y.; Lu, S.W. Effects of NaCl and Na+, Cl stress on photosynthetic characteristics of different genotypes of tomato seedlings. Acta Agric. Boreali Sin. 2009, 24, 163–168. [Google Scholar]
  29. Negrão, S.; Schmöckel, S.M.; Tester, M. Evaluating physiological responses of plants to salinity stress. Ann Bot. 2017, 1, 1–11. [Google Scholar] [CrossRef]
  30. Zhou, Y.; Diao, M.; Chen, X.J.; Cui, J.X.; Pang, S.Q.; Li, Y.Y.; Hou, C.Y.; Liu, H.Y. Application of exogenous glutathione confers salinity stress tolerance in tomato seedlings by modulating ions homeostasis and polyamine metabolism. Sci. Hortic. 2019, 250, 45–58. [Google Scholar] [CrossRef]
  31. Ciura, J.; Kruk, J. Phytohormones as targets for improving plant productivity and stress tolerance. J. Plant Physiol. 2018, 229, 32–40. [Google Scholar] [CrossRef]
  32. Xu, L.; Yan, D.; Ren, X.Y.; Wei, Y.Y.; Zhou, J.; Zhao, H.Y.; Liang, M.X. Vermicompost improves the physiological and biochemical responses of blessed thistle (Silybum marianum Gaertn.) and peppermint (Mentha haplocalyx Briq) to salinity stress. Ind. Crops Prod. 2016, 94, 574–585. [Google Scholar] [CrossRef]
  33. Wang, X.X.; Zhao, F.Y.; Zhang, G.X.; Zhang, Y.Q.; Yang, L.J. Vermicompost improves tomato yield and quality and the biochemical properties of soils with different tomato planting history in a greenhouse study. Front. Plant Sci. 2017, 8, 1978. [Google Scholar] [CrossRef] [PubMed]
  34. Zhao, F.Y.; Zhang, Y.Y.; Dijkstra, F.A.; Li, Z.J.; Zhang, Y.Q.; Zhang, T.S.; Lu, Y.Q.; Shi, J.W.; Yang, L.J. Effects of amendments on phosphorous status in soils with different phosphorous levels. Catena 2019, 172, 97–103. [Google Scholar] [CrossRef]
  35. Zhao, F.Y.; Zhang, Y.Y.; Dong, W.G.; Zhang, Y.Q.; Zhang, G.X.; Sun, Z.P.; Yang, L.J. Vermicompost can suppress Fusarium oxysporum f. sp. lycopersici via generation of beneficial bacteria in a long-term tomato monoculture soil. Plant Soil 2019, 440, 491–505. [Google Scholar] [CrossRef]
  36. Bao, S.D. Analysis of Soil Agro-Chemistry; Agricultural Press Chinese: Beijing, China, 2000. (In Chinese) [Google Scholar]
  37. Norman, R.Z.; Edberg, J.C.; Stucki, J.W. Determination of nitrate in soil extracts by dual-wavelength ultraviolet spectrophotometry. Soil Sci. Soc. Am. J. 1985, 49, 1182–1185. [Google Scholar] [CrossRef]
  38. Li, H.S. Principles and Techniques of Plant Physiological Biochemical Experimental; Higher Education Press: Beijing, China, 2000. [Google Scholar]
  39. Bates, L.S. Rapid determination of free proline for water-stress studies. Plant Soil 1973, 39, 205–207. [Google Scholar] [CrossRef]
  40. Bradford, M.M. A rapid method for the quantitation of microgram quantities of protein utilizing the principle of protein-dye binding. Anal. Biochem. 1976, 72, 248–254. [Google Scholar] [CrossRef]
  41. Shen, J.L.; Wang, Y.; Shu, S.; Jahan, M.S.; Zhong, M.; Wu, J.Q.; Sun, J.; Guo, S.R. Exogenous putrescine regulates leaf starch over-accumulation in cucumber under salt stress. Sci. Hortic. 2019, 253, 99–110. [Google Scholar] [CrossRef]
  42. Li, S.H.; Li, Y.M.; Gao, Y.; He, X.R.; Zhang, D.L.; Liu, B.B.; Li, Q.M. Effects of CO2 enrichment on non-structural carbohydrate metabolism in leaves of cucumber seedlings under salt stress. Sci. Hortic. 2020, 265, 109275. [Google Scholar] [CrossRef]
  43. Rufty, T.W.; Huber, S.C. Changes in starch formation and activities of sucrose phosphate synthase and cytoplasmic fructose-1,6-bisphosphatase in response to source-sink alterations. Plant Physiol. 1983, 72, 474–480. [Google Scholar] [CrossRef] [PubMed]
  44. Parastesh, F.; Alikhani, H.A.; Etesami, H. Vermicompost enriched with phosphate-solubilizing bacteria provides plant with enough phosphorus in a sequential cropping under calcareous soil conditions. J. Clean. Prod. 2019, 221, 27–37. [Google Scholar] [CrossRef]
  45. Song, X.L.; Li, H.B.; Song, J.X.; Chen, W.F.; Shi, L.H. Biochar/vermicompost promotes Hybrid Pennisetum plant growth and soil in saline soils. Plant Physiol. Bioch. 2022, 183, 96–110. [Google Scholar] [CrossRef]
  46. Gharbi, E.; Martinez, J.P.; Benahmed, H.; Hichri, I.; Dobrev, P.I.; Motyka, V.; Quinet, M.; Lutts, S. Phytohormone profiling in relation to osmotic adjustment in NaCl-treated plants of the halophyte tomato wild relative species Solanum chilense comparatively to the cultivated glycophyte Solanum lycopersicum. Plant Sci. 2017, 258, 77–89. [Google Scholar] [CrossRef]
  47. Gong, B.; Wen, D.; VandenLangenberg, K.; Wei, M.; Yang, F.J.; Shi, Q.H.; Wang, X.F. Comparative effects of NaCl and NaHCO3 stress on photosynthetic parameters, nutrient metabolism, and the antioxidant system in tomato leaves. Sci. Hortic. 2013, 157, 1–12. [Google Scholar] [CrossRef]
  48. Wang, Z.; Hong, Y.C.; Zhu, G.T.; Li, Y.M.; Niu, Q.F.; Yao, J.J.; Hua, K.; Bai, J.J.; Zhu, Y.F.; Shi, H.Z.; et al. Loss of salt tolerance during tomato domestication conferred by variation in a Na+/K+ transporter. EMBO J. 2020, 39, e103256. [Google Scholar] [CrossRef]
  49. Chakraborty, K.; Bhaduri, D.; Meena, H.N.; Kalariya, K. External potassium (K+) application improves salinity tolerance by promoting Na+-exclusion, K+-accumulation and osmotic adjustment in contrasting peanut cultivars. Plant Physiol. Bioch. 2016, 103, 143–153. [Google Scholar] [CrossRef]
  50. Ju, F.Y.; Pang, J.L.; Huo, Y.Y.; Zhu, J.J.; Yu, K.; Sun, L.Y.; Loka, D.A.; Hu, W.; Zhou, Z.G.; Wang, S.S.; et al. Potassium application alleviates the negative effects of salt stress on cotton (Gossypium hirsutum L.) yield by improving the ionic homeostasis, photosynthetic capacity and carbohydrate metabolism of the leaf subtending the cotton boll. Field Crops Res. 2021, 272, 108288. [Google Scholar] [CrossRef]
  51. Kanai, S.; Moghaieb, R.E.; El-Shemy, H.A.; Panigrahi, R.; Mohapatra, P.K.; Ito, J.; Nguyen, N.T.; Saneoka, H.; Fujita, K. Potassium deficiency affects water status and photosynthetic rate of the vegetative sink in green house tomato prior to its effects on source activity. Plant Sci. 2011, 180, 368–374. [Google Scholar] [CrossRef]
  52. Zeng, Y.L.; Li, L.; Yang, R.R.; Yi, X.Y.; Zhang, B.H. Contribution and distribution of inorganic ions and organic compounds to the osmotic adjustment in Halostachys caspica response to salt stress. Sci. Rep. 2015, 5, 13639. [Google Scholar] [CrossRef]
  53. He, X.F.; Wang, X.M.; Chen, B.L.; Ma, Z.Y.; Huang, Z.; Shen, X.; Chai, Z.P. The influence of nitrogen (N) input on the sink-source relationship of ‘Korla Fragrant’ pear (Pyrus brestschneideri Rehd.Cv.). Erwerbs-Obstbau 2023, 65, 35–45. [Google Scholar] [CrossRef]
  54. Zhu, Q.; Ozores-Hampton, M.; Li, Y.C.; Morgan, K.T. Phosphorus application rates affected phosphorus partitioning and use efficiency in tomato production. Agron. J. 2018, 110, 2050–2058. [Google Scholar] [CrossRef]
  55. Zhang, J.F.; Wang, Z.H.; Fan, B.H.; Hou, Y.S.; Dou, Y.Q.; Ren, Z.L.; Chen, X.J. Investigating the proper application rate of nitrogen under mulched drip irrigation to improve the yield and quality of tomato in saline soil. Agronomy 2020, 10, 1101. [Google Scholar] [CrossRef]
  56. Munns, R.; Passioura, J.B.; Colmer, T.D.; Byrt, C.S. Osmotic adjustment and energy limitations to plant growth in saline soil. New Phytol. 2020, 225, 1091–1096. [Google Scholar] [CrossRef]
  57. Balibrea, M.E.; Dell’Amico, J.; Bolarín, M.C.; Pérez-Alfocea, F. Carbon partitioning and sucrose metabolism in tomato plants growing under salinity. Physiol. Plantarum 2000, 110, 503–511. [Google Scholar] [CrossRef]
  58. Nurrahma, A.H.I.; Yabuta, S.; Junaedi, A.; Sakagami, J.I. Analysis of non-structural carbohydrate in relation with shoot elongation of rice under complete submergence. Sustainability 2021, 13, 670. [Google Scholar] [CrossRef]
  59. Munns, R.; Gilliham, M. Salinity tolerance of crops—What is the cost? New Phytol. 2015, 208, 668–673. [Google Scholar] [CrossRef]
  60. Petropoulos, S.A.; Chatzieustratiou, E.; Constantopoulou, E.; Kapotis, G. Yield and quality of lettuce and rocket grown in floating culture system. Not. Bot. Horti Agrobot. 2016, 44, 603–612. [Google Scholar] [CrossRef]
  61. Herencia, J.F.; García-Galavís, P.A.; Dorado, J.A.R.; Maqueda, C. Comparison of nutritional quality of the crops grown in an organic and conventional fertilized soil. Sci. Hortic. 2011, 129, 882–888. [Google Scholar] [CrossRef]
  62. Çolpan, E.; Zengin, M.; Özbahçe, A. The effects of potassium on the yield and fruit quality components of stick tomato. Hortic. Environ. Biotechnol. 2013, 54, 20–28. [Google Scholar] [CrossRef]
  63. Canellas, L.P.; Olivares, F.L.; Okorokova-Facanha, A.L.; Façanha, A.R. Humic acids isolated from earthworm compost enhance root elongation, lateral root emergence, and plasma membrane H+-ATPase activity in maize roots. Plant Physiol. 2002, 130, 1951–1957. [Google Scholar] [CrossRef] [PubMed]
  64. Zhang, H.; Tan, S.N.; Wong, W.S.; Ng, C.Y.L.; Teo, C.H.; Ge, L.; Chen, X.; Yong, J.W.H. Mass spectrometric evidence for the occurrence of plant growth promoting cytokinins in vermicompost tea. Biol. Fert. Soils 2014, 50, 401–403. [Google Scholar] [CrossRef]
  65. Guo, M.; Wang, X.S.; Guo, H.D.; Bai, S.Y.; Khan, A.; Wang, X.M.; Gao, Y.M.; Li, J.S. Tomato salt tolerance mechanisms and their potential applications for fighting salinity: A review. Front. Plant Sci. 2022, 13, 949541. [Google Scholar] [CrossRef] [PubMed]
  66. Li, Y.; Niu, W.Q.; Cao, X.S.; Wang, J.W.; Zhang, M.Z.; Duan, X.H.; Zhang, Z.X. Effect of soil aeration on root morphology and photosynthetic characteristics of potted tomato plants (Solanum lycopersicum) at different NaCl salinity levels. BMC Plant Biol. 2019, 19, 331. [Google Scholar] [CrossRef]
  67. Aslani, L.; Gholami, M.; Mobli, M.; Ehsanzadeh, P.; Bertin, N. Decreased sink/source ratio enhances hexose transport in the fruits of greenhouse tomatoes: Integration of gene expression and biochemical analyses. Physiol. Plantarum 2020, 170, 120–131. [Google Scholar] [CrossRef]
  68. Chen, Y.Z.; Kong, X.Q.; Dong, H.Z. Removal of early fruiting branches impacts leaf senescence and yield by altering the sink/source ratio of field-grown cotton. Field Crops Res. 2018, 216, 10–21. [Google Scholar] [CrossRef]
  69. Adams, W.W.; Muller, O.; Cohu, C.M.; Demmig-Adams, B. May photoinhibition be a consequence, rather than a cause, of limited plant productivity? Photosynth. Res. 2013, 117, 31–34. [Google Scholar] [CrossRef]
  70. Khelil, A.; Menu, T.; Ricard, B. Adaptive response to salt involving carbohydrate metabolism in leaves of a salt-sensitive tomato cultivar. Plant Physiol. Biochem. 2007, 45, 551–559. [Google Scholar] [CrossRef]
  71. Khan, H.A.; Siddique, K.H.M.; Colmer, T.D. Vegetative and reproductive growth of salt-stressed chickpea are carbon-limited: Sucrose infusion at the reproductive stage improves salt tolerance. J. Exp. Bot. 2017, 68, 2001–2011. [Google Scholar] [CrossRef]
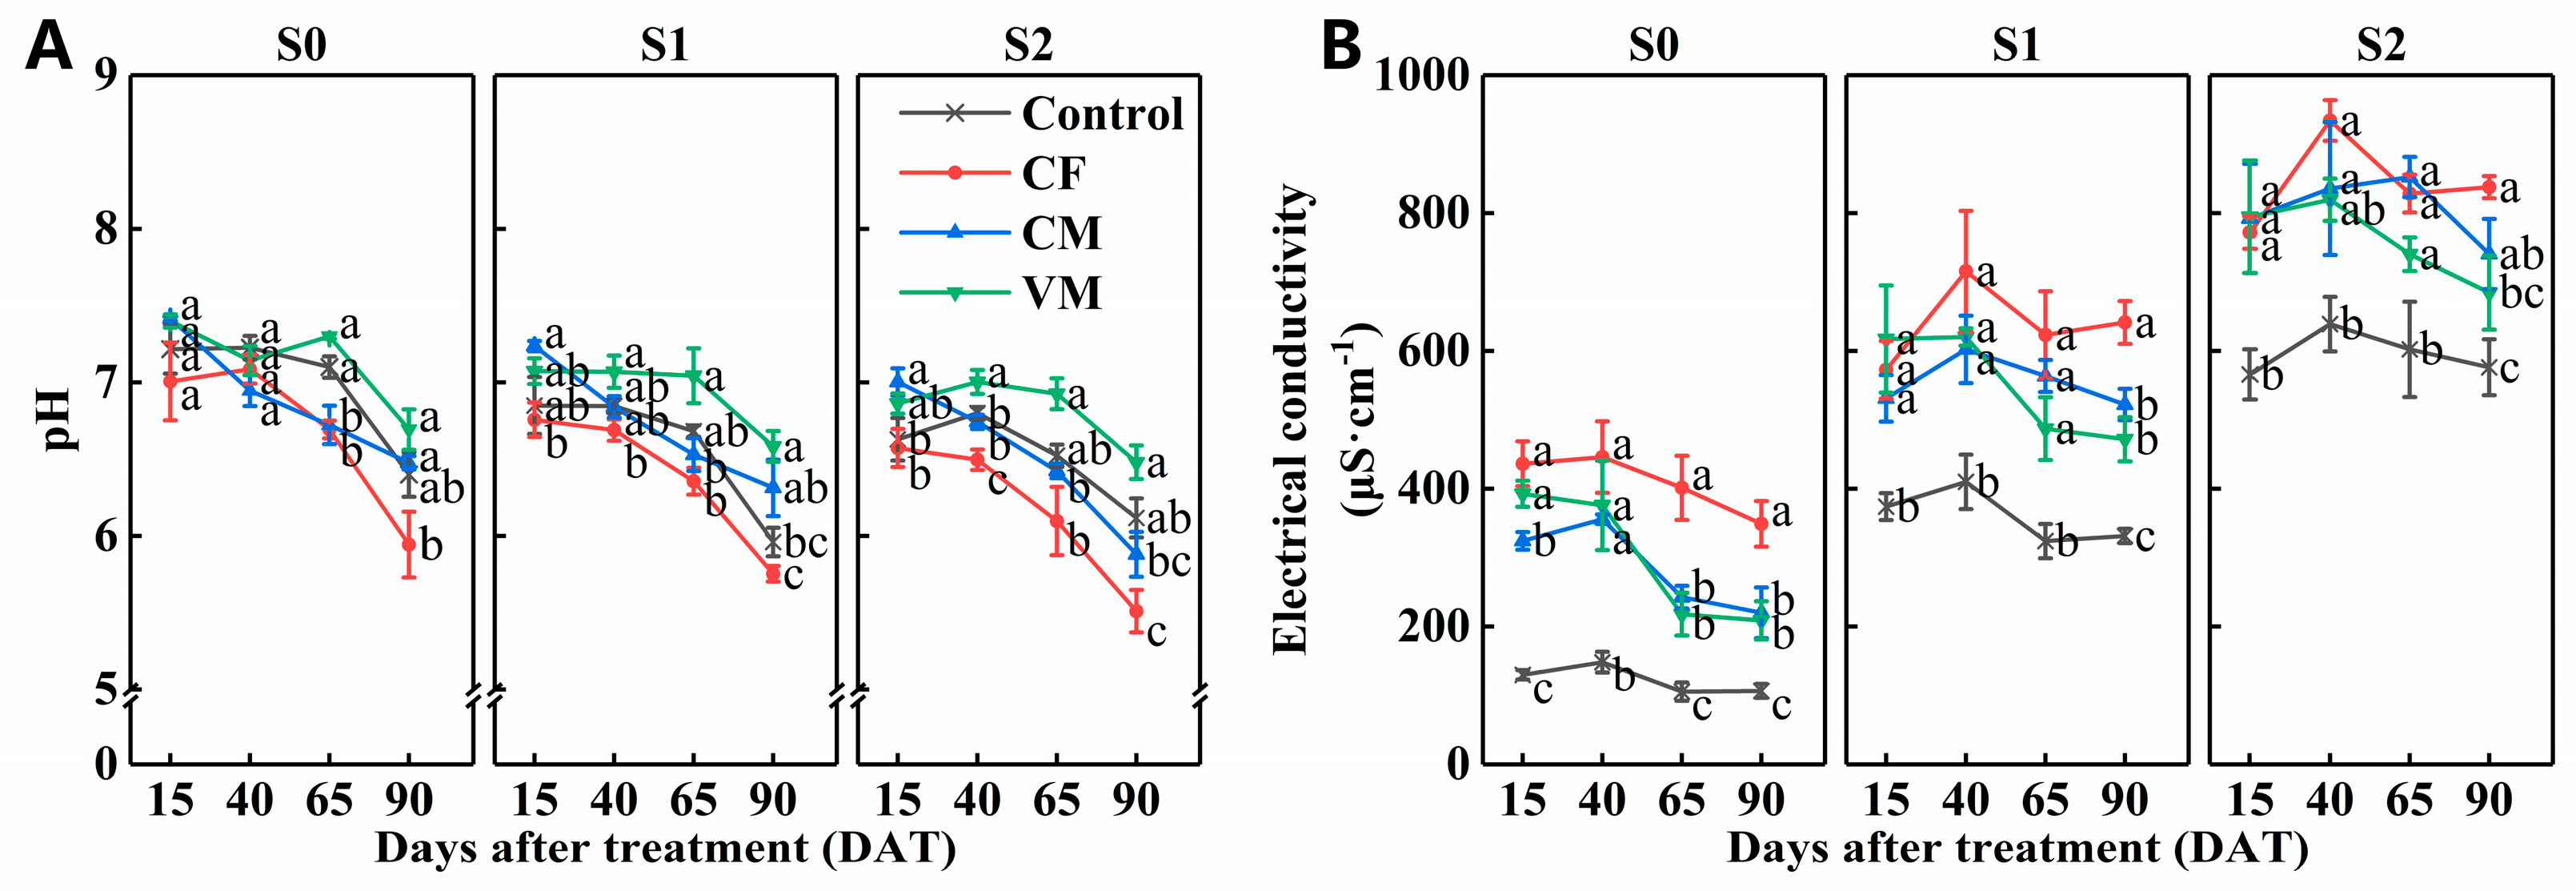
Figure 1. Effects of different fertilizer and salt treatments on soil pH (A) and EC (B). Values are means of three independent biological replicates ± SE (n = 3), and the different letters (a–c) indicate significant differences at p < 0.05 according to Duncan’s test, among different treatments at each time point at each salt level. Salt levels include no added NaCl (S0), 1 g NaCl added (S1), and 2 g NaCl added (S2) per kg soil. Treatments include no added fertilization (Control), added chemical fertilizer (CF), added cow manure (CM), and added vermicompost (VM).
Horticulturae 09 01015 g001
Figure 2. Effects of different fertilizer and salt treatments on NH4+-N (A), NO3-N (B), available phosphorus (C), and available potassium (D) in soil. Values are means of three biological replicates ± SE (n = 3), and the different letters (a–d) indicate significant differences at p < 0.05 according to Duncan’s test, among different treatments at each time point at each salt level. Salt levels include no added NaCl (S0), 1 g NaCl added (S1), and 2 g NaCl added (S2) per kg soil. Treatments include no added fertilization (Control), added chemical fertilizer (CF), added cow manure (CM), and added vermicompost (VM).
Horticulturae 09 01015 g002
Figure 3. Effects of different fertilizer and salt treatments on plant dry weight (A), relative chlorophyll content (B), root activity (C), fruit water content (D), leaf water content (E), and root water content (F) in tomato plants at 90 DAT. Values are means of three biological replicates ± SE (n = 3), and the different letters (a–c) indicate significant differences at p < 0.05 according to Duncan’s test, among different treatments at each salt level. Two-way ANOVA was performed for each parameter, and the p-values of the main effect of fertilizer (F) and salt (S), as well as the interaction effect of the two factors (F × S), are shown. Salt levels include no added NaCl (S0), 1 g NaCl added (S1), and 2 g NaCl added (S2) per kg soil. Treatments include no added fertilization (Control), added chemical fertilizer (CF), added cow manure (CM), and added vermicompost (VM).
Horticulturae 09 01015 g003
Figure 4. Effects of different fertilizer and salt treatments on gas exchange characteristics in leaves of tomato plants. Net photosynthetic rate (A, Pn), stomatal conductance (B, gs), transpiration rate (C, Tr), intercellular CO2 concentration (D, Ci), water use efficiency (E, WUE), and stomatal limitation (F, Ls) in tomato leaves at 15, 40, 65, and 90 days after treatment (DAT). Values are means of three biological replicates ± SE (n = 3), and the different letters (a–c) indicate significant differences at p < 0.05 according to Duncan’s test, among different treatments at each time point at each salt level. Salt levels include no added NaCl (S0), 1 g NaCl added (S1), and 2 g NaCl added (S2) per kg soil. Treatments include no added fertilization (Control), added chemical fertilizer (CF), added cow manure (CM), and added vermicompost (VM).
Horticulturae 09 01015 g004
Figure 5. Effects of different fertilizer and salt treatments on the content of soluble sugars (A,D), starch (B,E), and total nonstructural carbohydrates (C,F) in leaves and roots of tomato plants at 90 DAT. Values are means of three biological replicates ± SE (n = 3), and the different letters (a–c) indicate significant differences at p < 0.05 according to Duncan’s test, among different treatments at each salt level. Two-way ANOVA was performed for each parameter, and the p-values of the main effect of fertilizer (F) and salt (S), as well as the interaction effect of the two factors (F × S), are shown. Salt levels include no added NaCl (S0), 1 g NaCl added (S1), and 2 g NaCl added (S2) per kg soil. Treatments include no added fertilization (Control), added chemical fertilizer (CF), added cow manure (CM), and added vermicompost (VM).
Horticulturae 09 01015 g005
Figure 6. Effects of different fertilizer and salt treatments on the content of proline (A,C) and soluble protein (B,D) in leaves and roots of tomato plants at 90 DAT. Values are means of three biological replicates ± SE (n = 3), and the different letters (a–c) indicate significant differences at p < 0.05 according to Duncan’s test, among different treatments at each salt level. Two-way ANOVA was performed for each parameter, and the p-values of the main effect of fertilizer (F) and salt (S), as well as the interaction effect of the two factors (F × S), are shown. Salt levels include no added NaCl (S0), 1 g NaCl added (S1), and 2 g NaCl added (S2) per kg soil. Treatments include no added fertilization (Control), added chemical fertilizer (CF), added cow manure (CM), and added vermicompost (VM).
Horticulturae 09 01015 g006
Figure 7. Effects of different fertilizer and salt treatments on Na+ (A,D,G), K+ (B,E,H), and K+/Na+ (C,F,I) ratio in fruits, leaves, and roots of tomato plants at 90 DAT. Values are means of three biological replicates ± SE (n = 3), and the different letters (a–c) indicate significant differences at p < 0.05 according to Duncan’s test, among different treatments at each salt level. Two-way ANOVA was performed for each parameter, and the p-values of the main effect of fertilizer (F) and salt (S), as well as the interaction effect of the two factors (F × S), are shown. Salt levels include no added NaCl (S0), 1 g NaCl added (S1), and 2 g NaCl added (S2) per kg soil. Treatments include no added fertilization (Control), added chemical fertilizer (CF), added cow manure (CM), and added vermicompost (VM).
Horticulturae 09 01015 g007
Figure 8. Effects of different fertilizer and salt treatments on the content of N (A,C,E) and P (B,D,F) in fruits, leaves, and roots of tomato plants at 90 DAT. Values are means of three biological replicates ± SE (n = 3), and the different letters (a–c) indicate significant differences at p < 0.05 according to Duncan’s test, among different treatments at each salt level. Two-way ANOVA was performed for each parameter, and the p-values of the main effect of fertilizer (F) and salt (S), as well as the interaction effect of the two factors (F × S), are shown. Salt levels include no added NaCl (S0), 1 g NaCl added (S1), and 2 g NaCl added (S2) per kg soil. Treatments include no added fertilization (Control), added chemical fertilizer (CF), added cow manure (CM), and added vermicompost (VM).
Horticulturae 09 01015 g008
Figure 9. Effects of different fertilizer and salt treatments on yield (A), sugar acid ratio (B), vitamin C (C), organic acid (D), soluble solids (E), nitrate content (F), soluble sugars content (G), starch content (H), and total nonstructural carbohydrates content (I) in tomato fruit at 90 DAT. Values are means of three biological replicates ± SE (n = 3), and the different letters (a–c) indicate significant differences at p < 0.05 according to Duncan’s test, among different treatments at each salt level. Two-way ANOVA was performed for each parameter, and the p-values of the main effect of fertilizer (F) and salt (S), as well as the interaction effect of the two factors (F × S), are shown. Salt levels include no added NaCl (S0), 1 g NaCl added (S1), and 2 g NaCl added (S2) per kg soil. Treatments include no added fertilization (Control), added chemical fertilizer (CF), added cow manure (CM), and added vermicompost (VM).
Horticulturae 09 01015 g009
Figure 10. Schematic illustration of vermicompost improves tomato yield and quality under salt stress in tomato. The flow path of water, elements, and photosynthates of Control is indicated by the black dotted lines. Solid red arrows pointing up or down indicate an increase or decrease in substance content caused by salt. Solid green arrows pointing up or down indicate an increase or decrease in substance content caused by vermicompost.
Horticulturae 09 01015 g010
Table 1. Basic properties of fertilizers used in the experiment.
PropertiesVermicompostCow ManureChemical Fertilizer
pH6.586.92-
EC (µS cm−1)33301750-
OM (g kg−1)183326-
Total N (g kg−1)11.19.07106
Total P2O5 (g kg−1)19.220.966.7
Total K2O (g kg−1)4.246.97107
Total Ca (g kg−1)26.219.5100
Total Mg (g kg−1)3.532.82-
Table 2. ANOVA results for soil properties of different fertilizer and salt treatments.
DATp-ValuepHECNH4+-NNO3-NA-PA-K
F<0.01<0.001<0.001<0.001<0.001<0.001
15S<0.001<0.001<0.01<0.01<0.01<0.001
F × S=0.988=0.783=0.677<0.05=0.178=0.979
F<0.001<0.001<0.001<0.001<0.001<0.001
40S<0.001<0.001<0.001=0.460<0.01<0.05
F × S=0.083=0.999=0.389=0.853=0.787=0.849
F<0.001<0.001<0.001<0.001<0.001<0.001
65S<0.001<0.001<0.001<0.01=0.605<0.001
F × S=0.800=0.415=0.868<0.05=0.112=0.116
F<0.001<0.001<0.001<0.001<0.001<0.001
90S<0.01<0.001<0.001<0.01=0.137<0.001
F × S=0.409=0.919=0.838=0.731<0.05=0.392
The p-values of the main effect of fertilizer (F), salt (S), and the interaction effect of the two factors (F × S) on the pH, electrical conductivity (EC), NH4+-N, NO3-N, available phosphorus (A-P), and available potassium (A-K) are shown. All parameters were analyzed at 15, 40, 65, and 90 days after treatment (DAT).
Table 3. ANOVA results for gas exchange characteristics of different fertilizer and salt treatments.
DATp-ValuePngsTrCiWUELs
F=0.069<0.05=0.282<0.05=0.360<0.05
15S<0.001<0.01<0.001<0.001<0.05<0.001
F × S=0.617=0.683=0.442=0.595=0.678=0.592
F<0.01=0.067=0.553<0.01=0.121<0.01
40S<0.001<0.001<0.01<0.001<0.01<0.001
F × S=0.976=0.126=0.954=0.525=0.992=0.525
F<0.001<0.001<0.01<0.01<0.05<0.01
65S<0.001<0.001<0.001<0.001<0.01<0.001
F × S=0.480=0.233=0.729=0.419=0.975=0.422
F<0.001<0.001<0.05<0.001<0.01<0.001
90S<0.001<0.001<0.001<0.001<0.01<0.001
F × S=0.434<0.05=0.996=0.332=0.481=0.336
The p-values of the main effect of fertilizer (F) and salt (S), as well as the interaction effect of the two factors (F × S), are shown. The net photosynthetic rate (Pn), stomatal conductance (gs), transpiration rate (Tr), intercellular CO2 concentration (Ci), water use efficiency (WUE), and stomatal limitation (Ls) were analyzed at 15, 40, 65, and 90 days after treatment (DAT).
Disclaimer/Publisher’s Note: The statements, opinions and data contained in all publications are solely those of the individual author(s) and contributor(s) and not of MDPI and/or the editor(s). MDPI and/or the editor(s) disclaim responsibility for any injury to people or property resulting from any ideas, methods, instructions or products referred to in the content.