Article

Novel Hybrid Ferromagnetic Fe–Co/Nanodiamond Nanostructures: Influence of Carbon on Their Structural and Magnetic Properties

by
Panagiotis G. Ziogas
1,
Athanasios B. Bourlinos
1,
Polyxeni Chatzopoulou
2,
George P. Dimitrakopulos
2,
Anastasios Markou
1 and
Alexios P. Douvalis
1,*
1
Physics Department, University of Ioannina, 45110 Ioannina, Greece
2
Physics Department, Aristotle University of Thessaloniki, 54124 Thessaloniki, Greece
*
Author to whom correspondence should be addressed.
Magnetochemistry 2024, 10(5), 35; https://doi.org/10.3390/magnetochemistry10050035
Submission received: 22 April 2024 / Revised: 13 May 2024 / Accepted: 13 May 2024 / Published: 17 May 2024
(This article belongs to the Section Magnetic Nanospecies)

Abstract

:
This study introduces a novel magnetic nanohybrid material consisting of ferromagnetic (FM) bcc Fe–Co nanoparticles (NPs) grown on nanodiamond (ND) nanotemplates. A combination of wet chemistry, which produces chemical precursors and their subsequent thermal treatment under vacuum, was utilized for its development. The characterization and study of the prepared samples performed with a range of specialized experimental techniques reveal that thermal treatment of the as-prepared hybrid precursors under a range of annealing conditions leads to the development of Co-rich Fe–Co alloy NPs, with average sizes in the range of 6–10 nm, that exhibit uniform distribution on the surfaces of the ND nanotemplates and demonstrate FM behavior throughout a temperature range from 2 K to 400 K, with maximum magnetization values ranging between 18.9 and 21.1 emu/g and coercivities ranging between 112 and 881 Oe. Moreover, 57Fe Mössbauer spectroscopy reveals that apart from the predominant bcc FM Fe–Co phase, iron atoms also participate in the formation of a secondary martensitic-type Fe–Co phase. The emergence of this distinctive phase is attributed to the diffusion of carbon atoms within the Fe–Co lattices during their formation at elevated temperatures. The source of these carbon atoms is related to the unique morphological properties of the ND growth matrices, which facilitate surface sp2 formations. Apart from their diffusion within the Fe–Co NP lattice, the carbon atoms also reconstruct layered graphitic-type nanostructures enveloping the metallic alloy NPs. These non-typical nanohybrid materials, reported here for the first time in the literature, hold significant potential for use in applications related, but not limited to, biomedicine, biopharmaceutics, catalysis, and other various contemporary technological fields.

1. Introduction

In modern times, the rapid evolution and development of technology have made it possible to realize, explore, and understand a crucial area in materials science: nanostructures. Nanostructures have gained increased importance in various practical and essential applications due to their superior performance, cost-effectiveness, and responsiveness compared to conventional bulk materials.
Among nanostructures, carbon nanomaterials stand out as noteworthy contenders. Carbonaceous nanomaterials, known as nanocarbons, have garnered significant interest in catalytic processes, electronics, biomedicine, and biopharmaceutics. This is due to their low cost, tunable structure, high durability, unique electronic configurations, and diverse functionality. Carbon nanotubes, graphene, and fullerene, which exhibit hybridized sp2 bond configurations, show remarkable capabilities for exploiting their unique properties in a wide range of applications [1,2,3].
Diamond nanocrystals emerge as exceptional nanomaterials within the carbon family due to their unique sp3 bond hybridization. This enables versatile modifications in size (from a few up to several tens of nm) and growth dimensions (from zero to three-dimensional expansions). NDs have shown lower toxicity, superior chemical stability, and excellent biocompatibility compared to other carbon allotropes, making them highly desirable for biosensing techniques, biomedical imaging, drug delivery, and various other biomedical applications. The spherical morphology of NDs, with a large surface-to-volume ratio, facilitates interactions of a significant number of carbon atoms at their surface and subsurface regions. Besides size and shape, morphology plays a vital role in the chemical and structural stability of NDs, as it has been found that it may promote surface carbon atom sp2 bond hybridization formations and reconstructions, which are essential for their chemical stability [4]. In particular, at the surfaces of octahedral, cuboctahedral, and spherical NDs, the dangling bonds of unsaturated carbon atoms at their grain boundaries undergo a transition into partially sp2 hybridized carbon domains or are stabilized with hydrogen and oxygen atoms to reduce surface energy. Therefore, surface terminations are also essential [4]. Thermal treatment is significant in this regard, as it can cause the degradation of surface functionalities and produce a phase transition of diamond terminations into fullerene-like graphitic shells. This feature allows for the modification of sp3 bond-hybridized NDs into either uniform (or partially) core/shell (sp3/sp2) hybrids or concentric graphitic carbon onions (sp2 carbons), regulated by the annealing conditions [5,6]. Consequently, engineered NDs present a promising platform for exploring interfacial surfactant effects, holding intriguing prospects for a wide range of applications.
Another significant category of nanostructured materials is magnetic nanoparticles (MNPs), which are considered essential components of a system targeting specific applications where magnetic features are required. Among these, the iron–cobalt (Fe–Co) bimetallic compound system stands out as a competitive option due to its soft magnetic characteristics. Fe–Co alloys are significant FM materials due to their unique combination of high saturation magnetization (MS), reaching up to 240 emu/g in bulk form when the cobalt content reaches approximately 30 at. %, with low coercivity (HC) values in the range of 10–65 Oe, as well as high Curie temperatures (TC), a low uniaxial magnetic anisotropy constant Ku of about 2 × 10⁴ J/m3, and large permeability, depending on their composition [7,8,9,10,11,12].
Fe–Co alloys have been proposed to be used as materials in various applications, including catalysis [13], electromagnetic wave absorption [14], spintronic devices [15], enhanced-permeability dielectrics for reducing switching field in arrays of single-layer magnetoresistive-random-access-memory bits [16], heat-assisted magnetic recording for achieving greater storage density in hard disk drives [17], magnetic bearing and turbine engine components [18], building blocks for nanostructured thin film or bulk magnetic materials [11], magnetic particle imaging [19], and magnetic carriers for drug targeting, cancer therapy, and hyperthermia [20,21].
Various techniques are available to synthesize such MNPs, including mechanical alloying [9], impregnation followed by subsequent heat and chemical treatments [20], one-pot polyol pathways based on the addition of precursors at elevated temperatures [8], pulsed-laser ablation combined with inert gas condensation [22], carbothermal reduction via impregnated chitosan beads with Fe and Co ions [23], high-throughput magnetron sputtering [16], ethanol dehydrogenation through chemical vapor deposition [13], high-throughput thermal plasma synthesis [24], pulsed-laser deposition for thin film growth [15], and hydrothermal [25] and microemulsion methods [26]. It is crucial in all synthesis methods to choose the appropriate path that leads to the desired morphology, arrangement, size, and long-term stability of the MNPs’ intended application [26,27].
Typical cubic Fe–Co alloys possess soft magnetic characteristics and exhibit low Ku values. These properties render them unsuitable for applications as hard magnetic materials. However, if Ku could be increased considerably to sufficiently high values, the Fe–Co alloys could potentially become paradigms of non-rare-earth hard metal ferromagnets. Indeed, recent first-principles calculations have predicted high Ku values exceeding 106 J/m3 for Fe–Co alloys with a body-centered tetragonal (bct) crystal structure. The bct crystal lattice is considered an intermediate metastable lattice between the body-centered cubic (bcc) and the face-centered cubic (fcc) crystal lattices that the Fe–Co alloys could be crystallized into [28,29,30], whereas this bcc–bct–fcc transformation is known as the Bain transformation.
In real samples, two known synthetic methods can be employed to stabilize the bct Fe–Co structure, a phase not explicitly evident in the equilibrium phase diagram of the Fe–Co system [31]. As proposed by T. Hasegawa’s group, this can be achieved either by applying uniaxial stress to the Fe–Co cubic lattices through epitaxial effects or by introducing a third element such as B, N, or C interstitially into the Fe–Co cubic structure [32,33].
Epitaxially grown pure Fe–Co thin films on various buffer layers have shown Ku magnitudes up to 106 J/m3 when their crystal lattice c and a constants ratio (c/a) is slightly above 1.0 (1.0 < c/a < 1.2), and the Co concentration is about 50–60 at. % [29,34,35]. However, structural relaxation in epitaxially grown Fe–Co thin films limits the occurrence of bct structures with c/a ratio of about 1.2 to film thicknesses below approximately 1–3 nm [36]. Another crucial consideration is the chemical ordering of Fe and Co atoms in the crystal structure of the Fe–Co alloys, given by the ordering parameter S. To achieve high Ku values in the Fe–Co compounds, S is required to be high (S > 0.8) [29].
Alternatively, adding a specific third element, such as B, C, or N, is expected to induce a tetragonal distortion in the Fe–Co cubic lattice. Computational studies by D. Odkhuu et al. on Fe–Co alloys have predicted an induced tetragonal distortion of Fe–Co structures through interstitial N doping, leading to a considerable Ku value of 2 × 10⁶ J/m3 [25] in the B2-ordered tetragonal Fe–Co alloy [30]. This is achieved by the phase transition from ordered Fe–Co CsCl-type B2-bcc to bct upon a small addition of N that tends to transform to an fcc phase at higher levels of N doping. Notably, based on their studies, T. Hasegawa’s group experimentally achieved the stabilization of a bct Fe–Co phase at the boundaries between ordered B2 bcc and disordered fcc phases with increasing content of a third doped element (V and N). In their work, the formation of the bct-like Fe–Co phase is inferred from the effect of the c/a ratio on Ku when the c/a ratio ranges between 1.05 and 1.30, at 1.0 up to 5.5 at. % concentration of the third element [33]. These findings were later confirmed by transmission electron microscopy (TEM)-based observations, showing the formation of a bct-FeCo/VN single crystallite with a lattice constant c/a ratio of about 1.07 [32]. The atomic configuration of the Fe–Co-V-N unit cell corresponds to that of the B2-type Fe–Co.
Regarding tetragonally distorted iron alloy phases, Fe-based alloy martensites is another significant class of materials with excellent mechanical and magnetic properties. These materials emerge from the austenite-to-martensite transformation, a diffusionless rearrangement of the fcc into the bcc crystal lattice, triggered by a homogeneous structural deformation, e.g., the Bain or Kurdyumov γ-to-α transformation [37,38]. Many investigations have demonstrated that the tetragonal symmetry of the martensite phase is a result of a preferential occupation of a third element like N and C in one of the three (x-, y-, z-) available octahedrally coordinated interstitial site sublattices. In the case of carbon, this preferential occupancy arises from its higher solubility (up to about 9 at. % concentration) in the fcc austenitic (γ) Fe-based phase, relative to the bcc ferritic (α) Fe-based phase (up to about 1 at. % concentration). The formation of martensite occurs as the crystal structure undergoes the γ-to-α transformation over a limited range of thermal treatments (slow or rapid cooling, aging, or tempering), when the transformation takes place too quickly for the carbon atoms to diffuse in order to form either graphite or iron carbide (Fe3C); therefore, these C atoms are trapped in the octahedral interstitial sites [39,40,41,42].
There have been efforts to address an adequate mechanism to describe the primary transition and subsequent martensite phase formation in detail. Many of them involve complicated crystallographic transition mechanisms, which seemingly deviate from the primary purposes of this study. On the other hand, 57Fe Mössbauer spectroscopy, as an atomic-level probing characterization technique, is considered to be more proficient in shedding light on this issue and was employed in many cases to investigate, in depth, the specific electronic and magnetic modifications imposed on the Fe-sites by the carbon interstitials. These modifications depend on the proximity of iron atoms to the carbon interstitials and the specific local structures. The literature suggests that the presence of the third element content (carbon) at the octahedral interstitial sites in the initial austenite structure significantly determines the aspect ratio, c/a, of the final bct martensite lattice, and thus its tetragonality yield, which appears to be independent of the presence of the alloying elements [39,43].
In relation to the two nanomaterial types, many researchers have produced studies dealing with the synthesis, characterization, and applications of such nanomaterials using different nanocarbon allotropes either in core/shell models [13,20,36], thin film substrates [25], or as interstitial dopants [43,44,45,46]. In this work, the synthesis, characterization, and comprehensive study of the inseparably linked structural, morphological, and magnetic properties of a new line of hybrid nanomaterials composed of Fe–Co nanoalloys grown on ND nanotemplates (Fe–Co/NDs) built upon our group’s expertise in the development of such hybrid nanostructured magnetic materials [47,48,49] is presented. The realization of these nanohybrid structures relied on the use of wet chemical metallic salt impregnation methods and subsequent annealing under controlled conditions. The samples were characterized and studied using X-ray diffraction (XRD), TEM, high-resolution transmission, and scanning-transmission electron microscopy (HRTEM, and STEM, respectively) with high-angle angular dark-field (HAADF) imaging, energy dispersive X-ray spectroscopy analysis (EDS), vibrating sample magnetometry, and 57Fe Mössbauer spectroscopy techniques. The results demonstrate that the stability and nature of the Fe–Co nanoalloy phases developed on the surface of the ND nanotemplates are significantly determined by the annealing conditions (temperature and time). In all samples, the formation of a dominant phase attributed to nanostructured FM Fe–Co alloy is evident, along with a significant and systematic presence of a tetragonally distorted martensitic type Fe–Co/C phase, which is produced by interfacial interactions involving the C atoms between the growing Fe–Co MNPs and the sp2 type surfaces of the ND nanotemplates.
This nanohybrid system, whose synthesis and characterization are reported here for the first time in the literature, exhibits structural and magnetic properties that can be exploited in contemporary technological applications such as biomedicine [50]. Moreover, developing and analyzing the martensitic type Fe–Co phase in these samples could serve as a guide to unveil the conditions and means of producing such tetragonally distorted structures, thus further pushing the effort to deploy new non-rare-earth-based hard FM materials.

2. Experimental Section

2.1. Materials Synthesis

The synthetic route for the production of the hybrid magnetic crystalline Fe–Co/ND nanostructures involved a two-step procedure (Scheme 1): an initial wet chemistry impregnation step [51,52] aimed to deliver as-made (AM) chemical precursors, followed by thermal annealing of these precursors under controlled conditions. A nominal Fe:Co atomic ratio of 1:1 was implemented using appropriate amounts of the corresponding metal salts. A total ~10 wt. % of combined Fe and Co metal-to-ND mass ratio was considered, while both conventional (AM-NHD) and 57Fe-enriched (En-AM-NHD) reactants were used for the preparation of the corresponding AM nanohybrid precursor samples. The use of 57Fe-enriched reactants was chosen to enhance the resolution of the Mössbauer spectra (MS) transmission signals, given the low Fe content of the samples.
Specifically, for the conventional AM-NHD precursor, 58 mg of Fe(NO3)3∙9H2O (99.99+%, Aldrich 254223-50G) and 42 mg of Co(NO3)2∙6H2O (>99.0%, Fluka 60832) were dissolved in 0.8 mL of deionized water. This solution was mixed with 150 mg of detonation ND powder (98%, Aldrich 636428-1G). The mass concentrations of all components were calculated so that the final AM hybrid precursor contained ~10 wt. % of equiatomic Fe–Co metal percentage. The mixture was blended and homogenized in a moist paste form using an agate mortar and then allowed to dry at 100° C for 24 h. After dehydration, the material was re-homogenized into a fine powder and calcined in air at 400 °C for 1 h. This process aimed to remove the nitrates and produce homogeneous well-dispersed iron–cobalt oxide (ICO) NP seeds on the surfaces of the ND nanotemplates (see Scheme 1). Subsequently, thermal treatments of the AM-NHD precursor were conducted in sealed under vacuum (10−3 Torr) quartz ampoules at temperatures of 700 °C (NHD-700), 650 °C (NHD-650), and 600 °C (NHD-600), for varying time intervals of 2 s, 30 min, 2 h, 8 h, and 32 h.
For the 57Fe En-AM-NHD precursor, 51 mg of Fe(NO3)3∙9H2O (99.99+%, Aldrich 254223-50G) along with 0.1 mL of metallic 57Fe dissolved in HNO3 solution with C(57Fe) = 7 mg/mL concentration, and 42 mg of Co(NO3)2∙6H2O (>99.0%, Fluka 60832) were dissolved in 1 mL of deionized water. This solution was then mixed with 150 mg of ND powder (98%, Aldrich 636428-1G). The nominal 57Fe-to-Fe3+ atomic ratio in the relative reactants was calculated to be approximately 0.1. Subsequently, the mixture followed the same process of dehydration and calcination as that of the non-enriched AM-NHD precursor.
In the final step, the En-AM-NHD precursor was thermally treated in vacuum (10−3 Torr)-sealed quartz ampoules at 700 °C (En-NHD-700) for varying annealing time intervals of 30 min, 2 h, and 8 h. Additionally, we also examined the influence of a slow cooling (SC) procedure after annealing in the specific time interval of 30 min, from 700 °C to room temperature (RT), under controlled conditions (30 °C/h) using the En-AM-NHD precursor to produce the En-NHD-700,30m-SC sample. This was performed to explore the possibility of further enhancing the Fe–Co atomic ordering of the resulting crystalline alloy phases in this sample and to compare the results with the relative results on other samples that lacked the SC step feature [26,29].
Following this, the properties of these two representative samples, NHD-700,30m and En-NHD-700,30m-SC, respectively, are discussed further to demonstrate the feasibility and effectiveness of the proposed synthesis method.

2.2. Materials Characterization

Characterization and study of the structural and morphological properties, stoichiometry, and particle size of the prepared samples were performed by using powder XRD, using Cu Ka radiation on a Bruker Advance D8 diffractometer, and analytical TEM/STEM observations, which were carried out using a 200 kV JEOL JEM F200 TEM/STEM microscope equipped with a Cold Field Emission Gun (CFEG) and an OXFORD X-Max 65T EDS detector. Prior to TEM observations, the samples were dispersed in ethanol and suspended in ultrasound for up to 60 min, while a single drop of a very dilute suspension of each sample was placed on a carbon-coated Cu grid and left to dry naturally by evaporation at ambient conditions. Inquiries of the samples’ magnetic properties were performed on a conventional Vibrating Sample Magnetometer (VSM) (LakeShore 7300, Westerville, OH, USA) and a VSM-equipped Magnetic Property Measurement System (Quantum Desing MPMS 3, San Diego, CA, USA) through mass magnetization (M) and magnetic susceptibility (χg) measurements. M versus (vs.) external magnetic field (H) hysteresis loops were collected at constant temperatures of 2, 300, and 400 K in fields up to 70 kOe. The zero-field-cooled (ZFC) and field-cooled (FC) χg vs. temperature (T) curves were recorded upon warming the samples in the temperature range of 2 to 400 K under two different H values of 99 and 999 Oe, after cooling them in zero H, and on cooling, directly after the warming procedure under the aforementioned H fields, respectively. To investigate the iron-bearing phases’ electronic, magnetic, structural, and morphological properties in detail, 57Fe Mössbauer spectra (MS) were collected in transmission geometry at sample temperatures of 300 and 11 K, using constant-acceleration spectrometers equipped with 57Co(Rh) sources kept at room temperature (RT), in combination with a He gas closed-loop (ARS DMX-20) Mössbauer cryostat. For the velocity calibration of the spectrometers, metallic α-Fe at RT was used, and all isomer shift (IS) values are given relative to this standard. The recorded MS were fitted and analyzed using the IMSG code [53].

3. Results and Discussion

3.1. XRD

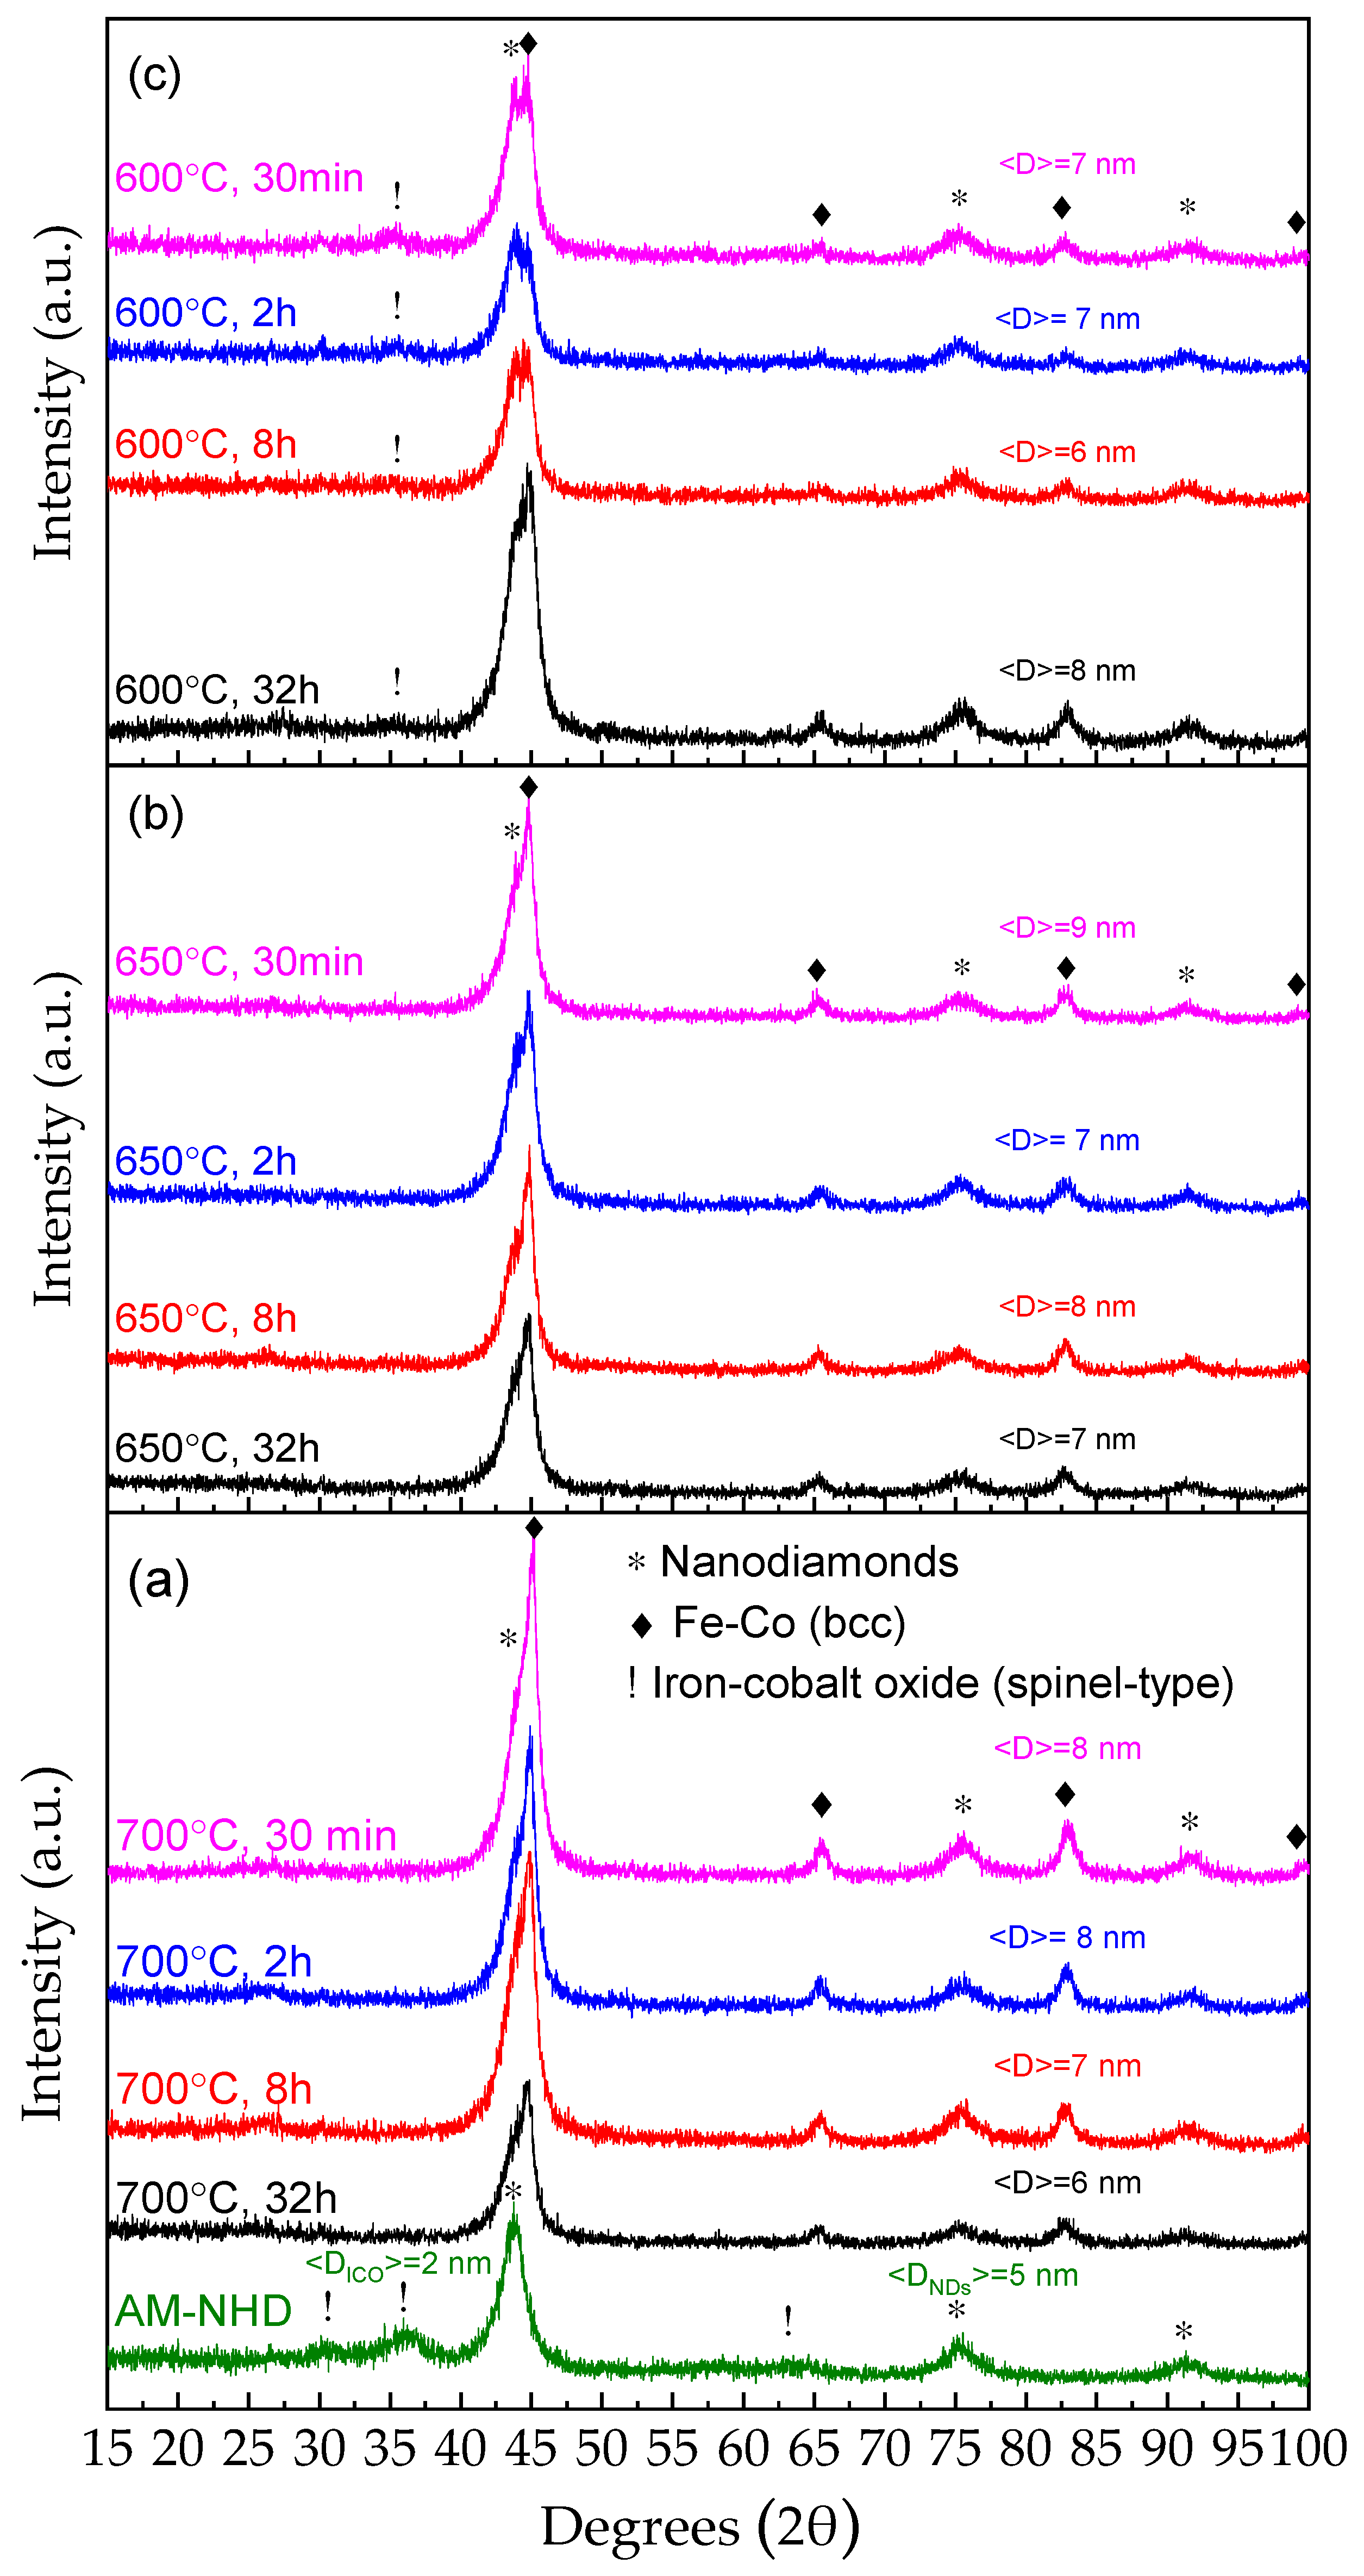
The XRD patterns of a typical AM-NHD precursor, along with the following annealed samples at different temperatures and heating durations, are shown in Figure 1.
The main broad diffraction peaks of the cubic ND structure at 43.9 (111), 75.3 (220), and 91.5 (311) degrees 2θ (lattice constant a = 3.567 Å, ICDD PDF 00-006-0675), and of the spinel-type Fe3−xCoxO4 ICO structure at 30.1 (220), 35.4 (311), and 63.6 (440) degrees 2θ (lattice constant a = 8.392 Å, ICDD PDF 00-022-1086), respectively [54], are depicted in the XRD diagram of the AM-NHD sample (Figure 1a). An estimation of the average NP crystalline domain size <D> for each of these two phases based on the most resolvable widths of their main diffraction peaks was made using the Scherrer formula [55], providing an average size of <DNDs> = 5 nm for the NDs and <DICO> = 2 nm for the ICO. This result indicates that the AM-NHD precursor is composed of very small ICO NPs developed on the ND nanotemplate matrices.
From Figure 1, it is also evident that the annealing of the AM-NHD precursor at all chosen temperatures and durations is capable of inducing the formation of a new nanocrystalline phase. At the same time, the presence of the ICO is diminished, and that of the NDs is completely retained. In particular, apart from the presence of the characteristic ND diffraction peaks, considerable contributions from the broad diffraction peaks of a cubic bcc Fe–Co crystal structure are evident at 44.9 (110), 65.3 (200), and 83.7 (211) degrees 2θ for the measured XRD patterns of all samples. The broad diffraction peaks of this phase inhibit a reliable estimation of the atomic Fe–Co stoichiometry from the angular positions of the diffraction peaks to be extracted from these data, as three different ICDD PDFs with iron-rich (Fe0.7Co0.3 00-048-1817, lattice constant a = 2.864 Å), equiatomic (Fe0.5Co0.5 00-049-1568, lattice constant a = 2.855 Å), and iron-poor (Fe0.3Co0.7 04-007-3335, lattice constant a = 2.842 Å) stoichiometries can qualitatively match these diffraction peaks equally. The aspects of the nature, morphology, and stoichiometry of this phase in the samples are revealed by TEM analysis (vide infra). However, an estimation of the average crystalline domain size <D> extracted out of the best resolvable widths of the main diffraction peaks at 65.3 and 83.7 degrees 2θ of this phase can be made using the Scherrer formula, and the results are depicted in each pattern. It is evident that the average size ranges between 6 and 9 nm in all cases. Moreover, for the samples annealed at 700 and 650 °C, there is no evidence of the presence of ICO in the XRD patterns, but a minor contribution of this phase appears for the samples annealed at 600 °C. From the study of these results, it is possible to conclude that as regards the formation of the Fe–Co alloy phase originating from the reduction in the ICO NP seeds, the annealing of the precursor can be carried out up to 700 °C without any significant increase in the average size of these alloy NPs compared with lower annealing temperatures. Furthermore, the residual ICO NPs appearing in the XRD patterns of the 600 °C annealed samples are absent at higher annealing temperatures, most probably due to incomplete reduction to Fe–Co, thus attributing to the case of 700 °C optimum annealing temperature characteristics. On the other side, as regards these XRD results, the annealing time does not seem to have a significant effect either in the average particle size of the Fe–Co phase or in the appearance of ICO phases in the samples, except in the case of the 600 °C series where increased time intervals seem to be related to less ICO presence. This means that the Fe–Co phase is rapidly formed from the reduction of the ICO during the annealing procedure.
Following this context, in Figure 2, we show the XRD patterns of the En-AM-NHD precursor and corresponding annealed samples. According to these measurements, the two sets of samples (non-enriched and enriched with the 57Fe reagent) have many structural similarities. In particular, the XRD pattern of En-AM-NHD sample in Figure 2 depicts the dominant presence of the broad diffraction peaks attributed to NDs, along with the three inferior diffraction peaks referred to the ICO spinel-type phase, while the application of the Scherrer formula to the corresponding peaks of this diagram gives an estimation of the average crystalline domain size <DNDs> = 4 nm for the NDs, and <DICO> = 2 nm for the ICO NPs. Annealing of the En-AM-NHD precursor at 700 °C induces the development of Fe–Co bcc nanostructures in addition to the presence of the ND nanotemplates at all durations, as found for the conventionally prepared AM-NHD precursor. However, there are also some differences; at 26.5 °C 2θ, a diffraction peak is evident, especially for the samples with the longer duration annealing treatments of 2 and 8 h. This peak is attributed to a graphitic carbon-type phase, which has also been found to develop in similar iron carbide/ND hybrid samples prepared by the same synthesis route [48]. As in the case of the annealed samples prepared with the conventional AM-NHD precursor, the aspects of the nature, morphology, and stoichiometry of this, as well as the Fe–Co alloy phase, will be revealed by further TEM analysis (vide infra). The average crystalline domain size <D> for the Fe–Co phase in most annealing duration cases lies at 10 nm, which is only slightly higher to those found for the samples prepared with the conventional AM-NHD precursor (6–9 nm), and an increase in <D> to 15 nm for this phase is observed for the longest (8 h) annealed sample, suggesting that for this precursor, longer durations induce an increase in the Fe–Co particle size. As for the cases of the annealed samples for 30 min with conventional (NHD-700,30m) and slow cooling (30 °C/h) (En-NHD-700,30m-SC) rates, no major differences are observed in their XRD patterns.

3.2. TEM, STEM, and EDS Analysis

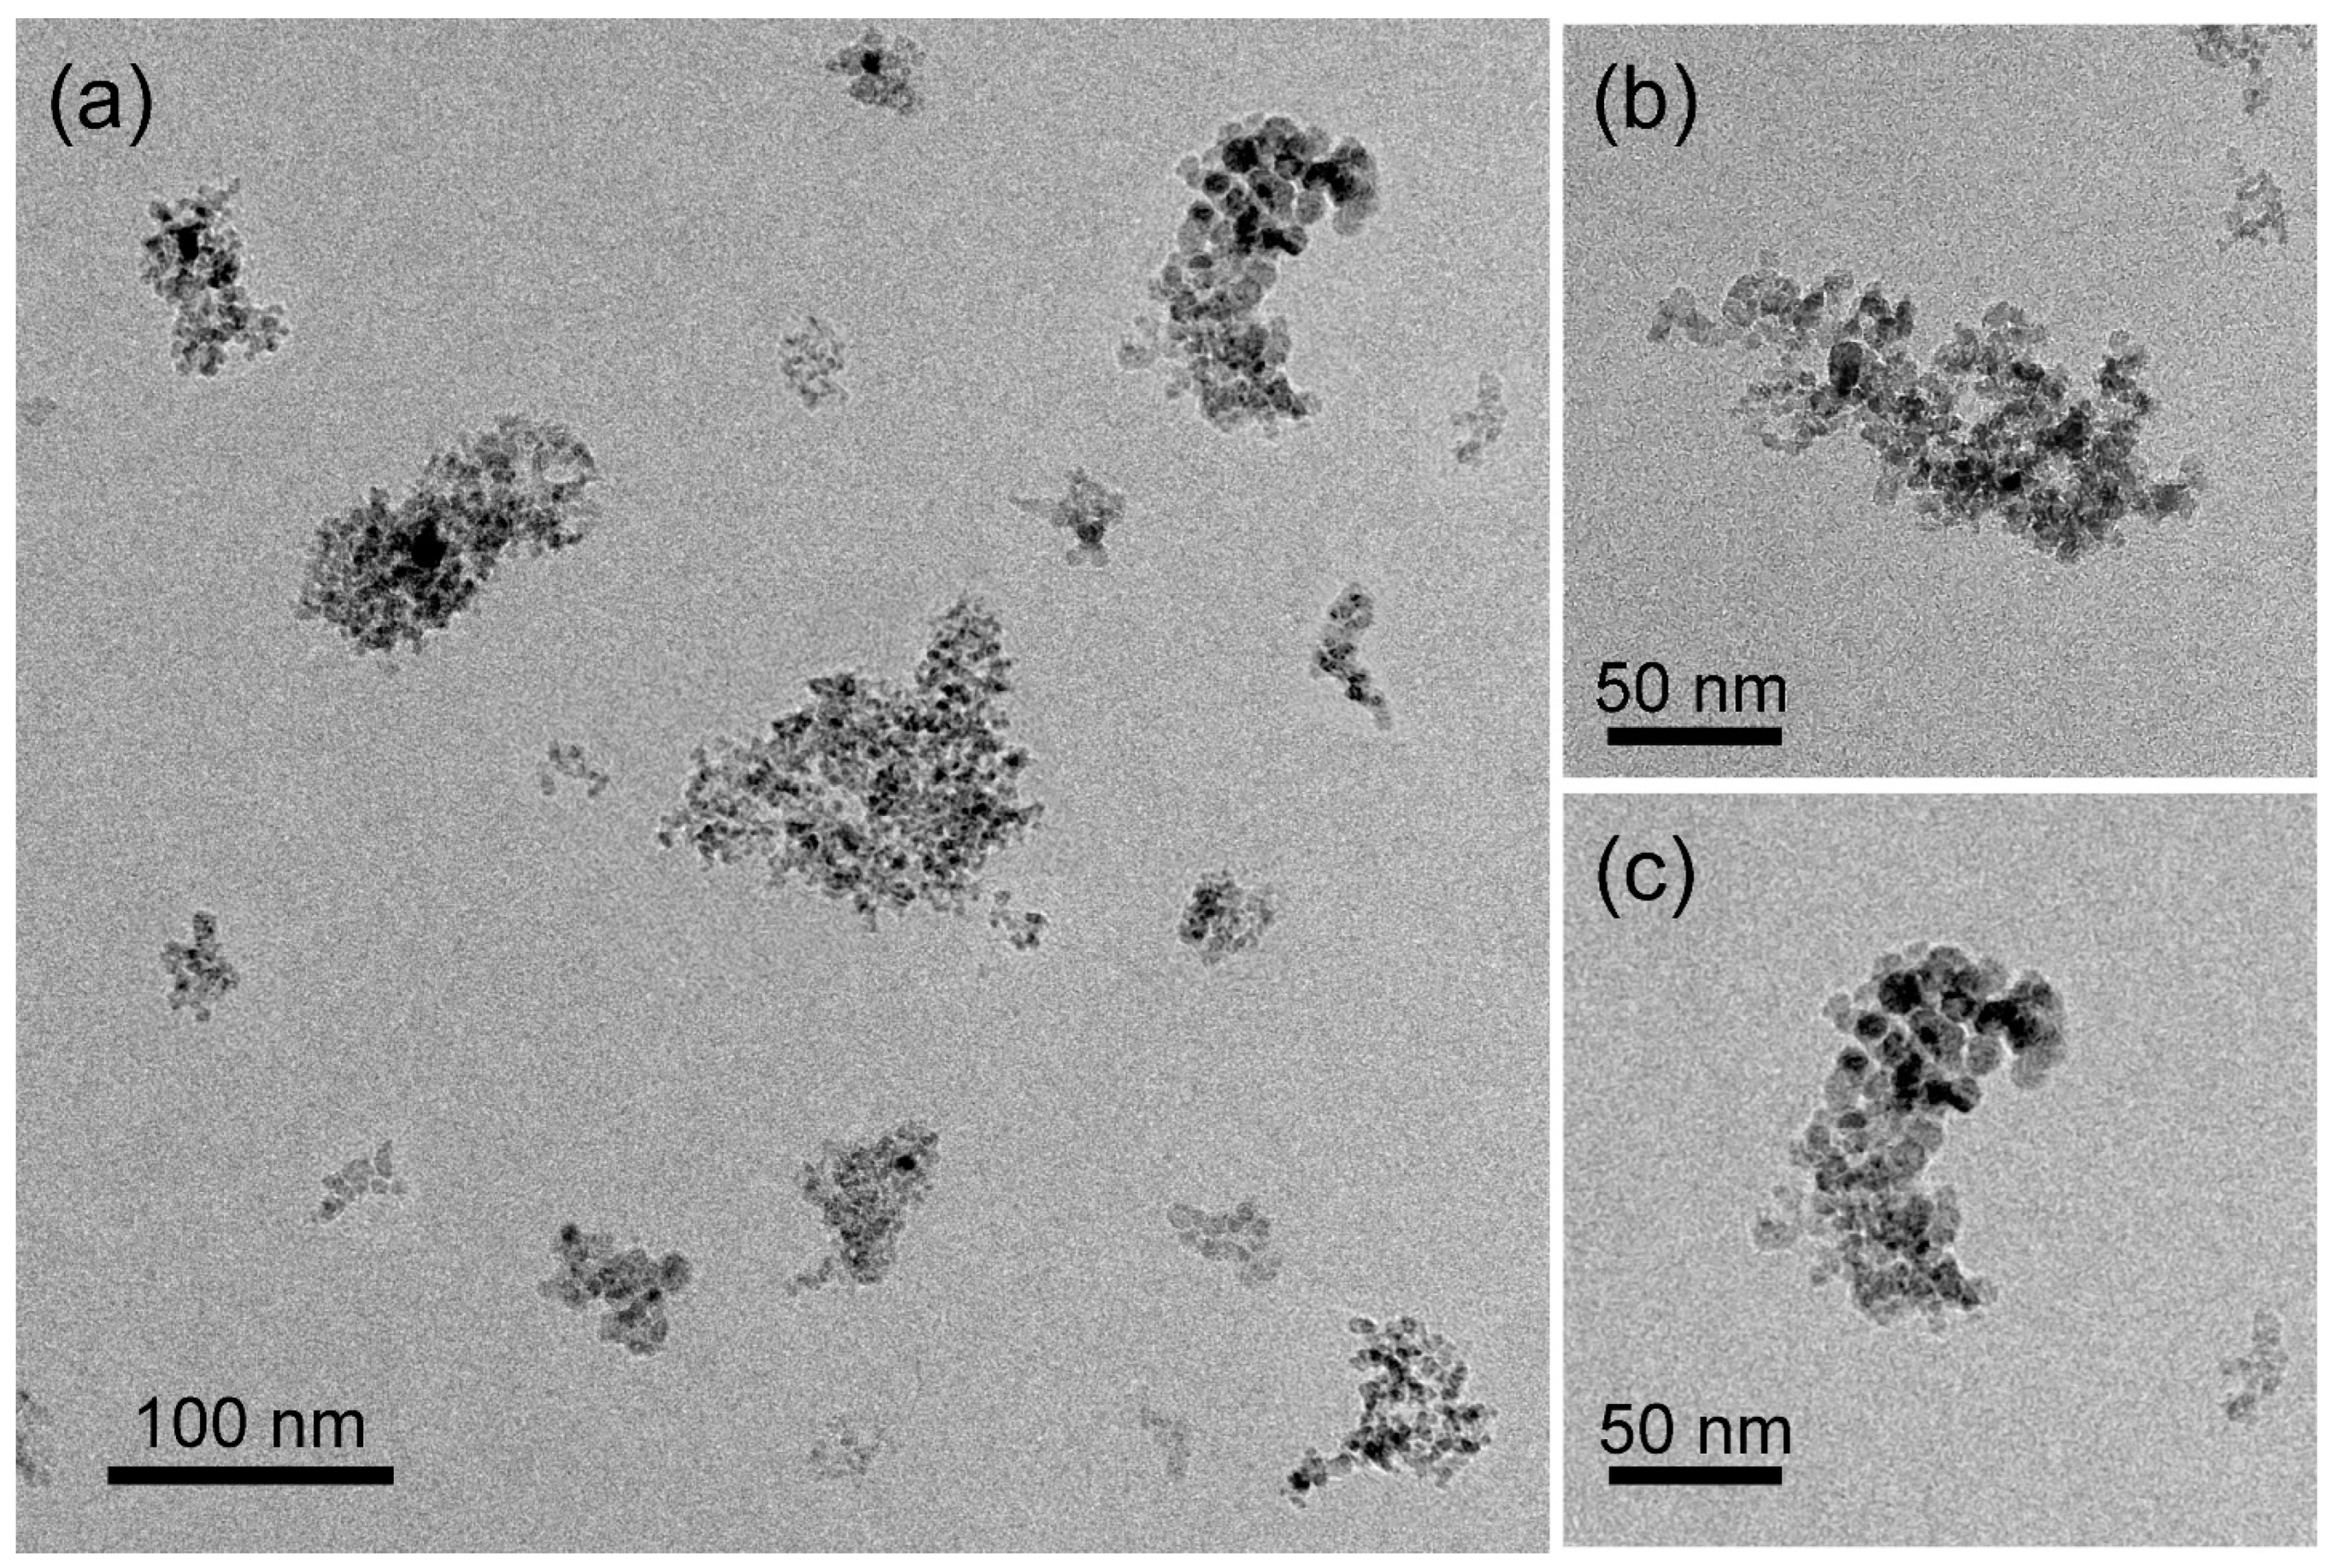
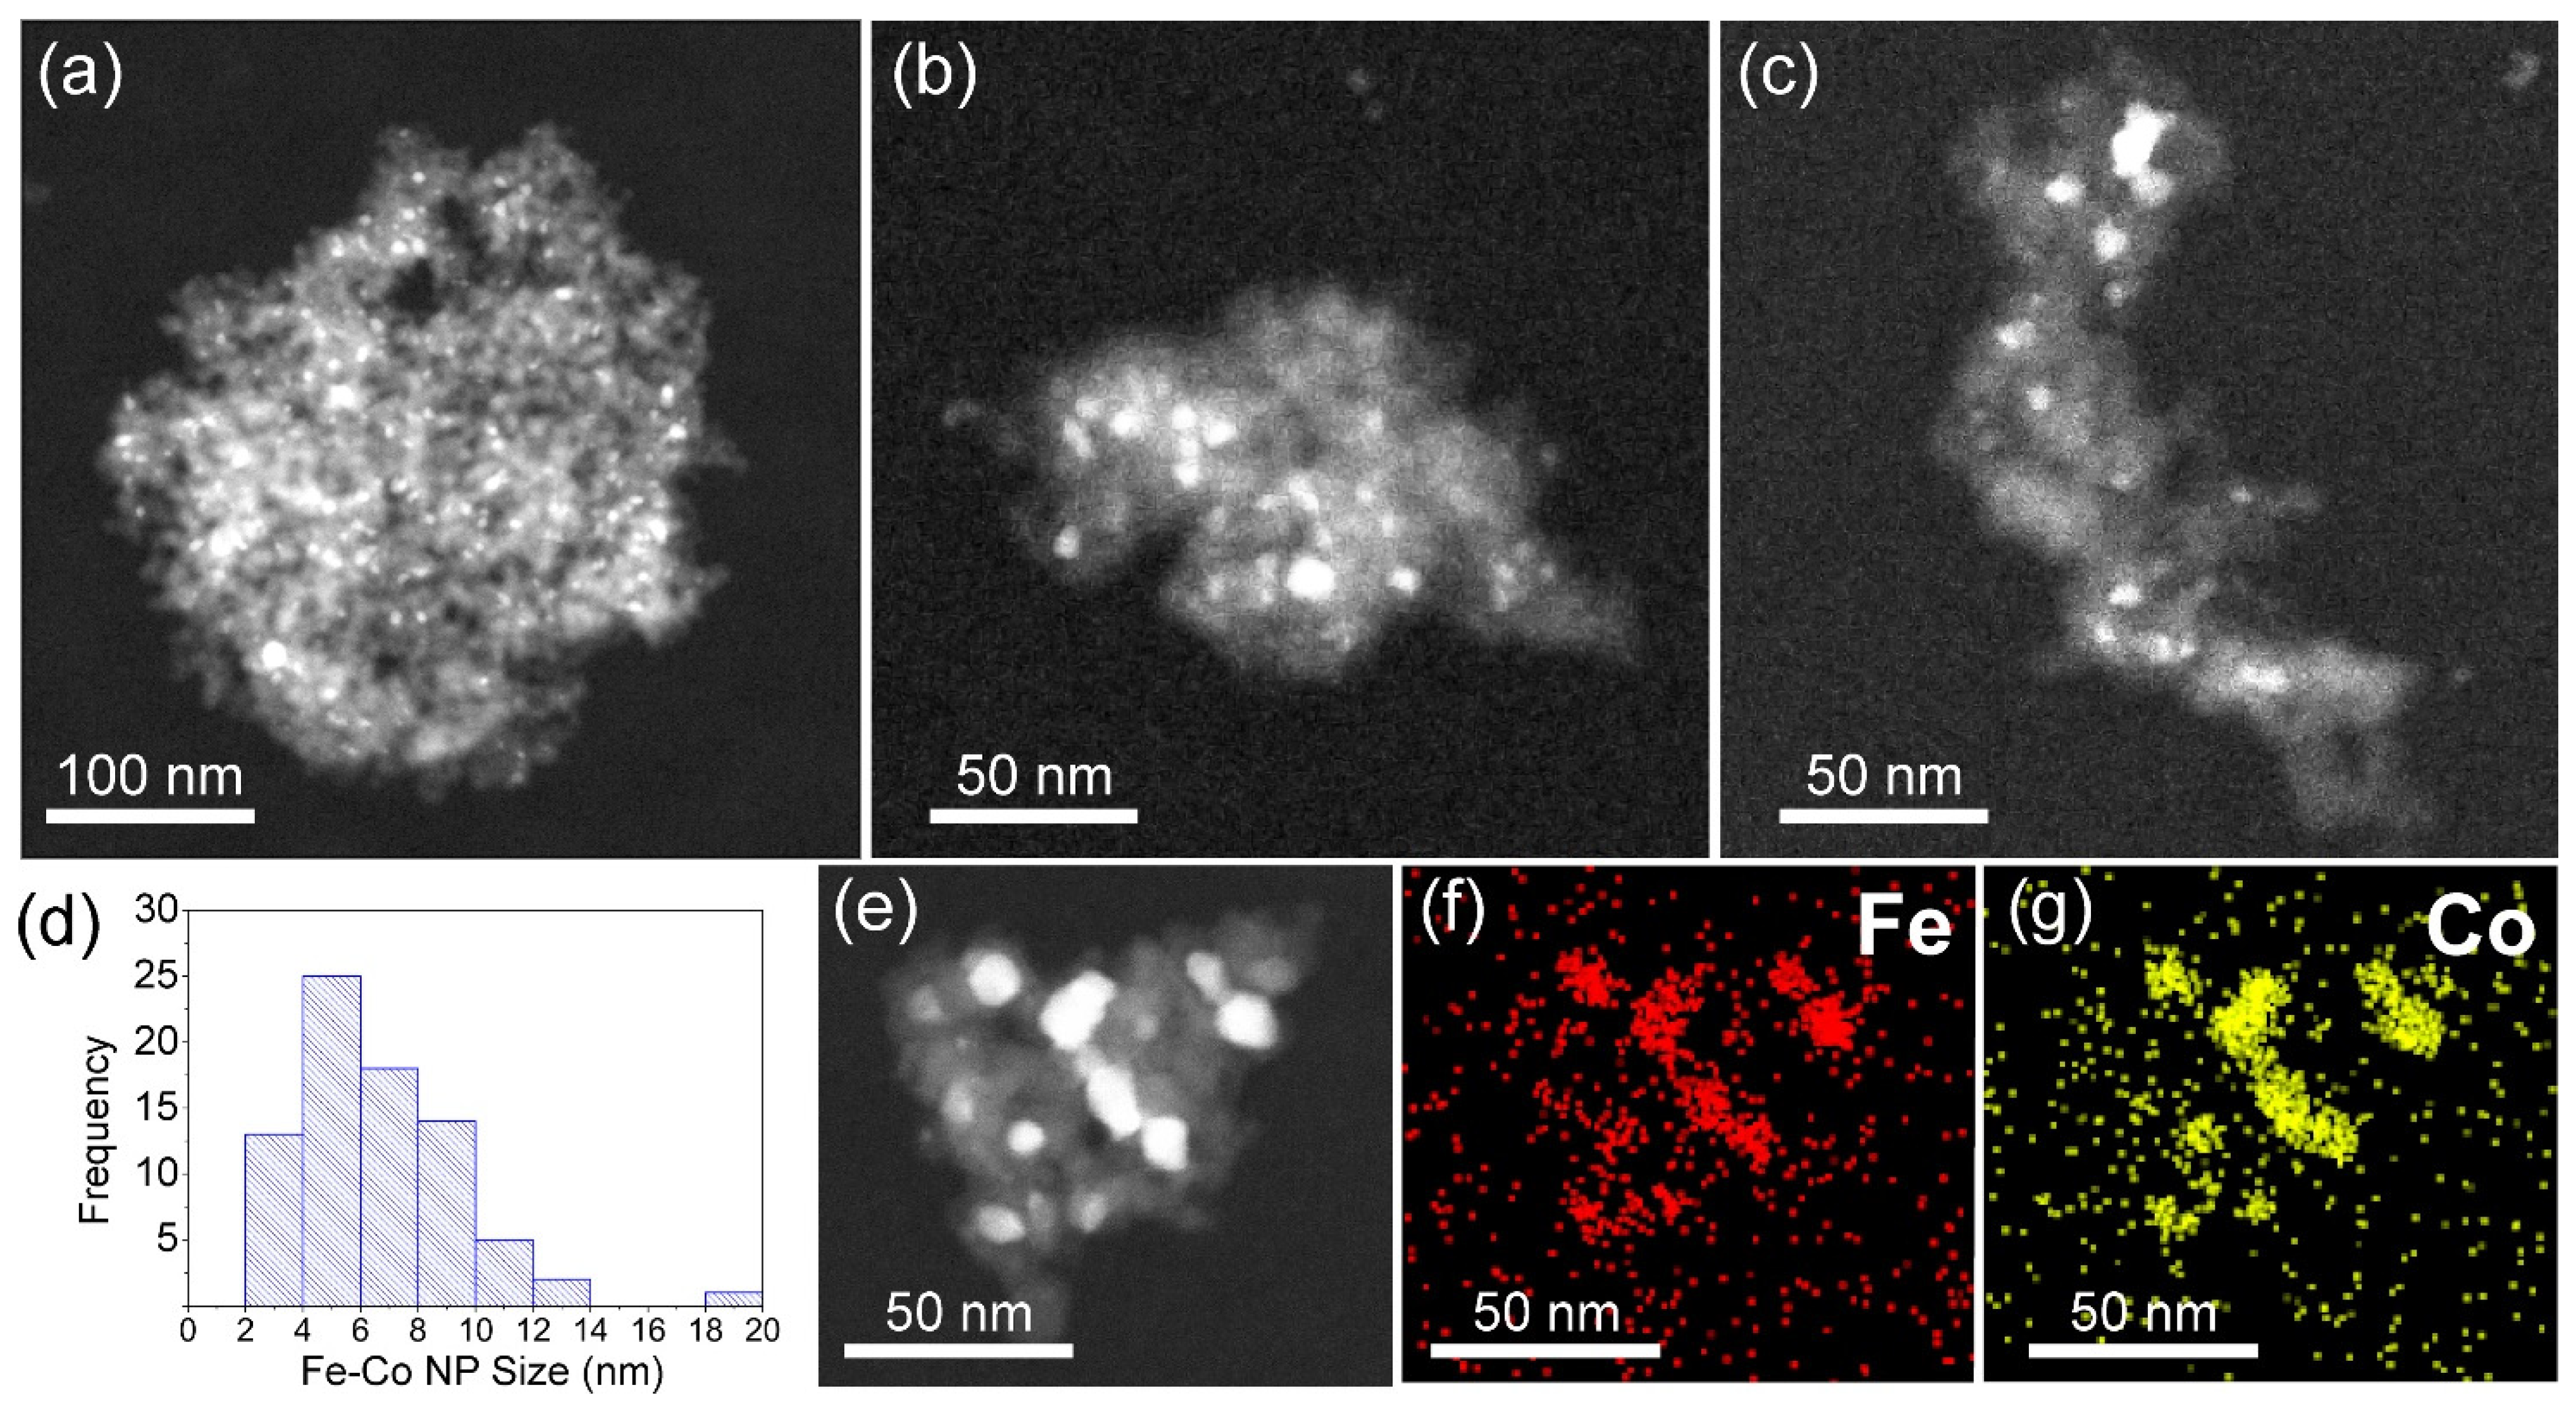
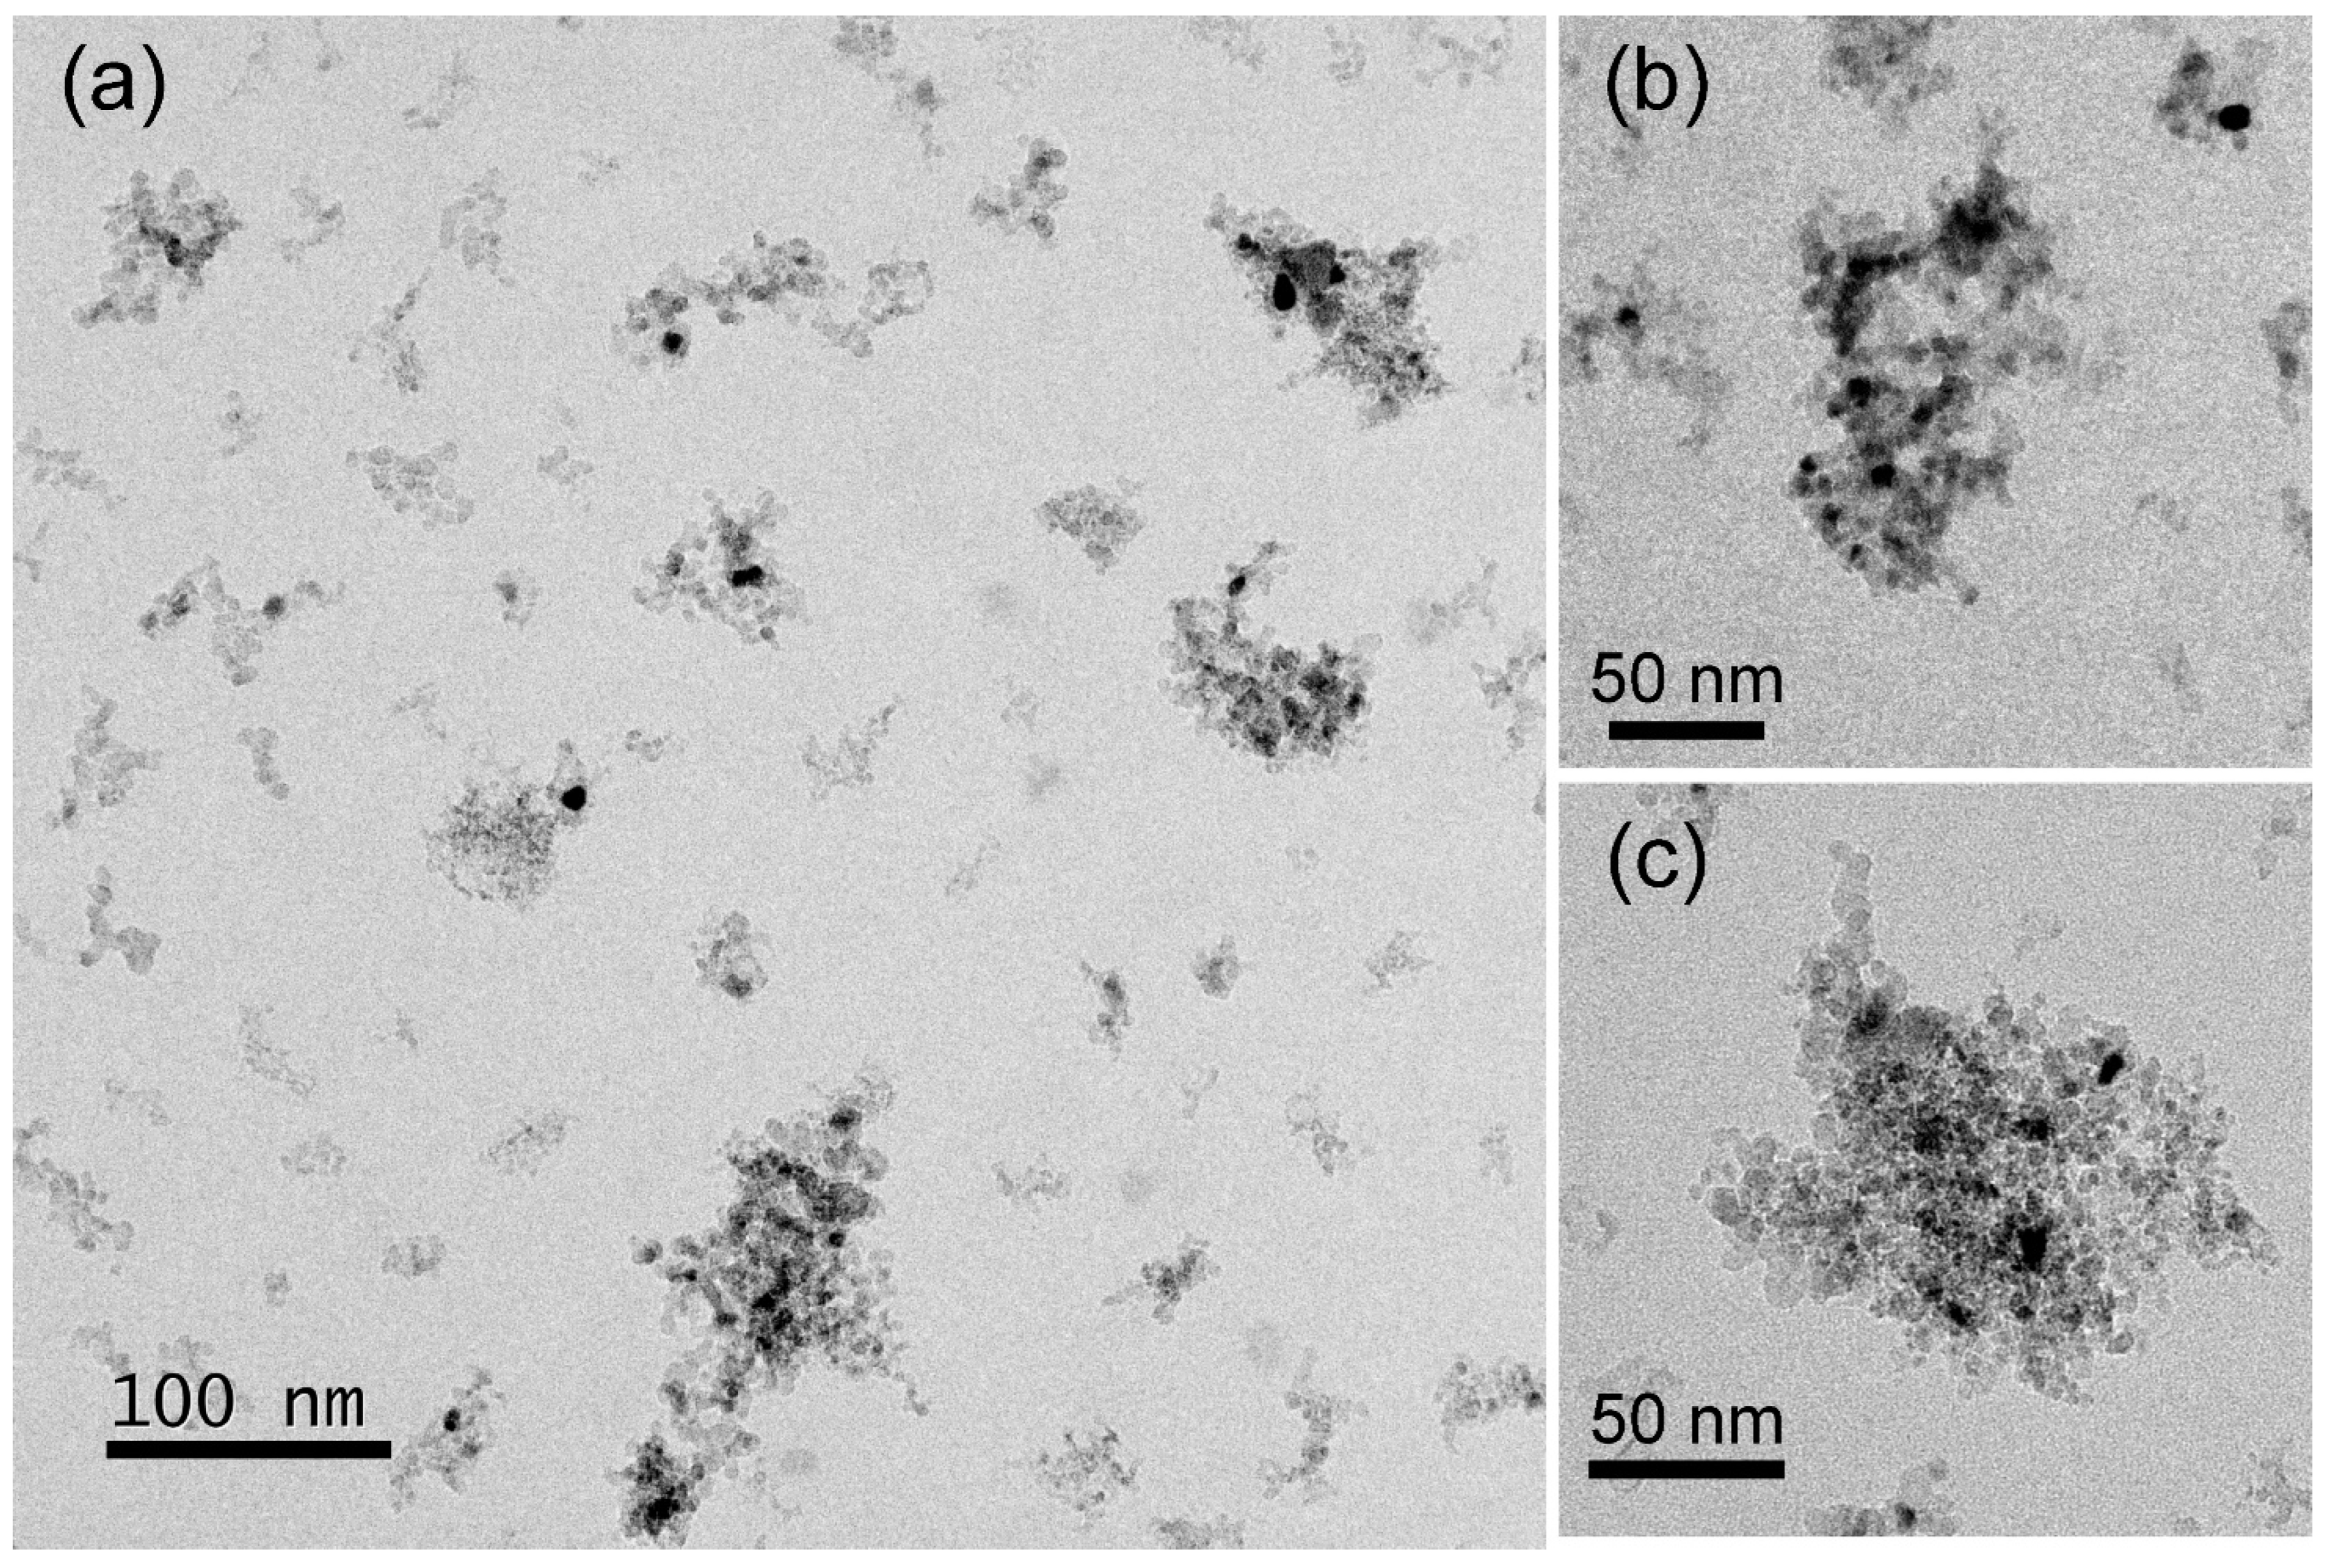
The determination of the dispersion, morphology and structure of the nanophases were revealed by TEM/STEM observations. TEM images from two representative samples, namely NHD-700,30m and En-NHD-700,30m-SC, are displayed in Figure 3 and Figure 6, respectively. Moreover, HAADF-STEM-EDS and HRTEM images, which thoroughly determine the chemical and structural details of these two respective samples, are given in Figure 4, Figure 5, Figure 7, and Figure 8, respectively. Additional images and EDS spectra from these samples are given in the Supplementary Materials (SMs) (Figures S1–S4).
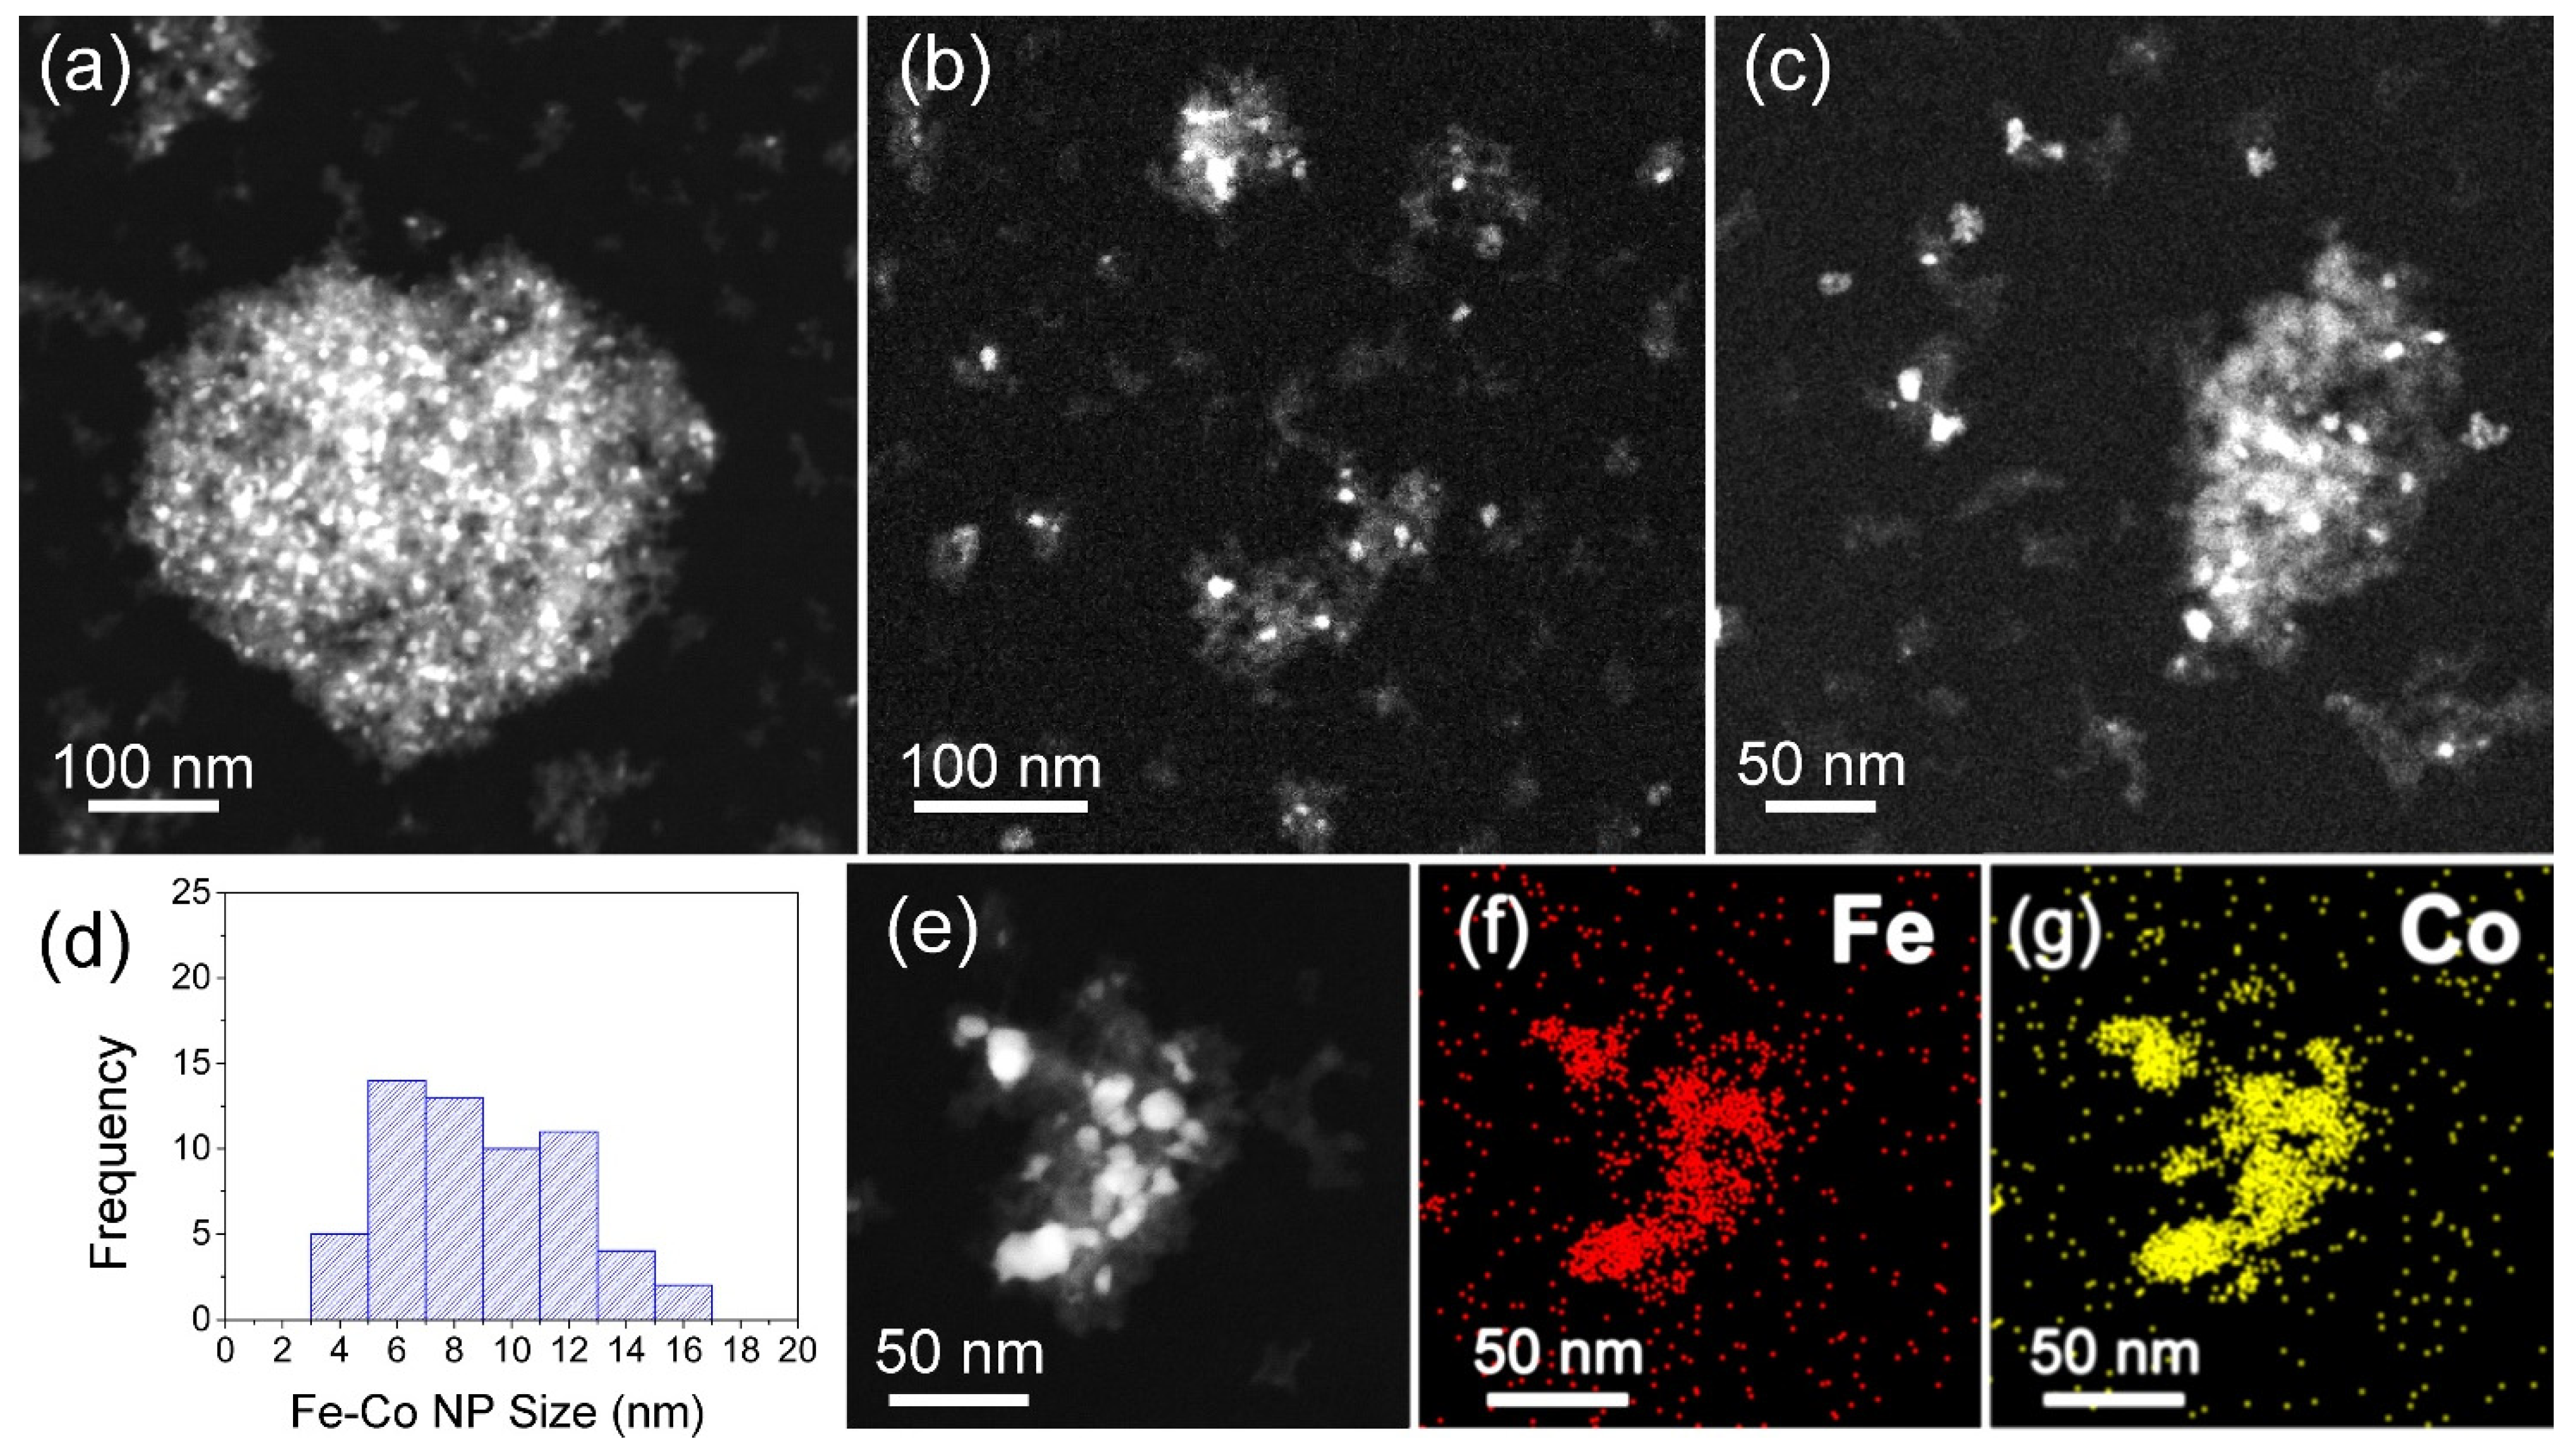
Figure 3 displays the morphology of the NHD-700,30m sample, showing a nanohybrid system consisting of well-dispersed ND clusters with arbitrary shapes and sizes ranging from 20 to 180 nm. These ND cluster nanotemplates contain relatively spherically shaped metallic NPs grown on their surface, which appear in darker contrast relative to the rest of the ND materials in these bright-field images. The ND NPs have an average size of about 5 nm and cluster together to form aggregates. HAADF imaging in STEM mode, shown in Figure 4, better reveals the distribution of the metallic NPs on the ND nanotemplates, as the contrast is proportional to the Z-number. A typical counting analysis of their sizes gives an asymmetric distribution, with higher spreading on the higher sizes’ side and a mean value of 6 nm (Figure 4d).
The HAADF STEM image of a hybrid Fe–Co NP/ND cluster and the corresponding elemental distribution mapping shown in Figure 4e–g reveals that Fe and Co atoms of the metallic NPs reside at the same spatial positions in the cluster, verifying the development of the Fe–Co alloy. Additional point and areal EDS spectra obtained from multiple metallic NPs (Figure S1 and Table S1) suggest a Co-rich stoichiometry in the Fe–Co alloy phase with an average Fe/Co atomic ratio of about 35:65 (Fe35Co65).
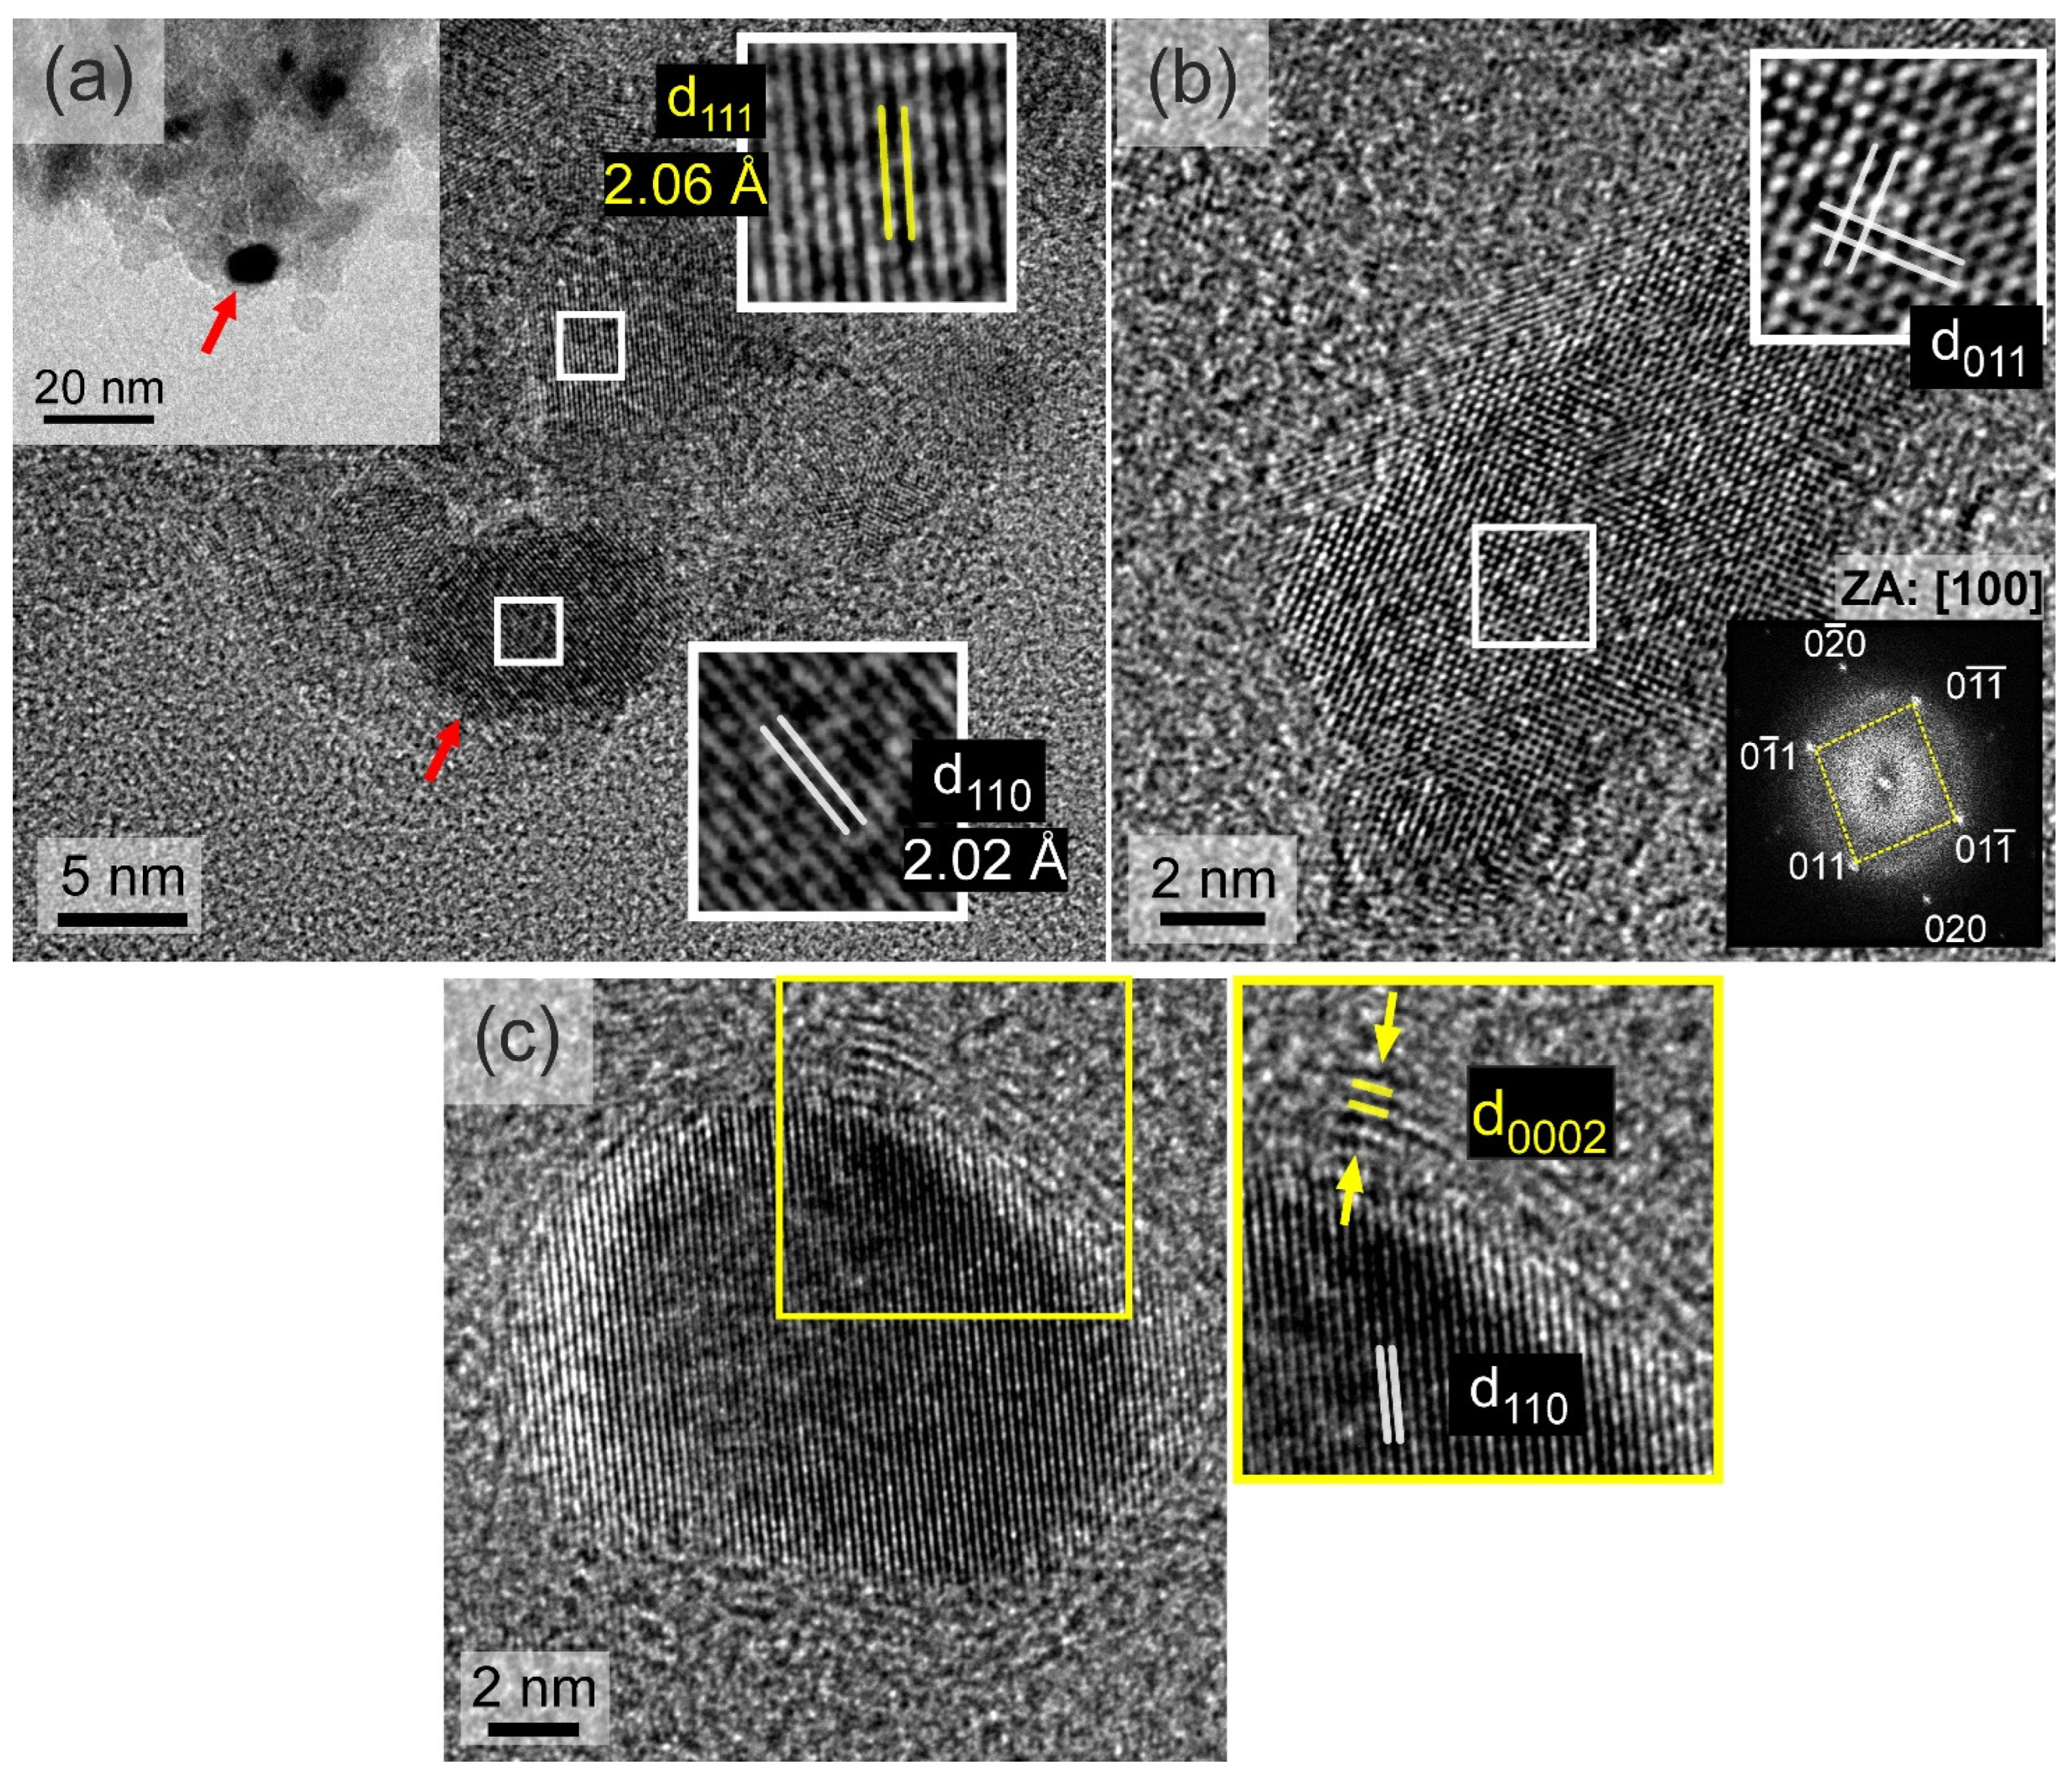
Figure 5 displays HRTEM images of different metallic Fe–Co NPs grown on the surface of the ND templates, where the characteristic d-spacings corresponding to the close-packed {110} and also the {200} planes of the bcc Fe35Co65 alloy structure are resolved. Moreover, and most importantly, the formation of graphitic-type layered structures partially wrapped around these metallic NPs is evident, at least to some extent, and indicated by the yellow arrows. The presence of these graphitic-type layered structures wrapping around the metallic Fe–Co NPs is quite systematic, as it is seen regularly in many other Fe–Co NP cases studied using HRTEM on this sample (see also Figure S2).
Figure 6 shows the morphology of the En-NHD-700,30m-SC sample. The hybrid Fe–Co/ND clusters are similar in structure, shape, and size to those found for the NHD-700,30m sample. The densely-packed ND NPs forming the nanotemplates are again, on average, about 5 nm in size, while HAADF-STEM images presented in Figure 7a–c reveal, for this sample, the same characteristics found for the NHD-700,30m sample. In this case, the metallic NPs’ size distribution seems more symmetric and has a slightly increased 9 nm mean value relative to that of the NHD-700,30m sample, attributed to the slow cooling process (Figure 7d). The elemental distribution of a hybrid Fe–Co NP/ND cluster shown in Figure 7e–g reveals that Fe and Co atoms reside at the same spatial positions, verifying again, as in the case of the NHD-700,30m sample, the development of the Fe–Co alloy. Moreover, additional point and areal EDS spectra obtained from multiple metallic NPs (Figure S3 and Table S2) also suggest a Co-rich stoichiometry in the Fe–Co alloy phase with an average Fe/Co atomic ratio of about 33:67 (Fe33Co67), very similar to that found for the NHD-700,30m sample.
The fact that both (57Fe-enriched and non-enriched) annealed samples possess very similar Co-rich Fe–Co NP compositions reflects the validity and reproducibility of the chosen two-step synthetic method.
Figure 8a displays an HRTEM image of a metallic Fe–Co NP at the edge of an ND cluster, as indicated in lower magnification in the inset BF-TEM image. Notably, the lattice spacings from the closely packed {111} and {110} planes between the cubic diamond and metallic B2 Fe–Co structures present a measurable difference. In Figure 8b, the HRTEM image reveals a characteristic Fe–Co NP projected along the [100] zone axis, aiding in the definitive identification of the B2 structure. Lastly, Figure 8c illustrates the formation of a graphitic-type few-layer structure at the interface between the metallic NPs and the ND support nanotemplate. The inset in Figure 8c shows this interface in greater detail with the graphitic-type {0002} planes marked yellow, along with the {110} planes of the adjacent metallic NP marked white. The graphitic layers wrapping around the NPs varied in thickness and degree of coverage. As shown in Figure S4, some graphitic layers were only partially developed around a metallic Fe–Co NP. Additionally, in another instance, they appear to extend away from the metallic NP.
From the TEM studies, it is possible to conclude that whatever the sample case, the development of the graphitic-type layered structures is inherently related to the development of the Fe–Co metallic NPs. By knowing the nature and characteristics of the chemical precursors used to develop the final hybrid nanostructures after vacuum annealing, it becomes apparent that carbon, which is the building element of NDs, is essential for the development of metallic Fe–Co NPs. These metallic NPs are initiated from the corresponding ICO NP seeds; thus, carbon atoms must be interacting with them, and they must be playing a crucial role in their reduction. Following this argument, the verified presence by TEM measurements of these carbon atoms at the interface between the Fe–Co metallic and ND NPs as graphitic-type layers can also suggest their further possible diffusion in the Fe–Co alloy structure.

3.3. 57Fe Mössbauer Spectroscopy

The atomic-level probing technique of 57Fe Mössbauer spectroscopy offers a unique tool to characterize and study the structural, morphological, electronic, and magnetic properties of the iron-containing phases present in the samples. The 57Fe MS of the conventional AM-NHD and En-AM-NHD precursor samples recorded at RT are presented in Figure 9.
These spectra are characterized by a central quadrupole split contribution, which is the only one existing for the spectrum of the conventional AM-NHD precursor, while for the spectrum of the En-AM-NHD precursor, a minor broad magnetically split contribution is also evident. The resonant lines of the quadrupole split contributions are relatively broad and slightly asymmetric in both MS. Thus, we used a group of two quadrupole split components to fit the spectrum of the conventional AM-NHD precursor, and a group of two quadrupole split and two magnetically split components to fit the spectrum of the En-AM-NHD precursor. For the magnetically split components in the latter case, a Gaussian-type spreading ΔBhf [53] of their hyperfine magnetic field (Bhf) values around the central BhfC value was allowed to match the broadening of the resonant lines of this part of the spectrum. The resulting Mössbauer parameter (MP) values from the best fits of these MS are listed in Table 1. These values indicate the presence of only Fe3+ high-spin (S = 5/2) states for both precursor samples. In particular, these values are characteristic of Fe3+ ions found for ICO spinel-type nanostructures, for which their particle size is so small that it renders them superparamagnetic (SPM) characteristics at RT [48,56,57]. This result agrees well with the results extracted from the XRD measurements on these samples. For the conventional AM-NHD precursor sample, the presence of only the quadrupole split contribution at RT denotes that at this temperature, the size of all ICO NP seeds developed on the surfaces of the ND nanotemplates during the first stage of the synthesis drops below the SPM size limit, where the SPM relaxation is so fast that the characteristic relaxation time τ falls below the characteristic 57Fe Mössbauer spectroscopy measuring time τMS, which is of the order of ~10−8 s; consequently, their Bhf values average to zero (collapse completely) [58,59]. The presence of a broad magnetically split part for the spectrum of the En-AM-NHD precursor sample, which is represented by the two relative components and sums up to 18% in absorption area (AA), suggests that in this case, a part of the assembly of ICO NP seeds acquire SPM relaxation times higher than τMS. This could be due to the increased particle size for these NPs, relative to smaller NPs, and/or due to their agglomeration in larger clusters, where the interparticle interactions are strong enough to increase the value to τ beyond τMS [60,61,62].
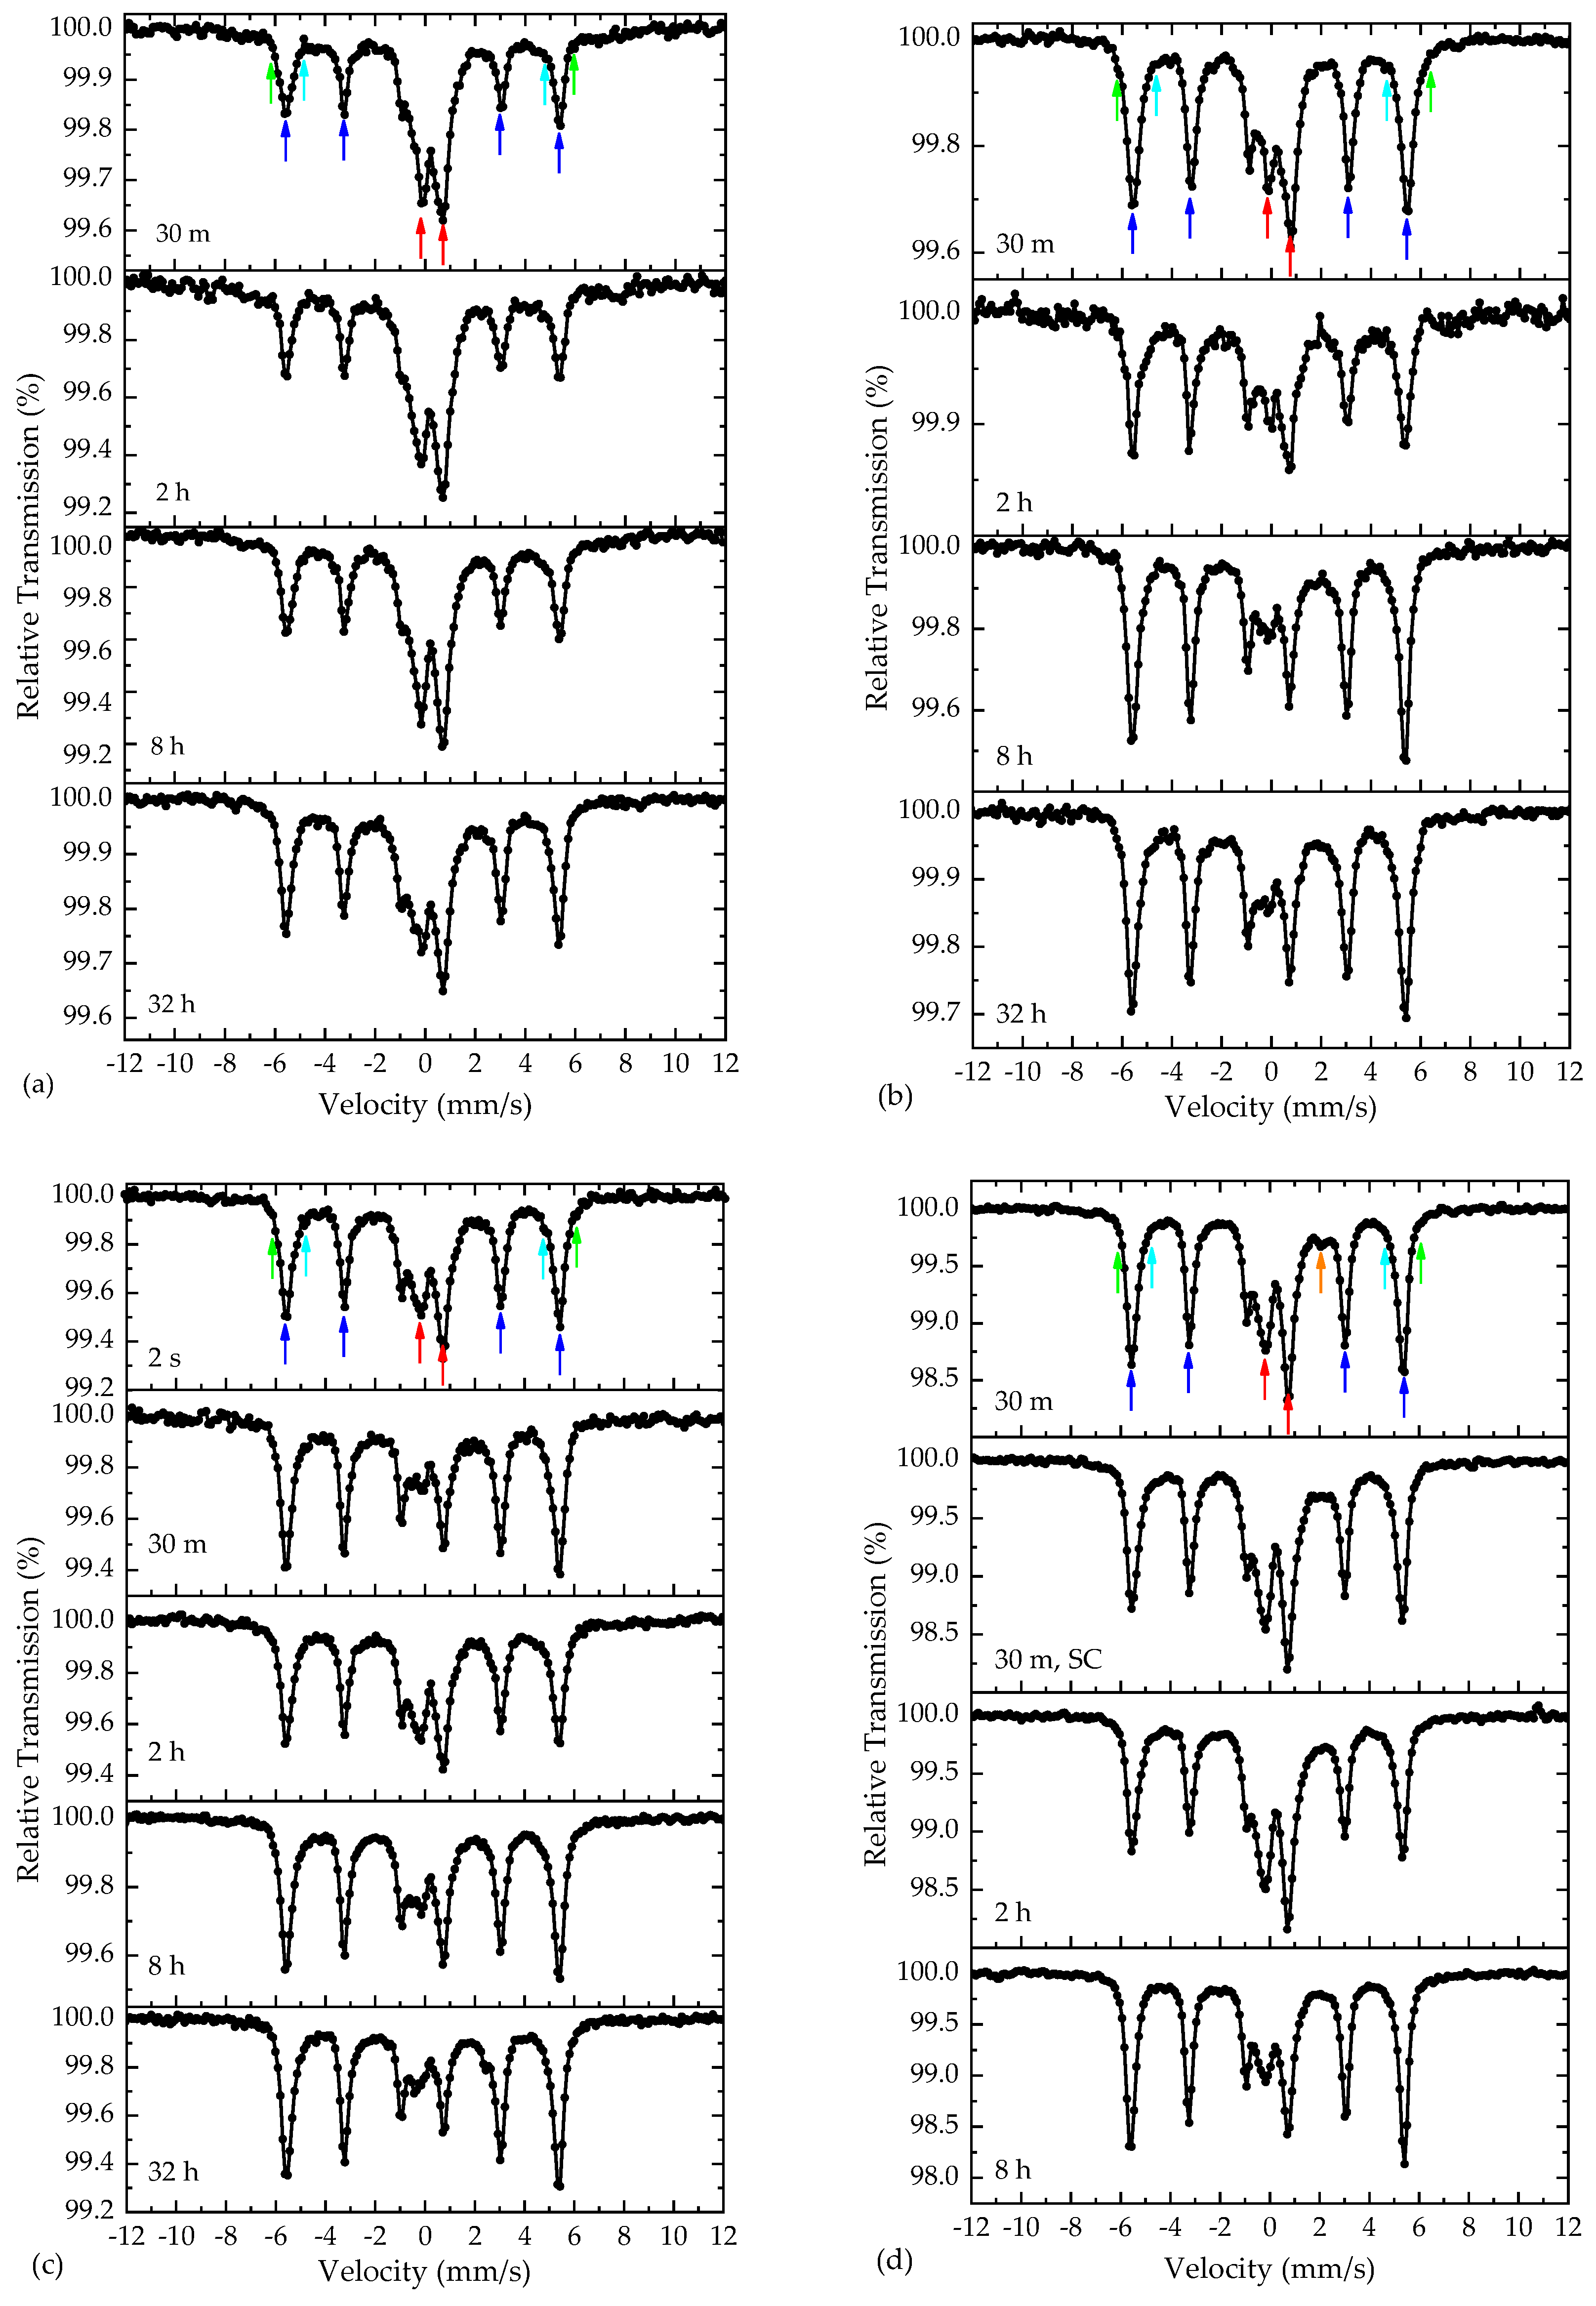
The raw MS of the annealed samples using both the conventional AM-NHD and the En-AM-NHD precursors collected at RT appear in Figure 10. Regardless of the samples’ synthesis conditions, these MS exhibit certain spectral characteristics that are common in all cases. These are the following: (i) the presence of a dominant magnetically split contribution with relative sharp resonant lines indicated by blue arrows for the four outer peaks of the six-line pattern; (ii) the presence of minor satellite magnetically split contributions, which are the most pronounced around the two outer peaks of the main magnetically split contribution and are indicated by the green and cyan arrows; and (iii) the presence of a quadrupole split contribution at the center of each MS, indicated by two red arrows. The intensity of the dominant and satellite magnetically split contributions (i) and (ii) are relatively stable in each MS, but that of the quadrupole split contribution (iii) is more pronounced for the samples annealed at 600 and 650 °C with shorter durations and decreases for the samples annealed at 700 °C. Moreover, by comparing the MS of the precursor and annealed samples, it is evident that the central quadrupole split contribution (iii) in the annealed samples is reminiscent of the main SPM ICO contribution in the precursor samples. Thus, a first qualitative conclusion suggests that the samples annealed at 700 °C contain a less residual part of SPM ICO NPs that could have remained in the annealed samples due to incomplete oxide-to-alloy reduction reactions, compared with the samples annealed at lower temperatures. This result is compatible with the results extracted from the XRD analyses, which suggest some presence of ICO, at least for the samples annealed at the lowest temperature of 600 °C.
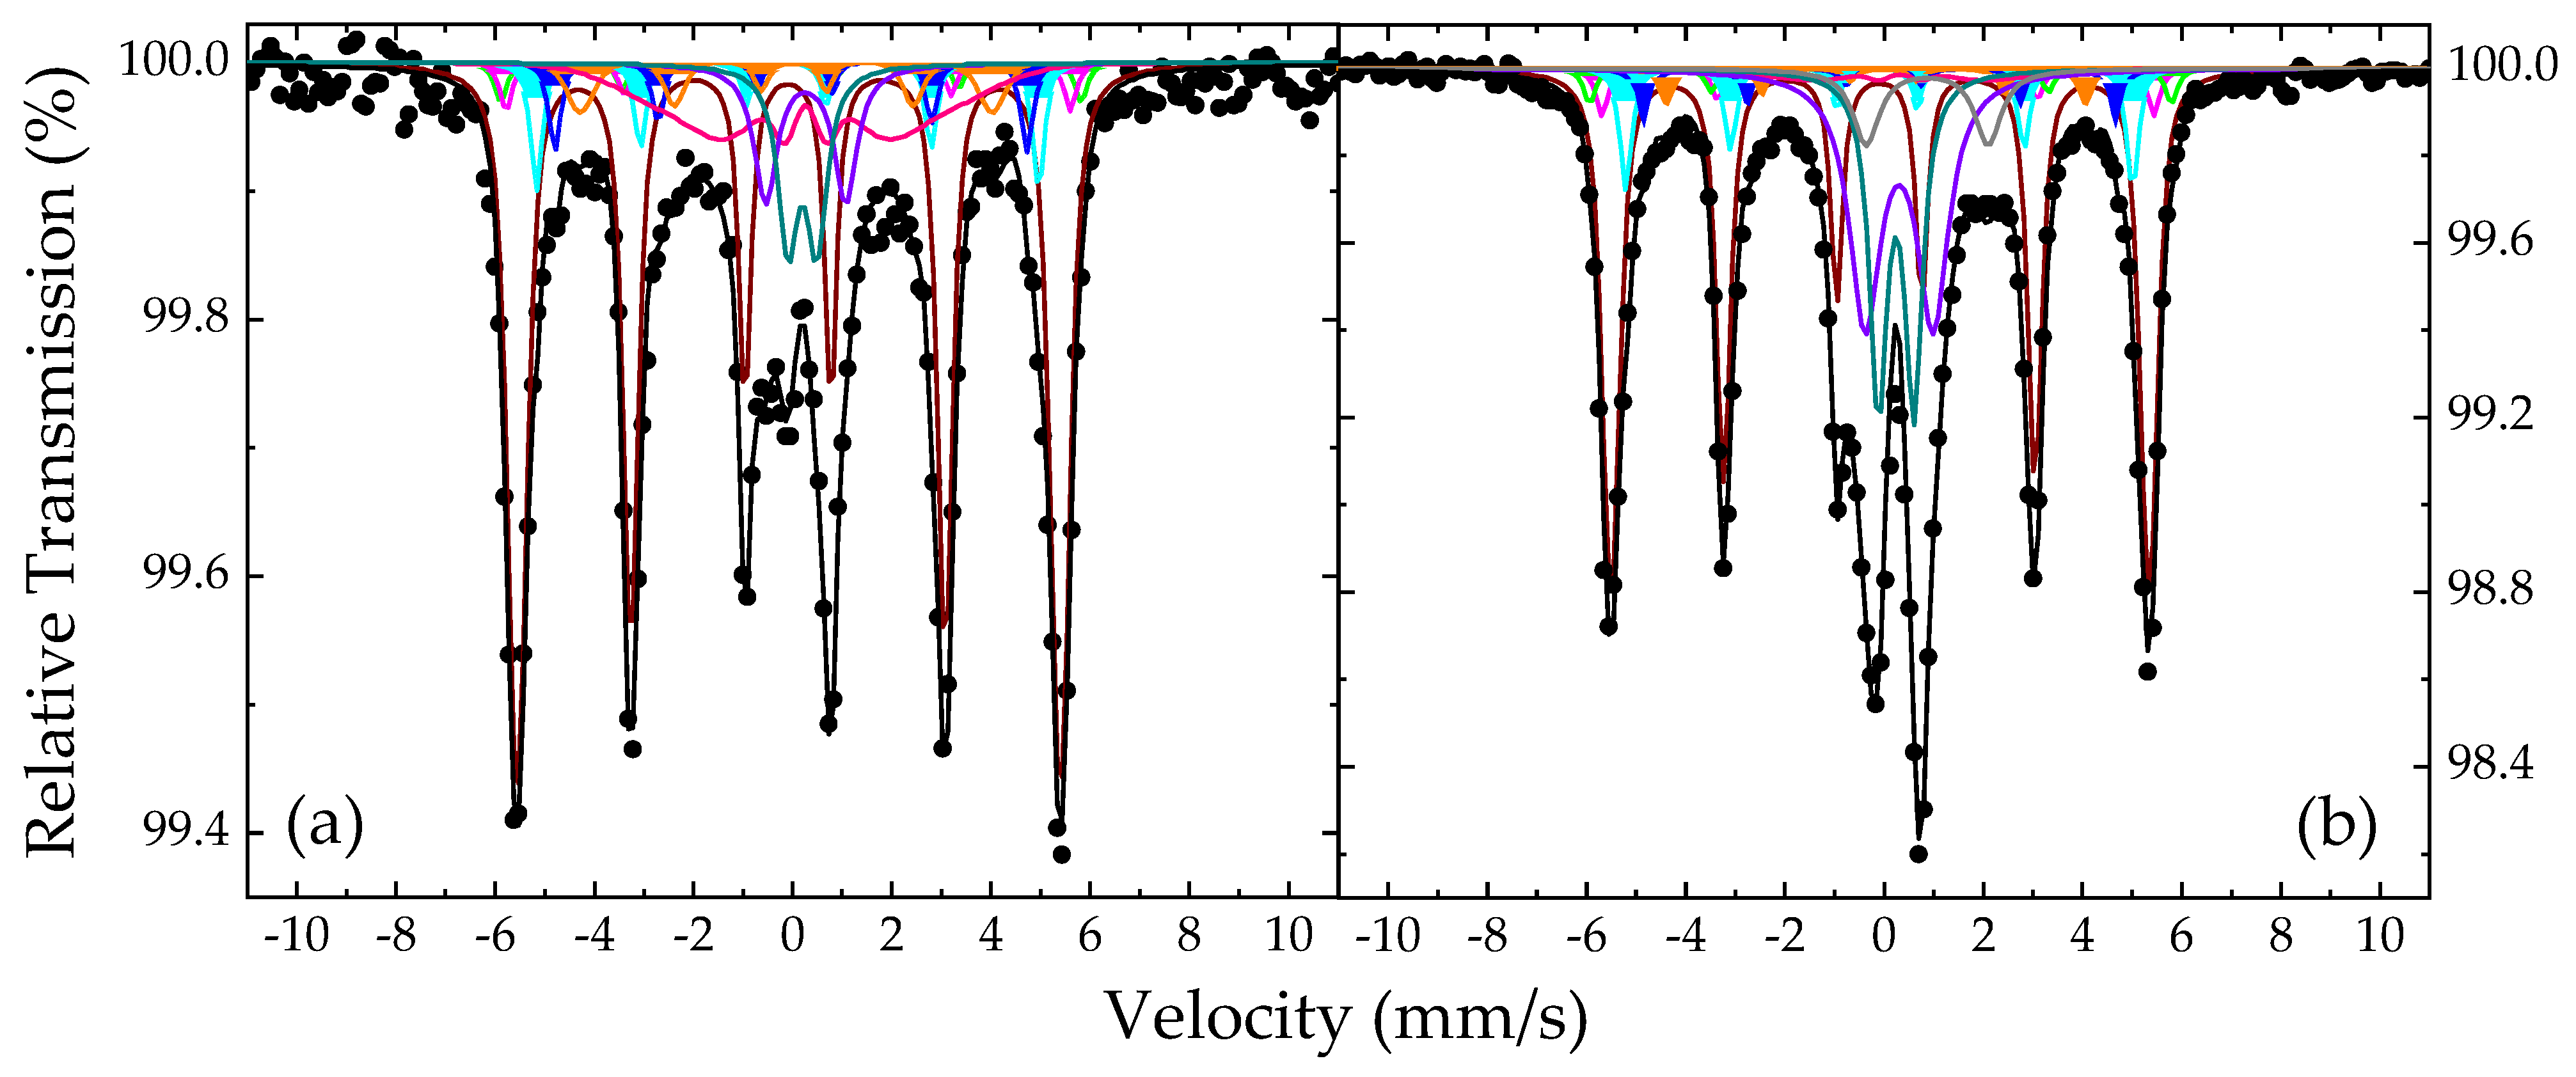
Consequently, to fit these spectra adequately and taking also into account the results from the XRD and TEM analyses, we used a model composed of one main magnetically split component to account for the dominant six-line pattern (i), a set of five minor magnetically split components for the satellite contributions (ii), and a set of two quadrupole split components for the central part (iii). In the cases of the dominant magnetically split component and one of the five minor satellite components, a Gaussian-type spreading ΔBhf of their Bhf values was allowed to cover the relative broadening of the resonant lines. In all cases, an additional minor magnetically split component with collapsing Bhf characteristics was necessary to be added to the fitting model to cover a broad absorption area residing at and around the center of each spectrum. Representative fits for the MS of the NHD-700,30m and of En-NHD-700,30m-SC samples are shown in Figure 11, and the resulting values of the MP for these fits are listed in Table 2.
Regarding the fit of the NHD-700,30m sample’s spectrum, the resulting MP values of the dominant magnetically split component (colored maroon in Figure 11a) are characteristic of a cubic FM Fe–Co alloy phase. The IS and BhfC values of 0.02 mm/s and ~340 kOe for this component suggest a stoichiometry in the Co-rich concentration region between 60 and 70 at. % Co. In addition, the slight line broadening reproduced by the ΔBhf spreading of 8 kOe could suggest contributions from both local stoichiometry and/or Fe–Co atomic-ordering structural fluctuation effects, both of which influence the environment of the iron atoms in the Fe–Co system [12,63]. For a specific Co-rich concentration above the equiatomic stoichiometry, the increase in atomic Fe–Co ordering contributes lower Bhf values compared to decreased ordering levels, while for a certain atomic Fe–Co ordering level, the decrease in Co concentration contributes higher Bhf values [64,65,66]. To this extent, when both effects are present, which most probably might be the actual situation in these samples, they tend to obscure the clear distinction between an ordered B2 CsCl-type and a disordered A2 Fe–Co structure, thus contributing to the appearance of the resonant line broadening.
The satellite contributions (ii) in this fit are modeled by a set of five minor magnetically split components with colored filled areas as shown in detail in Figure 11a. The resulting IS and Bhf values of these components listed in Table 2 correspond to iron atoms that have a metallic alloy character but are simultaneously influenced by the presence of an additional neighboring atom in their immediate atomic environment. Taking into account the TEM analyses, which suggest the diffusion of carbon atoms in the structure of the Fe–Co NPs, we attribute these components to the iron atoms of a martensitic-type Fe–Co phase forming in the Fe–Co NPs. Each component of this set corresponds to a different iron neighbor environment forming around the interstitial carbon atoms, which induce tetragonal-type distortions in the Fe–Co cubic lattice [39,40,41,43,46]. Considering the detailed analysis of the structural properties and related MP of such iron sites emerging in the martensite structure given by Kurdyumov and Gavriljuk [39,40], we can ascribe certain atomic environments to this set of components. In particular, component Martensitic Fe–Co(1), colored green in Figure 11a, acquires the highest Bhf value of the set and describes iron atoms in crystal sites placed in dilatated Fe–Co crystal lattice positions at distances relatively far from interstitial carbon atoms. Component Martensitic Fe–Co(2), colored magenta in Figure 11a, can be attributed to iron atoms, which are distant third neighbors of the interstitial carbon atoms and are only slightly influenced by the presence of these interstitials. Components Martensitic Fe–Co(3), colored cyan, and Martensitic Fe–Co(4), colored blue in Figure 11a, respectively, correspond to iron atoms occupying the closest second- and first-neighbor positions of the interstitial carbon atoms, respectively, which, according to the literature, acquire octahedral Fe/Co coordination in the bcc Fe–Co crystal structure [40,43]. Finally, component Martensitic Fe–Co(5), colored orange in Figure 11a, acquires the lower Bhf value of the set and is attributed to Fe atoms with an environment of two carbon atoms as nearest neighbors; such environments (iron atoms with two carbon atoms nearest neighbors) are more probable to appear in increased carbon interstitial concentrations according to relative binomial distribution models [46].
The central part of the spectrum is fitted with two quadrupole split components, SPM Fe3+ (1), colored dark cyan, and SPM Fe3+ (2), colored purple in Figure 11a, respectively, and one broad magnetically split component MCOL Fe3+, colored pink in Figure 11a, with collapsing Βhf characteristics. These components acquire relative broad resonant lines, and their MP values listed in Table 2 suggest that they correspond to high-spin Fe3+ ion sites in oxygen first-neighbor environments, indicative of a spinel-type ICO phase, which experience fast SPM relaxation phenomena similar to those found at the precursor samples. This result verifies the qualitative conclusion made earlier in this section that these SPM ICO NPs could have remained in the annealed samples due to incomplete oxide-to-alloy reduction reactions. Although this phase could not be detected by XRD and TEM for this sample, most probably due to its scarceness, the specialized method of 57Fe Mossbauer spectroscopy, which only probes iron, succeeds in detecting it.
To verify the consistency and fidelity of our fitting model, we checked the thermal evolution of the MS for this sample at 11 K. At this temperature, the spectrum of the NHD-700,30m sample can be fitted with the same fitting model (see Figure S9 and Table S7), in which all iron alloy components acquire the expected shifts in their IS and Bhf values, while their AA values are very similar (within the expected errors) to those found at RT. A difference can be found only for the AA values of the SPM Fe3+ and MCOL Fe3+ components, where the increased AA value of the MCOL Fe3+ component at the expense of the AA values of the SPM Fe3+ components denotes the expected decrease in SPM relaxation time τ for the nanostructured ICO NPs at low temperatures, as the ceasing of the very fast SPM relaxation encompasses a larger portion of this phase [48,56,57].
By adapting this model, we manage to adequately fit all other RT MS of the annealed samples based on the conventional AM-NHD precursor. The fitted MS are shown in Figures S5–S7, and the resulting MP values are listed in Tables S3–S5. The MP values from all fits are quite similar to those found for the NHD-700,30m sample. In some cases (NHD-650,8h and NHD-700,32h), an additional SPM quadrupole split component of Fe2+ high-spin (S = 2) character that indicates the presence of some additional Fe2+ ions in the SPM ICO phase [56] was necessary to be included in the fitting model. For the samples annealed at 600 °C in all durations and at 650 °C with annealing durations up to 2 h, increased values for the sum of the AAs of the ICO phase components are observed relative to those found for the NHD-700,30m sample. The same result holds also for the sample annealed at 700 °C in the short duration of 2 s. These results quantitatively verify our earlier qualitative conclusion on the more prominent presence of ICO at lower annealing temperatures and durations.
For the fit of the RT spectrum of the En-NHD-700,30m-SC sample shown in Figure 11b, we used the same fitting model as for the NHD-700,30m sample, with the addition of the SPM quadrupole split component of Fe2+ high spin (S = 2) character. The resulting MP values of all other components listed in Table 2 are very similar to those found for the non-57Fe-enriched NHD-700,30m sample. This reveals the high similarity of the Fe–Co NP phase characteristics in the two samples and the reproducibility of the synthesis method, as also verified by the XRD and TEM results. On the other side, an increase of about 10% for the sum of the AA values of the components attributed to the ICO phase and a similar decrease in the AA value of the main cubic Fe–Co alloy component is observed for the En-NHD-700,30m-SC sample, compared to those AAs found for the NHD-700,30m sample. By contrast, the sum of the AA values for the “martensitic” components remains relatively constant in both samples. These results suggest that the En-NHD-700,30m-SC sample contains relatively higher amounts of the SPM ICO phase, which is also somehow chemically different, in the sense that it contains additional Fe2+ ions, from the corresponding SPM ICO phase found in the NHD-700,30m sample, and this reflects some diversification between the two chemical precursor characteristics. The systematic presence of the Fe2+ component in the MS of all samples resulting from the annealing of the En-AM-NHD precursor (see Supplementary Materials Figure S8 and Table S6) further enforces this argument, as the presence of this component is only occasional in the MS of the samples resulting from the annealing of the conventional AM-NHD precursor.
By lowering the temperature to 11 K, the evolution of the MS of the En-NHD-700,30m-SC sample (see Figure S9 and Table S7) follows the same features found for the case of the NHD-700,30m sample, verifying again the consistency of the fitting model. The only difference refers to the presence of an additional broad magnetically resolved component, MRES Fe3+, colored dark yellow in Figure S9, that corresponds to a part of the ICO phase with SPM characteristics, which suggest increased NP sizes relative to the other parts of this assembly.
Again, as in the case of the NHD-700,30m sample, by adapting this model, we manage to adequately fit all other RT MS of the annealed samples based on the En-AM-NHD precursor. The fitted MS are shown in Figure S8, and the resulting MP values are listed in Table S6. Very similar results were observed for all samples.

3.4. Magnetization and Magnetic Susceptibility

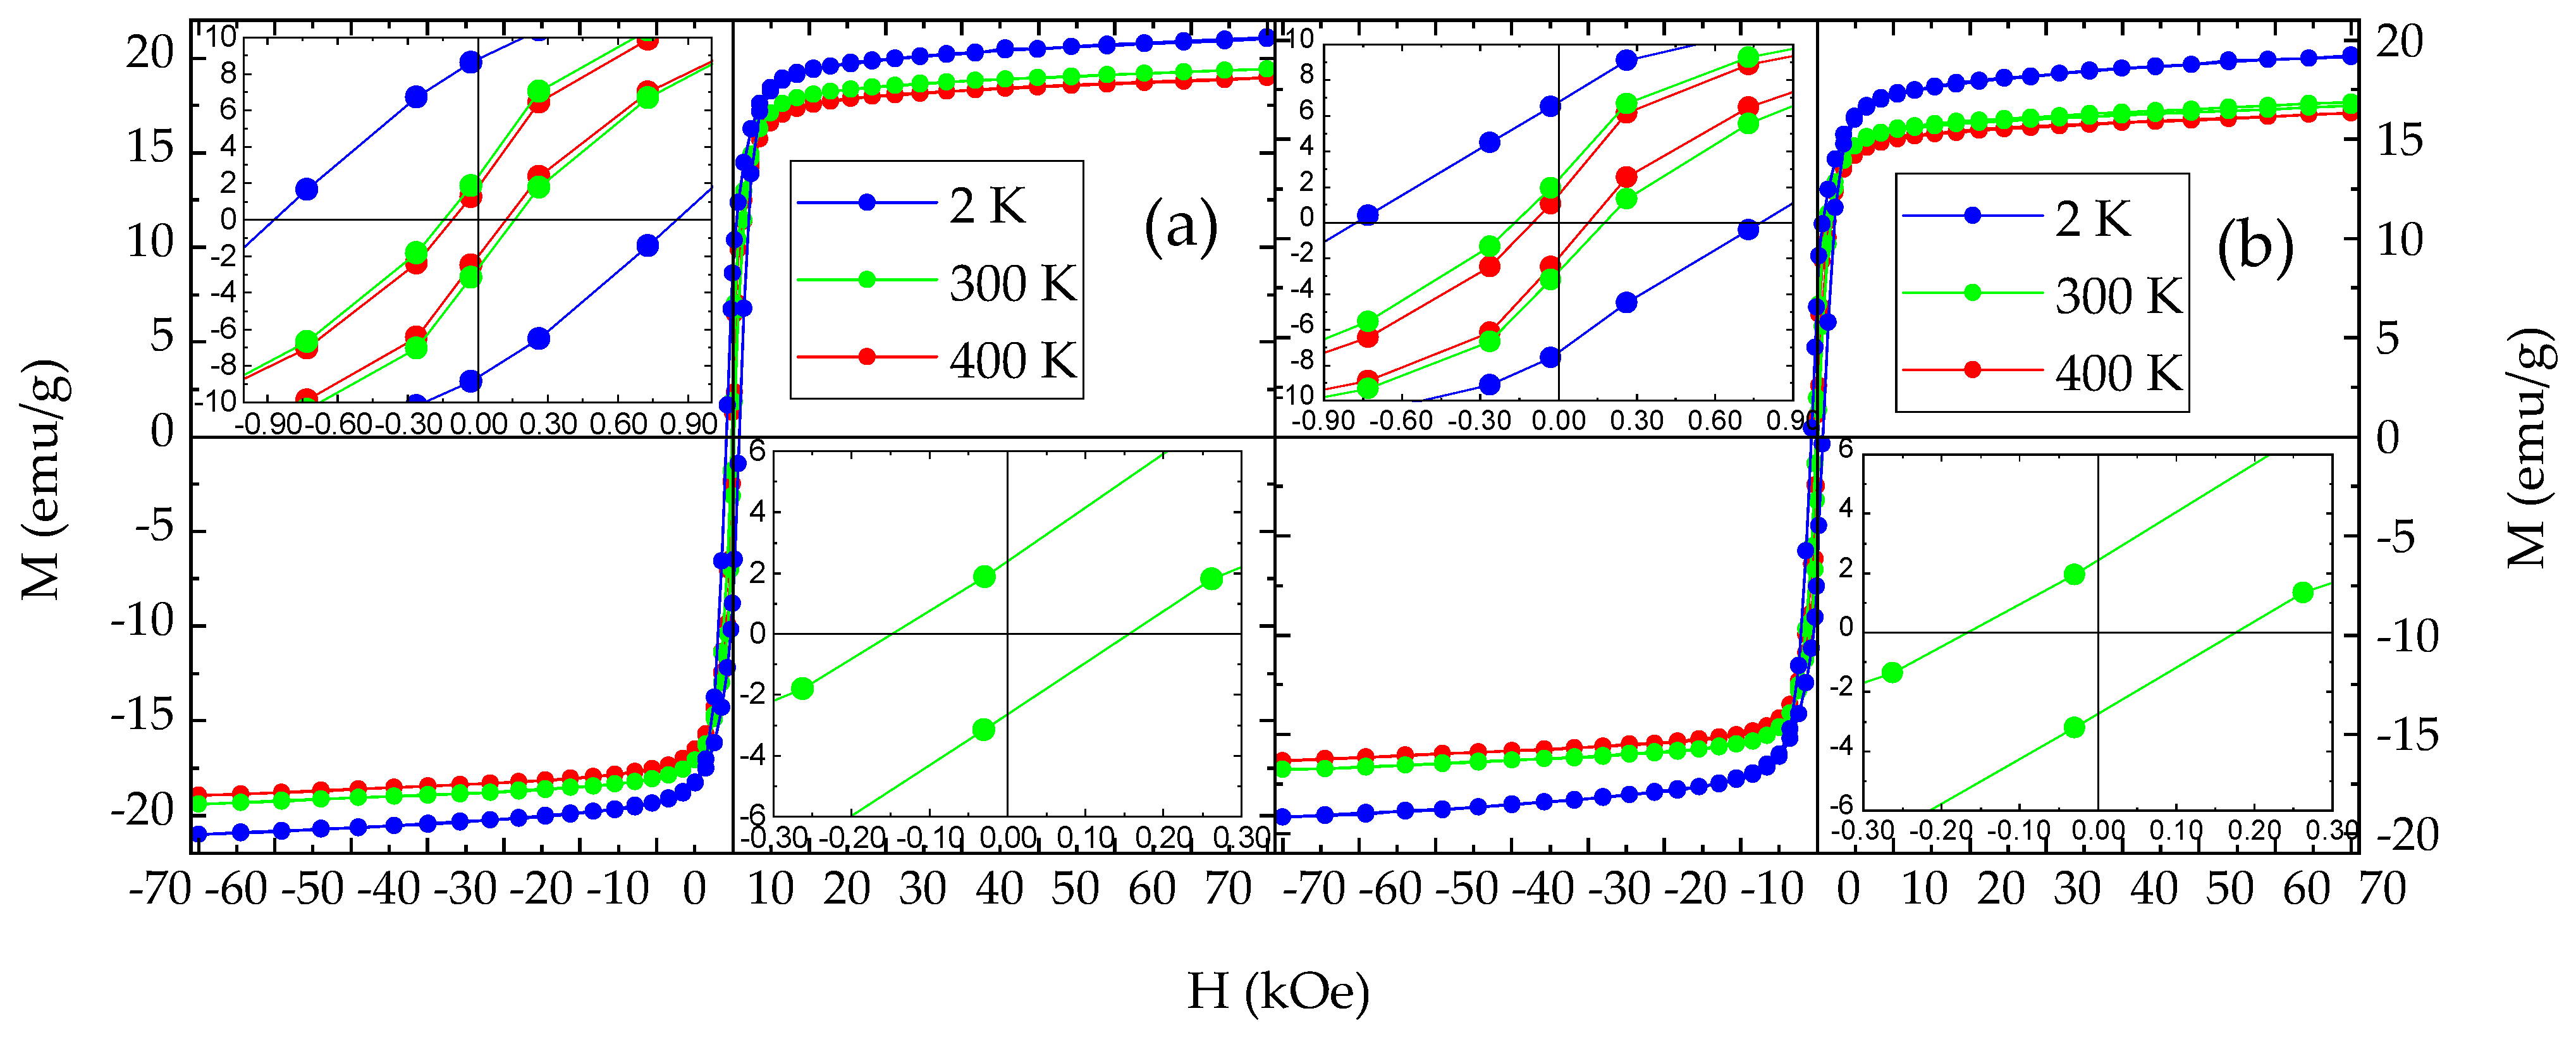
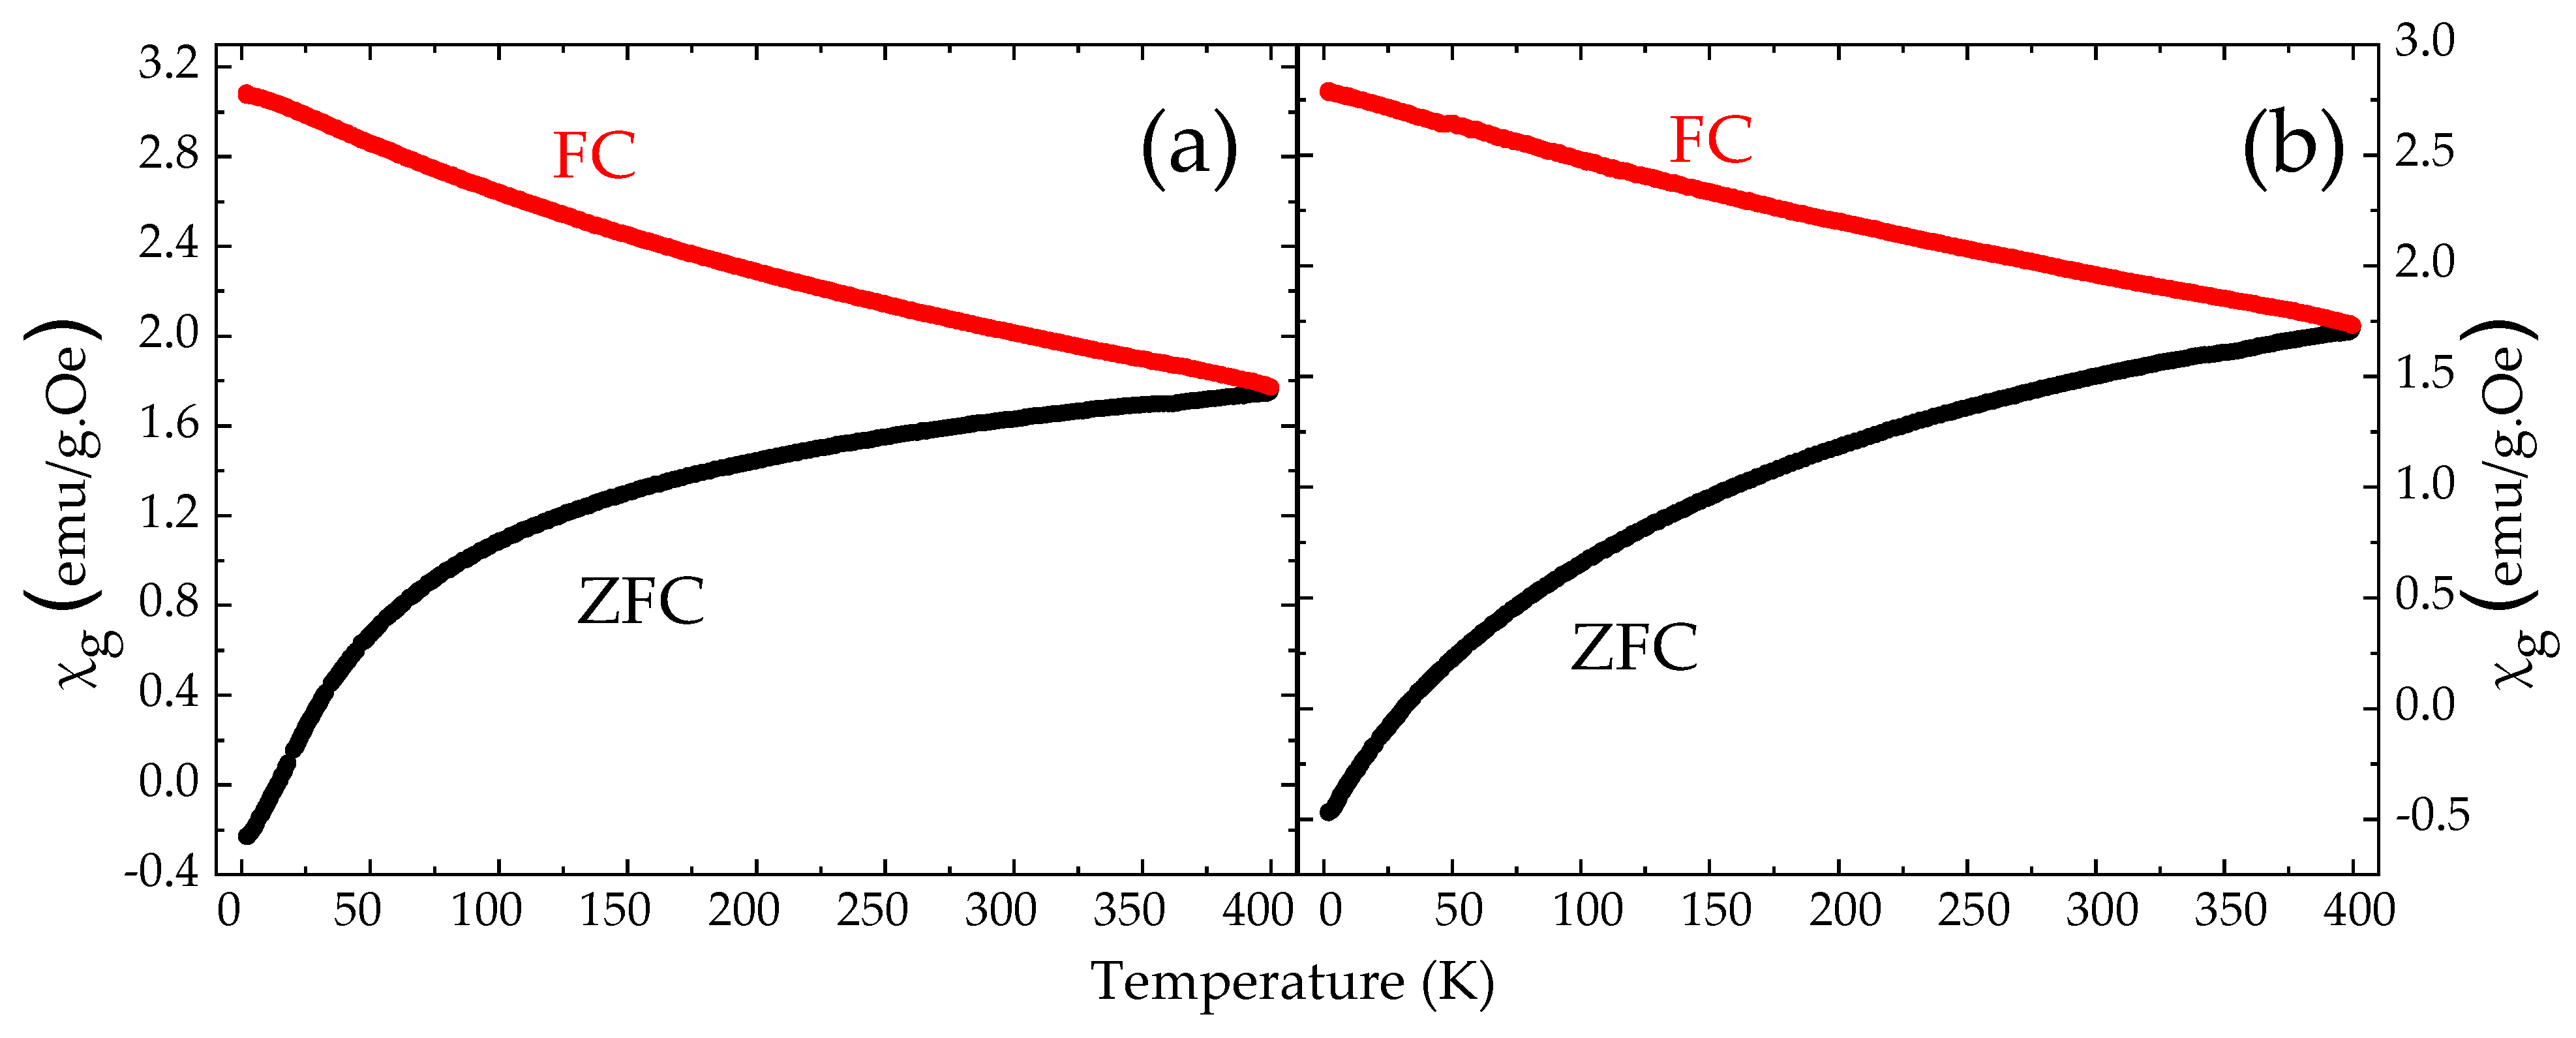
The magnetic properties of the NHD samples are delineated rigorously by their M vs. H under constant T and χg vs. T under constant H measurements. Such characteristic measurements taken for the NHD-700,30m and En-NHD-700,30m-SC non-57Fe-enriched and 57Fe-enriched samples appear in Figure 12 and Figure 13, respectively.
The M vs. H isothermal loops of the NHD-700,30m and En-NHD-700,30m-SC samples recorded at 400, 300, and 2 K reveal clear FM characteristics with hysteresis, revealing coercivities that range from about 100 to about 900 Oe depending on temperature (see Table 3). These characteristics are accompanied, however, by constant and non-vanishing dM/dH slopes at high H values at all temperatures. These features correspond to an assembly of Fe–Co NPs with FM order and relative harder magnetic characteristics compared to the nominal coercivities found for typical bulk Fe–Co alloys that reach only about 65 Oe at RT [9]. The non-vanishing dM/dH slopes at high H values denote a second non-FM contribution that can be attributed to the spinel-type ICO NPs found to be present in these samples, which, due to their very small particle size, experience very fast SPM relaxation at all temperatures. Moreover, the large increase in the coercive field values found at 400, 300, and 2 K indicates that the assembly of Fe–Co FM NPs should also experience SPM relaxation, which gradually ceases as T decreases, and, in particular—more substantially at 2 K—as the majority of the metallic NPs in the assembly becomes completely magnetically blocked [67].
The χg vs. T measurements of both samples recorded under an applied field of 99 Oe are shown in Figure 13 and reflect again the characteristics revealed by the M vs. H measurements, which are attributed to an assembly of Fe–Co FM NPs accompanied by SPM relaxation features. In both diagrams, the χg values of the ZFC branches monotonically increase as T increases, with no local maxima up to 400 K, while the FC branches are much smoother and continuously rise as T decreases. The coincidence of the two branches only at the highest measured temperature point of 400 K for both samples suggests a relatively broad size distribution for the magnetically ordered nanophases contained in these samples. The magnetic behavior of the system is clearly determined by the larger-in-size or/and more strongly magnetically interacting metallic Fe–Co NPs, which are magnetically blocked even at 400 K, as demonstrated from the existence of hysteresis in the M vs. H loops [60]. On the other hand, the smaller-in-size or/and weakly magnetically interacting metallic Fe–Co NPs, as well as the SPM ICO NPs, reveal their contribution to the M vs. H and χg vs. T measurements mainly through the lack of saturation for the magnetization at high H values recorded in all temperatures. Similar behaviors are obtained in the χg vs. T measurements of both annealed samples recorded under an applied field of 999 Oe (Figure S22, Supplementary Materials). There, however, the ZFC branches contain a minor local maximum around 200 K for both samples, suggesting a slight diversification in the SPM relaxation behavior for different assemblies of magnetic NPs originating from the differences in the stoichiometry, in the sense of the presence of both Fe–Co and ICO NPs, their size distribution, and interparticle interactions strength, which can be revealed only at higher H values in these measurements [56]. Moreover, the differences in the Fe–Co and ICO NP content in each sample could also justify the slightly higher maximum M and χg values observed for the NHD-700,30m sample relative to those found for the En-NHD-700,30m-SC sample. As the nominal M values are higher for the Fe–Co phase relative to those of the ICO phase, the higher amount of ICO NPs evident by Mössbauer spectroscopy measurements for the En-NHD-700,30m-SC sample is the cause of its reduced M and χg values relative to those found for the NHD-700,30m sample.

4. Discussion

Summarizing the results of all the experimental techniques employed in this study, we can comprehensively elucidate the development of the phases and their properties concerning the samples’ synthesis conditions. In this context, it is important to understand the significance of the AM-NHD and En-AM-NHD precursor samples in relation to the properties observed in the final annealed samples. These hybrid nanomaterials comprise fine SPM ICO NPs developed on the surfaces of the ND nanotemplates. The resulting structural configurations of these nanohybrids are closely connected to the intrinsic properties of the preconceived NDs, which are derived from detonation reactions. These properties activate specific operating mechanisms during the initial steps of the synthetic procedures followed in our samples. These mechanisms pertain to the attribution of favorable blending and interacting conditions emerging from the development of oxide/hydroxide functional groups present on the NDs’ surfaces in the moist mixture, which interact strongly with the corresponding metallic salts dissolved in deionized water during the first step of each sample’s synthesis [51]. The advancement of such strong interacting bonds is realized due to the ideal chemical conditions provided by the hygroscopic properties of the metallic salts and the hydrophilic nature of the NDs’ surficial functional groups. As a result, a substantial quantity of oxide/hydroxide functional groups is available to interact and form coupling bonds with the respective Fe3+ and Co2+ metallic ions, ensuring the metal ions have a firm attachment to the NDs’ surface. In this respect, it is possible to consider that two types of strong coupling bonds can be developed between the strongly interacting counterparts: (i) Fe-O-C and Co-O-C bonds and (ii) direct Fe-C and Co-C bonds [5,68,69].
The experimental data of this work evince the inability to develop any Fe–Co alloy phase during the first step of the samples’ synthesis. On the contrary, the development of only very fine ICO NPs that are well dispersed on the nanohybrid clusters can be observed. These characteristics, which conform consistently to the bonding mechanism, were also featured in our previous work based on this wet impregnation method [48]. Nonetheless, the employment of the second step in the synthesis leads to the development of the Fe–Co alloy nanophases. In this second step, the precursor is annealed in vacuum (evacuated quartz ampoules) at high temperatures. This procedure induces reduction conditions to the nominal Fe3+ and Co2+ ions of the ICO NPs in each sample system, forcing these ions to form the Fe–Co alloy nanophases. The spatial proximity between the very small ICO NPs favors their combination and growth into larger clusters during this second annealing step and leads to the development of larger in average size, relative-to-the-original ICO NP seeds, FM bcc Fe–Co cobalt-rich alloy NPs on the surfaces of the ND nanotemplates. However, those ICO NPs that are relatively isolated on the surfaces of the ND nanotemplates fail to develop into metallic Fe–Co alloy NPs and remain on these surfaces as excessive ICO residues.
Similar characteristics are found for the annealed samples originating from both precursor types, conventional and 57Fe-enriched; however, a slightly higher average cobalt concentration for Fe–Co NPs from TEM/EDS measurements is observed for the 57Fe-enriched case. These NPs also appear larger and have a wider dispersion from the equivalent Fe–Co NPs of the non-enriched annealed samples. We consider the idea that these differences can be attributed to the slight modification of the first wet chemistry step procedure followed for the two precursors. The addition of the small amount of metallic 57Fe in an HNO3 solution during the preparation of the 57Fe-enriched precursor may influence the way the resulting iron ions disperse in the moist mixture during the first step of the synthesis, by prompting aggregation of the Fe3+/57Fe3+ ion assemblies, which could possibly lead to their distinctive characteristics. The 57Fe MS of the two precursors indicate some difference regarding the presence of magnetically split contributions for the 57Fe-enriched precursor, which are not observed for the conventional precursor. This difference seems to be passed along partially to the final annealed samples and is reflected through the slight increase in the average Fe–Co NP size/dispersion and amount of ICO AA values in their MS, which include also Fe2+ SPM states.
In either case, the annealing procedure triggers the involvement of strong reducing agents in the second step of the synthesis. These are the sp2-coupled carbon atoms existing already as native species at the surfaces of the ND NPs and are further developed during thermal annealing [5,6,70,71]. These sp2-hybridized carbon atoms, along with the low O2 pressure due to the vacuum existing inside the ampules (10−3 Torr), provide the appropriate conditions for complete reduction of the Fe3+ and Co2+ ions in the ICO NPs to the Fe0 and Co0 atoms that form the corresponding Fe–Co alloy NPs. Moreover, the formation of the Fe–Co alloy NPs in our samples is accompanied by the development of graphitic-type layers surrounding these metallic NPs partially or in total, as evidenced by TEM observations. Surface graphitization effects of the ND sp3 cores can begin to occur at elevated temperatures in the vicinity of 700 °C, and can be further enhanced by the presence of surface structural defects and metallic elements like iron, cobalt, and nickel, which act as catalysts [5,72]. Metallic nanoparticles can act as catalysts for the graphitization process. Carbon atoms can be preferentially adsorbed onto the surface of the metal nanoparticles, where they undergo rearrangement into graphitic-type structures. Consequently, the metal Fe–Co alloy nanoparticles provide active sites and facilitate the alignment of carbon atoms into the resulting graphitic-type arrangement. It is possible to consider, thus, that the birth of the Fe–Co NPs from the reduction in the ICO NPs with the aid of the surface ND sp2 carbon atoms, could also serve as an action to promote them as initial metallic alloy nucleation centers for the formation of graphitic-type layered nanostructures, as evidenced by HRTEM observations in both systems.
Furthermore, as the graphitization mechanism occurring on NDs’ surfaces at elevated temperatures is favored by structural degradations that could result in low surface energy in the basal layer of the graphitic-type nanostructures, it could, in turn, also lead to low binding energies for the absorbed carbon atoms in the Fe–Co NPs, thus facilitating an easier lateral diffusion of these carbon atoms in the structure of the alloy. Hence, high temperatures not only promote the formation of metallic Fe–Co NPs through reduction in ICO NPs in our samples but also appear to facilitate a partial—at least, lateral—diffusion of carbon atoms across the shared surface and subsurface interfaces of the grown metallic NPs and the NDs in both synthesized systems. This non-extensive mechanism, involving the interstitial diffusion of carbon atoms into the Fe–Co lattice, may be the primary factor contributing to the development of the non-extensive (minor) contribution from the non-cubic tetragonally distorted martensitic-type Fe–Co phase, evidenced by our 57Fe Mössbauer spectroscopy measurements.
With respect to the magnetic properties, the lack of magnetization saturation for all samples’ M vs. H measurements, even at 2 K, could be attributed to the SPM behavior of the smaller-in-size metallic Fe–Co alloy NPs superimposed with the SPM behavior of the residual ICO NPs. The presence of this SPM ICO phase was demonstrated by 57Fe Mössbauer spectroscopy at all temperatures in all samples. On the other hand, 57Fe Mössbauer spectroscopy investigations also revealed the contribution from a tetragonally distorted martensitic-type Fe–Co phase encountered in all samples, but its presence is non-extensive. Consequently, no strongly correlated hard magnetic behavior can be confirmed through these M vs. H measurements. Therefore, the magnetic properties of the resulting annealed samples are predominantly influenced by the spatial isolation and well-dispersed placement of the Fe–Co NPs, which provide relative harder FM properties with respect to conventional bulk Fe–Co alloys, which exhibit HC values ranging between 40 and 70 Oe [8,9,10], but are not hard enough to surpass the range of ~200 Oe at RT and 1200 Oe at 2 K.
No significant difference could be deducted from the employment of the slow cooling procedure in the magnetic properties between either the 57Fe-enriched En-NHD-700,30m and En-NHD-700,30m-SC samples or the conventional NHD-700,30m and the 57Fe-enriched En-NHD-700,30m-SC samples, apart from the already mentioned increased presence of the ICO phase in the MS of the En-NHD-700,30m-SC sample relative to the conventional NHD-700,30m sample. Therefore, we have to conclude that there is no significant and straightforward interconnection between the slow cooling procedure and the crystal order of the Fe–Co metallic phase, at least regarding the chosen specific annealing conditions (700 °C, 30 min).

5. Conclusions

In this study, using a two-step preparation procedure combining wet chemical methods and annealing under controlled conditions, we successfully synthesized novel magnetic nanohybrid materials by growing FM bcc Fe–Co NPs on ND nanotemplates. These Fe–Co NPs, with average sizes ranging between 6 and 10 nm, were uniformly distributed on the surfaces of the NDs, exhibited a concentration rich in cobalt (approximately 65 at. % Co), and displayed FM behavior over a temperature range spanning from 400 K to 2 K, with coercivity values increasing from ~110 Oe at 400 K to ~850 Oe at 2 K. The formation of the predominant bcc FM Fe–Co phase was consistently accompanied by a secondary non-extensive, tetragonally distorted, martensitic-type Fe–Co phase, in addition to an inherent residual ICO precursor phase.
Notably, the development of this unique martensitic-type Fe–Co phase is attributed to the distinctive morphological properties of the ND growth matrices, which present surface formations and reconstructions of carbon sp2 nanostructures that were enhanced during the annealing procedure in the second step of the synthesis. sp2 graphitic-type layered nanostructures appeared to surround the metallic Fe–Co NPs and provided an ideal environment for interstitial carbon atom diffusion within the Fe–Co lattices at elevated temperatures during annealing, triggering this non-extensive martensitic-type Fe–Co structural configuration. Nonetheless, extending the formation of this martensitic-type phase towards achieving samples with harder ferromagnetic characteristics is an issue that needs to be addressed in future work, following the appropriate strategies that could, for example, target the diffusion of two atom types in interstitial sites, combining carbon and nitrogen from N-doped ND nanotemplate support.
These nanohybrid materials, which are presented for the first time in the literature, extend our group’s collection of innovative hybrid magnetic nanostructured materials [47,48,49] and hold substantial promise as materials for applications in biomedicine, biopharmaceutics, and other related technological fields.

Supplementary Materials

The following supporting information can be downloaded at https://www.mdpi.com/article/10.3390/magnetochemistry10050035/s1, Figures S1–S4: additional HRTEM and HAADF-STEM images, and EDS spectra from the NHD-700,30m and En-NHD-700,30m-SC samples. Tables S1 and S2: atomic ratios from EDS analysis on corresponding Figures. Figures S5–S9: Fitted 57Fe Mössbauer spectra of all samples recorded at RT and samples NHD-700,30m and of En-NHD-700,30m-SC recorded at 11 K. Tables S3–S7: 57Fe Mössbauer hyperfine parameters from the best fits of the corresponding spectra of all samples recorded at RT and samples NHD-700,30m and of En-NHD-700,30m-SC recorded at 11 K. Figures S10–S22: M vs. H and χg vs. T measurements of all samples with Hap = 99 Oe and Hap = 999 Oe. Table S8: Magnetic characteristics derived from the respective isothermal loops of all samples at 300 and 2 K.

Author Contributions

Conceptualization, A.P.D. and P.G.Z.; methodology, A.P.D., P.G.Z. and A.B.B.; software, A.P.D.; validation, A.P.D., P.G.Z., A.B.B. and G.P.D.; formal analysis, A.P.D., P.G.Z., P.C. and G.P.D.; investigation, P.G.Z., A.B.B., P.C., G.P.D. and A.P.D.; resources, P.G.Z., A.B.B., P.C., G.P.D., A.M. and A.P.D.; data curation, P.G.Z., A.B.B., P.C., G.P.D. and A.P.D.; writing—original draft preparation, P.G.Z.; writing—review and editing, P.G.Z., P.C., G.P.D. and A.P.D.; visualization, P.G.Z. and A.P.D.; supervision, A.P.D.; project administration, A.P.D.; funding acquisition, A.P.D. All authors have read and agreed to the published version of the manuscript.

Funding

This research received no external funding.

Data Availability Statement

The data presented in this study are available on request from the corresponding author.

Acknowledgments

P.G.Z. acknowledges the support of this research work by the Hellenic Foundation for Research and Innovation (HFRI) under the 3rd Call for HFRI PhD Fellowships (Fellowship Number: 06623). The use of the XRD and VSM Laboratory Network Units of the University of Ioannina is gratefully acknowledged.

Conflicts of Interest

The authors declare no conflict of interest.

References

  1. Maze, J.R.; Stanwix, P.L.; Hodges, J.S.; Hong, S.; Taylor, J.M.; Cappellaro, P.; Jiang, L.; Dutt, M.V.G.; Togan, E.; Zibrov, A.S.; et al. Nanoscale magnetic sensing with an individual electronic spin in diamond. Nature 2008, 455, 644–647. [Google Scholar] [CrossRef]
  2. Purtov, K.V.; Petunin, A.I.; Burov, A.E.; Puzyr, A.P.; Bondar, V.S. Nanodiamonds as Carriers for Address Delivery of Biologically Active Substances. Nanoscale Res. Lett. 2010, 5, 631–636. [Google Scholar] [CrossRef]
  3. Schrand, A.M.; Hens, S.A.C.; Shenderova, O.A. Nanodiamond Particles: Properties and Perspectives for Bioapplications. Crit. Rev. Solid State Mater. Sci. 2009, 34, 18–74. [Google Scholar] [CrossRef]
  4. Mochalin, V.N.; Shenderova, O.; Ho, D.; Gogotsi, Y. The properties and applications of nanodiamonds. Nat. Nanotechnol. 2012, 7, 11–23. [Google Scholar] [CrossRef]
  5. Duan, X.; Tian, W.; Zhang, H.; Sun, H.; Ao, Z.; Shao, Z.; Wang, S. sp2/sp3 Framework from Diamond Nanocrystals: A Key Bridge of Carbonaceous Structure to Carbocatalysis. ACS Catal. 2019, 9, 7494–7519. [Google Scholar] [CrossRef]
  6. Zeiger, M.; Jäckel, N.; Mochalin, V.N.; Presser, V. Review: Carbon onions for electrochemical energy storage. J. Mater. Chem. A 2016, 4, 3172–3196. [Google Scholar] [CrossRef]
  7. Coey, J.M.D. Magnetism and Magnetic Materials, 1st ed.; Cambridge University Press: Cambridge, UK, 2010. [Google Scholar] [CrossRef]
  8. Karipoth, P.; Thirumurugan, A.; Velaga, S.; Greneche, J.-M.; Joseyphus, R.J. Magnetic properties of FeCo alloy nanoparticles synthesized through instant chemical reduction. J. Appl. Phys. 2016, 120, 123906. [Google Scholar] [CrossRef]
  9. Jesús, F.S.-D.; Bolarín-Miró, A.M.; Escobedo, C.A.C.; Torres-Villaseñor, G.; Vera-Serna, P. Structural Analysis and Magnetic Properties of FeCo Alloys Obtained by Mechanical Alloying. J. Met. 2016, 2016, 8347063. [Google Scholar] [CrossRef]
  10. Chermahini, M.D.; Zandrahimi, M.; Shokrollahi, H.; Sharafi, S. The effect of milling time and composition on microstructural and magnetic properties of nanostructured Fe–Co alloys. J. Alloys Compd. 2009, 477, 45–50. [Google Scholar] [CrossRef]
  11. Chaubey, G.S.; Barcena, C.; Poudyal, N.; Rong, C.; Gao, J.; Sun, S.; Liu, J.P. Synthesis and Stabilization of FeCo Nanoparticles. J. Am. Chem. Soc. 2007, 129, 7214–7215. [Google Scholar] [CrossRef]
  12. Demayo, B.; Forester, D.W.; Spooner, S. Effects of Atomic Configurational Changes on Hyperfine Interactions in Concentrated Iron-Cobalt Alloys. J. Appl. Phys. 1970, 41, 1319–1320. [Google Scholar] [CrossRef]
  13. Lopes, A.M.S.; Barbosa, F.F.; Torres, M.A.M.; Pergher, S.B.C.; Braga, T.P. In situ synthesis of highly stable FeCo alloy encapsulated in carbon from ethanol. Mater. Today Commun. 2022, 32, 103900. [Google Scholar] [CrossRef]
  14. Lv, R.; Kang, F.; Gu, J.; Gui, X.; Wei, J.; Wang, K.; Wu, D. Carbon nanotubes filled with ferromagnetic alloy nanowires: Lightweight and wide-band microwave absorber. Appl. Phys. Lett. 2008, 93, 223105. [Google Scholar] [CrossRef]
  15. Ito, H.; Saito, M.; Miyamachi, T.; Komori, F.; Koganezawa, T.; Mizuguchi, M.; Kotsugi, M. Fabrication of 10-type FeCo ordered structure using a periodic Ni buffer layer. AIP Adv. 2019, 9, 045307. [Google Scholar] [CrossRef]
  16. Falub, C.V.; Pietambaram, S.V.; Yildirim, O.; Meduňa, M.; Caha, O.; Hida, R.; Zhao, X.; Ambrosini, J.; Rohrmann, H.; Hug, H.J. Enhanced permeability dielectric FeCo/Al2O3 multilayer thin films with tailored properties deposited by magnetron sputtering on silicon. AIP Adv. 2019, 9, 035243. [Google Scholar] [CrossRef]
  17. Jakobsson, A.; Şaşıoğlu, E.; Mavropoulos, P.; Ležaić, M.; Sanyal, B.; Bihlmayer, G.; Blügel, S. Tuning the Curie temperature of FeCo compounds by tetragonal distortion. Appl. Phys. Lett. 2013, 103, 102404. [Google Scholar] [CrossRef]
  18. Yu, R.H.; Basu, S.; Zhang, Y.; Xiao, J.Q. Magnetic domains and coercivity in FeCo soft magnetic alloys. J. Appl. Phys. 1999, 85, 6034–6036. [Google Scholar] [CrossRef]
  19. Song, G.; Kenney, M.; Chen, Y.-S.; Zheng, X.; Deng, Y.; Chen, Z.; Wang, S.X.; Gambhir, S.S.; Dai, H.; Rao, J. Carbon-coated FeCo nanoparticles as sensitive magnetic-particle-imaging tracers with photothermal and magnetothermal properties. Nat. Biomed. Eng. 2020, 4, 325–334. [Google Scholar] [CrossRef] [PubMed]
  20. Seo, W.S.; Lee, J.H.; Sun, X.; Suzuki, Y.; Mann, D.; Liu, Z.; Terashima, M.; Yang, P.C.; McConnell, M.V.; Nishimura, D.G.; et al. FeCo/graphitic-shell nanocrystals as advanced magnetic-resonance-imaging and near-infrared agents. Nat. Mater. 2006, 5, 971–976. [Google Scholar] [CrossRef]
  21. Hütten, A.; Sudfeld, D.; Ennen, I.; Reiss, G.; Hachmann, W.; Heinzmann, U.; Wojczykowski, K.; Jutzi, P.; Saikaly, W.; Thomas, G. New magnetic nanoparticles for biotechnology. J. Biotechnol. 2004, 112, 47–63. [Google Scholar] [CrossRef]
  22. Patelli, N.; Cugini, F.; Wang, D.; Sanna, S.; Solzi, M.; Hahn, H.; Pasquini, L. Structure and magnetic properties of Fe-Co alloy nanoparticles synthesized by pulsed-laser inert gas condensation. J. Alloys Compd. 2022, 890, 161863. [Google Scholar] [CrossRef]
  23. da Silva, R.; Carrico, A.; Filho, E.S.; da Silva, F.F.; Bufaical, L.; Soares, J.; da Costa, J.; de Araújo, J.; Morales, M. Influence of the gas atmosphere on the obtention of cobalt and iron based nanocomposites and core/shell nanoparticles by calcination in the presence of chitosan. J. Solid State Chem. 2022, 312, 123225. [Google Scholar] [CrossRef]
  24. Jang, M.-S.; Chang, M.S.; Kwon, Y.-T.; Yang, S.; Gwak, J.; Kwon, S.J.; Lee, J.; Song, K.; Park, C.R.; Lee, S.B.; et al. High-throughput thermal plasma synthesis of FexCo1−x nano-chained particles with unusually high permeability and their electromagnetic wave absorption properties at high frequency (1–26 GHz). Nanoscale 2021, 13, 12004–12016. [Google Scholar] [CrossRef]
  25. Ding, J.; Cheng, L.; Zhao, W. Self-Assembly Magnetic FeCo Nanostructures on Oxide Graphene for Enhanced Microwave Absorption. J. Electron. Mater. 2022, 51, 2856–2866. [Google Scholar] [CrossRef]
  26. Shokuhfar, A.; Afghahi, S.S.S. Size Controlled Synthesis of FeCo Alloy Nanoparticles and Study of the Particle Size and Distribution Effects on Magnetic Properties. Adv. Mater. Sci. Eng. 2014, 2014, 295390. [Google Scholar] [CrossRef]
  27. Valiev, E.; Gimaev, R.; Zverev, V.; Kamilov, K.; Pyatakov, A.; Kovalev, B.; Tishin, A. Application of the exchange-striction model for the calculation of the FeRh alloys magnetic properties. Intermetallics 2019, 108, 81–86. [Google Scholar] [CrossRef]
  28. Burkert, T.; Nordström, L.; Eriksson, O.; Heinonen, O. Giant Magnetic Anisotropy in Tetragonal FeCo Alloys. Phys. Rev. Lett. 2004, 93, 027203. [Google Scholar] [CrossRef] [PubMed]
  29. Kota, Y.; Sakuma, A. Degree of Order Dependence on Magnetocrystalline Anisotropy in Body-Centered Tetragonal FeCo Alloys. Appl. Phys. Express 2012, 5, 113002. [Google Scholar] [CrossRef]
  30. Odkhuu, D.; Hong, S.C. First-Principles Prediction of Possible Rare-Earth Free Permanent Magnet of Tetragonal FeCo with Enhanced Magnetic Anisotropy and Energy Product through Interstitial Nitrogen. Phys. Rev. Appl. 2019, 11, 054085. [Google Scholar] [CrossRef]
  31. Nishizawa, T.; Ishida, K. The Co−Fe (Cobalt−Iron) system. Bull. Alloys Phase Diagrams 1984, 5, 250–259. [Google Scholar] [CrossRef]
  32. Hasegawa, T.; Seki, Y. TEM-based crystal structure analysis of body-centered tetragonal structure in non-epitaxial FeCo film with added V and N. Mater. Lett. 2022, 313, 131734. [Google Scholar] [CrossRef]
  33. Hasegawa, T.; Niibori, T.; Takemasa, Y.; Oikawa, M. Stabilisation of tetragonal FeCo structure with high magnetic anisotropy by the addition of V and N elements. Sci. Rep. 2019, 9, 5248. [Google Scholar] [CrossRef]
  34. Warnicke, P.; Andersson, G.; Björck, M.; Ferré, J.; Nordblad, P. Magnetic anisotropy of tetragonal FeCo/Pt(001) superlattices. J. Phys. Condens. Matter 2007, 19, 226218. [Google Scholar] [CrossRef]
  35. Zhang, L.; Liu, L.; Ishio, S. Investigation of magnetic anisotropy and magnetization process of tetragonal distorted FeCo multilayer films. Mater. Lett. 2015, 160, 238–241. [Google Scholar] [CrossRef]
  36. Gong, M.; Kirkeminde, A.; Wuttig, M.; Ren, S. Phase Transformation-Induced Tetragonal FeCo Nanostructures. Nano Lett. 2014, 14, 6493–6498. [Google Scholar] [CrossRef] [PubMed]
  37. Hume-Rothery, W. The Structures of Alloys of Iron; Elsevier: Amsterdam, The Netherlands, 1966. [Google Scholar]
  38. Pepperhoff, W.; Acet, M. Constitution and Magnetism of Iron and its Alloys. In Engineering Materials; Springer: Berlin/Heidelberg, Germany, 2001. [Google Scholar]
  39. Kurdjumov, G.; Khachaturyan, A. Nature of axial ratio anomalies of the martensite lattice and mechanism of diffusionless γ → α transformation. Acta Met. 1975, 23, 1077–1088. [Google Scholar] [CrossRef]
  40. Gavriljuk, V.G.; Firstov, S.O.; Sirosh, V.A.; Tyshchenko, A.I.; Mogilny, G.S. Carbon Distribution in Low-Temperature Isothermal Iron-Based Martensite and Its Tetragonality. Met. I Noveishie Tekhnologii 2016, 38, 455–475. [Google Scholar] [CrossRef]
  41. Gavriljuk, V.; Tarasenko, A.; Tyshchenko, A. Low temperature ageing of the freshly formed Fe-C and Fe-N martensites. Scr. Mater. 2000, 43, 233–238. [Google Scholar] [CrossRef]
  42. Gao, Y.; Wang, Y. Hidden pathway during fcc to bcc/bct transformations: Crystallographic origin of slip martensite in steels. Phys. Rev. Mater. 2018, 2, 093611. [Google Scholar] [CrossRef]
  43. Choo, W.; Kaplow, R. Mössbauer measurements on the aging of iron-carbon martensite. Acta Met. 1973, 21, 725–732. [Google Scholar] [CrossRef]
  44. Kozhitov, L.V.; Muratov, D.G.; Kostishin, V.G.; Suslyaev, V.I.; Korovin, E.Y.; Popkova, A.V. FeCo/C nanocomposites: Synthesis, magnetic and electromagnetic properties. Russ. J. Inorg. Chem. 2017, 62, 1499–1507. [Google Scholar] [CrossRef]
  45. Ghunaim, R.; Scholz, M.; Damm, C.; Rellinghaus, B.; Klingeler, R.; Büchner, B.; Mertig, M.; Hampel, S. Single-crystalline FeCo nanoparticle-filled carbon nanotubes: Synthesis, structural characterization and magnetic properties. Beilstein J. Nanotechnol. 2018, 9, 1024–1034. [Google Scholar] [CrossRef]
  46. Gielen, P.; Kaplow, R. Mossbauer effect in iron-carbon and iron-nitrogen alloys. Acta Met. 1967, 15, 49–63. [Google Scholar] [CrossRef]
  47. Douvalis, A.P.; Bourlinos, A.B.; Tucek, J.; Čépe, K.; Bakas, T.; Zboril, R. Development of novel FePt/nanodiamond hybrid nanostructures: L10 phase size-growth suppression and magnetic properties. J. Nanoparticle Res. 2016, 18, 115. [Google Scholar] [CrossRef]
  48. Ziogas, P.; Bourlinos, A.B.; Tucek, J.; Malina, O.; Douvalis, A.P. Novel Magnetic Nanohybrids: From Iron Oxide to Iron Carbide Nanoparticles Grown on Nanodiamonds. Magnetochemistry 2020, 6, 73. [Google Scholar] [CrossRef]
  49. Ziogas, P.; Bourlinos, A.B.; Chatzopoulou, P.; Dimitrakopulos, G.P.; Kehagias, T.; Markou, A.; Douvalis, A.P. Intriguing Prospects of a Novel Magnetic Nanohybrid Material: Ferromagnetic FeRh Nanoparticles Grown on Nanodiamonds. Metals 2022, 12, 1355. [Google Scholar] [CrossRef]
  50. Han, Z.; Rao, J.S.; Gangwar, L.; Namsrai, B.-E.; Pasek-Allen, J.L.; Etheridge, M.L.; Wolf, S.M.; Pruett, T.L.; Bischof, J.C.; Finger, E.B. Vitrification and nanowarming enable long-term organ cryopreservation and life-sustaining kidney transplantation in a rat model. Nat. Commun. 2023, 14, 3407. [Google Scholar] [CrossRef] [PubMed]
  51. Bourlinos, A.B.; Zbořil, R.; Kubala, M.; Stathi, P.; Deligiannakis, Y.; Karakassides, M.A.; Steriotis, T.A.; Stubos, A.K. Fabrication of fluorescent nanodiamond@C core–shell hybrids via mild carbonization of sodium cholate–nanodiamond complexes. J. Mater. Sci. 2011, 46, 7912–7916. [Google Scholar] [CrossRef]
  52. Bourlinos, A.; Simopoulos, A.; Petridis, D.; Okumura, H.; Hadjipanayis, G. Silica-Maghemite Nanocomposites. Adv. Mater. 2001, 13, 289–291. [Google Scholar] [CrossRef]
  53. Douvalis, A.P.; Polymeros, A.; Bakas, T. IMSG09: A57Fe-119Sn Mössbauer spectra computer fitting program with novel interactive user interface. J. Phys. Conf. Ser. 2010, 217, 012014. [Google Scholar] [CrossRef]
  54. Cornell, R.M.; Schwertmann, U. The Iron Oxides: Structure, Properties, Reactions, Occurences and Uses, 1st ed.; Wiley: Hoboken, NJ, USA, 2003. [Google Scholar] [CrossRef]
  55. Cullity, B.D.; Stock, S.R. Elements of X-ray Diffraction, 3rd. ed.; Prentice Hall: Upper Saddle River, NJ, USA, 2001. [Google Scholar]
  56. Lyubutin, I.S.; Gervits, E.N.; Starchikov, S.S.; Lin, C.-R.; Tseng, Y.-T.; Shih, K.-Y.; Wang, C.-C.; Chen, I.-H.; Ogarkova, Y.L.; Korotkov, N.Y. Magnetic and Mössbauer spectroscopy studies of hollow microcapsules made of silica-coated CoFe2O4 nanoparticles. Smart Mater. Struct. 2016, 25, 015022. [Google Scholar] [CrossRef]
  57. Hahsler, M.; Landers, J.; Nowack, T.; Salamon, S.; Zimmermann, M.; HeiBler, S.; Wende, H.; Behrens, S. Magnetic Properties and Mossbauer Spectroscopy of Fe3O4/CoFe2O4 Nanorods. Inorg. Chem. 2020, 59, 3677–3685. [Google Scholar] [CrossRef]
  58. Greenwood, N.N.; Gibb, T.C. Mössbauer Spectroscopy; Springer: Dordrecht, The Netherlands, 1971. [Google Scholar]
  59. Gütlich, P.; Bill, E.; Trautwein, A.X. Mössbauer Spectroscopy and Transition Metal Chemistry; Springer: Berlin/Heidelberg, Germany, 2011. [Google Scholar]
  60. Mørup, S.; Hansen, M. Superparamagnetic Particles. In Handbook of Magnetism and Advanced Magnetic Materials; Wiley: Hoboken, NJ, USA, 2007. [Google Scholar] [CrossRef]
  61. Mørup, S.; Hansen, M.F.; Frandsen, C. Magnetic interactions between nanoparticles. Beilstein J. Nanotechnol. 2010, 1, 182–190. [Google Scholar] [CrossRef]
  62. Kronmüller, H.; Parkin, S. (Eds.) Handbook of Magnetism and Advanced Magnetic Materials, 1st ed.; Wiley: Hoboken, NJ, USA, 2007. [Google Scholar]
  63. Hamdeh, H.H.; Fultz, B.; Pearson, D.H. Mössbauer spectrometry study of the hyperfine fields and electronic structure of Fe-Co alloys. Phys. Rev. B 1989, 39, 11233–11240. [Google Scholar] [CrossRef]
  64. Serikov, V.V.; Kleinerman, N.M.; Golovnya, O.A. NMR and Mössbauer study of peculiarities of the structure formation in Fe–Co alloys. Phys. Met. Met. 2017, 118, 1040–1047. [Google Scholar] [CrossRef]
  65. Moumeni, H.; Alleg, S.; Djebbari, C.; Bentayeb, F.Z.; Grenèche, J.M. Synthesis and characterisation of nanostructured FeCo alloys. J. Mater. Sci. 2004, 39, 5441–5443. [Google Scholar] [CrossRef]
  66. Montano, P.A.; Seehra, M.S. Mössbauer study of the order-disorder andα−γtransitions in FeCo. Phys. Rev. B 1977, 15, 2437–2441. [Google Scholar] [CrossRef]
  67. Fiorani, D. (Ed.) Surface effects in magnetic nanoparticles. In Nanostructure Science and Technology; Springer: New York, NY, USA, 2005. [Google Scholar]
  68. Tuček, J.; Kemp, K.C.; Kim, K.S.; Zbořil, R. Iron-Oxide-Supported Nanocarbon in Lithium-Ion Batteries, Medical, Catalytic, and Environmental Applications. ACS Nano 2014, 8, 7571–7612. [Google Scholar] [CrossRef]
  69. Fan, X.; Gao, H.; Kou, X.; Zhang, B.; Wang, S. Synthesis of FeCo-reduced graphene oxide composite and its magnetic and adsorption properties. Mater. Res. Bull. 2015, 65, 320–324. [Google Scholar] [CrossRef]
  70. Shenderova, O.A.; McGuire, G.E. Science and engineering of nanodiamond particle surfaces for biological applications (Review). Biointerphases 2015, 10, 030802. [Google Scholar] [CrossRef]
  71. Barnard, A.S. Stability of Diamond at the Nanoscale. In Ultananocrystalline Diamond; Elsevier: Amsterdam, The Netherlands, 2012; pp. 3–52. [Google Scholar] [CrossRef]
  72. Petit, T.; Arnault, J.-C.; Girard, H.A.; Sennour, M.; Bergonzo, P. Early stages of surface graphitization on nanodiamond probed by x-ray photoelectron spectroscopy. Phys. Rev. B 2011, 84, 233407. [Google Scholar] [CrossRef]
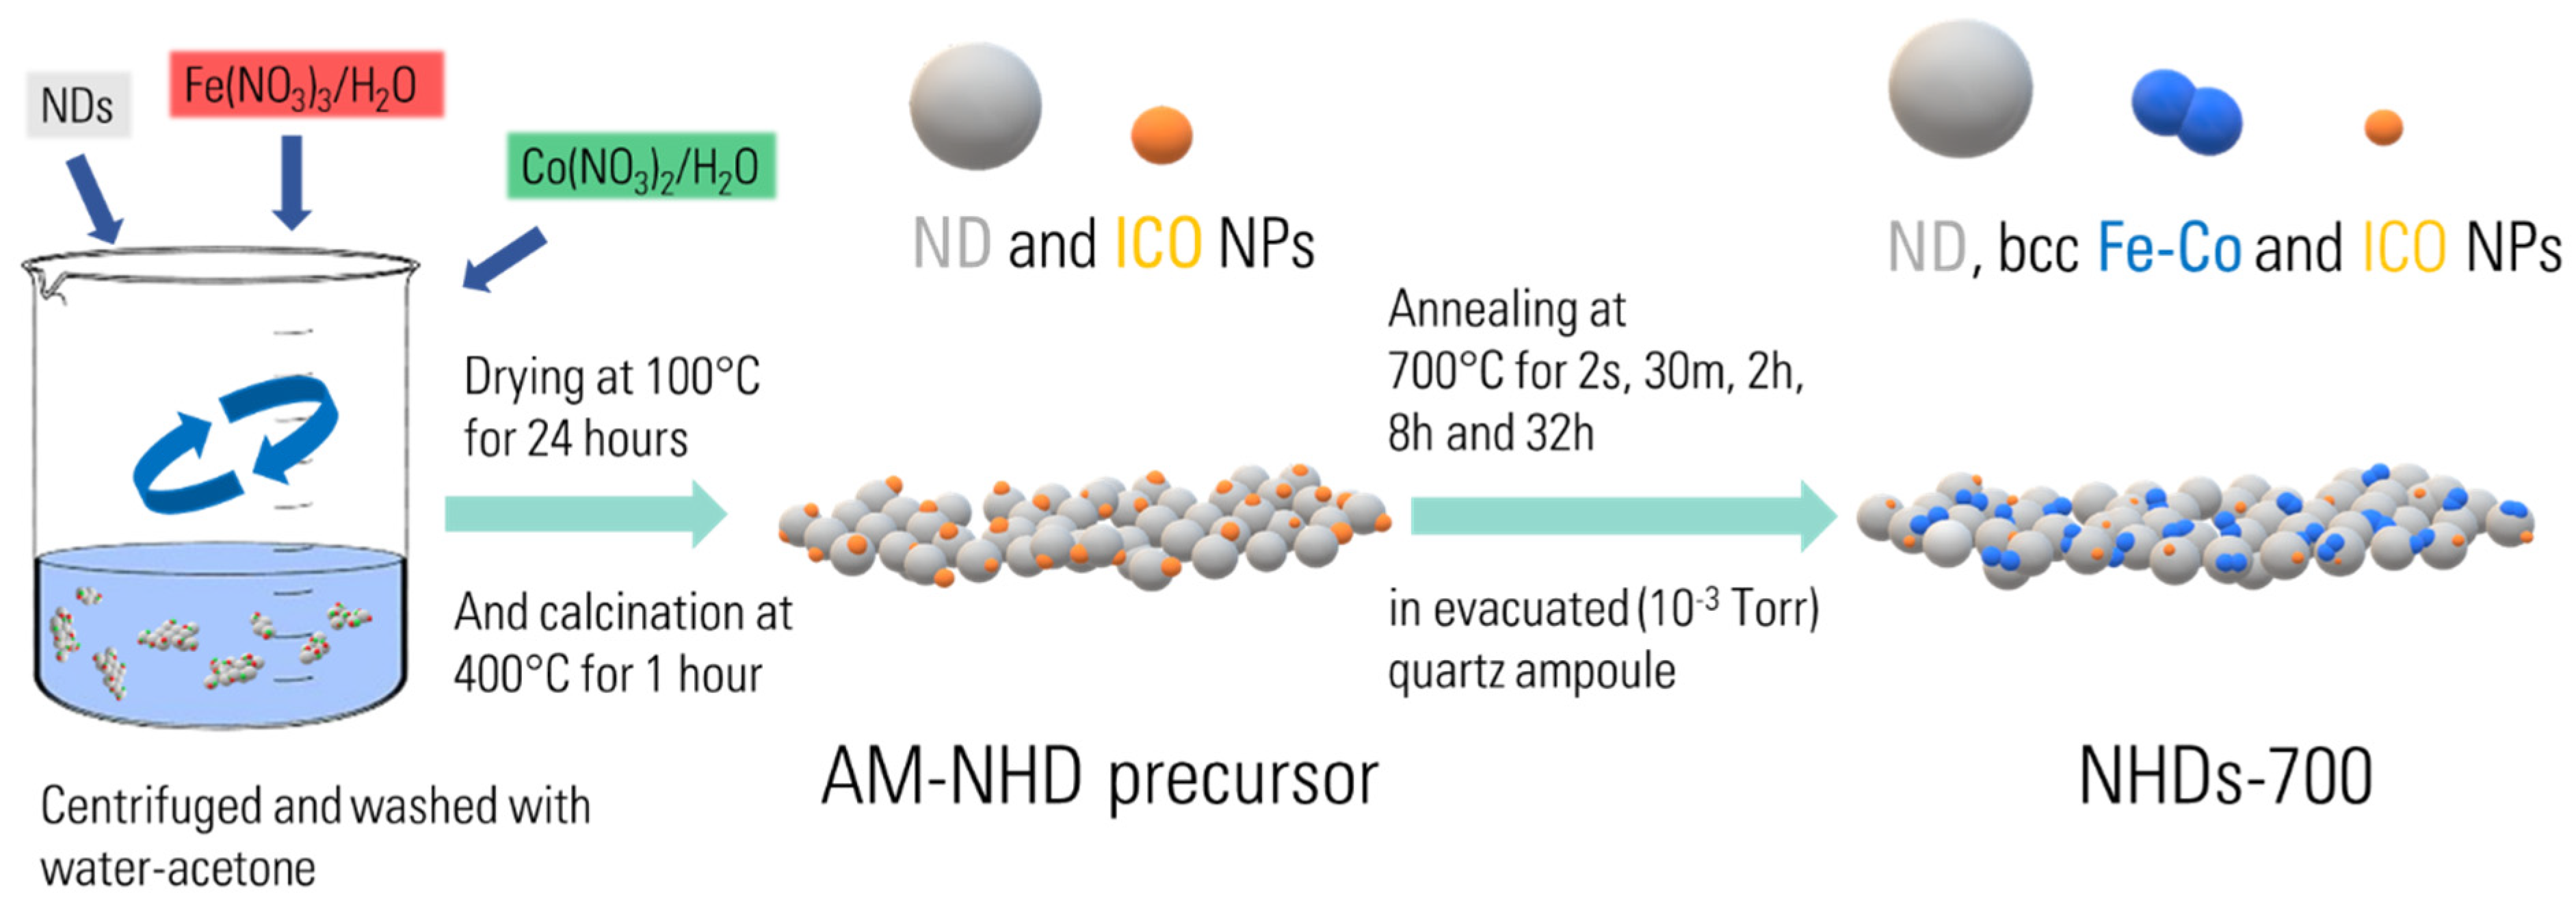
Scheme 1. Graphic representation of the synthesis procedure of as-made hybrid and annealed nanohybrid samples.
Magnetochemistry 10 00035 sch001
Figure 1. XRD patterns of a typical as-made nanohybrid precursor and the corresponding annealed samples at 700 °C (a), 650 °C (b), and 600 °C (c). The crystalline phases in the samples are depicted by respective different symbols denoting the angular positions of their main diffraction peaks. The average crystalline domain size <D> of the nanodiamonds and iron–cobalt oxide phases for the as-made nanohybrid precursor sample and that of the Fe–Co phase for all other samples are denoted in each pattern.
Magnetochemistry 10 00035 g001
Figure 2. XRD patterns of the 57Fe-enriched as-made nanohybrid precursor and the corresponding annealed samples at 700 °C. The crystalline phases in the samples are depicted by the respective different symbols denoting the angular positions of their main diffraction peaks. The average crystalline domain size <D> of the nanodiamonds and iron–cobalt oxide phases for the 57Fe-enriched as-made nanohybrid precursor sample and that of the Fe–Co phase for all other samples are denoted in each pattern.
Magnetochemistry 10 00035 g002
Figure 3. Bright-field TEM images of the NHD-700,30m sample (ac) at different magnifications.
Magnetochemistry 10 00035 g003
Figure 4. HAADF STEM images from different nanohybrid clusters of the NHD-700,30m sample (ac). Distribution of the Fe–Co metallic nanoparticles sizes (d). HAADF STEM image of a particular hybrid Fe–Co nanoparticles/nanodiamonds cluster (e) and the corresponding elemental distribution of Fe (f) and Co (g).
Magnetochemistry 10 00035 g004
Figure 5. HRTEM images of two different Fe–Co metallic nanoparticles (a,b) grown on the NHD-700,30m sample where the {110} and {200} planes are resolved in (a) and only the {110} planes are resolved in (b). The planes are highlighted in the blown-up white rectangles along with their d-spacings. Graphitic-type layered structures wrapped around the metallic nanoparticles are indicated by the yellow arrows.
Magnetochemistry 10 00035 g005
Figure 6. TEM images of the En-NHD-700,30m-SC sample (ac) at different magnifications.
Magnetochemistry 10 00035 g006
Figure 7. HAADF Z-contrast images in STEM mode from different nanohybrid clusters of the En-NHD-700,30m-SC sample (ac). Distribution of the Fe–Co metallic nanoparticles sizes (d). HAADF STEM image of a particular hybrid Fe–Co nanoparticle/nanodiamonds cluster (e) and the corresponding elemental distribution-mapping of Fe (f) and Co (g).
Magnetochemistry 10 00035 g007
Figure 8. (a) HRTEM image of a typical Fe–Co nanoparticle/nanodiamonds cluster in the En-NHD-700,30m-SC sample. The {111} planes of a nanodiamond nanoparticle and the {110} planes of a bcc Fe–Co metallic nanoparticle (indicated with the red arrow) are provided. (b) HRTEM image from another metallic Fe–Co nanoparticle projected along [100]. (c) HRTEM image showing a Fe–Co nanoparticle surrounded by a graphitic-type few-layer structure, with the {110} planes of the metallic bcc and the {0002} planes of the graphitic-type structures indicated by white and yellow fonts.
Magnetochemistry 10 00035 g008
Figure 9. 57Fe Mössbauer spectra of the conventional as-made nanohybrid precursor (a) and the 57Fe-enriched as-made nanohybrid precursor (b) samples collected at room temperature. The black dots correspond to the experimental data and the colored lines to the components used to fit these spectra listed in Table 1.
Magnetochemistry 10 00035 g009
Figure 10. Room temperature raw 57Fe Mössbauer spectra of the samples synthesized using the conventional as-made nanohybrid precursor annealed at 600 °C (a), 650 °C (b), and 700 °C (c) and the 57Fe-enriched as-made nanohybrid precursor annealed at 700 °C (d). The annealing duration at the specified temperatures is included in each spectrum. The colored arrows denote the positions of the main spectral contributions corresponding to the iron-bearing phases, as discussed in the text.
Magnetochemistry 10 00035 g010
Figure 11. Fitted 57Fe Mössbauer spectra of the NHD-700,30m (a) and of the En-NHD-700,30m-SC (b) samples collected at room temperature. The black dots correspond to the experimental data and the colored lines and filled areas to the components used to fit these spectra listed in Table 2.
Magnetochemistry 10 00035 g011
Figure 12. Magnetization vs. applied magnetic field isothermal loops of the NHD-700,30m (a) and En-NHD-700,30m-SC (b) samples measured at different temperatures indicated by different colors. The insets in each set of measurements show the details of the loops’ characteristics around zero applied magnetic field for all temperatures (upper left) and with even more detail for the 300 K loop (lower right).
Magnetochemistry 10 00035 g012
Figure 13. Magnetic susceptibility vs. temperature measurements of the non-enriched NHD-700,30m (a) and 57Fe-enriched En-NHD-700,30m-SC (b) samples under an applied field of 99 Oe.
Magnetochemistry 10 00035 g013
Table 1. Mössbauer hyperfine parameters as resulting from the best fits of the corresponding spectra of the samples shown on Figure 9. IS the isomer shift (given relative to α-Fe at 300 K), Γ/2 is the half-line width, QS is the quadrupole splitting, 2ε is the quadrupole shift, BhfC is the central value of the hyperfine magnetic field, ΔBhf is the total spreading (Gaussian-type) of the Bhf values around the central BhfC value, and AA is the relative spectral absorption area of each component used to fit the spectra. Typical errors are ±0.02 mm/s for IS, Γ/2, 2ε and QS, ±3 kOe for BhfC and ±3% for AA.
SampleComponentIS (mm/s)Γ/2 (mm/s)QS or 2ε (mm/s)BhfC (kOe)ΔBhf (kOe)Area (%)Color
AM-NHD precursorSPM Fe3+ (1)0.330.200.650057Dark Cayn
SPM Fe3+ (2)0.350.251.170043Purple
En-AM-NHD precursorSPM Fe3+ (1)0.360.210.670051Dark Cayn
SPM Fe3+ (2)0.370.291.170031Purple
MCOL Fe3+ (1)0.510.150.143229512Red
MCOL Fe3+ (2)0.390.150.07468226Dark Yellow
Table 2. Mössbauer hyperfine parameters as resulting from the best fits of the corresponding spectra of the samples shown on Figure 11. IS the isomer shift (given relative to α-Fe at 300 K), Γ/2 is the half line-width, QS is the quadrupole splitting, 2ε is the quadrupole shift, BhfC is the central value of the hyperfine magnetic field, ΔBhf is the total spreading (Gaussian-type) of the Bhf values around the central BhfC value, and AA is the relative spectral absorption area of each component used to fit the spectra. Typical errors are ±0.02 mm/s for IS, Γ/2, 2ε and QS, ±3 kOe for BhfC and ±3% for AA.
SampleComponentIS (mm/s)Γ/2 (mm/s)QS or 2ε (mm/s)BhfC (kOe)ΔBhf (kOe)Area (%)Color
Non-enrichedNHDs-700,30mFe35Co650.020.140.02340852Maroon
Martensitic Fe-Co (1)0.090.140.0136402Green
Martensitic Fe-Co (2)0.040.140.0135402Magenta
Martensitic Fe-Co (3)0.000.140.0431506Cyan
Martensitic Fe-Co (4)0.130.14−0.0829605Blue
Martensitic Fe-Co (5)0.080.14−0.15259135Orange
MCOL Fe3+0.280.140.001556514Pink
SPM Fe3+ (1)0.300.220.58007Dark Cyan
SPM Fe3+ (2)0.340.281.58007Purple
Enriched-NHDs-700,30m withSCFe33Co670.020.140.02337741Maroon
Martensitic Fe-Co (1)0.090.140.0136502Green
Martensitic Fe-Co (2)0.040.140.0134603Magenta
Martensitic Fe-Co (3)0.050.140.0431807Cyan
Martensitic Fe-Co (4)0.120.14−0.0929604Blue
Martensitic Fe-Co (5)0.080.14−0.1526353Orange
MCOL Fe3+0.430.140.00160602Pink
SPM Fe3+ (1)0.350.210.720014Dark Cyan
SPM Fe3+ (2)0.410.381.370019Purple
SPM Fe2+0.970.322.46005Grey
Table 3. Magnetic characteristics derived from the isothermal loops of Figure 12.
SampleT (K)Mmax+
(emu/g)
Mmax− (emu/g)MR+ (emu/g)MR− (emu/g)HC+ (Oe)HC− (Oe)
NHD-700,30m40018.9−18.91.7−2.0112−112
30019.4−19.42.3−2.7160−152
221.1−21.18.7−8.6856−881
En-NHD-700,30m-SC40016.3−16.41.6−1.9114−98
30016.7−16.82.5−2.7177−169
219.2−19.26.8−7.2781−776
Disclaimer/Publisher’s Note: The statements, opinions and data contained in all publications are solely those of the individual author(s) and contributor(s) and not of MDPI and/or the editor(s). MDPI and/or the editor(s) disclaim responsibility for any injury to people or property resulting from any ideas, methods, instructions or products referred to in the content.