Article

Paramagnetic Solid-State NMR Study of Solid Solutions of Cobaltocene with Ferrocene and Nickelocene

by
Gabrielle E. Harmon-Welch
,
Vladimir I. Bakhmutov
and
Janet Blümel
*
Department of Chemistry, Texas A&M University, College Station, TX 77843-3012, USA
*
Author to whom correspondence should be addressed.
Magnetochemistry 2024, 10(8), 58; https://doi.org/10.3390/magnetochemistry10080058
Submission received: 1 July 2024 / Revised: 3 August 2024 / Accepted: 12 August 2024 / Published: 15 August 2024
(This article belongs to the Special Issue Nuclear Magnetic Resonance Applied to Paramagnetic Molecules)

Abstract

:
The metallocenes ferrocene (Cp2Fe, 1), nickelocene (Cp2Ni, 2), and cobaltocene (Cp2Co, 3) crystallize in the same space group (P21/a) and they have the same shape and similar size. Therefore, they form solid solutions with random distribution of the different molecules when crystallized from solution. Alternatively, the solid metallocenes can be ground together manually, and the solid solutions form at any molar ratio within minutes. The metallocenes 2 and 3 are paramagnetic. Solid solutions of 1/3 and 2/3 have been studied by paramagnetic solution and solid-state NMR spectroscopy. The effect of the paramagnetic species on the other components in the solid solutions has been investigated. The impact on the chemical shifts is limited. However, the halfwidths and the signal shapes, as defined by the rotational sideband intensities, change with increasing amounts of paramagnetic components. The 1H T1 relaxation times are shortened for diamagnetic protons in the presence of paramagnetic metallocenes in the solid solutions. It has been demonstrated that all metallocenes mix at the molecular level within the polycrystalline samples. The EPR spectra of the solid solutions are dominated by the most intensive signal of any paramagnetic metallocene in the solid samples.

1. Introduction

Solid solutions are materials that are composed of two or more components that are distributed homogeneously within the crystal lattice [1]. The amounts of the components are well-defined, but they can vary over a broad range [2]. Solid solutions are, for example, important in pharmaceutical applications, where the active ingredient is homogeneously embedded in a polymer or co-crystallized with an inactive carrier for slow release [3]. Solid solutions are often created by co-crystallizing the different components from favorable solvents. For volatile substances, solid solutions can be obtained by condensing their vapors together using optimized conditions [4].
One prerequisite for forming solid solutions is that the components crystallize in the same space group. Furthermore, the molecules should have similar size and polarity. These criteria are perfectly met by metallocenes, (C5H5)2M where M stands for a 3d transition metal. The metallocenes ferrocene (Cp2Fe, (C5H5)2Fe, 1), nickelocene (Cp2Ni, (C5H5)2Ni, 2), and cobaltocene (Cp2Co, (C5H5)2Co, 3) all crystallize in the space group (P21/a) and have the same shape and very similar size [5,6,7,8].
Although solid solutions of crystalline metallocenes are of fundamental interest and would be great precursors for preparing mixed nanoparticles and dual atom catalysts in alternative ways than described in the literature [9], so far only co-crystallized systems of 1 and 2 have been reported [10]. The reason for this might be that in the triad 13, only Cp2Fe is air-stable and diamagnetic as an 18-valence electron complex. Cp2Ni contains two unpaired electrons, which render the compound paramagnetic and air-sensitive [10]. Cp2Co is less paramagnetic, with only one unpaired electron, but it also decomposes in air and is generally more reactive than 1 and 2. These factors might have been deterrents for further research into forming solid solutions of these metallocenes, although co-adsorption of 1 and 2 on a silica surface and their mixing on the molecular level [11] suggest that these metallocenes form solid solutions, that they can be handled easily, and can be characterized with solution and solid-state NMR spectroscopy [12,13,14,15]. The measurements not only of diamagnetic but also of most paramagnetic species can be performed [16,17]. In particular, paramagnetic metallocenes have been investigated previously in solution [18,19], in neat polycrystalline form [20,21], and adsorbed on the surfaces of porous silica [11,22,23,24].
In this contribution, we will demonstrate that 3 forms crystalline solid solutions with 1 and 2 at various ratios. The homogeneously mixed crystals are obtained by co-crystallizing from solution or by completely removing the solvent in vacuo. Alternatively, the solid solutions have been created by dry grinding of the components. All methods of preparation lead to similar results. The mixtures were then studied by solution and solid-state NMR spectroscopy. In particular, the chemical shift and halfwidth changes of the signals of 1 and 2 in the presence of different amounts of 3 have been investigated. Furthermore, we determined the 1H T1 relaxation times of the metallocenes and the impact that the paramagnetic metallocenes 2 and 3 exert on the relaxation of the other components. As we will outline in the following sections, paramagnetic NMR spectroscopy [16,17] corroborates the assumption that the metallocenes 13 form homogeneous solid solutions and that the molecules mix on the molecular level.

2. Results and Discussion

2.1. Ferrocene/Cobaltocene Mixtures in Solution

To study the effects of cobaltocene (3) on both the diamagnetic 1 and the paramagnetic metallocene 2, mixtures of ferrocene/cobaltocene and nickelocene/cobaltocene were prepared with varying ratios, changed in 10% increments. The metallocenes do not react with each other when dissolved, for example, in CDCl3. The interactions of 1 and 2 in solution have been communicated previously [10]. Depending on the composition of a mixture of 1 with 3, the color of the solution changes gradually from orange to purple-brown (Figure S1). No precipitate is noticeable. Besides this visual evidence, the 1H NMR spectra of mixtures only feature the resonances of the metallocenes. For example, the spectrum of a 60%/40% mixture of 1 and 3 in CDCl3 shows the signals of 1 at 4.08 ppm and 3 at about –42 ppm and no additional species that would indicate any reaction products (Figure S2).
There is no coordination or other interaction between 1 and 3, so the latter does not function as a chemical shift reagent. Therefore, the 1H NMR chemical shifts of ferrocene only change by 0.15 ppm from 4.16 ppm to 4.01 ppm when progressing from a 100/0 ratio of 1/3 to 10/90 (Table S1). The signal of 3 in the mixtures with 1 in solution shows some scatter in the chemical shift values between −41.05 and −42.40 ppm, which can be expected due to the paramagnetism of 3 and the temperature and concentration effects [19,25] on the broad signal. The halfwidths of the 1H NMR signals of 1 and 3 in solution with different ratios are summarized in Table S2. With increasing amounts of 3, the halfwidth of the ferrocene signal more than doubles. On the other hand, the linewidth of the cobaltocene signal does not follow a trend and remains in the range of about 300 Hz to 317 Hz.
Besides the chemical shifts and halfwidths of NMR signals, the longitudinal T1 relaxation times of nuclei are very sensitive and provide information about interactions of diamagnetic species with paramagnetic species in a sample. The T1 relaxation times have been derived using inversion-recovery experiments. The 1H T1 times of 1 in the presence of 3 are reported for varying compositions of CDCl3 solutions in Table S3 and visualized in a graphic in Figure S3. With increasing content of paramagnetic 3, the T1 time of the protons of 1 decline steeply and exponentially from 4.9 s for 1 without 3 to 0.21 s for a 10/90 mixture of 1/3. On the other hand, the T1 time of the 1H nuclei in paramagnetic 3 is short and remains practically unchanged at about 10 ms (Table S3).

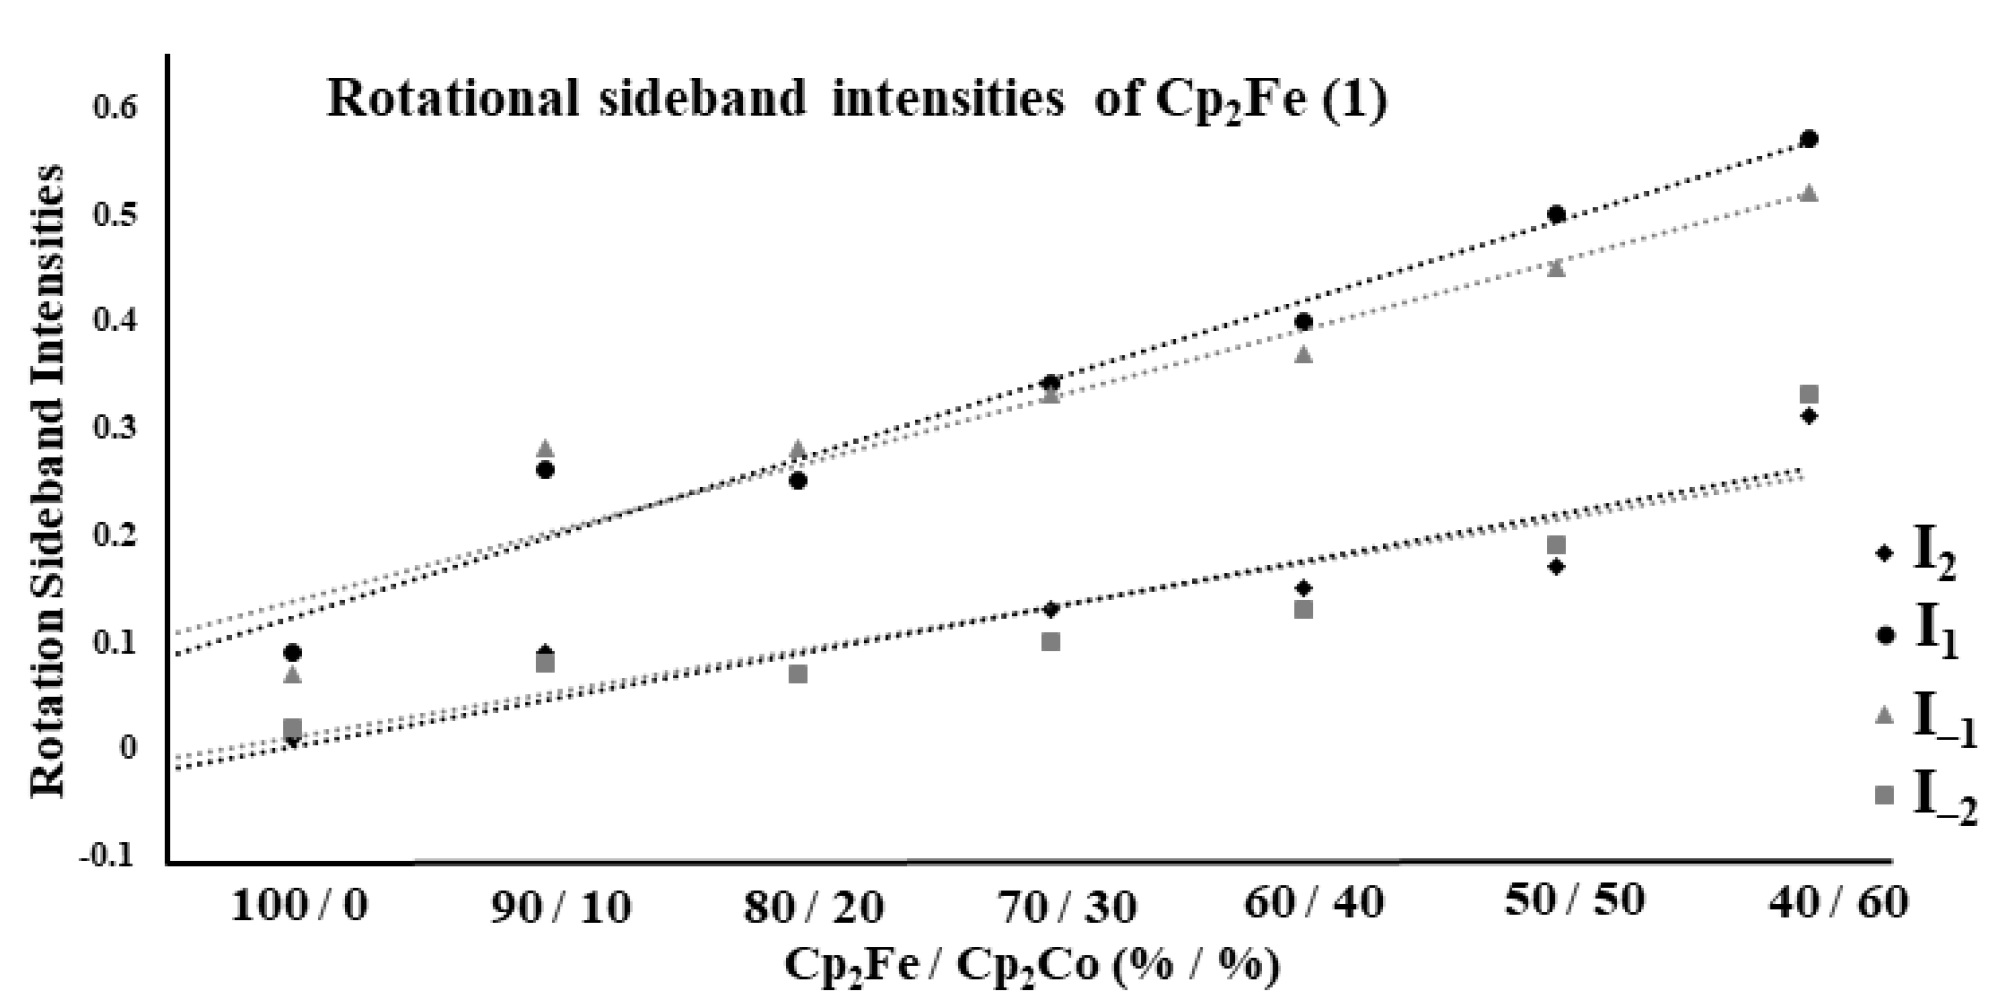
2.2. Ferrocene/Cobaltocene Solid Solutions

The formation of solid solutions of two different metallocenes can be probed with solution NMR spectroscopy. For this purpose, the metallocenes are weighed in, combined in well-defined ratios, and dissolved together (Figure S1). Then, the solvent is allowed to evaporate and large crystals form [10]. When ca. 10% of the metallocenes have crystallized, the supernatant solution is decanted, filtered off, or removed via pipette. The crystals can then be investigated. It can easily be recognized by the color of the metallocene crystals if only one component crystallizes or whether the metallocenes crystallize separately. In cases where a well-defined mixed solid with a metallocene ratio different from the starting solution is obtained, and to confirm the presence of a solid solution, the crystallization process is repeated with different initial ratios of the components. A solid solution is indicated if different initial ratios lead to these same ratios in mixed crystals. Following this protocol, solid solutions of 1 and 3 were prepared by mixing the metallocenes in the desired ratios, dissolving them in a favorable solvent, such as DCM, CHCl3, or hexane, and crystallizing by slow evaporation of the solvent. After filtration, the composition of the crystalline material was confirmed by dissolving the crystals in a deuterated solvent and integrating the metallocene signals in the 1H NMR spectra. The obtained integrals were in accordance with the initial ratios of the metallocenes. For example, the 1H NMR spectrum displayed in Figure S2 results in the expected 2:3 ratio for the intensities of the signals of 1 and 3 in a 40/60 co-crystal. This confirms that the crystalline material consists of homogeneous solid solutions and that none of the components crystallizes as pure 1 or 3 from the mixtures. Having established that 1 and 3 co-crystallize readily, a faster approach to create their solid solutions is to strip the solvent from the metallocene mixtures in DCM. As an alternative, solvent-free approach to the synthesis of the solid solutions, the components were mixed together thoroughly by dry grinding (Figure 1), as communicated for 1 and 2 previously [10]. The obtained solid solutions with different amounts of the components were then investigated regarding their homogeneity and the interactions of the metallocene molecules on the molecular level.
To confirm that grinding 1 and 3 together in different molar ratios led to the solid solutions and did not just result in physical mixtures of the components, the melting points were determined (Table S4). Starting with neat 1 that features a melting point of 174 °C, increasing the amount of 3 in the solid mixture raised the melting point gradually until the melting temperature of pure 3 (180.1 °C) [26] is reached. It should be noted that the melting points of 1 and 3 are very high. This excludes the potential mechanochemistry-based assumption that the pressure of the manual mixing with a mortar and pestle at ambient temperature may lead to the formation of the solid solutions via a melting process.
Next, the 1H MAS spectra of the solid solutions of Cp2Fe (1) with Cp2Co (3) were studied (Figure 2). The chemical shifts of 1 and 3 with varying amounts of the components in the solid solutions are summarized in Table 1. Interestingly, compared to the solution NMR spectra (Figure S2, Table S1), the signal of neat 3 (Figure 2, top) and of 3 in the solid solutions of all compositions with 1 is substantially upfield shifted by about 9 ppm to about −51 ppm. Comparing the chemical shifts of diamagnetic species in solution and in the solid state usually results in a difference of a few ppm [12]. The value is, however, in agreement with the literature [21]. The isotropic chemical shift is composed of the diamagnetic and paramagnetic shift. Reference [21] lists the paramagnetic shift of neat 3 as −56 ppm and the diamagnetic shift as +4.2 ppm, recorded for neat 1. The isotropic shift reported in reference [21] is therefore −51.8 ppm, which is close to our value of −51 ppm. Because 3 is paramagnetic, one must factor in differences of the measurement temperatures. Additionally, at higher rotational speeds, the sample heats up due to friction at the rotor walls [20]. The older the rotor and the rougher its surface, the more friction heating will occur. The higher temperature leads to a shift of the signal towards the diamagnetic region.
The presence of different amounts of 1 does not change the δ(1H) of the signal of 3 (Figure 2, Table 1) substantially. The chemical shift of the 1H MAS signal of 1 in the solid solutions is, however, impacted by the presence of 3 in the crystals (Table 1). The δ(1H) of the signal changes gradually from 4.22 ppm for neat 1 to 3.68 ppm for a 10/90 molar ratio of 1/3.
Besides the chemical shift, the halfwidth of a signal is an indicator for the presence of a paramagnetic species. For spectra measured with MAS, the residual linewidth, which is the halfwidth of the isotropic line of the MAS signal, can be used. The residual linewidths of the signals of 1 and 3 in solid solutions with different amounts of the components are summarized in Table 2 and visualized in Figure 3. The halfwidth of the ferrocene signal increases exponentially from 810 Hz initially for neat 1 to about 1850 Hz for a 10/90 solid solution with 3. While the residual linewidth of the signal of 1 is impacted by the presence of paramagnetic 3 in the crystal lattice, the halfwidth of the Cp2Co resonance remains unchanged throughout all ratios of 1/3 (Table 2, Figure 3).
In addition to the chemical shift and the residual linewidth of a signal, for diamagnetic solid materials, the CSA (chemical shift anisotropy) [12,15] is used for characterizing, for example, the nature of functional groups and intermolecular interactions in mixtures. For example, it is typical that the CSA of 31P NMR signals in polycrystalline metal phosphine complexes is different, although the 31P nuclei are coordinated to the same metal center and are magnetically inequivalent but chemically equivalent [27]. Unfortunately, for solid paramagnetic species, the CSA can not be disentangled from the broadening effects of dipolar interactions and the BMS (bulk magnetic susceptibility) [17]. However, the change of the signal shape for Cp2Fe (1) in the solid solutions with Cp2Co (3) in different ratios is obvious. With increasing amounts of 3, the first and second order rotational sidebands of the signal of 1 become more intensive (Figure 2) when compared to the intensity of the isotropic peak. For quantifying this information, the integrals of the sidebands were determined with respect to the isotropic line set to a value of 1 [10]. To avoid any overlap of the rotational sidebands of the signals of 1 and 3, a lower rotational frequency of 6 kHz has been chosen. Integrating the rotational sidebands resulted in the data summarized in Table S5 and graphically displayed in Figure 4. In accordance with the visual impression of the spectra (Figure 2), the first-order rotational sidebands gain slightly more intensity than the second-order sidebands of the signal of 1 when the amount of 3 in the solid solution is increased. For both types of rotational sidebands, a linear correlation between the sideband intensities and the amounts of 3 present in the solid solutions is found (Figure 4). The signal of 3 displays the same tendencies for the rotational sideband intensities. However, the effect of the different amounts of 1 present in the crystal lattice is less pronounced (Table S6, Figure S4).
The chemical shifts, residual halfwidths, and sideband intensities all indicate that the metallocene molecules mix on the molecular level in the solid solutions of 1 and 3. Additional proof can be derived from 1H T1 relaxation time measurements using inversion-recovery techniques [17]. The spectra of a 50/50 solid solution of 1/3, obtained by crystallizing from solution, are displayed in Figure S5, and examples for the quality of the fits for 40/60 and 60/40 compositions of 1/3 are shown in Figure S6. The data obtained for different solid solutions of 1 and 3 are summarized in Table 3.
The 1H relaxation of the pure crystalline paramagnetic 3 is short (1.3 ms). In the presence of 1, the T1 times get longer and range between 2.0 ms and 2.5 ms. The relaxation time of the ferrocene protons proves to be more sensitive to the different amounts of 3 present in the crystals. While neat 1 features a relaxation time of 14 s in the solid state [10], only 20% of cobaltocene in the solid solution decreases the value to 31 ms (Table 3). The gradual decrease in T1 with increasing amounts of paramagnetic 3 leads to 4.2 ms for a 20/80 composition of 1/3. It is noteworthy to mention that just mixing the dry components 1 and 3 followed by immediate measurement results in two different T1 relaxation times for the ferrocene signals, a long and short one. This is in accordance with earlier observations on mixtures of 1 and 2 [10]. Therefore, the presence of only short 1H T1 times for the diamagnetic 1 in the solid solutions confirms that the paramagnetic molecules of 3 are distributed homogeneously within the crystal and mix with 1 on the molecular level (Table 3). It should be noted that the T1 times of 1 and 3 are different in the solid solutions because the metal centers do not get detached from their Cp ligands. The metals do not exchange their places in the lattice, leaving the Cp ligands in their original positions. This was demonstrated earlier for the pair 1 and 2 [10]. Furthermore, the Cp rings undergo extremely fast rotations even in the solid state [20]. These fast rotations reorient the intermolecular proton-proton dipolar vectors. Therefore, a spin-diffusion relaxation mechanism can be ruled out. In species containing Co2+ and Ni2+ ions, the proton relaxation is dominated by electron-proton dipolar interactions that are very sensitive to the proton-electron distances [16,28]. In addition, the spin-diffusion relaxation is generally exponential, in contrast to the data obtained.

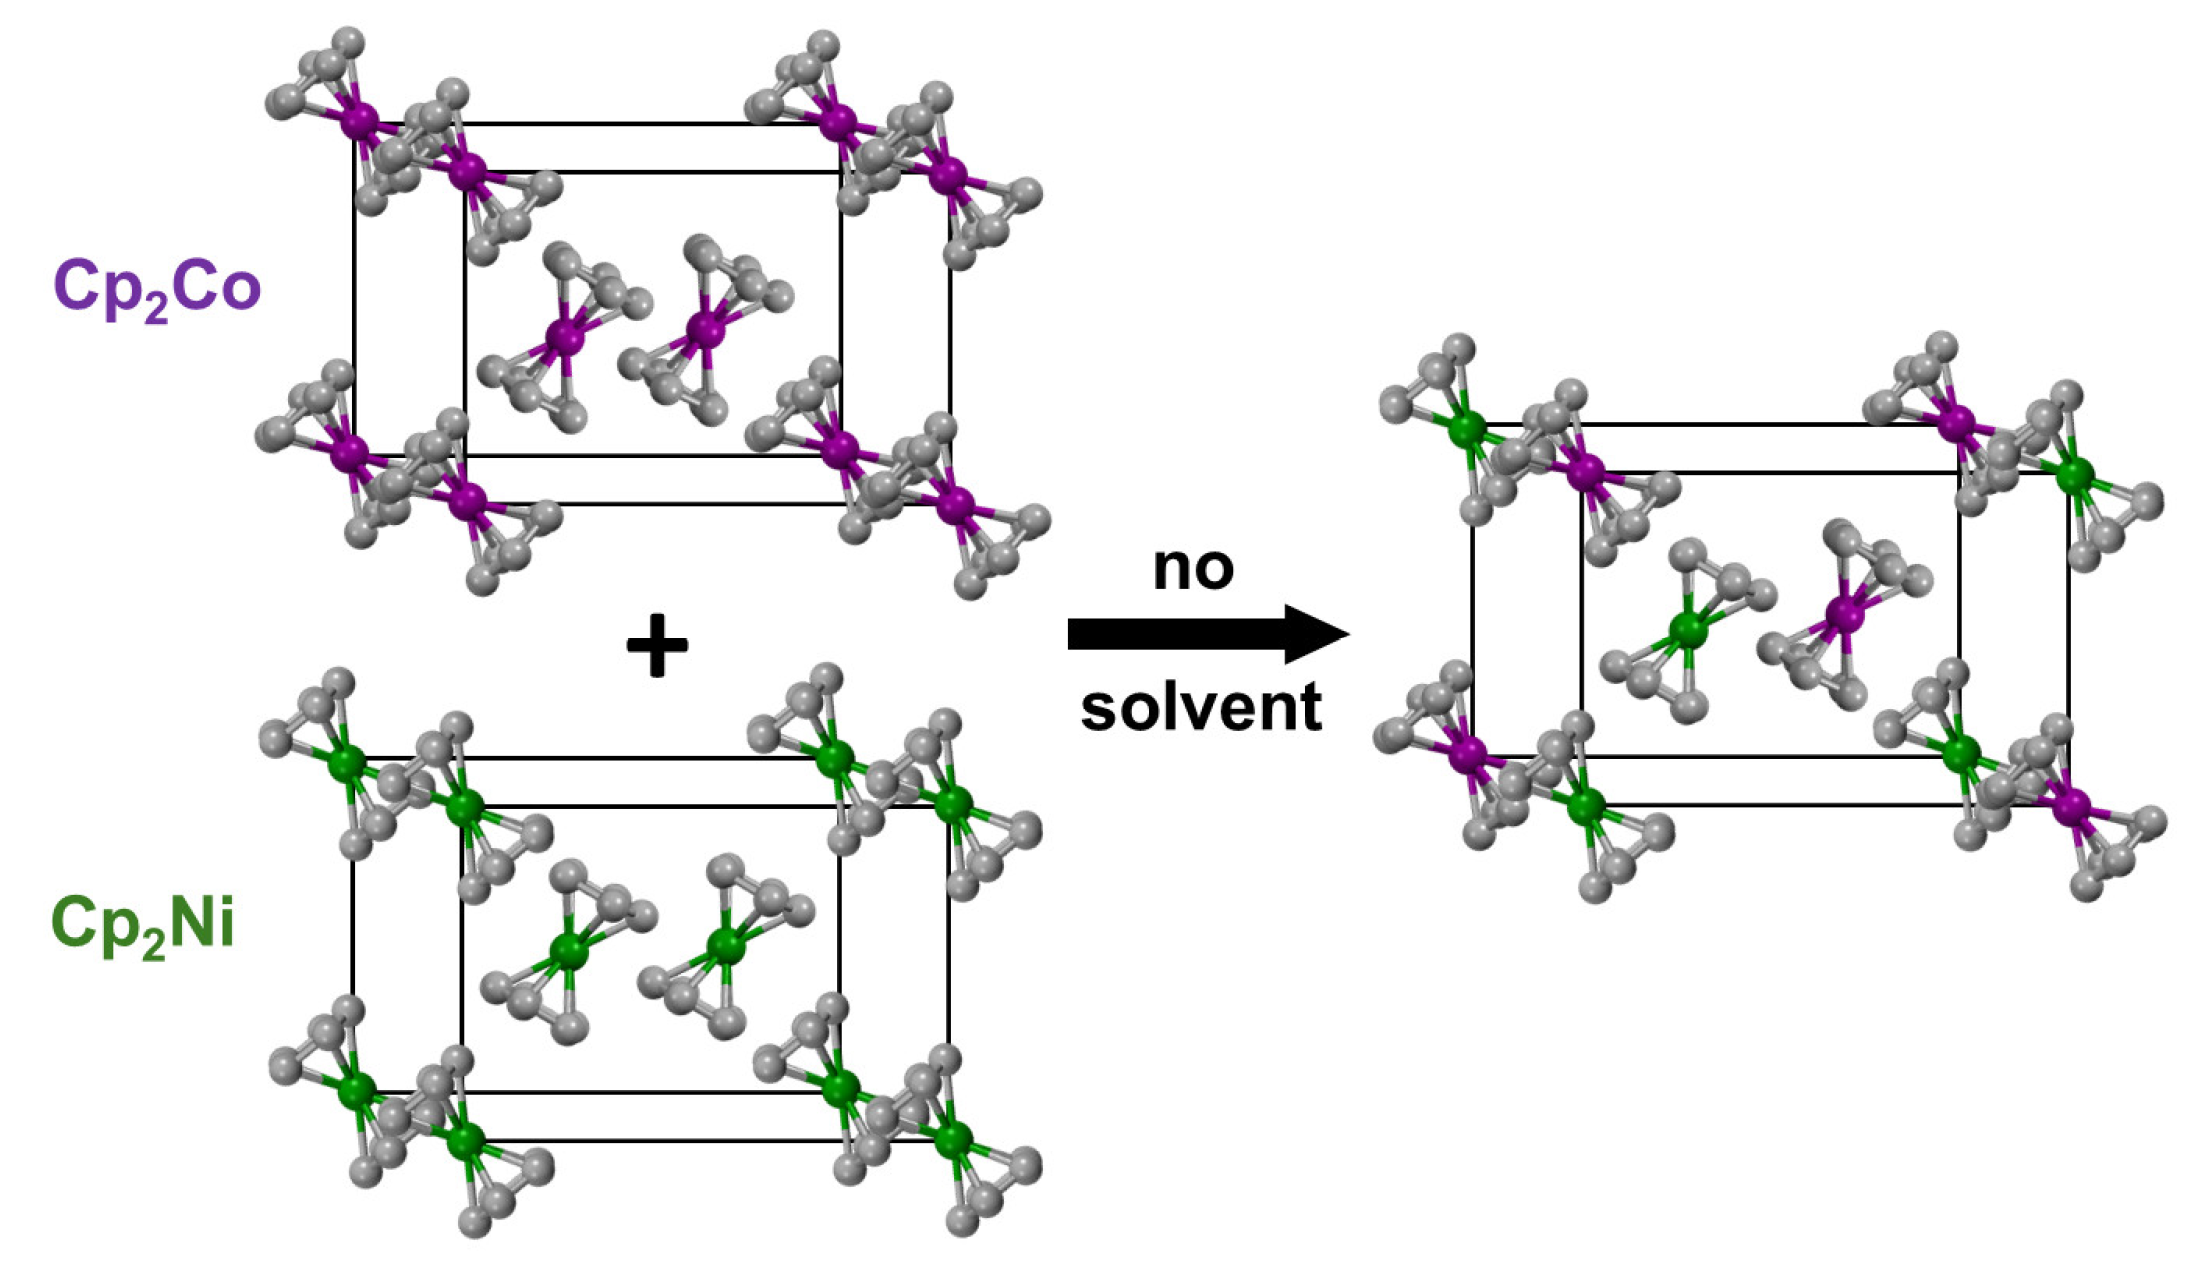
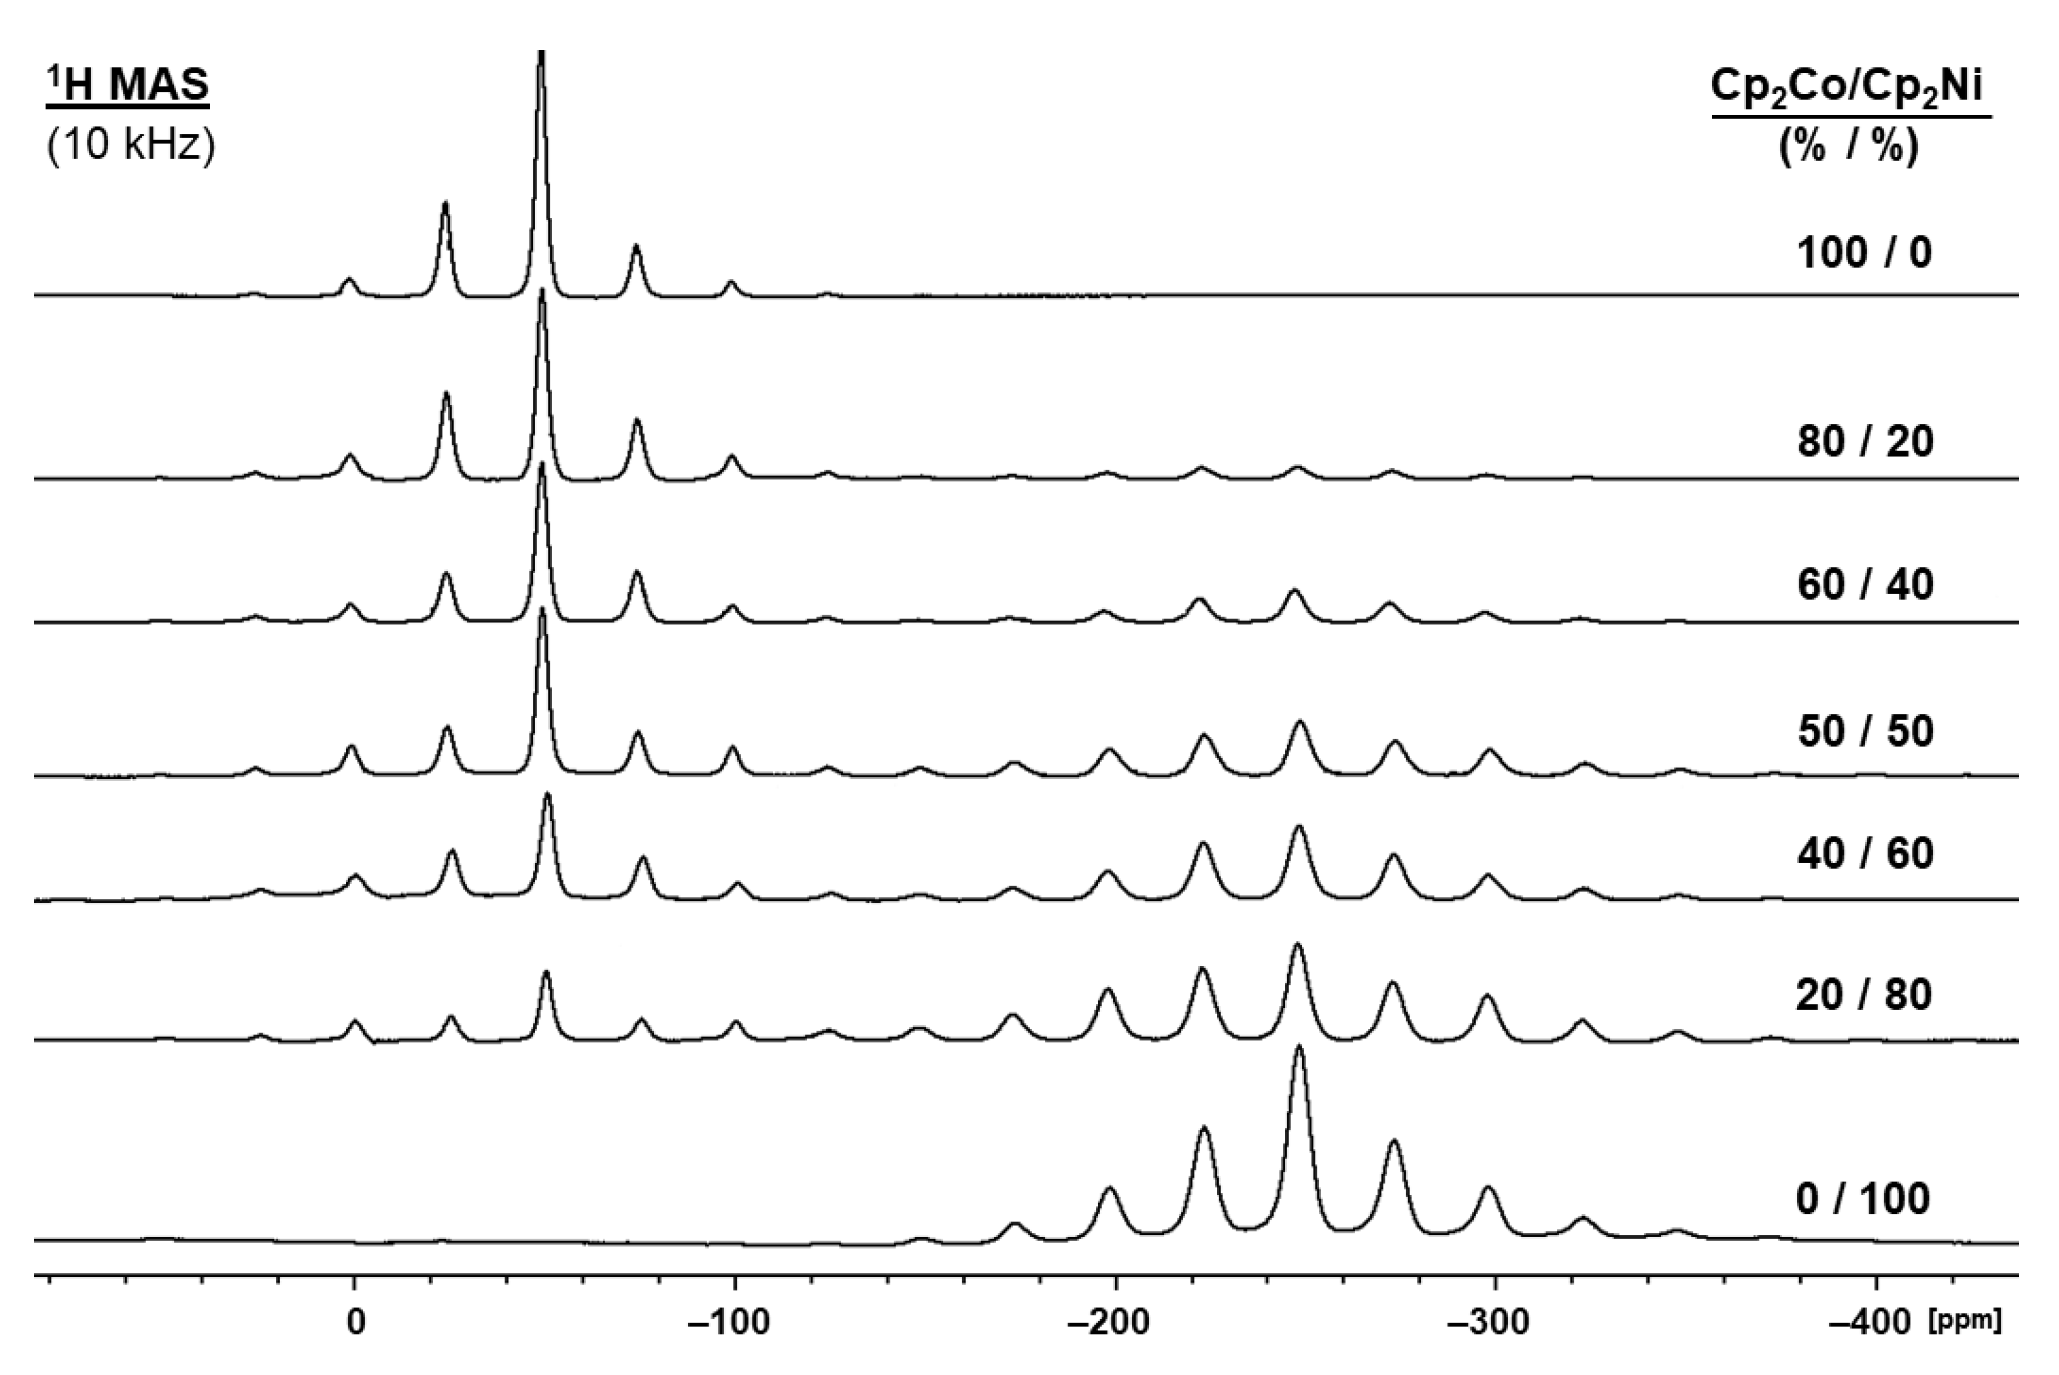
2.3. Nickelocene/Cobaltocene Solid Solutions

Next, the effect of two paramagnetic metallocenes on each other in solid solutions was investigated. For this purpose, Cp2Ni (2) and Cp2Co (3) were co-crystallized in different molar ratios. The 1H MAS NMR spectra of selected ratios are displayed in Figure 5.
The 1H chemical shifts for the signals of both components are summarized in Table 4. With increasing amounts of 2, the resonance of 3 experiences a gradual upfield shift from −50.51 ppm for the pure compound to −51.88 ppm in a 10/90 solid solution of 3/2. The proton chemical shift of the signal of 2 is in accordance with the literature value (−245 ppm) [10] and remains practically unchanged by the presence of any amount of 3. The slight variations in δ(1H) between −245.1 ppm and −245.9 ppm can be attributed to temperature [20] and phase correction effects. It is unlikely that the shift differences are due to changes of the bulk magnetic susceptibility. There is no trend in the chemical shifts with changing composition of the materials. Furthermore, we demonstrated earlier that keeping the neat metallocenes separate in a rotor leads to a spectrum composed of the undisturbed crystalline metallocenes 1 and 2 [10].
The 1H MAS residual linewidths of 2 and 3 follow the same trend that was observed for the chemical shifts (Table 5). There is a noticeable increase in the linewidth of 3 from 1.38 kHz for the neat metallocene to 1.56 kHz in a 10/90 solid solution with 2. The linewidths for 2 do not show any trend in solid solutions with 3 of different composition. They scatter slightly due to the impact of temperature, background subtraction, and phase correction but stay within the range from 2.41 kHz to 2.69 kHz.
In analogy to the solid solutions of 1 with 3, described above, the rotational sideband intensities, as compared to the isotropic line set to intensity 1.0, have been determined for the couple 2/3 with different amounts of the components. The results are summarized in Table S7 and graphically displayed in Figure S7. The mutual impact of both paramagnetic metallocenes on the signal shapes of each other is negligible. Only the trendline of the I–2 sideband of 2 shows a slight upward slope with increasing amounts of 3 in the solid solutions (Figure S7).
Next, the 1H T1 relaxation times of 2 and 3 in their solid solutions with different compositions have been determined. The values are reported in Table S8. The Cp2Ni relaxation times are practically unaffected by 3, which is consistent with the observations made for the chemical shifts and halfwidths of 2 discussed above. The cobaltocene T1 relaxation time increases from 1.3 ms to 2.8 ms when proceeding from 100% to 10% Cp2Co in the samples. This effect can be connected with increasing the intermolecular distances in the samples prepared by joint grinding. In summary, cobaltocene and nickelocene relax rather independently.
We also studied the impact of the unpaired electrons of paramagnetic 2 and 3 on the other metallocenes 13 in the solid solutions by EPR spectroscopy. According to anticipation, the diamagnetic Cp2Fe did not result in an EPR signal, while the neat paramagnetic metallocenes 2 and 3 showed spectra similar to those reported in the literature [29,30]. Cp2Fe did not have any impact on the EPR spectrum of Cp2Co (Figure S8). In the EPR spectrum of a solid solution of 2 and 3, the strong resonance of 3 dominated over the weaker signal of Cp2Ni (Figure S9). In summary, EPR spectroscopy does not provide insight into any interactions of the unpaired electrons of the metal nuclei in 2 and 3.

3. Conclusions

It has been demonstrated with 1H paramagnetic solution and solid-state NMR spectroscopy that the metallocenes Cp2Fe (1) and Cp2Ni (2) form solid solutions with Cp2Co (3). The solid solutions can be created by co-crystallization of the components from solution or by dry grinding in the absence of a solvent. All components of the solid solutions with different compositions have been investigated with respect to the chemical shifts of their 1H MAS signals, the residual linewidths, the overall signal shapes as expressed by the individual rotational sideband intensities, and the T1 relaxation times.
The impact of paramagnetic 3 on the NMR characteristics of 1 is highest, while interactions between 2 and 3 manifest themselves in more subtle changes. For example, with increasing amounts of paramagnetic 3 in 1/3 solid solutions, the signal of 1 undergoes an upfield shift from 4.22 ppm for pure 1 to 3.68 ppm in a 10/90 molar ratio with 3 and the residual linewidth increases from 810 to 1850 Hz. The overall signal becomes broader, as the relative intensities of the first and second-order rotational sidebands increase. Most striking is the result that the T1 relaxation of the 1H nuclei of 1 becomes faster with growing amounts of paramagnetic 3 in the solid solutions. While pure polycrystalline 1 has a T1 relaxation time of 14 s, in a 20/80 solid solution of 1/3 it drops to 4.2 ms.
In summary, it has been demonstrated that 1H MAS paramagnetic solid-state NMR spectroscopy is a powerful tool to characterize paramagnetic materials, in particular the composition and homogeneity of solid solutions of metallocenes. Using several different methods, it has been proven that the metallocenes 13 form homogeneous solid solutions and that the individual molecules mix on the molecular level. The results are not only phenomenologically interesting but important with respect to forming mixed nanoparticles with exact composition or well-defined heterobimetallic dual atom catalysts on surfaces.

4. Experimental Section

Sample preparation. Ferrocene (1), nickelocene (2), and cobaltocene (3) were obtained from Fisher Scientific. Prior to storing the substances in a glove box, they were sublimed in an inert gas atmosphere. All samples of mixed metallocenes were prepared in a glove box under a rigorously dried and oxygen-free N2 atmosphere.
The solid solutions of the metallocenes have been prepared by dissolving the components in the desired ratios in DCM, CHCl3, or hexane, and crystallizing by slow evaporation of the solvent. The solid solutions of the metallocenes can also be prepared by dissolving the components in the desired ratios in dry, oxygen-free DCM under an inert gas atmosphere. After stirring the solutions for 5 min, the solvent was removed at the Schlenk line.
Alternatively, the corresponding amounts of solid metallocenes were ground together to form solid solutions. For this purpose, the metallocenes were weighed in a glove box and combined in a mortar. An agate mortar and pestle set was used because this material does not adsorb metallocenes, unlike ceramics [23,24]. The metallocene mixtures were ground manually for 5 min and left undisturbed for 5 min. This cycle was repeated two more times for a total of 30 min. Then the samples were packed densely into the 4 mm ZrO2 MAS rotors. To avoid oxidation of the air-sensitive nickelocene and cobaltocene, N2 served as MAS drive and bearing gas.
NMR measurements. For solution NMR spectroscopy, the metallocenes and their mixtures were dissolved in CDCl3 and measured with a 500 MHz Varian spectrometer at room temperature. All solid-state NMR spectra were acquired using the solid-state NMR instrument Bruker Avance-Neo 400, obtained from Bruker Biospin, Karlsruhe, Germany. The 4 mm MAS probehead featured two channels. For 1H measurements, a standard Bloch decay pulse sequence was applied. Usually, eight scans provided spectra with sufficient S/N ratio. For processing the spectra, no line broadening was required but a 1H background signal, recorded independently, has been subtracted from the metallocene spectra. TMS was used as the external chemical shift standard. All NMR instruments were operated with nitrogen as drive and bearing gas at 295 K. The temperature unit of the solid-state NMR spectrometer was calibrated for the static regime by the standard procedure using liquid methanol placed into a MAS NMR rotor. Temperature corrections on spinning have been made according to the protocol for 4 mm NMR rotors [31]. According to the correction, 295 K for the drive and bearing gas transforms to 298.3 K within the rotor at a spinning rate of 10 kHz.
The T1 relaxation times of the metallocene protons were determined at 10 kHz with standard inversion-recovery pulse sequences (relaxation delay–180°−τ−90°–acquisition). The RF pulses were well-calibrated (2.5 μs at a power of 105.3 W). The acquisition time was between 0.005 and 0.001 s. The τ delays were varied incrementally within a range from 0.00005 to 50 s for 1/3 and 0.000015 to 5.0 s for 2/3. The recycle delays were long enough to guarantee complete nuclear relaxation after each pulse cycle. For mixtures of 1 and 3, the recycle delay was 50 s, and for solid solutions of 2 and 3 it was 5 s. Four scans provided spectra with sufficient signal-to-noise ratio and no line broadening was applied. For processing the relaxation time data, the experimentally obtained inversion−recovery curves, which feature the signal intensities versus τ times, were subjected to a standard nonlinear fitting computer program that was based on the Levenberg−Marquardt algorithm. The 1H resonances of the metallocenes 13 have very different chemical shifts. Therefore, the T1 times for their mixtures were measured with two carrier frequencies that were centered on the positions of the two resonances in the systems 1/3 and 2/3. The error margin of the T1 time determinations is ~10–15%.
The sideband intensities of the 1H MAS signals and the line shape analyses of the wideline spectra were obtained using the programs and software package of the Bruker instrument Avance-Neo 400.
EPR measurements. All EPR measurements were performed on the instrument Bruker Elexsys E500. Chloroform solutions of the metallocenes with the indicated molar ratios were prepared in an EPR tube under an argon atmosphere. Each sample with a given metallocene ratio was prepared twice to confirm accuracy. Then, the solvent was carefully removed under reduced pressure and the crystalline materials were immediately measured at room temperature under a nitrogen atmosphere. The field was centered at 3480 Gauss and a sweep width from 1800 to 4800 Gauss was chosen. The number of points was 1024, with a sample g-factor of 2.000. For each sample, 32 scans were recorded using a continual wave sweep. The sweep time was 5.24 s. The modulation frequency was 100 kHz and the modulation amplitude 1 Gauss with a harmonic 1 and modulation phase 0. The receiver gain was 60 dB, the time constant 1.28 ms, and the conversion time 5.12 s.

Supplementary Materials

The following supporting information can be downloaded at: https://www.mdpi.com/article/10.3390/magnetochemistry10080058/s1, Figure S1: Mixtures with the indicated ratios of Cp2Fe (1) and Cp2Co (3) in CDCl3; Figure S2: Solution 1H NMR spectrum (295 K, CDCl3) of a mixture of 60% Cp2Fe (1) with 40% Cp2Co (3); Table S1: Chemical shifts of Cp2Fe (1) and Cp2Co (3) dissolved in CDCl3 at 295 K with the indicated ratios; Table S2: Halfwidths of Cp2Fe (1) and Cp2Co (3) dissolved in CDCl3 with the indicated ratios; Table S3: Relaxation times of Cp2Fe (1) and Cp2Co (3) dissolved in CDCl3 with the indicated molar ratios; Figure S3: T1 relaxation times of Cp2Fe (1) dissolved in CDCl3 together with Cp2Co (3) with the indicated ratios; Table S4: Melting points of mixed polycrystalline Cp2Fe and Cp2Co at the indicated molar ratios. The measurements were performed three times for each sample and the average value is reported. All melting point determinations were carried out using melting point capillaries closed in an inert gas atmosphere; Table S5: Intensities of the first and second-order rotational sidebands of the 1H MAS NMR signal of Cp2Fe (1) in the solid solution with Cp2Co (3) with the indicated ratios. The intensities were measured with respect to the isotropic line set to intensity 1.00. The spectra were recorded at a rotational frequency of 6 kHz. The downfield sidebands of the first and second order are labeled I1 and I2, and the sidebands on the upfield side are I‒1 and I‒2. The intensities have been determined after background subtraction. For a graphical display of data see Figure 4; Table S6: Intensities of the first and second-order rotational sidebands of the 1H MAS NMR signal of Cp2Co (3) in the solid solutions with Cp2Fe (1) at the indicated ratios. The intensities were measured with respect to the isotropic line set to intensity 1.00. The spectra were recorded at a 6 kHz rotational frequency in order to remove any overlap of sidebands. The downfield sidebands of the first and second order are labeled I1 and I2, and the sidebands on the upfield side are I‒1 and I‒2. The intensities have been determined after background subtraction. For a graphical display of the data see Figure S4; Figure S4: Graphical display of the rotational sideband intensities for the 1H MAS signal of Cp2Co (3), mixed with Cp2Fe at the indicated molar ratios (Table S6); Figure S5: Inversion-recovery 1H MAS NMR spectra recorded at a spinning rate of 10 kHz for a 50%/50% solid solution of Cp2Fe and Cp2Co. The solid solution was obtained by co-crystallization of the components from a CDCl3 solution. The τ delay times were varied between 50 and 0.00005 s; Figure S6: Experimental inversion-recovery curves obtained for the 40%/60% (top) and 60%/40% (bottom) Cp2Fe/Cp2Co solid solutions after fittings to exponential (dotted lines) and stretched exponential functions with β parameters of 0.46 and 0.62, respectively (solid lines); Table S7: Intensities of the first and second-order rotational sidebands of the 1H MAS NMR signal of Cp2Ni (2) in the solid solutions with Cp2Co (3) at the indicated ratios. The intensities were measured with respect to the isotropic line set to intensity 1.00. The downfield sidebands of the first and second order are labeled I1 and I2, and the sidebands on the upfield side are I‒1 and I‒2. The intensities have been determined after background subtraction. For a graphical display of the data see Figure S7; Figure S7: Graphical display of the rotational sideband intensities for the 1H MAS signal of Cp2Co (3), mixed with Cp2Fe at the indicated molar ratios (Table S7); Table S8: 1H T1 relaxation times of the Cp resonances of solid solutions of Cp2Ni (2) and Cp2Co (3), prepared by grinding, with the indicated molar ratios. The T1 times were obtained by fittings with a stretched exponential f(t) = exp(−τ/T1)β for the Cp signals; Figure S8: EPR spectra of Cp2Fe (bottom), Cp2Co (top), and a 50%/50% solid solution of both metallocenes (middle), obtained by crystallization from a CDCl3 solution; Figure S9: EPR spectra of Cp2Co, Cp2Ni, and a 50%/50% solid solution of both metallocenes, obtained by crystallization from CDCl3 solution.

Author Contributions

Conceptualization, J.B.; methodology, J.B., V.I.B. and G.E.H.-W.; validation, J.B. and V.I.B.; formal analysis, V.I.B. and G.E.H.-W.; investigation, G.E.H.-W.; resources, J.B.; data curation, J.B., V.I.B. and G.E.H.-W.; writing-original draft preparation, G.E.H.-W.; writing-review and editing, J.B.; visualization, G.E.H.-W.; supervision, J.B.; project administration, J.B.; funding acquisition, J.B. All authors have read and agreed to the published version of the manuscript.

Funding

This work was supported by the National Science Foundation (CHE-1900100).

Data Availability Statement

Data will be made available upon request.

Acknowledgments

We thank John C. Hoefler for creating the graphical abstract and the display in Figure 1 and Douglas Elliott for assisting with the T1 time determinations of the solution NMR signals.

Conflicts of Interest

The authors declare no conflict of interest.

References

  1. Callister, W.D., Jr. Materials Science and Engineering: An Introduction, 7th ed.; John Wiley & Sons: Hoboken, NJ, USA, 2006; ISBN 0-471-35446-5. [Google Scholar]
  2. Ter Horst, J.H.; Deij, M.A.; Cains, P.W. Discovering New Co-Crystals. Cryst. Growth Des. 2009, 9, 1531–1537. [Google Scholar] [CrossRef]
  3. Tilborg, A.; Norberg, B.; Wouters, J. Pharmaceutical salts and cocrystals involving amino acids: A brief structural overview of the state-of-art. Eur. J. Med. Chem. 2014, 74, 411–426. [Google Scholar] [CrossRef]
  4. Blagden, N.; Berry, D.J.; Parkin, A.; Javed, H.; Ibrahim, A.; Gavan, P.T.; De Matos, L.L.; Seaton, C.C. Current directions in co-crystal growth. New J. Chem. 2008, 32, 1659–1672. [Google Scholar] [CrossRef]
  5. Seiler, P.; Dunitz, J.D. A New Interpretation of the Disordered Crystal Structure of Ferrocene. Acta Crystallogr. Sect. B Struct. Crystallogr. Cryst. Chem. 1979, 35, 1068–1074. [Google Scholar] [CrossRef]
  6. Miyamoto, Y.; Takamizawa, S. Deformation twinning of ferrocene crystals assisted by the rotational mobility of cyclopentadienyl rings. Dalton Trans. 2015, 44, 5688–5691. [Google Scholar] [CrossRef]
  7. Bünder, W.; Weiss, E. Verfeinerung der Kristallstruktur von Dicyclopentadienylkobalt, (η5-C5H5)2Co. J. Organomet. Chem. 1975, 92, 65–68. [Google Scholar] [CrossRef]
  8. Antipin, M.Y.; Boese, R.; Auga, N.; Schmid, G. Redetermination of the cobaltocene crystal structure at 100 K and 297 K: Comparison with ferrocene and nickelocene. Struct. Chem. 1993, 4, 91–101. [Google Scholar] [CrossRef]
  9. Ding, K.; Cullen, D.A.; Zhang, L.; Cao, Z.; Roy, A.D.; Ivanov, I.N.; Cao, D. A general synthesis approach for supported bimetallic nanoparticles via surface inorganometallic chemistry. Science 2018, 362, 560–564. [Google Scholar] [CrossRef]
  10. Harmon-Welch, G.E.; Hoefler, J.C.; Trujillo, M.R.; Bhuvanesh, N.; Bakhmutov, V.I.; Blümel, J. Creating Solid Solutions of Metallocenes: Migration of Nickelocene into the Ferrocene Crystal Lattice in the Absence of a Solvent. J. Phys. Chem. C 2023, 127, 3059–3066. [Google Scholar]
  11. Benzie, J.W.; Harmon-Welch, G.E.; Hoefler, J.C.; Bakhmutov, V.I.; Blümel, J. Molecular Dynamics and Surface Interactions of Nickelocene Adsorbed on Silica: A Paramagnetic Solid-State NMR Study. Langmuir 2022, 38, 7422–7432. [Google Scholar] [CrossRef] [PubMed]
  12. Shenderovich, I.G.; Limbach, H.-H. Solid State NMR for Nonexperts: An Overview of Simple but General Practical Methods. Solids 2021, 2, 139–154. [Google Scholar] [CrossRef]
  13. Schmidt-Rohr, K.; Spiess, H.W. Multidimensional Solid-State NMR and Polymers; Academic Press: London, UK, 1994. [Google Scholar]
  14. Samudrala, K.K.; Huynh, W.; Dorn, R.W.; Rossini, A.J.; Conley, M.P. Formation of a Strong Heterogeneous Aluminum Lewis Acid on Silica. Angew. Chem. Int. Ed. 2022, 61, e202205745. [Google Scholar] [CrossRef]
  15. Duncan, T.M. A Compilation of Chemical Shift Anisotropies; Farragut Press: Chicago, IL, USA, 1990. [Google Scholar]
  16. Pell, A.J.; Pintacuda, G.; Grey, C.P. Paramagnetic NMR in solution and the solid state. Prog. Nucl. Magn. Reson. Spectrosc. 2019, 111, 1–271. [Google Scholar] [CrossRef] [PubMed]
  17. Bakhmutov, V.I. Strategies for solid-state NMR studies of materials: From diamagnetic to paramagnetic porous solids. Chem. Rev. 2011, 111, 530–562. [Google Scholar] [CrossRef]
  18. Fischer, R.A.; Nlate, S.; Hoffmann, H.; Herdtweck, E.; Blümel, J. Two Types of Intramolecular Lewis-Base Adducts with the [2-(Dimethyl-amino)ethyl]cyclopentadienyl Ligand: Synthesis and Crystal Structures of {η51-C5H4[(CH2)2NMe2]}Ni-I and {η5-μ-C5H4[(CH2)2NMe2]}(Me3P)Ni-InI2. Organometallics 1996, 15, 5746–5752. [Google Scholar] [CrossRef]
  19. Blümel, J.; Hofmann, P.; Köhler, F.H. NMR Spectroscopy of Paramagnetic Complexes. Magn. Reson. Chem. 1993, 31, 2–6. [Google Scholar] [CrossRef]
  20. Blümel, J.; Hiller, W.; Herker, M.; Köhler, F.H. Solid-State Paramagnetic NMR Spectroscopy of Chromocenes. Organometallics 1996, 15, 3474–3476. [Google Scholar] [CrossRef]
  21. Heise, H.; Köhler, F.H.; Xie, X. Solid-state NMR spectroscopy of paramagnetic metallocenes. J. Magn. Reson. 2001, 150, 198–206. [Google Scholar] [CrossRef] [PubMed]
  22. Schnellbach, M.; Blümel, J.; Köhler, F.H. The Union Carbide catalyst (Cp2Cr + SiO2), studied by solid-state NMR. J. Organomet. Chem. 1996, 520, 227–230. [Google Scholar] [CrossRef]
  23. Cluff, K.J.; Schnellbach, M.; Hilliard, C.R.; Blümel, J. The adsorption of chromocene and ferrocene on silica: A solid-state NMR study. J. Organomet. Chem. 2013, 744, 119–124. [Google Scholar] [CrossRef]
  24. Cluff, K.J.; Blümel, J. Adsorption of Metallocenes on Silica. Chem. Eur. J. 2016, 22, 16562–16575. [Google Scholar] [CrossRef] [PubMed]
  25. Martin, B.; Autschbach, J. Temperature dependence of contact and dipolar NMR chemical shifts in paramagnetic molecules. J. Chem. Phys. 2015, 142, 054108. [Google Scholar] [CrossRef] [PubMed]
  26. Lide, D.R. (Ed.) CRC Handbook of Chemistry and Physics, 86th ed.; CRC Press: Boca Raton, FL, USA, 2005; p. 3257. ISBN 0-8493-0486-5. [Google Scholar]
  27. Reinhard, S.; Blümel, J. 31P CP/MAS NMR of polycrystalline and immobilized phosphines and catalysts with fast sample spinning. Magn. Reson. Chem. 2003, 41, 406–416. [Google Scholar] [CrossRef]
  28. Rettig, M.F.; Drago, R.S. Electron delocalization in paramagnetic metallocenes. I. Nuclear magnetic resonance contact shifts. J. Am. Chem. Soc. 1969, 91, 1361–1370. [Google Scholar] [CrossRef]
  29. Rajasekharan, M.V.; Bucher, R.; Deiss, E.; Zoller, L.; Salzer, A.K.; Moser, E.; Weber, J.; Ammeter, J.H. ESR Study of the Electronic Structure and Dynamic Jahn-Teller Effect in Nickelocenium Cation. J. Am. Chem. Soc. 1983, 105, 7516–7522. [Google Scholar] [CrossRef]
  30. Prins, R.; Reinders, F.J. Electron Spin Resonance of the Cation of Ferrocene. J. Am. Chem. Soc. 1969, 91, 4929–4931. [Google Scholar] [CrossRef]
  31. Guan, X.; Stark, R.E. A general protocol for temperature calibration of MAS NMR probes at arbitrary spinning speeds. Solid State NMR 2010, 38, 74–76. [Google Scholar] [CrossRef] [PubMed]
Figure 1. Unit cell of a cobaltocene/nickelocene solid solution (molar ratio 50/50) obtained by dry grinding of the crystalline components. The schematic presentation was created using the data of the single crystal X-ray structure of ferrocene [5].
Magnetochemistry 10 00058 g001
Figure 2. 1H MAS NMR spectra of solid solutions of Cp2Fe (1) and Cp2Co (3), prepared by grinding, with the indicated molar ratios. The two most intensive peaks are the isotropic lines, the smaller ones are rotational sidebands.
Magnetochemistry 10 00058 g002
Figure 3. Residual linewidths of the Cp2Fe (1) and Cp2Co (3) 1H MAS signals for solid solutions with the indicated molar ratios. The spinning speed was 10 kHz.
Magnetochemistry 10 00058 g003
Figure 4. Graphical display of the rotational sideband intensities for the 1H MAS signal of Cp2Fe (1), mixed with Cp2Co at the indicated molar ratios. The intensity of the isotropic line was set to the value 1.0. The downfield sidebands of the first and second order are labeled I1 and I2, and the sidebands on the upfield side are I–1 and I‒2.
Magnetochemistry 10 00058 g004
Figure 5. 1H MAS spectra of solid solutions of Cp2Co (3) and Cp2Ni (2) with the indicated molar ratios. The peaks with the highest intensities are the isotropic lines, all other peaks are rotational sidebands.
Magnetochemistry 10 00058 g005
Table 1. 1H MAS NMR chemical shifts δ of the isotropic lines of the ferrocene (1) and cobaltocene (3) signals in a solid solution of the components with the indicated molar ratios at a spinning speed of 10 kHz.
Molar Ratio
Cp2Fe/Cp2Co
(%/%)
δ(1H) (ppm)
Cp2FeCp2Co
0/100−50.51
10/903.68−50.72
20/803.70−50.77
30/703.73−50.77
40/603.82−50.80
50/503.84−50.90
60/403.90−50.92
70/303.86−50.90
80/203.90−50.97
90/104.11−50.85
100/04.22
Table 2. 1H MAS NMR halfwidths Δν1/2 of the isotropic lines of ferrocene (1) and cobaltocene (3) in their solid solutions with the indicated molar ratios. The spinning speed was 10 kHz.
Molar Ratio
Cp2Fe/Cp2Co
(%/%)
Δν1/2 (kHz)
Cp2FeCp2Co
0/1001.18
10/901.851.30
20/801.251.16
30/701.031.25
40/600.921.21
50/500.911.20
60/400.901.23
70/300.861.26
80/200.811.22
90/100.811.21
100/00.81
Table 3. The 1H T1 relaxation times (ms) of the Cp resonances in Cp2Fe/Cp2Co solid solutions, prepared by crystallization from solution, were obtained by fittings with a stretched exponential f(t) = exp(−τ/T1)β. All data were obtained at 10 kHz rotational speed, except for the 50/50 entry (11 kHz).
Molar Ratio
Cp2Fe/Cp2Co
(%/%)
1H T1 (β) (ms)
Cp2FeCp2Co
0/1001.3 (0.46)
20/804.2 (0.36)2.0 (0.85)
30/705.9 (0.20)2.4 (0.54)
40/607.3 (0.46)2.0 (0.50)
50/508.4 (0.40)2.5 (0.55)
60/4014 (0.62)2.3 (0.63)
70/3023 (0.69)2.1 (0.47)
80/2031 (0.73)2.4 (0.52)
100/014,000
Table 4. 1H MAS NMR chemical shifts of the isotropic lines of the signals of Cp2Co (3) and Cp2Ni (2) in a solid solution of the components with the indicated molar ratios at a spinning speed of 10 kHz.
Molar Ratio
Cp2Co/Cp2Ni
(%/%)
δ(1H) (ppm)
Cp2CoCp2Ni
100/0−50.51
90/10−50.78−245.9
80/20−50.73−245.1
70/30−50.82−245.4
60/40−50.85−245.8
50/50−50.92−245.9
40/60−50.87−245.8
30/70−51.07−245.4
20/80−51.86−245.8
10/90−51.88−245.9
0/100−245.4
Table 5. 1H MAS NMR halfwidths Δν1/2 of the isotropic lines of the Cp2Co (3) and Cp2Ni (2) signals in a solid solution of the components with the indicated molar ratios at a spinning speed of 10 kHz.
Molar Ratio
Cp2Co/Cp2Ni
(%/%)
Δν1/2 (kHz)
Cp2CoCp2Ni
100/01.38
90/101.392.57
80/201.372.49
70/301.392.46
60/401.452.42
50/501.392.41
40/601.362.55
30/701.402.69
20/801.392.54
10/901.562.59
0/1002.62
Disclaimer/Publisher’s Note: The statements, opinions and data contained in all publications are solely those of the individual author(s) and contributor(s) and not of MDPI and/or the editor(s). MDPI and/or the editor(s) disclaim responsibility for any injury to people or property resulting from any ideas, methods, instructions or products referred to in the content.

