Article

Saccharomyces cerevisiae and Candida albicans Yeast Cells Labeled with Fe(III) Complexes as MRI Probes

1
Department of Chemistry, University at Buffalo, The State University of New York, Amherst, NY 14260, USA
2
Department of Cell Stress Biology, Roswell Park Comprehensive Cancer Center, Buffalo NY 14263, USA
3
Department of Biology, University at Buffalo, The State University of New York, Amherst, NY 14260, USA
*
Author to whom correspondence should be addressed.
Magnetochemistry 2020, 6(3), 41; https://doi.org/10.3390/magnetochemistry6030041
Submission received: 13 August 2020 / Revised: 29 August 2020 / Accepted: 31 August 2020 / Published: 4 September 2020
(This article belongs to the Special Issue Transition-Metal Contrast Agents for MRI)

Abstract

:
The development of MRI probes is of interest for labeling antibiotic-resistant fungal infections based on yeast. Our work showed that yeast cells can be labeled with high-spin Fe(III) complexes to produce enhanced T2 water proton relaxation. These Fe(III)-based macrocyclic complexes contained a 1,4,7-triazacyclononane framework, two pendant alcohol groups, and either a non-coordinating ancillary group and a bound water molecule or a third coordinating pendant. The Fe(III) complexes that had an open coordination site associated strongly with Saccharomyces cerevisiae upon incubation, as shown by screening using Z-spectra analysis. The incubation of one Fe(III) complex with either Saccharomyces cerevisiae or Candida albicans yeast led to an interaction with the β-glucan-based cell wall, as shown by the ready retrieval of the complex by the bidentate chelator called maltol. Other conditions, such as a heat shock treatment of the complexes, produced Fe(III) complex uptake that could not be reversed by the addition of maltol. Appending a fluorescence dye to Fe(TOB) led to uptake through secretory pathways, as shown by confocal fluorescence microscopy and by the incomplete retrieval of the Fe(III) complex by the maltol treatment. Yeast cells that were labeled with these Fe(III) complexes displayed enhanced water proton T2 relaxation, both for S. cerevisiae and for yeast and hyphal forms of C. albicans.

Graphical Abstract

1. Introduction

Many applications involve the use of chemical probes for tracking various types of cells. For example, tracking mammalian cells is important for cell therapy approaches, whereas the monitoring of microbes may be useful for studying infections. Cell therapy is an emerging method in regenerative medicine with applications in cancer therapy, treating genetic disorders, and enabling the repair of damaged cells [1,2,3]. In certain cell therapy applications, the cells are modified ex vivo and later implanted into the body. Imaging these cells in vivo would provide real-time distribution information and allow for the assessment of the therapeutic cells. One imaging modality, MRI, has the advantages of unlimited depth penetration, high spatial resolution, and the use of non-ionizing radiation. Mammalian cells labeled with paramagnetic MRI contrast agents have been employed in preclinical studies [2,4,5,6]. The cell-labeling approach may be extended to image bacterial and fungal pathogens to investigate the onset and progression of infectious diseases. To date, there are several reports of PET (positron emission tomography) probes for the in vivo imaging of bacteria or fluorescent agents [7,8]. However, chemical probes that facilitate the MR imaging of microbial infections, such as fungal infections, are underdeveloped.
Over 90% of fungal infections are caused by commensal Candida species, termed candidiasis, which are a major cause of mortality in immunocompromised patients, despite the availability of antifungal treatments [9,10,11,12,13,14]. Candidiasis is caused by several fungal species, including Candida albicans, which typically resides on the mucocutaneous surfaces of the human body. It is a polymorphous fungus, as shown by its ability to undergo morphogenic changes (yeast, pseudohypha, and hypha) that are triggered by environmental factors [10,14,15,16]. There is a strong correlation between the yeast-to-hyphal state transformation and pathogenicity of C. albicans [9,11,17,18]. The commensal nature of C. albicans and the seriousness of the infections caused by these organisms calls for better diagnostic procedures and more sophisticated disease models, as well as tools for studying infections.
Despite the impressive soft-tissue contrast in MRI, the images of yeast are dependent on the structural abnormalities caused by the infection [19,20]. Often, immunocompromised patients with widespread infections are the subjects of these studies [19,21,22]. There is a critical need for a non-invasive and accurate diagnostic test for fungal infections. Furthermore, tools for tracking yeast in vivo through imaging to study infections in animal models would be useful for monitoring therapeutic treatments [23].
Our group has developed a new class of high-spin Fe(III) complexes that are effective MRI contrast agents [24,25,26]. These robust complexes display a promising T1 MRI contrast, both during in vivo and in vitro experiments. All complexes contain a triazacyclononane (TACN) framework with two or three coordinating hydroxypropyl pendants to bind the small Fe(III) metal ion and stabilize the trivalent oxidation state (Scheme 1). The hydroxypropyl groups provide strong interactions with second-sphere water to increase the relaxivity. Four of the complexes studied here (Fe(TOB), Fe(TOBA), Fe(TOD), and Fe(TASO)) have a water molecule as the sixth ligand to increase the water proton relaxivity. Notably, this open coordination site is important for producing complexes that bind to small molecules, such as bidentate chelates, as well as macromolecules, such as polymeric β-glucan particles (β-GPs) [27]. Two of the complexes, Fe(TOT) and Fe(TOTz), are coordinatively saturated and lack an inner-sphere water such that these complexes have limited interactions with biopolymers or other ligands. All complexes have a single deprotonated hydroxypropyl pendant and an overall cationic charge.
In this study, we screened six high-spin Fe(III) complexes shown in Scheme 1 and studied the feasibility of labeling Saccharomyces cerevisiae (Baker’s yeast), which is a model organism with properties related to many species, including pathogens. The most promising derivatives were also studied on pathogenic C. albicans. The cell association was optimized in S. cerevisiae using heat shock and endocytosis. Endocytosis was found to be the most efficient mode of cell treatment and was used to label C. albicans with Fe(TOB). Fe(TOD), a fluorescent analog of Fe(TOB) enabled us to investigate the localization of these complexes in cells [27]. A previous study in our group visualized yeast cells using an Fe(III) complex containing a coumarin dye, but the complex was not sufficiently soluble for loading cells with high concentrations of a paramagnetic complex [26]. The nature of the cellular association and localization of Fe(TOB) or Fe(TOD) labeling of cells was further probed by using a small molecule chelator, namely, maltol, which we have shown can sequester Fe(III) complexes from glucan particles derived from yeast via the formation of a ternary adduct [27]. We show here that both S. cerevisiae and C. albicans displayed enhanced R2 relaxation properties when labeled with the Fe(TOB) complex.

2. Results

2.1. Yeast Cell Culture

The experiments with the Fe(III) coordination complexes were conducted on S. cerevisiae and subsequently extended to C. albicans. The yeast cells used in the study were S. cerevisiae of the Sigma1278b strain background [28]. The specific strain used (PC538) is a typical wild-type (WT) strain with the following genotype: MATa ste4 FUS1-HIS3 FUS1-lacZ ura3-52 [29], which was used for all experiments in the study. The samples were normalized relative to the total protein content (biomass) to compare cell labeling across the strains [30]. A linear relationship between the optical density of cultures and the total protein content was obtained (Figures S12–S14). Samples were prepared by adjusting the optical densities to normalize the protein content for the experiments.

2.2. Labeling Yeast Cells

Endocytosis and heat shock incubation were employed to study the cellular association of Fe(TOB) in S. cerevisiae [31]. Both techniques exhibited promising iron complex cell association, as analyzed using ICP-MS. Endocytosis was chosen as the preferred method since it induces less stress in the cells. Briefly, the cells were grown to mid-log phase, harvested through centrifugation, and washed with 1× PBS before the Fe(III) complex treatment. The cells were incubated with the complex in 1× PBS for 30 min, and post incubation, the cells were collected and washed with a 1× PBS buffer. The C. albicans were treated with Fe(TOB) using the optimized endocytosis protocol in S. cerevisiae. The resulting cell pellet was yellow-orange due to the Fe(TOB) loading (Figure S1). All subsequent studies with Fe(III) complexes used endocytosis for labeling. Endocytosis was used for the labeling of S. cerevisiae with Fe(TASO), Fe(TOBA), Fe(TOT), or Fe(TOTz). These complexes were chosen based on their effective r1 and r2 relaxivity, which is the highest for the Fe(TOB), Fe(TOBA), and Fe(TASO) complexes that have an inner-sphere water (Table S1). Notably, the r2 values for Fe(TOB) and Fe(TOBA) are similar to those of Gd(DTPA) at 4.7 T and 37 °C within experimental error. The r1 value of Fe(TOB) is approximately 70% of Gd(DTPA) under these conditions [25].

2.3. Z-Spectra Measurements

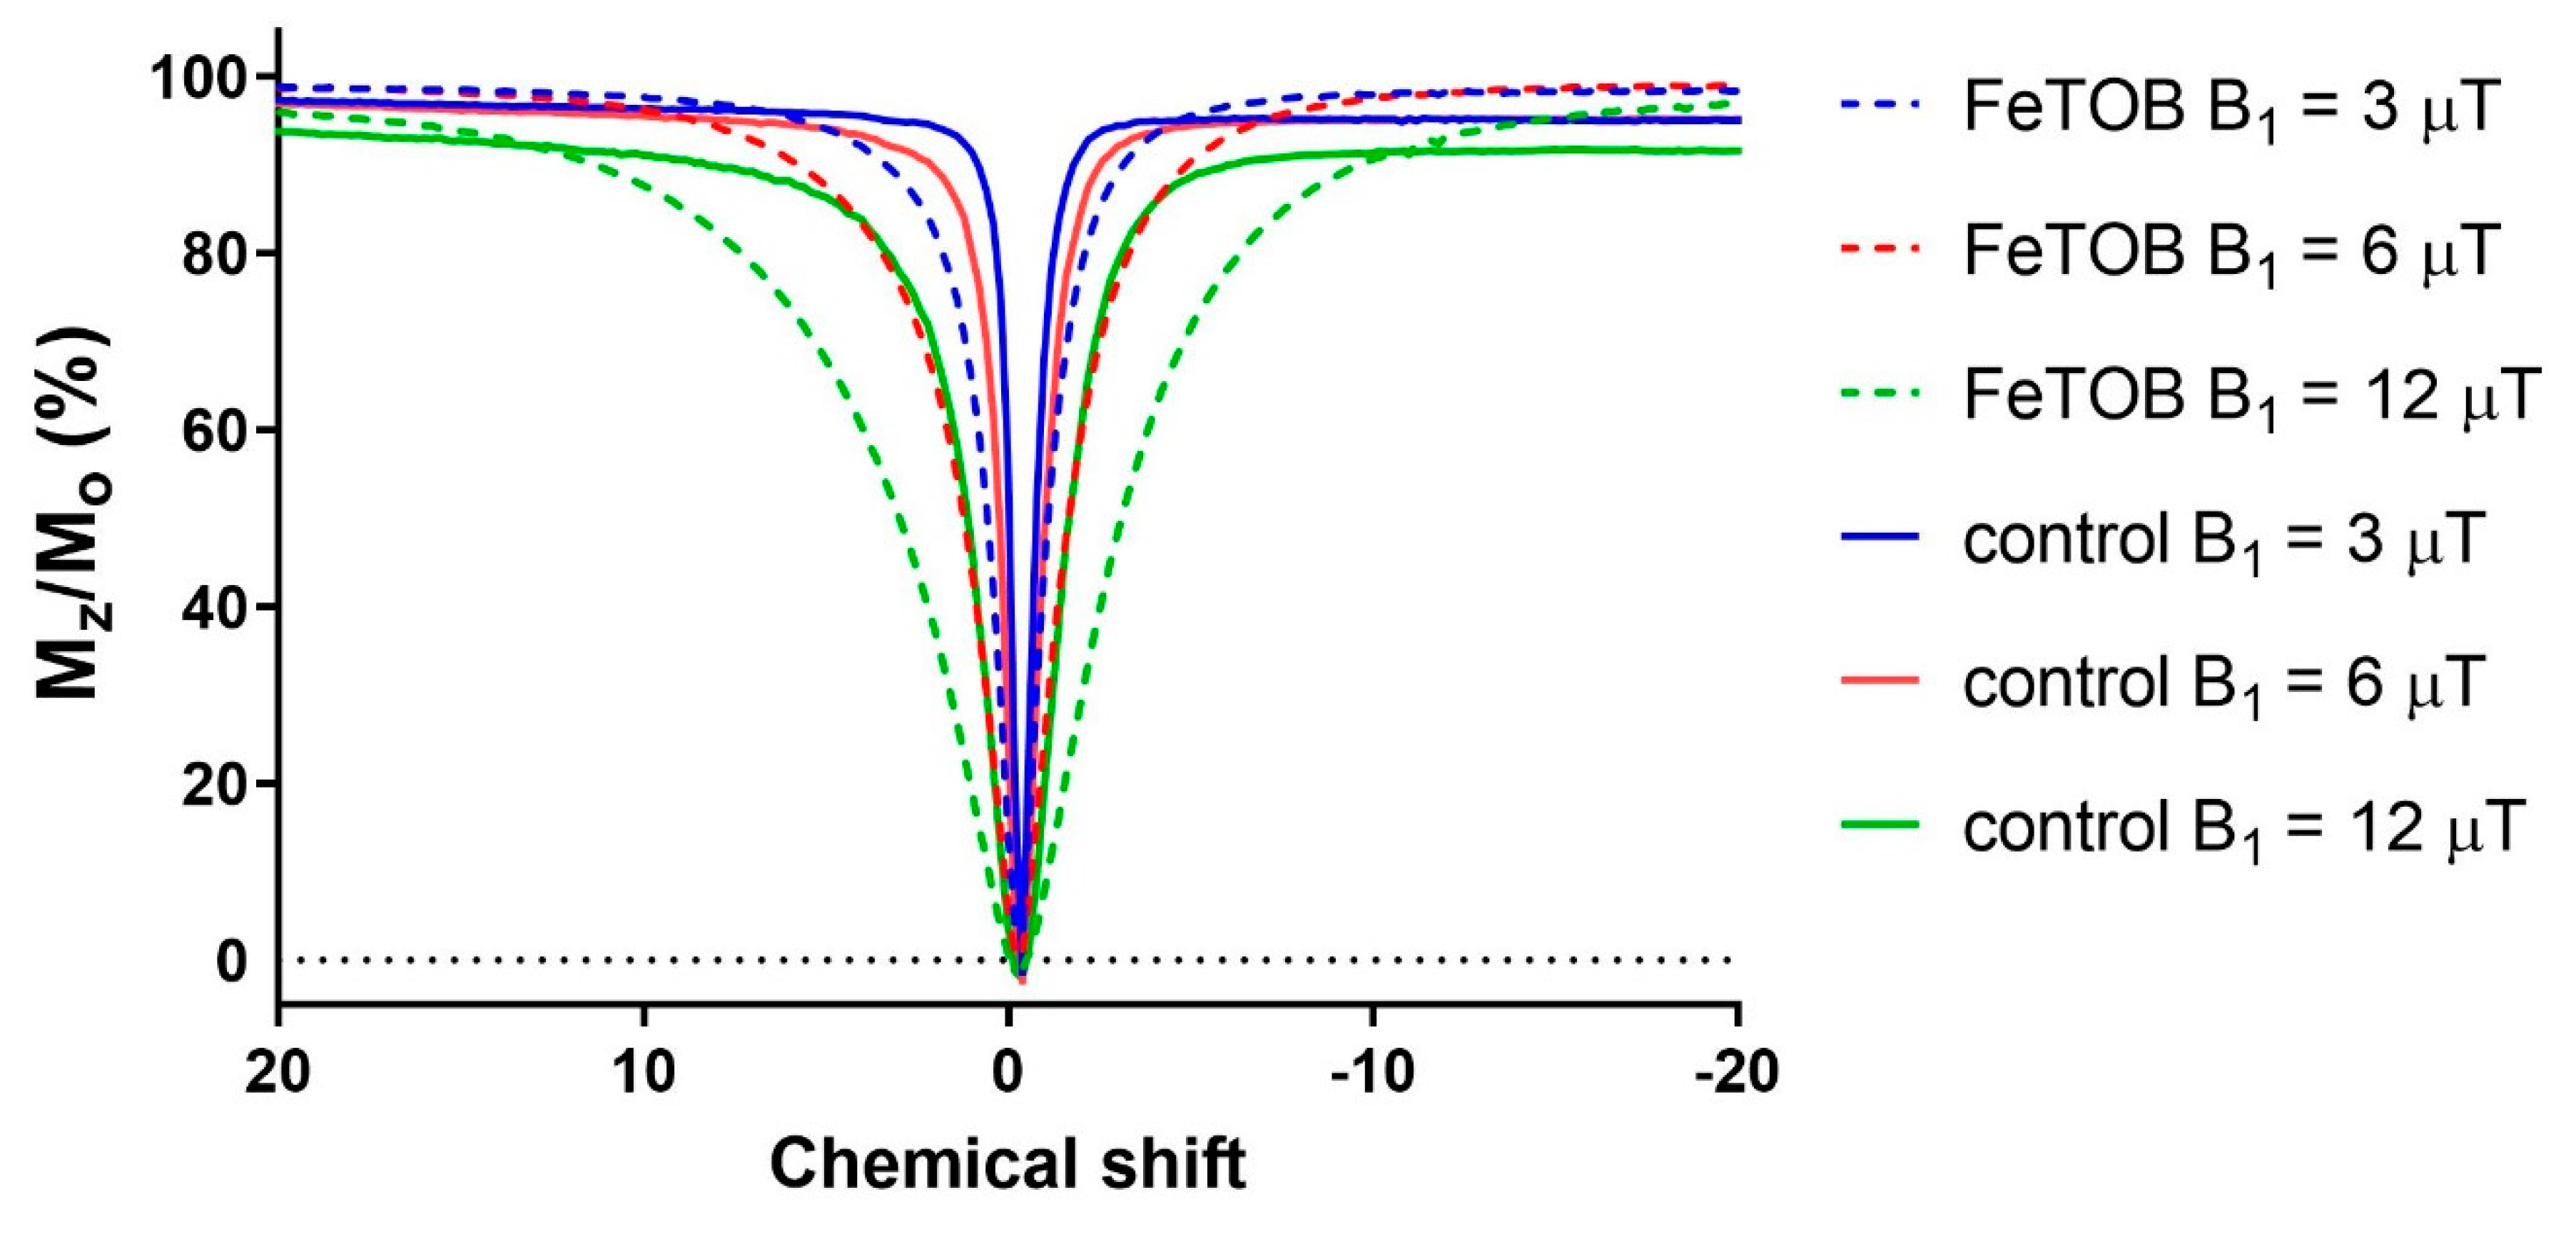
The S. cerevisiae samples were incubated with the Fe(III) complexes and the Z-spectra were recorded as an initial screen of labeling. Following harvesting and rinsing, the cells were suspended in 1× PBS and transferred to NMR tubes for Z-spectra measurements at irradiation powers of B1 = 3, 6, and 12 µT. Z-spectra are plots of the magnetization intensity of the bulk water signal upon irradiation with a pre-saturation radiofrequency pulse that is typically from 40 ppm to −40 ppm at 0.5 ppm intervals. The data are expressed as the percent reduction in the water proton magnetization (Mz/Mo). Z-spectra arise from contributions from T2 and magnetization transfer effects, and may display asymmetry from chemical exchange saturation transfer (CEST) effects. At the outset of these studies, we hypothesized that the Fe(III) complexes would shift the water proton pool of the yeast cells to give rise to a CEST effect, as we have observed in Fe(III) containing shrunken liposomes [32]. Lanthanide-containing liposomes show both CEST and broadening of the Z-spectra from T2-based magnetic susceptibility effects of paramagnetic complexes encapsulated in non-spherical compartments [33].
The S. cerevisiae samples labeled through endocytosis showed broadening of the Z-spectra (Figure 1, Figures S4 and S5) for the complexes that had an open coordination site, including Fe(TOB), Fe(TOBA), and Fe(TASO). The broadening was most pronounced for the heat shock treatment with Fe(TOB) (Figure S3). No apparent broadening of the Z-spectra was observed when S. cerevisiae were treated with Fe(TOT) or Fe(TOTz) using similar incubation protocols (Figures S6 and S7). We suspected that an interaction between Fe(TOB), Fe(TOBA), or Fe(TASO) and β-D-glucan present in the cell wall of S. cerevisiae was responsible for the increased broadening of the Z-spectra. Supporting this postulate is a report showing that Fe(TOB) interacts with glucan particles derived from yeast cells, but Fe(TOT) has a much weaker interaction [27]. Further studies focused on Fe(TOB) or the fluorescent analog, Fe(TOD), for the labeling of yeast.
Both C. albicans budding yeast and hyphae phenotypes were labeled with Fe(TOB) using endocytosis. The yeast phenotype exhibited similar broadening in the Z-spectra as that observed from S. cerevisiae yeast (Figure S8). On the other hand, C. albicans hyphae displayed enhanced broadening in the Z-spectra (Figure S9). The filamentous shape of the hyphae likely caused the enhanced magnetic susceptibility, resulting in greater T2 effects, as discussed below.

2.4. Fluorescence Microscopy on S. cerevisiae

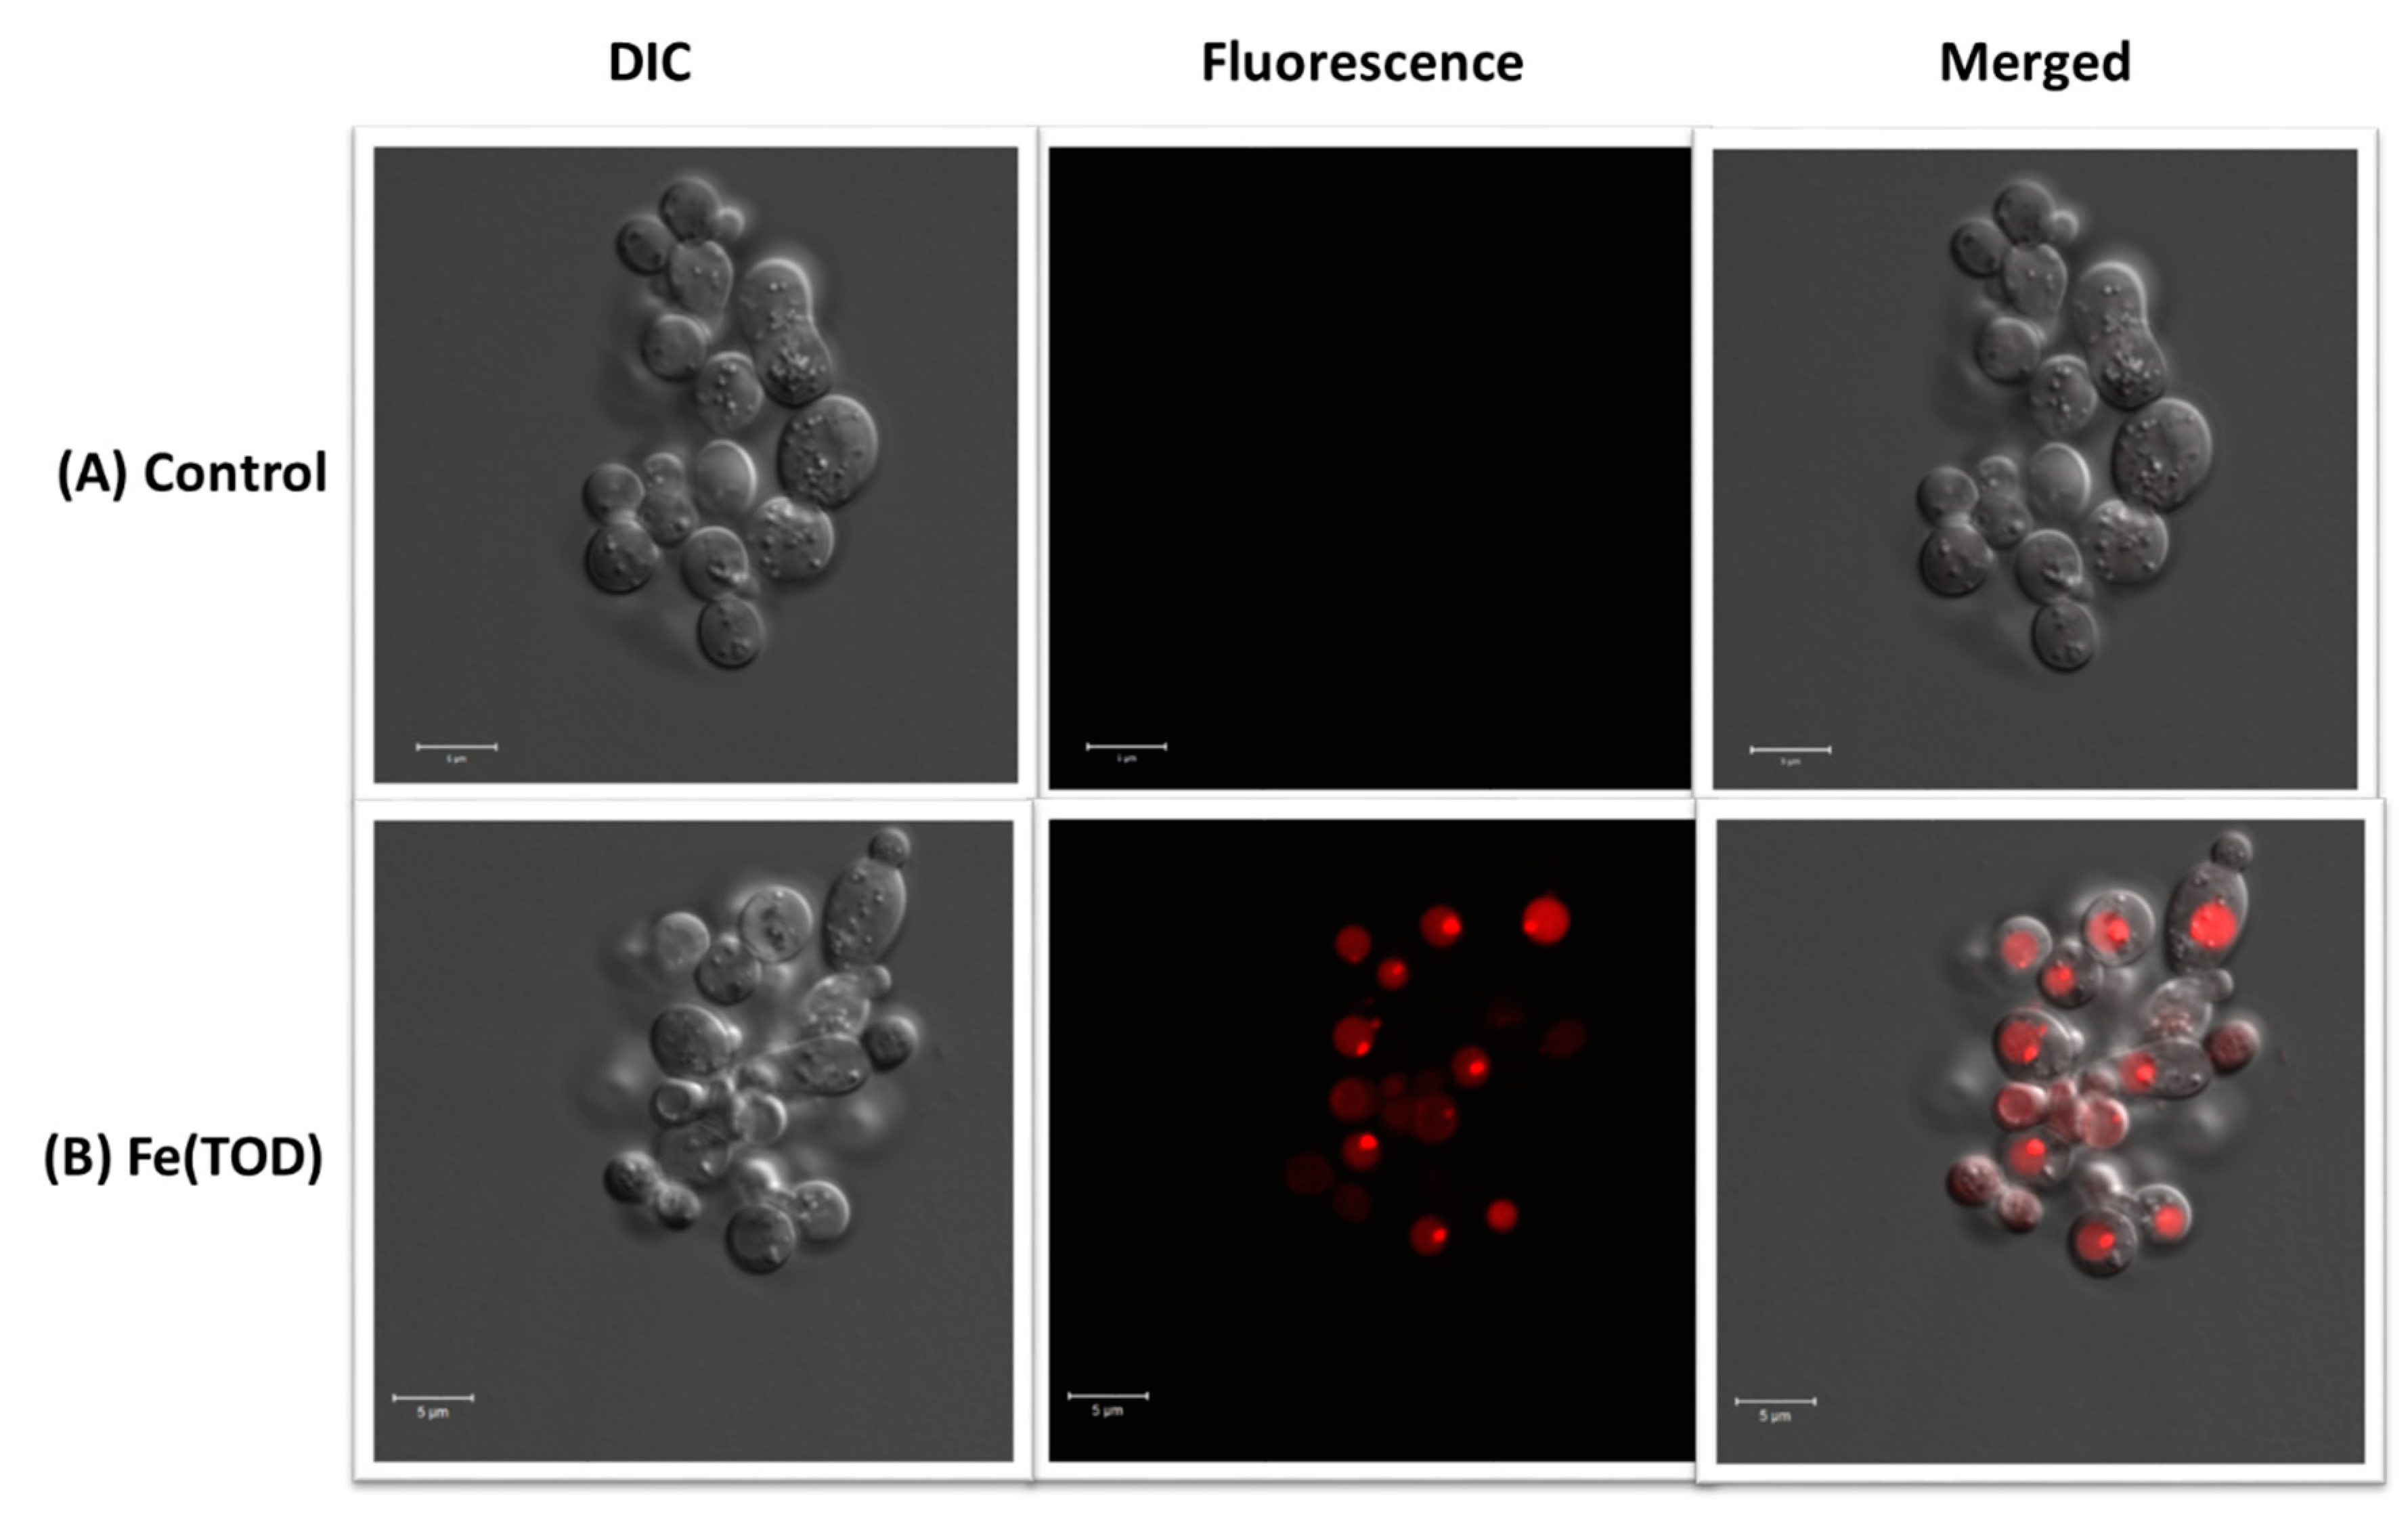
The S. cerevisiae cells were treated with Fe(TOD) to investigate the localization of iron complexes in endocytosis. The photophysical properties of Fe(TOD) are reported in the literature [27]. The S. cerevisiae cells were treated with 10 mM Fe(TOD) and incubated for 30 min at 30 °C. The cells were harvested and imaged with confocal fluorescence microscopy (Figure 1). The Fe(TOD) complex exhibited organeller compartmentalization that was most likely due to the complex being inside a vacuole [31]. No apparent fluorescence was observed in the control cells under the same imaging conditions.

2.5. Sequestration of Fe(III) Complexes from Yeast with a Bidentate Chelator

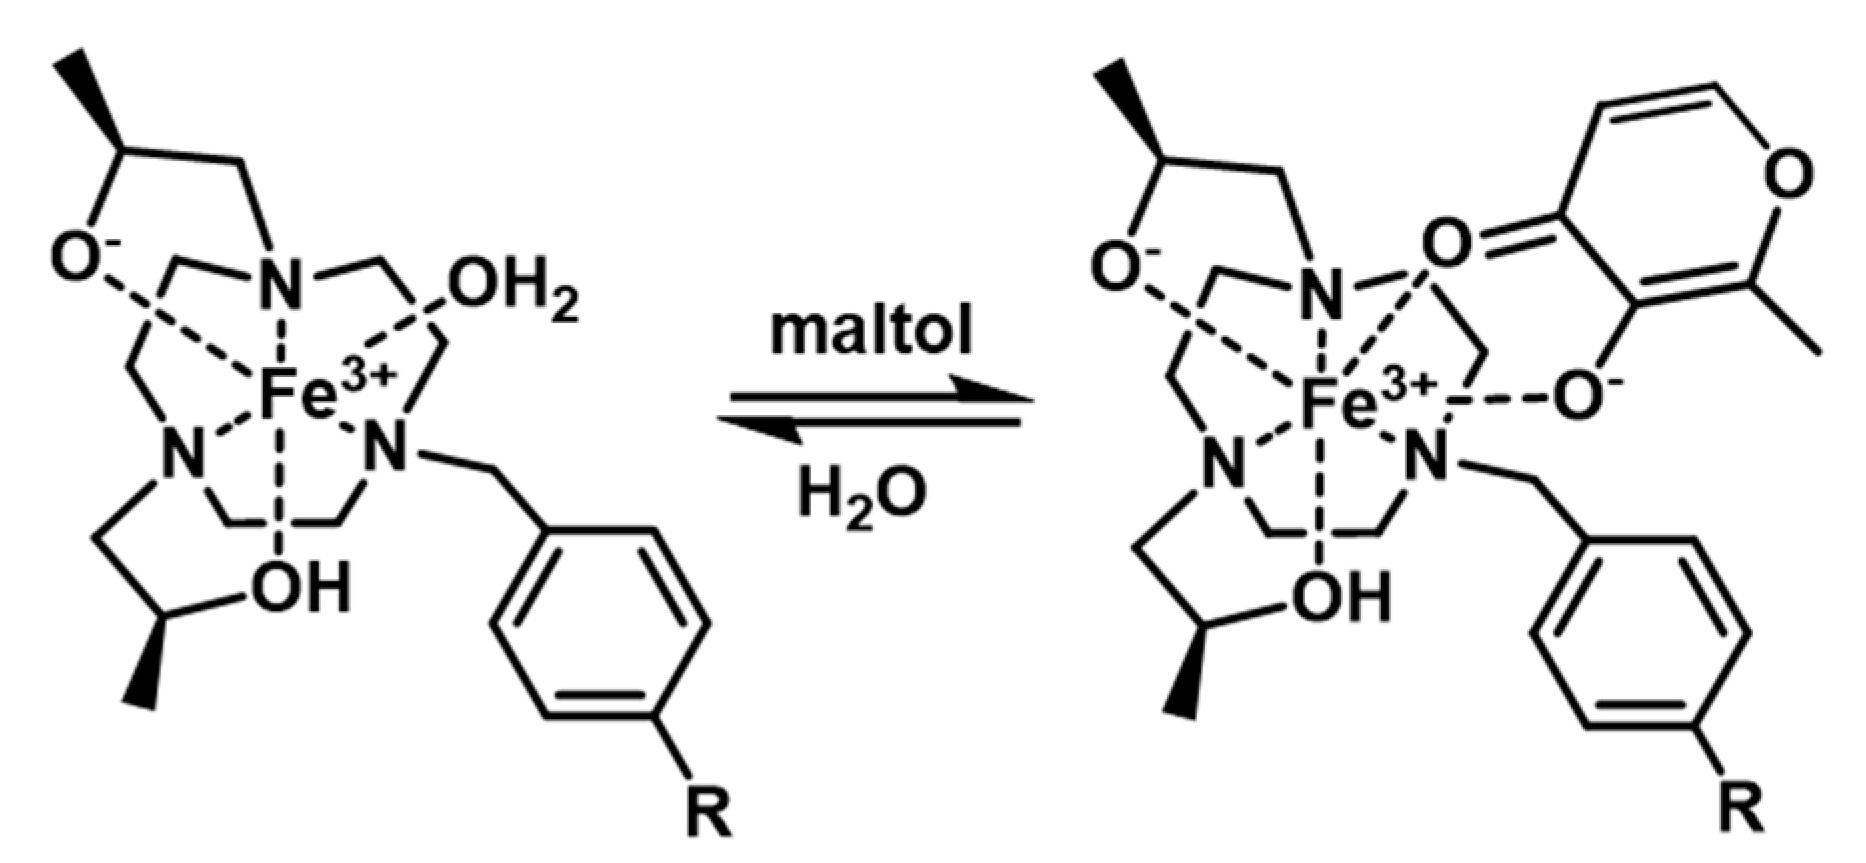
Certain bidentate chelates, such as maltol, bind strongly to Fe(TOB) or Fe(TOD) to produce a ternary complex in which the macrocyclic ligand is retained [27]. Treatment with maltol can be used as a tool to study the release of Fe(TOB) or Fe(TOD) from labeled glucan particles [27]. Along similar lines, maltol treatments of Fe(TOB)-labeled S. cerevisiae and C. albicans were monitored through NMR spectroscopy, ICP-MS, and cell viability experiments. The Fe(TOB)-labeled cells were treated with 10 mM of maltol solution and incubated at 30 °C for 3 h. The cell media turned red after the maltol treatment, indicating the formation of the Fe(TOB)–maltol ternary complex. The cells were washed and normalized relative to the total protein content for the experiments.

2.6. Determination of the Fe Content in the Yeast

The cellular associations of the Fe(III) complexes were determined using ICP-MS measurements of total iron content in the cells (Figure 2 and Figure S11). The Fe content was normalized relative to the total protein content to compare different S. cerevisiae and C. albicans phenotypes [34]. The Fe(III)-complex-labeled cells displayed a significantly higher iron content compared to the control cells in both S. cerevisiae and C. albicans.
Among the various cell-labeling methods used to study S. cerevisiae, endocytosis displayed significantly higher Fe(TOB) cell association than heat shock. This was surprising given the large broadening observed in the Z-spectra for heat-shock-labeled samples, which suggests that cellular localization was important (Figure 2A). In comparison, Fe(TOT) displayed only 25% of the cellular association in live yeast cells compared to that observed with Fe(TOB). The lowered amount of Fe(TOT) in the yeast was comparable to the lower loading observed in β–glucan-based cell wall particles [27]. This observation suggests that the labeling of the yeast cells with Fe(III) complexes is dependent on both the charge and coordination sphere of the treated complexes. The S. cerevisiae labeled with Fe(TASO) and Fe(TOBA) showed iron levels that were roughly comparable to those of Fe(TOB), whereas Fe(TOTz)-labeled cells were at 25% compared to those observed for Fe(TOB).
The maltol treatment used on the control samples did not show any significant change in the iron content, suggesting that maltol could not sequester iron from endogenous proteins or native iron pools. The maltol treatment of Fe(TOB)-treated cells restored the iron content to the pre-Fe(TOB) treatment levels during endocytosis (Figure 2A). However, the maltol treatment of Fe(TOB)-heat-treated cells did not restore the iron content of the cells to the pre-Fe(TOB) treatment levels. This result further substantiates a secretory pathway localization of the complex during a heat shock treatment.
The maltol treatment of cells labeled with Fe(TOD) during endocytosis did not decrease the iron levels to those of the control (Figure 2A). Given that confocal fluorescence microscopy suggested organeller localization of Fe(TOD), the Fe(TOD)–maltol complex would need to cross the organeller membrane, followed by the cell membrane and the cell wall, to sequester the complex out of the cells. This process may be slow enough that it was not complete after 3 h, or may not be feasible in the cells. The maltol treatment of cells labeled with Fe(TOT) did not reduce the iron levels to that of the control. This result is consistent with the fact that Fe(TOT) cannot form the ternary complex with maltol [27].
The C. albicans budding yeast cells displayed the highest iron content per protein concentration, followed by C. albicans hyphae and S. cerevisiae. The maltol treatment of the Fe(TOB)-endocytosis-labeled C. albicans or S.cerevisiae cells restored the iron content to that of the untreated cell levels (Figure 2B).

2.7. Scanning Electron Microscopy (SEM) Experiments

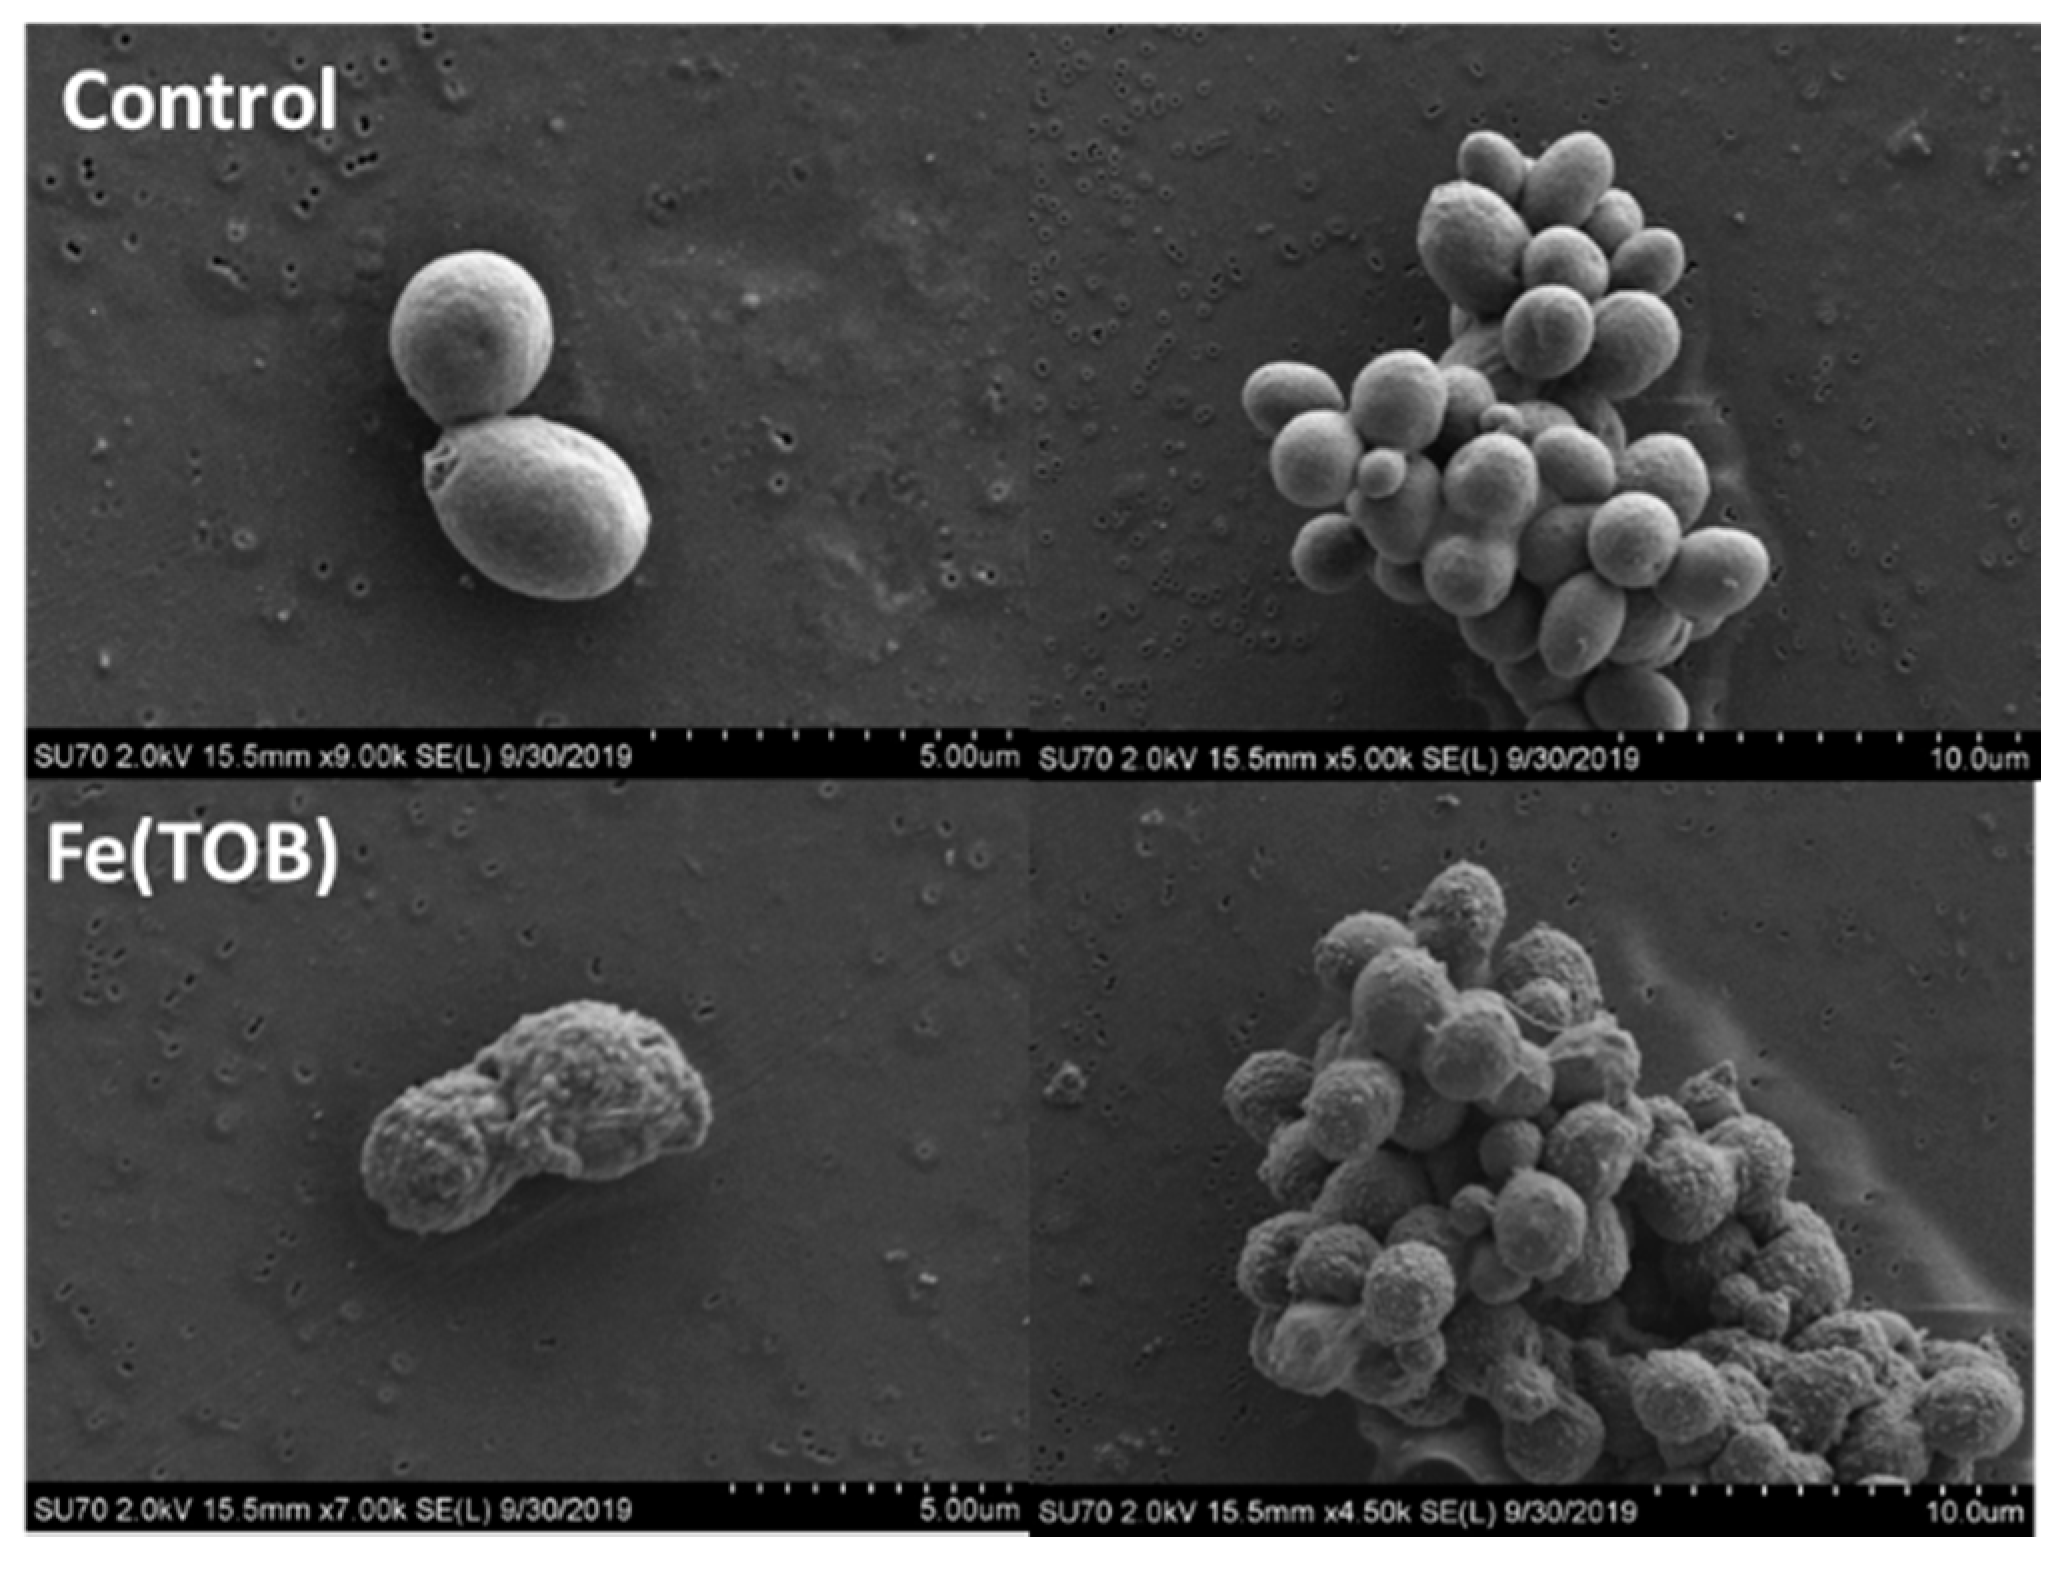
The Fe(TOB)-labeled S. cerevisiae cells were characterized using SEM (Figure 3). An inspection of the micrographs suggests that there were drastic changes in the cell surface morphology, which supported the interaction of the complex with the cell wall. This result was supported by the fact that the Fe(TOB) complex binds strongly to β-glucan polymer, which is abundantly present in the cell wall [35]. The exact nature of the interaction is not clear but is facilitated by the open coordination site of the Fe(III) complexes, suggesting that the Fe(III) binds to a component of the β-glucan polymer.

2.8. Optimizing the Matrix for T1 and T2 Water Proton Relaxation Measurements

It is important to evaluate the imaging agents in a matrix to simulate tissue [36,37]. For cell studies, the ideal matrix should mimic the extracellular tissue environment with a low background signal. Furthermore, the gel formation should be reproducible and the gel matrix should suspend the cells during the NMR/MRI acquisition experiment window. Other practical factors, including a moderate gelation time, the potential for microbial growth, and the cost were also taken into account for the selection of the matrix. Based on these criteria, bovine skin collagen, agarose, and gelatin were chosen as potential matrices for the proton relaxivity experiments.
Gelatin is hydrolyzed collagen and contains smaller peptides compared to collagen [38]. It is inexpensive and is commonly used as a gelling agent in food and drugs [39,40]. Gelatin was used in concentrations of 2–20% (w/v) to prepare gels. The gelation times for gelatin were relatively lengthy and provided enough time to suspend the cells upon reaching room temperature. The background T2 value did not change significantly with the increase in the gelatin concentration (Figure S17). In contrast, the gelation of collagen was not as reproducible for the suspension of cells.
Agarose gel phantoms have been used extensively in NMR phantom experiments [41,42]. The agarose gelled too quickly and also produced very broad Z-spectra (Figure S18). However, the samples suspended in 0.05% (w/v) agarose displayed high background T2 water proton shortening, reducing the contrast between the Fe(TOB)-labeled and control cell samples on a 4.7 T animal MRI scanner at 37 °C (Figure S16). Similarly, only small differences in the broadening of the Z-spectra were observed for the agarose blank, control, and Fe(TOB)-labeled cells in the 9.4 T NMR spectrometer (Figure S15). Agarose forms a structurally defined matrix with an ordered hydration sphere, leading to more efficient spin–spin (T2) proton relaxation [43,44,45].
For further NMR experiments, the gelatin composition was optimized to 15% (w/v) for suspending yeast cells. The gels polymerized over time, leading to sharp water resonances in the 1H NMR spectra (Figure S19) and the Z-spectra had less broadening (Figure S18). As a result of the polymerization, the difference in the rate constants associated with water proton T2 processes between the blank and cell experiments was more pronounced. The gelatin gel was able to uniformly suspend the yeast cells for 2.5 h at 37 °C. Based on these results, the optimal experimental window was found to be up to 2.5 h after gelation.
The serial dilution assays with S. cerevisiae and C. albicans on 15% (w/v) gelatin solid plate did not show any significant growth, even after 2 days, supporting the sterility of the media (Figure S21). The serial dilution spots were inoculated on a fresh YEPD media plate and grown for 2 days at 30 °C. The resulting media plate displayed the growth of all the serial dilution cells (Figure S22). This observation implies that cell proliferation was slow in the absence of media in the 15% (w/v) gelatin matrix during the duration of the NMR experiment.

2.9. T1 and T2 Water Proton Relaxation Measurements of C. albicans Cells

The Fe(TOB)-treated and control cells were suspended in 15% (w/v) gelatin. The T1 water proton shortening was minimal in both phenotypes of Fe(TOB)-labeled C. albicans. Moreover, there was no statistical difference between the control and Fe(TOB)-labeled cells in both the hyphae and yeast phenotypes (Figure S23) when normalized for protein content. Such quenching of the T1 agents in cells is reported in the literature and was attributed to a slow water exchange through the cell wall of the yeast [26]. Additionally, the hydrophobicity of the cell wall may contribute to a lowered water exchange [27].
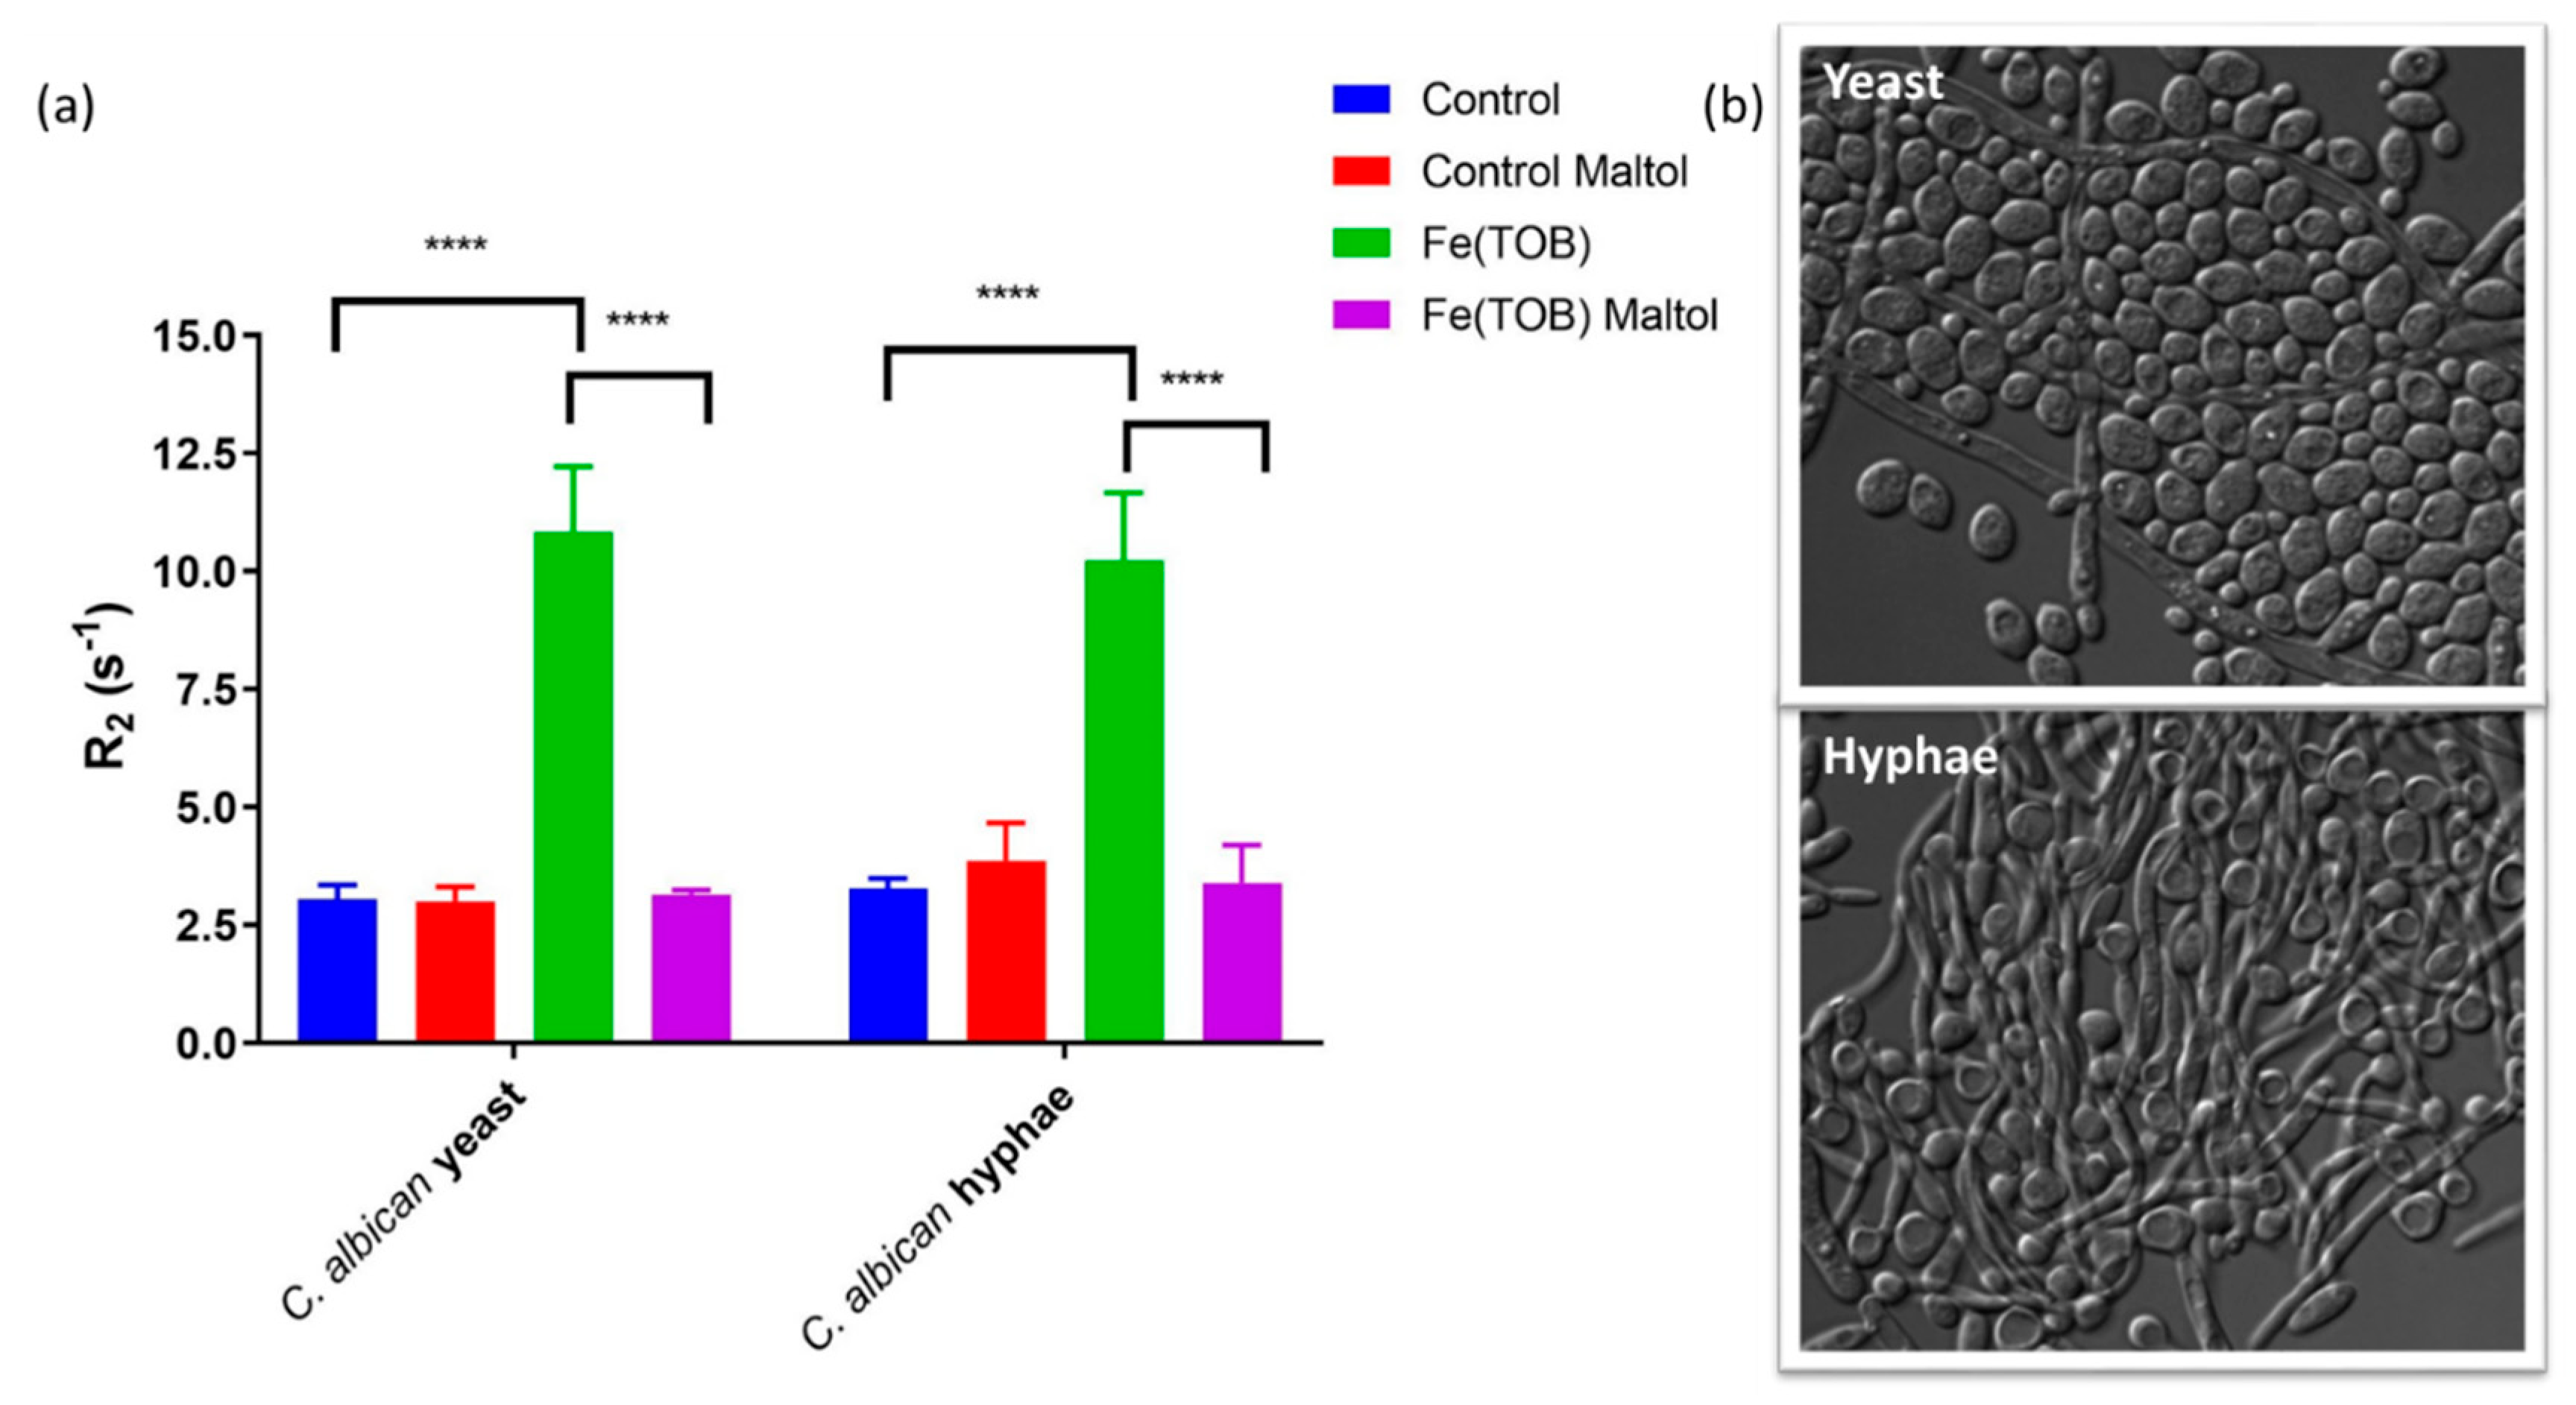
On the other hand, the modulation of T2 water proton relaxation, expressed as a rate constant (R2), was significantly enhanced in Fe(TOB)-labeled samples for both phenotypes (Figure 4). The maltol treatment restored the T2 proton relaxation, expressed as the R2 rate constant, to that of the untreated cells for Fe(TOB)-labeled cells in both phenotypes.
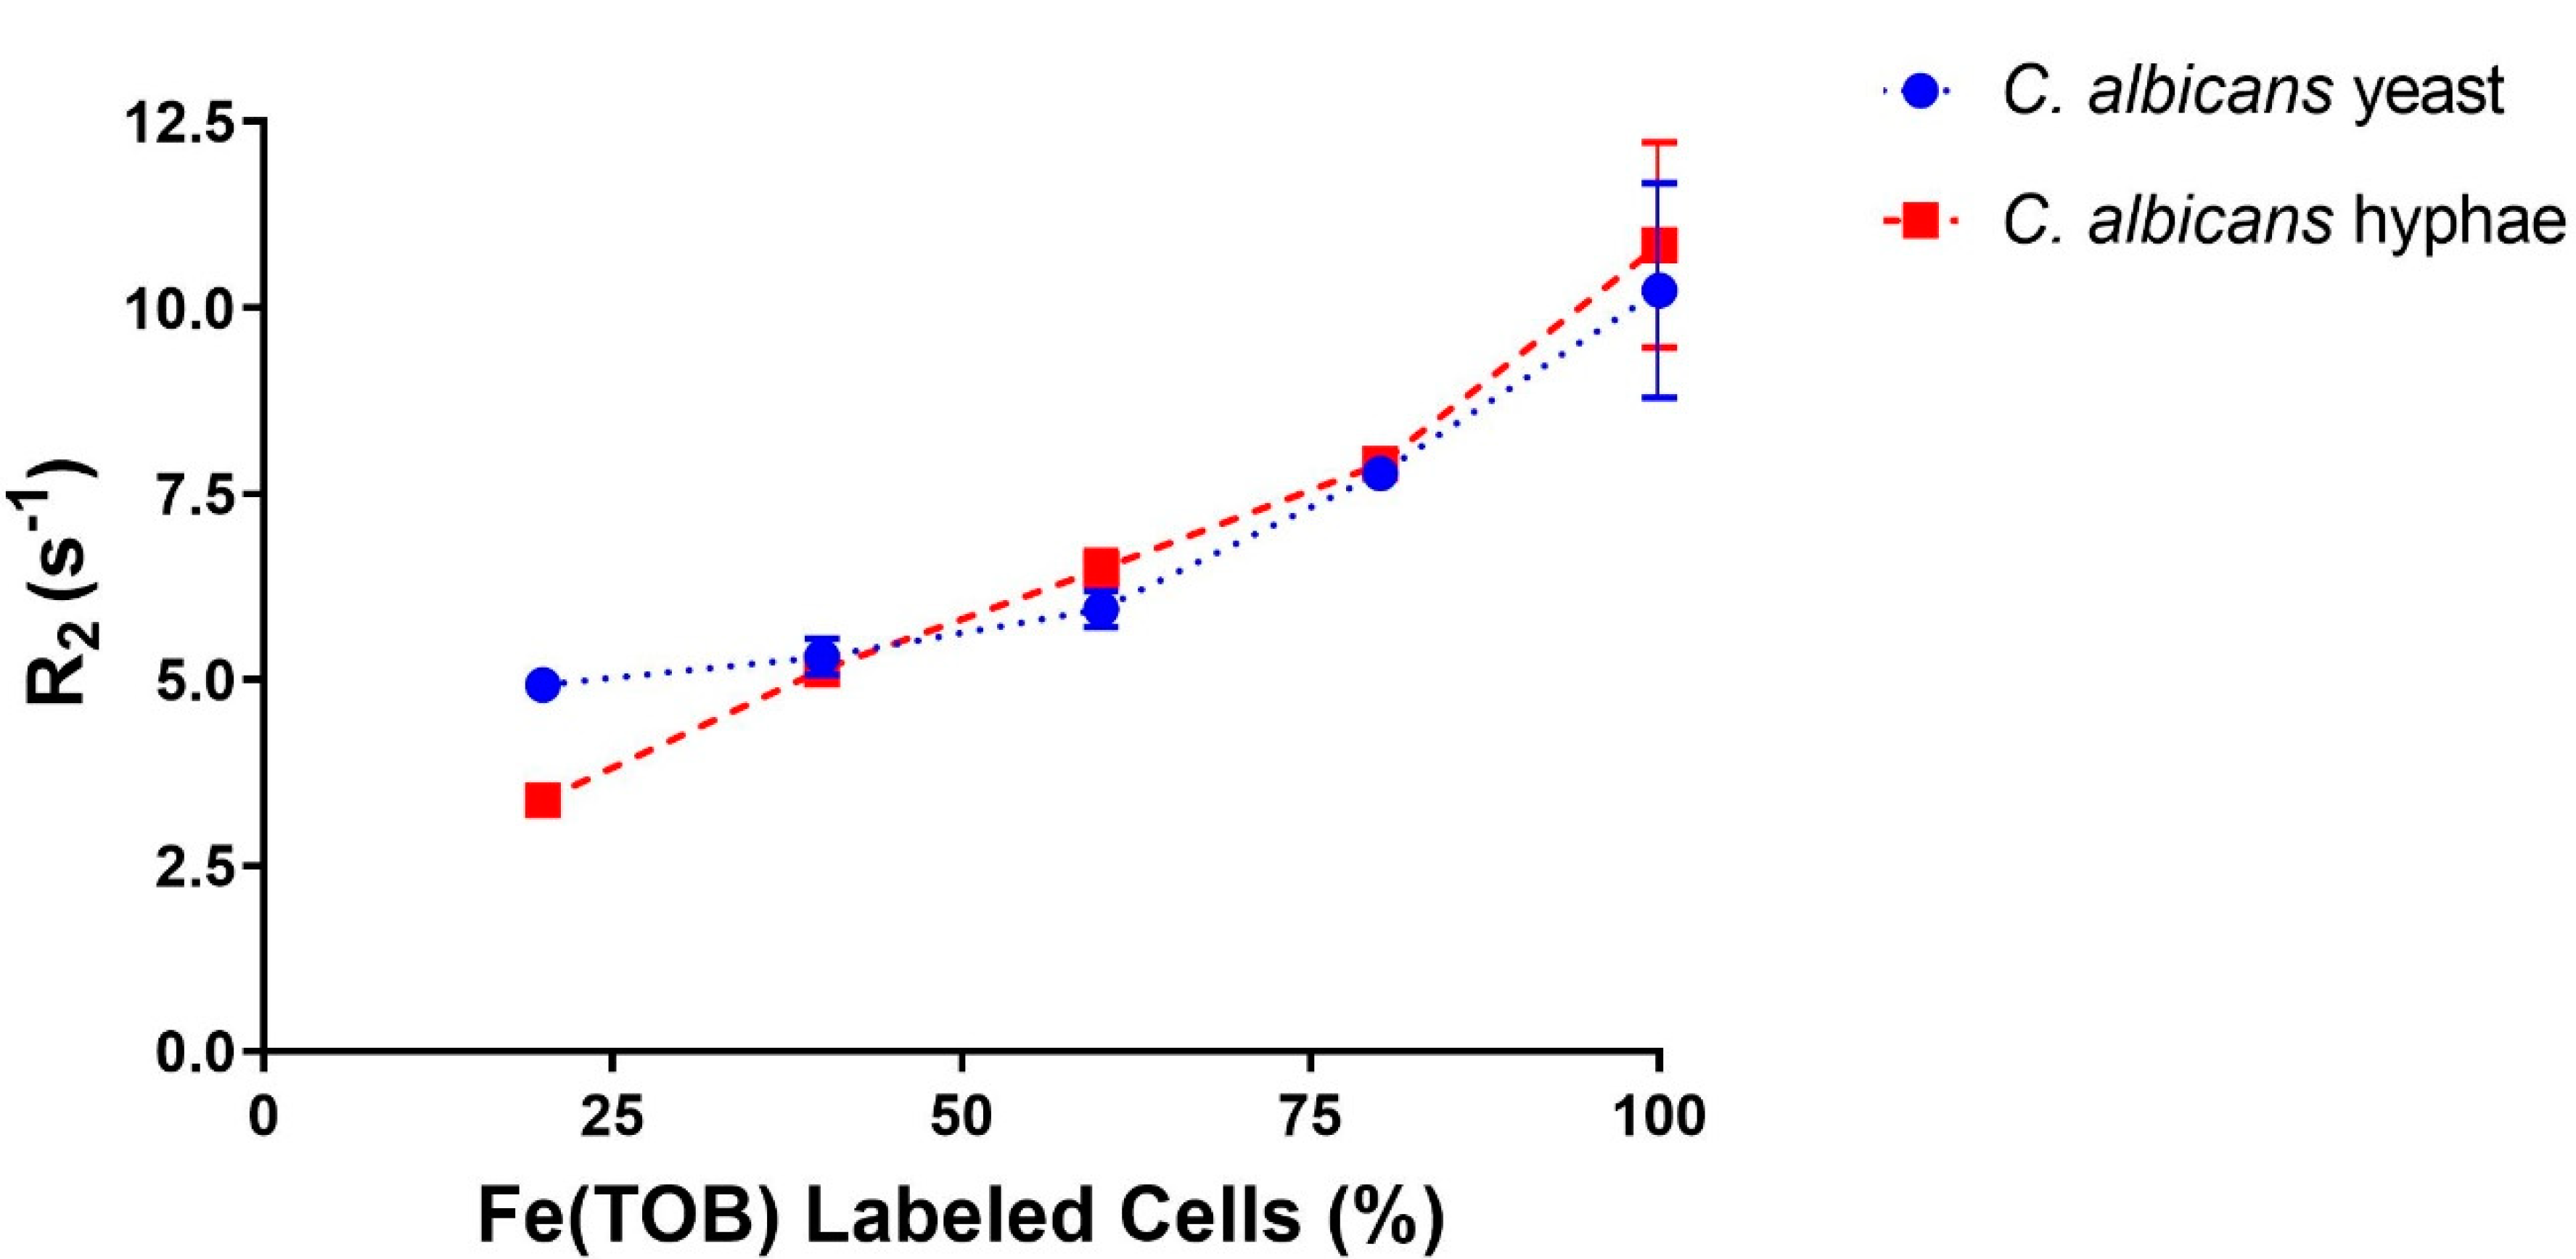
The detection limit of the Fe(TOB)-labeling was investigated by mixing the Fe(TOB)-labeled cells with control cells in both the C. albicans yeast and hyphae. The percentage of Fe(TOB)-labeled cells was increased while keeping the total protein content of the samples constant at 125 µg/mL protein (Figure 5). The samples were uniformly suspended in 15% (w/v) gelatin and the T1 and T2 constants were measured for the samples. As expected, the water proton T1 constants did not change markedly upon the addition of Fe(TOB)-labeled cells (Figure S24). On the other hand, the T2 effect on water protons increased with the increase of Fe(TOB)-labeled cells (Figure 6).

2.10. Cell Viability

Serial dilution assays were performed on the control and Fe(TOB)-labeled cells for both S. cerevisiae and C. albicans (Figures S25–S29). The S. cerevisiae and C. albicans yeast cells were spotted on a YEPD media plate and grown for 2 days at 30 °C. The C. albicans hyphae cells were grown in SPIDER media for 2 days at 30 °C and photographed. The effect of the maltol on the cell viability of C. albicans was also tested using a serial dilution assay. Neither the 10 mM Fe(TOB) or 10 mM Fe(TOB) and maltol treatments had an adverse toxic effect on the cells. The high tolerance to the Fe(TOB) complex is promising and bodes well for labeling cells for MRI tracking in animal models.

3. Discussion

Non-invasive probes are needed to monitor the dissemination, progression, and potency of antifungal treatments of candidiasis time. Considerable effort has been reported toward the development of non-invasive probes to study these infections using luciferase-catalyzed bioluminescence and positron emission tomography (PET) [23,46,47,48,49]. However, the lack of probes for labeling yeast for an improved MRI contrast is surprising, especially given the advantages of the high resolution and unlimited depth penetration of this modality.
Methods for labeling yeast with small-molecule metal complexes must take into account the yeast cell wall. The cell wall is the outermost organelle of the yeast cells and constitutes 26–32% of the biomass of yeast cells [35,50]. The cell wall is an accessible target for cellular labeling, which does not require the metal complexes to cross the lipid membranes. Moreover, yeast cells have unique β-glucan-based cell walls, as opposed to the peptidoglycan-based cell walls in bacteria [51,52]. Selective labeling with a β-glucan-based cell wall could potentially provide specific labeling and detection of yeast cells over other pathogenic bacterial cells. Our studies in this area were based on a new class of Fe(III) MRI contrast agent that has a special affinity for the β-glucan-containing particles made from the yeast cell wall [27]. We wondered whether the cell wall of live yeast would be similarly labeled with the Fe(III) complexes. Moreover, the change in the morphology switching of yeast cells in the infectious form may provide a further index of progression. We hypothesized that the change in morphology would affect the magnetic susceptibility of the labeled yeast and produce a unique MRI signature.
The cell association was studied and optimized using S. cerevisiae (Baker’s yeast) as a model organism by exploring a series of Fe(III) macrocyclic complexes as paramagnetic agents. Endocytosis-based labeling of S. cerevisiae cells with complexes that contained open coordination sites, such as Fe(TOB), Fe(TOBA), and Fe(TASO), lead to broadening of the Z-spectra (Figures 1, S4, and S5). No such broadening was observed in the cells labeled with closed coordination complexes, such as Fe(TOT) and Fe(TOTz) (Figures S6 and S7). The greater broadening of the Z-spectra corresponded to a larger amount of Fe(III) content in the yeast (Figure S11). Thus, the open coordination site on the Fe(III) center must be critical for interaction with the yeast cells.
Heat shock was also investigated as a means of promoting the cell association of complexes into yeast cells. The heat shock treatment of S. cerevisiae cells in the presence of Fe(TOB) led to samples with even more pronounced broadening of the Z-spectra. The observed broadening of the Z-spectra with Fe(III) complexes is unusual in comparison to Gd(III)-based T1 agents that produce narrowed Z-spectra from quenching of the magnetization transfer (MT) upon cellular entrapment [6]. The presence of these Gd(III)-based T1 agents leads to perturbations in the MT process, leading to a low degree of saturation in the bulk water, thus narrowing the Z-spectra [53,54].
Both endocytosis and heat shock treatments produced a significant cellular association of Fe(TOB), as detected through ICP-MS experiments, with no apparent toxicity to the yeast cells (Figures 2A, S25, and S26). Interestingly, the endocytosis exhibited the highest Fe cellular association after only 30 min of incubation to give on the order of 1010–1011 Fe/cell in Fe(TOB)-labeled S. cerevisiae. These values were comparable to the cell association achieved in Gd-HPDO3A-labeled mammalian cells and a magnitude lower than a previously reported Fe(III) complex incorporated into yeast cells through electroporation [4,6,41]. Endocytosis was chosen as the preferred mode due to its simplicity, ease of scaling up, and higher levels of incorporation of the complex.
Interesting differences emerged when the Fe(III)-complex-labeled S. cerevisiae cells were treated with maltol and the total iron content was measured using ICP-MS. The cell media for the Fe(III)-complex-labeled cells turned red due to the maltol treatment, indicating the release of a Fe(III) complex to give the maltol ternary adduct (Scheme 2). The ternary interaction with maltol is unique to Fe(TOB) or other open coordination analogs and is not observed in Fe(TOT) [27]. Interestingly, maltol was able to restore the Fe content in the cells to pre-Fe(TOB) treatment levels in endocytosis-labeled cells, but not in heat shock labeled cells (Figure 2A). The inability of maltol to remove the Fe(III) complex was also observed for Fe(TOD)-treated cells.
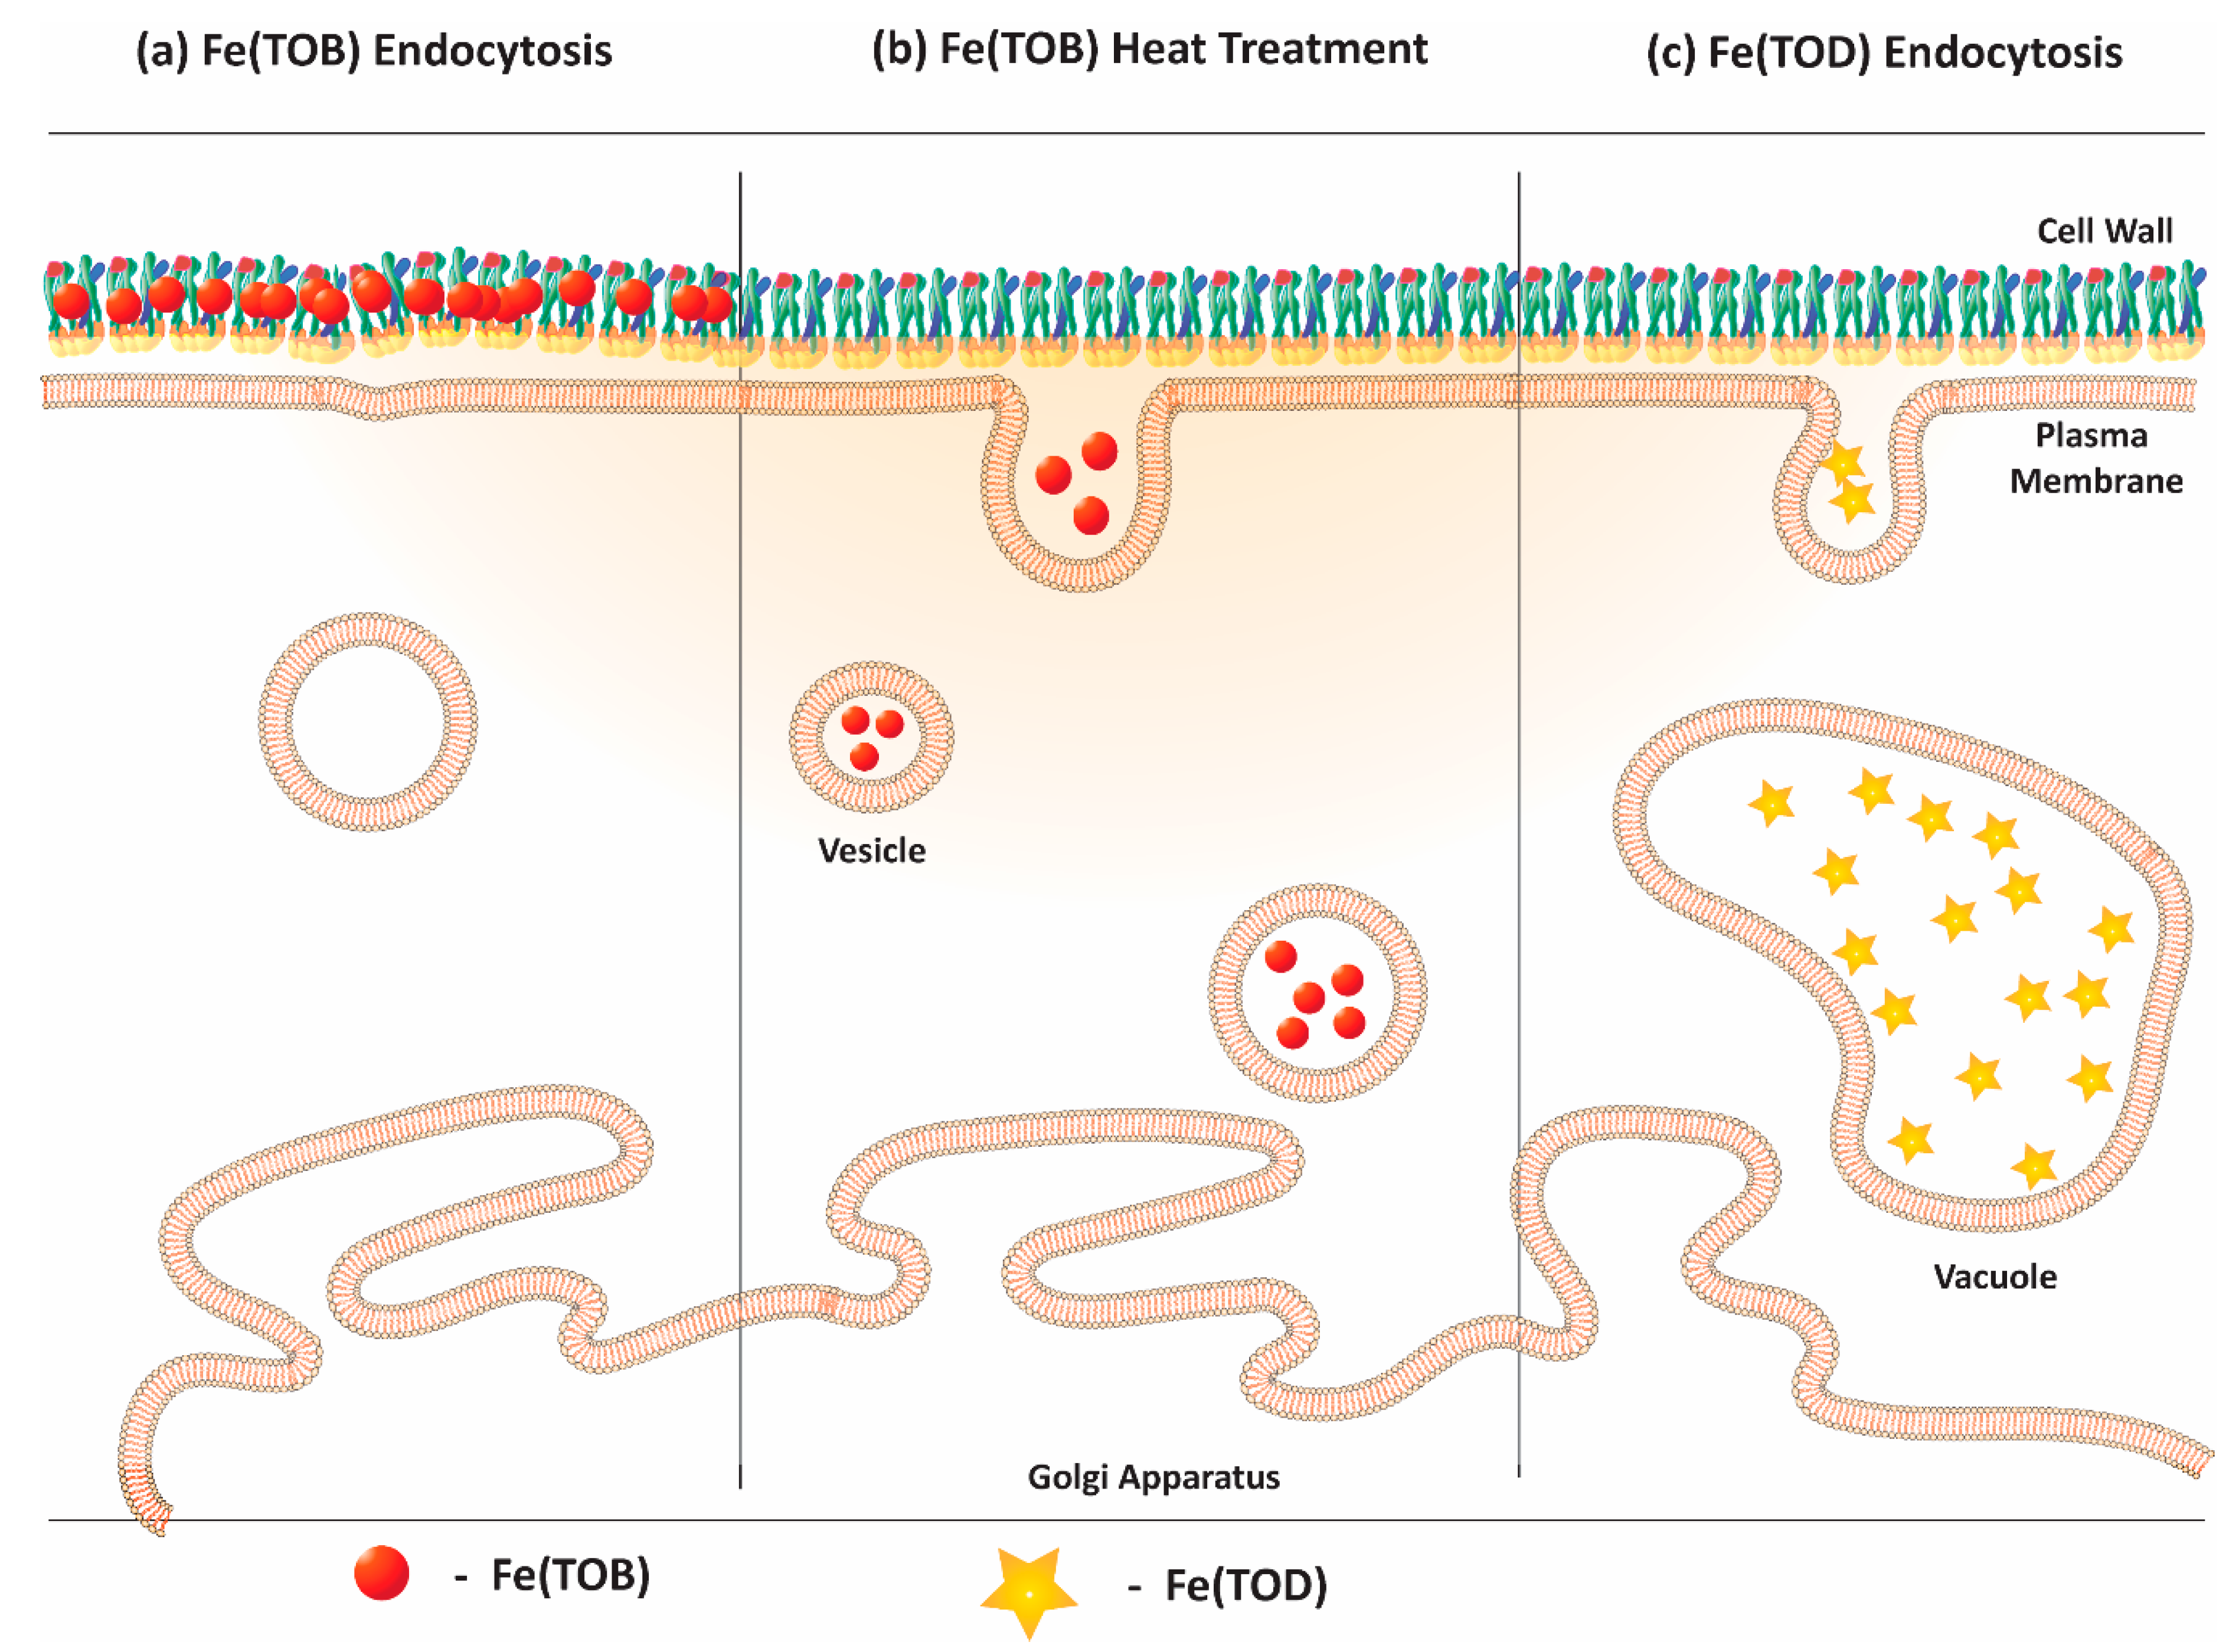
These results suggest that endocytosis treatment of yeast with Fe(TOB) produces an Fe(III) complex bound to the cell wall, which is released upon maltol treatment, as observed in the case of glucan particles. Another possibility is that Fe(TOB) is internalized in the cytoplasm in cells and the Fe(TOB)–maltol complex can cross the cellular membrane and cell wall with relative ease. To further investigate the cell wall interaction in the endocytosis of Fe(TOB), scanning electron microscopy was carried out. The differences in the surface morphology between the control cells and Fe(TOB)-treated cells suggests that Fe(TOB) interacted at the surface of the cells (Figure 3). The C. albicans samples also displayed complete reversibility of Fe(TOB) labeling when treated with maltol under similar conditions, suggesting the cell wall localization of Fe(TOB). The proposed localization of Fe(TOB) in this case is depicted in Figure 7a.
The incomplete retrieval of the iron complex by maltol in heat-shock-treated yeast indicated a distinct localization for the Fe(TOB) complex under these conditions. By comparison, the heat shock treatment with analogous Co(II) complexes showed a localized punctate pattern, suggesting localization by a secretory pathway [30,31]. It is possible that the heat shock treatment enhanced the endocytosis-mediated cell association, resulting in the organeller entrapment of the complex in the secretory pathway. This provides an additional membrane for the Fe(TOB)–maltol complex to cross to be released in the cell media, resulting in the inefficient retrieval of Fe(TOB). We propose that the organeller entrapment of Fe(TOD) (Figure 1) also led to the inefficient retrieval of the iron complex due to the maltol treatment. Interestingly, the maltol was able to release the Fe(TOD) labels from the GPs [27]. This suggests that crossing an additional membrane due to organeller entrapment diminished the efficiency of the maltol-mediated retrieval of the Fe(III) complex. The proposed localization of Fe(TOB) through the heat shock incubation and endocytosis treatment of Fe(TOD) is depicted in Figure 7b,c.
Cell wall localization of Fe(TOB) should lead to complex loading that is proportional to the surface area of the cells. It was thus expected that in samples with an equal number of cells, the filamentous C. albicans hyphae would show higher Fe(TOB) cell wall incorporation than the ellipsoidal C. albicans yeast cells. For C. albicans, the yeast phenotype proliferates through budding, resulting in exponential growth in cell numbers. Hyphae, in contrast, exhibit apical growth, resulting in longer cells. However, the total hyphae number remains unchanged [16]. Due to this, it is challenging to access cell numbers for hyphae samples for comparison. Instead, total protein content as a measure of biomass was used for normalization.
Surprisingly, the C. albicans budding yeast phenotype displayed the highest cellular association among the biomass-normalized samples of S. cerevisiae and C. albicans (Figure 3b). Assuming the S. cerevisiae yeast phenotypes to be spherical with diameters in the range of 5 ± 2 µm, the estimated cell concentration of Fe(TOB) complexes in cells was calculated to be ≈19 M for Fe(TOB). Using the biomass-normalized volumes reported in the literature and the Fe cellular association obtained in the protein-normalized samples using ICP-MS measurements, the concentration of Fe(TOB) per cell was found to be ≈26 M in yeast and ≈5.5 M in hyphae cells [16].
Assuming that the cell wall composition was similar in both the yeast and hyphae, this disparity between the Fe(TOB) concentration per cell between C. albicans budding yeast and hyphae, despite the higher cell association of Fe(TOB) in C. albicans yeast cells, indicates that the complex cellular association was due to the larger number of yeast cells in the sample that had a correspondingly larger surface area. The proclivity of hyphae cells toward forming longer cells instead of an increased number of filamentous cells would suggest that a sample containing the same biomass of cells could have a larger number of yeast cells compared to filamentous hyphae cells. As a result, the yeast samples could have a higher total surface area compared to hyphae cells, despite the individual hyphae cells being longer than individual yeast cells [55]. Correlations were obtained in the literature between biomass (dry weight) and surface area of these phenotypes [16]. Under the conditions used in our study, the surface area ratio between yeast and hyphae is ≈1.2:1 for 1 µg of C. albicans [16,56].
The water proton T1 and T2 relaxation times, given as rate constants (R1 and R2, respectively) of the Fe(TOB)-labeled yeast cells were investigated to determine the best method for monitoring the labeled cells. The Z-spectra broadening in the case of Fe(TOB) was attributed to yeast cell loading of the paramagnetic metal complex, leading to faster T2 proton relaxation. Liposomes loaded with Gd-based agents under limited water exchange conditions have been shown to display high T2 proton relaxation due to large contributions from magnetic susceptibility. For liposomal systems, the contribution of paramagnetic complex loading toward the overall measured R2 of bulk protons is defined by the following equation with R2p corrected for a small diamagnetic effect [33,57]:
R 2 p c e l l =   R 2 p S U S C +   R 2 p E X C H
where R 2 p S U S C is the contribution from magnetic field inhomogenieties caused by the paramagnetic liposome or cell, R 2 p E X C H denotes the contribution from rapidly relaxing intraliposomal water protons and their exchange across the cellular membrane, and R 2 p c e l l represents the summed paramagnetic relaxation rate constant of the cell (or liposome). The susceptibility contribution is dependent on the shape of the labeled vesicle, the effective magnetic moment (µeff) of the paramagnetic complex, and the concentration of the paramagnetic center [33,57]. A heat shock treatment is likely to enhance the complex uptake through a secretory pathway, as found in the literature [31]. The Fe(III) complex cell association, though lower than in case of endocytosis, could lead to concentrated compartmentalization of the complex into organelles in the secretory pathway to potentially enhance the R 2 S U S C   contribution and lead to additional broadening in the Z-spectra.
The differences in R2 between the control cells and Fe(TOB)-labeled cells were found to be matrix sensitive. Matrices, such as agarose, collagen, and gelatin, were chosen based on their biological relevance. A 15% gelatin (w/v) was found to provide optimal reproducibility in R2 at 37 °C. The cells were uniformly suspended in the gel during the NMR experiment and the gel was resistant to microbial growth for 2 days without additives.
Fe(TOB) interacting with the β-glucan-based hydrophobic cell wall is likely to modify the second-sphere water around the Fe(TOB) complex, leading to quenched T1 effects on proton relaxation [27]. S. cerevisiae cells, being ellipsoidal, would likely enhance the magnetic susceptibility contribution to the T2-based relaxation. Furthermore, the turgidity of cells due to the presence of a cellular plasma membrane could provide additional organizational structure to the paramagnetic vesicle to further enhance the T2-based relaxation compared to the Fe(TOB)-labeled GPs. This hypothesis can easily be tested via the Fe(TOB)-labeling of filamentous (hyphae) C. albicans. The filamentous shape of C. albicans hyphae could potentially lead to a larger magnetic susceptibility contribution, further enhancing the T2 water proton relaxation as long as they have the same localization and loading of Fe(TOB).
The T2 relaxation times were measured using biomass-normalized samples of C. albicans yeast and hyphae samples labeled with Fe(TOB). As expected from the ICP-MS studies, both yeast and hyphae cells displayed similar relaxation rate (R2) constants. This is most likely the result of a larger total surface area in yeast samples compared to hyphae samples. In addition, C. albicans hyphae cells overexpress various adhesive proteins that aid cell adhesion to form fungal biofilms [58,59,60]. It is possible that the cells could be aggregating at the microscopic level and further reducing the available surface area for Fe(TOB) interaction.
It is noteworthy that despite the lower cellular association of Fe(TOB) with hyphal form, the R2 relaxation rate constants were comparable between the yeast and hyphae samples. This result suggests that there is indeed a higher bulk magnetic contribution in the case of hyphae cells, resulting in greater water proton T2 shortening.

4. Materials and Methods

4.1. Instrumentation

A Varian Inova 500 MHz NMR spectrometer equipped with an FTS Systems TC-84 Kinetics Air Jet Temperature Controller (Varian, Palo Alto, CA, USA) was used to collect the CEST NMR data and 1H NMR spectra. Absorbance spectra were collected using a Beckman Coulter DU 800 UV-Vis Spectrophotometer equipped with a Peltier temperature controller (Beckman Coulter, Pasadena, CA, USA). Fluorescence microscopy was done on a Zeiss Axioplan2 microscope (Leica microsystems, Buffalo Grove, IL, USA). The cell viability images were taken using a Biorad Chemidoc XRS+ molecular imager (Hercules, CA, USA. Optical density measurements were taken using a Dynex Spectra MR plate reader (Chantilly, VA, USA). T1 and T2 relaxation measurements were performed on a Varian Inova 500 MHz NMR spectrometer. The concentration of Fe in yeast cells was determined using inductively coupled plasma mass spectrometry (ICP-MS) on a Thermo X-Series 2 (Thermofisher, Waltham, MA, USA).

4.2. Materials

Nitric acid at 65–70% with greater than ≥99.999% purity (trace metals basis) was obtained from BeanTown Chemical (Hudson, NH, USA). The 100 ppm Fe standard solutions were purchased from Inorganic Ventures (Christiansburg, Virginia, USA). Reagent grade gelatin was purchased from VWR Life Sciences (Bridgeport, NJ, USA). Nutrient broth pH 6.9 without NaCl was purchased from Millipore Sigma (Burlington, MA, USA). D-(-)-Mannitol was purchased from Alfa Aesar (Haverhill, MA, USA). Bovine collagen (3 mg/mL) was obtained from Advanced Biomatrix (Carlsbad, CA, USA). For the yeast experiments, the cultures were grown on standard YEPD [yeast extract (10 g/L), peptone (20 g/L), and dextrose (2%)] (VWR, Bridgeport, NJ, USA), in liquid or semisolid agar media. For hyphae phenotypes, SPIDER media [Nutrient Broth (20 g/L), Millipore Sigma (Burlington, MA, USA), Mannitol (20 g/L), and K2HPO4 (4 g/L); pH adjusted to 7.2 using NaOH] was used.

4.3. Cell Culture and Labeling

S. cerevisiae of the Sigma1278b strain background was used for the preliminary studies [28]. The specific strain used (PC538) is a typical wild-type (WT) strain with the following genotype: MATa ste4 FUS1-HIS3 FUS1-lacZ ura3-52, [29] which was used for experiments in the study. PC538 yeast cells were grown in YEPD [yeast extract (10 g/L), peptone (20 g/L), and dextrose (2%)] liquid media. The yeast cells were grown to the mid-log phase. All centrifugations were done at 5000× g. The cells were harvested using centrifugation, and the cell pellets were washed with Millipore water. The harvested control cell pellet was suspended in Millipore water and used for experiments. Optical density measurements were done at 600 nm to obtain the cell density to determine the approximate number of cells.
For the endocytosis, the cell pellet was treated with 10 mM Fe(III) complexes and incubated at 30 °C for 30 min with continuous shaking. The cells were washed and suspended in 1× PBS. Optical density measurements were done at 600 nm to obtain the cell numbers.
For the heat-shock treatment, the resulting cell pellet was treated with 10 mM Fe(TOB) complexes in solution in a 50% (v/v) PEG 3350 solution (Millipore Sigma (Burlington, MA, USA). The cells were incubated at 30 °C for 30 min with continuous shaking. After incubation, the cells were incubated at 42 °C for 10 min. For recovery after the heat shock, the cells were then incubated at 30 °C with continuous shaking for 4 h. The cells were washed and suspended in 1× PBS. The optical density measurements were done at 600 nm to obtain the cell density to determine the approximate number of cells.
The C. albicans used for this study was the strain SC5314, isolated from a patient with systemic candidiasis [11,61,62]. For the growth of the budding yeast form, the cells were grown in YEPD liquid media for 16 h. The cells were harvested using centrifugation and the cell pellets were washed with Millipore water. For endocytosis, the cell pellet was treated with 10 mM Fe(TOB) and incubated at 30 °C for 30 min with continuous shaking. The cells were washed and suspended in 1× PBS. Optical density measurements were done at 600 nm to obtain the cell numbers.
For growing the hyphae of C. albicans, cells were grown in YEPD liquid media for 16 h, harvested using centrifugation, and the optical density measurements were done at 600 nm. The optical density of ≈33 OD was diluted to 10 OD. The cells were washed thrice with 1× PBS. The cells were harvested using centrifugation and were diluted to 0.2 OD and grown for 4 h at 37 °C with continuous shaking in SPIDER media [63]. After incubation, the cells were harvested using centrifugation, and the cell pellets were washed with Millipore water. For endocytosis, the cell pellet was treated with 10 mM Fe(TOB) and incubated at 30 °C for 30 min with continuous shaking. The cells were washed and suspended in 1× PBS. The optical density measurements were done at 600 nm to obtain the cell numbers.

4.4. Fluorescence Microscopy

The C. albicans (budding yeast and hyphae) cells were collected and suspended in 1× PBS. The cells were heat-killed at 60 °C for 15 min before preparing the glass slides for imaging using fluorescence microscopy. Fluorescence imaging was done using a phase contrast channel on a Zeiss Axioplan2 fluorescence microscope.
For the confocal microscopy, the S. cerevisiae yeast cells were washed three times in water before preparing the samples for imaging. The samples were added under a synthetic dextrose (SD) agar pad to avoid sample dehydration during the experiment [64].

4.5. Pierce Protein Assay

The cells were cultured in triplicate and were collected using centrifugation. The resulting cell pellets were stored at −80 °C for 16 h. The cells were thawed to room temperature and proteins were extracted via the addition of a trichloracetic acid (TCA) buffer containing 10% TCA; 10 mM Tris-HCl, pH 8; 25 mM ammonium acetate; 1 mM EDTA. Acid-washed glass beads were added to the scaffold and cell pellet mixture. The cells were lysed using three consecutive 90 s vortex pulses with 1 min rests on ice using a fast prep multi-vortex (Labline instrument, Melrose, IL, USA). The proteins were precipitated using centrifugation at 4 °C at 16,000 g for 10 min. The protein pellets were thoroughly re-suspended using a resuspension buffer containing 0.1 M Tris-HCl pH 11 and 3% SDS by boiling the suspension for 5 min at 95 °C. The total protein concentration was measured using a Biorad BCA protein assay kit (Pierce™ Microplate BCA Protein Assay Kit catalog # 23252 (Biorad, Hercules, CA, USA). The total protein content was plotted against the optical density at 600 nm (OD600) for the cells. The data was fit to a linear regression graph in GraphPad Prism (Graphpad, San Diego, CA, USA).

4.6. Z-Spectra Measurements of the Fe(III)-Complex-Labeled Yeast

All the samples were suspended in 1× PBS for the analysis. The Z-spectra were acquired within a range of ±100 ppm by acquiring a total of 201 data points (steps of 1 ppm) with B1 = 3, 6, and 12 µT at 37 °C.

4.7. Maltol Removal of the Fe(TOB)-Labeled Yeast

To the Fe(TOB)-labeled yeast, a 10 mM maltol solution was added. The particles were incubated for 3 h at 30 °C. After incubation, the particles were harvested using centrifugation, followed by three 1× PBS washes. Both the supernatant and pellet were saved for the ICP-MS analysis.

4.8. Matrix Preparation

Bovine collagen, agarose, and gelatin were used to study the effect of the gelling agent on the matrix relaxation times. Samples with 2.4 mg/mL collagen were prepared using the protocol reported in the literature [26]. The concentrations of the gelling agents were varied between 1–25% (w/v) for gelatin and 0.5–4% (w/v) for agarose. A series of test matrices were prepared by mixing the agents with distilled water at room temperature. The resulting samples were heated to dissolve the solid particles with constant stirring. The resulting gels were further tested to investigate the gelation times, cell suspension threshold, and experimental window for the cell phantom experiments.
Culture plates were prepared with the various matrices and nutrient supplementation to examine the susceptibility of yeast growth during the experiments. The culture plates with only the gelation matrix were prepared to examine the sterility of the matrix.

4.9. T1 and T2 Water Proton Relaxation Measurements of Yeast Cells and the Associated Data Analysis

The cells were washed three times with 1× PBS. The cells were normalized relative to the total protein content (≈125 µg/mL) and suspended in a 15% (w/v) gelatin gel using the referenced protocol [65] in 5 mm borosilicate NMR sample tubes. The relaxation rates of the cells were measured on a 9.7 T NMR spectrometer at 37 °C using inversion recovery for T1 and the Carr–Purcell–Meiboom–Gill (CPMG) spin echo for the T2 protocol [66]. Briefly, the T1 relaxation times of serial dilutions were measured using an inversion recovery with the following parameters: relaxation delay = 20 s, echo time array starting from 0.5–5 s, and a receiver bandwidth = 28 ms. The T2 relaxation times were measured using the CPMG sequence with a fixed TR of 10 s and TE times ranging from 100–3000 ms in 100 ms increments. The relaxation rate of each sample was calculated using non-linear regression analysis in GraphPad Prism. Alternatively, the T1/T2 relaxation times were determined on a 4.7 T MRI system, as reported previously [26]. Briefly, the T1 relaxation times of the serial dilutions were measured using an inversion recovery and a balanced steady-state free precession (bSSFP) acquisition with the following parameters: TE/TR = 1.5/3.0 ms, flip angle = 30°, inversion repetition time = 10 s, segments = 8, and frames = 100. The T2 relaxation times were measured using a multi-echo CPMG sequence with a fixed TR of 4200 ms and TE times ranging from 20–1200 ms in 20 ms increments. The relaxation rate of each sample was calculated using non-linear regression analysis within MATLAB (MathWorks, Natick, MA, USA) and relaxivities were then calculated using linear regression (concentration versus relaxation rate).

4.10. Scanning Electron Microscopy on the Glucan Particles

The samples were prepared using a method previously reported in the literature [27,67]. Briefly, the control and Fe(TOB)-treated cells were concentrated via syringe filtration using a 0.2 micron Whatman nucleopore polycarbonate filter paper with a 1 mL syringe (GE Whatman, catalog #889-78084, Maidstone, UK). The cells were rinsed using buffer via a syringe, treated with 100% ethanol via a syringe, and incubated for 15 min. The filter paper was removed from the holder, placed in a Petri dish, and treated with hydroxymethyldiazane (HMDS). Samples were placed at 4 °C for 16 h and imaged the following day.

4.11. Cell Viability Assay

The aliquots of control cells and complex treated cells were washed two times with 1× PBS. Serial dilution assays were performed by spotting 10 µL of serial 10-fold dilutions of the cultures with an OD600 of 0.8 on YEPD semi-solid agar media for S. cerevisiae and C. albicans yeast and SPIDER semi-solid media for C. albicans hyphae cultures. The plates were incubated and photographed after 24 h for C. albicans and 48 h for S. cerevisiae.

4.12. Determination of Iron in the Yeast Cells

The amount of Fe in the yeast cells was determined using ICP-MS (Thermo X-Series 2; Thermofisher, Waltham, MA, USA). After the internalization experiments, the yeast cells with and without the Fe(III) complex were collected in 200 µL Milli-Q (Millipore) water. Yeast cell solutions (100 µL) were digested with metal-free nitric acid (900 µL) (65–70%). After a 3 d digestion process, the samples were diluted to 2% HNO3, 30 ppb cobalt standard solution in 10 mL Milli-Q (Millipore) water and analyzed using ICP-MS. Cobalt and indium standard solutions were used as the internal standards.

4.13. Statistical Analysis

The results were expressed as mean value ± standard error (SE). Statistical analyses were performed using one-way ANOVA analysis followed by Tukey’s multiple comparisons test using GraphPad Prism 8. A p-value of less than 0.05 was regarded as significant for the cellular association and viability studies, while a p-value of less than 0.5 was regarded as significant for the T1 measurements on the cells.

5. Conclusions

This study demonstrates that paramagnetic-Fe(III)-based MRI probes can be used to label pathogenic C. albicans, as well as the domesticated S. cerevisiae. Endocytosis was the most efficient method for cellular labeling with Fe(TOB); the studies supported the cell wall localization of Fe(TOB) in both S. cerevisiae and C. albicans when this method was used. The Fe(TOB)-labeled cells displayed strong enhancement in water proton T2 relaxation, which may be useful for tracking the yeast in vivo. The strongly enhanced T2 over T1 relaxation times of the Fe(TOB) associated with yeast would allow for in vivo discrimination of Fe(TOB)-labeled yeast over a free complex.
Fe(TOB)-labeled yeast cells may find applications in the study of invasive candidiasis in animals. We envision that yeast cells labeled with paramagnetic probes could be injected into animals to study the progression of the yeast infection in the host. Alternatively, given that several of the Fe(III) macrocyclic complexes studied here produce MRI contrast in mice, studies are warranted to determine whether yeast infections might be detected via the administration of Fe(III) MRI contrast agents into the animal. The success of this type of study would rely on tuning the biodistribution of the contrast agent to target the site of infection [24,25].

Supplementary Materials

The following are available online at https://www.mdpi.com/2312-7481/6/3/41/s1, Table S1: Relaxivity values for Fe(III) complexes measured at 4.7 T, 20 mM HEPES pH 7.2, 100 mM NaCl at 37 °C. Figure S1: Color change of S. cerevisiae pellet upon treatment with Fe(TOB). Figure S2: Z-spectra of (a)control and (b)10 mM Fe(TOB) labeled through endocytosis in S. cerevisiae in 1× PBS at 37 °C. Figure S3: Z-spectra of (a)control and (b)10 mM Fe(TOB) labeled through heat shock in S. cerevisiae in 1× PBS at 37 °C. Figure S4: Z-spectra of (a)control and (b)10 mM Fe(TOBA) labeled through endocytosis in S. cerevisiae in 1× PBS at 37 °C. Figure S5: Z-spectra of (a)control and (b)10 mM Fe(TASO) labeled through endocytosis in S. cerevisiae in 1× PBS at 37 °C. Figure S6: Z-spectra of (a)control and (b)10 mM Fe(TOTz) labeled through endocytosis in S. cerevisiae in 1× PBS at 37 °C. Figure S7: Z-spectra of (a)control and (b)10 mM Fe(TOT) labeled through endocytosis in S. cerevisiae in 1× PBS at 37 °C. Figure S8: Z-spectra of (a)control and (b)10 mM Fe(TOB) labeled through endocytosis in C. albicans yeast in 1× PBS at 37 °C. Figure S9: Z-spectra of (a)control and (b)10 mM Fe(TOB) labeled through endocytosis in C. albicans hyphae in 1× PBS at 37 °C. Figure S10: Z-spectra of (a)control and (b)10 mM Fe(TOB) labeled through endocytosis in S. cerevisiae hyphae in 1× PBS at 37 °C. Figure S11: Total Fe content in yeast cells upon endocytosis treatment with 10 mM Fe(III) complexes in S. cerevisiae as measured by ICPMS. Mean ± SE is reported. Figure S12: Plot of the total protein content measured by Pierce protein assay vs optical density at 600 nm in S. cerevisiae in midlog phase. The graph was fit to linear regression with R2 = 0.9196. Figure S13: Plot of the total protein content measured by Pierce protein assay vs optical density at 600 nm in C. albicans in yeast form. The graph was fit to linear regression with R2 = 0.9792. Figure S14: Plot of the total protein content measured by Pierce protein assay vs optical density at 600 nm in C. albicans in hyphae form. The graph was fit to linear regression with R2 = 0.9678. Table S2: Linear regression of total protein content measured by Pierce protein assay vs optical density at 600 nm in yeast strains. Figure S15: Z-spectra for 0.05% (w/v) agarose, SC (S. cerevisiae) control and Fe(TOB) labeled cells, CAY (C. albicans yeast) control and Fe(TOB) labeled cells and CAH (C. albicans hyphae) control and Fe(TOB) labeled cells on 9.4 T NMR spectrometer at 37 °C. Figure S16: (a) R1 relaxation rate constants and (b) R2 relaxation rate constants for 0.05% (w/v) agarose, SC (S. cerevisiae) control and Fe(TOB) labeled cells, CAY (C. albicans yeast) control and Fe(TOB) labeled cells and CAH (C. albicans hyphae) control and Fe(TOB) labeled cells on 4.7 T animal scanner at 37 oC. Mean ± SE is reported, (*) p < 0.05, (**) p < 0.01, (***) p < 0.001, (****) p < 0.0001 with n = 3 for all samples. Figure S17: R2 water proton relaxation rate constant values for agarose and gelatin phantom samples measured by CPMG method on 9.4 T NMR spectrometers at 37 °C. Figure S18: Z-spectra of (a) 2.4 mg/mL Collagen (b) 15% (w/v) Gelatin and (c) 4% (w/v) Agarose at 37 °C on 9.4 T NMR spectrometer at B1 = 12 μT Figure S19: 1H NMR of 15% (w/v) gelatin phantom samples after 2h (bottom) and 48 h (top) Figure S20: R2 relaxation rate constant of water protons in (a) 15% (w/v) gelatin phantom (b) SCY (S. cerevisiae) (c) CAY (C. albicans) yeast form (d) CAH (C. albicans) hyphae at 37 °C after 2 h (Blue) and 2 days (orange) at 37 °C on 9.4 T NMR spectrometer. Figure S21: Serial dilution assay with S. cerevisiae, C. albicans (yeast) and C. albicans (hyphae) spotted on 15% (w/v) gelatin media at 30 °C. The cells were grown for 2 days and photographed. Figure S22: Serial dilution assay with S. cerevisiae, C. albicans (yeast) and C. albicans (hyphae) spotted on YEPD media at 30 °C. The cells were grown for 2 days and photographed. Figure S23: R1 relaxation rate constants of water protons on 9.4 T NMR spectrometer with C. albicans yeast cells suspended in 15% (w/v) gelatin at 37 °C. All cell samples contain ~125 μg protein/mL. Figure S24: R1 relaxation rate constants of samples containing increasing concentration of Fe(TOB) labeled cells suspended in 15% (w/v) gelatin in 9.4 T NMR spectrometer. Figure S25: Serial dilution assay with S. cerevisiae PC538 (yeast) (i) untreated (ii) 10 mM Fe(TOB) treated cells spotted on YEPD media at 30 °C. The cells were grown for 2 days and photographed. Figure S26: Serial dilution assay with S. cerevisiae PC538 (yeast) (i) heat shocked untreated cells (ii) 10 mM Fe(TOB) treated heat shocked cells spotted on YEPD media at 30 °C. The cells were grown for 2 days and photographed. Figure S27: Serial dilution assay with S. cerevisiae PC538 (yeast) (i) untreated (ii) 10 mM Fe(TOD) treated cells spotted on YEPD media at 30 °C. The cells were grown for 2 days and photographed. Figure S28: Serial dilution assay with C. albicans (yeast) (i) untreated (ii) 10 mM Fe(TOB) treated (iii) 10 mM Maltol treated and (iv) 10 mM Fe(TOB) treatment followed by 10 mM Maltol treated cells spotted on YEPD media at 30 °C. The cells were grown for 2 days and photographed. Figure S29: Serial dilution assay with C. albicans (hyphae) (i) untreated (ii) 10 mM Fe(TOB) treated (iii) 10 mM Maltol treated and (iv) 10 mM Fe(TOB) treatment followed by 10 mM Maltol treated cells spotted on YEPD media at 30 °C. The cells were grown for 2 days and photographed.

Author Contributions

Conceptualization, J.R.M., A.P., and P.J.C.; methodology, A.P., D.A., E.M.S., P.J.C., and J.A.S.; resources, J.R.M., P.J.C., and J.A.S.; writing—original draft preparation, A.P. and J.R.M.; writing—review and editing, J.R.M., A.P., D.A., and P.J.C.; supervision, J.R.M.; project administration, J.R.M. and P.J.C; funding acquisition, J.R.M. and P.J.C. All authors have read and agreed to the published version of the manuscript.

Funding

J.R.M. thanks the NSF (CHE-1710224) for the support of this work. P.J.C. is supported by a grant from the NIH (GM#098629). The authors would also like to thank the Chemistry Instrument Center (CIC), University at Buffalo. This work utilized an ICP-MS that was purchased with funding from an NSF Major Research Instrumentation Program (NSF CHE-0959565) and National Institutes of Health (S10 RR029517). The confocal imaging studies were funded by the National Science Foundation Major Research Foundation grant #DBI 0923133.

Acknowledgments

The authors would like to thank Laura Rusche for providing the SC5314 C. albicans strain for the studies. We thank Peter Bush for assisting with the electron microscopy. We thank Gail Willsky for suggestions on the manuscript.

Conflicts of Interest

The authors declare no conflict of interest. J.R.M. is a co-founder of Ferric Contrast, Inc., a company with a focus on iron MRI contrast agents. The funders had no role in the design of the study; in the collection, analyses, or interpretation of data; in the writing of the manuscript, or in the decision to publish the results.

References

  1. Branski, L.K.; Gauglitz, G.G.; Herndon, D.N.; Jeschke, M.G. A review of gene and stem cell therapy in cutaneous wound healing. Burns 2009, 35, 171–180. [Google Scholar] [CrossRef] [PubMed] [Green Version]
  2. Nicholls, F.J.; Ling, W.; Ferrauto, G.; Aime, S.; Modo, M. Simultaneous MR imaging for tissue engineering in a rat model of stroke. Sci. Rep. 2015, 5, 14597. [Google Scholar] [CrossRef] [PubMed] [Green Version]
  3. June, C.H.; O’Connor, R.S.; Kawalekar, O.U.; Ghassemi, S.; Milone, M.C. CAR T cell immunotherapy for human cancer. Science 2018, 359, 1361–1365. [Google Scholar] [CrossRef] [PubMed] [Green Version]
  4. Ferrauto, G.; Di Gregorio, E.; Dastru’, W.; Lanzardo, S.; Aime, S. Gd-loaded-RBCs for the assessment of tumor vascular volume by contrast-enhanced-MRI. Biomaterials 2015, 58, 82–92. [Google Scholar] [CrossRef] [PubMed]
  5. Ferrauto, G.; Castelli, D.D.; Di Gregorio, E.; Langereis, S.; Burdinski, D.; Grüll, H.; Terreno, E.; Aime, S. Lanthanide-Loaded Erythrocytes As Highly Sensitive Chemical Exchange Saturation Transfer MRI Contrast Agents. J. Am. Chem. Soc. 2013, 136, 638–641. [Google Scholar] [CrossRef]
  6. Castelli, D.D.; Ferrauto, G.; Di Gregorio, E.; Terreno, E.; Aime, S. Sensitive MRI detection of internalizedT1contrast agents using magnetization transfer contrast. NMR Biomed. 2015, 28, 1663–1670. [Google Scholar] [CrossRef]
  7. Mota, F.; Ordonez, A.A.; Firth, G.; Ruiz-Bedoya, C.A.; Ma, M.T.; Jain, S.K. Radiotracer Development for Bacterial Imaging. J. Med. Chem. 2020, 63, 1964–1977. [Google Scholar] [CrossRef]
  8. Locke, L.W.; Shankaran, K.; Gong, L.; Stoodley, P.; Vozar, S.L.; Cole, S.L.; Tweedle, M.F.; Wozniak, D.J. Evaluation of peptide-based probes towards in vivo diagnostic imaging of bacterial biofilm-associated infections. ACS Infect. Dis. 2020. [Google Scholar] [CrossRef]
  9. Kullberg, B.-J.; Arendrup, M.C. Invasive Candidiasis. N. Engl. J. Med. 2015, 373, 1445–1456. [Google Scholar] [CrossRef] [Green Version]
  10. Pfaller, M.A.; Diekema, D.J. Epidemiology of Invasive Candidiasis: A Persistent Public Health Problem. Clin. Microbiol. Rev. 2007, 20, 133–163. [Google Scholar] [CrossRef] [Green Version]
  11. Vediyappan, G.; Dumontet, V.; Pélissier, F.; D’Enfert, C. Gymnemic Acids Inhibit Hyphal Growth and Virulence in Candida albicans. PLoS ONE 2013, 8, e74189. [Google Scholar] [CrossRef] [PubMed] [Green Version]
  12. Kato, H.; Yoshimura, Y.; Suido, Y.; Shimizu, H.; Ide, K.; Sugiyama, Y.; Matsuno, K.; Nakajima, H. Mortality and risk factor analysis for Candida blood stream infection: A multicenter study. J. Infect. Chemother. 2019, 25, 341–345. [Google Scholar] [CrossRef] [PubMed]
  13. Arendrup, M.C.; Andersen, J.S.; Holten, M.K.; Krarup, K.B.; Reiter, N.; Schierbeck, J.; Helleberg, M. Diagnostic Performance of T2Candida Among ICU Patients With Risk Factors for Invasive Candidiasis. Open Forum Infect. Dis. 2019, 6, ofz136. [Google Scholar] [CrossRef] [PubMed]
  14. Pappas, P.G.; Kauffman, C.A.; Andes, D.R.; Clancy, C.J.; Marr, K.A.; Ostrosky-Zeichner, L.; Reboli, A.C.; Schuster, M.G.; Vazquez, J.A.; Walsh, T.J.; et al. Clinical Practice Guideline for the Management of Candidiasis: 2016 Update by the Infectious Diseases Society of America. Clin. Infect. Dis. 2015, 62, e1–e50. [Google Scholar] [CrossRef]
  15. Saraswat, D.; Kumar, R.; Pande, T.; Edgerton, M.; Cullen, P.J. Signalling mucin Msb2 Regulates adaptation to thermal stress inCandida albicans. Mol. Microbiol. 2016, 100, 425–441. [Google Scholar] [CrossRef] [Green Version]
  16. Hosseinzadeh, A.; Urban, C.F. Novel Insight into Neutrophil Immune Responses by Dry Mass Determination of Candida albicans Morphotypes. PLoS ONE 2013, 8, e77993. [Google Scholar] [CrossRef] [Green Version]
  17. Berman, J.; Sudbery, P.E. Candida albicans: A molecular revolution built on lessons from budding yeast. Nat. Rev. Genet. 2002, 3, 918–931. [Google Scholar] [CrossRef]
  18. Noble, S.M.; French, S.; Kohn, L.A.; Chen, V.; Johnson, A.D. Systematic screens of a Candida albicans homozygous deletion library decouple morphogenetic switching and pathogenicity. Nat. Genet. 2010, 42, 590–598. [Google Scholar] [CrossRef] [Green Version]
  19. Orlowski, H.; McWilliams, S.; Mellnick, V.M.; Bhalla, S.; Lubner, M.G.; Pickhardt, P.J.; Menias, C.O. Imaging Spectrum of Invasive Fungal and Fungal-like Infections. Radiographics 2017, 37, 1119–1134. [Google Scholar] [CrossRef]
  20. Shih, R.Y.; Koeller, K.K. Bacterial, Fungal, and Parasitic Infections of the Central Nervous System: Radiologic-Pathologic Correlation and Historical Perspectives:From the Radiologic Pathology Archives. Radiographics 2015, 35, 1141–1169. [Google Scholar] [CrossRef] [Green Version]
  21. Sánchez–Portocarrero, J.; Pérez–Cecilia, E.; Corral, O.; Romero–Vivas, J.; Picazo, J.J. The central nervous system and infection by Candida species. Diagn. Microbiol. Infect. Dis. 2000, 37, 169–179. [Google Scholar] [CrossRef]
  22. Zhang, P.; Lian, L.; Wang, F. Magnetic resonance imaging features of gelatinous pseudocysts in cryptococcal meningoencephalitis. Acta Neurol. Belg. 2018, 119, 265–267. [Google Scholar] [CrossRef] [PubMed] [Green Version]
  23. Jacobsen, I.D.; Lüttich, A.; Kurzai, O.; Hube, B.; Brock, M. In vivo imaging of disseminated murine Candida albicans infection reveals unexpected host sites of fungal persistence during antifungal therapy. J. Antimicrob. Chemother. 2014, 69, 2785–2796. [Google Scholar] [CrossRef] [PubMed] [Green Version]
  24. Asik, D.; Smolinski, R.; Abozeid, S.; Mitchell, T.B.; Turowski, S.G.; Spernyak, J.A.; Morrow, J.R. Modulating the Properties of Fe(III) Macrocyclic MRI Contrast Agents by Appending Sulfonate or Hydroxyl Groups. Molecules 2020, 25, 2291. [Google Scholar] [CrossRef]
  25. Snyder, E.M.; Asik, D.; Abozeid, S.M.; Burgio, A.; Bateman, G.; Turowski, S.G.; Spernyak, J.A.; Morrow, J.R. A Class of Fe III Macrocyclic Complexes with Alcohol Donor Groups as Effective T 1 MRI Contrast Agents. Angew. Chem. 2019, 132, 2435–2440. [Google Scholar] [CrossRef]
  26. Patel, A.; Asik, D.; Spernyak, J.A.; Cullen, P.J.; Morrow, J.R. MRI and fluorescence studies of Saccharomyces cerevisiae loaded with a bimodal Fe(III) T1 contrast agent. J. Inorg. Biochem. 2019, 201, 110832. [Google Scholar] [CrossRef]
  27. Patel, A.; Asik, D.; Snyder, E.M.; DiLillo, A.E.; Cullen, P.J.; Morrow, J.R. Binding and Release of FeIII Complexes from Glucan Particles for the Delivery of T 1 MRI Contrast Agents. ChemMedChem 2020, 15, 1050–1057. [Google Scholar] [CrossRef]
  28. Gimeno, C.J.; Ljungdahl, P.O.; Styles, C.A.; Fink, G.R. Unipolar cell divisions in the yeast S. cerevisiae lead to filamentous growth: Regulation by starvation and RAS. Cell 1992, 68, 1077–1090. [Google Scholar] [CrossRef]
  29. Cullen, P.J.; Sabbagh, J.W.; Graham, E.; Irick, M.M.; Van Olden, E.K.; Neal, C.; Delrow, J.; Bardwell, L.; Sprague, J.G.F. A signaling mucin at the head of the Cdc42- and MAPK-dependent filamentous growth pathway in yeast. Genes Dev. 2004, 18, 1695–1708. [Google Scholar] [CrossRef] [Green Version]
  30. Patel, A.; Mohammed, A.S.; Cullen, P.J.; Morrow, J.R. Co(II) macrocyclic complexes with fluorescent tags as paraCEST and cellCEST agents. 2020. Unpublished work. [Google Scholar]
  31. Kawai, S.; Hashimoto, W.; Murata, K. Transformation ofSaccharomyces cerevisiaeand other fungi. Bioeng. Bugs 2010, 1, 395–403. [Google Scholar] [CrossRef] [PubMed] [Green Version]
  32. Samira, M.; Abozeid, D.A.; Morrow, R.J. Liposomal Fe(III) complexes as T1, T2 and lipoCEST agents. 2020. Unpublished work. [Google Scholar]
  33. Mulas, G.; Ferrauto, G.; Dastru’, W.; Anedda, R.; Aime, S.; Terreno, E. Insights on the relaxation of liposomes encapsulating paramagnetic Ln-based complexes. Magn. Reson. Med. 2014, 74, 468–473. [Google Scholar] [CrossRef] [PubMed]
  34. Smith, P.; Krohn, R.; Hermanson, G.; Mallia, A.; Gartner, F.; Provenzano, M.; Fujimoto, E.; Goeke, N.; Olson, B.; Klenk, D. Measurement of protein using bicinchoninic acid. Anal. Biochem. 1985, 150, 76–85. [Google Scholar] [CrossRef]
  35. Nguyen, T.H.; Fleet, G.H.; Rogers, P.L. Composition of the cell walls of several yeast species. Appl. Microbiol. Biotechnol. 1998, 50, 206–212. [Google Scholar] [CrossRef]
  36. Mitchell, M.D.; Kundel, H.L.; Axel, L.; Joseph, P.M. Agarose as a tissue equivalent phantom material for NMR imaging. Magn. Reson. Imaging 1986, 4, 263–266. [Google Scholar] [CrossRef]
  37. Hellerbach, A.; Schuster, V.; Jansen, A.; Sommer, J. MRI Phantoms—Are There Alternatives to Agar? PLoS ONE 2013, 8, e70343. [Google Scholar] [CrossRef] [Green Version]
  38. Young, S.; Wong, M.; Tabata, Y.; Mikos, A.G. Gelatin as a delivery vehicle for the controlled release of bioactive molecules. J. Control. Release 2005, 109, 256–274. [Google Scholar] [CrossRef]
  39. Komaiko, J.; McClements, D.J. Food-grade nanoemulsion filled hydrogels formed by spontaneous emulsification and gelation: Optical properties, rheology, and stability. Food Hydrocoll. 2015, 46, 67–75. [Google Scholar] [CrossRef]
  40. Dowling, M.B.; Lee, J.-H.; Raghavan, S.R. pH-Responsive Jello: Gelatin Gels Containing Fatty Acid Vesicles†. Langmuir 2009, 25, 8519–8525. [Google Scholar] [CrossRef]
  41. Ferrauto, G.; Di Gregorio, E.; Castelli, D.D.; Aime, S. CEST-MRI studies of cells loaded with lanthanide shift reagents. Magn. Reson. Med. 2018, 80, 1626–1637. [Google Scholar] [CrossRef] [PubMed]
  42. Dorazio, S.J.; Olatunde, A.O.; Spernyak, J.A.; Morrow, J.R. CoCEST: Cobalt(II) amide-appended paraCEST MRI contrast agents. Chem. Commun. 2013, 49, 10025–10027. [Google Scholar] [CrossRef] [PubMed]
  43. Maaloum, M.; Pernodet, N.; Tinland, B. Agarose gel structure using atomic force microscopy: Gel concentration and ionic strength effects. Electrophoresis 1998, 19, 1606–1610. [Google Scholar] [CrossRef] [PubMed]
  44. Stellwagen, J.; Stellwagen, N.C. Internal Structure of the Agarose Gel Matrix. J. Phys. Chem. 1995, 99, 4247–4251. [Google Scholar] [CrossRef]
  45. Griess, G.; Guiseley, K.; Serwer, P. The relationship of agarose gel structure to the sieving of spheres during agarose gel electrophoresis. Biophys. J. 1993, 65, 138–148. [Google Scholar] [CrossRef] [Green Version]
  46. Hutchens, M.; Luker, G.D. Applications of bioluminescence imaging to the study of infectious diseases. Cell. Microbiol. 2007, 9, 2315–2322. [Google Scholar] [CrossRef] [Green Version]
  47. Andreu, N.; Zelmer, A.; Wiles, S. Noninvasive biophotonic imaging for studies of infectious disease. FEMS Microbiol. Rev. 2011, 35, 360–394. [Google Scholar] [CrossRef] [Green Version]
  48. Morad, H.O.J.; Wild, A.-M.; Wiehr, S.; Davies, G.; Maurer, A.; Pichler, B.J.; Thornton, C.R. Pre-clinical Imaging of Invasive Candidiasis Using ImmunoPET/MR. Front. Microbiol. 2018, 9, 1996. [Google Scholar] [CrossRef] [Green Version]
  49. Bleeker-Rovers, C.; Warris, A.; Drenth, J.; Corstens, F.; Oyen, W.J.; Kullberg, B.-J.; Bleeker-Rovers, C.P. Diagnosis of Candida lung abscesses by 18F-fluorodeoxyglucose positron emission tomography. Clin. Microbiol. Infect. 2005, 11, 493–495. [Google Scholar] [CrossRef] [Green Version]
  50. Lesage, G.; Bussey, H. Cell Wall Assembly in Saccharomyces cerevisiae. Microbiol. Mol. Boil. Rev. 2006, 70, 317–343. [Google Scholar] [CrossRef] [Green Version]
  51. Dörr, T.; Moynihan, P.J.; Mayer, C. Editorial: Bacterial Cell Wall Structure and Dynamics. Front. Microbiol. 2019, 10, 2051. [Google Scholar] [CrossRef] [PubMed] [Green Version]
  52. Romaniuk, J.A.H.; Cegelski, L. Bacterial cell wall composition and the influence of antibiotics by cell-wall and whole-cell NMR. Philos. Trans. R. Soc. B Biol. Sci. 2015, 370, 20150024. [Google Scholar] [CrossRef] [PubMed]
  53. Tee, Y.K.; Donahue, M.J.; Harston, G.W.J.; Payne, S.J.; Chappell, M. Quantification of amide proton transfer effect pre- and post-gadolinium contrast agent administration. J. Magn. Reson. Imaging 2013, 40, 832–838. [Google Scholar] [CrossRef] [PubMed] [Green Version]
  54. Kurki, T.; Niemi, P.T.; Lundbom, N. Gadolinium-enhanced magnetization transfer contrast imaging of intracranial tumors. J. Magn. Reson. Imaging 1992, 2, 401–406. [Google Scholar] [CrossRef] [PubMed]
  55. Mukaremera, L.; Lee, K.K.; Mora-Montes, H.M.; Gow, N.A.R. Candida albicans Yeast, Pseudohyphal, and Hyphal Morphogenesis Differentially Affects Immune Recognition. Front. Immunol. 2017, 8, 629. [Google Scholar] [CrossRef] [Green Version]
  56. Creger, P.E.; Blankenship, J.R. Analysis of gene expression in filamentous cells of Candida albicans grown on agar plates. J. Boil. Methods 2018, 5, e84. [Google Scholar] [CrossRef] [Green Version]
  57. Terreno, E.; Crich, S.G.; Belfiore, S.; Biancone, L.; Cabella, C.; Esposito, G.; Manazza, A.D.; Aime, S. Effect of the intracellular localization of a Gd-based imaging probe on the relaxation enhancement of water protons. Magn. Reson. Med. 2006, 55, 491–497. [Google Scholar] [CrossRef]
  58. Li, F.; Svarovsky, M.J.; Karlsson, A.J.; Wagner, J.P.; Marchillo, K.; Oshel, P.; Andes, D.; Palecek, S.P. Eap1p, an Adhesin That Mediates Candida albicans Biofilm Formation In Vitro and In Vivo. Eukaryot. Cell 2007, 6, 931–939. [Google Scholar] [CrossRef] [Green Version]
  59. Liu, Y.; Filler, S.G. Candida albicans Als3, a Multifunctional Adhesin and Invasin. Eukaryot. Cell 2010, 10, 168–173. [Google Scholar] [CrossRef] [Green Version]
  60. McCall, A.D.; Pathirana, R.U.; Prabhakar, A.; Cullen, P.J.; Edgerton, M. Candida albicans biofilm development is governed by cooperative attachment and adhesion maintenance proteins. NPJ Biofilms Microbiomes 2019, 5, 1–12. [Google Scholar] [CrossRef] [Green Version]
  61. Rupert, C.B.; Heltzel, J.M.H.; Taylor, D.J.; Rusché, L. Sporadic Gene Loss After Duplication Is Associated with Functional Divergence of Sirtuin Deacetylases AmongCandidaYeast Species. G3 Genes Genomes Genet. 2016, 6, 3297–3305. [Google Scholar] [CrossRef] [PubMed] [Green Version]
  62. Gillum, A.M.; Tsay, E.Y.H.; Kirsch, D.R. Isolation of the Candida albicans gene for orotidine-5′-phosphate decarboxylase by complementation of S. cerevisiae ura3 and E. coli pyrF mutations. Mol. Genet. Genom. 1984, 198, 179–182. [Google Scholar] [CrossRef] [PubMed]
  63. Liu, H.; Kohler, J.; Fink, G. Suppression of hyphal formation in Candida albicans by mutation of a STE12 homolog. Science 1994, 266, 1723–1726. [Google Scholar] [CrossRef] [PubMed]
  64. Rines, D.R.; Thomann, D.; Dorn, J.F.; Goodwin, P.; Sorger, P.K. Live Cell Imaging of Yeast. Cold Spring Harb. Protoc. 2011, 2011, 1026–1041. [Google Scholar] [CrossRef]
  65. Farhat, Y. Protocol for Cell-Seeded Collagen Gels. Available online: http://protocol-place.com/cell-culture/cell-seeded-collagen-gel-protocol/ (accessed on 2 October 2019).
  66. McIntosh, L.P. CPMG. In Encyclopedia of Biophysics; Springer Science and Business Media LLC: Berlin, Germany, 2013; p. 386. [Google Scholar]
  67. Chow, J.; Notaro, M.; Prabhakar, A.; Free, S.J.; Cullen, P.J. Impact of Fungal MAPK Pathway Targets on the Cell Wall. J. Fungi 2018, 4, 93. [Google Scholar] [CrossRef] [Green Version]
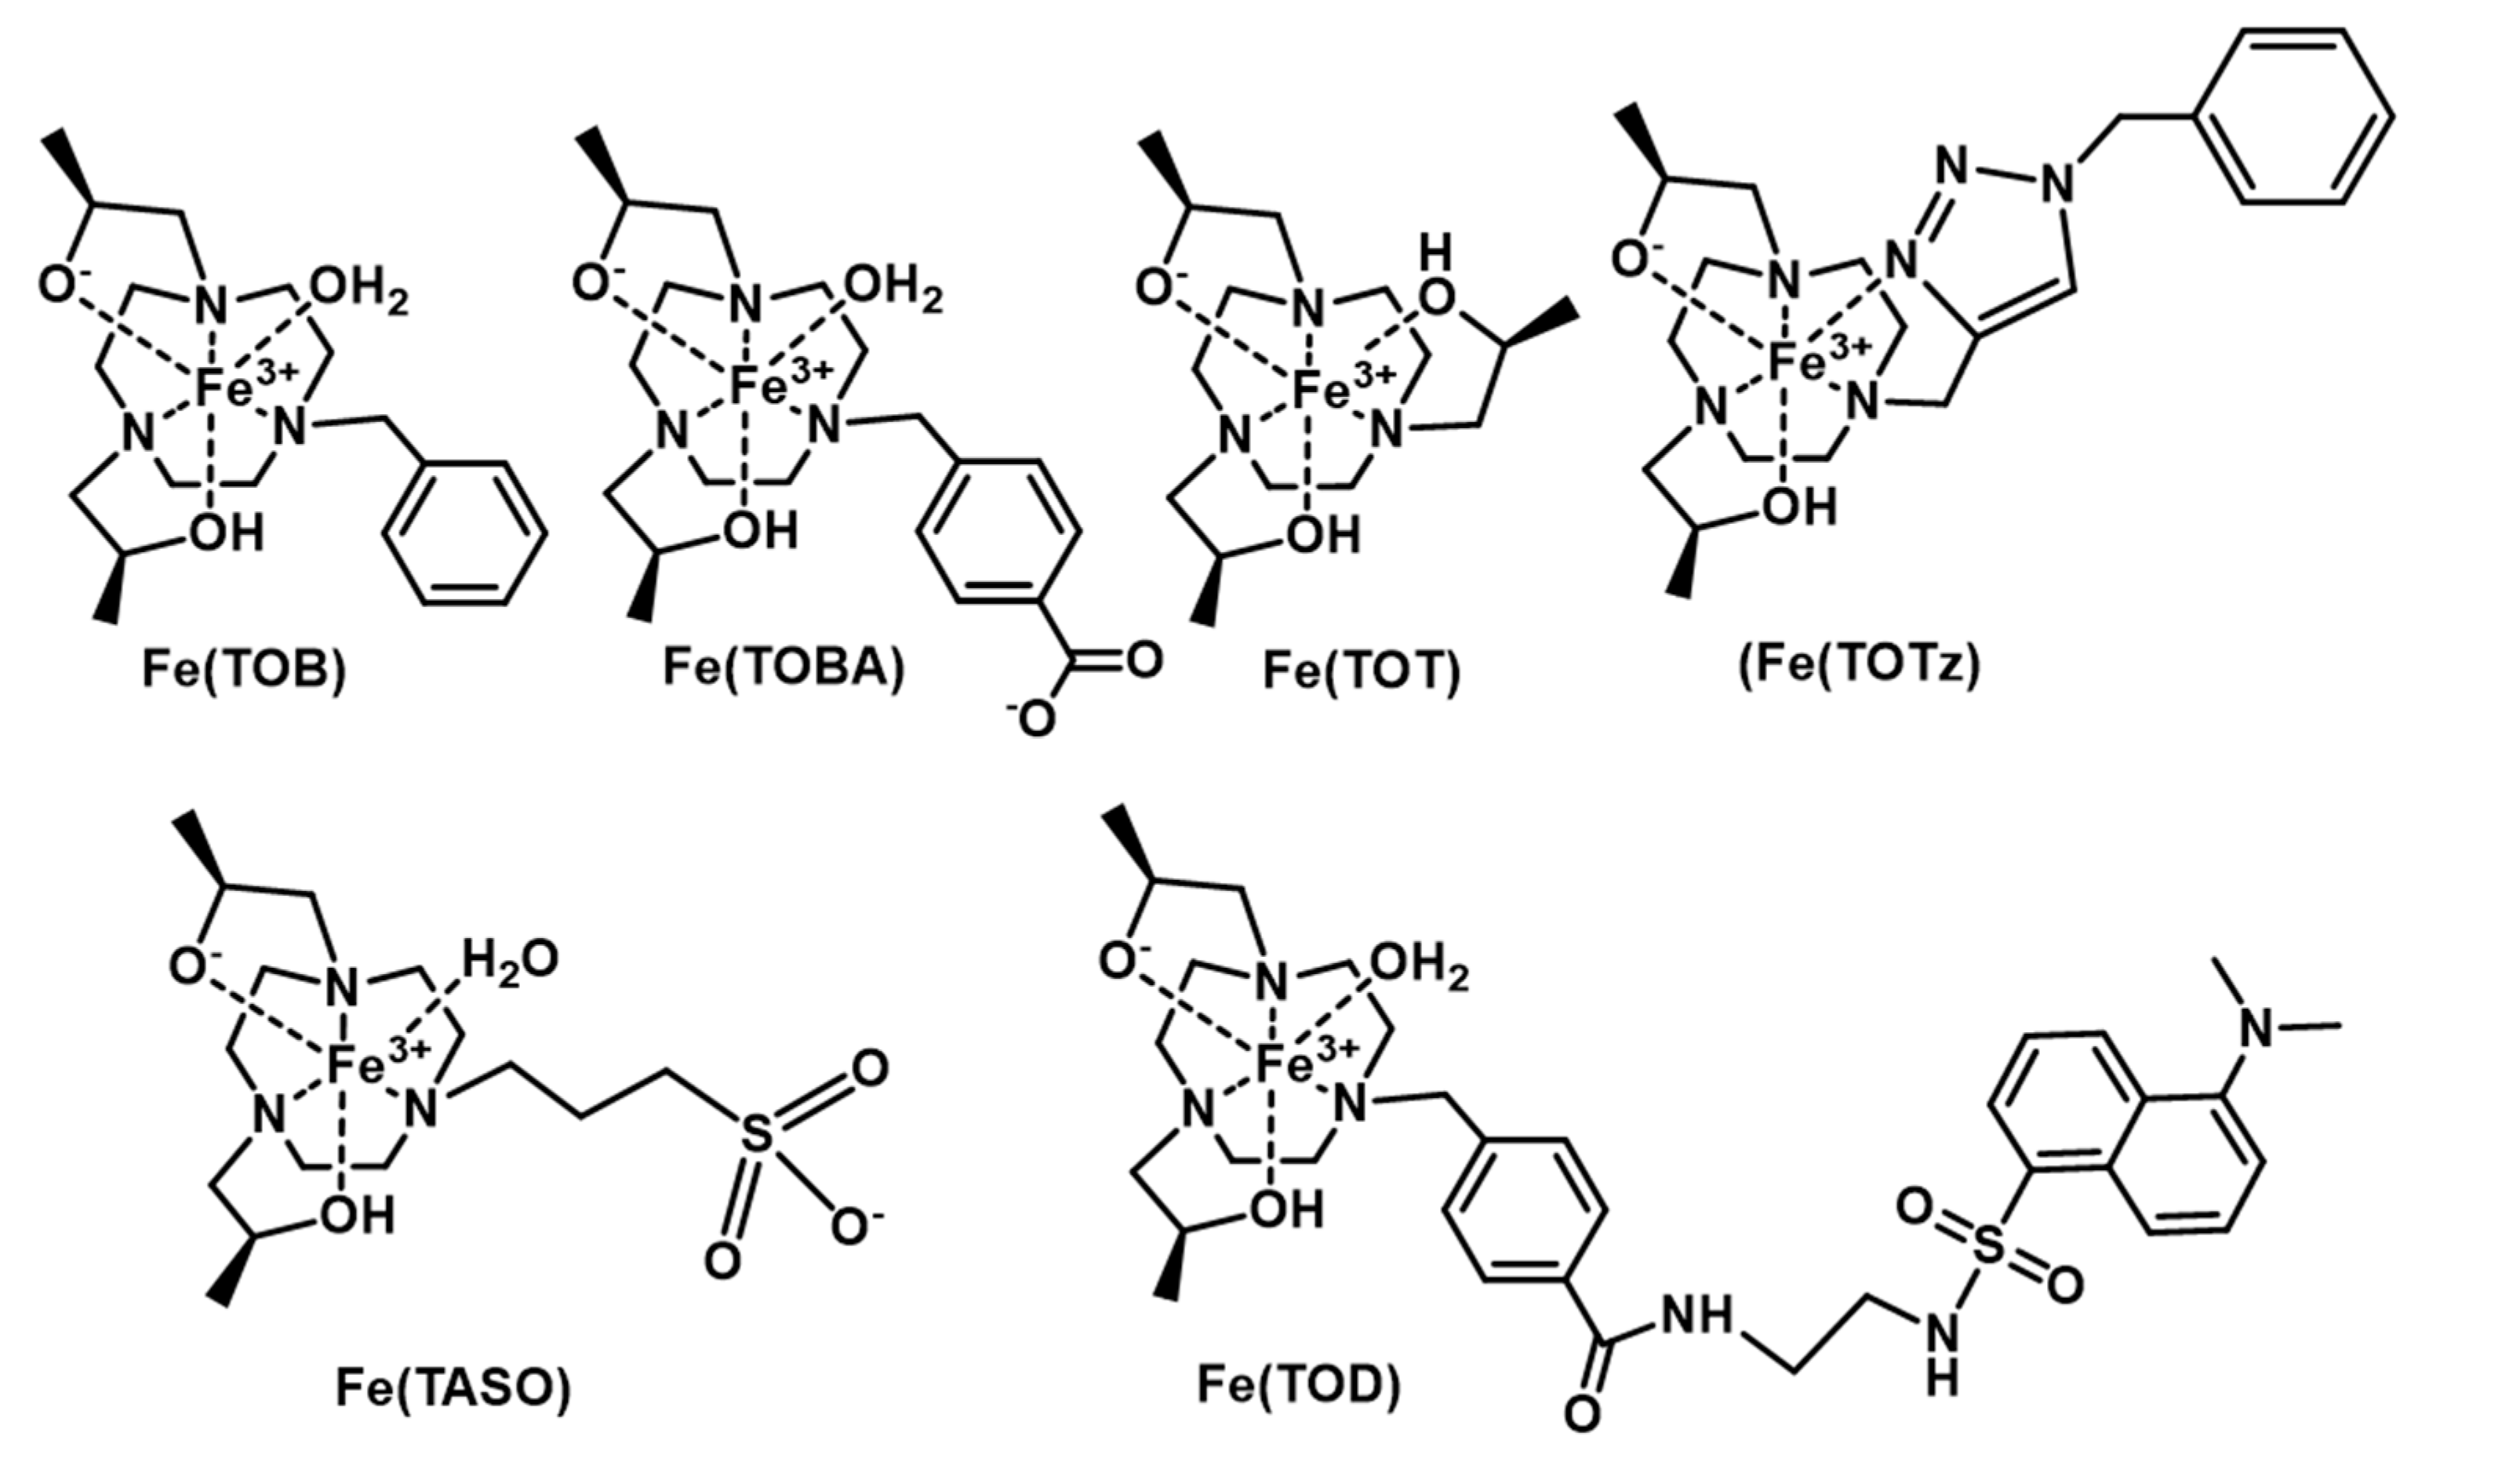
Scheme 1. Fe(III) complexes that are shown with the predominant species at a neutral pH.
Magnetochemistry 06 00041 sch001
Figure 1. Z-spectra of the control (solid line) and 10 mM Fe(TOB)-labeled (dashed line) cells using endocytosis in S. cerevisiae in 1× PBS at 37 °C.
Magnetochemistry 06 00041 g001
Figure 2. Confocal fluorescence microscopy images of the S. cerevisiae PC538 cells: (A) control cells and (B) Fe(TOD)-treated (10 mM) cells. DIC stands for differential interference contrast. Excitation was at 405 nm and emission was at 520–560 nm.
Magnetochemistry 06 00041 g002
Figure 3. Total Fe content in yeast cells during (a) endocytosis and heat treatment with 10 mM Fe(TOB) complexes, endocytosis labeling with 10 mM Fe(TOD), and endocytosis labeling with 10 mM Fe(TOT) in S. cerevisiae; (b) endocytosis labeling of 10 mM Fe(TOB) treatment with S. cerevisiae, C. albicans yeast, and C. albicans hyphae, as measured using ICPMS. Mean ± SE is reported, **** p < 0.0001 and ** p < 0.001, n = 3.
Magnetochemistry 06 00041 g003
Figure 4. Scanning electron micrograph of the control and Fe(TOB)-labeled S. cerevisiae.
Magnetochemistry 06 00041 g004
Figure 5. (a) R2 values of water protons using a Carr–Purcell–Meiboom–Gill (CPMG) sequence in a 9.4 T NMR spectrometer with C. albicans yeast and hyphae cells suspended in 15% (w/v) gelatin at 37 °C. All cell samples contained ≈125 µg protein/mL. Mean ± SE is reported, **** p < 0.0001 and n = 3 for cells. (b) Microscopy images of C. albicans yeast and hyphae cells.
Magnetochemistry 06 00041 g005
Figure 6. R2 values of water protons determined using a CPMG sequence on samples containing increasing concentrations of Fe(TOB)-labeled cells suspended in 15% (w/v) gelatin in a 9.4 T NMR spectrometer.
Magnetochemistry 06 00041 g006
Scheme 2. Proposed tertiary complex with maltol and Fe(III) complexes with R being a proton or an amide or carboxylate based substitutent.
Magnetochemistry 06 00041 sch002
Figure 7. Schematic representation of the uptake and cell association with the tentative localization of Fe(III) complexes: (a) endocytosis treatment of Fe(TOB), (b) heat treatment of Fe(TOB), and (c) endocytosis treatment of Fe(TOD).
Magnetochemistry 06 00041 g007