Article

Ten-Coordinate Lanthanide [Ln(HL)(L)] Complexes (Ln = Dy, Ho, Er, Tb) with Pentadentate N3O2-Type Schiff-Base Ligands: Synthesis, Structure and Magnetism

by
Tamara A. Bazhenova
1,
Ilya A. Yakushev
1,2,3,
Konstantin A. Lyssenko
4,
Olga V. Maximova
1,5,6,
Vladimir S. Mironov
1,7,*,
Yuriy V. Manakin
1,
Alexey B. Kornev
1,
Alexander N. Vasiliev
5,8 and
Eduard B. Yagubskii
1,*
1
Institute of Problems of Chemical Physics, 142432 Chernogolovka, Russia
2
Kurnakov Institute of General and Inorganic Chemistry, 119991 Moscow, Russia
3
National Research Center “Kurchatov Institute”, 123182 Moscow, Russia
4
Department of Chemistry, Lomonosov Moscow State University, 119991 Moscow, Russia
5
Faculty of Physics, Lomonosov Moscow State University, 119991 Moscow, Russia
6
National University “MISiS”, 119049 Moscow, Russia
7
Shubnikov Institute of Crystallography of Federal Scientific Research Centre “Crystallography and Photonics” RAS, 119333 Moscow, Russia
8
National Research South Ural State University, 454080 Chelyabinsk, Russia
*
Authors to whom correspondence should be addressed.
Magnetochemistry 2020, 6(4), 60; https://doi.org/10.3390/magnetochemistry6040060
Submission received: 26 October 2020 / Revised: 7 November 2020 / Accepted: 9 November 2020 / Published: 13 November 2020
(This article belongs to the Section Magnetic Materials)

Abstract

:
A series of five neutral mononuclear lanthanide complexes [Ln(HL)(L)] (Ln = Dy3+, Ho3+ Er3+ and Tb3+) with rigid pentadentate N3O2-type Schiff base ligands, H2LH (1-Dy, 3-Ho, 4-Er and 6-Tb complexes) or H2LOCH3, (2-Dy complex) has been synthesized by reaction of two equivalents of 1,1′-(pyridine-2,6-diyl)bis(ethan-1-yl-1-ylidene))dibenzohydrazine (H2LH, [H2DAPBH]) or 1,1′-(pyridine-2,6-diyl)bis(ethan-1-yl-1-ylidene))di-4-methoxybenzohydrazine (H2LOCH3, [H2DAPMBH]) with common lanthanide salts. The terbium complex [Tb(LH)(NO3)(H2O)2](DME)2 (5-Tb) with one ligand H2LH was also obtained and characterized. Single crystal X-ray analysis shows that complexes 14 have the composition {[Ln3+(HL)(L)2−] solv} and similar molecular structures. In all the compounds, the central Ln3+ ion is chelated by two interlocked pentadentate ligands resulting in the coordination number of ten. Each lanthanide ion is coordinated by six nitrogen atoms and four oxygen atoms of the two N3O2 chelating groups forming together a distorted bicapped square antiprismatic polyhedron N6O4 with two capping pyridyl N atoms in the apical positions. The ac magnetic measurements reveal field-induced single-molecule magnet (SMM) behavior of the two dysprosium complexes (with barriers of Ueff = 29 K at 800 Oe in 1-Dy and Ueff = 70 K at 300 Oe in 2-Dy) and erbium complex (Ueff = 87 K at 1500 Oe in 4-Er); complex 3-Ho with a non-Kramers Ho3+ ion is SMM-silent. Although 2-Dy differs from 1-Dy only by a distant methoxy-group in the phenyl ring of the ligand, their dynamic magnetic properties are markedly different. This feature can be due to the difference in long-range contributions (beyond the first coordination sphere) to the crystal-field (CF) potential of 4f electrons of Dy3+ ion that affects magnetic characteristics of the ground and excited CF states. Magnetic behavior and the electronic structure of Ln3+ ions of 14 complexes are analyzed in terms of CF calculations.

Graphical Abstract

1. Introduction

Over the past decades, single-molecule magnets (SMMs) [1,2,3,4] have been attracting extensive research interest due to their huge forward-looking applications in the fields of quantum computing, high-density information storage and molecule spintronics [5,6,7]. SMMs are magnetically bistable high-spin molecules featuring a double-well potential with the two lowest spin states MS = ±S separated by the energy barrier Ueff = |D|S2 (or |D|S2–1/4) for half-integer spin S, with D being the molecular magnetic anisotropy parameter. Below the characteristic blocking temperature TB, magnetic moment can be trapped in one of the ±MS states thus resulting in slow magnetic relaxation and magnetic hysteresis [1,2,3,4]. After a decade of intense research of polynuclear SMMs based on high-spin 3d-ions in the early period, the discovery in 2003 of mononuclear [Pc2Ln] phthalocyanine double-decker lanthanide complexes showing slow spin relaxation [8] turned attention to the lanthanide SMMs [9,10,11,12,13,14,15,16,17,18], which exhibit high magnetic anisotropy and energy barrier due to the large angular momentum and strong spin-orbit coupling of lanthanide ions. The recent progress in advanced SMMs is associated with lanthanide complexes, especially complexes of heavy lanthanides, Tb(III) [8,19,20,21], Dy(III) [22,23,24,25,26,27,28,29], Ho(III) [30,31,32] and Er(III) [33,34,35,36]. Among them, mononuclear lanthanide complexes with slow magnetic relaxation, commonly referenced to as single-ion magnets (SIMs), are of special interest, since they provide a more efficient control of the magnetic anisotropy D and barrier Ueff as compared with polynuclear Ln-SMMs [11,13,14,15,16,17,18,19,20,21,22,23,24,25,26,27,28,29,30,31,32,33,34,35,36]. Magnetic anisotropy of the lanthanide ion is strongly influenced by the crystal-field (CF) spitting pattern of the ground J-multiplet, which is specified by the coordination geometry and electronic configuration of the 4f-ion. In particular, coordination environment with a high-order symmetry axis can provide axial magnetic anisotropy, which minimize the quantum tunneling of magnetization thus ultimately leading to a high energy barrier Ueff and blocking temperature TB [9,10,11,12,17,18]. In this regard, pseudo-linear complexes of heavy lanthanides with strongly donating axial ligands are of particular interest as high-performance SIMs, since they ensure the most advantageous Ising-type CF splitting pattern required for high energy barrier Ueff featuring a well isolated doubly degenerate ground energy level with pure MJ = ±J states and large total CF splitting energy [37]. In particular, such favorable conditions occur in pentagonal bipyramidal (D5h-symmetry) dysprosium complexes [24,26,27,28,29] possessing a barrier over 1000 cm−1 and blocking temperatures TB about 20 K [26,27]. More recent example are dysprosium pseudo-linear sandwich complexes, which display huge barriers and record blocking temperatures, such as Ueff = 1277 cm−1 and TB = 60 K in [(Cpttt)2Dy]+ [38,39] and Ueff = 1543 cm−1 and TB = 80 K in [(CpiPr5)Dy(Cp*)]+ [40], reaching the liquid nitrogen temperature range.
These breakthrough advances have stimulated an extensive study of PBP lanthanide complexes in recent years [26,27,28,29,41,42,43,44,45,46,47]. However, in the record-breaking PBP complexes with general formula [Dy(OR)2(L)5]+ [26,27,28,29,41], the pentagonal coordination geometry arises rather accidentally, probably due to the packing of monodentate ligands L, and, therefore, it is likely structurally labile. More structurally robust PBP coordination of Ln ions is provided by rigid pentadentate chelating ligands in the equatorial plane. A number of lanthanide complexes with polydentate ligands were reported in the literature [48,49,50], including Ln(III) texaphyrin complexes [48,49] and Schiff-base complexes with the [N5] or [N3O2] chelating ring displaying SMM behavior [50,51,52].
Previously, we described synthesis, structure and magnetic properties of [Ln(H2dapsc)(H2O)4](NO3)3 complexes of heavy lanthanides (Ln = Tb, Dy, Ho and Er) with a pentadentate (N3O2) Schiff-base ligand (H2dapsc = 2,6-diacetylpyridine bis(semicarbazone)) [53]. These complexes display a quasi-PBP geometry due to the presence of several water molecules in the apical positions. The dysprosium and erbium complexes exhibit slow magnetic relaxation with the barrier of 18 and 11 K, respectively. More recently, we reported structural and magnetic characteristics of 1D coordination polymers {[Ln(DAPMBH)(μ-N3)C2H5OH]C2H5OH}n (where H2DAPMBH = 2,6-diacetylpyridine bis(4-methoxybenzoylhydrazone, a new pentadentate [N3O2] ligand, Ln = Dy, Er, Gd and Y) built of chains composed of azido-bridged pentagonal lanthanide complexes [Ln(DAPMBH)]; of these, Dy and Er compounds exhibit SMM behavior with Ueff/kB = 47 K and 17 K, respectively [54]. In addition, there has been a report of true PBP (D5h) lanthanide complexes [LnIII(H2L)Cl2] (Ln = Dy, Tb) with the pentadentate ligand (H2L = 2,6-diacetylpyridine bis-(salicylhydrazone)) in the equatorial plane and two apical Cl atoms; the Dy complex is an SMM with Ueff/kB = 70 K [50]. These results indicate that lanthanide complexes with a rigid five-membered chelate ring in the equatorial plane are a promising avenue for designing SMMs.
In this paper, we report syntheses, structural characterization and magnetic properties of novel neutral mononuclear lanthanide complexes with the general formula [Ln(HL)(L)](solv) (Ln = Dy, Ho, Er, Tb; solv = CH3OH, C2H5OH, H2O, CHCl3), in which the lanthanide ions are doubly chelated by five-membered rings (N3O2) of two pentadentate ligands, H2DAPBH = 2,6-bis(phenylhydrazone)pyridine or H2DAPMBH = 2,6-bis(4-methoxy-benzoylhydrazide)pyridine) resulting in a rather symmetric N6O4 ten-fold coordination. Such a type of coordination is rare for lanthanide complexes with two polydentate planar ligands [55,56,57]. We present results of static and dynamic magnetic measurements of complexes 14, which are analyzed in terms of detailed crystal-field (CF) calculations with the aim to relate magnetic relaxation properties of these complexes to the specific electronic structure of Ln3+ ions and to assess their SMM performance.

2. Results and Discussion

2.1. Synthetic Aspects

All mononuclear Ln3+ complexes are obtained in a similar way by mixing hydrated lanthanide nitrate, chloride or formate salts and pentadentate ligand (H2DAPBH or H2DAPMBH) in methyl or ethyl alcohol. In all cases, at the ratio ligand/metal salt = 2 and in the presence of two equivalents of Et3N as a base, the main products are charge-neutral mononuclear complexes of the composition {[Ln(HDAPBH)(DAPBH)]solv}, in which Ln3+ ion binds two pentadentate ligands. Complexes are readily soluble in hot alcohols. Single crystals of compounds 1-Dy, 2-Dy are obtained by slow evaporation of the filtered mother liquors, while preparation of 3-Ho, 4-Er single crystals requires recrystallization from other solvents.
The nature of byproducts precipitated during the synthesis of the title compounds was deduced by finding the molecular structure of the compound 5-Tb precipitated during the synthesis of the complex [Tb(HL)(L)]∙CH3OH. The filtered precipitate was dissolved in dimethoxyethane (DME), from which crystals of 5-Tb separated on slow evaporation. The X-ray single crystal analysis of 5-Tb revealed that it is a nine-coordinate neutral mononuclear complex having a 1:1 ratio of Tb and the dianionic [DAPBH]2− ligand, with a bidentate nitrate anion and two H2O molecules coordinated to the metal ion in axial positions (see Figure 1).
Apparently, similar complexes formed as byproducts in all other cases (in particular, the analysis of solids formed during the synthesis of 1-Dy or 3-Ho complexes showed that they have a composition close to that of 5-Tb with the ratio Ln/ligand = 1). Complexes of similar composition with the H2DAPBH ligand were obtained earlier for several rare earth elements [55,56,57].

2.2. X-Ray Crystallography

Single-crystal X-ray diffraction analysis revealed that all the five compounds had a very similar molecular architecture but crystallized in different space groups. The crystallographic data and structure refinements details for complexes 1-Dy, 2-Dy, 3-Ho, 4-Er and 5-Tb are given in Table 1, and the selected bond lengths and angles for ten-coordinate complexes 1-Dy, 2-Dy, 3-Ho and 4-Er are listed in Table 2.
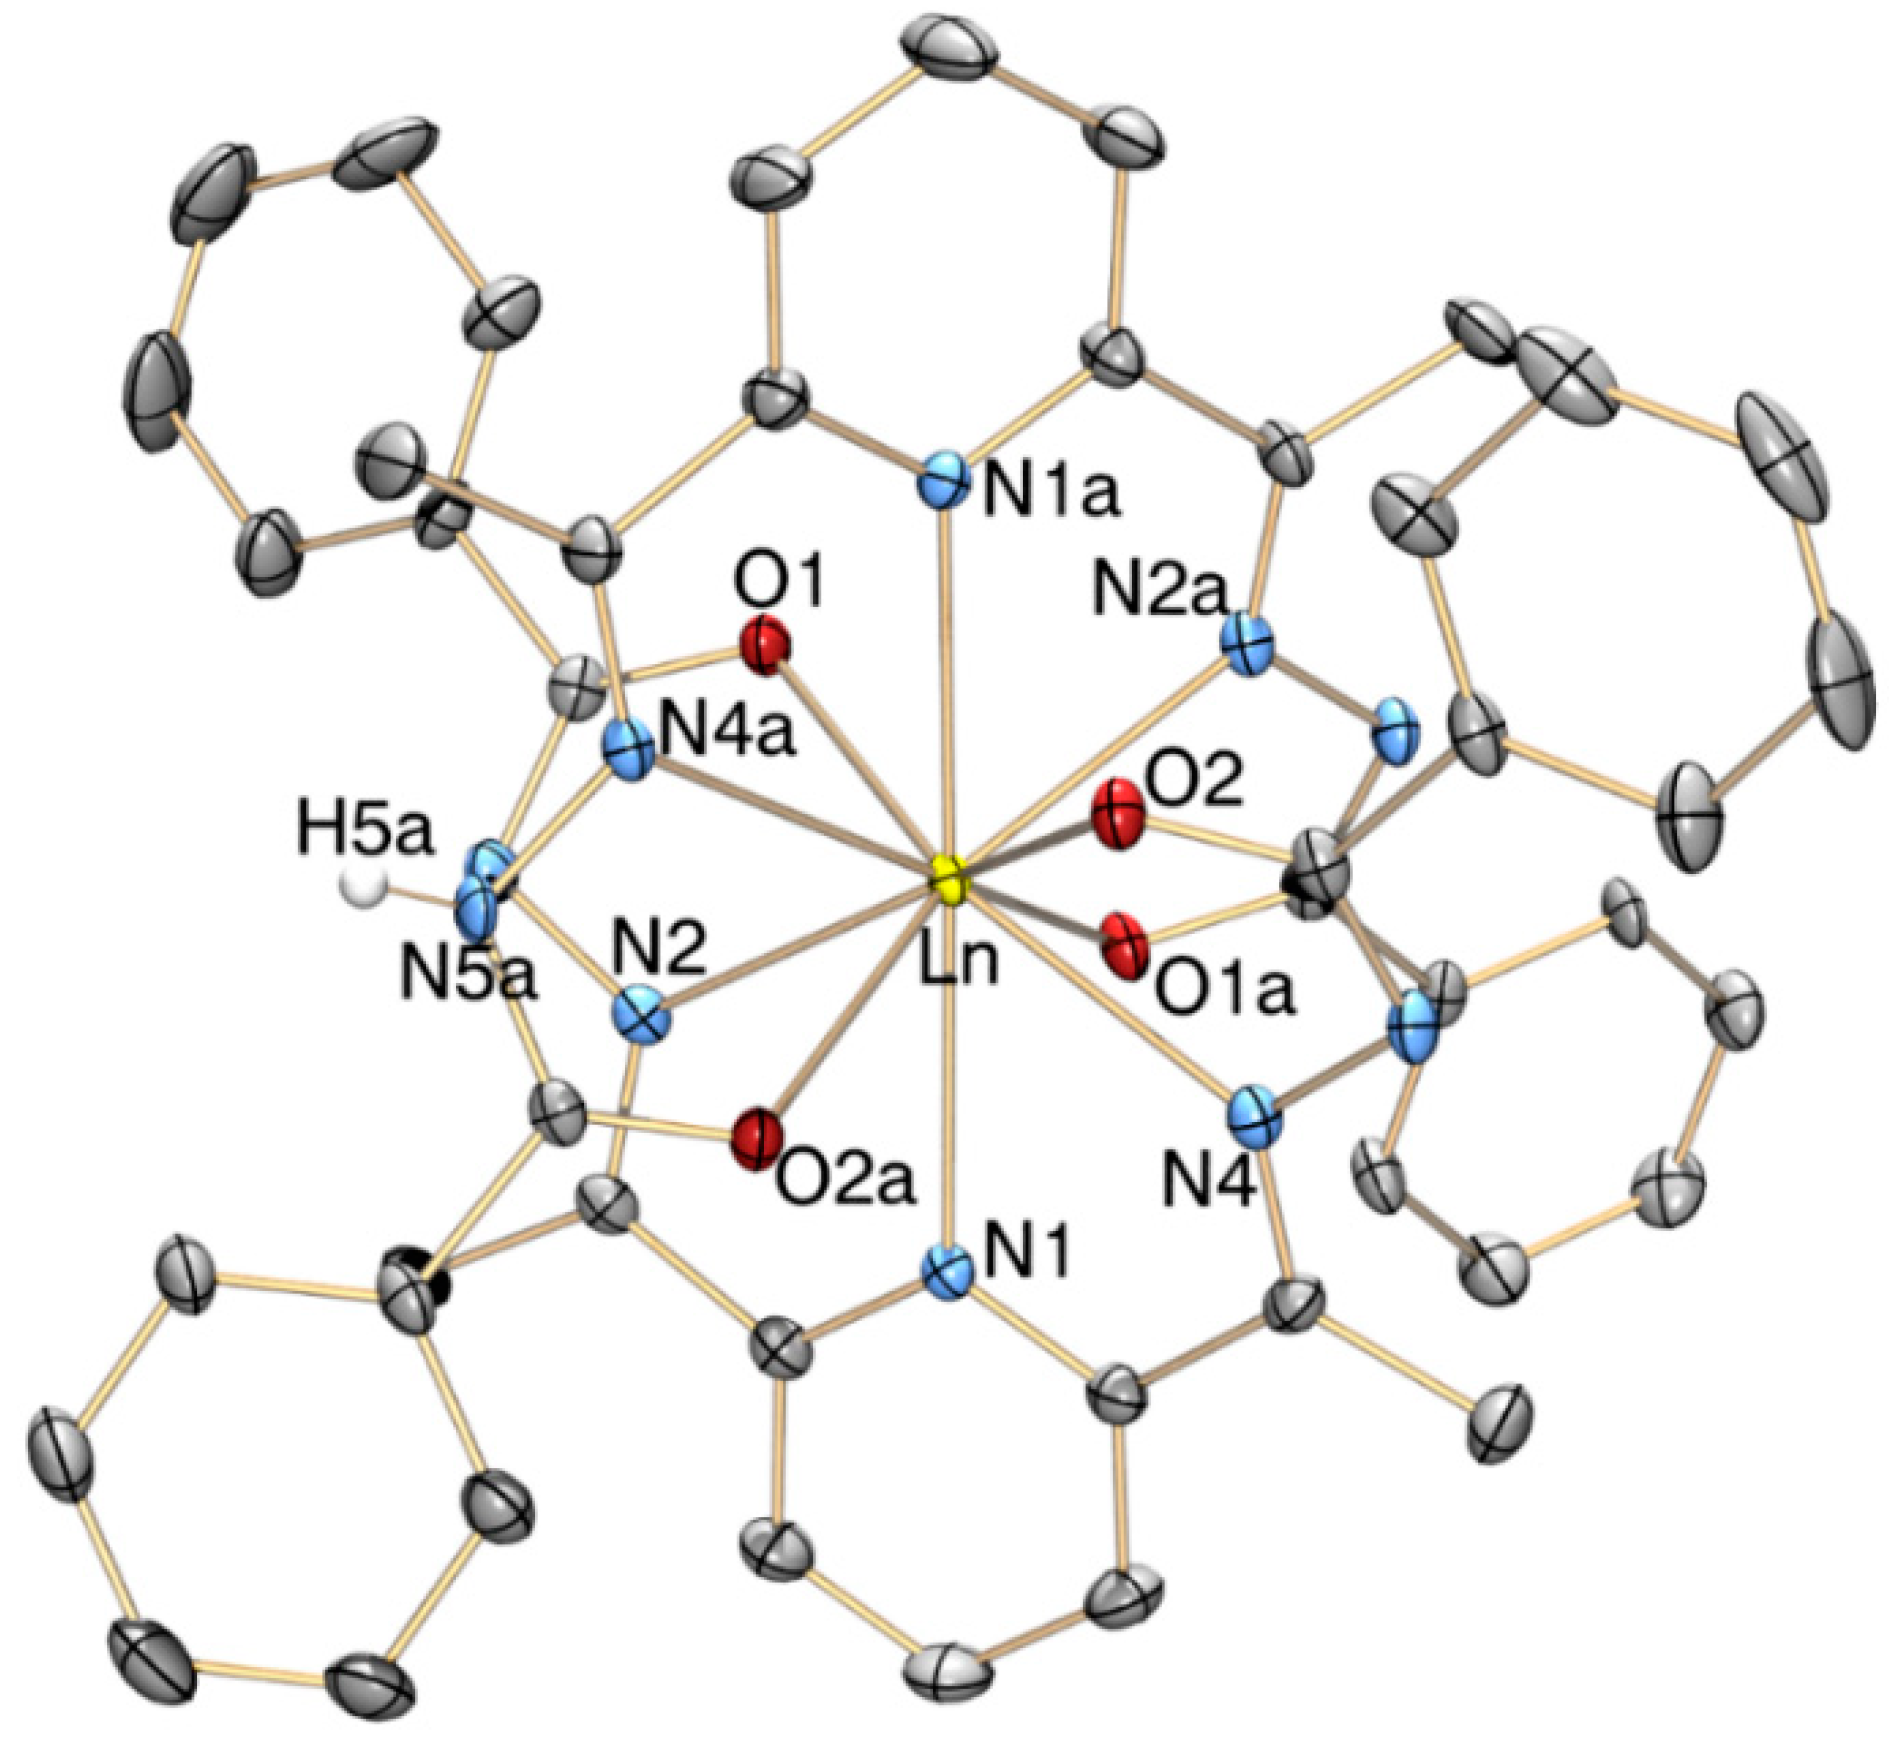
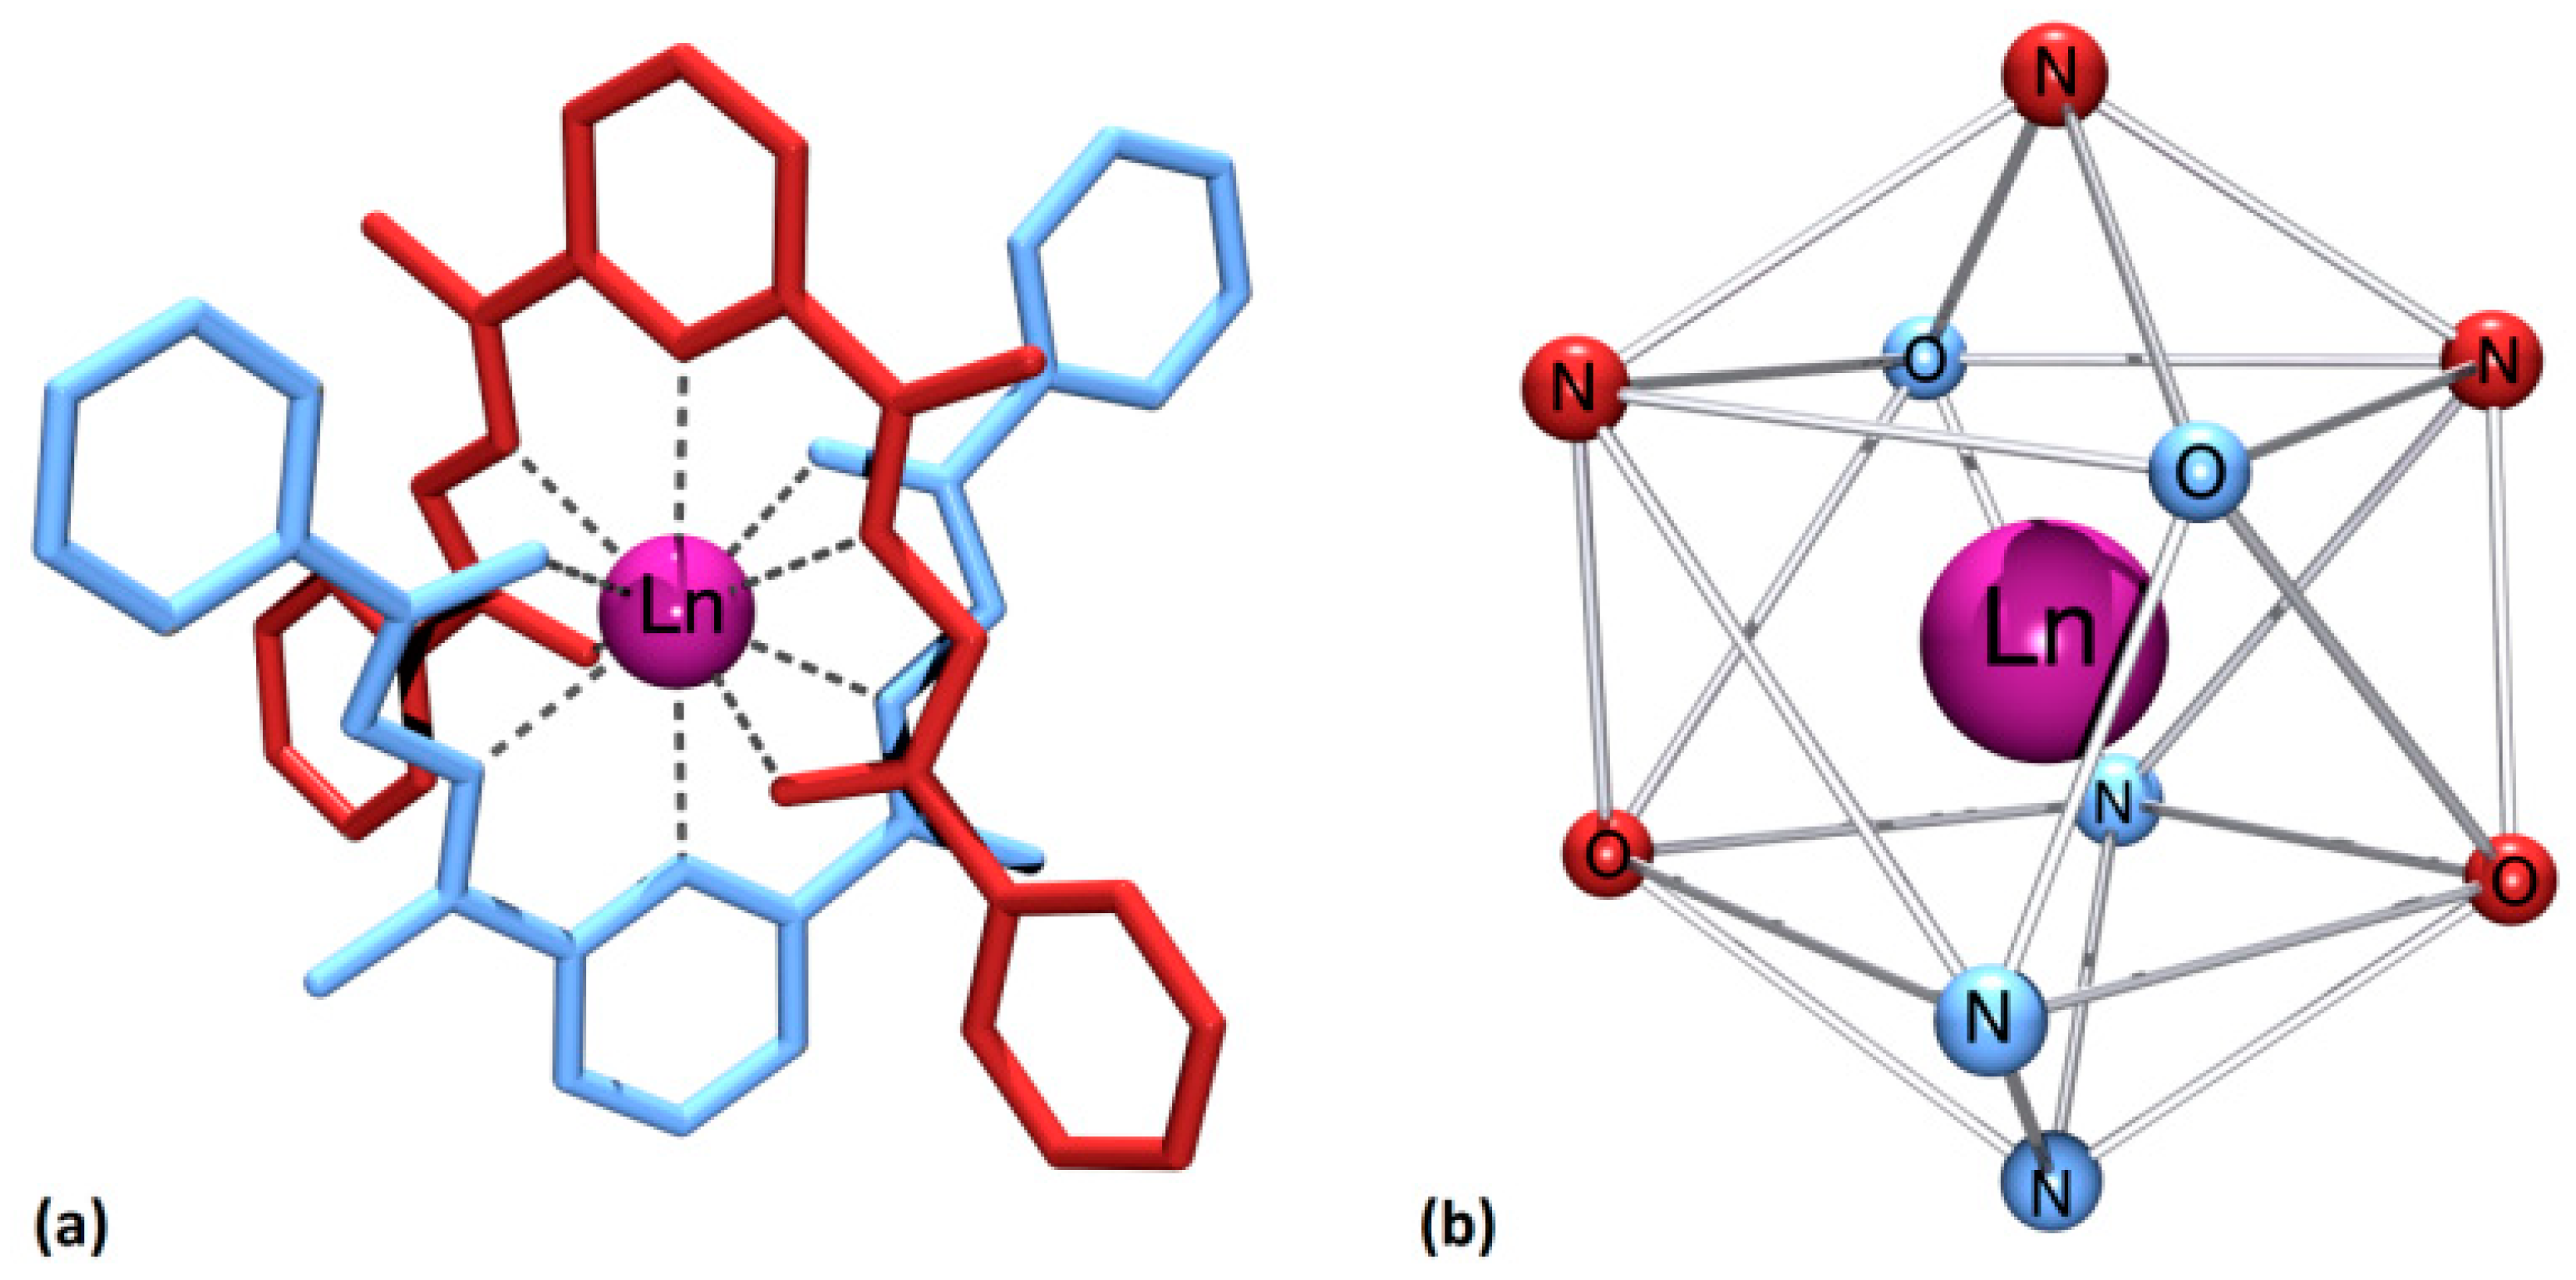
The central Ln3+ ion in all the four compounds was chelated by two interlocked pentadentate ligands (L or L(OCH3)) with the N3O2 donor set (Figure 2) resulting in the coordination number of ten (shown schematically in Figure 3a). Each metal ion was coordinating by six nitrogen atoms and four oxygen atoms, which together formed a bicapped square antiprismatic polyhedron capped by the pyridyl N atoms (Figure 3b).
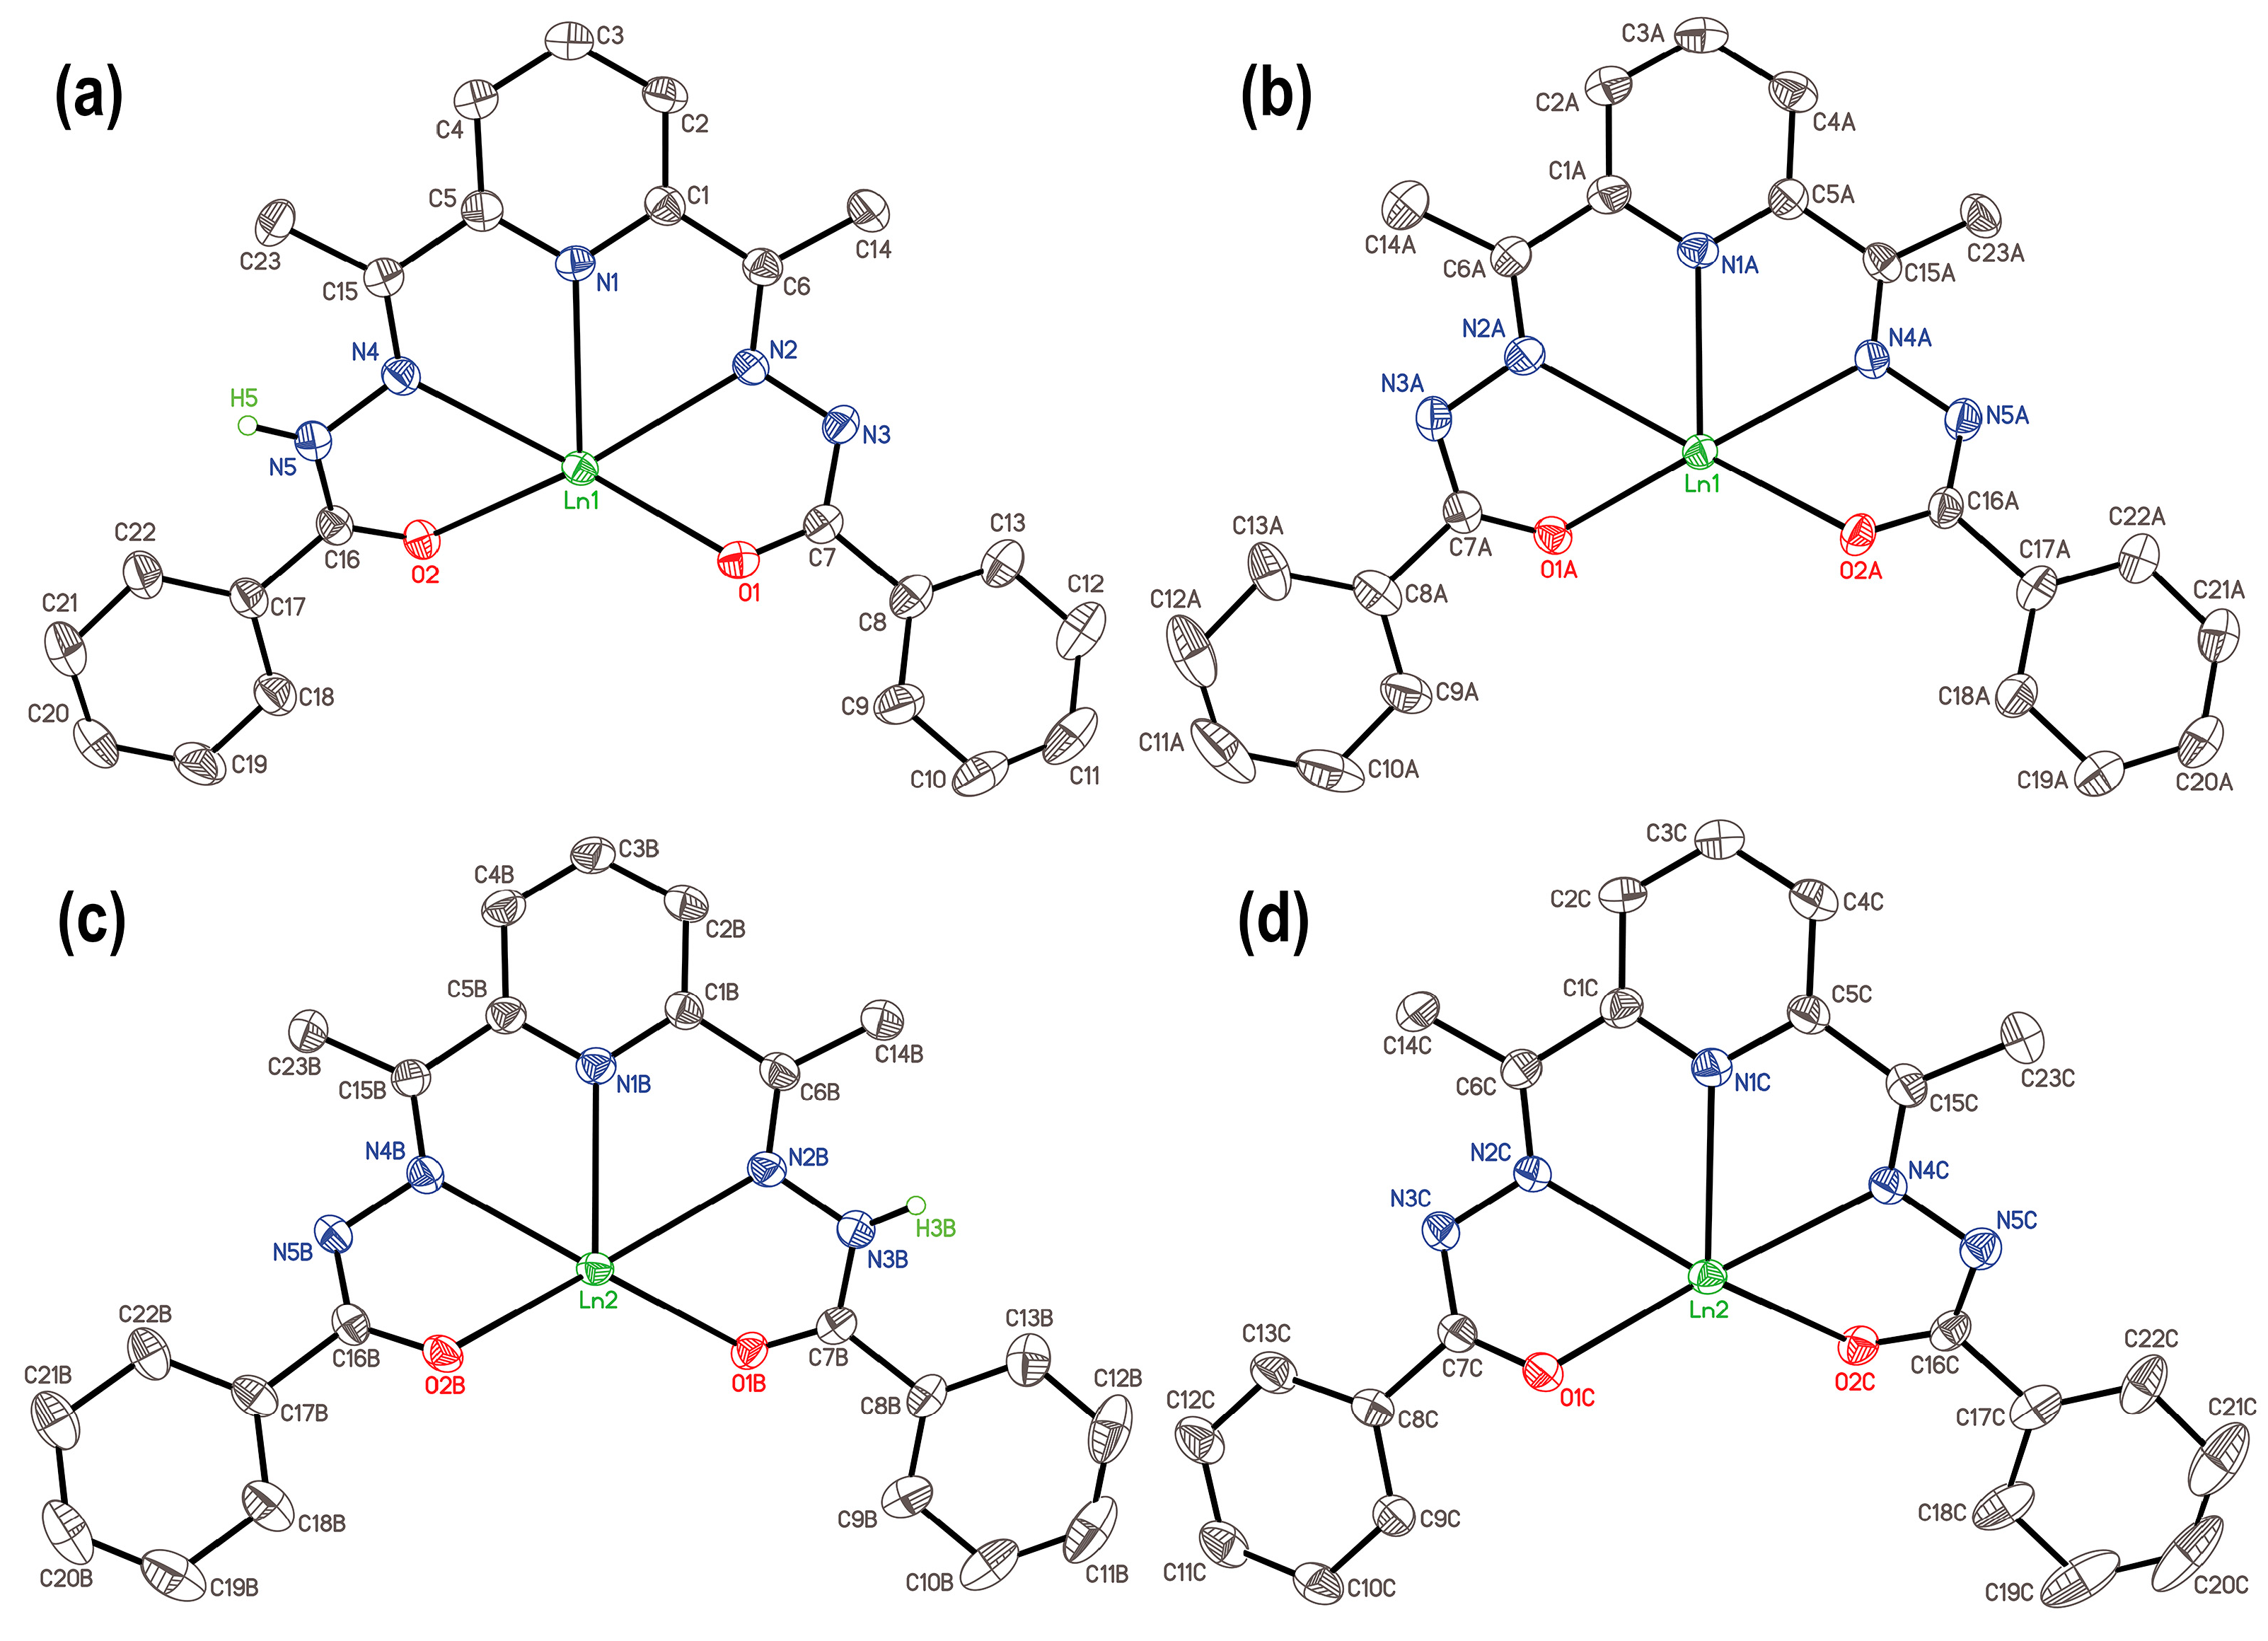
In all complexes, one of two pentadentate ligands was dianionic while the other one was monoanionic (Figure 4). Two ligands in total had the net charge of −3, which provided a charge balance of the Ln(III) complex as a whole. It should be noted that the complexation of two ligands with a rare-earth element led to a strong distortion of the original ligand structure, in contrast to an almost flat conformation in the structure 5-Tb, Figure 1.
Complex 1-Dy, [Dy(HL)(L)]∙1.5H2O crystallizes in the tetragonal P43 space group. The unit cell of 1-Dy contained eight neutral molecules [Dy(HL)(L)] of two symmetry independent types, 1-Dy(1) and 1-Dy(2), slightly differing in the lengths of bonds and angles. The crystallization water molecules located between 1-Dy(1) and 1-Dy(2) centers were involved in hydrogen bonds with participation of protons of NH groups and O atoms of the solvate water molecules (Figure S1, Table S1). The shortest intermolecular distances between Dy(III) centers in crystal 1-Dy were 9.7870(12) and 9.8629(12) Å.
Complex 2-Dy, [Dy(HL(OCH3))(L(OCH3))]∙C2H5OH∙0.5H2O is, in general, close to 1-Dy by structure (Figure 5), but crystallized in the triclinic structure of the P-1 space group with the two molecules (Z = 2) being symmetry related. Unlike 1-Dy, in which the hydrogen atom of the monoanionic ligand HL was found in the general position, in this compound it was disordered over two positions with an occupancy of 50% on each possible position (H3 (on N3) and H3′ (on N3A), for details see Figure 5 and the corresponding cif-file). The solvent molecules (H2O and disordered EtOH) were found to form strong hydrogen bonds with the main molecules (Table S2). These interactions formed 1D polymeric chains, packed parallel along the b axis without forming any significant voids. The shortest intermolecular distances between Dy(III) ions in crystal 2-Dy were 9.8713(9) and 10.6176(9) Å.
Analogous to 1-Dy, an asymmetric unit of 3-Ho [Ho(HL)(L)]∙CH3OH∙CH2Cl2 contained two crystallographically independent molecules [Ho(HL)(L)] but, in contrast to 1-Dy, crystallized in the monoclinic space group P21/c. The crystal structure of 3-Ho included two coordinated methanol molecules as intermolecular linkers forming polymeric chains packed along the c axis. Another solvent, methylene chloride, did not interact with complex molecules and filled intermolecular voids. The shortest distances between Ho(III) atoms were 9.7074(11) and 9.8352(11) Å.
Complex 4-Er, [Er(HL)(L)]∙4CHCl3∙H2O crystallized in the orthorhombic P212121 space group as the solvate with coordinated chloroform and water molecules. Both molecular geometry and coordination environment did not have significant differences from 1-Dy and 3-Ho. Inspection of the hydrogen bonds in the complex revealed that the coordinated water molecule formed two intramolecular and one intermolecular hydrogen bonds with the neighboring molecule of the [Er(HL)(L)] with hydrogen atom H5 (Figure 2) of the ligand HL. As well as the other ten-coordinate compounds discussed here, molecules of this complex and water molecules formed linear polymeric chains oriented along the b axis, with interchain cavities filled by chloroform molecules, which in turn also interacted with oxygen atoms via relatively weak C–H···O interactions; the closest Er–Er distances were 10.5905(8) and 11.5236(10) Å (Figure S2, Table S4).
Values of the dihedral angle between the planes formed by N(pyridine) and two N atoms, connected with the Ln3+ ion (Table 2), differed across the complexes over the range of 57.80(10) to 61.6(3)° indicating that distortion of the coordination geometry varied subtly in the complexes described. In order to compare the degree of deviation from the ideal bicapped square antiprismatic coordination of the metal centers in a more unified way, we performed calculations of continuous shape measures by using the SHAPE (2.1) program [59,60]. Results listed in Table S5 indicate substantial deviation from the ideal geometry for all [Ln(HL)(L)] complexes and confirm small but meaningful differences for two symmetry independent molecules in the unit cell of 1-Dy and 3-Ho. Full information about hydrogen bonds in compounds 14 are given in Supplementary Information section, Tables S1–S4 and Figures S1 and S2.
All ten-coordinate complexes, yet rather similar in coordination fashion for both types (HL and L2–) of the ligand, demonstrated variations in the interatomic distances Ln-O (Table 2, Figure 2, Figure 4 and Figure 5), in accordance with the ligand charge. The distances Ln1-O1A and Ln1-O2A (Ln2-O1C and Ln2-O2C) in the case of dianionic ligands were 2.398(9) Å and 2.414(9) Å (2.355(9) Å and 2.503(9) Å) for 1-Dy, 2.349(3) Å and 2.389(3) Å (2.388(3) Å and 2.389(4) Å) for 3-Ho and 2.358(3) Å and 2.392(3) Å for 4-Er and tend to be close with some distortions from ideal coordination geometry in most cases. In contrast, the presence of the hydrogen atom of the N-H group in the structure of the monoanionic ligand HL, which is also involved in the formation of hydrogen bonds leads to slightly stronger distortion from ideal molecular geometry: the interatomic distances Ln1-O1 and Ln1-O2 (Ln2-O1B and Ln2-O2B for the second independent molecule in 1-Dy and 3-Ho were 2.377(8) Å and 2.528(8) Å (2.411(8) Å and 2.367(8) Å) for 1-Dy, 2.371(4) Å and 2.499(3) Å (2.526(3) Å and 2.395(3) Å) for 3-Ho and 2.347(3) Å and 2.464(3) Å for 4-Er. Moreover, localization of the proton on one of the two nitrogen atoms of the HL ligand also caused an increase in interatomic distances between the central atom Ln1(Ln2) and adjacent to the proton hydrazone nitrogen atom N4(N2B) in comparison with the interatomic distances Ln1-N2 or Ln2-N4B (Table 2) of the same ligand HL in 1-Dy, 3-Ho and 4-Er, which led to even more pronounced heterogeneity and differences in the environment of the central atom formed by the ligands L2- and HL. Closely related Dy complexes with the analogous structural moiety [Dy(HL)(H2L)]2+ and [Dy(H2L)2]3+ reveal similar but more significant inequality in the bond length between oxygen and dysprosium atoms [61] and, therefore, have greater asymmetry in the coordination environment of dysprosium in the case of coordination of the monoanionic ligand HL: 2.3185(8) Å and 2.5094(10) Å for [Dy(HL)(H2L)]2+ with a smaller range of lengths 2.4126(11) Å and 2.4880(12) for the ligand H2L, and close distances for two neutral ligands 2.404(3) Å, 2.414(3) Å and 2.395(3) Å, 2.420(3) Å in the cation [Dy(H2L)2]3+.
Additionally, a further noteworthy fact is the difference between 1-Dy and 2-Dy complexes. In contrast to 1-Dy, the unit cell of 2-Dy contains only one crystallographically independent disordered complex molecule, and the disorder exists both in the location of the proton, which with a 50% probability was dispersed over two nitrogen positions, and in the arrangement of the OCH3-phenyl ring (Figure 5) of two unequal ligand (HL(OCH3))−1/2 (the distance Dy1-O1 was slightly larger than Dy1-O1A, 2.496(4) Å and 2.453(4) Å, respectively, but both were longer than Dy1-O2 and Dy1-O2A (2.346(5) Å and 2.360(4) Å (Table 2, Figure 5), and in complexes 1-Dy, 3-Ho and 4-Er). In 2-Dy the interatomic distances (Table 2, Figure 5) Dy1-N2, Dy1-N2A and Dy1-N4 and Dy1-N4A are pairwise close to each other—2.601(5) Å, 2.603(5) Å and 2.561(5) Å and 2.534(5) Å, respectively, that is, in the case of a disordered hydrogen atom, some increase in the bond lengths between the Dy central atom and N atoms of a coordinated ligand (Dy1-N2 and Dy1-N2A) was also observed. In addition, it should be noted that due to this disordering, other additional small and undetectable via X-ray diffraction techniques distortions in the dysprosium local environment in different molecules of the complex 2-Dy in a crystal are still possible.

2.3. Magnetism

2.3.1. Static Magnetic Properties

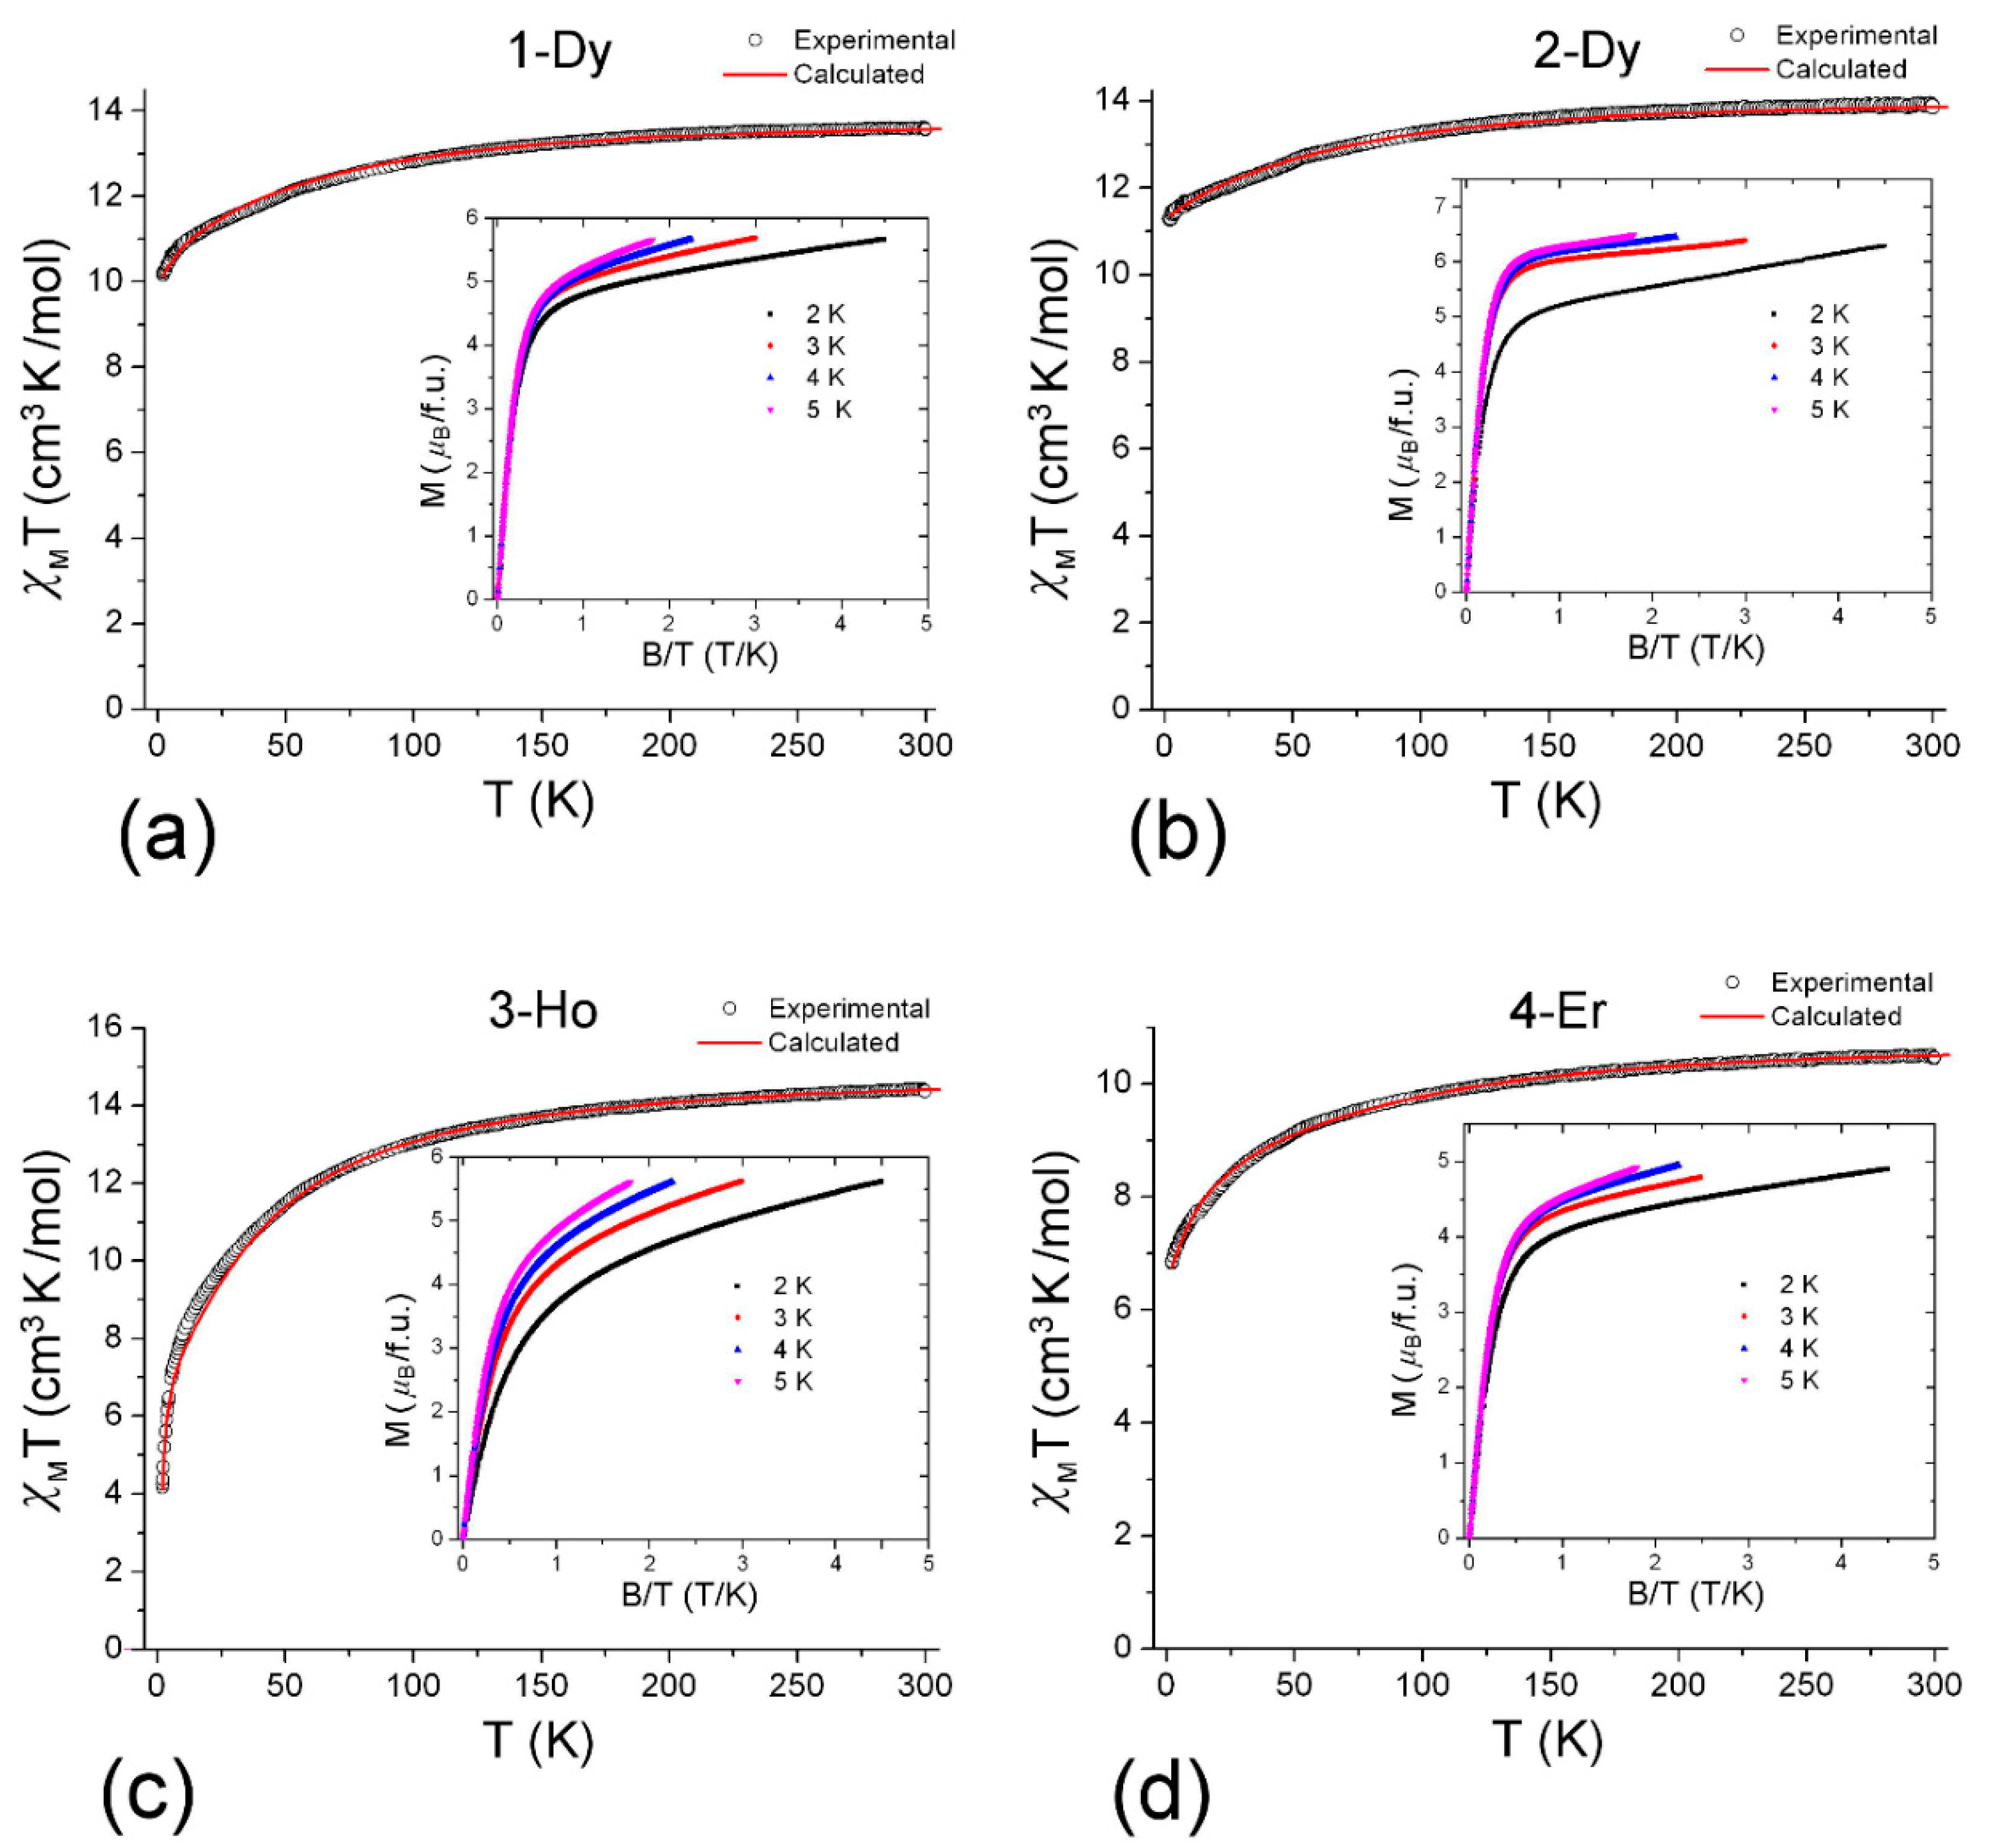
Magnetic susceptibility measurements for complexes 14 with the ten-coordinate LnN6O4 core were carried out under the dc applied field of 1000 Oe in the temperature range of 2–300 K, as shown in Figure 6. Magnetic measurements for terbium complexes 5 and 6 were not performed, since they were less relevant to the series of isostructural complexes 14 owing to the dissimilar structure of 5-Tb (Figure 1) and the lack of structural data for 6-Tb. At 300 K, the χMT products of 1-Dy, 2-Dy, 3-Ho and 4-Er complexes were close to the respective free-ion values, 14.17 (Dy3+, 6H15/2), 14.07 (Ho3+, 5I8) and 11.48 (Er3+, 4I15/2) cm3 K mol−1 (Figure 6). In all complexes, the χMT product gradually decreased upon cooling to 100 K, below which it fell more rapidly due to progressive thermal depopulation of low-lying excited Stark levels of the Ln3+ ions. The field dependencies of the magnetization (M/µB vs. H/T) for all complexes were recorded at 2, 3, 4 and 5 K in the field range of 0–4.5 T (insets to Figure 6). The magnetizations reached values of 5.6, 6.25, 5.5 and 4.8 µB, respectively, at 4.5 T and 2 K without saturation. The lack of saturation and the non-superposition on a single master curve for M/µB vs. H/T plots at different temperatures suggest the presence of considerable magnetic anisotropy in the complexes [61,62,63].

2.3.2. Analysis of dc-Magnetic Data

Since dc and ac magnetic properties of lanthanide complexes, and especially their SMM behavior, are highly sensitive to the character of the crystal-field (CF) splitting effect, it is important to establish the energy spectrum of the CF states and specific properties of the ground-state wave functions of Ln3+ ions in compounds 14. To this end, we analyzed dc magnetic properties of our complexes in the framework of the CF theory for Ln3+ ions, which is based on the conventional CF Hamiltonian:
H = H 0 + H C F ,
where H0 denotes the free-ion Hamiltonian and HCF is the CF term. The free-ion Hamiltonian H0 describes atomic interactions of 4f-electrons:
H 0 = k = 2 , 4 , 6 f k F k + ζ 4 f i l i s i + α L ( L + 1 ) + β G ( R 7 ) + γ G ( G 2 ) ,
where fk and Fk are the angular and radial Slater parameters, respectively, the second term is the spin orbit operator, and α, β and γ are Trees parameters describing two-electron correlation corrections to the Coulomb repulsion term [64,65,66]. The HCF Hamiltonian incorporates metal–ligand interactions:
H C F = k , q B k q C q k ,
where Bkq are CF parameters (k = 2, 4, 6; qk) and Cqk are spherical tensor operators for f-electrons [64,65,66]. Details of CF calculations for Ln3+ ions were well documented elsewhere [64,65,66,67,68]. The Bkq quantities are phenomenological adjustable CF parameters, which are usually obtained from fitting to the spectroscopic and/or magnetic data for lanthanide compounds. It is noteworthy, however, that in most cases the fitting CF calculations were applied only to metal centers with high enough symmetry in order to keep a reasonable number of variables. For the low-symmetry metal centers (occurring in our [Ln(HL)(L)] complexes) the CF fitting calculations became overparameterized owing to a large number (up to 27) of independent CF Bkq parameters. To avoid these difficulties, we took advantages of the superposition CF model [68,69], which relates the Bkq parameters with the actual geometry of the metal site:
B k q = n b ( R 0 ) ( R 0 / R n ) t k C q k ( ϑ n , ϕ n ) ,
where n runs over all metal–ligand pairs involved in the coordination polyhedron (N6O4, Figure 3b) around the Ln3+ ion, bk(R0) are the three (k = 2, 4, 6) intrinsic, or single ligand CF parameters, (Rn, θn and φn) are polar coordinates of the n-th ligand atom; their radial dependence is approximated by the power-law with tk being the exponent indexes and R0 being the reference distance (i.e., the average metal–ligand distance). The superposition CF model, its foundation and applications were described in the literature [68,69,70,71].
Now we turned to the simulation of magnetic properties of lanthanide complexes with the CF Hamiltonian (2). In most cases, magnetic properties of lanthanide compounds are highly anisotropic. The magnetization M and applied magnetic field H related by M = χH, where χ is the tensor of magnetic susceptibility:
M α = β χ α β H β ,
which is represented by a 3 × 3 matrix χαβ (where α, β = x, y, z); its components χαβ can be calculated in terms of the |i> wave functions of Ln3+ ions using the Gerloch–McMeeking equation [72]:
χ α β = N a i e x p ( E i / k T ) × i { j i | μ α | j j | μ β | i k T j i i | μ α | j j | μ β | i + i | μ β | j j | μ α | i E i E j } exp ( E i / k T ) ,
where Na is the Avogadro number, Ei is the energy of the CF state |i>, k is the Boltzmann constant, T is the absolute temperature, and μα, μβ are the components of the magnetic moment operator:
μ = μ B ( L + 2 S ) ,
where μB is the Bohr magneton and L and S are, respectively, the operators of the total orbital momentum. The eigenvalues of the matrix χαβ (6) correspond to the principal components of the magnetic susceptibility (χx, χy, χz); the powder magnetic susceptibility is written as χ = (χx + χy + χz)/3. In the frame of this technique, we simulated magnetic dc susceptibility of four lanthanide complexes with the aim is to determine the CF splitting pattern of the ground J-multiplets produced by the N6O4 polyhedron (Figure 3b).
With this approach, we derived the CF parameters Bkq from the fitting of the χT curves simulated with Equation (6) to the experimental dc magnetic data for [Ln(HL)(L)] complexes (Figure 6). However, the conventional CF computational scheme with freely variable Bkq parameters cannot directly be applied to complexes 14, since it is likely to be unreliable due to overparameterization, which is characteristic of low-symmetry metal sites (C2 or C1 in 14). In such systems, CF fitting to the magnetic susceptibility curves typically converges to several least squares minima that are incompatible with each other. For this reason, we used the superposition CF model [68,70], which relates the usual Bkq CF parameters with the specific geometry of the coordination polyhedron around the Ln3+ ion via three intrinsic CF parameters bk (k = 2, 4, 6) (Equation (4)). Importantly, since the bk parameters describe metal–ligand bonding energy for f-electrons, they are transferable between different Ln3+ ions in complexes with similar ligand coordination; this allows the approximate prediction of CF parameters for metal sites with known atomic positions. Therefore, for isostructural series of lanthanide compounds, the CF splitting pattern of different lanthanide ions can be reproduced with a single set of intrinsic bk parameters; this fact can be used to check the consistency of the set of CF parameters.
Given these considerations, CF calculations for [Ln(HL)(L)] complexes were carried out in two steps. First, a primary set of bk parameters (b2 = 800, b4 = 380, and b6 = 260 cm−1 at R0 = 2.45 Å, both for O and N atoms) was obtained from simulation of the dc magnetic susceptibility for the Dy, Ho and Er complexes with the same superposition model parameters. Calculations were carried out with fixed power-law indexes t2 = 5, t4 = 8 and t6 = 11 estimated elsewhere [69,70]; atomic parameters of Ln3+ ions involved in the free-ion Hamiltonian (Equation (3)) are taken from the literature [66,67]. The polar coordinates (Rn, θn and φn) in Equation (5) corresponds to the actual geometry of the N6O4 coordination polyhedra in compounds 14 (Figure 3b). It is also noteworthy that calculations of the χαβ tensor with Equation (6) involves the CF states |i> of both the lowest J-multiplet and several excited multiplets in order to include second-order contributions to the χαβ components resulting from high-lying excited states, which are mixed to the ground state by the magnetic field; this computational scheme is implemented with routines described previously [73,74,75]. Calculations with these parameters provide an approximate general agreement with the experimental χMT curves for the 1-Dy, 2-Dy, 3-Ho and 4-Er complexes.
This set of parameters was then used as a reference point for refined CF calculations performed separately for the individual complexes 14. At this stage, a modified CF computational scheme was applied, in which the rank two (k = 2) ‘global’ Bkq parameters were allowed to vary together with the b4 and b6 ‘intrinsic’ CF parameters (which are different for the N and O atoms in the N6O4 polyhedron) to reach the best agreement with the experimental dc magnetic data for the specific lanthanide complex in the whole temperature range (2–300 K, Figure 6). Application of this approach was motivated by the fact that the second rank CF parameters Bkq were sensitive to long-range metal–ligand interactions extending beyond the first coordination sphere of the lanthanide ion and, therefore, they were poorly described in terms of the superposition CF model. The simulated χMT curves were well consistent with the experimental data (Figure 6). To take into account some uncertainty in the actual lanthanide concentration in powdered complexes, a scaling factor for the magnetic susceptibility was applied for complexes 14 (+4.2% for 1-Dy, +3.1% for 2-Dy, +6.6% for 3-Ho and +2.7% for 4-Er, respectively).
Calculated CF energy levels of Dy3+, Ho3+ and Er3+ ions in complexes 14 are summarized in Table 3, and the sets of Bkq CF parameters are presented in Table S6. These results indicate that Ln3+ ions centered in the N6O4 polyhedron (Figure 3b) reveal rather low CF splitting energy, c.a.
The 400 cm−1 or less (Table 3) is also consistent with the CF strength criterion S [76], which is around 500 cm−1 (see Table S6). This fact alone suggests that [Ln(HL)(L)] complexes are unlikely to be high-performance SMMs due to the absence of large CF splitting energy, which is known to be one of the most important prerequisite to have a high spin-reversal barrier Ueff (see below the next section).

2.3.3. Dynamic Magnetic Properties

The alternating current magnetic susceptibility (ac) measurements serve as a probe for the relaxation processes in the magnetic system, revealing in a frequency dependence of in-phase χ′(ν) and a non-zero out-of-phase χ′′(ν) signal. None of the studied compounds shows the slow magnetic relaxation in measured frequency and temperature ranges (10 Hz to 10 kHz and 2–5 K) in a zero dc magnetic field. Both the in-phase χ′ and out-of-phase χ′′ magnetic susceptibility of the mononuclear complexes 1-Dy, 2-Dy and 4-Er exhibited the frequency-dependent signals in the presence of the dc magnetic field (Figure S3). The observed magnetic field induced SMM behavior in these complexes was likely due to suppression of the ground state tunneling processes by the dc magnetic field. The SMM-silent behavior of the Ho complex (3-Ho) complex is associated with a non-magnetic character of the ground state of non-Kramers ion Ho3+, which is represented by two close-spaced singlet states with the energy separation about 0.6 cm−1 (Table 3); this splitting energy is large enough to cause fast magnetic relaxation.
To probe the magnetic relaxation in 1-Dy, 2-Dy and 4-Er complexes, the frequency dependence of ac susceptibility was measured in the presence of the dc magnetic field. The magnetic field was set at value corresponding to the peak in field dependence of out-phase magnetic susceptibility, χ′′(H) (Figure S3a–c).
The shape of the χ’(ν), χ′′(ν) and the Cole–Cole plots (χ′′(ν) vs. χ’(ν)) of 1-Dy, 2-Dy and 4-Er complexes differed markedly see Figure 7, Figure 9 and Figure 11. In the case of 4-Er, the χ′′(ν) the curve measured at H = 1500 Oe exhibited a clear maximum shifting towards the higher frequencies at a temperature increase from 2 to 5 K. The corresponding Cole–Cole curves had a relatively symmetric shape (see Figure 7c).
The χ′(ν), χ′′(ν) dependencies were analyzed within the modified Debye model [77] (Equations (8)–(10)):
χ t o t a l ( ω ) = χ s + ( χ T χ s ) 1 + ( i ω τ ) 1 α ,
χ ( ω ) = χ S + ( χ T χ S ) ( 1 + ( ω τ ) 1 α sin ( π α / 2 ) ) 1 + 2 ( ω τ ) 1 α sin ( π α / 2 ) + ( ω τ ) 2 ( 1 α ) ,
χ ( ω ) = ( χ T χ S ) ( ω τ ) 1 α cos ( π α / 2 ) 1 + 2 ( ω τ ) 1 α sin ( π α / 2 ) + ( ω τ ) 2 ( 1 α ) ,
where parameter α is a measure of distribution of relaxation time that characterizes the deviation from the Debye model, χS, χT, are the adiabatic and isothermal susceptibilities, ω—angular frequency and τ—relaxation time [77]. The fitting results for 4-Er are presented in Table S7.
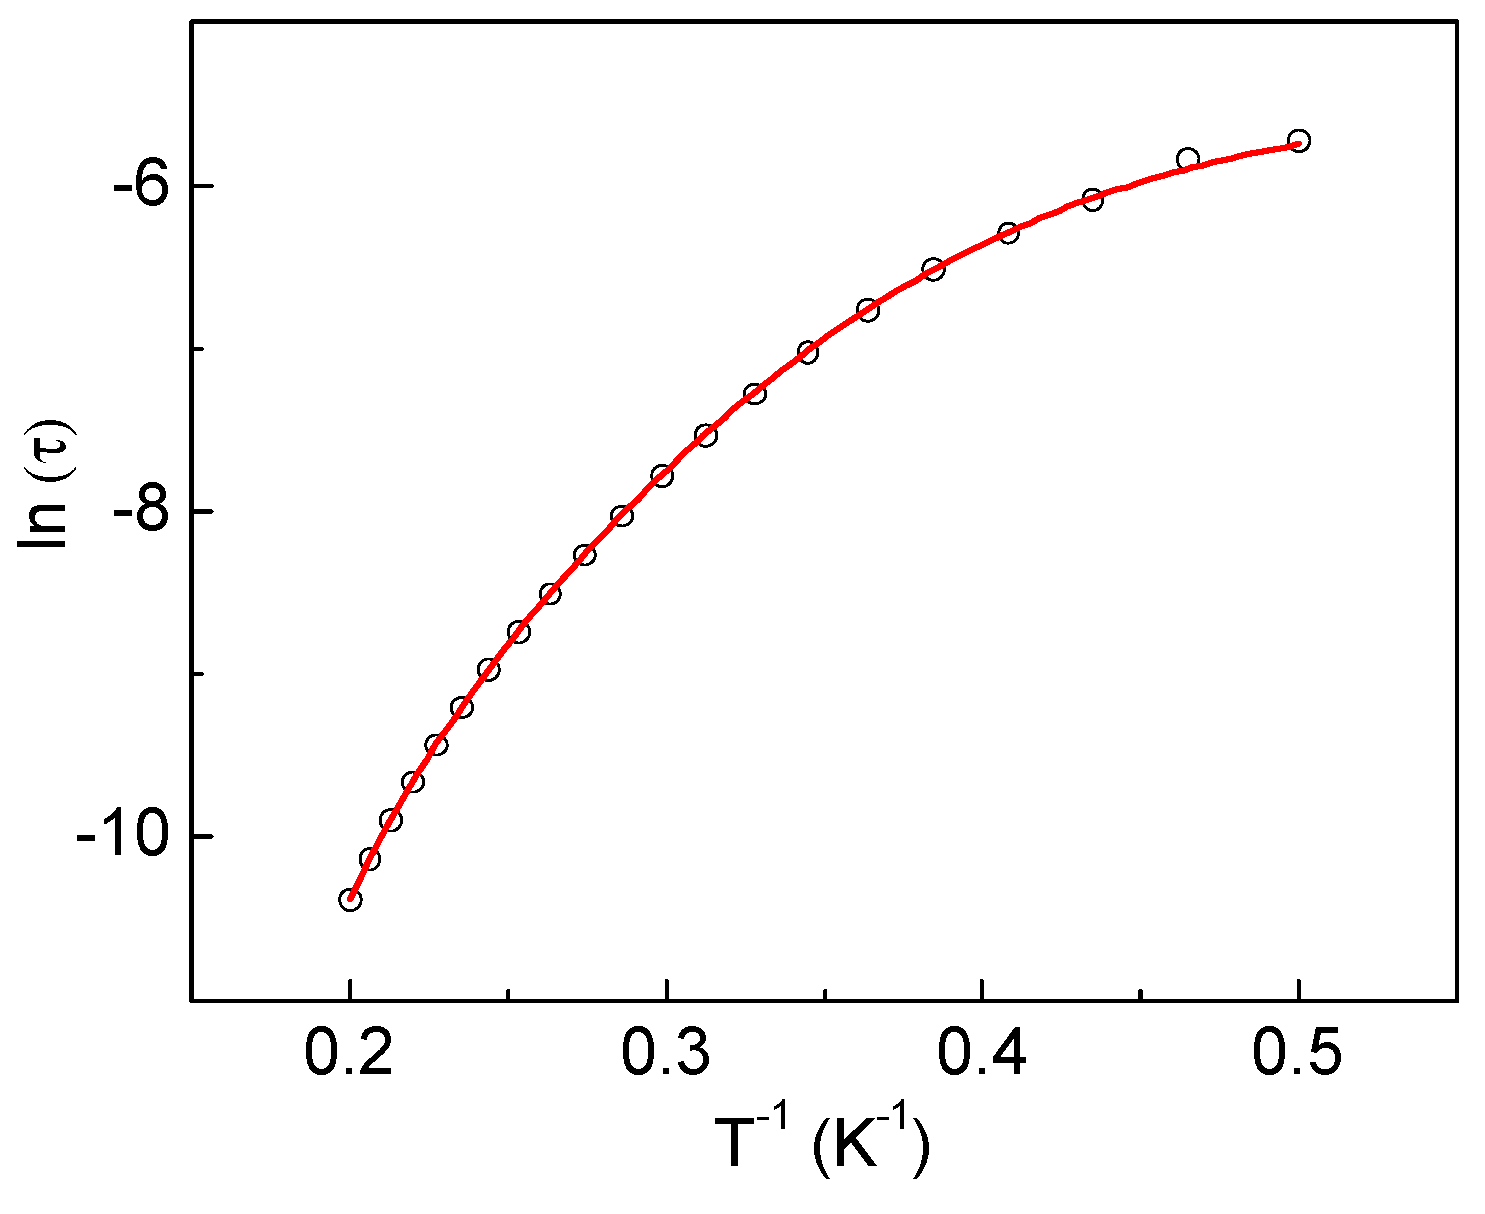
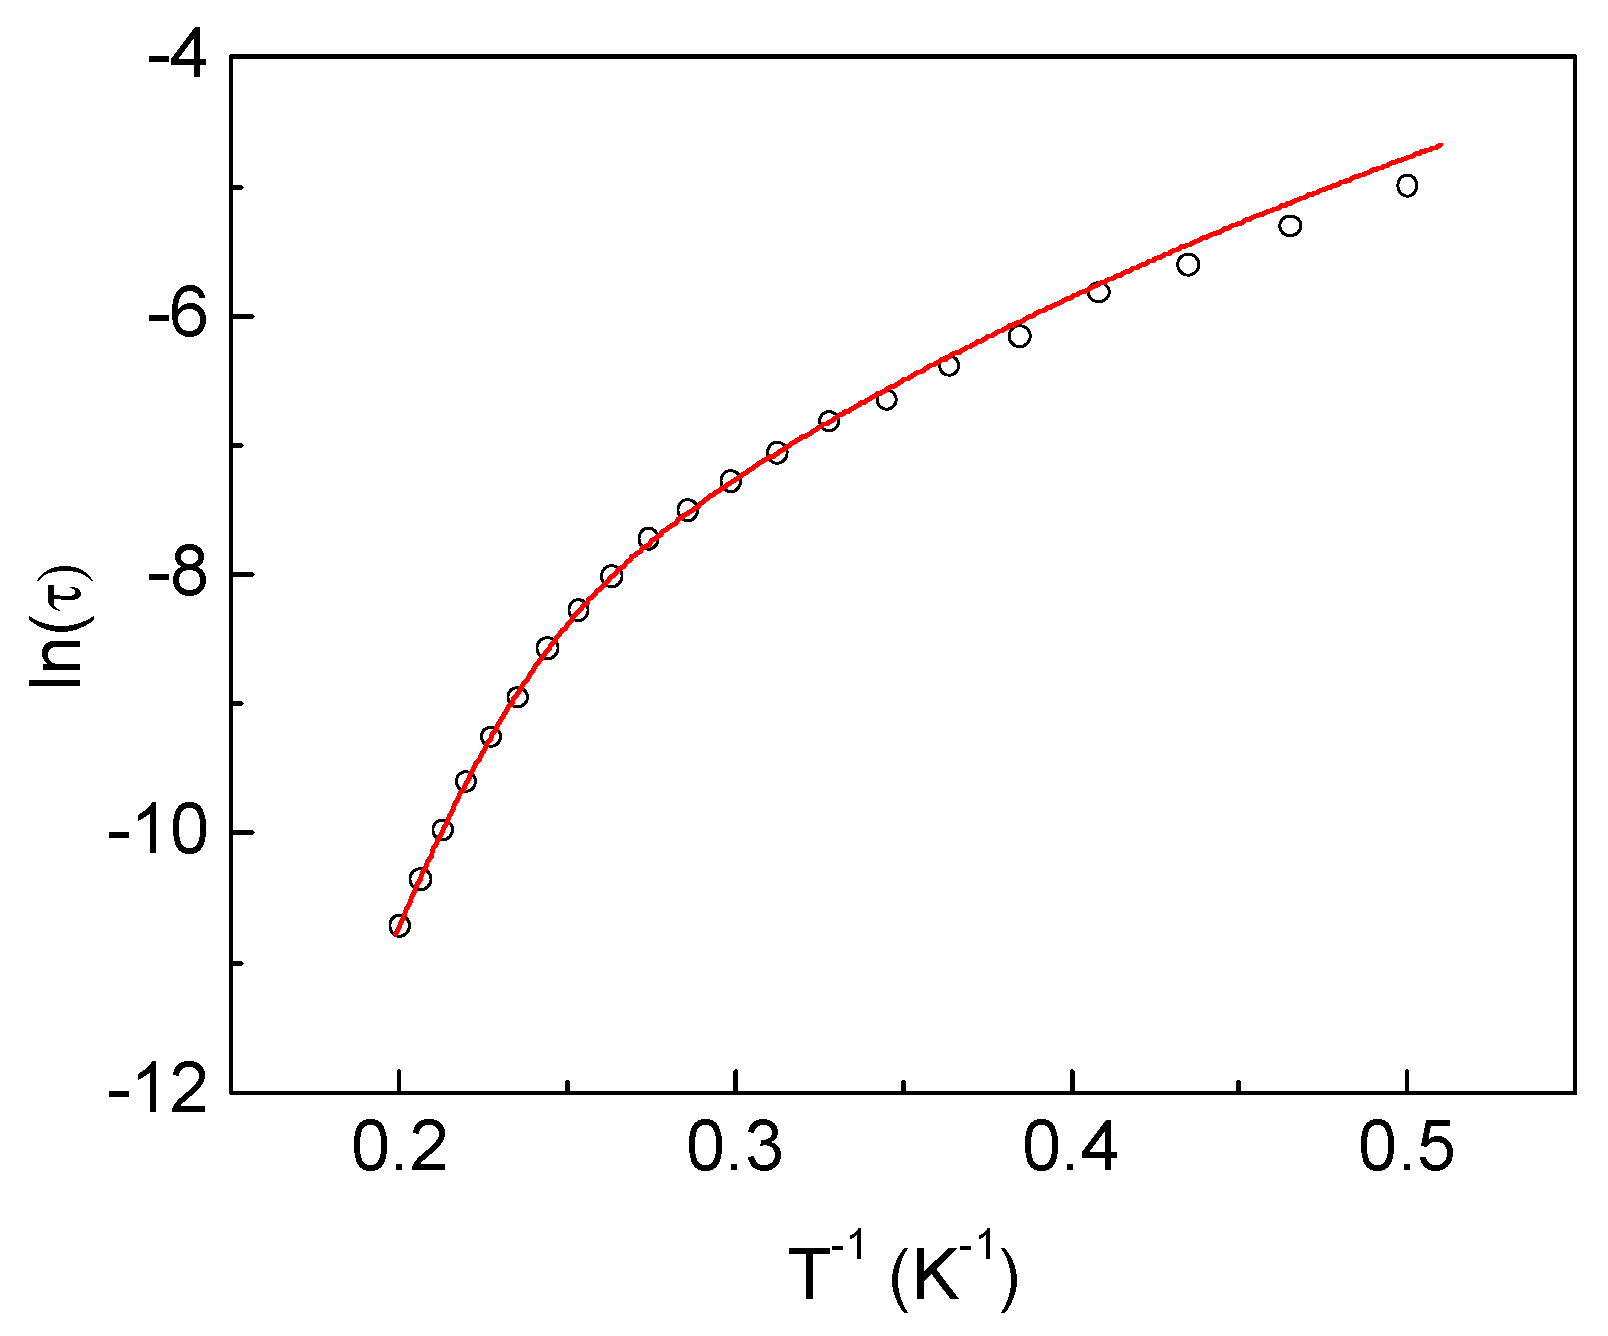
The parameter α for 4-Er complex varied within the range 0.19–0.03 signifying the narrow distribution of relaxation time in the measured temperature range (Table S7). The best fit of temperature dependence of relaxation time for 4-Er with Equation (11) [78] was achieved with the set of parameters: C = 1.2·s−1, n = 6.1, Ueff = 87 K and τ0 = 4 × 10⁻¹² s, τQTM = 4.4 × 10⁻³ s and A = 0 (Figure 8).
τ 1 = τ Q T M 1 + A T + C T n + τ 0 1 exp ( U eff k T ) ,
where T is the absolute temperature, Ueff is the effective energy barrier for the reversal of magnetization and k is the Boltzmann constant. The τ−1QTM term in Equation (11) represents the temperature-independent contribution from the quantum tunneling of magnetization (QTM) effects, the second and third terms are direct relaxation and Raman process correspondingly, the exponential term describes the thermally activated mechanism of magnetic relaxation (Orbach process) [78]. The parameter n = 6 corresponds to the Raman spin-lattice relaxation process for the case of Kramers system [78]. It is noteworthy that the effective energy barrier Ueff = 87 K obtained from fitting with Equation (11) was considerably higher than the energy position of the first excited CF state at 23 cm−1 (33 K) and close to the energy of the next CF state at 75 cm−1 (108 K), as estimated from CF calculations for 4-Er (Table 3).
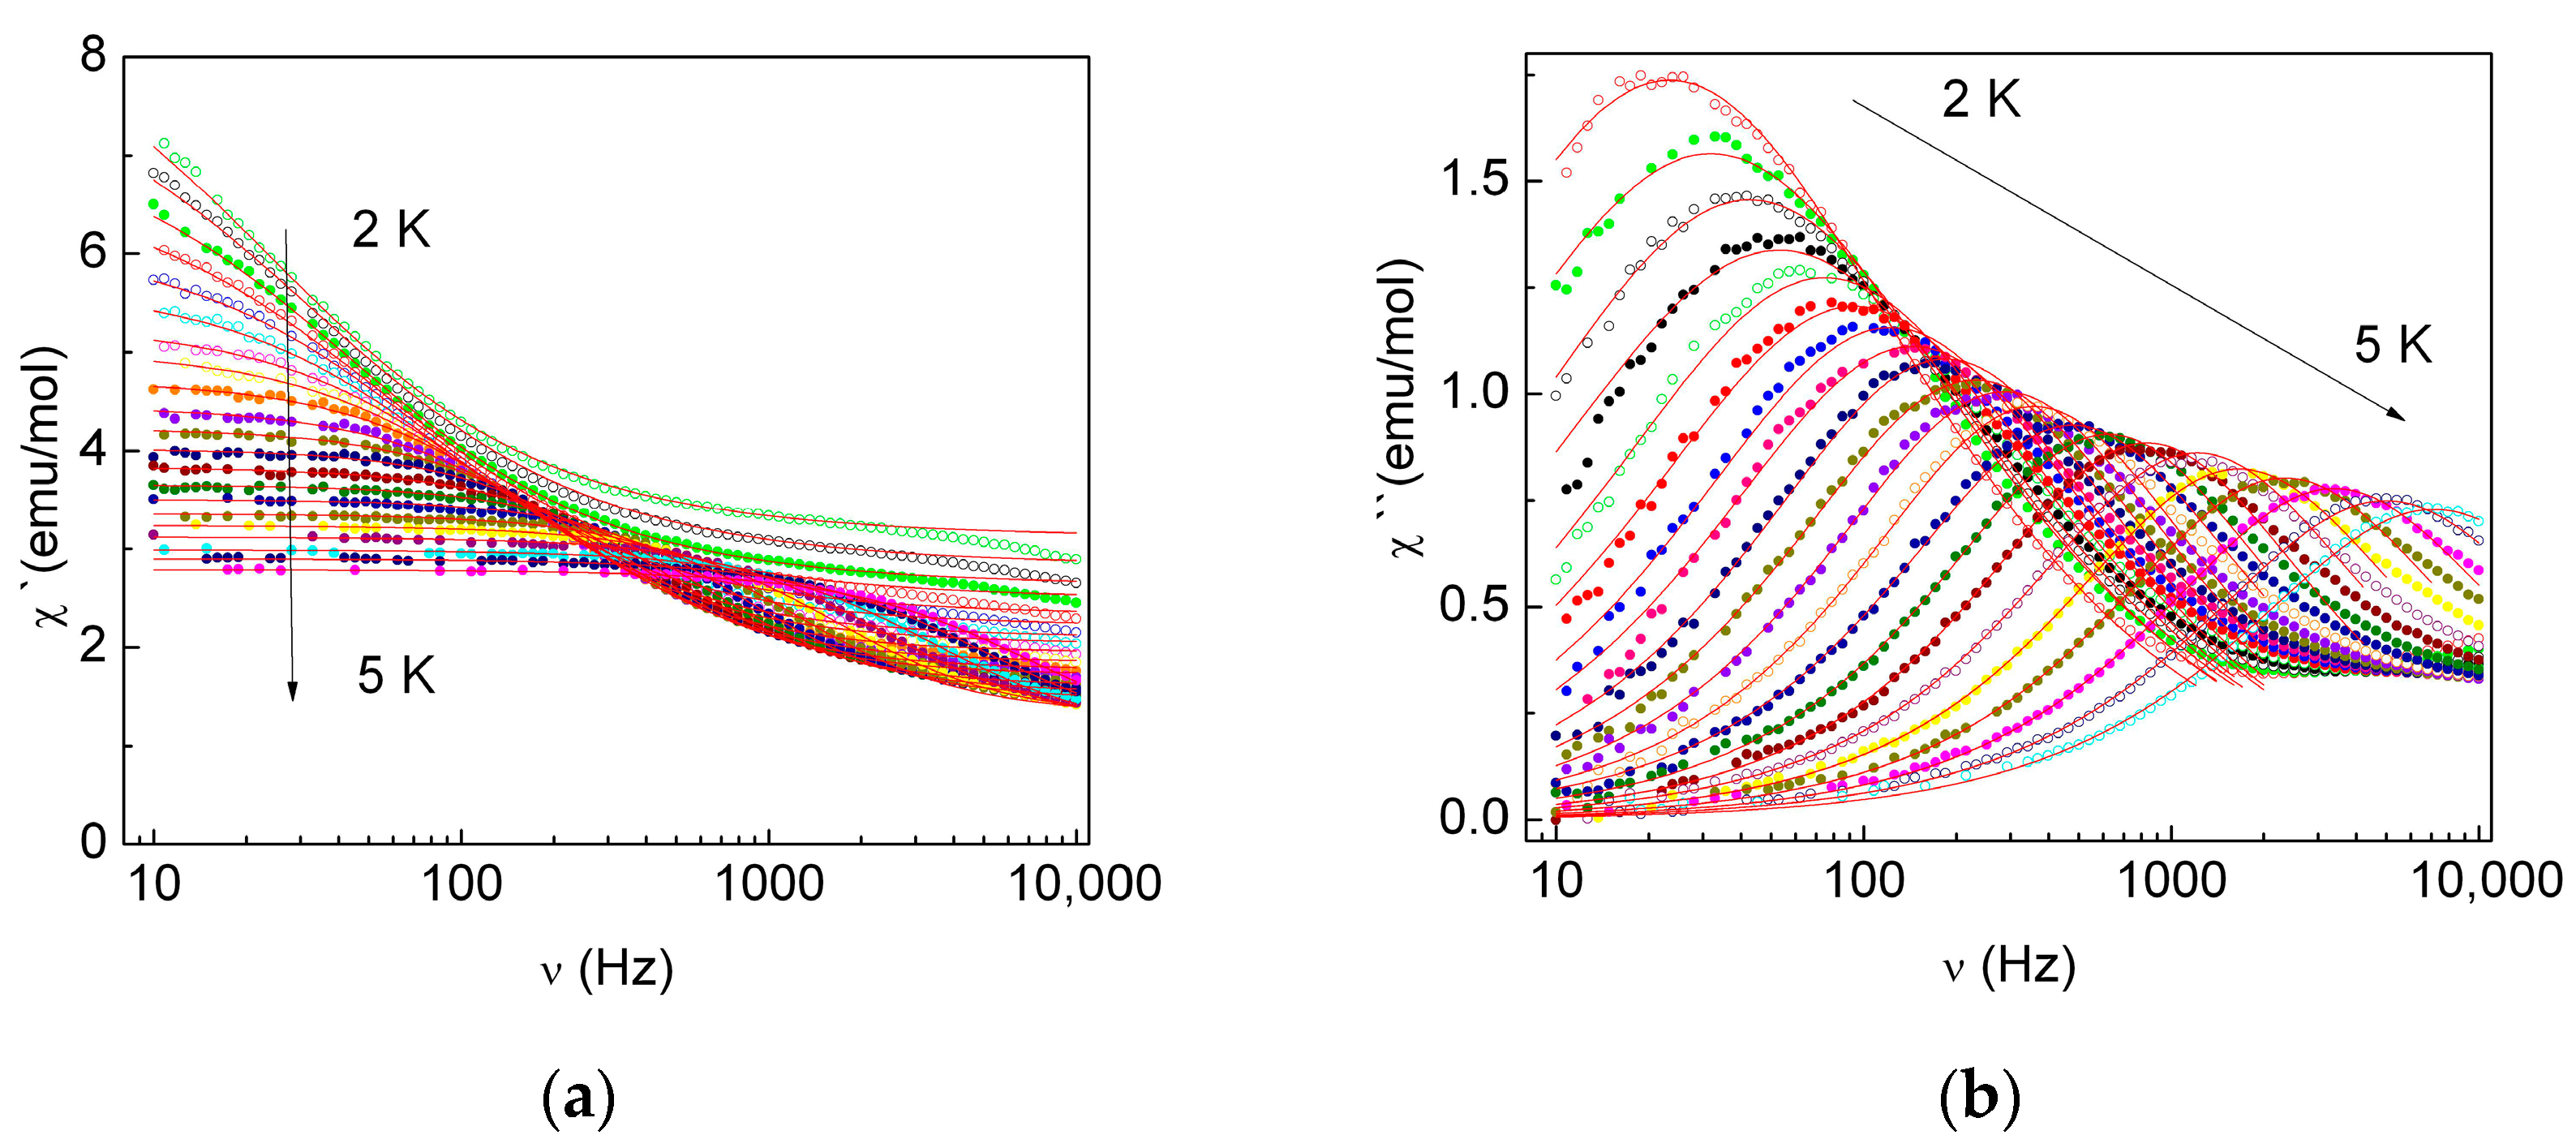
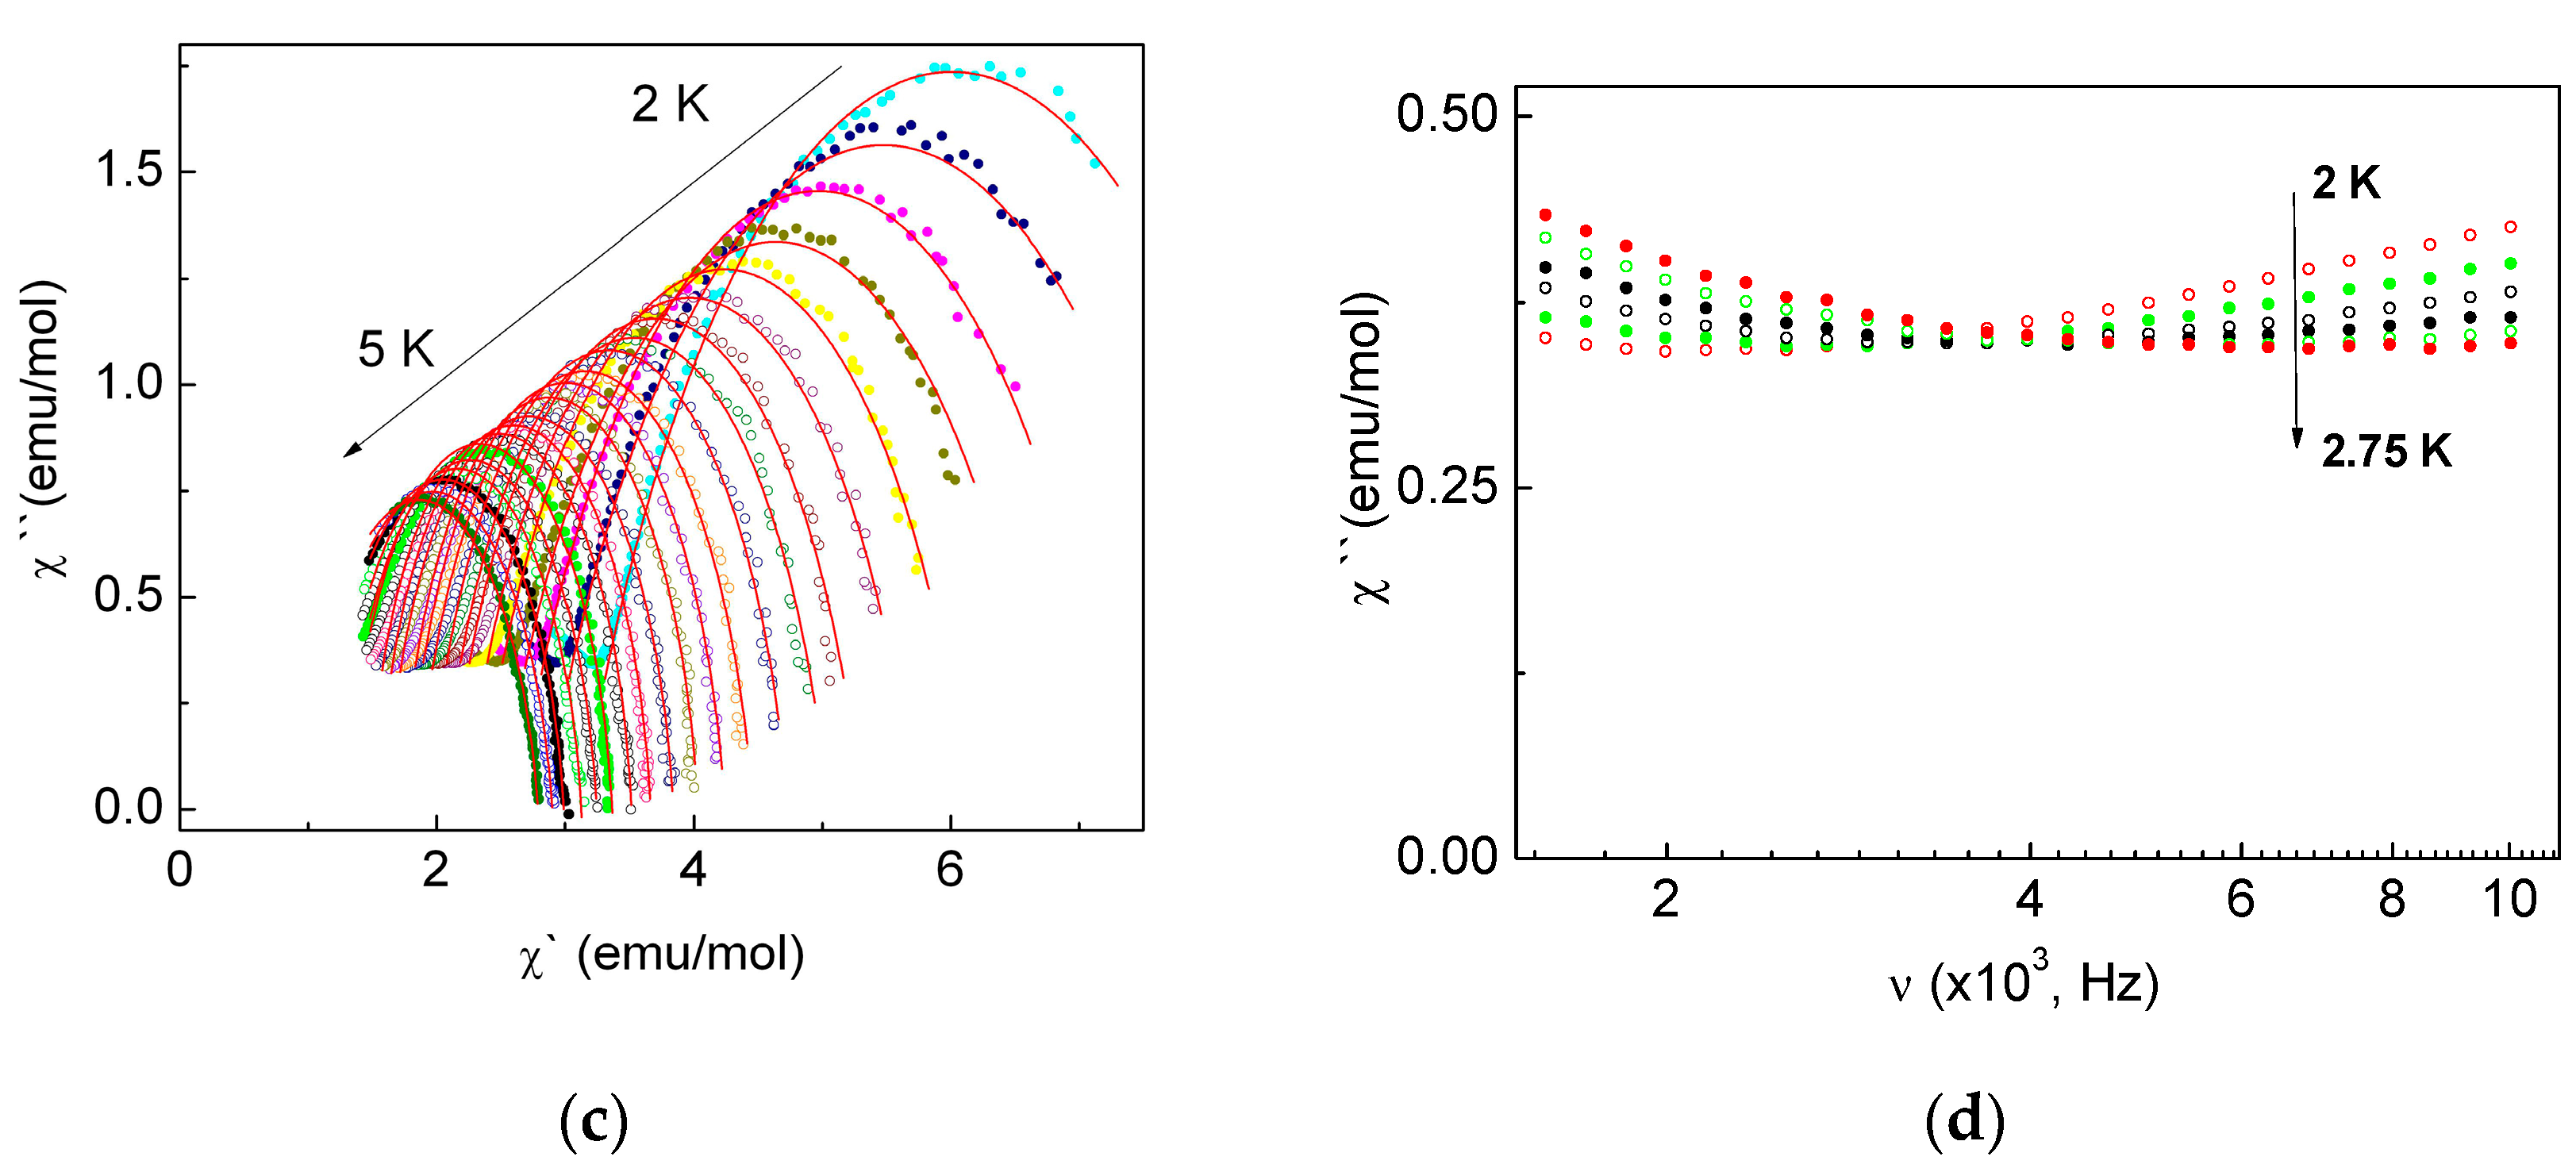
The χ′(ν), χ′′(ν) dependencies and Cole–Cole χ′′(χ′) plots for the 1-Dy compound measured at H = 800 Oe are presented in Figure 9. The χ′′(ν) (Figure 9b) and Cole–Cole (Figure 9c) plots exhibited two distinct maxima at temperature range of 2–2.45 K.
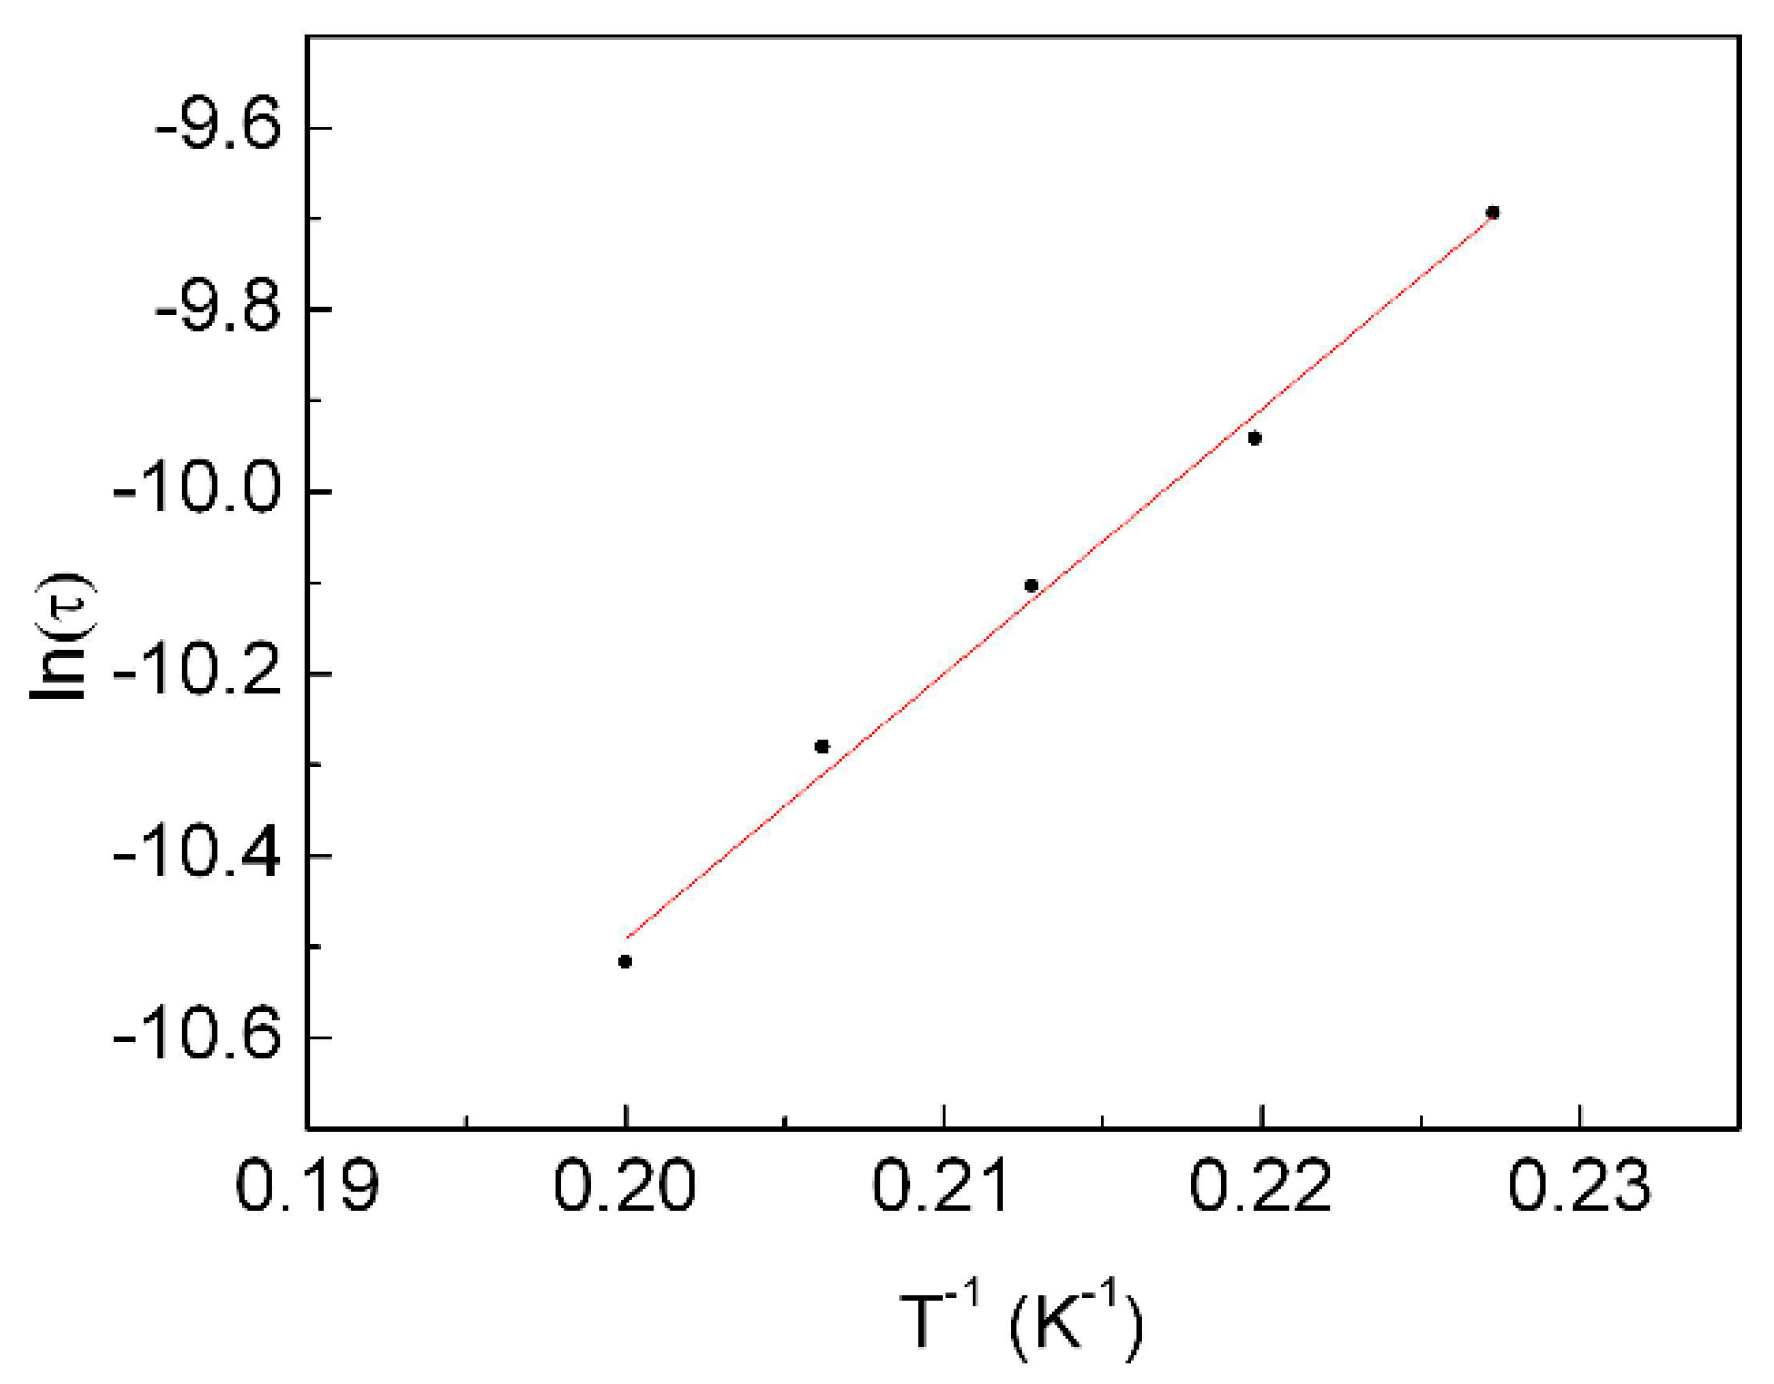
The asymmetric unit of the 1-Dy compound constituted two independent molecules, which slightly differed in bond lengths and angles (Figure 4, Table 2). Based on the presence of two Dy centers in the structure of 1-Dy, the observed two-humped shape of χ′′(ν) and Cole–Cole χ′′(χ′) plots are likely associated with two different relaxation processes corresponding to various magnetic centers [78,79,80,81,82,83,84]. The χ′(ν), χ′′(ν) dependences in the 2–2.45 K temperature range were fitted by a linear combination of two modified Debye models given by Equations (S1)–(S3) [79,84,85,86]. The fitting parameters and curves are presented in Table S8 and Figure S4, correspondingly. The values of α1 (0.6–0.45) and α2 (0.41–0.56) noticeably differed from zero signifying the multiple relaxation pathways. At a further temperature increase the two-hump shape of the χ′′(ν) dependence evolved into a single broad peak. At a range of 2.6–4.7 K the χ′(ν), χ′′(ν) dependences were not well captured neither by the modified Debye model for a single relaxation process (Equations (8)–(10)) nor by a linear combination of two modified Debye models (Equations (S1)–(S3)). Tentatively, the broad peak signal still represents the two relaxation processes observed at 2–2.45 K, which were not well separated at intermediate temperature range. As shown in Figure S5, the χ′(ν) and χ′′(ν) dependences at temperatures above 4.85 K were well fitted by the modified Debye model for single relaxation process (Equations (8)–(10)), which allowed us to assume that the peak at temperatures 4.4–5 K corresponds to the same single relaxation process and estimates the value of effective energy barrier. The results of fitting the χ′(ν) and χ′′(ν) dependences by Equations (8)–(10) in the temperature range of 4.4–5 K and Cole–Cole plots are presented in Figure S5 and Table S9. The value of the effective energy barrier, Ueff = 29 K, obtained by the analysis of the temperature dependence of relaxation time with Arrhenius law (Figure 10) correlated with the energy gap to the first excited Kramers doublet in 1-Dy, 23 cm−1 (33 K), Table 3.
In the 2-Dy the Dy3+ ion was coordinated by a slightly modified ligand (L(OCH3)), as compared to 1-Dy. Specifically, in 1-Dy the hydrogen atom of the monoanionic ligand (HL) was localized on one of the two nitrogen atoms (Figure 4) while in 2-Dy, a hydrogen atom was disordered over two positions with an occupancy of 50% on each position (Figure 5), which led to a different crystal symmetry of 1-Dy and 2-Dy and magnetic properties. To probe the magnetic relaxation processes in the 2-Dy compound we measured the frequency dependence of ac magnetic susceptibility in the presence of external dc magnetic field (H = 300 Oe, Figure 11). At 2 K the χ′′(ν) curve constituted a pronounced peak at around 20 Hz and a clearly seen onset of secondary signal of smaller magnitude in the higher frequency range (Figure 11). The high frequency relaxation process tentatively stemmed from the disorder in the structure of 2-Dy (Figure 5). The observed low frequency signal (χ′(ν) and χ′′(ν)) was fitted by the generalized Debye model for a single relaxation process (Equations (8)–(10)), as shown in Figure 11 and Table S10.
The best fitting of temperature dependence of relaxation time by Equation (4) was achieved with parameters: C = 4.2 s−1, n = 4.8, Ueff = 70 K and τ0 = 2.2 × 10⁻¹¹ s (Figure 12). The greater value of effective energy barrier Ueff in 2-Dy compared to that in 1-Dy could be attributed to a higher value of the first excited CF state, 39 cm−1 (56 K). In addition, the ground and the first excited Kramers doublets in 2-Dy exhibited strong Ising-type magnetic anisotropy (gx = 0.082, gy = 0.581 and gz = 19.000 for the ground state and gx = 0.306, gy = 0.381 and gz = 17.310 for the first excited CF state at 39 cm−1, Table 3) that suppressed the transverse magnetic anisotropy and favored the higher value of effective energy barrier.
The differences in the electronic structure of the 1-Dy and 2-Dy complexes and their magnetization relaxation are mainly specified by the local structure of the complexes, as known its small modification strongly affects the SMM properties of rare earths [9,10,11,12,13,14,15,16,17,18]. Comparative study of the electronic structure and magnetic properties of two cationic ten-coordinate Dy complexes with two neutral ligands H2DAPBH [Dy(H2DAPBH)2](NO3)3 (7) and one neutral and one monoanionic ligands [Dy(H2DAPBH)(HDAPBH)](NO3)2 (8), described in the work [61], showed that the localization of a negative charge on one of the two amido nitrogens leads to distortions in the coordination polyhedron of Dy: shortening of two bonds (Dy-N (hydrazone) and Dy-O (carbonyl)) compared with neutral ligand H2DAPBH and, as a consequence, to a decrease of magnetic anisotropy and the magnetization barrier (Ueff) of complex 8 compared to 7 (19 and 32.4 K, respectively). In our neutral ten-coordinate complex 1-Dy, the hydrogen atom of the monoanionic ligand (HL) was localized on one of the two nitrogens, which led to an increase in two bond lengths compared with dianionic ligand DAPBH (Table 2), but these distortions in the 1-Dy coordination sphere are noticeably smaller than those in the complex 8. The latter likely leads to the higher value of effective energy barrier obtained for the 1-Dy compared to that for complex 8. In the case of the 2-Dy compound, one hydrogen was disordered over two nitrogen positions and the bond lengths distortion was insignificant compared to those in the 1-Dy (Table 2), the magnetization barrier was higher than that of 1-Dy. Our results clearly show that small variations of the coordination environment of 4f metal center could significantly affect the relaxation dynamics of rare-earth complexes.

3. Materials and Methods

2,6-diacetylpyridine, benzoylhydrazide, triethylamine, DyCl3·6H2O, Er(HCOO)3·2H2O, HoCl3·6H2O, Tb(NO3)3·6H2O, dimethoxyethane, ethanol, methanol, chloroform, 4-methoxybenzoic acid, thionyl chloride and hydrazine hydrate solution (50–60% N2H4) were purchased from commercial sources and used without further purification. The infrared spectra were measured on solid samples using a Perkin Elmer Spectrum 100 Fourier Transform infrared spectrometer in the range of 4000–500 cm−1. NMR spectra were recorded on Bruker AVANCE III (500 MHz) spectrometer. Elemental analyses were carried out by the Analytical Department service at the Institute of Problems of Chemical Physics RAS using Vario MICRO cube (Elementar Analysensysteme GmbH) equipment. Both ac and dc magnetic properties were measured using Physical Properties Measurements System PPMS-9 (Quantum Design) in the temperature range of T = 2–300 K under a magnetic field up to B = 7 T. The samples in the polycrystalline (powder) form were loaded into an insulating capsule. The experimental data were corrected for the sample holder. The diamagnetic contribution from the ligand was calculated using Pascal’s constants.

3.1. Synthetic Procedures

4-Methoxybenzoic acid hydrazide was synthesized from methyl 4-methoxybenzoate (prepared, in turn, in 85% yield from 4-methoxybenzoic acid, methanol and thionyl chloride [87]) and hydrazine hydrate in refluxing methanol according to previously published procedure [88]. Found: C, 58.03; H, 6.05; N, 16.86%. Calc. for C8H10O2N2: C, 57.82; H, 6.07; N, 16.86%. FT-IR νmax/cm−1: 3323s, 1618vs, 1606vs, 1495vs, 1343vs, 1328s, 1256vs, 1188s, 1174s, 1038s, 928s, 844vs, 765s.
H2DAPBH (H2L) and H2DAPMBH (H2L(OCH3)) ligands were prepared in a ketone-hydrazine condensation reaction between one equivalent of 2,6-diacetylpyridine and two equivalents of benzoylhydrazine or 4-methoxybenzoylhydrazine respectively in 96% ethanol according to the previously reported procedure [89]. The yields were more than 90% for both ligands. H2DAPBH Found: C, 69.25; H, 5.35; N, 17.49%. Calc. for C23H21N5O2: C, 69.16; H, 5.30; N, 17.53%. FT-IR νmax/cm−1: 3277m, 1660vs, 1603m, 1580m, 1524vs, 1491m, 1450s, 1372m, 1342m, 1271vs, 1188m, 1160m, 1077m, 917s, 812s, 708vs. 1H NMR (DMSO-d6, 500 MHz) δ 10.91 (2H, s, NH), 8.30–7.20 (13H, m), 2.55 (6H, s, CH3); 13C NMR (DMSO-d6, 126 MHz) δ 164.17, 154.50, 154.16, 137.14, 133.94, 131.64, 128.29, 128.11, 120.56, 12.49. H2DAPMBH Found: C, 65.62; H, 5.71; N, 15.35%. Calc for C25H25N5O4: C, 65.35; H, 5.48; N, 15.24%. FT-IR νmax/cm−1: 3411m, 3218m, 2296m, 1646s, 1606s, 1580m, 1547s, 1502vs, 1455m, 1365m, 1285s, 1250vs, 1176vs, 1145m, 1120m, 1025s, 919m, 834vs, 758m. 1H NMR (DMSO-d6, 500 MHz) δ 10.75 (2H, s, NH), 8.35–7.54 (3H, m), 7.91 (4H, d), 7.06 (4H, d), 3.84 (6H, s, OCH3), 2.53 (6H, s, CH3). 13C NMR (DMSO-d6, 126 MHz) δ 163.53, 161.97, 154.24, 153.82, 137.12, 130.19, 125.88, 120.34, 113.53, 55.44, 12.34.
[Dy(HL)(L)]∙1.5H2O (1-Dy). To a suspension of H2L (0.44 mmol, 176 mg) in 96% ethanol (14 mL) triethylamine (0.89 mmol, 0.13 mL) was added while stirring. After 10 min under stirring, solid DyCl3·6H2O (94 mg, 0.25 mmol) was added to the reaction mixture. The white suspension turned to lemon yellow immediately, and complete dissolution of white solids was observed. After 20 min the yellow precipitate appeared and the reaction mixture was stirring at r.t. for additional two hours and then was filtered off. Slow evaporation of the filtrate produced large X-ray quality yellow crystals of ∙(1-Dy) after several days. Yield: 0.130 g (55%, on the basis of Dy(III) salt). Found: C, 55.56; H, 4.78; N, 13.85%. Calc. for C46H42DyN10O5.5: C, 56.07; H, 4.30; N, 14.21%. FT-IR νmax/cm−1: 668m, 713vs, 737m, 806m, 985m, 1036s, 1150m, 1174m, 1322m, 1370vs, 1437m, 1518s, 1558m, 1554m, 1583m, 1644m, 3350w.
[Dy(HL(OCH3))(L(OCH3))]∙C2H5OH∙0.5H2O (2-Dy). To a suspension of H2L(OCH3) (0.26 mmol, 118 mg) in 96% ethanol (10 mL) triethylamine (0.58 mmol, 0.08 mL) was added. After 10 min under stirring, solid DyCl3·6H2O (55 mg, 0.15 mmol) was added to the reaction mixture. The white suspension turned to light yellow immediately. After 1 h under stirring at r.t., light yellow precipitate, first formed, dissolved and the reaction mixture was refluxed for two hours. On cooling no precipitate was observed. Pale yellow crystals suitable for X-ray analyses were obtained after slow evaporation of ethanol. Yield: 0.119 g (70%, on the basis of Dy(III) salt). Found: C, 55.65; H, 5.15; N, 12.63%. Calc. for C52H54DyN10O9.5: C, 55.10; H, 4.80; N, 12.36%. FT-IR νmax/cm−1: 680m, 699m, 735m, 765s, 805m, 1041s, 1171vs, 1245s, 1301m, 1330m, 1368vs, 1511s, 1558m, 1585m, 1604m, 1638m, 3361w.
[Ho(HL)(L)]∙CH3OH∙CH2Cl2 (3-Ho). To a suspension of H2L (0.68 mmol, 270 mg) in absolute methanol (17 mL) triethylamine (1.4 mmol, 0.2 mL) was added. After 10 min under stirring, solid HoCl3·6H2O (125 mg, 0.33 mmol) was added to the reaction mixture. The white suspension turned to yellow immediately and the solution gradually became clear. After 1 h under stirring at 65 °C, some amount of yellow precipitate formed. The precipitate was filtered off and the reaction solution was concentrated in vacuum. The yellow crystalline product thus precipitated was dissolved in a 1:1 mixture of methanol and methylene chloride. Large transparent yellow crystals suitable for X-ray analyses were obtained after filtration and slow evaporation of this solution. Yield: 0.230 g (65%, on the basis of Ho(III) salt). Found C, 53.66; H, 4.38; N, 13.25%. Calc. for C48H45Cl2HoN10O5 C, 53.49; H, 4.21; N, 13.00%; FT-IR νmax/cm−1: 680m, 712vs, 811m, 1036m, 1147m, 1369vs, 1430m, 1514s, 1554m, 1587m, 1647m, 3368w.
[Er(HL)(L)]∙4CHCl3·H2O (4-Er). Complex 4-Er was prepared as the lemon solid as described for 1-Dy except that Er(HCOO)3·2H2O (90 mg, 0.27 mmol) was used as a source of the metal. The reaction resulted in a crystalline precipitate having, according to analysis, the composition of Er(HL)(L)·C2H5OH. Yield: 0.135 g (50%, on the basis of Er(III) salt). Found: C, 56.85; H, 4.43; N, 13.68%. Calc. for ErC48H45N10O5: C, 57.13; H, 4.50; N, 13.88%. FT-IR νmax/cm−1: 680s, 711vs, 814m, 1171m, 1301m, 1372vs, 1432m, 1522s, 1587m, 1645m, 3058w, 3351w. Bright yellow single crystals of 4-Er suitable for X-ray diffraction analysis were obtained by recrystallization of [Er(HL)(L)]∙C2H5OH from chloroform.
[Tb(L)(NO3)(H2O)2]·2DME (5-Tb). To a suspension of H2L (0.53 mmol, 212 mg) in absolute methanol (18 mL) triethylamine (1.06 mmol, 0.15 mL) was added. After 10 min under stirring solid Tb(NO3)3·6H2O (0.26 mmol, 120 mg) was added to the reaction mixture. The white suspension turned to bright yellow immediately, and the white precipitate gradually dissolved. After 20 min under stirring at r.t. the yellow precipitate appeared and the reaction mixture was stirring at 50 °C for additional two hours. After this, the yellow precipitate was filtered off and dissolved in dimethoxyethane. Slow evaporation of the solvent led to the precipitation of crystals suitable for X-ray diffraction. Yield: 0.042 g (20%, on the basis of Tb(III) salt). Found: C, 44.90; H, 5.34; N, 10.30%; Calc. for TbC31H43N6O11; C, 44.61; H, 5.19; N, 10.07%.
[Tb(HL)(L)]·CH3OH (6-Tb). The mother liquor remaining after filtering off 5-Tb was left at room temperature for slow evaporation of methanol. In this case, a crystalline product was formed having, according to the analysis, the composition [Tb(HL)(L)]·CH3OH. Yield: 0.102 g (40%, on the basis of Tb(III) salt). Found: C, 57.11; H, 4.74; N, 13.90%. Calc. for C47H43TbN10O5: C, 57.20; H, 4.39; N, 14.19%. FT-IR νmax/cm−1: 678m, 712s, 739m, 807m, 982m, 1035s. Despite multiple attempts of recrystallization of 6-Tb with using different solvents and their mixtures, we could not obtain crystals suitable for single crystal XRD experiment due to strong tendency of 6-Tb crystals to twinning.

3.2. X-Ray Data Collection, Structure Solution and Refinement

X-ray diffraction data for 1-Dy, 2-Dy, 4-Er and 5-Tb were obtained on a Bruker SMART APEX II diffractometer (CCD detector, Mo Kα, λ = 0.71073 Å, graphite monochromator) using ω-scan mode at the Laboratory for X-Ray Diffraction Studies INEOS RAS. X-ray diffraction data for 3-Ho were collected on the ‘Belok’ beamline [90] (λ = 0.79272 Å) of the Kurchatov Synchrotron Radiation Source (National Research Center “Kurchatov Institute”, Moscow, Russian Federation) in the φ-scan mode using a Rayonix SX165 CCD detector at 100 K. The data were indexed, integrated and scaled using the Bruker SAINT program (SAINT; Bruker AXS Inc., Madison, WI, USA, 2016) and the XDS program suite [91]. The reflection intensities were corrected for absorption using the SADABS software (SADABS; Bruker AXS Inc., Madison, WI, USA, 2016) for complexes 1-Dy, 4-Er and 5-Tb, the TWINABS software (Bruker TWINABS 2012/1. Bruker AXS Inc., Madison, WI, USA) for 2-Dy and the XDS program [91] for compound 3-Ho. The structures were solved by direct methods and refined by full-matrix least squares on F2 with anisotropic displacement parameters for non-hydrogen atoms in general positions, and isotropically in the case of disordered carbon atoms (complexes 1-Dy and 2-Dy). The residual electron density arises from the extremely disordered neutral solvent molecules in 1-Dy and 3-Ho was removed with the SQUEEZE tool [92]. Wherever possible, the acidic hydrogen atoms were derived from electron density map and refined isotropically, or initially the hydrogen atoms positions were derived from the electron density map followed by the placement of the hydrogen atoms in ideal positions and refinement in the riding model. All other hydrogen atoms were placed in calculated positions and refined using the riding model with Uiso(H) = 1.5 × Ueq(C, O) for the methyl and hydroxyl groups and 1.2 × Ueq(C) for hydrogen atoms of the ligand and methylene groups. SADI, DFIX and EADP instructions were applied on disordered atoms of molecules and solvents, and other atoms were refined without any constraints or restraints. In addition, twinned data in 1-Dy and 2-Dy were handled with TWIN instruction on HKLF 4 and HKLF 5, respectively. Calculations were carried out using the SHELXTL program suite [93,94]. Crystallographic data for 15 have been deposited with the Cambridge Crystallographic Data Center, № 1987371-1987375 ([email protected], https://www.ccdc.cam.ac.uk/structures/).

3.3. Simulation of Static Magnetic Properties and CF Calculations

Crystal-field (CF) analysis for complexes 14 was carried out with the conventional CF theory for f-electrons based on the Wyborne parameterization scheme [64,65,66] in combination with the superposition CF model [67,68,69] adapted for low-symmetry metal sites. Simulation of magnetic susceptibility was performed in terms of the Gerloch–McMeeking equation [71] using computational routines described elsewhere [72,73,74].

4. Conclusions

A series of neutral ten coordinate lanthanide complexes was obtained by reactions of simple salts of Dy, Ho, Er and Tb with pentadentate ligands (H2DAPBH (H2L) or H2DAPMBH (H2L(OCH3)) in the presence of Et3N as a base: [Dy(HL)(L)]∙1.5H2O∙(1-Dy), [Dy(HL(OCH3))(L(OCH3))]∙C2H5OH∙0.5H2O (2-Dy), [Ho(HL)(L)]∙CH3OH∙CH2Cl2 (3-Ho), [Er(HL)(L)]∙4CHCl3∙H2O (4-Er) and [Tb(HL)(L)] ∙CH3OH∙CHCl3 (6-Tb). These reactions also led to nine coordinate complexes as byproducts, of which terbium complex [Tb(L)(NO3)(H2O)2]·2DME (5-Tb) was isolated and characterized by X-ray diffraction analysis. Complexes 14 contained two ligands, one of which was dianionic (L2−), and the second was monoanionic (HL). The Ln3+ ions were coordinated by six nitrogen and four oxygen atoms forming a ten-coordinate bicapped square antiprism LnN6O4. Although all four complexes had very similar molecular structures, their crystal structures and space groups were different. The structures of the 1-Dy and 3-Ho complexes contained two crystallographically independent molecules and the hydrogen atom was localized at one of the two amido nitrogens of the monoanionic ligand. In contrast, the 2-Dy and 4-Er contained only one symmetry independent molecule in the unit cell, and the hydrogen atom was localized in the erbium complex and disordered over two nitrogen positions in 2-Dy. AC magnetic measurements revealed that 1-Dy, 2-Dy and 4-Er were field-induced SMMs, while 3-Ho was not. Magnetic properties of 14 and their electronic structure were analyzed in terms of theoretical calculations based on the superposition CF model. In particular, this analysis showed that SMM-silent behavior of 3-Ho was due to a non-magnetic character of the ground state of non-Kramers Ho3+ ion. The behavior of magnetic relaxation in complexes 1-Dy, 2-Dy and 4-Er varied significantly. The 1-Dy shows two separate relaxation processes, which was explained by the presence of two crystallographically independent molecules in its structure, while in 4-Er one type of curves with maximum was present on the frequency dependences of the imaginary component of the ac susceptibility. The 2-Dy complex exhibited complicated dynamics of relaxation, which was likely affected by the disorder in the structure of this compound. The magnetization barriers for the 1-Dy and 2-Dy complexes correlated with the theoretical calculations of electronic structures for these complexes. Compounds 14 refer to a rare class of ten-coordinate lanthanide complexes formed by two planar pentadentate ligands with interpenetrating N3O2 chelating rings producing a LnN6O4 polyhedron shaped as a distorted bicapped square antiprism.

Supplementary Materials

The following are available online at https://www.mdpi.com/2312-7481/6/4/60/s1, Figures S1–S10, Tables S1–S5. CCDC 1987371-1987375 contain the supplementary crystallographic data for this paper. These data can be obtained free of charge via www.ccdc.cam.ac.uk/data_request/cif, or by emailing [email protected], or by contacting The Cambridge Crystallographic Data Centre, 12 Union Road, Cambridge CB2 1EZ, UK; Fax: +44-1223-336033.

Author Contributions

Conceptualization, T.A.B., V.S.M. and E.B.Y.; synthesis and characterization, T.A.B., A.B.K. and Y.V.M.; X-ray crystallography, I.A.Y., K.A.L.; DC and AC magnetometry experiment, O.V.M. and A.N.V.; DC magnetometry analysis and theoretical calculations, V.S.M.; AC magnetometry analysis, O.V.M. and E.B.Y.; writing—original draft preparation, T.A.B., V.S.M. and O.V.M.; writing—review and editing, V.S.M. and Y.V.M.; visualization, Y.V.M.; project administration, E.B.Y. All authors have read and agreed to the published version of the manuscript.

Funding

The authors are grateful for the financial support from the Russian Science Foundation (RSF project № 18-13-00264). O.V.M. and A.N.V. acknowledge support by the Ministry of Education and Science of the Russian Federation in the framework of Increase Competitiveness Program of NUST “MISiS” Grant No. K2-2020-008; by Act 211 of the Government of Russian Federation, Contracts No. 02.A03.21.0004 and No. 02.A03.21.0011, in the section ac magnetic measurements.

Conflicts of Interest

The authors declare no conflict of interest.

References

  1. Sessoli, R.; Gatteschi, D.; Caneschi, A.; Novak, M.A. Magnetic bistability in a metal-ion cluster. Nature 1993, 365, 141–143. [Google Scholar] [CrossRef]
  2. Caneschi, A.; Gatteschi, D.; Sessoli, R.; Barra, A.L.; Brunel, L.C.; Guillot, M. Alternating current susceptibility, high field magnetization, and millimeter band EPR evidence for a ground S = 10 state in [Mn12O12(CH3COO)16(H2O)4].2 CH3COOH.4H2O. J. Am. Chem. Soc. 1991, 113, 5873–5874. [Google Scholar] [CrossRef]
  3. Gateschi, D.; Sessoli, R.; Villain, J. Molecular Nanomagnets; Oxford University Press: Oxford, UK, 2006. [Google Scholar]
  4. Benelli, C.; Gatteschi, D. Introduction to Molecular Magnetism; Wiley-VCH: Weinheim, Germany, 2015. [Google Scholar]
  5. Leuenberger, M.N.; Loss, D. Quantum computing in molecular magnets. Nature 2001, 410, 789–793. [Google Scholar] [CrossRef] [PubMed] [Green Version]
  6. Bogani, L.; Wernsdorfer, W. Molecular spintronics using single-molecule magnets. Nat. Mater. 2008, 7, 179–186. [Google Scholar] [CrossRef] [PubMed]
  7. Mannini, M.; Pineider, F.; Sainctavit, P.; Danieli, C.; Otero, E.; Sciancalepore, C.; Talarico, A.M.; Arrio, M.-A.; Cornia, A.; Gatteschi, D.; et al. Magnetic memory of a single-molecule quantum magnet wired to a gold surface. Nat. Mater. 2009, 8, 194–197. [Google Scholar] [CrossRef]
  8. Ishikawa, N.; Sugita, M.; Ishikawa, T.; Koshihara, S.Y.; Kaizu, Y. Lanthanide Double-Decker Complexes Functioning as Magnets at the Single-Molecular Level. J. Am. Chem. Soc. 2003, 125, 8694–8695. [Google Scholar] [CrossRef] [PubMed]
  9. Sessoli, R.; Powell, A.K. Strategies towards single molecule magnets based on lanthanide ions. Coord. Chem. Rev. 2009, 253, 2328–2341. [Google Scholar] [CrossRef]
  10. Sorace, L.; Benelli, C.; Gatteschi, D. Lanthanides in molecular magnetism: Old tools in a new field. Chem. Soc. Rev. 2011, 40, 3092–3104. [Google Scholar] [CrossRef]
  11. Woodruff, D.N.; Winpenny, R.E.P.; Layfield, R.A. Lanthanide Single-Molecule Magnets. Chem. Rev. 2013, 113, 5110–5148. [Google Scholar] [CrossRef]
  12. Nakano, M.; Oshio, H. Magnetic anisotropies in paramagnetic polynuclear metal complexes. Chem. Soc. Rev. 2011, 40, 3239–3248. [Google Scholar] [CrossRef]
  13. Tang, J.; Zhang, P. Lanthanide Single Molecular Magnets; Springer: Berlin/Heidelberg, Germany, 2015. [Google Scholar]
  14. Jiang, S.-D.; Wang, B.-W.; Gao, S. Advances in Lanthanide Single-Ion Magnets. Struct. Bond. 2015, 164, 111–141. [Google Scholar]
  15. Habib, F.; Murugesu, M. Lessons learned from dinuclear lanthanide nano-magnets. Chem. Soc. Rev. 2013, 42, 3278–3288. [Google Scholar] [CrossRef] [PubMed] [Green Version]
  16. Gregson, M.; Chilton, N.F.; Ariciu, A.-M.; Tuna, F.; Crowe, I.F.; Lewis, W.; Blake, A.J.; Collison, D.; McInnes, E.J.L.; Winpenny, R.E.P.; et al. A monometallic lanthanide bis(methanediide) single molecule magnet with a large energy barrier and complex spin relaxation behaviour. Chem. Sci. 2016, 7, 155–165. [Google Scholar] [CrossRef] [PubMed] [Green Version]
  17. Layfield, R.A.; Murugesu, M. (Eds.) Lanthanides and Actinides in Molecular Magnetism; Wiley-VCH: Weinheim, Germany, 2015. [Google Scholar]
  18. Wang, H.; Wang, B.-W.; Bian, Y.; Gao, S.; Jiang, J. Single-molecule magnetism of tetrapyrrole lanthanide compounds with sandwich multiple-decker structures. Coord. Chem. Rev. 2016, 306, 195–216. [Google Scholar] [CrossRef]
  19. Ishikawa, N.; Otsuka, S.; Kaizu, Y. The Effect of the f–f Interaction on the Dynamic Magnetism of a Coupled 4f8 System in a Dinuclear Terbium Complex with Phthalocyanines. Angew. Chem. Int. Ed. 2005, 44, 731–733. [Google Scholar] [CrossRef]
  20. Ishikawa, N.; Sugita, M.; Wernsdorfer, W. Quantum Tunneling of Magnetization in Lanthanide Single-Molecule Magnets: Bis(phthalocyaninato)terbium and Bis(phthalocyaninato)dysprosium Anions. Angew. Chem. Int. Ed. 2005, 44, 2931–2935. [Google Scholar] [CrossRef] [Green Version]
  21. Branzoli, F.; Carretta, P.; Filibian, M.; Zoppellaro, G.; Graf, M.J.; Galan-Mascaros, J.R.; Fuhr, O.; Brink, S.; Ruben, M. Spin Dynamics in the Negatively Charged Terbium (III) Bis-phthalocyaninato Complex. J. Am. Chem. Soc. 2009, 131, 4387–4396. [Google Scholar] [CrossRef]
  22. Jiang, S.-D.; Wang, B.-W.; Su, G.; Wang, Z.-M.; Gao, S. A Mononuclear Dysprosium Complex Featuring Single-Molecule-Magnet Behavior. Angew. Chem. Int. Ed. 2010, 49, 7448–7451. [Google Scholar] [CrossRef]
  23. Blagg, R.J.; Muryn, C.A.; McInnes, E.J.L.; Tuna, F.; Winpenny, R.E.P. Single Pyramid Magnets: Dy5 Pyramids with Slow Magnetic Relaxation to 40K. Angew. Chem. Int. Ed. 2011, 50, 6530–6533. [Google Scholar] [CrossRef]
  24. Liu, J.-L.; Chen, Y.-C.; Zheng, Y.-Z.; Lin, W.-Q.; Ungur, L.; Wernsdorfer, W.; Chibotaru, L.F.; Tong, M.-L. Switching the anisotropy barrier of a single-ion magnet by symmetry change from quasi-D5h to quasi-Oh. Chem. Sci. 2013, 4, 3310–3316. [Google Scholar] [CrossRef]
  25. Blagg, R.J.; Ungur, L.; Tuna, F.; Speak, J.; Comar, P.; Collison, D.; Wernsdorfer, W.; McInnes, E.J.L.; Chibotaru, L.F.; Winpenny, R.E.P. Magnetic relaxation pathways in lanthanide single-molecule magnets. Nat. Chem. 2013, 5, 673–678. [Google Scholar] [CrossRef] [PubMed]
  26. Ding, Y.-S.; Chilton, N.F.; Winpenny, R.E.P.; Zheng, Y.-Z. On Approaching the Limit of Molecular Magnetic Anisotropy: A Near-Perfect Pentagonal Bipyramidal Dysprosium(III) Single-Molecule Magnet. Angew. Chem. Int. Ed. 2016, 55, 16071–16074. [Google Scholar] [CrossRef] [PubMed]
  27. Chen, Y.-C.; Liu, J.-L.; Ungur, L.; Liu, J.; Li, Q.-W.; Wang, L.-F.; Ni, Z.-P.; Chibotaru, L.F.; Chen, X.-M.; Tong, M.-L. Symmetry-Supported Magnetic Blocking at 20 K in Pentagonal Bipyramidal Dy(III) Single-Ion Magnets. J. Am. Chem. Soc. 2016, 138, 2829–2837. [Google Scholar] [CrossRef]
  28. Liu, J.; Chen, Y.-C.; Liu, J.-L.; Vieru, V.; Ungur, L.; Jia, J.-H.; Chibotaru, L.F.; Lan, Y.; Wernsdorfer, W.; Gao, S.; et al. A Stable Pentagonal Bipyramidal Dy(III) Single-Ion Magnet with a Record Magnetization Reversal Barrier over 1000 K. J. Am. Chem. Soc. 2016, 138, 5441–5450. [Google Scholar] [CrossRef] [PubMed]
  29. Zhang, L.; Jung, J.; Zhang, P.; Guo, M.; Zhao, L.; Tang, J.; Le Guennic, B. Site-Resolved Two-Step Relaxation Process in an Asymmetric Dy2 Single-Molecule Magnet. Chem. Eur. J. 2016, 22, 1392–1398. [Google Scholar] [CrossRef] [PubMed]
  30. Ishikawa, N.; Sugita, M.; Wernsdorfer, W. Nuclear Spin Driven Quantum Tunneling of Magnetization in a New Lanthanide Single-Molecule Magnet: Bis(Phthalocyaninato)holmium Anion. J. Am. Chem. Soc. 2005, 127, 3650–3651. [Google Scholar] [CrossRef] [Green Version]
  31. Cardona-Serra, S.; Clemente-Juan, J.M.; Coronado, E.; Gaita-Ariño, A.; Camón, A.; Evangelisti, M.; Luis, F.; Martínez-Pérez, M.J.; Sesé, J. Lanthanoid Single-Ion Magnets Based on Polyoxometalates with a 5-fold Symmetry: The Series [LnP5W30O110]12– (Ln3+ = Tb, Dy, Ho, Er, Tm, and Yb). J. Am. Chem. Soc. 2012, 134, 14982–14990. [Google Scholar] [CrossRef]
  32. Chen, Y.-C.; Liu, J.-L.; Wernsdorfer, W.; Liu, D.; Chibotaru, L.F.; Chen, X.-M.; Tong, M.-L. Hyperfine-Interaction-Driven Suppression of Quantum Tunneling at Zero Field in a Holmium(III) Single-Ion Magnet. Angew. Chem. Int. Ed. 2017, 56, 4996–5000. [Google Scholar] [CrossRef]
  33. Jiang, S.-D.; Wang, B.-W.; Sun, H.-L.; Wang, Z.-M.; Gao, S. An Organometallic Single-Ion Magnet. J. Am. Chem. Soc. 2011, 133, 4730–4733. [Google Scholar] [CrossRef]
  34. Meihaus, K.R.; Long, J.R. Magnetic Blocking at 10 K and a Dipolar-Mediated Avalanche in Salts of the Bis(η8-cyclooctatetraenide) Complex [Er(COT)2]. J. Am. Chem. Soc. 2013, 135, 17952–17957. [Google Scholar] [CrossRef]
  35. Ungur, L.; Le Roy, J.J.; Korobkov, I.; Murugesu, M.; Chibotaru, L.F. Fine-tuning the Local Symmetry to Attain Record Blocking Temperature and Magnetic Remanence in a Single-Ion Magnet. Angew. Chem. Int. Ed. 2014, 53, 4413–4417. [Google Scholar] [CrossRef] [PubMed]
  36. Le Roy, J.J.; Ungur, L.; Korobkov, I.; Chibotaru, L.F.; Murugesu, M. Coupling Strategies to Enhance Single-Molecule Magnet Properties of Erbium-Cyclooctatetraenyl Complexes. J. Am. Chem. Soc. 2014, 136, 8003–8010. [Google Scholar] [CrossRef] [PubMed]
  37. Bar, A.K.; Kalita, P.; Singh, M.K.; Rajaraman, G.; Chandrasekhar, V. Low-coordinate mononuclear lanthanide complexes as molecular nanomagnets. Coord. Chem. Rev. 2018, 367, 163–216. [Google Scholar] [CrossRef]
  38. Guo, F.-S.; Day, B.; Chen, Y.-C.; Tong, M.-L.; Mansikkamaki, A.; Layfield, R.A. A Dysprosium Metallocene Single-Molecule Magnet Functioning at the Axial Limit. Angew. Chem. Int. Ed. 2017, 56, 11445–11449. [Google Scholar] [CrossRef]
  39. Goodwin, C.A.P.; Ortu, F.; Reta, D.; Chilton, N.F.; Mills, D.P. Molecular magnetic hysteresis at 60 kelvin in dysprosocenium. Nature 2017, 548, 439–442. [Google Scholar] [CrossRef]
  40. Guo, F.S.; Day, B.M.; Chen, Y.C.; Tong, M.L.; Mansikkamäki, A.; Layfield, R.A. Magnetic hysteresis up to 80 kelvin in a dysprosium metallocene single-molecule magnet. Science 2018, 362, 1400–1403. [Google Scholar] [CrossRef] [Green Version]
  41. Gupta, S.K.; Rajeshkumar, T.; Rajaraman, G.; Murugavel, R. An air-stable Dy(III) single-ion magnet with high anisotropy barrier and blocking temperature. Chem. Sci. 2016, 7, 5181–5191. [Google Scholar] [CrossRef] [Green Version]
  42. Chen, Y.C.; Liu, J.L.; Lan, Y.; Zhong, Z.Q.; Mansikkamäki, A.; Ungur, L.; Li, Q.W.; Jia, J.H.; Chibotaru, L.F.; Han, J.B.; et al. Dynamic Magnetic and Optical Insight into a High Performance Pentagonal Bipyramidal DyIII Single-Ion Magnet. Chem. Eur. J. 2017, 23, 5708–5715. [Google Scholar] [CrossRef] [Green Version]
  43. Liu, J.L.; Wu, J.Y.; Chen, Y.C.; Mereacre, V.; Powell, A.K.; Ungur, L.; Chibotaru, L.F.; Chen, X.M.; Tong, M.L. A Heterometallic FeII–DyIII Single-Molecule Magnet with a Record Anisotropy Barrier. Angew. Chem. Int. Ed. 2014, 53, 12966–12970. [Google Scholar] [CrossRef]
  44. Li, J.; Yuan, C.; Yang, L.; Kong, M.; Zhang, J.; Ge, J.Y.; Zhang, Y.Q.; Song, Y. Magnetic Anisotropy along a Series of Lanthanide Polyoxometalates with Pentagonal Bipyramidal Symmetry. Inorg. Chem. 2017, 56, 7835–7841. [Google Scholar] [CrossRef]
  45. Huang, X.C.; Zhang, M.; Wu, D.; Shao, D.; Zhao, X.H.; Huang, W.; Wang, X.Y. Single molecule magnet behavior observed in a 1-D dysprosium chain with quasi-D5h symmetry. Dalton Trans. 2015, 44, 20834–20838. [Google Scholar] [CrossRef] [PubMed]
  46. Ren, M.; Bao, S.S.; Wang, B.W.; Ferreira, R.A.S.; Zheng, L.M.; Carlos, L.D. Lanthanide phosphonates with pseudo-D5h local symmetry exhibiting magnetic and luminescence bifunctional properties. Inorg. Chem. Front. 2015, 2, 558–566. [Google Scholar] [CrossRef]
  47. Li, M.; Wu, H.; Yang, Q.; Ke, H.; Yin, B.; Shi, Q.; Wang, W.; Wei, Q.; Xie, G.; Chen, S. Experimental and Theoretical Interpretation on the Magnetic Behavior in a Series of Pentagonal-Bipyramidal DyIII Single-Ion Magnets. Chem. Eur. J. 2017, 23, 17775–17787. [Google Scholar] [CrossRef] [PubMed]
  48. Lisowski, J.; Sessler, J.L.; Lynch, V.; Mody, T.D. 1H NMR Spectroscopic Study of Paramagnetic Lanthanide(III) Texaphyrins. Effect of Axial Ligation. J. Am. Chem. Soc. 1995, 117, 2273–2285. [Google Scholar] [CrossRef]
  49. Magda, D.; Crofts, S.; Lin, A.; Miles, D.; Wright, M.; Sessler, J.L. Synthesis and Kinetic Properties of Ribozyme Analogues Prepared Using Phosphoramidite Derivatives of Dysprosium(III) Texaphyrin. J. Am. Chem. Soc. 1997, 119, 2293–2294. [Google Scholar] [CrossRef]
  50. Bar, A.K.; Kalita, P.; Sutter, J.P.; Chandrasekhar, V. Pentagonal-Bipyramid Ln(III) Complexes Exhibiting Single-Ion-Magnet Behavior: A Rational Synthetic Approach for a Rigid Equatorial Plane. Inorg. Chem. 2018, 57, 2398–2401. [Google Scholar] [CrossRef]
  51. Gavey, E.L.; Beldjoudi, Y.; Rawson, J.M.; Stamatatos, T.C.; Pilkington, M. Slow relaxation in the first penta-aza Dy(III) macrocyclic complex. Chem. Commun. 2014, 50, 3741–3743. [Google Scholar] [CrossRef]
  52. Gavey, E.L.; Pilkington, M. Employing Schiff-base macrocycles to probe the effect of ligand field on the relaxation dynamics of a family of DyIII SMMs. Polyhedron 2016, 108, 122–130. [Google Scholar] [CrossRef]
  53. Sasnovskaya, V.D.; Kopotkov, V.A.; Kazakova, A.V.; Talantsev, A.D.; Morgunov, R.B.; Simonov, S.V.; Zorina, L.V.; Mironov, V.S.; Yagubskii, E.B. Slow magnetic relaxation in mononuclear complexes of Tb, Dy, Ho and Er with the pentadentate (N3O2) Schiff-base dapsc ligand. New J. Chem. 2018, 42, 14883–14893. [Google Scholar] [CrossRef]
  54. Bazhenova, T.A.; Mironov, V.S.; Yakushev, I.A.; Svetogorov, R.D.; Maximova, O.V.; Manakin, Y.V.; Kornev, A.B.; Vasiliev, A.N.; Yagubskii, E.B. End-to-End Azido-Bridged Lanthanide Chain Complexes (Dy, Er, Gd, and Y) with a Pentadentate Schiff-Base [N3O2] Ligand: Synthesis, Structure, and Magnetism. Inorg. Chem. 2020, 59, 563–578. [Google Scholar] [CrossRef]
  55. Tamboura, F.B.; Haba, P.M.; Gaye, M.; Sall, A.S.; Barry, A.H.; Jouini, T. Structural studies of bis-(2,6-diacetylpyridine-bis-(phenylhydrazone)) and X-ray structure of its Y(III), Pr(III), Sm(III) and Er(III) complex. Polyhedron 2004, 23, 1191–1197. [Google Scholar] [CrossRef]
  56. Gao, X.-S.; Yao, X.J.C. Two new complexes of Lanthanide(III) ion with the N3O2-donor Schiff base ligand: Synthesis, crystal structure, and magnetic properties. J. Mol. Struct. 2016, 1126, 275–279. [Google Scholar] [CrossRef]
  57. Tamboura, F.B.; Diop, M.; Gaye, M.; Sall, A.S.; Barry, A.H.; Jouini, T. X-ray structure and spectroscopic properties of some lanthanides(III) complexes derived from 2,6-diacetylpyridine-bis(benzoylhydrazone). Inorg. Chem. Commun. 2003, 6, 1004–1010. [Google Scholar] [CrossRef]
  58. Farrugia, L.J. WinGX and ORTER for Windows: An update. J. Appl. Crystallogr. 2012, 45, 849–854. [Google Scholar] [CrossRef]
  59. Llunell, M.; Casanova, D.; Cirera, J.; Alemany, P.; Alvarez, S. SHAPE, version 2.1; Universitat de Barcelona: Barcelona, Spain, 2013; Available online: http://www.ee.ub.edu/index.php?option=com_jdownloads&view=viewcategories&Itemid=529 (accessed on 26 April 2013).
  60. Alvarez, S.; Alemany, P.; Casanova, D.; Cirera, J.; Llunell, M.; Avnir, D. Shape maps and polyhedral interconversion paths in transition metal chemistry. Coord. Chem. Rev. 2005, 249, 1693–1708. [Google Scholar] [CrossRef]
  61. Batchelor, L.J.; Cimatti, I.; Guillot, R.; Tuna, F.; Wernsdorfer, W.; Ungur, L.; Chibotaru, L.F.; Campbell, V.E.; Mallah, T. Chemical tuning of the magnetic relaxation in dysprosium(iii) mononuclear complexes. Dalton Trans. 2014, 43, 12146–12149. [Google Scholar] [CrossRef] [PubMed]
  62. Gamer, M.T.; Lan, Y.; Roesky, P.W.; Powell, A.K.; Clerac, R. Pentanuclear Dysprosium Hydroxy Cluster Showing Single-Molecule-Magnet Behavior. Inorg. Chem. 2008, 47, 6581–6583. [Google Scholar] [CrossRef]
  63. Layfield, R.A.; McDouall, J.J.W.; Sulway, S.A.; Tuna, F.; Collison, D.; Winpenny, R.E.P. Influence of the N-Bridging Ligand on Magnetic Relaxation in an Organometallic Dysprosium Single-Molecule Magnet. Chem. Eur. J. 2010, 16, 4442–4446. [Google Scholar] [CrossRef]
  64. Wybourne, G. Spectroscopic Properties of Rare Earths; Interscience: New York, NY, USA, 1965. [Google Scholar]
  65. Hüfner, S. Optical Spectra of Transparent Rare Earth Compounds; Academic: New York, NY, USA, 1978. [Google Scholar]
  66. Gorller-Walrand, C.; Binnemans, K. Rationalization of the crystal-field parametrization. In Handbook on the Physics and Chemistry of Rare Earths; Gschneidner, K.A., Jr., Eyring, L., Eds.; North-Holland: Amsterdam, The Netherlands, 1996; Volume 23, pp. 121–283. [Google Scholar]
  67. Carnall, W.T.; Fields, P.R.; Rajnak, K. Spectral Intensities of the Trivalent Lanthanides and Actinides in Solution. II. Pm3+, Sm3+, Eu3+, Gd3+, Tb3+, Dy3+, and Ho3+. J. Chem. Phys. 1968, 49, 4412–4423. [Google Scholar] [CrossRef]
  68. Carnall, W.T.; Goodman, G.L.; Rajnak, K.; Rana, R.S. A systematic analysis of the spectra of the lanthanides doped into single crystal LaF3. J. Chem. Phys. 1989, 90, 3443–3457. [Google Scholar] [CrossRef]
  69. Newman, D.J. The orbit-lattice interaction for lanthanide ions. I. Determination of empirical parameters. Aust. J. Phys. 1978, 31, 79–93. [Google Scholar] [CrossRef] [Green Version]
  70. Newman, D.J.; Ng, B. The superposition model of crystal fields. Rep. Prog. Phys. 1989, 52, 699–763. [Google Scholar] [CrossRef]
  71. Bungenstock, C.; Tröster, T.; Holzapfel, W.B. Effect of pressure on free-ion and crystal-field parameters of Pr3+ in LOCl (L = La, Pr, Gd). Phys. Rev. B 2000, 62, 7945–7955. [Google Scholar] [CrossRef]
  72. Gerloch, M.; McMeeking, R.F. Paramagnetic properties of unsymmetrical transition-metal complexes. J. Chem. Soc. Dalton Trans. 1975, 22, 2443–2451. [Google Scholar] [CrossRef]
  73. Mironov, V.S.; Li, L.E. Crystal field analysis of Pr3+ and Nd3+ ions in KR(WO4)2 (R = Y or Gd) potassium rare-earth tungstates. J. Alloys Compos. 1998, 279, 83–92. [Google Scholar] [CrossRef]
  74. Mironov, V.S.; Galyametdinov, Y.G.; Ceulemans, A.; Binnemans, K. On the magnetic anisotropy of lanthanide-containing metallomesogens. J. Chem. Phys. 2000, 113, 10293–10303. [Google Scholar] [CrossRef]
  75. Mironov, V.S.; Galyametdinov, Y.G.; Ceulemans, A.; Gorller-Walrand, C.; Binnemans, K. Room-temperature magnetic anisotropy of lanthanide complexes: A model study for various coordination polyhedra. J. Chem. Phys. 2002, 116, 4673–4685. [Google Scholar] [CrossRef]
  76. Chang, N.C.; Gruber, J.B.; Leavitt, R.P.; Morrison, C.A. Optical spectra, energy levels, and crystal-field analysis of tripositive rare earth ions in Y2O3. I. Kramers ions in C2 sites. J. Chem. Phys. 1982, 76, 3877–3889. [Google Scholar] [CrossRef]
  77. Cole, K.S.; Cole, R.H. Dispersion and Absorption in Dielectrics I. Alternating Current Characteristics. J. Chem. Phys. 1941, 9, 341–351. [Google Scholar] [CrossRef] [Green Version]
  78. Shrivastava, K.N. Theory of Spin–Lattice Relaxation. Phys. Status Solidi B 1983, 117, 437–458. [Google Scholar] [CrossRef]
  79. Guo, Y.-N.; Xu, G.-F.; Guo, Y.; Tang, J. Relaxation dynamics of dysprosium(III) single molecule magnets. Dalton Trans. 2011, 40, 9953–9963. [Google Scholar] [CrossRef]
  80. Gonidec, M.; Luis, F.; Vílchez, À.; Esquena, J.; Amabilino, D.B.; Veciana, J. A Liquid-Crystalline Single-Molecule Magnet with Variable Magnetic Properties. Angew. Chem. Int. Ed. 2010, 49, 1623–1626. [Google Scholar] [CrossRef] [PubMed]
  81. Guo, Y.-N.; Xu, G.-F.; Gamez, P.; Zhao, L.; Lin, S.-Y.; Deng, R.; Tang, J.; Zhang, H.-J. Two-Step Relaxation in a Linear Tetranuclear Dysprosium(III) Aggregate Showing Single-Molecule Magnet Behavior. J. Am. Chem. Soc. 2010, 132, 8538–8539. [Google Scholar] [CrossRef] [PubMed]
  82. Diaz-Ortega, I.F.; Herrera, J.M.; Aravena, D.; Ruiz, E.; Guta, T.; Rajaraman, G.; Nojiri, H.; Colacio, E. Designing a Dy2 Single-Molecule Magnet with Two Well-Differentiated Relaxation Processes by Using a Nonsymmetric Bis-bidentate Bipyrimidine-N-Oxide Ligand: A Comparison with Mononuclear Counterparts. Inorg. Chem. 2018, 57, 6362–6375. [Google Scholar] [CrossRef] [Green Version]
  83. Li, D.-P.; Wang, T.-W.; Li, C.-H.; Liu, D.-S.; Li, Y.-Z.; You, X.-Z. Single-ion magnets based on mononuclear lanthanide complexes with chiral Schiff base ligands [Ln(FTA)3L] (Ln = Sm, Eu, Gd, Tb and Dy). Chem. Commun. 2010, 46, 2929–2931. [Google Scholar] [CrossRef] [PubMed]
  84. Wang, Y.; Li, X.-L.; Wang, T.-W.; Song, Y.; You, X.-Z. Slow Relaxation Processes and Single-Ion Magnetic Behaviors in Dysprosium-Containing Complexes. Inorg. Chem. 2010, 49, 969–976. [Google Scholar] [CrossRef]
  85. Jiang, S.-D.; Liu, S.-S.; Zhou, L.-N.; Wang, B.-W.; Wang, Z.-M.; Gao, S. Series of Lanthanide Organometallic Single-Ion Magnets. Inorg. Chem. 2012, 51, 3079–3087. [Google Scholar] [CrossRef]
  86. Funes, A.V.; Carrella, L.; Rentschler, E.; Alborés, P. Exploring the Slow Relaxation of the Magnetization in CoIII-Decorated {DyIII2} Units. Chem. Eur. J. 2016, 22, 14308–14318. [Google Scholar] [CrossRef]
  87. Zhang, G.; Yu, Y.; Zhao, Y.; Xie, X.; Ding, C. Iron(III)/TEMPO-Catalyzed Synthesis of 2,5-Disubstituted 1,3,4-Oxadiazoles by Oxidative Cyclization under Mild Conditions. Synlett 2017, 28, 1373–1377. [Google Scholar]
  88. Murty, M.S.R.; Penthala, R.; Polepalli, S.; Jain, N. Synthesis and biological evaluation of novel resveratrol-oxadiazole hybrid heterocycles as potential antiproliferative agents. Med. Chem. Res. 2016, 25, 627–643. [Google Scholar] [CrossRef]
  89. Giordano, T.J.; Palenik, G.J.; Palenik, R.C.; Sullivan, D.A. Pentagonal-bipyramidal complexes. Synthesis and characterization of aqua(nitrato)[2,6-diacetylpyridine bis(benzoyl hydrazone)]cobalt(II) nitrate and diaqua[2,6-diacetylpyridine bis(benzoyl hydrazone)]nickel(II) nitrate dehydrate. Inorg. Chem. 1979, 18, 2445–2450. [Google Scholar] [CrossRef]
  90. Svetogorov, R.D.; Dorovatovskii, P.V.; Lazarenko, V.A. Belok/XSA Diffraction Beamline for Studying Crystalline Samples at Kurchatov Synchrotron Radiation Source. Cryst. Res. Technol. 2020, 55, 1900184. [Google Scholar] [CrossRef]
  91. Kabsch, W. XDS. Acta Crystallogr. Sect. D Biol. Crystallogr. 2010, 66, 125–132. [Google Scholar] [CrossRef] [PubMed] [Green Version]
  92. Spek, A.L. PLATON SQUEEZE: A tool for the calculation of the disordered solvent contribution to the calculated structure factors. Acta Cryst. 2015, C71, 9–18. [Google Scholar]
  93. Sheldrick, G.M. SHELXTL-97, version 5.10; Bruker AXS Inc.: Madison, WI, USA, 1997. [Google Scholar]
  94. Sheldrick, G.M. SHELXT—Integrated Space-Group and Crystal-Structure Determination. Acta Crystallogr. Sect. A Found. Adv. 2015, 71, 3–8. [Google Scholar] [CrossRef] [Green Version]
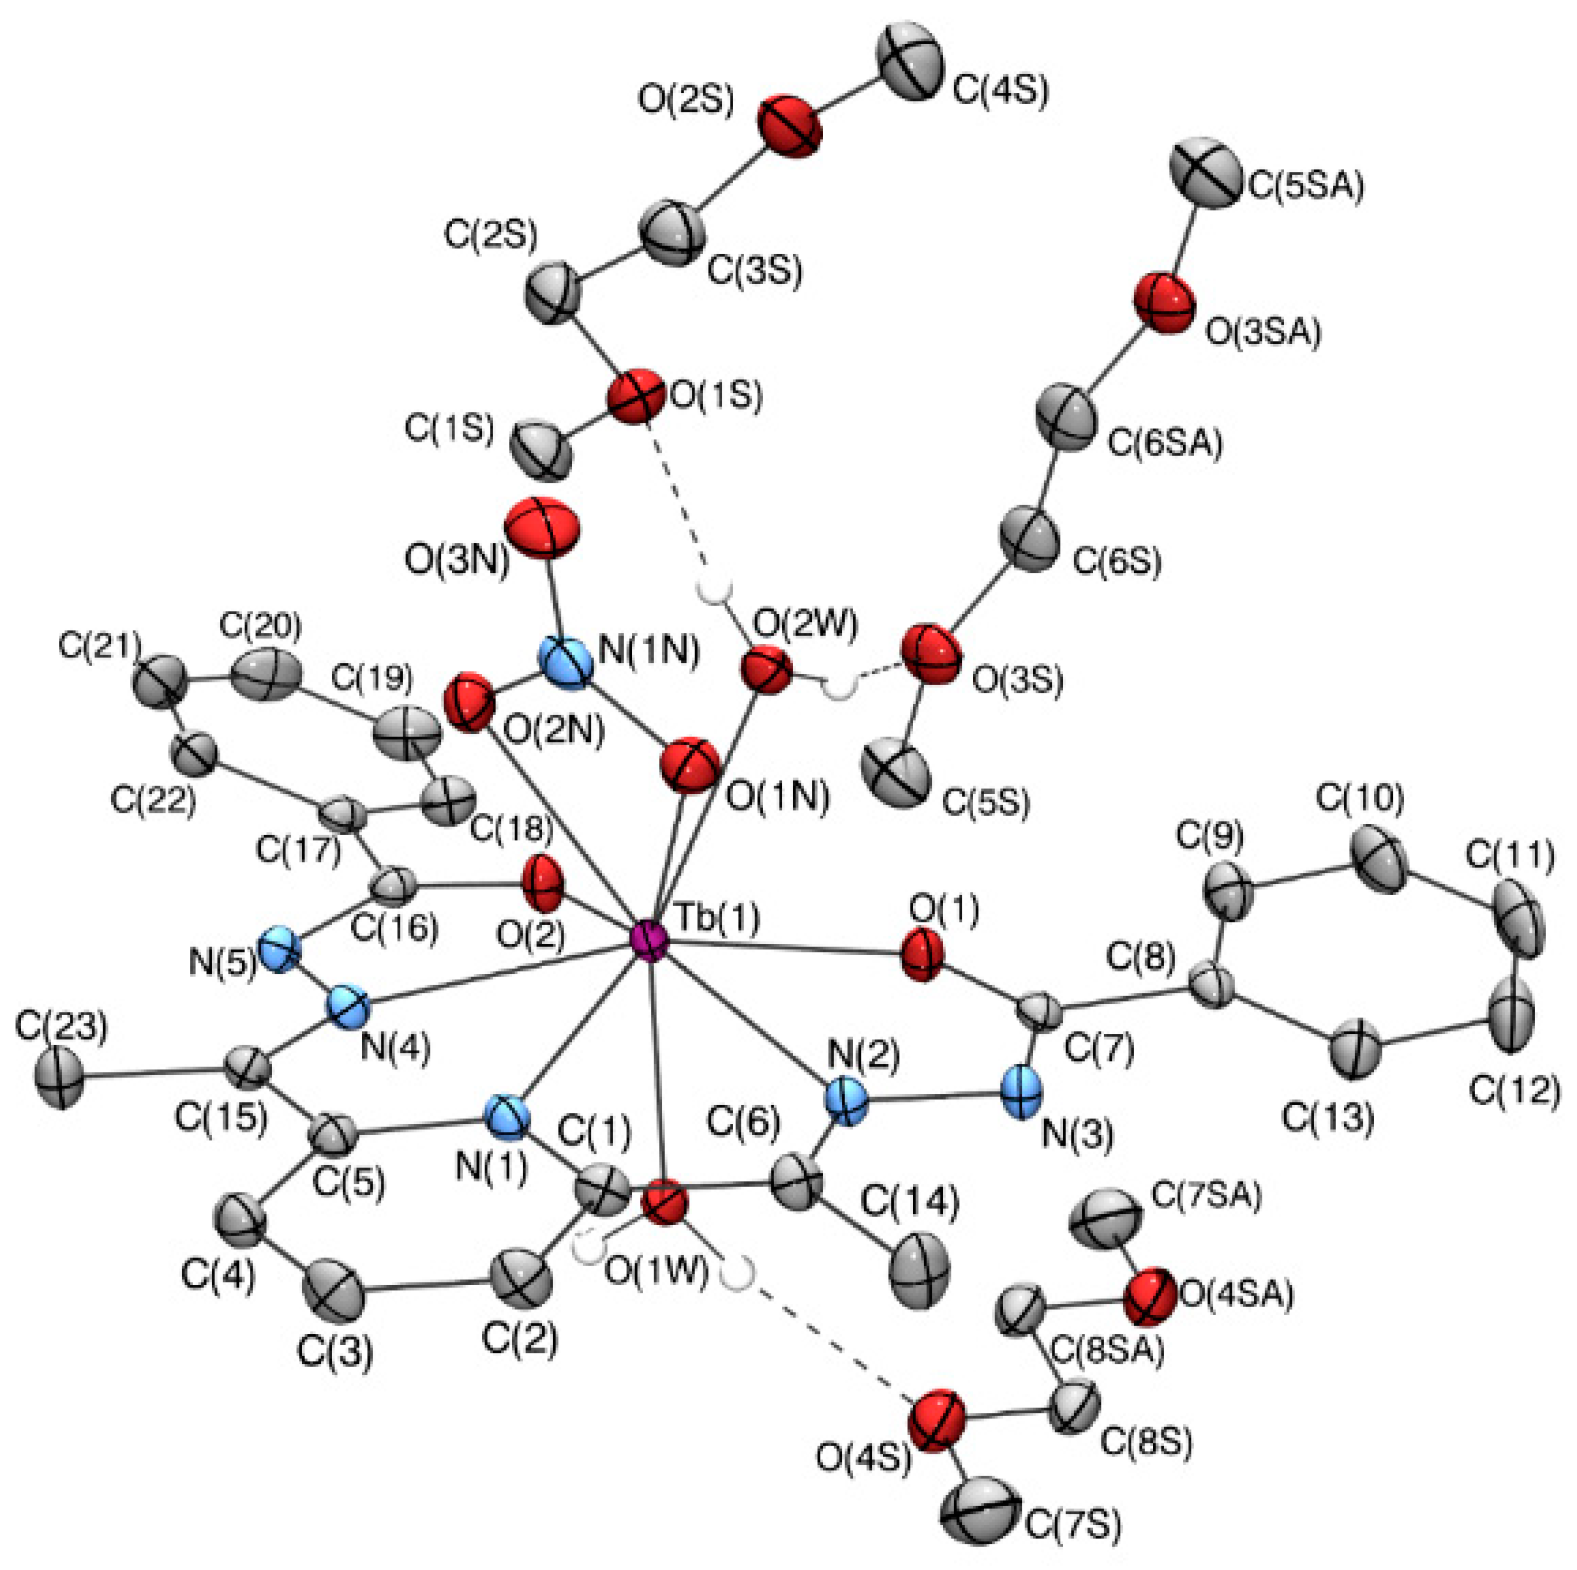
Figure 1. ORTEP [58] drawing of [Tb(DAPBH)(NO3)(H2O)2](DME)2 (5-Tb) with the atom numbering scheme. Thermal ellipsoids are shown at the 35% probability level. Hydrogens are omitted for clarity, except those participating in H-bonding.
Magnetochemistry 06 00060 g001
Figure 2. ORTEP representation of the molecular structure of 4-Er complex with 50% thermal ellipsoid probability as an illustration of common structural features of 14 complexes. Hydrogen atoms are omitted for clarity, except one localized at the N5A atom.
Magnetochemistry 06 00060 g002
Figure 3. Schematic representation of (a) the coordination of two pentadentate ligands on an Ln atom to form a complex [Ln(HL)(L)] and (b) bicapped square antiprism LnN6O4 capped by the pyridyl N atoms of the H2DAPBH ligand.
Magnetochemistry 06 00060 g003
Figure 4. General labeling scheme for main molecules of 1, 3 and 4: (a,b) for first crystallographically independent molecule in 1-Dy and 3-Ho and (c,d) for second independent molecule in 1-Dy and 3-Ho. In complex 4-Er, the hydrogen atom in a monoanionic ligand is localized at position N5A (Figure 2). On each part of the image one ligand, and hydrogen atoms (except one hydrogen atom of a partially monoanionic ligand) are not shown for clarity.
Magnetochemistry 06 00060 g004
Figure 5. Labeling scheme for main molecule of 2-Dy. On each part of the image (a,b) one ligand, and hydrogen atoms (except one remaining hydrogen atom of a monoanionic ligand) are not shown for clarity; both hydrogen atoms positions H3 and H3′ were occupied at the 50% probability level. Disordering in each ligand is shown with dashed open bonds.
Magnetochemistry 06 00060 g005
Figure 6. Experimental (open circles) and calculated (solid red lines) temperature dependence of the χMT product under dc field of 1000 Oe for complexes: (a) 1-Dy; (b) 2-Dy; (c) 3-Ho and (d) 4-Er. Insets: M/µB vs. B/T plots within the field range of 0–4.5 T and temperature range of 2–5 K.
Magnetochemistry 06 00060 g006
Figure 7. The frequency dependence of the χ′ (a) and χ′′ (b) under a magnetic field H = 1500 Oe and the Cole–Cole diagram (c) at different temperatures for 4-Er.
Magnetochemistry 06 00060 g007
Figure 8. Magnetization relaxation time ln(τ) vs. T−1 plot under the optimal dc field of 1500 Oe for 4-Er. The solid red line represents the fit to Equation (11) with no contribution from the direct relaxation process (A = 0).
Magnetochemistry 06 00060 g008
Figure 9. The frequency dependence of ac magnetic susceptibility χ′(ν) (a) and χ′′(ν) (b) under a magnetic field H = 800 Oe and the Cole–Cole diagram at different temperatures for 1-Dy (c).
Magnetochemistry 06 00060 g009
Figure 10. The ln(τ) vs. T−1 plot under the optimum dc field of 800 Oe for 1-Dy. The solid is fitting by the Arrhenius law in temperature range of 4.4–5 K with parameters τ0 = 8.3 × 10⁻⁸ s, Ueff = 29 K.
Magnetochemistry 06 00060 g010
Figure 11. The frequency dependence of the χ′(ν) (a) and χ′′(ν) (b) under the magnetic field of H = 300 Oe, its fitting by the modified Debye model and the Cole–Cole diagram (c) at different temperatures and high frequency secondary relaxation process (d) for 2-Dy; circles are the experimental data and red lines are the fitting curves.
Magnetochemistry 06 00060 g011aMagnetochemistry 06 00060 g011b
Figure 12. Magnetization relaxation time ln (τ) vs. T−1 plot under the DC field for 2-Dy. The solid is the best fitting plot by Equation (11), C = 4.2 s−1, n = 4.8, Ueff = 70 K, τ0 = 2.2 × 10⁻¹¹ s, A = 0, τQTM−1 = 0.
Magnetochemistry 06 00060 g012
Table 1. Crystal data and structure refinement for 15.
1-Dy2-Dy3-Ho4-Er5-Tb
CCDC number19873711987372198737319873741987375
empirical formulaC46H42DyN10O5.50C52H54DyN10O9.50C48H45Cl2HoN10O5C50H45Cl12ErN10O5C31H43N6O11Tb
formula weight985.391133.551077.771458.62834.63
temperature, K 120(2)120(2)100(2)120(2)120(2)
color, habityellow, blockyellow, blockyellow-green, prismlemon, blockyellow, block
crystal size, mm 0.232 × 0.208 × 0.2080.320 × 0.210 × 0.1900.180 × 0.100 × 0.0800.435 × 0.431 × 0.2200.325 × 0.285 × 0.242
radiation sourcefine-focus sealed tubefine-focus sealed tubesynchrotronfine-focus sealed tubefine-focus sealed tube
wavelength, Å0.710730.710730.792720.710730.71073
crystal systemTetragonalTriclinicMonoclinicOrthorhombicMonoclinic
space groupP43P-1P21/cP212121P21/n
a, Å14.0526(14)7.0262(2)20.115(4)11.5236(10)12.2369(8)
b, Å14.0526(14)13.4861(3)19.538(2)20.3299(17)19.6927(13)
c, Å46.815(5)31.4635(9)25.698(5)25.596(2)14.9627(10)
α, deg9084.098(2)909090
β, deg9074.746(2)104.258(16)90106.0617(14)
γ, deg9062.038(2)909090
V, Å39245(2)2437.9(4)9788(3)5996.5(9)3464.9(4)
Z82844
density (calcd), Mg/m31.4161.5441.4631.6161.600
μ, mm−11.6731.6032.3751.9882.108
F(000)39841156435229081696
θ range, deg1.690–28.0001.242–29.0001.165–28.5001.880–28.9992.017–28.998
Index ranges−18 ≤ h ≤ 17,
−18 ≤ k ≤ 18,
−61 ≤ l ≤ 57
−16 ≤ h ≤ 17,
−17 ≤ k ≤ 18,
0 ≤ l ≤ 23
−24 ≤ h ≤ 24,
−23 ≤ k ≤ 23,
−30 ≤ l ≤ 30
−15 ≤ h ≤ 15,
−27 ≤ k ≤ 27,
−34 ≤ l ≤ 34
−16 ≤ h ≤ 16,
−26 ≤ k ≤ 26,
−20 ≤ l ≤ 20
reflections collected63,80931,974211,75071,92433,909
independent reflections21,755 (Rint =0.1051)12,799 (Rint = 0.0881)17,880 (Rint = 0.0785)15,895 (Rint = 0.0376)9218 (Rint = 0.0375)
R1/wR2 (I > 2σ(I))0.0625/0.12290.0578/0.13570.0528/0.14930.0288/0.07130.0254/0.0535
R1/wR2 (all data)0.0998/0.13970.0796/0.15710.0716/0.16010.0305/0.07210.0336/0.0572
data/restraints/parameters21,755/21/112312,799/0/67317,880/4/120615,895/14/7449218/0/452
goodness-of-fit on F20.9921.1221.2701.1761.031
Tmin/Tmax0.5983/0.74610.6114/0.74600.0005/1.00000.5842/0.74610.5471/0.7460
Δρmax/Δρmin, e·Å−31.726/−1.3642.234/−2.2661.809/−1.2181.909/−1.3850.784/−0.613
Table 2. Selected bond lengths (Å) and angles (°) in 1-Dy(1), 2-Dy, 3-Ho(1) and 4-Er.
1-Dy(1)2-Dy3-Ho(1)4-Er
Ln-N1 (pyridine)2.597(9)2.706(5)2.656(4)2.616(3)
Ln-N1A (pyridine)2.647(9)2.663(5)2.627(4)2.629(4)
Ln-N22.503(10)2.601(5)2.535(4)2.513(3)
Ln-N2A2.508(11)2.603(5)2.534(4)2.494(4)
Ln-N42.575(11)2.561(5)2.577(5)2.517(4)
Ln-N4A2.554(11)2.534(5)2.516(4)2.598(3)
Ln-O12.377(8)2.496(4)2.371(4)2.347(3)
Ln-O1A2.398(9)2.453(4)2.389(3)2.358(3)
Ln-O22.528(8)2.346(5)2.499(3)2.392(3)
Ln-O2A2.414(9)2.360(4)2.349(3)2.464(3)
Dihedral angle *, °58.7(3)58.36(10)59.92(8) 57.80(10)
*Angle between the planes N1-N2-N4-Ln1 and N1A-N2A-N4A-Ln1.
Table 3. Calculated crystal-field (CF) splitting energies (cm−1) of the lowest J-multiplets of Ln3+ ions and g-tensors of the ground and first excited CF states in 1-Dy, 2-Dy, 3-Ho and 4-Er complexes.
1-Dy, 6H15/22-Dy, 6H15/23-Ho, 5I84-Er, 4I15/2
0000
23390.623
65778575
10911692197
210197117234
253267132284
295312162328
345358187390
227
250
282
330
339
g-tensor components of the ground CF state
gx = 0.084 gx = 0.082-gx = 0.461
gy = 1.096 gy = 0.581gy = 1.037
gz = 17.981gz = 19.000gz = 14.884
g-tensor components of the first excited CF state
gx = 0.428gx = 0.306-gx = 2.068
gy = 0.620gy = 0.381gy = 4.896
gz = 16.210gz = 17.310gz = 11.618
Publisher’s Note: MDPI stays neutral with regard to jurisdictional claims in published maps and institutional affiliations.