Abstract
It is well recognized that intermetallics based on rare-earth (R) and transition metals (T) display numerous interesting magnetic properties, leading to potential applications in different fields. The latest progress regarding magnetic properties and the magnetocaloric effect (MCE) in the nanostructured PrCo compound, as well as its carbides and hydrides, is reviewed in this paper. Some of this progress reveals remarkable MCE performance, which makes it attractive in the field of magnetic refrigeration at high temperatures. With the purpose of understanding the magnetic and magnetocaloric characteristics of these compounds, the crystal structure, microstructure, and magnetism are also brought into focus. The PrCo compound has interesting magnetic properties, such as a high Curie temperature T and uniaxial magnetocrystalline anisotropy. It crystallizes in a hexagonal structure (2:7 H) of the CeNi type and is stable at relatively low temperatures (T ≤ 1023 K), or it has a rhombohedral structure (2:7 R) of the GdCo type and is stable at high temperatures (T ≥ 1223 K). Studies of the magnetocaloric properties of the nanocrystalline PrCo compound have shown the existence of a large reversible magnetic entropy change (S) with a second-order magnetic transition. After its substitution, we showed that nanocrystalline PrCoFe compounds that were annealed at T = 973 K crystallized in the 2:7 H structure similarly to the parent compound. The extended X-ray absorption fine-structure (EXAFS) spectra adjustments showed that Fe atoms preferably occupy the 12k site for x ≤ 1. The study of the magnetic properties of nanocrystalline PrCoFe compounds revealed an increase in T of about 26% for x = 0.5, as well as an improvement in the coercivity, H (12 kOe), and the (BH) (9 MGOe) product. On the other hand, the insertion of C atoms into the PrCo cell led to a marked improvement in the T value of 21.6%. The best magnetic properties were found for the PrCoC compound annealed at 973 K, H = 10.3 kOe, and (BH) = 11.5 MGOe. We studied the microstructure, hydrogenation, and magnetic properties of nanocrystalline PrCoH hydrides. The crystal structure of the PrCo compound transformed from a hexagonal (P63/mmc) into an orthorhombic (Pbcn) and monoclinic (C2/c) structure during hydrogenation. The absorption of H by the PrCo compound led to an increase in the T value from 600 K at x = 0 to 691 K at x = 3.75. The PrCoH hydride had optimal magnetic properties: H = 6.1 KOe, (BH) = 5.8 MGOe, and T = 607 K. We tailored the mean field theory (MFT) and random magnetic anisotropy (RMA) methods to investigate the magnetic moments, exchange interactions, and magnetic anisotropy properties. The relationship between the microstructure and magnetic properties is discussed. The obtained results provide a fundamental reference for adapting the magnetic properties of the PrCo, PrCoFe, PrCoC, and PrCoH compounds for potential permanent nanomagnets, high-density magnetic recording, and magnetic refrigeration applications.
1. Introduction
In recent years, magnetic nanomaterials based on rare-earth elements (R) and transition metals (T) have been widely investigated due to their extremely diverse potential applications in industrial fields [1,2,3,4,5,6,7,8]. These properties are often used to produce soft, hard, or semi-hard magnetic materials [9,10,11,12,13,14,15,16,17,18,19,20,21,22,23]. The origin of these exceptional magnetic properties is particularly due to the coexistence of of two complementary kinds of magnetism: the localized magnetism characteristic of rare-earth (R) electrons and the itinerant magnetism of the electrons of transition metals (T), such as cobalt (Co) and iron (Fe) [24,25,26,27,28,29,30,31,32,33]. The R elements thus provide their strong magnetocrystalline anisotropy (H) due to the interactions between their orbital moment and the crystal field. The metals provide their strong magnetization and a high Curie temperature (T) due to the important exchange interactions between the elements [34,35,36,37,38,39,40,41,42,43,44,45,46,47,48,49,50,51]. Permanent magnets are the idea of an ever-increasing number of recent devices. Alloys and intermetallic compounds obtained by combining (R) elements with metals (T) form a crucial class of materials for which applications have been found in permanent magnets [44]. Among the intermetallic systems, the noncrystalline PrCo compound is currently one of the most promising [34,52,53,54]. The interest in these systems is due to the combination of the complementary characteristics of the -itinerant and -localized magnetism of Co and Pr atoms, respectively [54,55]. In order to strengthen these interactions, it is necessary to partially substitute the Co atoms in the noncrystalline PrCo compounds with an appropriate element, such as iron (Fe), or through the insertion of a light element, such as carbon (C) or hydrogen (H), which can increase interatomic distances and strengthen the magnetic moment.
In addition, in parallel with the optimization of the intrinsic magnetic properties, it is necessary to optimize the extrinsic magnetic properties of the PrCo, PrCoFe, PrCoC, and PrCoH compounds by searching for a suitable nanocrystalline state corresponding to the potential applications. In our study, we implemented the high-energy grinding technique followed by controlled recrystallization. At this scale, the grain size was brought to the order of magnitude of the exchange length. This method, which constitutes a non-equilibrium synthesis process, makes it possible to obtain metastable nanostructured powders from a mixture of elementary powders. We tailored the mean field theory (MFT) [56,57] and random magnetic anisotropy (RMA) [58,59] to investigate the magnetic moments, exchange interactions, and magnetic anisotropy properties. The correlation between microstructure and magnetic properties is discussed. The magnetocaloric properties for the nanocrystalline PrCo compound are reported. The magnetocaloric effect is calculated in terms of isothermal magnetic entropy change (S) based on the magnetization isotherms obtained at different temperatures for the rhombohedral (2:7 R) and hexagonal structures (2:7 H). Furthermore, we discuss the impact of stacking blocks on low-field magnetic refrigeration in the nanocrystalline PrCo compound.
2. Synthesis Methods of PrCo, PrCoFe, PrCoC, and PrCoH Samples
To prepare the nanocrystalline PrCo and PrCoFe (x = 0.25, 0.5, 0.75, and 1) samples, high-energy ball milling was carried out on previously prepared ingots [60]. The pre-alloy obtained by fusion was broken inside a glove box with a mortar and then introduced with five beads into a hermetically sealed jar. A Fritsch P7 planetary mill with a bead/powder ratio of 15:1 was used to get finer particles. The ground powder was then wrapped in tantalum foil (Ta) and then sealed in quartz ampoules under secondary vacuum (10 bar) at different annealing temperatures: T = 700 K and 1350 K. The tantalum foil (Ta) was used to avoid contamination due to contact with silica; these samples were first degassed under secondary vacuum to ensure that no impurities came to pollute the synthesis products. The sample was cooled after leaving the oven by quenching in water. To insert carbon atoms (C) into the PrCo elemental cell, we used a carbonation technique that involved a solid–solid-type reaction according to the following reaction [61]:
Hydrogen atoms (H) were inserted into the PrCo compound with a solid–gas reaction between the sample and 99.99% pure dihydrogen (H) [58]. The method used was that of Sievert [62,63]. The amount of absorbed hydrogen was determined with a volumetric method [64,65].
3. Structural, Microstructural, and Magnetic Characterizations of the Samples
The microstructural characterizations of the PrCo, PrCoFe, PrCoC, and PrCoH samples were investigated by using X-ray diffraction (XRD; Bruker D8 Advance) with CuK radiation of wavelength = 0.154056 nm. The refinement of the patterns was done by using the FULLPROF computing code based on the Rietveld method [66,67] with the assumption of the Thompson–Cox–Hastings line profile. The goodness-of-fit indicators and R were calculated as previously described in [61]. Extended X-ray absorption fine-structure (EXAFS) measurements were performed on a 2.75 GeV SAMBA beamline, Synchrotron SOLEIL, France. EXAFS experiments were carried out at 293 K in the fluorescence mode using a 4-element Si(111) drift detector. The EXAFS spectra were extrapolated using the MAXeCherokee code [68,69], while the fitting process and comparison between theoretical and experimental EXAFS curves were carried out with the MAX-Roundmidnight package [68]. The theoretical phases and amplitudes used in the EXAFS models were determined with the FEFF8 code [70] by using the crystal structure results of the Rietveld refinements at each Fe site with the use of the MAX-CRYSTALFFREV code [68] for the Crystal Structure–EXAFS Modeling interface.
The morphology, the chemical compositions, and the images were considered using a JEOL 2010 FEG transmission electron microscope equipped with an energy-dispersive spectrometer (EDS). For the TEM measurements, specimens were thinned using a focused-ion-beam-type FEI Helios 600 Nanolab dual-beam instrument. The Curie temperature T was measured on a MANICS differential sample magnetometer (DSM-871 Magneto/susceptometer) in a field of 1 kOe with a sample of around 5–10 × 10 g. T was obtained from the M(T) curve by extracting the linear part of the M(T) curve and determining the temperature value of the intersection with the expanded baseline. Magnetic hysteresis M(H) loops were determined using a Physical Properties Measurement System (PPMS9) Quantum Design microscope.
4. Structural Properties
4.1. Nanocrystalline PrCo Compound
The nanocrystalline PrCo compound can crystallize into two polymorphic structures [54] as a function of the annealing temperature T; the first is a hexagonal (2:7 H) structure of the CeNi type ( space group) that is stable at T ≤ 1023 K with the lattice parameters Å and Å. The second is a rhombohedral (2:7 R) structure of the GdCo type ( space group) that is stable at T ≥ 1223 K. The lattice parameters are Å and c = 36.549 ÅṪhe PrCo cells can be defined by stacking the hexagonal structural blocks for PrCo (CaCu-type structure) and the cubic PrCo blocks (MgCu- and MgZn-type structures) along the common hexagonal (trigonal for PrCo) axis [54]. The lattice parameters of the two structures are distinguished by the c parameter, which is higher for the 2:7 R structure due to the difference in stacking ([2H] = [BBABBA], [3R] = 3[BBA]) [71,72,73].
4.2. Nanocrystalline PrCoFe (x = 0, 0.25, 0.5, 0.75, and 1) Compounds
The analysis performed with XRD for the nanocrystalline PrCoFe (x = 0, 0.25, 0.5, 0.75, and 1) compounds annealed at T = 973 K showed the presence of a main crystallographic phase with the structure of CeNi (P6/mmc space group) [69,71]. The peaks found were identified by assigning Miller indices () to the different peaks recorded. Using Rietveld analysis, we were able to determine the crystallographic parameters for each compound. The structural results and the R and parameters are listed in Table 1. The minimum of the and parameters corresponded to Fe located in the position, which indicated that was the preferential site for Fe. The PrCoFe unit cell expansion was about 1.15%. The variation of the ratio with x suggested that the unit cell expansion was anisotropic and more pronounced in the basal plane. The grain size was estimated from Scherrer’s expression [61,63]: = 0.9 /(cos), where is the full width at half maximum (FWHM) of the peaks at the diffraction angle . The values were around 125, 130, 140, 146, and 154 nm for 0, 0.25, 0.50, 0.75, and 1, respectively. For 1 < x < 2.5, the multiphase sample formation was highlighted by additional diffraction peaks that were not indexed in the P6/mmc space group. We noted the appearance of additional lines corresponding to the reflections of the 1:3 structure. For x > 2.5, we noted the appearance of other peaks that were similar to those corresponding to the 1:3 and 2:17 phases. The 2:7 structure disappeared entirely and broke down into Pr(Co,Fe) + Pr(Co,Fe) [69].

Table 1.
Structural data from the Rietveld analysis of nanocrystalline PrCoFe compounds.
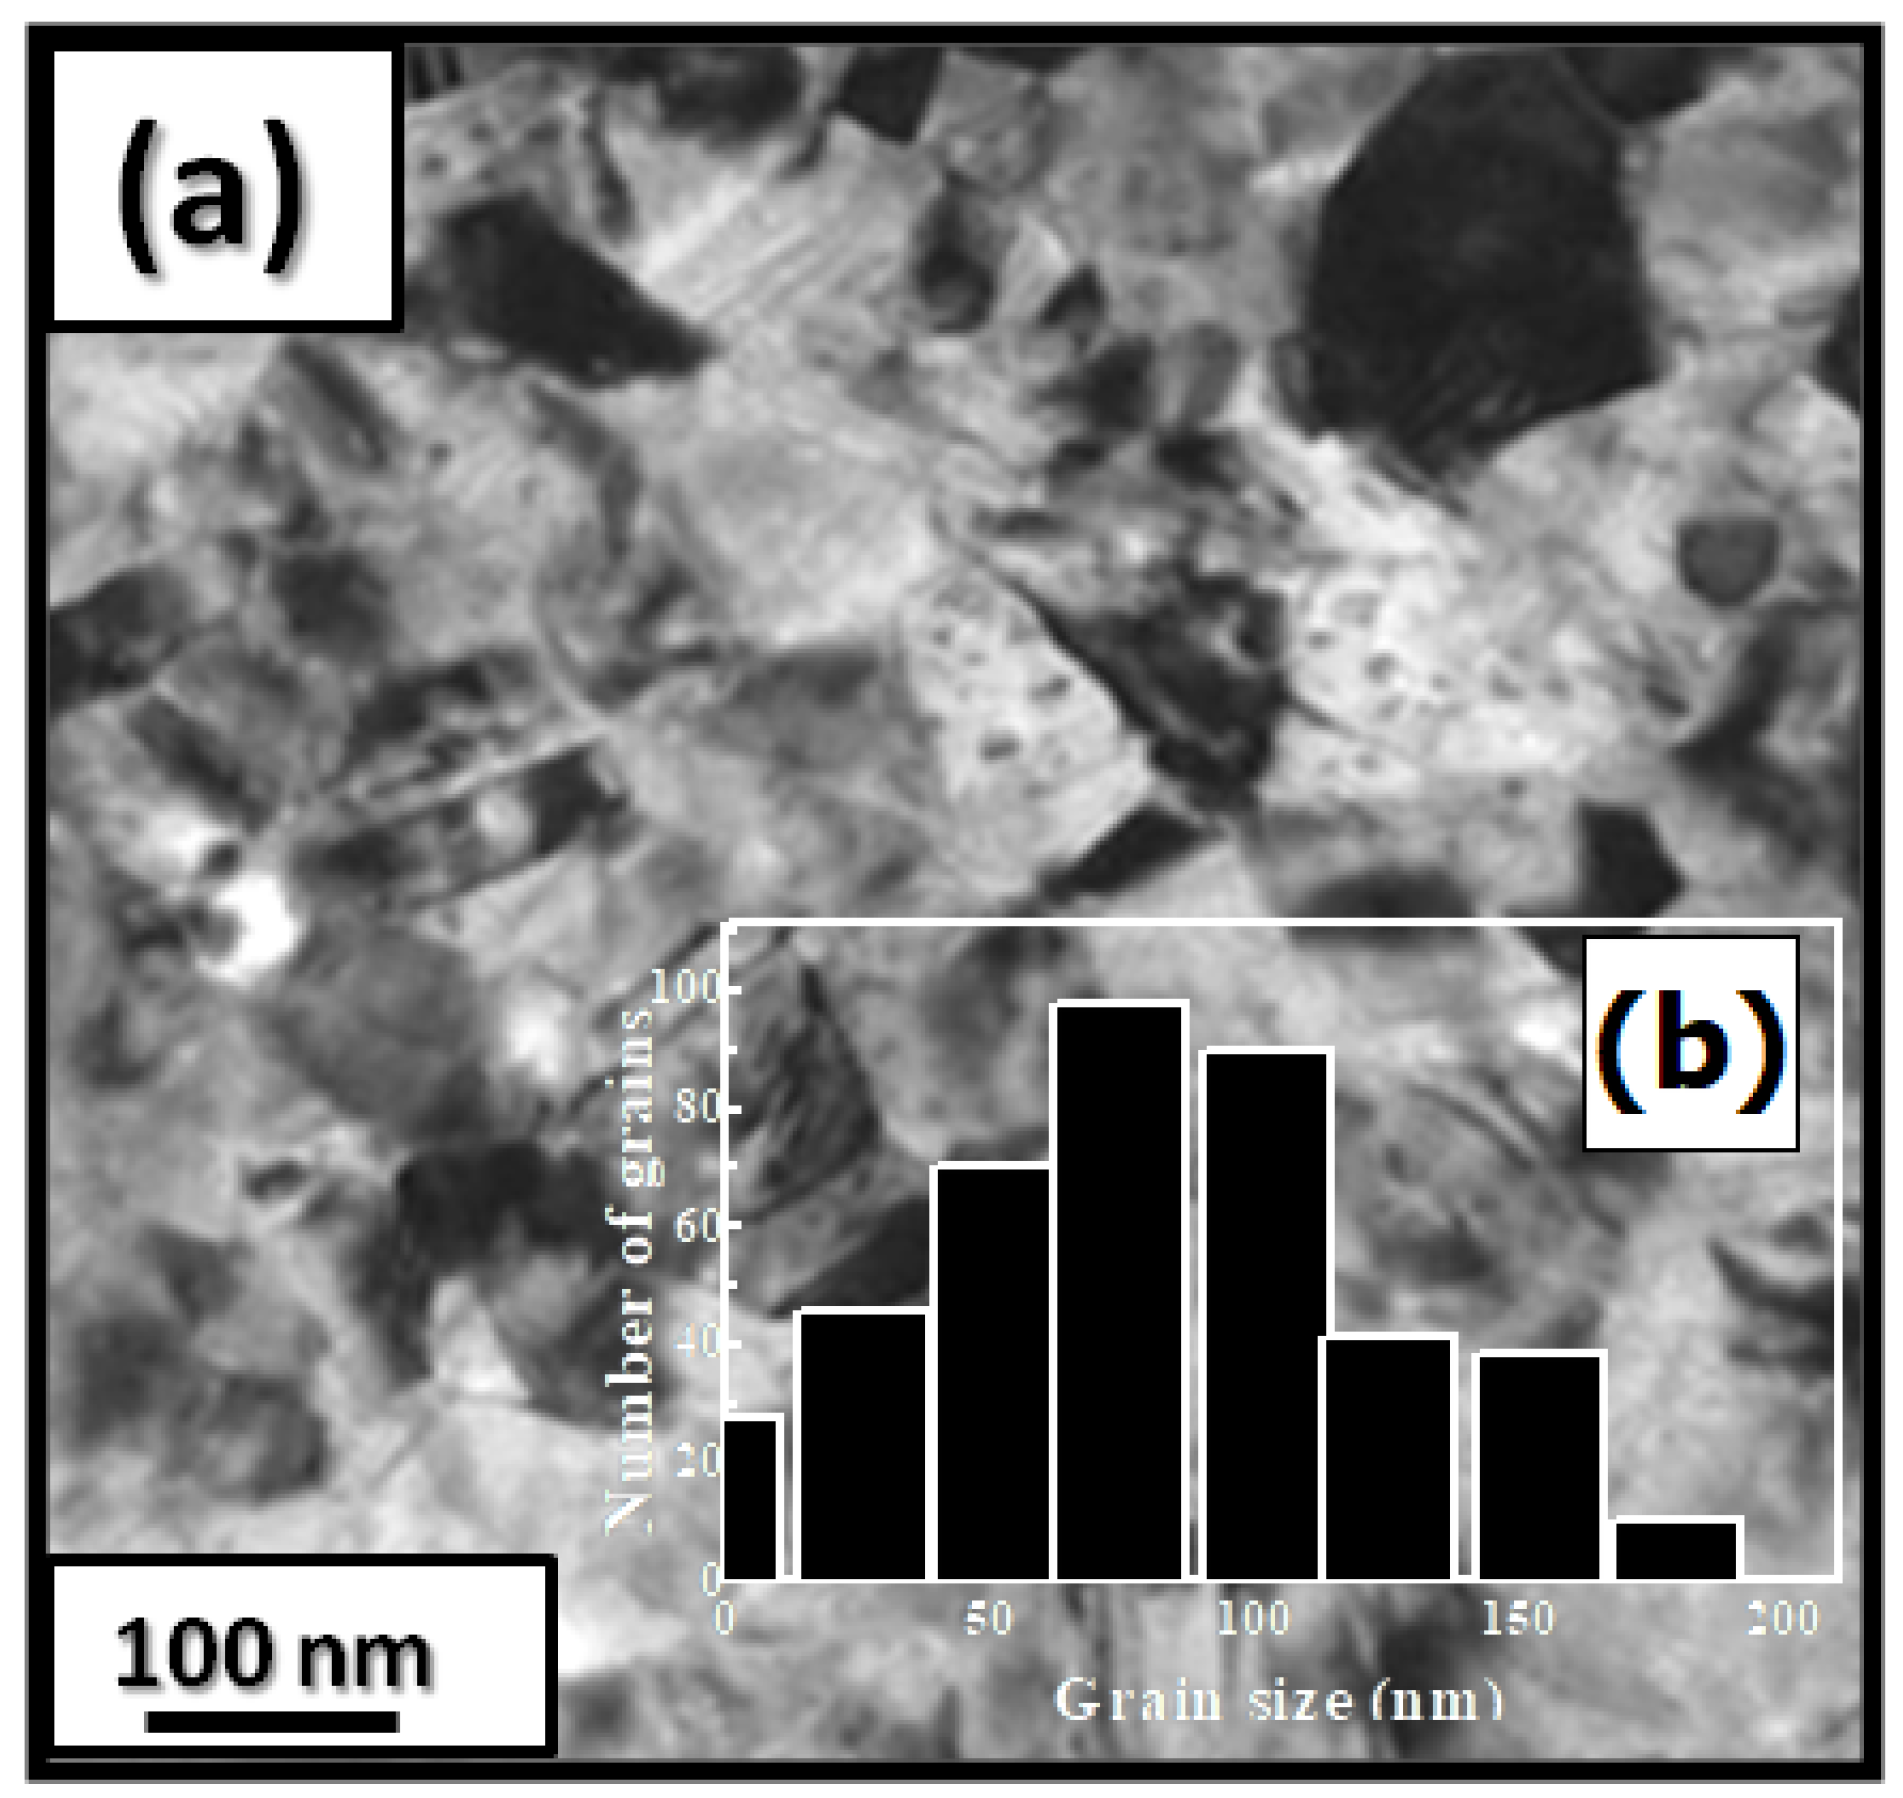
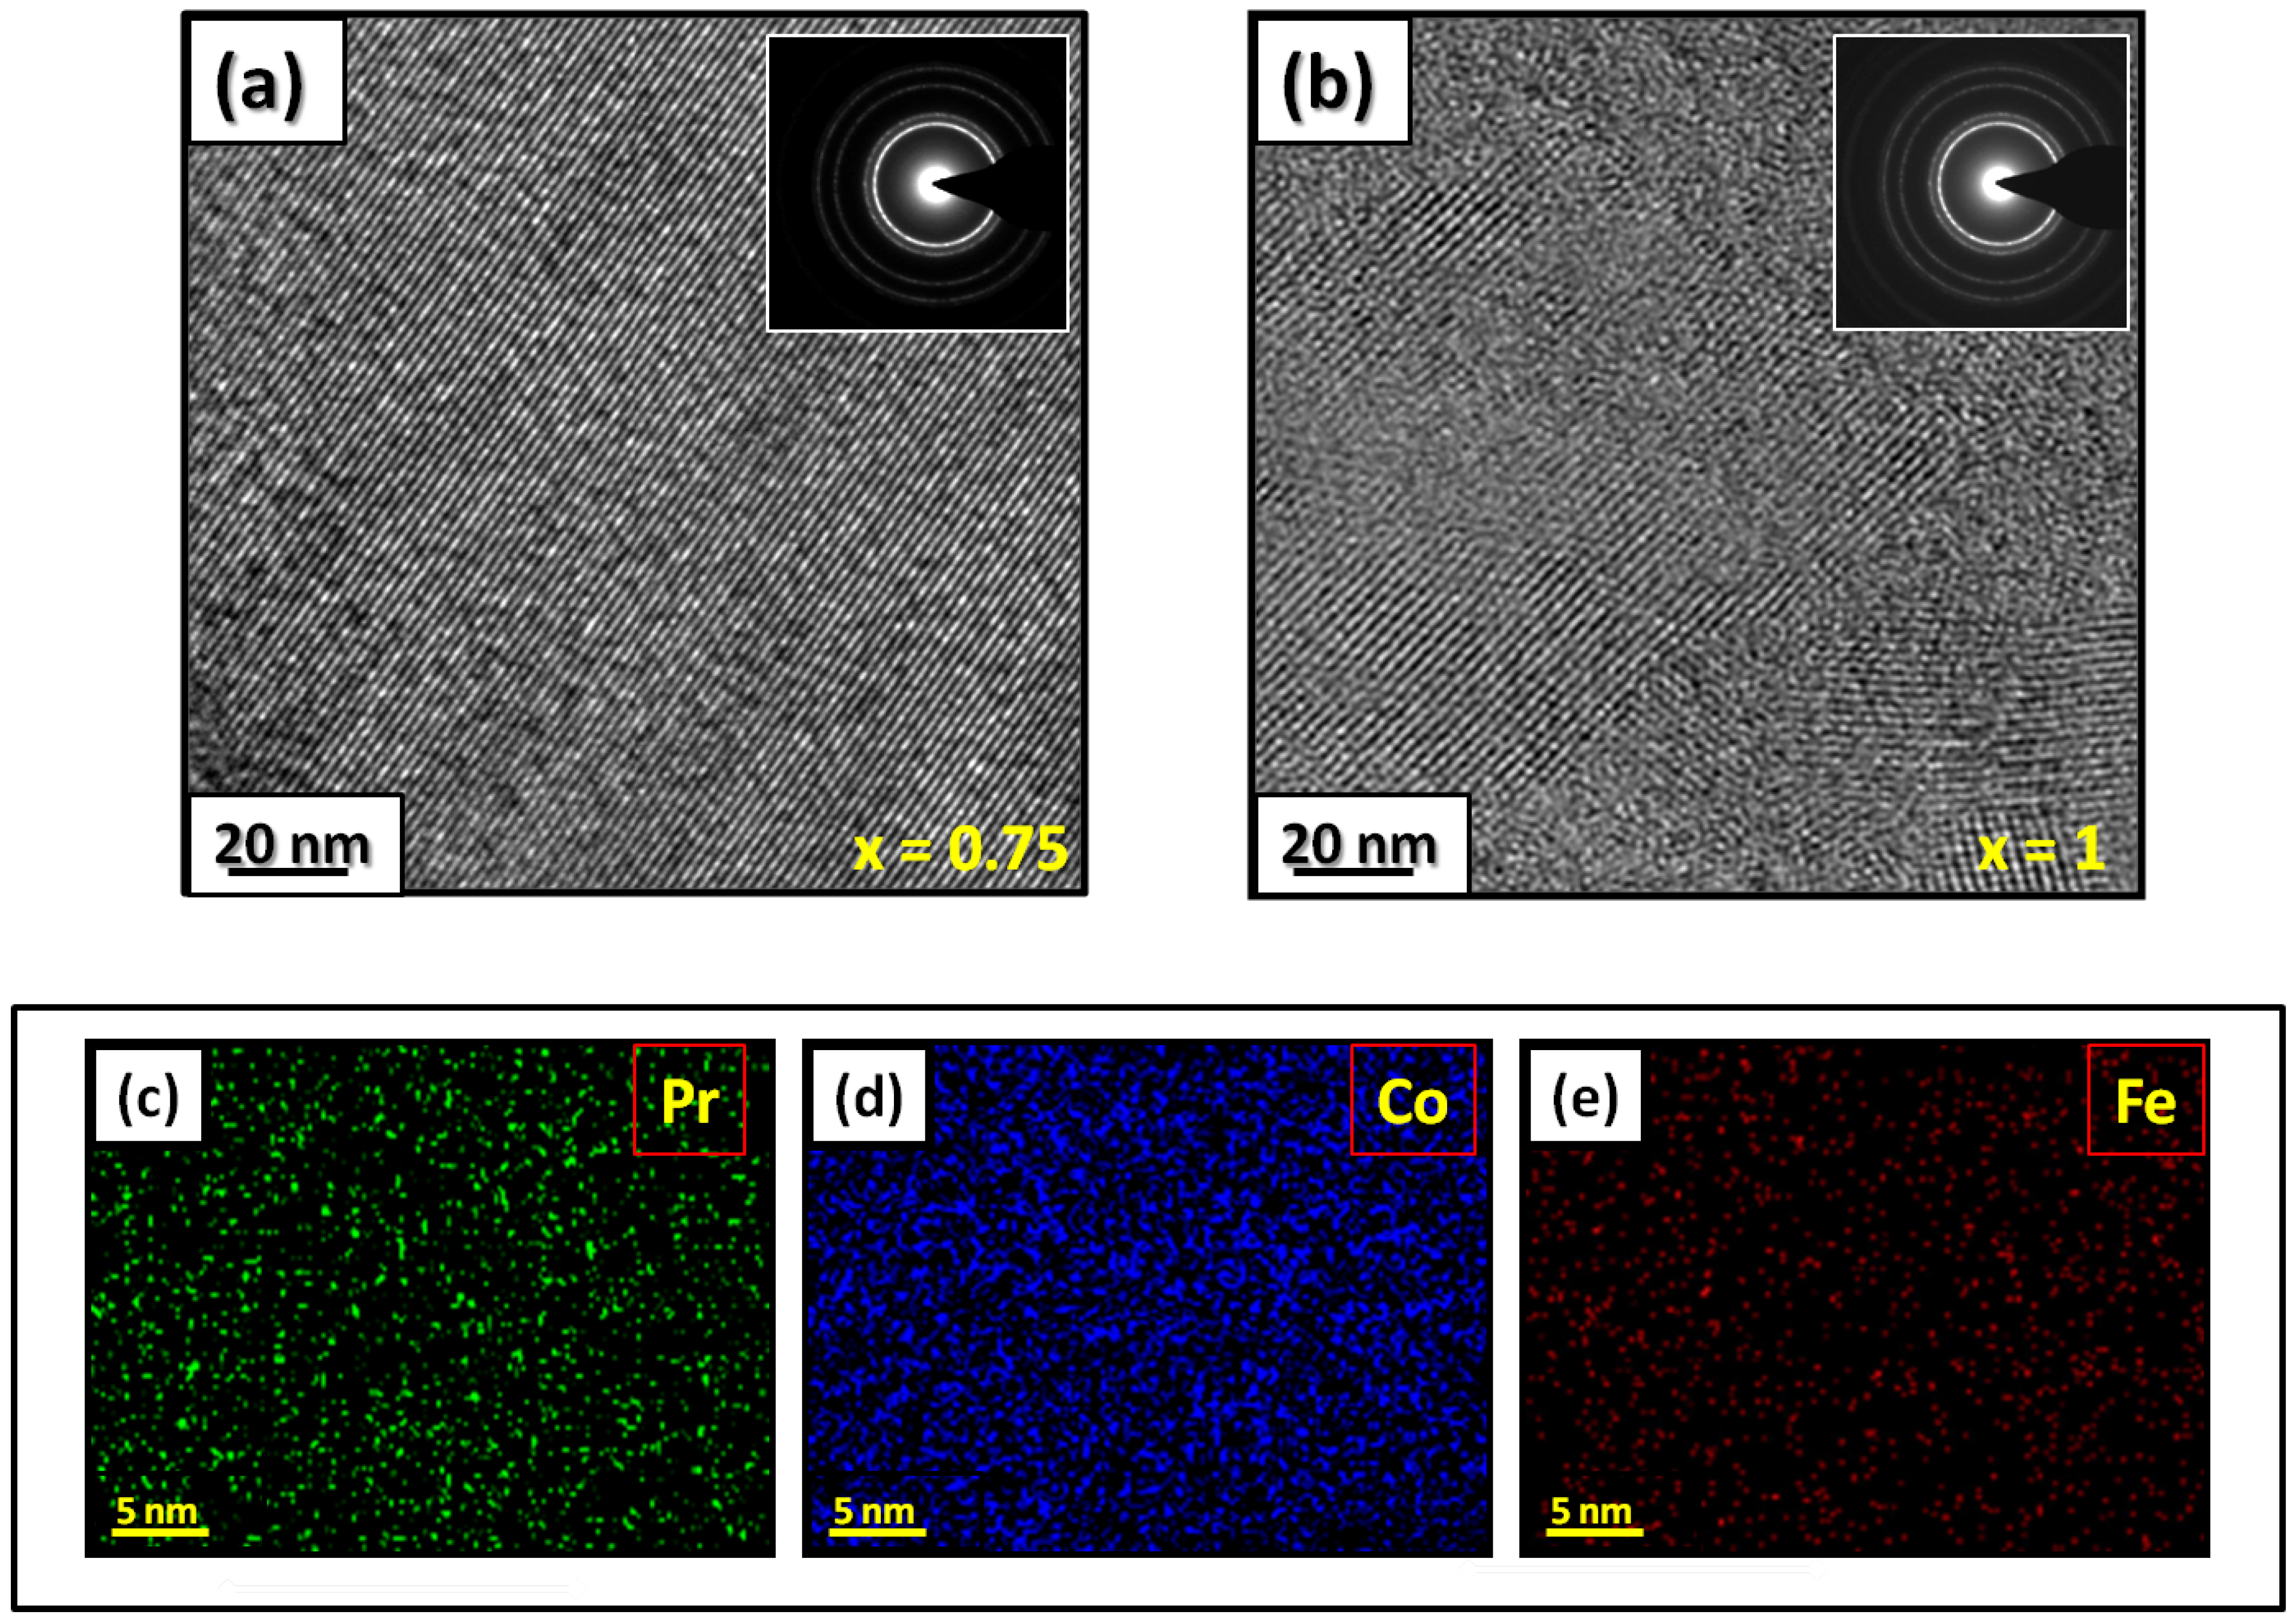
Figure 1 presents bright-field micrographs of the PrCoFe (Figure 1a) compound. By performing statistical calculations on the grain size, the grain size distributions are shown in Figure 1b. The grain size was estimated to be 90 nm. The values found are in good agreement with the average grain sizes found using Scherrer’s expression. The HRTEM images shown in Figure 2a,b reveal the fully crystallized structure of the PrCoFe and PrCoFe compounds. The composition distribution was investigated by STEM–EDX mapping (Figure 2c–e. The stoichiometric proportions of PrCoFe were maintained. The Pr, Co, and Fe compositions ranged from 20.8 to 23.5%, 78.9 to 75.5%, and 1.4 to 2.6%, respectively. The diffraction spots were distributed over the rings corresponding to the d(0.795 nm), d(0.635 nm), d(0.508 nm), d(0.458 nm), d(0.291 nm), d (0.258 nm), and d(0.158 nm) distances for the (2:7 H) structure [69].
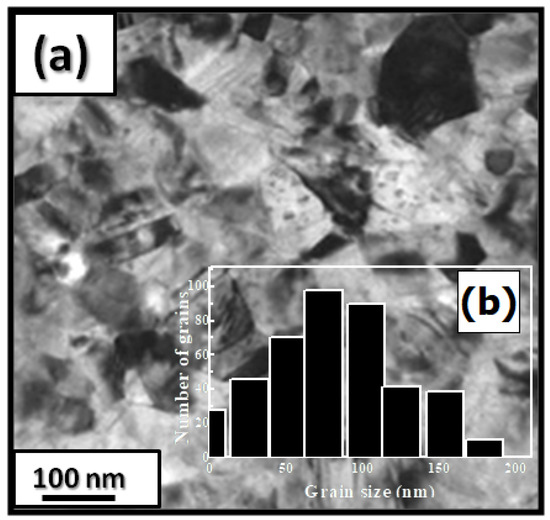
Figure 1.
Bright-field micrography of the PrCoFe compound (a). The grain size distribution is shown in the inset (b).
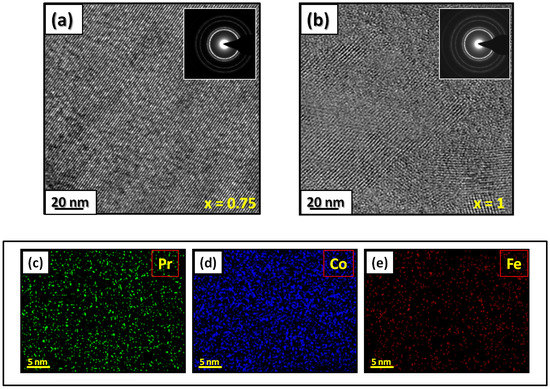
Figure 2.
HRTEM images (the selected area of electron diffraction is shown in the inset): (a) PrCoFe and (b) PrCoFe compounds annealed at 1023 K. Elemental mapping of PrCoFe: (c) Pr, (d) Co and (e) Fe.
4.3. Structural Analysis of Nanocrystalline PrCoFe Compounds with EXAFS
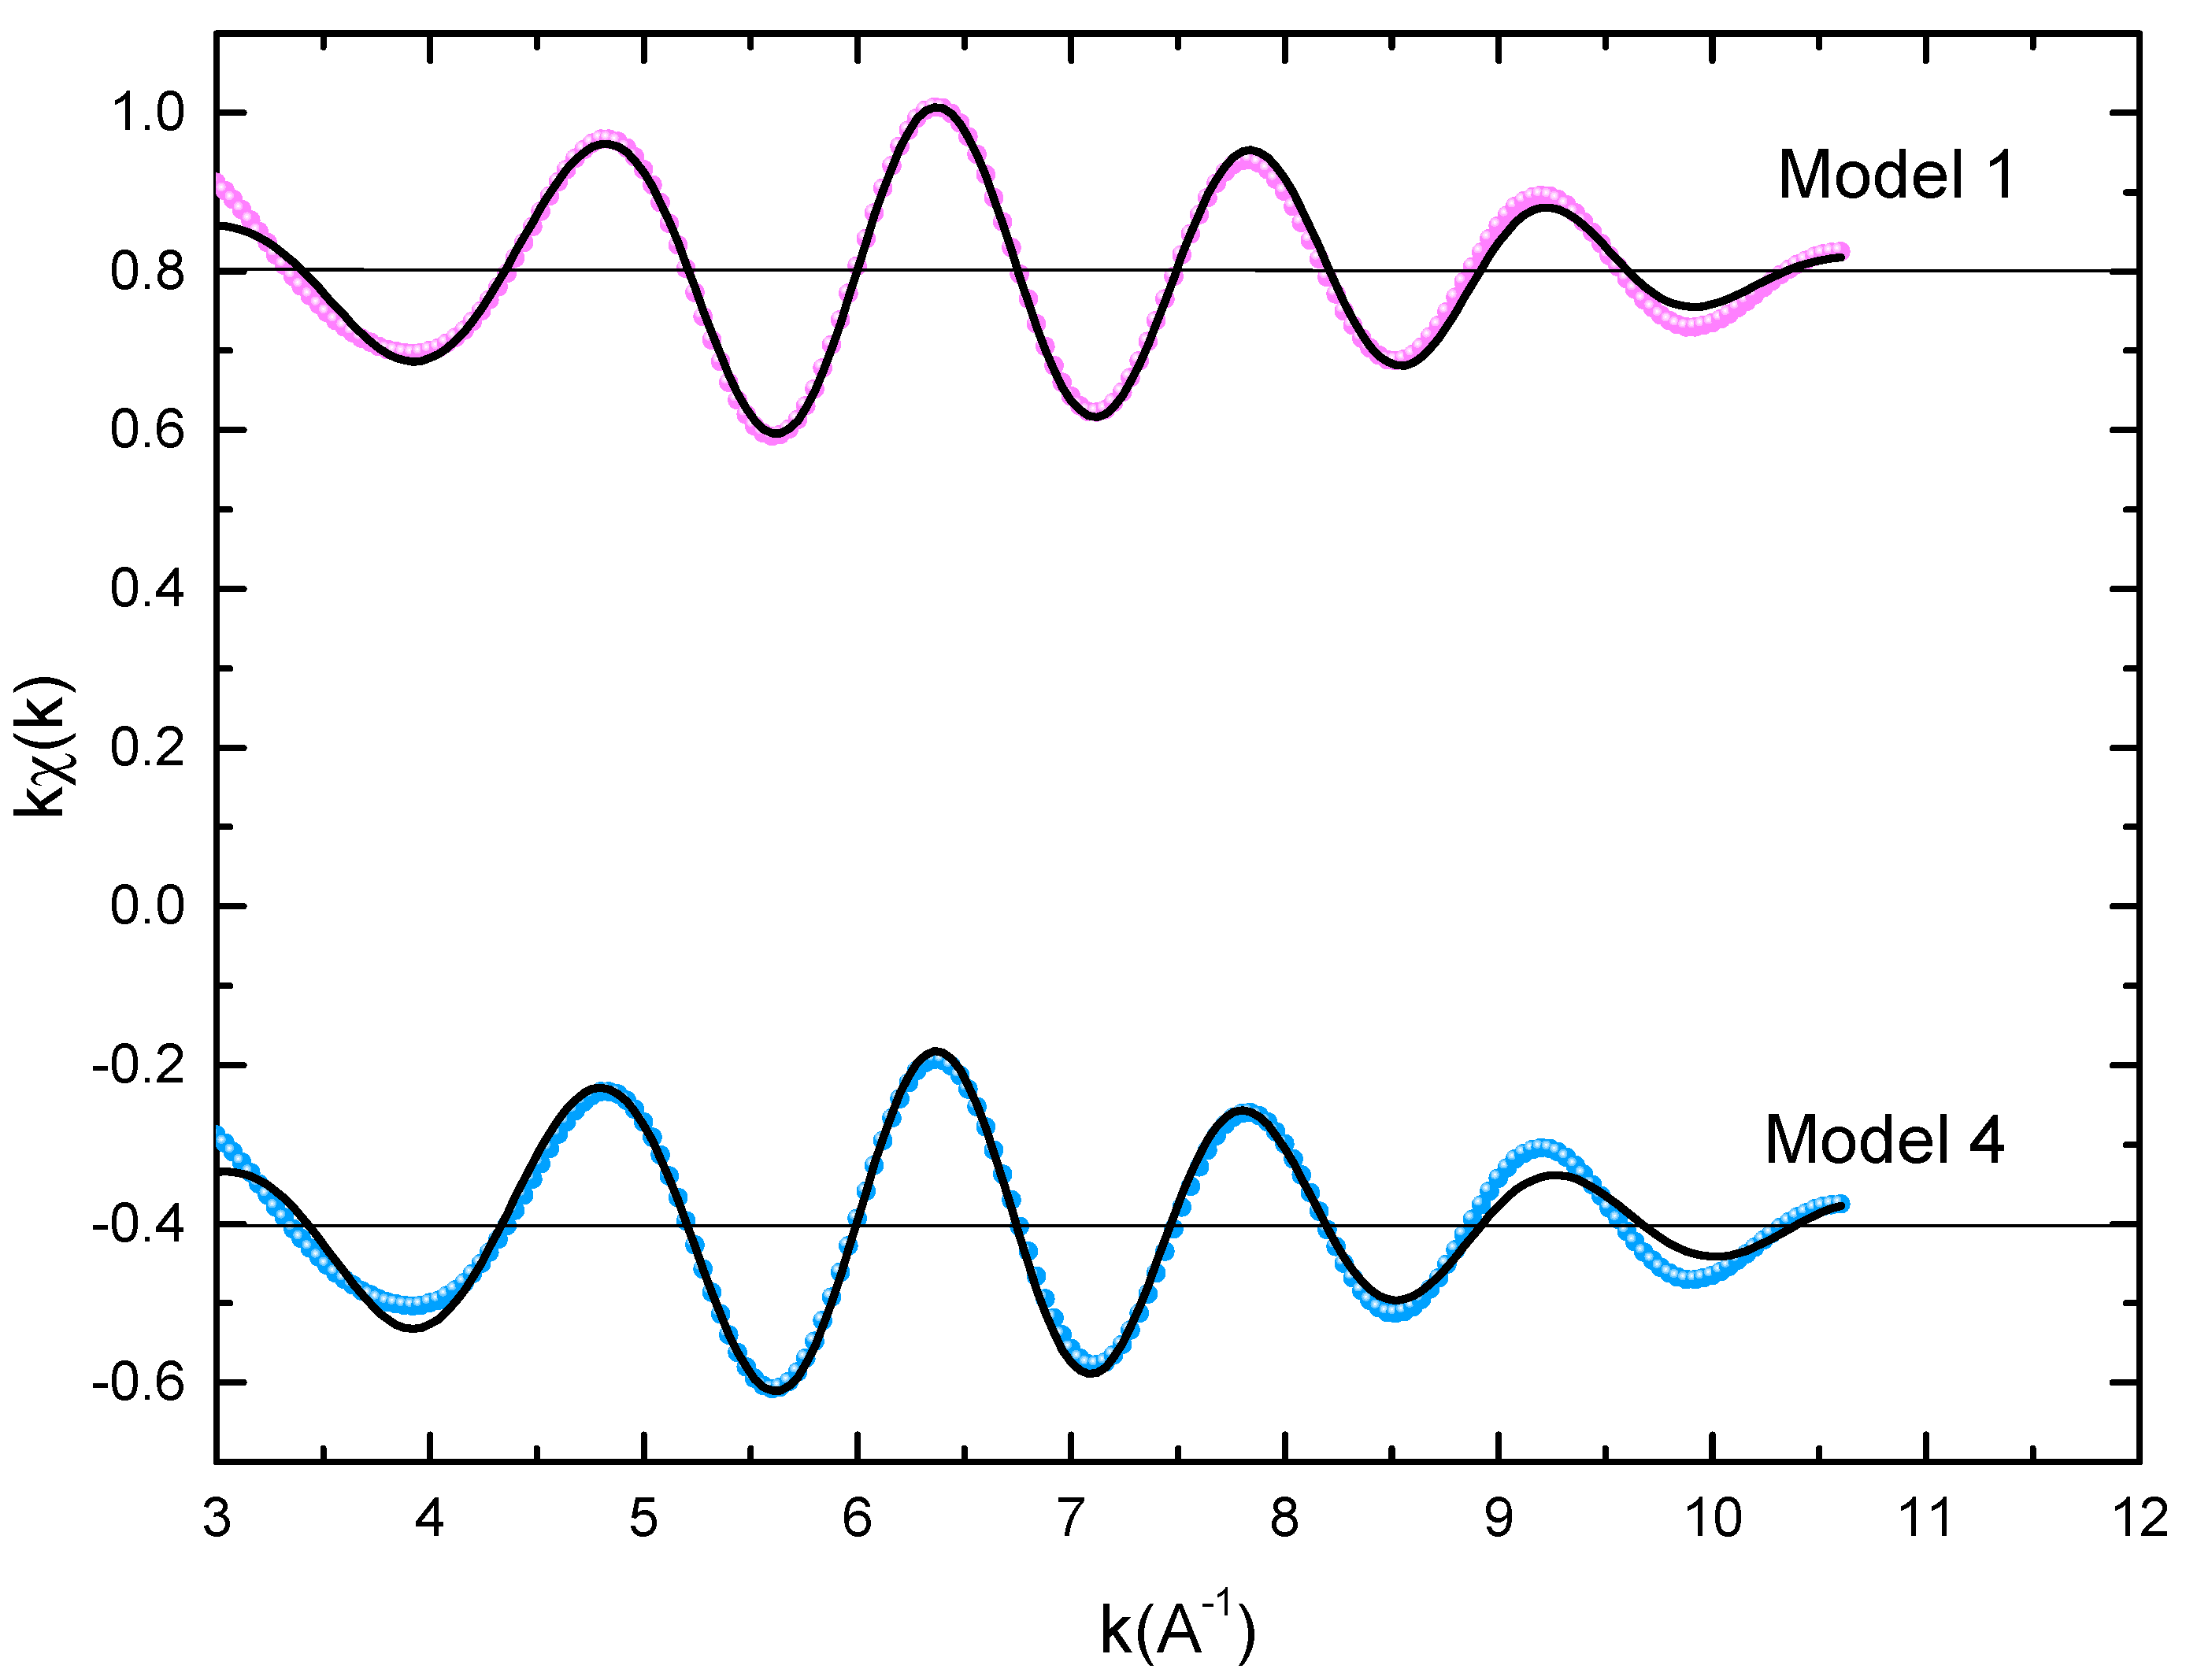
Figure 3 displays the extended X-ray absorption fine structure (EXAFS) found for the PrCoFe compounds (x = 0.5, 0.75, and 1). The Fe–K edge is near 7120 eV, with a maximum absorbance located at 7126 eV. The apparent features of the three spectra are similar, revealing that the local structure around the Fe atoms does not change significantly with Fe content. The Fourier transforms (FTs) of the EXAFS data (Figure 3) were calculated between k= 2 Å and k = 10.5 Å in order to to avoid disturbance and noise. The resolution is /(2k) = 0.18 Å. The main FT peak observed between 1.3 and 3.4 Å is due to the second atom shell (Pr and Fe) at ≈3.0 Å and the single Fe–Co scattering at ≈2.50 Å.
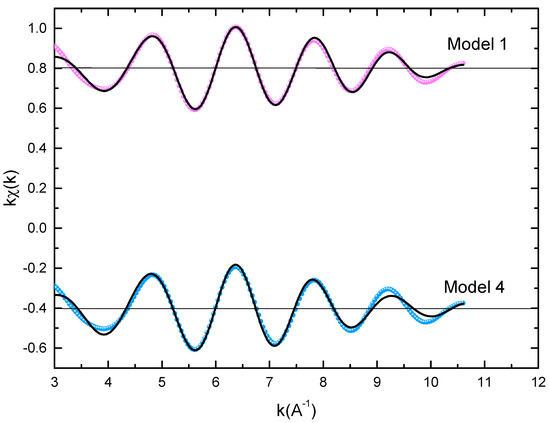
Figure 3.
Experimental EXAFS spectra in k space of the imaginary part of the Fourier transforms of the PrCoFe compound, adjusted using Models 1 and 4. Black and red lines show the experimental signal and theoretical curves, respectively.
Quantitative EXAFS modeling of the local Fe structure in Pr(Co,Fe) was initiated with a comprehensive analysis of the five Co sites in PrCo obtained in our previous paper [71]. The first interatomic distances around the central Co/Fe atom are listed in Table 2. The five Co sites were significantly different enough to suggest that a noticeable difference in the corresponding EXAFS spectra was expected; the 4f and 4e sites were almost identical, with a first shell of 6 Co at an average distance of 2.50 Å and a mixture of 3 Co and 3 Pr at the same distance of around 2.95 Å in the second shell. Site 2a was similar for the first shell of Co at 2.54 Å and a second shell composed of 6 Pr at 2.96 Å. In site 6h, the two first shells contained, respectively, 8 Co around 2.5 Å and 4 Pr at 3.17Å. All four sites were strongly isotropic, and the radial distributions of the first and second distances were rather close. On the other hand, the 12k site was anisotropic with 7 Co first neighbors and a wide radial distribution of Pr second neighbors (3 Pr at 2.91 Å and 2 Pr at 3.29 Å). The five theoretical EXAFS spectra corresponding to the five Fe substitution sites described above were compared to the experimental data. On the qualitative side, we found a better similarity between the model and the experimental results than for the other sites.

Table 2.
The interatomic distance (R) and coordination number (N) found with the FEFF6 software package for different possible positions of Fe for the PrCoFe compound.
To get quantitative results, the adjustment of K-Fe EXAFS spectra was performed using four models that simulated the local structure in the five sites (model 1, model 2, model 3, and model 4 for , , or , and , respectively), which described all of the assumptions of the Fe site according to the results in Table 3. For each shell, we could fit three parameters: the Debye–Waller factor (), the coordination number (N), which represents the radial distribution function width, and the central atom–neighbor distance (R). We could also make a shift of the energy origin E, but we noticed that this parameter could be fixed in all of our adjustments. To prevent divergence due to the parameters’ correlations [74], we minimized the number of fitted parameters. Therefore, the coordination numbers were fixed for all shells to the values obtained in the crystal structure, and the only amplitude parameters were the Debye–Waller factors. The EXAFS adjustment results are given in Table 3. The Debye–Waller factors increased as a function of x, consistently with the slight decrease in the main peak of the FT amplitude. This was reflective of an increase in structural disorder with substitution disorder. Regarding the neighbor Fe–central atom distances, the Fe-Co distances and the first Fe-Pr distance increased slightly, while the second Fe-Pr distance decreased. As predicted, this Co-Fe substitution effect was mainly due to the increase in Fe-Co bonds with respect to Co-Co bonds.

Table 3.
EXAFS adjustment parameters for PrCoFe (x = 0.5, 0.75, and 1): interatomic distances (R), quality factor (QF), and Debye–Waller factor ().
For all PrCoFe compounds, the model in which Fe atoms occupy the site provides a good adjustment with a QF that is three times smaller than for the other three models. Obviously, the adjustments of the first shell when treating the first Fe-Co contribution at 2.5 Å are similar, and their quality is comparable for the four models. The difference lies in the second shell and is mainly related to the contributions of the unbound Fe-Pr and the second Fe-Co between 2.9 and 3.2 Å. To illustrate the difference between the good adjustment of Model 1 and the other three models, we also show a zoom of their Fourier transforms between 2.3 and 3.5 Å. The improvement in the adjustment of Model 1 over Models 2–4 is depicted quantitatively in the Table 4, in which we determined residuals and quality factors in R space for PrCoFe for the four models, i.e., in the domain of the full Fourier transform () or in a restrained R space between 2.3 and 3.5 Å(QF). When the entire R domain is utilized, the model improvement of QF is comparable to the values found in k space (Table 3). The significant improvement in the quality factors in the restricted R domain is well established. The good adjustment parameters show that an Fe() atom is enclosed by an average of seven Co neighbors at 2.5 Å, three Pr neighbors at 3.0 Å, and two Pr neighbors at 3.2 Å. In addition, the Debye–Waller factors () of the Fe-Pr shell found with Model 2 and Model 3 are about 0.024 Å, which is physically oversized and unacceptable. The conclusion is that if we attempt to constrain the model to only a second Pr distance, as in all sites, but with , the radial distribution feature of the Pr fitted around Fe attempts to offset this bias with an un-physical value of the Debye–Waller factor. However, this compensation is not enough to reach a quality of adjustment that is comparable to the value obtained with the assumption of the site. Nevertheless, a substitution in a mixture of , , and sites cannot be fully excluded with only the EXAFS adjustment results. We think, however, that the preferential substitution is more probable for several reasons described in [69]. Note that the difference between the atomic radii of Co and Fe is only 0.05 Å. Thus, this is not subject to important influences, such as those found in metallic alloys, e.g., Cu-Al, where the observation of Vegard’s law in the long-range mean of the crystal structure versus x is significantly different from the locally expanded structure obtained with EXAFS [75]. On the other hand, in the PrCoFe described in this work, we could not find any significant differences between the local structures derived from XRD and EXAFS. Although the substitution disorder was introduced by the partial replacement of Co by Fe, the crystal structure identified through powder diffraction and Rietveld refinement was even verified for the actual crystal cell parameters and atomic positions around the Fe substituent. Nevertheless, XRD did not identify the exact location where the substitution took place, whereas this information was provided by the EXAFS study.

Table 4.
Quality factors in R space for the fits of PrCoFe.
4.4. Nanocrystalline PrCoC (x = 0–1) Compounds
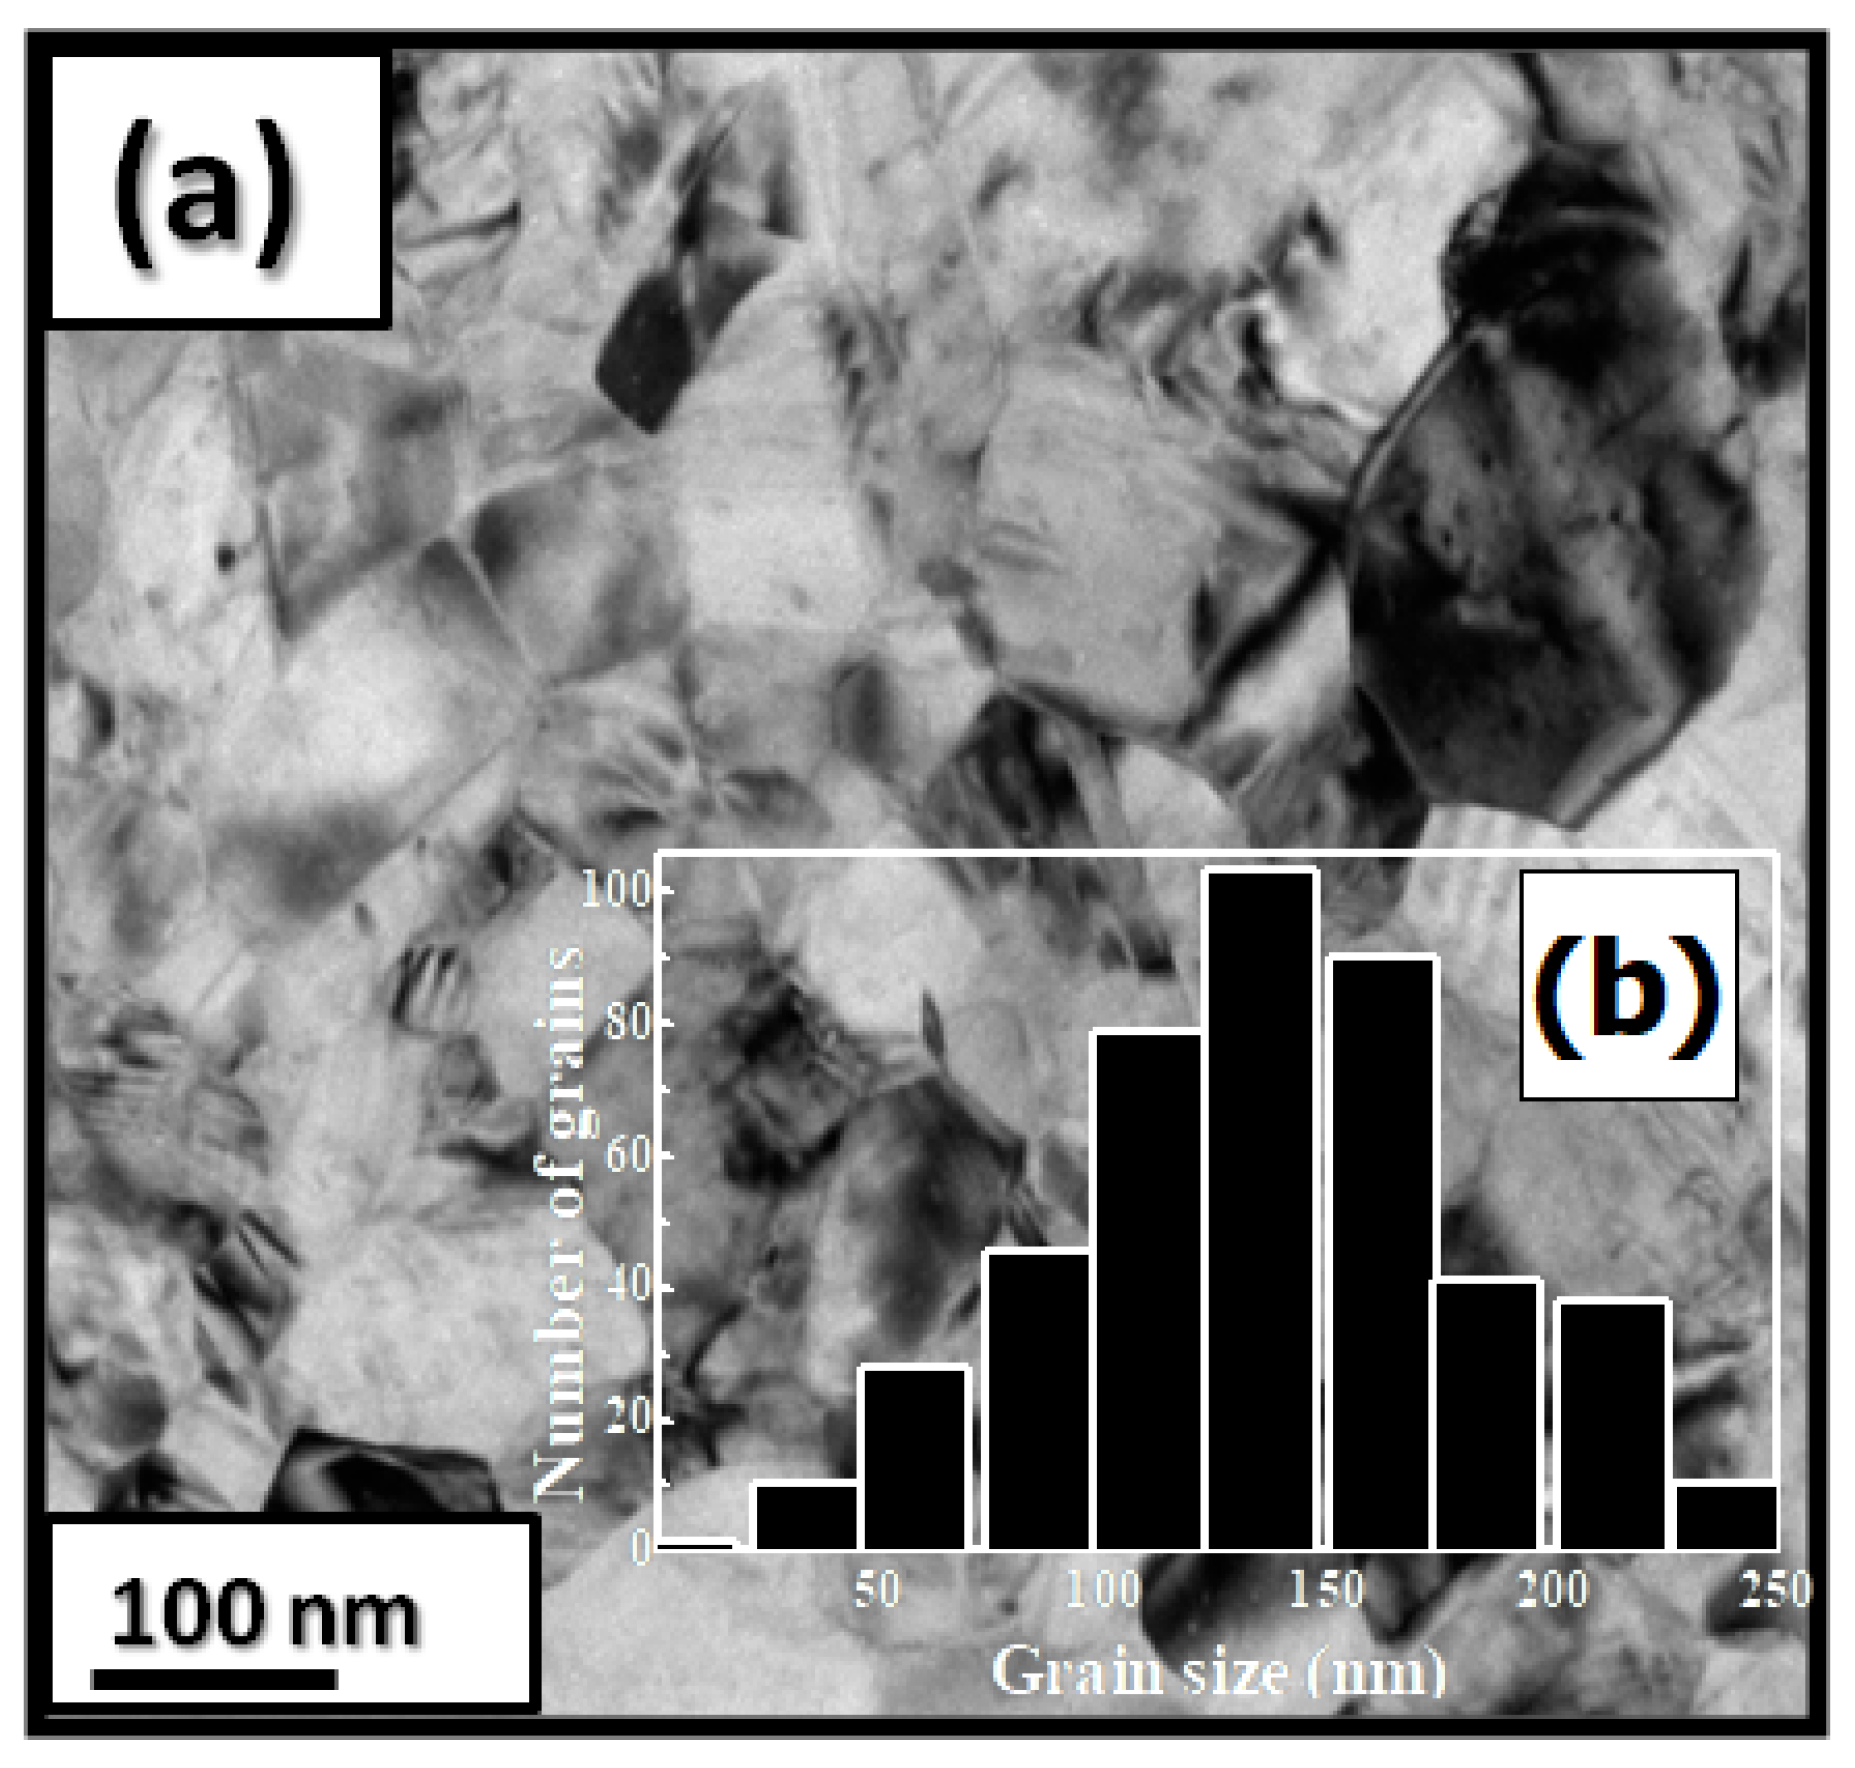
PrCoC compounds have a predominantly hexagonal CeNi structure with a P6/mmc space group. The a and c parameters and the unit cell volume V are increased during C insertion (a/a = 0.23%, c/c = 10.5% and V/V = 10%). The structural data from the Rietveld analysis are given in Table 5. Figure 4a shows a bright-field micrograph of the PrCoC compound. The average grain size is around 150 nm (Figure 4b). The HRTEM images of the nanocrystalline PrCoC and PrCoC indicate a fully crystallized structure. The compositions of Pr, Co, and C are around 23.2, 74.8, and 2 atomic percent (at.%), respectively.

Table 5.
Structural data obtained by the Rietveld analysis of PrCoC (x = 0.25, 0.50, 0.75, 1) compounds.
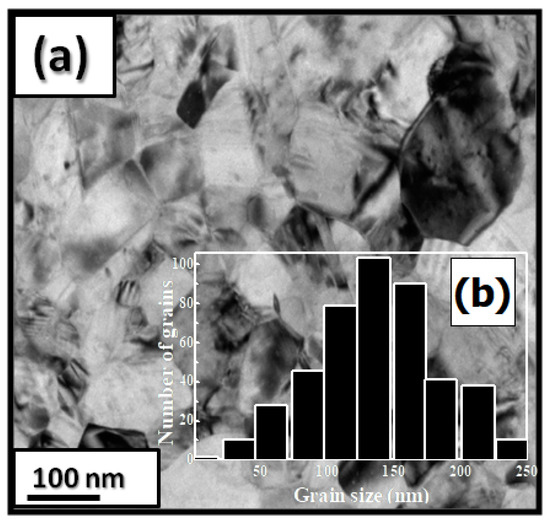
Figure 4.
Bright-field micrographs of PrCoC (a). The grain size distribution is shown in the inset (b).
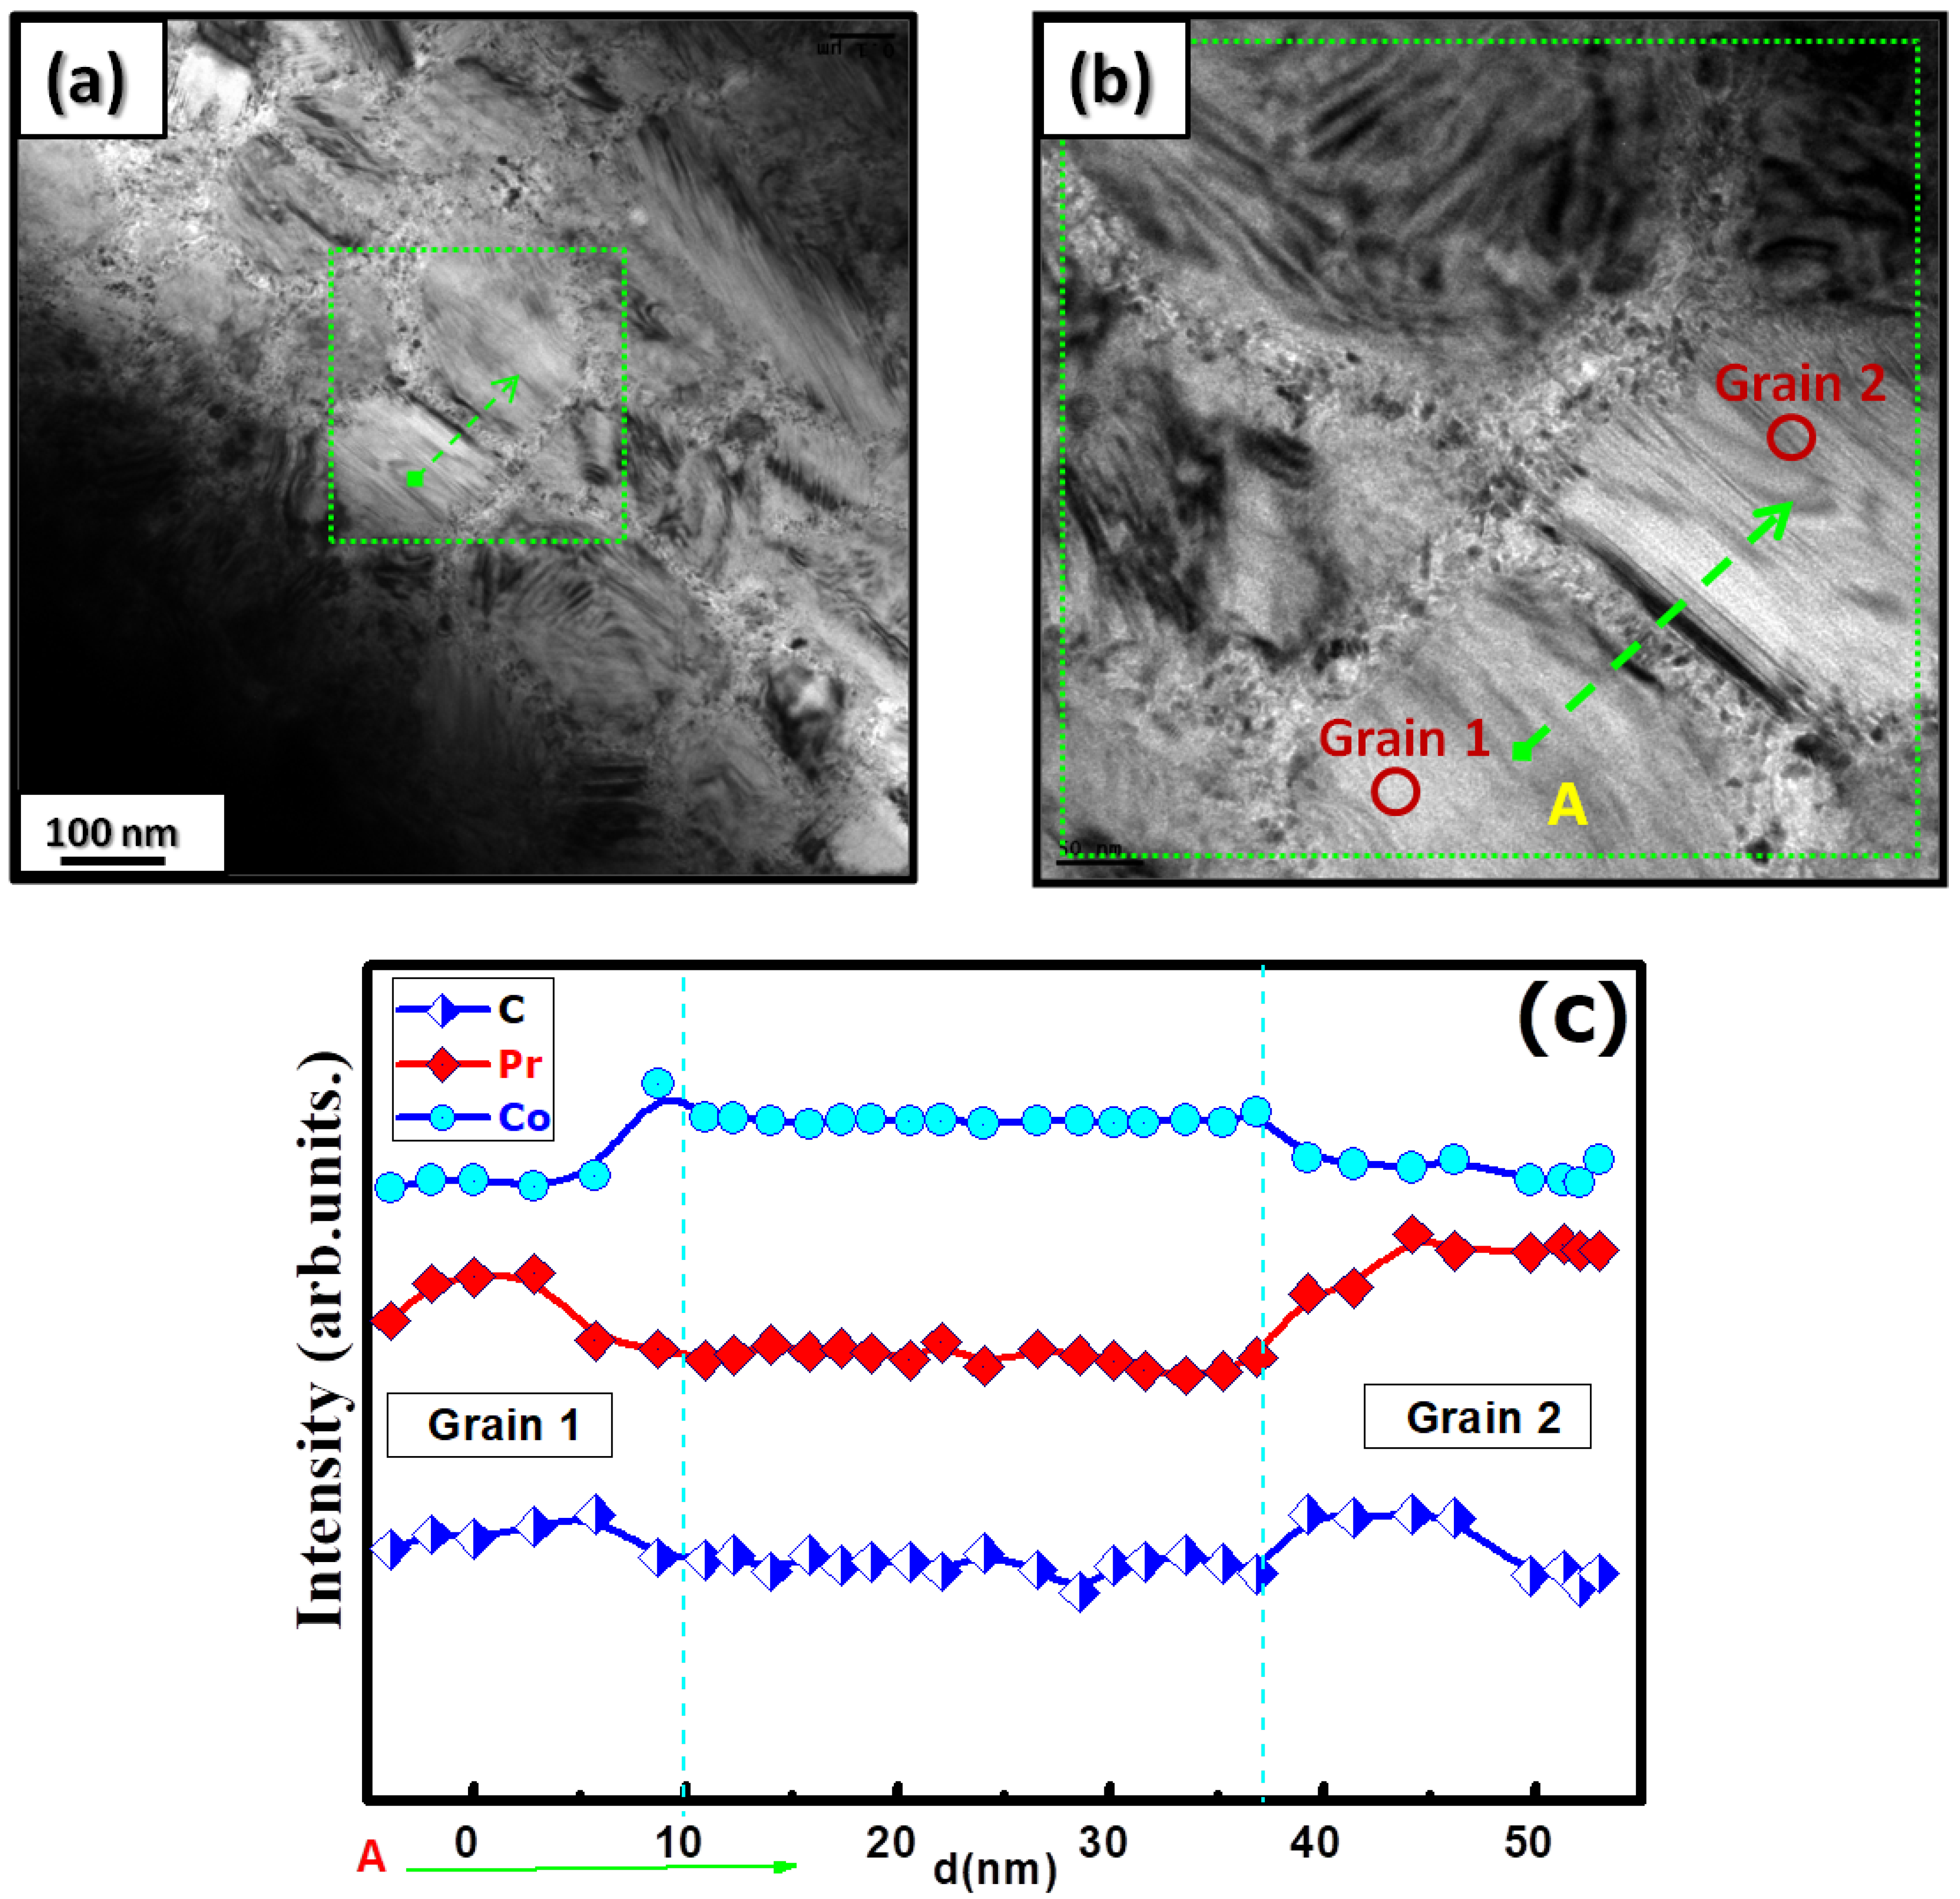
Figure 5a shows the grain morphology of the nanocrystalline PrCoC compound when analyzed with TEM. The nanocrystalline PrCoC compound is composed of larger grains of about 150 nm. By zooming in on the area between these grains (Figure 5b), a different phase consisting of very small grains of about 7–12 nm is found. The corresponding EDX analysis is presented in Figure 5c, which depicts the intensity distribution profiles of the Pr, Co, and C elements. The purple line corresponds to the profile of Co, and the red line corresponds to Pr. C is represented by a blue line. The slightly decreased intensity distribution profiles of Pr and C in the area between the grains indicate a more Co-rich phase.
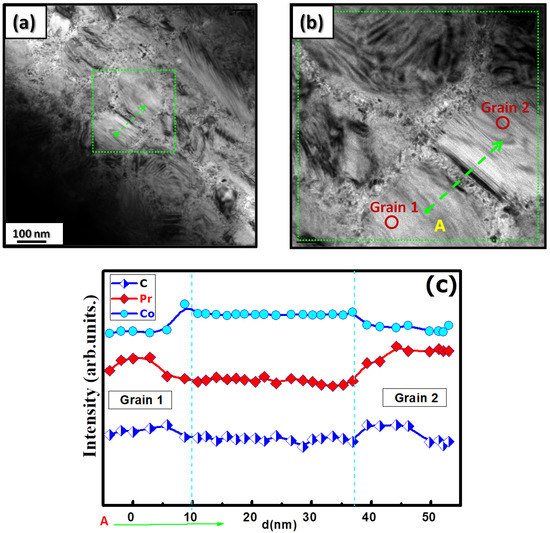
Figure 5.
(a) Bright-field TEM image of the nanocrystalline PrCoC compound. (b) High-resolution image of the area in between grains shown in the green square in (a). (c) The EDS line profile presented as a function of the distance d from point A.
4.5. Nanocrystalline PrCoH (x = 0–10.8) Compounds
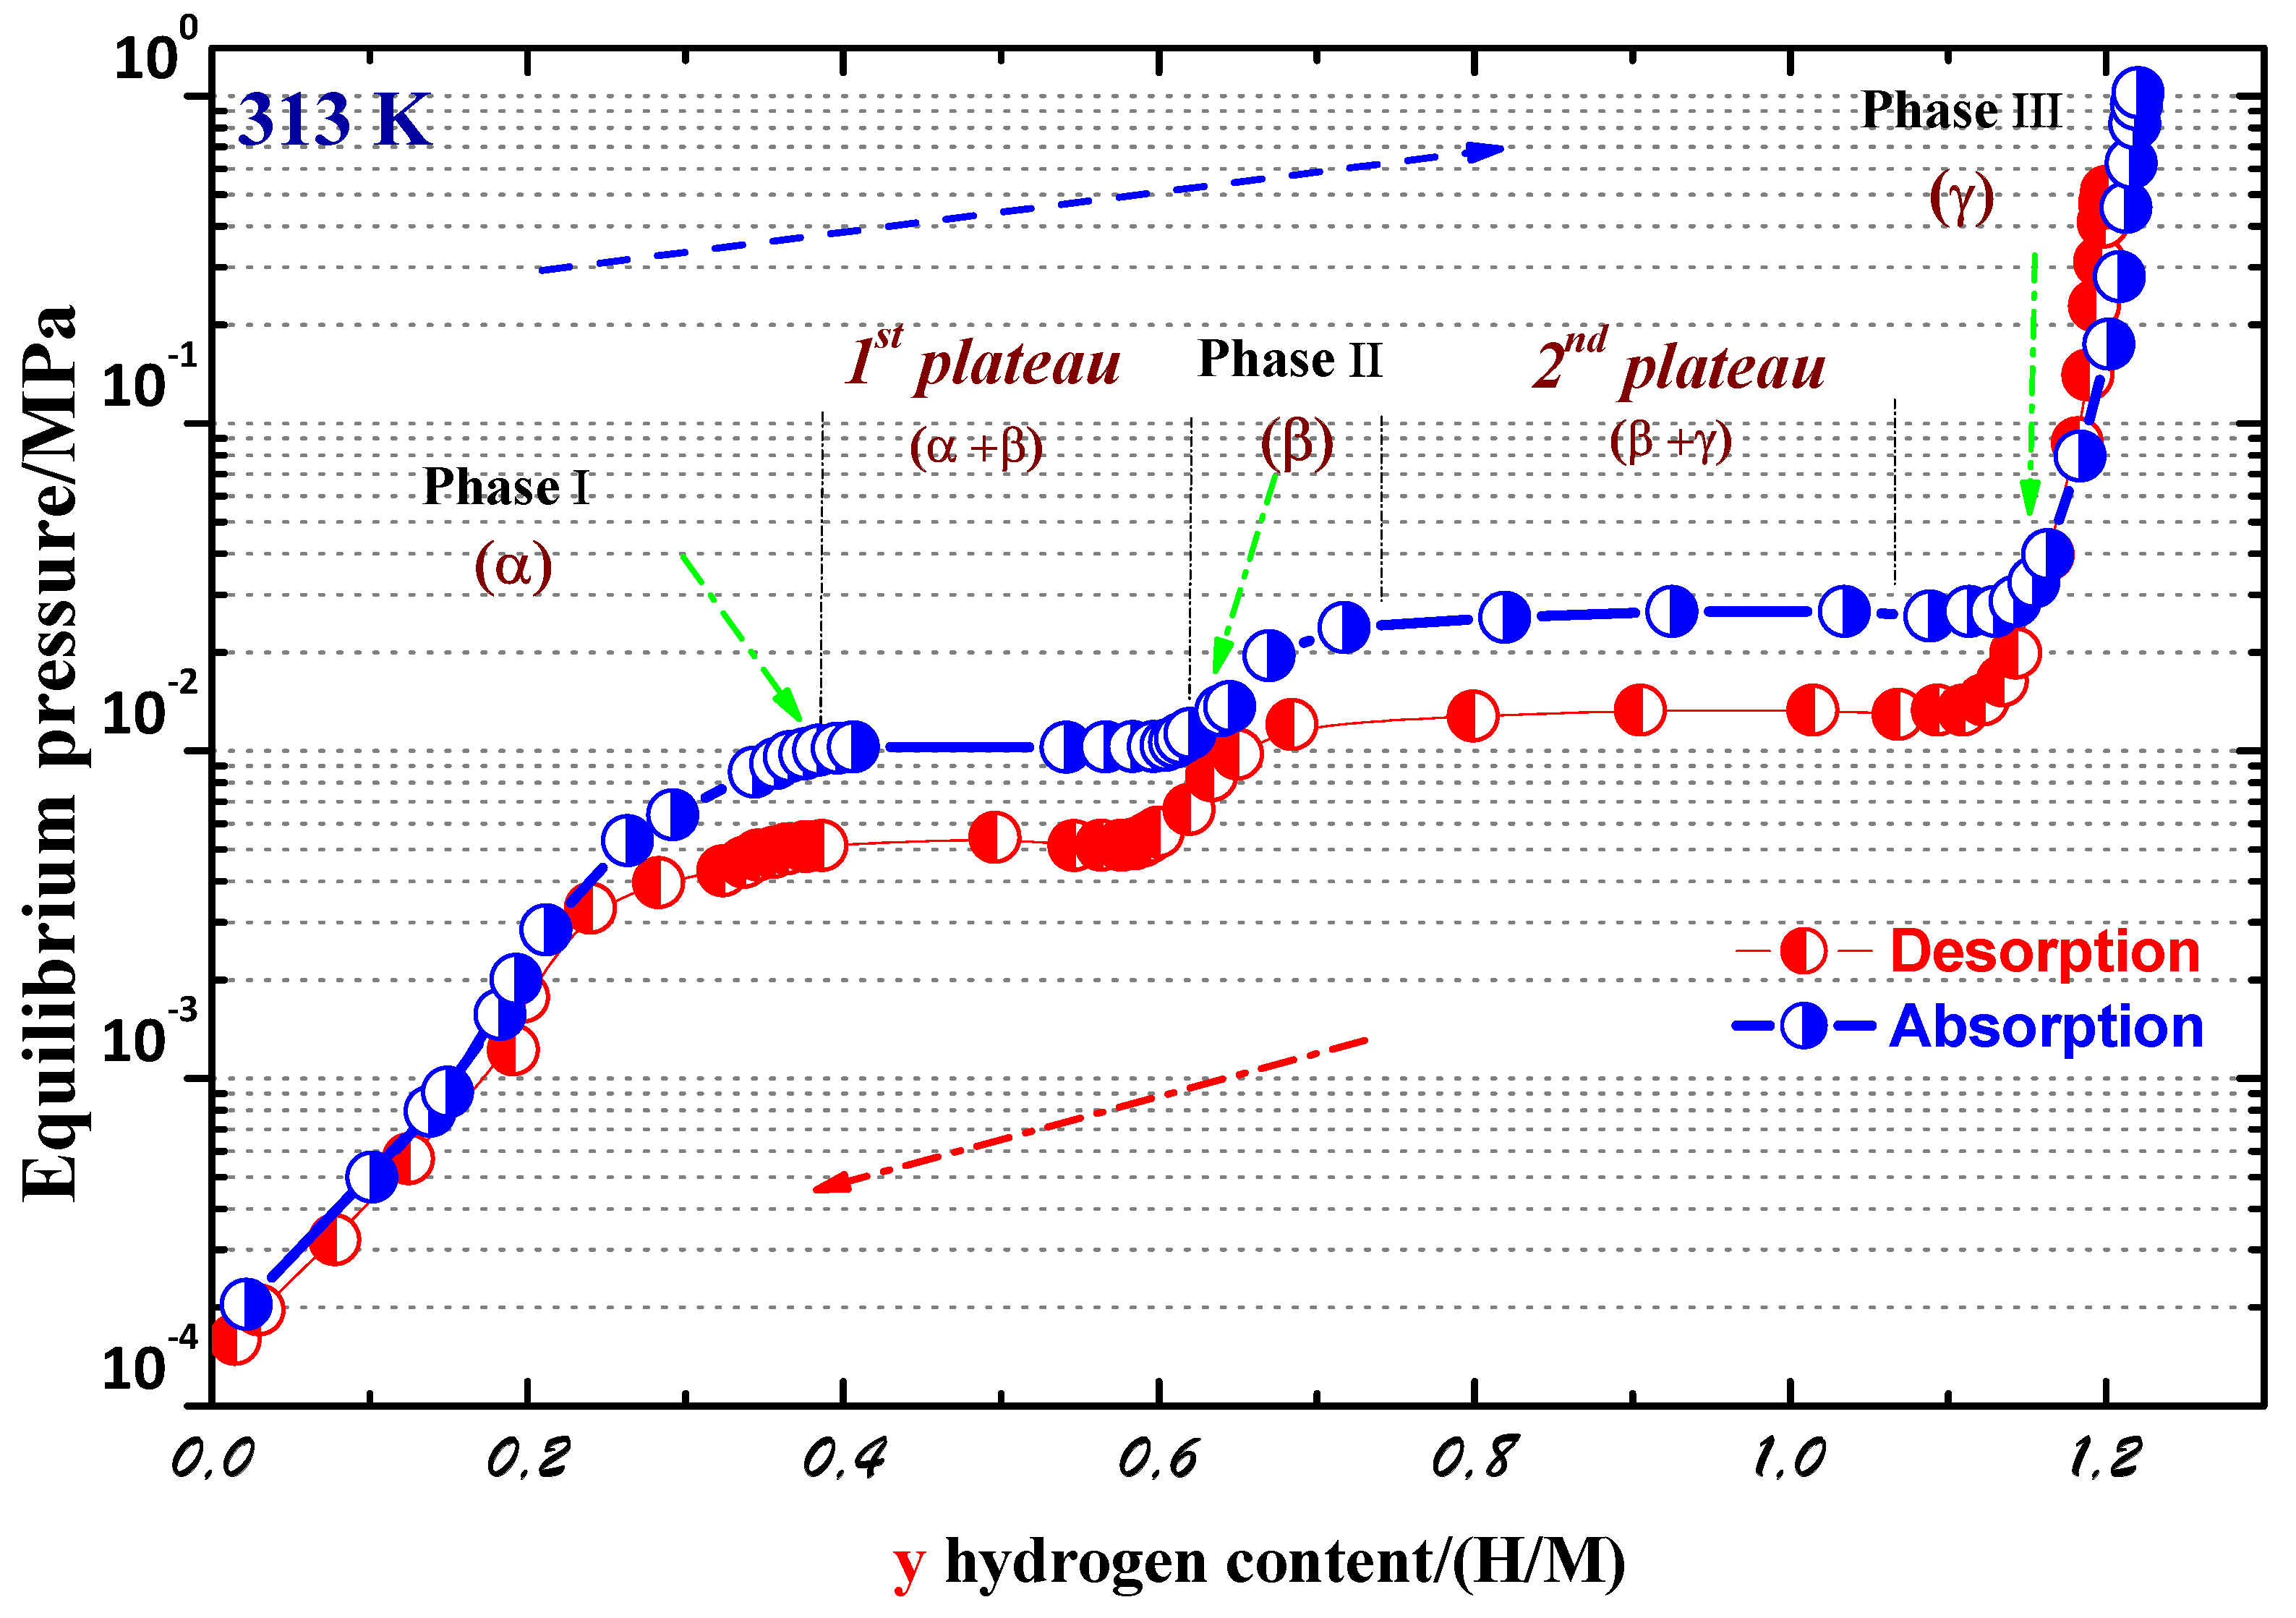
We investigated the hydrogen absorption–desorption properties of the PrCo compound along the P-C isotherm. The P-C isotherm curves at T = 313 K are displayed in Figure 6. Two plateaus were clearly seen. These results indicate the presence of three distinct crystallographic hydrides, which can be defined as follows: , , and . The phase is the solid solution phase based on PrCo (y ≤ 0.42), followed by the phase (0.61 < y ≤ 0.72), and is the phase with the highest H content (y ≤ 1.05). The 1st plateau pressures were around 0.012 × 10 Pa (absorption) and 0.005 × 10 Pa (desorption). The 2nd plateau pressures were at approximately 0.032 × 10 Pa (absorption) and 0.013 × 10 Pa (desorption). The maximum H storage content was y = 1.2 H/M in the 1st absorption, and about 60% of the maximum H content stayed after the 1st desorption.The y(H/M) content is the ratio of H atoms x(H/f.u) to all metal atoms (y = x/9). The crystal structure of the PrCo compound transformed from hexagonal ( space group, phase) to orthorhombic ( space group, phase) and monoclinic (C2/c space group, phase) phases during hydrogenation. These two phases were recognized as PrCoH and PrCoH. Their enthalpies, H, were estimated to be –48.8 and –49.9 kJ/mol.H, respectively, from the Van ’t Hoff plot. The hydrogenation mechanism can be described as follows:
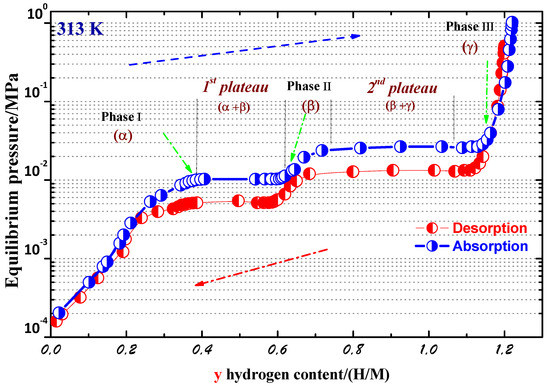
Figure 6.
P–C isotherm curves of the PrCo compound at 313 K.
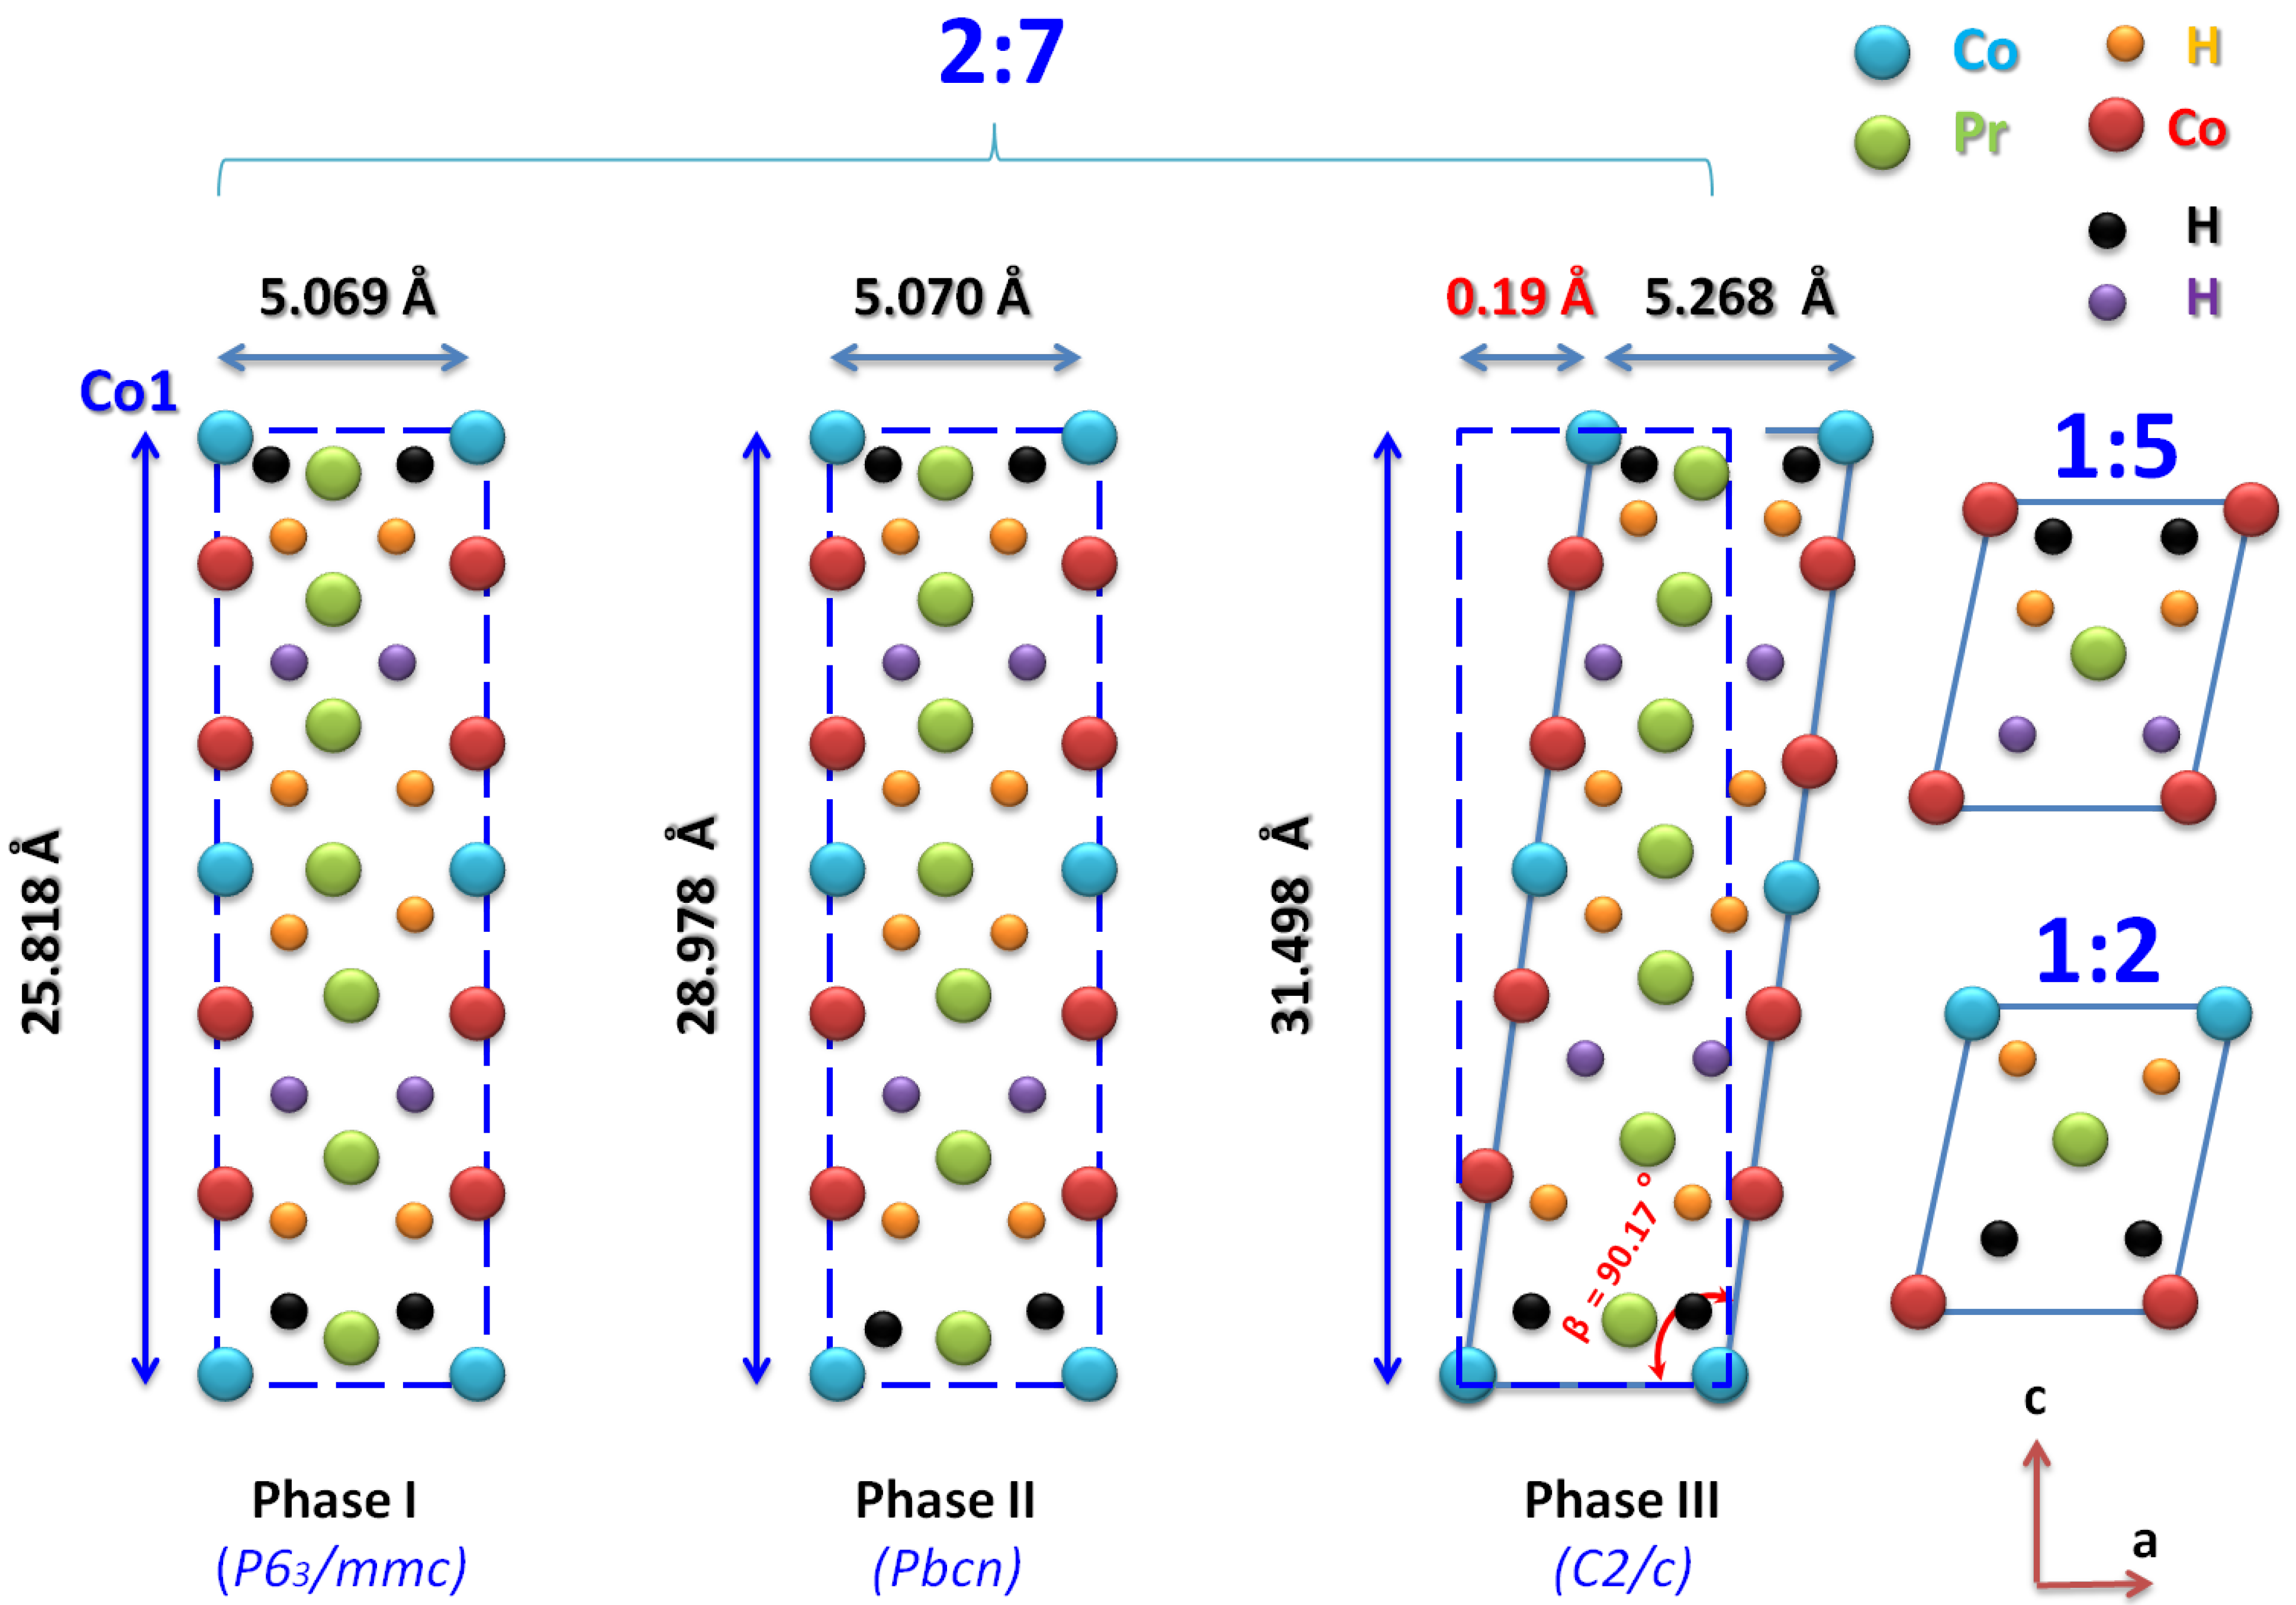
The structural parameters of PrCoH ( phase) and PrCoH ( phase) were, respectively, a = 5.070 Å, b = 8.153 Å, c = 28.978 Å and a = 5.268 Å, b = 7.103 Å, c = 31.498 Å, = 90.17. The average grain sizes were 170 and 185 nm for x = 6.1 and 10.8, respectively. As indicated in Figure 7, the deviation induced the displacement of the Co (2a) atoms on the (001) plane by as much 0.19 Å from the corresponding position in the orthorhombic structure due to the large lattice parameter c, which was more than 30 Å. The orthorhombic unit cell can be viewed in relation to a hexagonal cell, where the a, b, and c parameters of the two structures are related to each other as a = a, b = 2cos a ( = 30), and c = c. An orthorhombic model has the closest structure to that of the model [57,63,76].
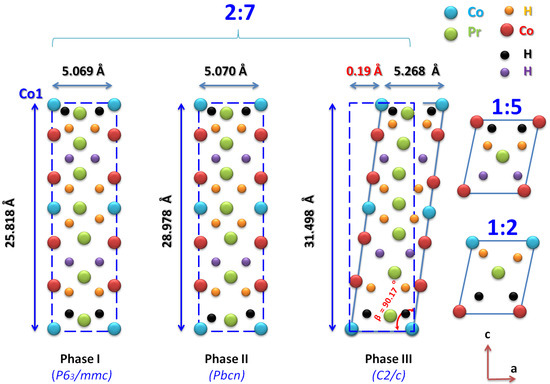
Figure 7.
Position of the Co atom in the orthorhombic () and monoclinic () structures projected in the ≺1 0 1≻ direction.
5. Intrinsic Magnetic Properties
5.1. Nanocrystalline PrCoFe (x = 0, 0.25, 0.5, 0.75, and 1) Compounds
To study the effects of Co substitution by Fe on the intrinsic magnetic properties of the alloy samples, the Curie temperature T for the nanocrystalline PrCoFe phase was measured for each Fe content x. The nanocrystalline PrCoFe compounds were ferromagnetic. The T value increased from 600 K for the nanocrystalline PrCo compound, attaining a maximum of 760 K at x = 0.5, and then decreased for x = 0.75 and x = 1. The T values were around 695 and 667 K, respectively. The T value was the result of two effects: the electronic effect related to the filling of the band of Fe atoms and the magnetovolume effect related to the Co-Co distances [71]. The M(H) curves of the nanocrystalline PrCoFe compounds were measured at 293 K. The determination of was performed using the law of approach to saturation [77]:
The M values were converted into the magnetic moment per formula unit . The increased linearly with increasing the Fe content x. The theoretical equation of as a function of x was defined by the formula: = + 7x (0 ≤ x ≤ 1), where is the saturation moment of the PrCo compound (in /f.u). The experimental data corresponded well to the theoretical forecast. The evolution of with x could be justified by the reduction in the average number of 3d electrons when replacing the Co atoms with Fe, which led to a progressive strengthening of the Co(3d)-Co(3d) exchange interactions and, thus, to an enhanced magnetic moment with the 3d [71]. We realized the XRD patterns of PrCoFe powders that were magnetically aligned at T = 293 K in a field of 0.5 T. For samples with x < 0.5, the (00l) reflections were heavily enhanced, indicating EMD along the c axis. For x > 0.5, the diagram shows a lower intensity of the (00l) peaks, while the reflections (h0l) are reinforced, implying that the EMD of the PrCoFe sample deviates from the c axis.
5.2. Nanocrystalline PrCoC (x = 0–1) Compounds
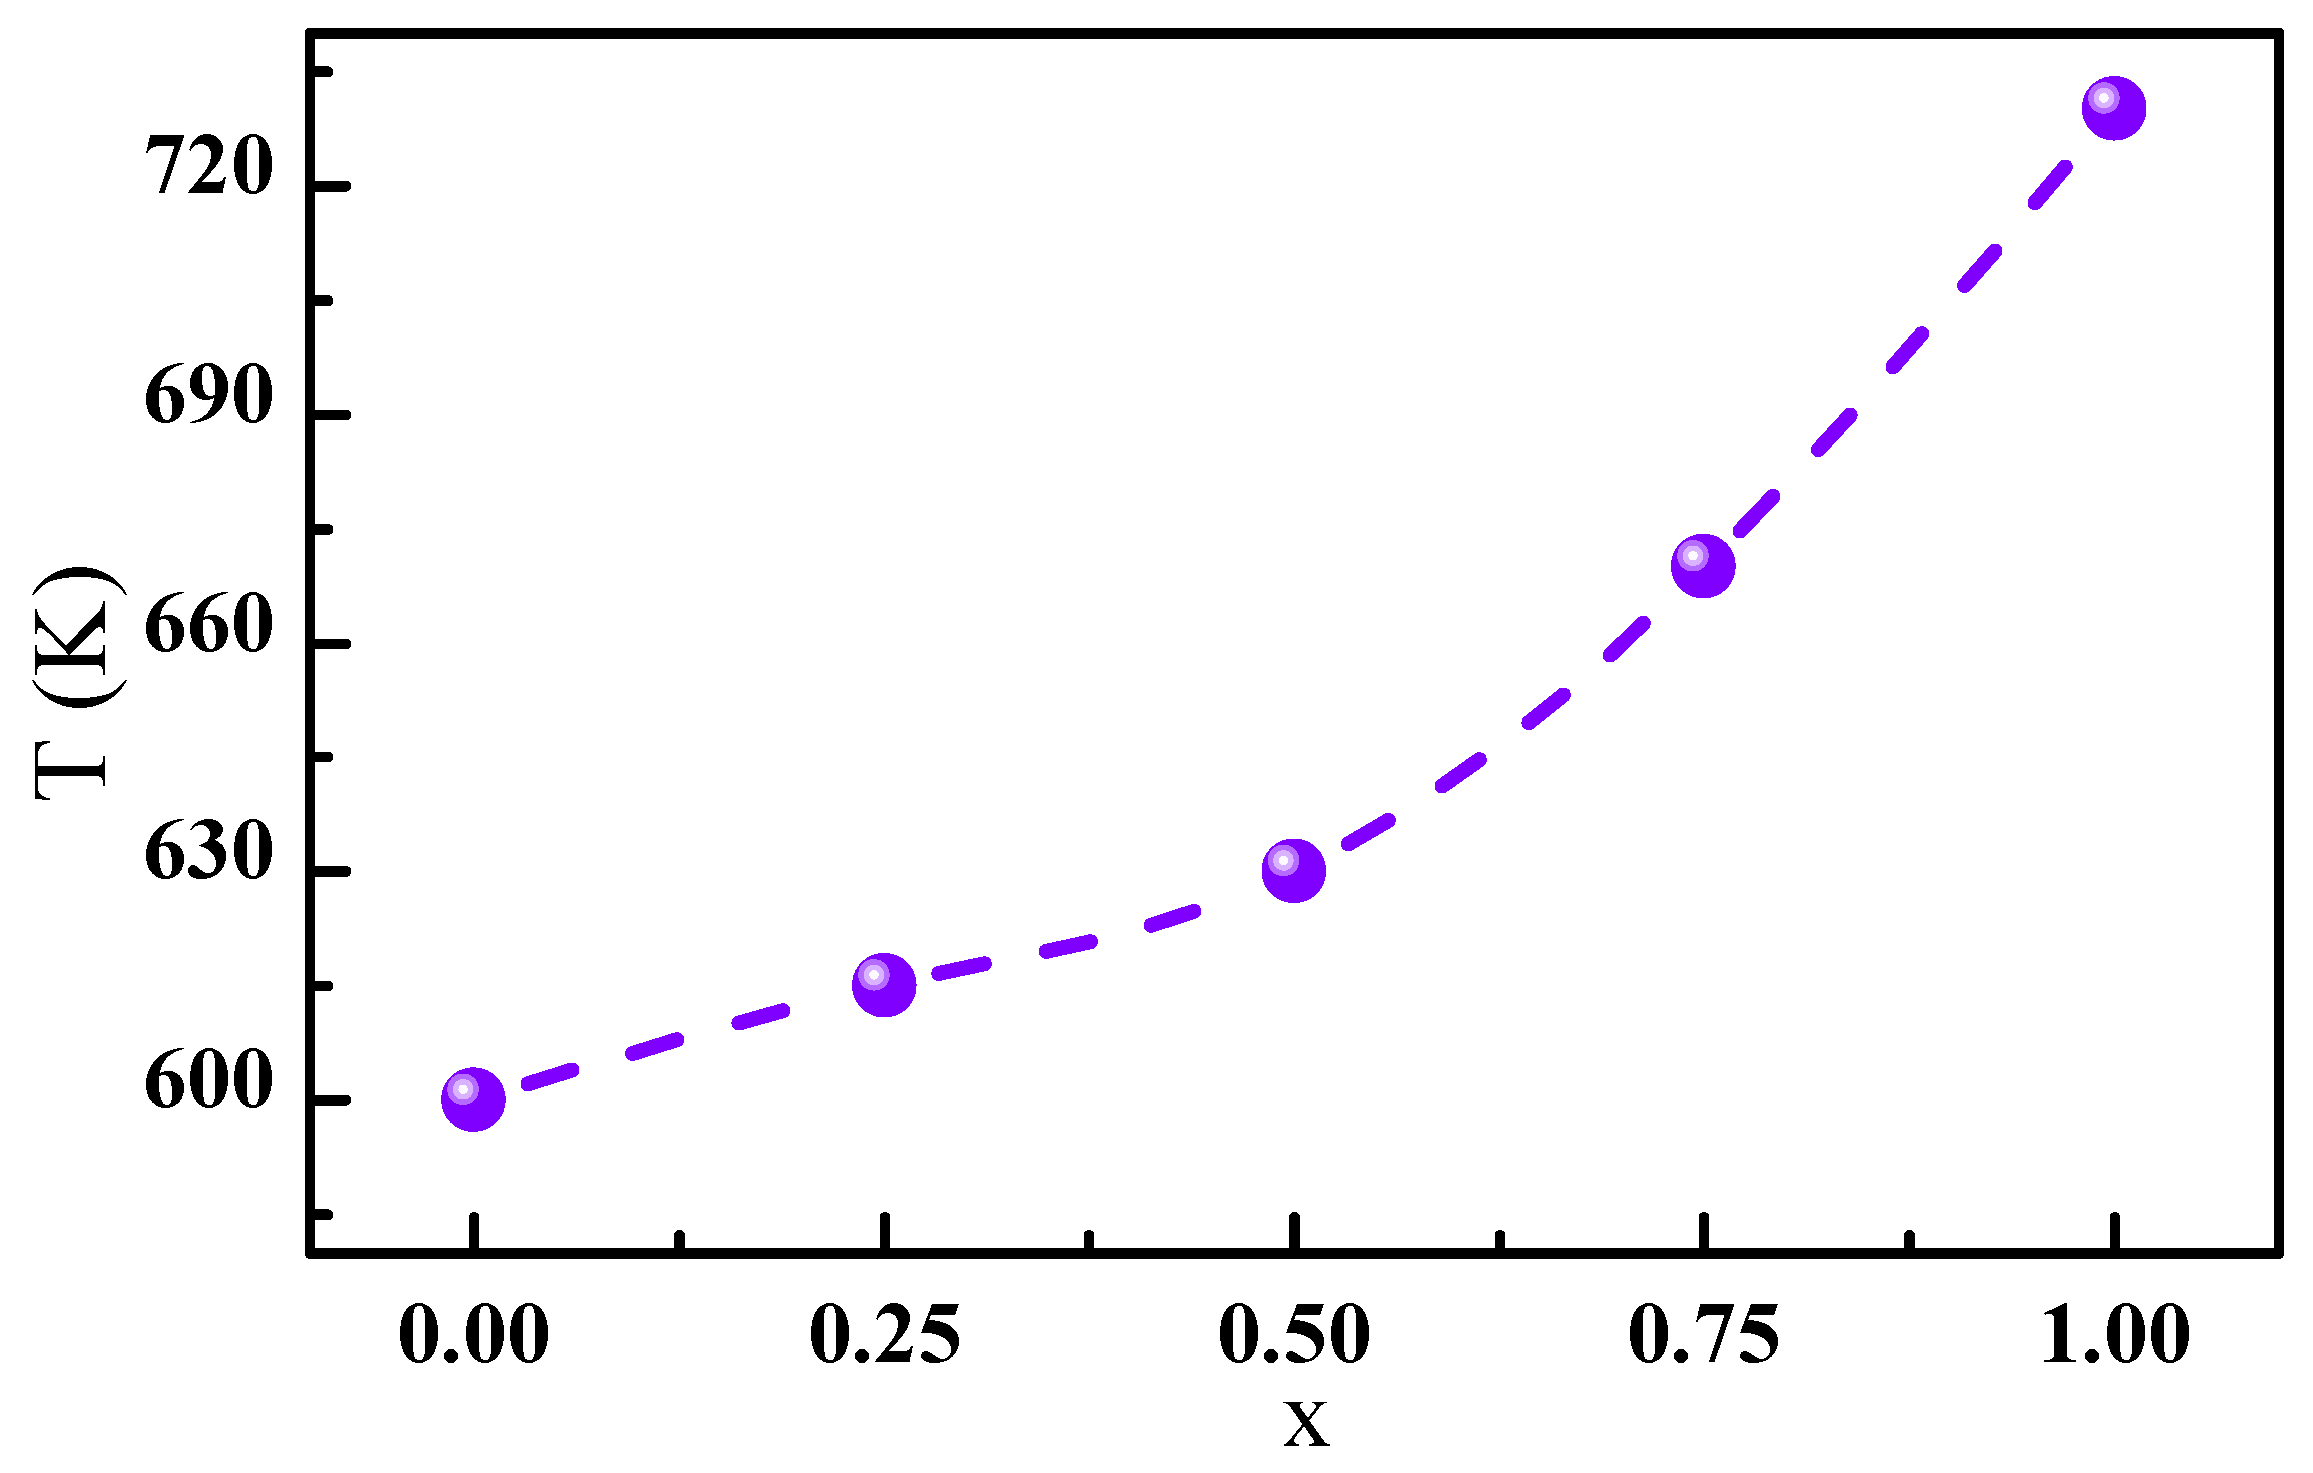
The Curie temperature T of the PrCo compounds was determined according to the Co-Co, Pr-Co, and Pr-Pr interactions. In general, the Co-Co interaction was dominant, and the Pr-Co and Pr-Pr interactions were negligible. From the obtained structural data, the C insertion led to a change in the a, c parameters of the PrCo compound and thus to an increase in the unit cell volume V of 2.5%. The a, c parameters varied from Å and Å for PrCo to Å and Å for PrCoC. Consequently, the Co()-Co(), Co()-Co(), and Co()-Co() distances increased the related , and exchange interactions. As a result, the T increased due to the magnetovolume effect. Figure 8 gives the influence of C insertion on T. T increased from 600 to 740 K for x = 1, which corresponds to an increase of 23.5%.
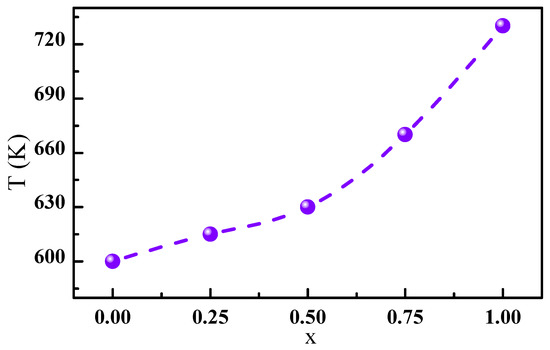
Figure 8.
Evolution of the Curie temperature T as a function of the C content.
The magnetization measurements, M(H), which were performed up to 90 kOe, indicated that the saturation process was hardly achievable at T = 293 K. This was due to the presence of an important magnetocrystalline anisotropy. An insertion content in the PrCoC system induced an important increase in the magnetization compared to PrCo, but it did not change the type of magnetic behavior, which always remained ferromagnetic. The values of the PrCoC compounds were determined from the M(H) curves. The dependence of M on the C insertion content in PrCoC showed a linear behavior at 293 K. The insertion of a small content of C caused an increase in from 8.2 for to /f.u for 1, corresponding to an increase of about 34%.
5.3. Nanocrystalline PrCoH (x = 0–10.8) Hydrides
The H absorption resulted in a variation of the lattice parameters of the PrCo compound and, therefore, an increase in the cell volume V. The nearest-neighbor number of each Co atom and the Co-Co distances were then determined depending on the H content. The Co-Co distances most influenced by H absorption were those involving the Co and Co atoms, respectively, in the 4f and 12k sites. Therefore, the increase in the Co-Co, Co-Co, and Co-Co distances led to a modification of the exchange interactions J, which had some impact on the increase in T. T increased as a function of H content from 600 K at x = 0 to 691 K at x = 3.75, then decreased for x > 3.75. The PrCoH hydrides presented a ferromagnetic comportment for all H contents. The XRD patterns of the magnetically aligned PrCoH hydride powder samples showed only (0 0 l)-type peaks, implying that the EMDs of PrCoH hydrides were along the c axis.
5.4. Mean Field Theory (MFT) and Random Magnetic Anisotropy (RMA) Analysis
5.4.1. Nanocrystalline PrCoC (x = 0–1) Compounds
The ferromagnetic alignment of the magnetic moments of Pr and Co atoms, M and M, can be described using the following expression:
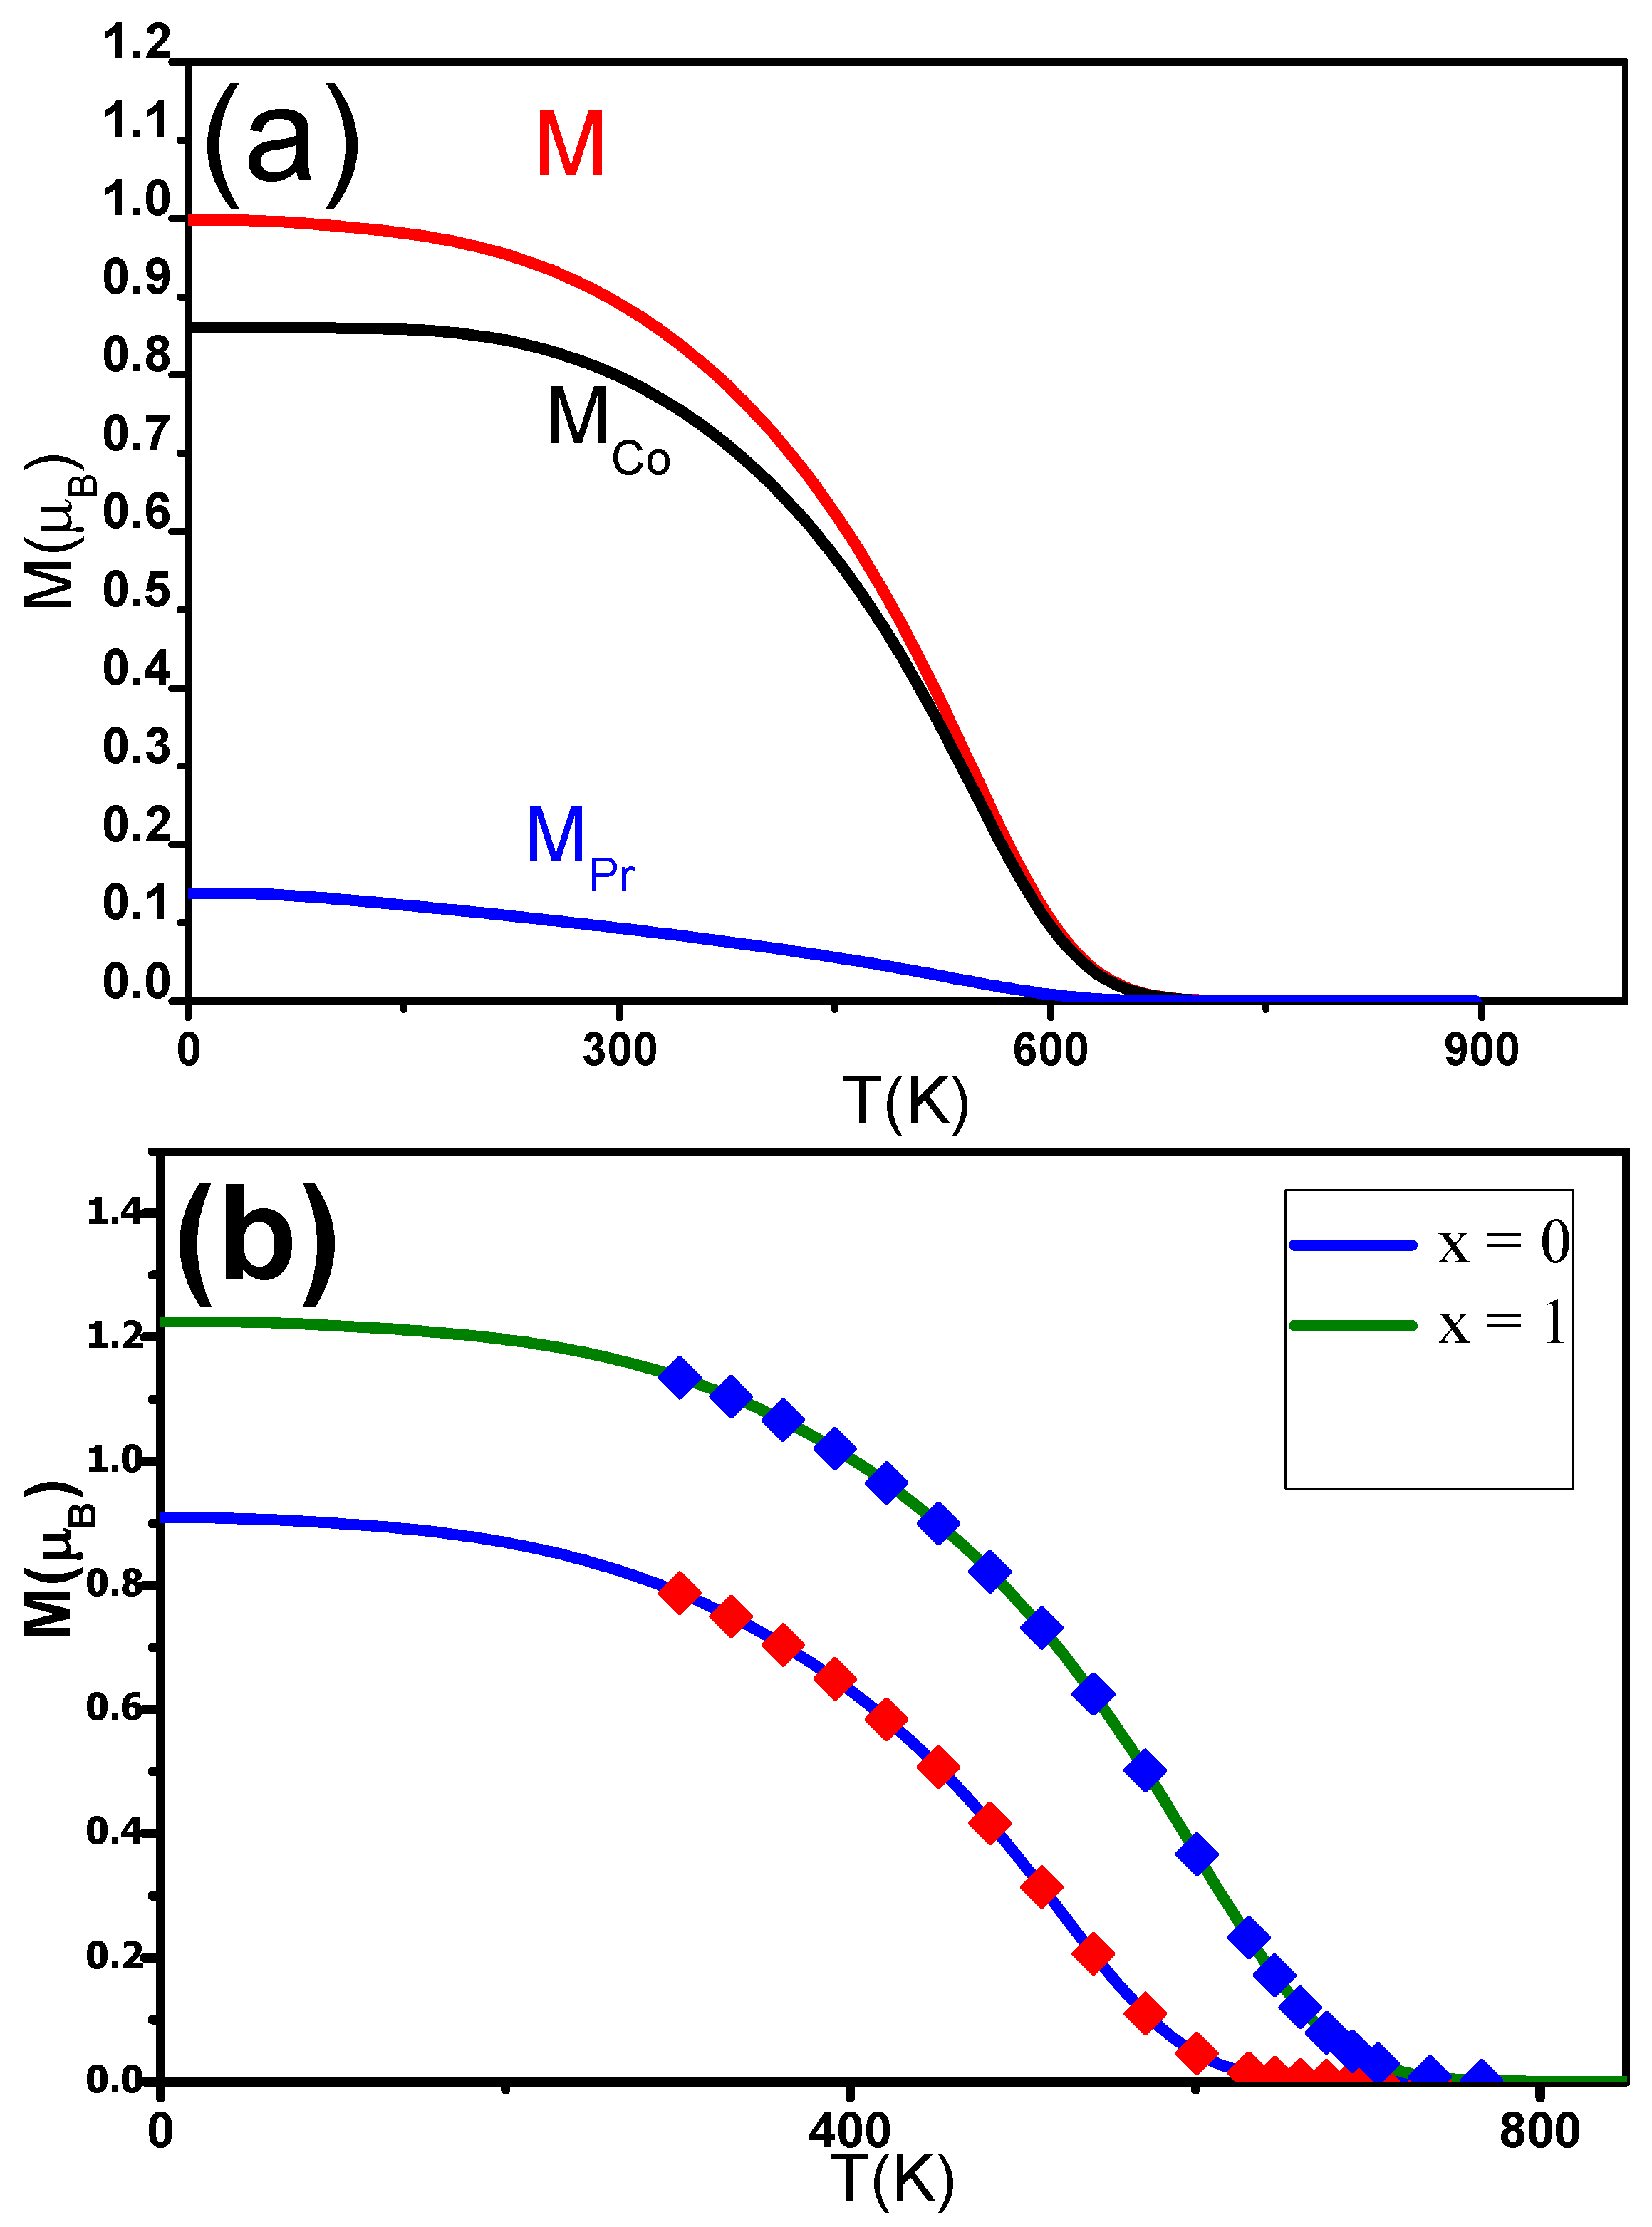
M and M were estimated using mean field theory (MFT). The magnetization M can be determined using expression (5). M and M were expected to follow the Brillouin functions [78]. M(T) was fitted for different C contents x. The experimental data align well with the theoretical curves. T was found to be in agreement with the experimentally derived temperature. M, M, and M were also determined for PrCoC (Figure 9a). The J and J exchange interactions increased as a function of x, while J was found to be constant around 2.10 J. Inserting C into the PrCo induced an enhancement of T from 600 to 730 K when x was increased from 0 to 1 (Figure 9b). The increase in T can be ascribed to electronic and magnetovolumic effects.
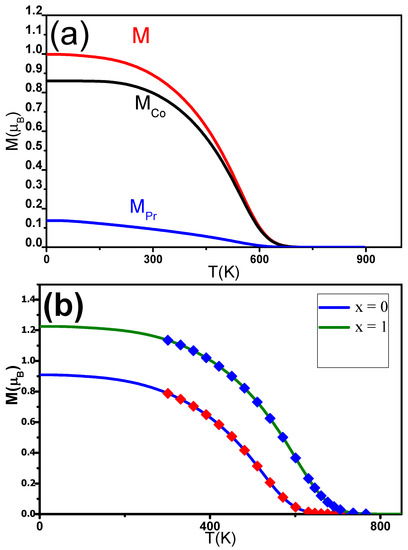
Figure 9.
(a) Calculated change in the magnetic moments (M(T), M(T)) and magnetization (M(T)) of the nanocrystalline PrCoC compound. (b) The solid lines are the M(T) of nanocrystalline PrCoC found calculated in the MFT analysis. The symbols show the experimental data.
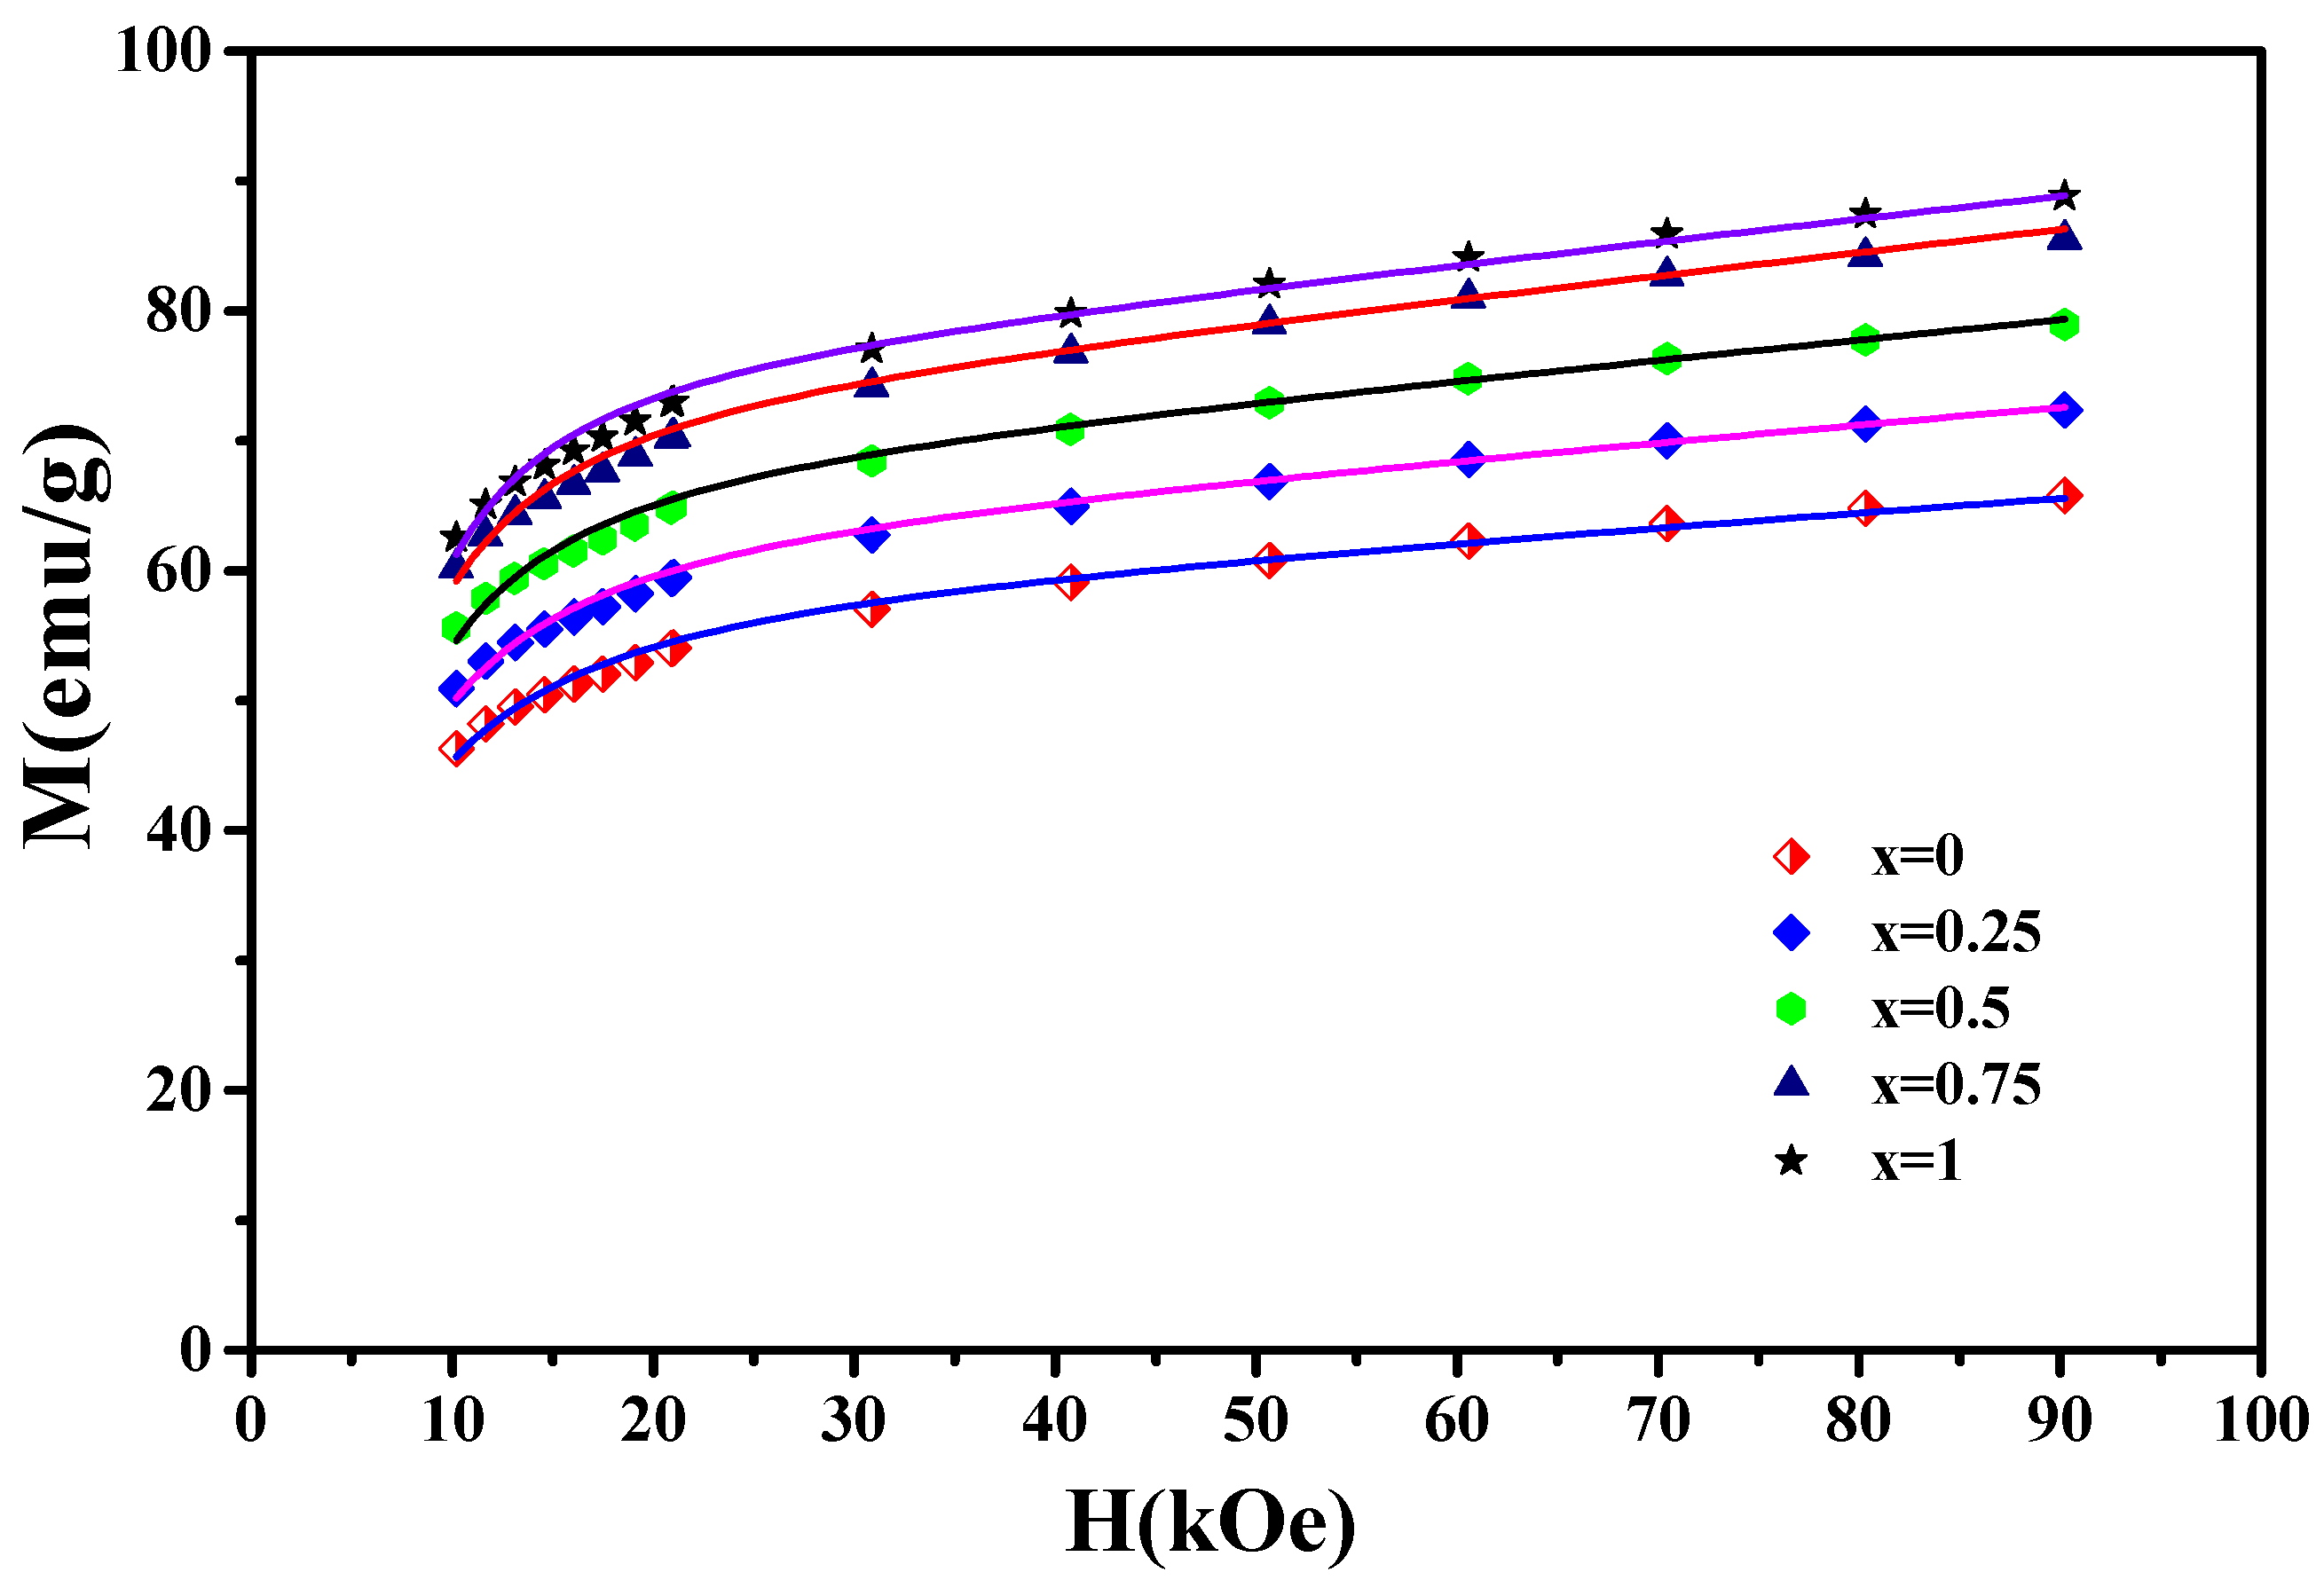
The magnetization curves M(H) of the nanocrystalline PrCoC compounds are displayed in Figure 10. Based on the law of approach to saturation, which describes the M(H) for H H, M close to the M can be estimated by:
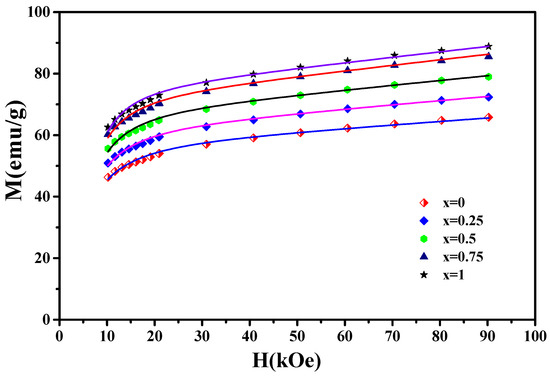
Figure 10.
The magnetization curves M(H) of the nanocrystalline PrCoC compounds (x = 0, 0.25, 0.5, 0.75, and 1). The solid lines show the fit to the experimental data (symbols).
H, H, and H correspond to the applied magnetic field, the exchange field, and the coherent anisotropy field, respectively. is the magnetic susceptibility. and are constants. Figure 10 displays the M(H) curves near saturation for the PrCoC compounds. As illustrated in Figure 10, Equation (6) fits the experimental data well. From the fits of Equation (6), we extracted the anisotropy field H, exchange field H, and the exchange constant , which are mentioned in Table 6. The and parameters are correlated to H and H with the following expressions [57]:

Table 6.
The values of M, the factors and , the field H(kOe), H(kOe), H(kOe), , and d (nm) for the nanocrystalline PrCoC (x = 0, 0.25, 0.5, 0.75, 1) compounds, measured at 293 K.
The anisotropy field H = 2K/M. K is the constant anisotropy.
d is the distance over which the local anisotropy axis is related. The d values were estimated with statistical correlation magnetometry. The parameter plays an important role in the distinction between weak anisotropy ( < 1) and strong anisotropy ( > 1). It was found using the following formula [58]:
For all C contents, was higher than 1, which is consistent with a ferromagnetic system with strong random anisotropy.
5.4.2. Nanocrystalline PrCoH (x = 0–10.8) Hydrides
The exchange interactions of nanocrystalline PrCoH were calculated as a function of H content using the MFT (Table 7). J and J increased when the H content increased. The exchange interaction J was around 2 × 10 J. M(T), M(T), and M(T) were fitted. The T values were found to be in good agreement with the experimentally determined values. T increased as a function of H content from 600 K at x = 0 to 691 K at x = 3.75, dealing with an increase of about 9.1%, then decreasing for x > 3.75. The peak value appearance of T at x = 3.75 resulted from the H content dependence of the exchange interaction parameter of J. The enhancement of the T of PrCoH hydrides for x ≤ 3.75 could be the result of two effects: the electronic effect associated with a decrease in the hybridization of Co(3d) atoms with their neighbors and the magnetovolume effect associated with Co-Co distances, which suggests a decrease in antiferromagnetic interaction [57]. The Co-Co exchange interactions increased from 166 × 10 for x = 0 to 178 × 10 J for x = 3.75. The decrease in T for x > 3.75 was mostly due to the reduction in Co-Co exchange interactions from 178 × 10 to 130 × 10 J for x = 10.8.

Table 7.
The saturation magnetization M, factors and , magnetic anisotropy field H(kOe), coherent anisotropy field H(kOe), exchange field H(kOe), exchange constant , and distance d (nm) values for the nanocrystalline PrCoH hydrides, measured at 293 K.
From the fits of Equation (6), we also determined the different magnetic parameters, which are enumerated in Table 7. H varied from 130 to 150 kOe. The constant anisotropy K and increased from 5.24 × 10 to 5.69 × 10 erg/cm and from 1.01 to 1.37 , respectively, then decreased for x > 2.5. The decrease in K was well related to the decrease in using the relation K∞ m (m is relative change in magnetization). This agrees with the statement that the magnetization for the PrCoH hydrides is principally due to the Co moment . increased from 8.32 at x = 0 to 14 /f.u at x = 2.5, then decreased for x > 2.5. The decrease in was due to the reduced hybridization state between the 3d(Co) and 5d(Pr) bands engendered by the volume expansion, which led to a decrease in the state density at the Fermi level. The 3d(Co) bands became closer and, therefore, more localized. Hence, the magnetic moment per Co atom increased with the H atom absorption in a first step. This created new Co-H bonds, which resulted in a decrease in the magnetization of the PrCoH hydrides, which confirms the hypothesis on the electronic and magnetovolumic effects of H absorption [57,58]. The coercivity H can be defined by the random anisotropy model [79]. H can be written with the following expression:
where is the grain size.
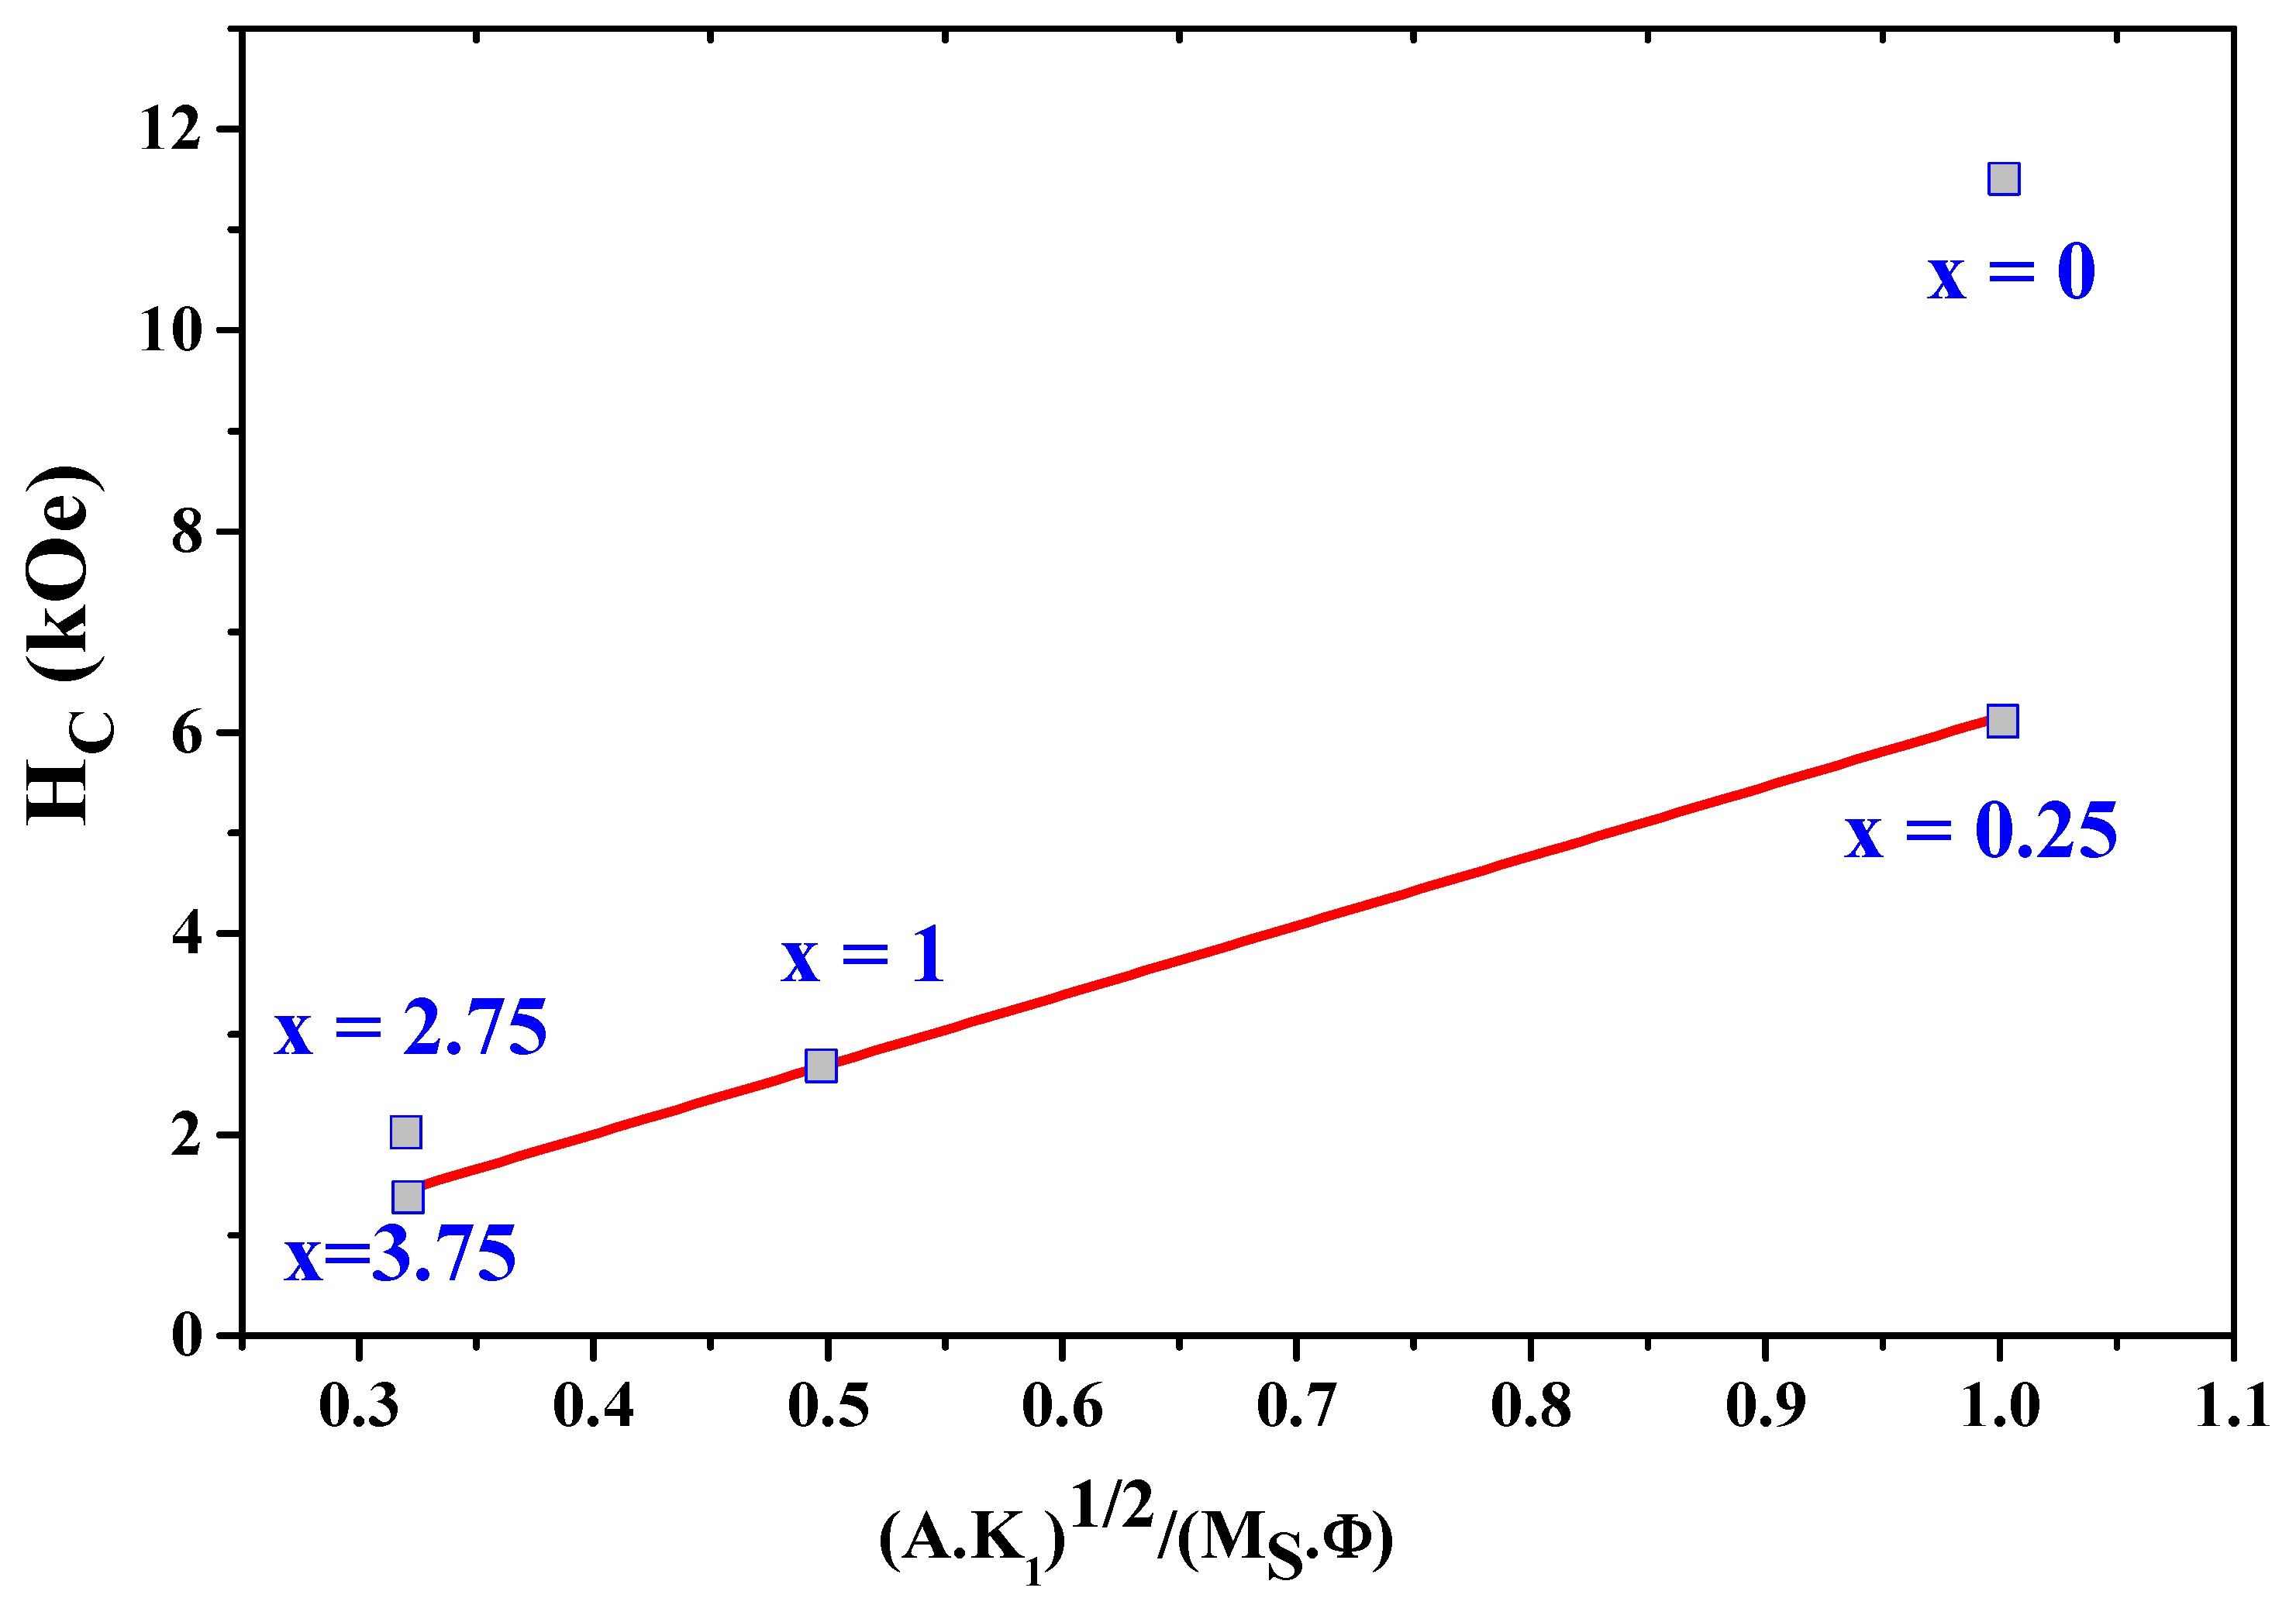
As shown in Figure 11, the experimental values of H as a function of and H fit well and linearly with . The parameter was estimated to be about 6.91. The values of H obtained from (9) are in agreement with the experimental values.
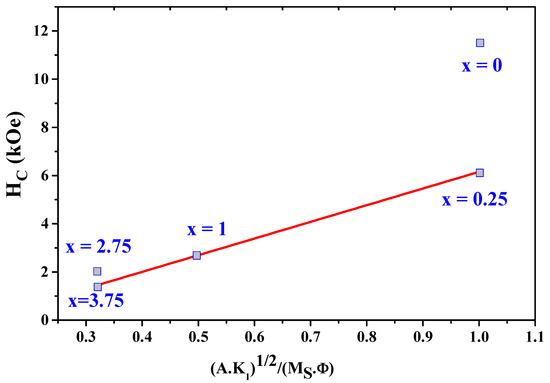
Figure 11.
The experimental data on the coercivity H as a function of = .
5.5. Magnetocaloric Effect of the Nanocrystalline PrCo Compound
The measurements of the curves were carried out around the Curie temperature going from 562 to 598 K for 2:7 (R) and from 585 to 615 K for 2:7 (H). The same type of magnetization behavior as for PrCo could be observed. On the other hand, when , the PrCo compound was paramagnetic, and its magnetization increased gradually with the applied field. The magnetization increased rapidly with the applied field until saturation was achieved. It should be noticed that, for the 2:7 R structure, saturation was not achieved compared to the 2:7 H structure; this was related to the presence of strong uniaxial anisotropy in this compound. We traced the Arrott curves for the PrCo compound in its 2:7 H and 2:7 R structures based on the isotherms found. It should be remarked that these curves showed a positive slope; this confirmed that the PrCo compound for the two structures had a second-order phase transition from the paramagnetic to the ferromagnetic state [80].
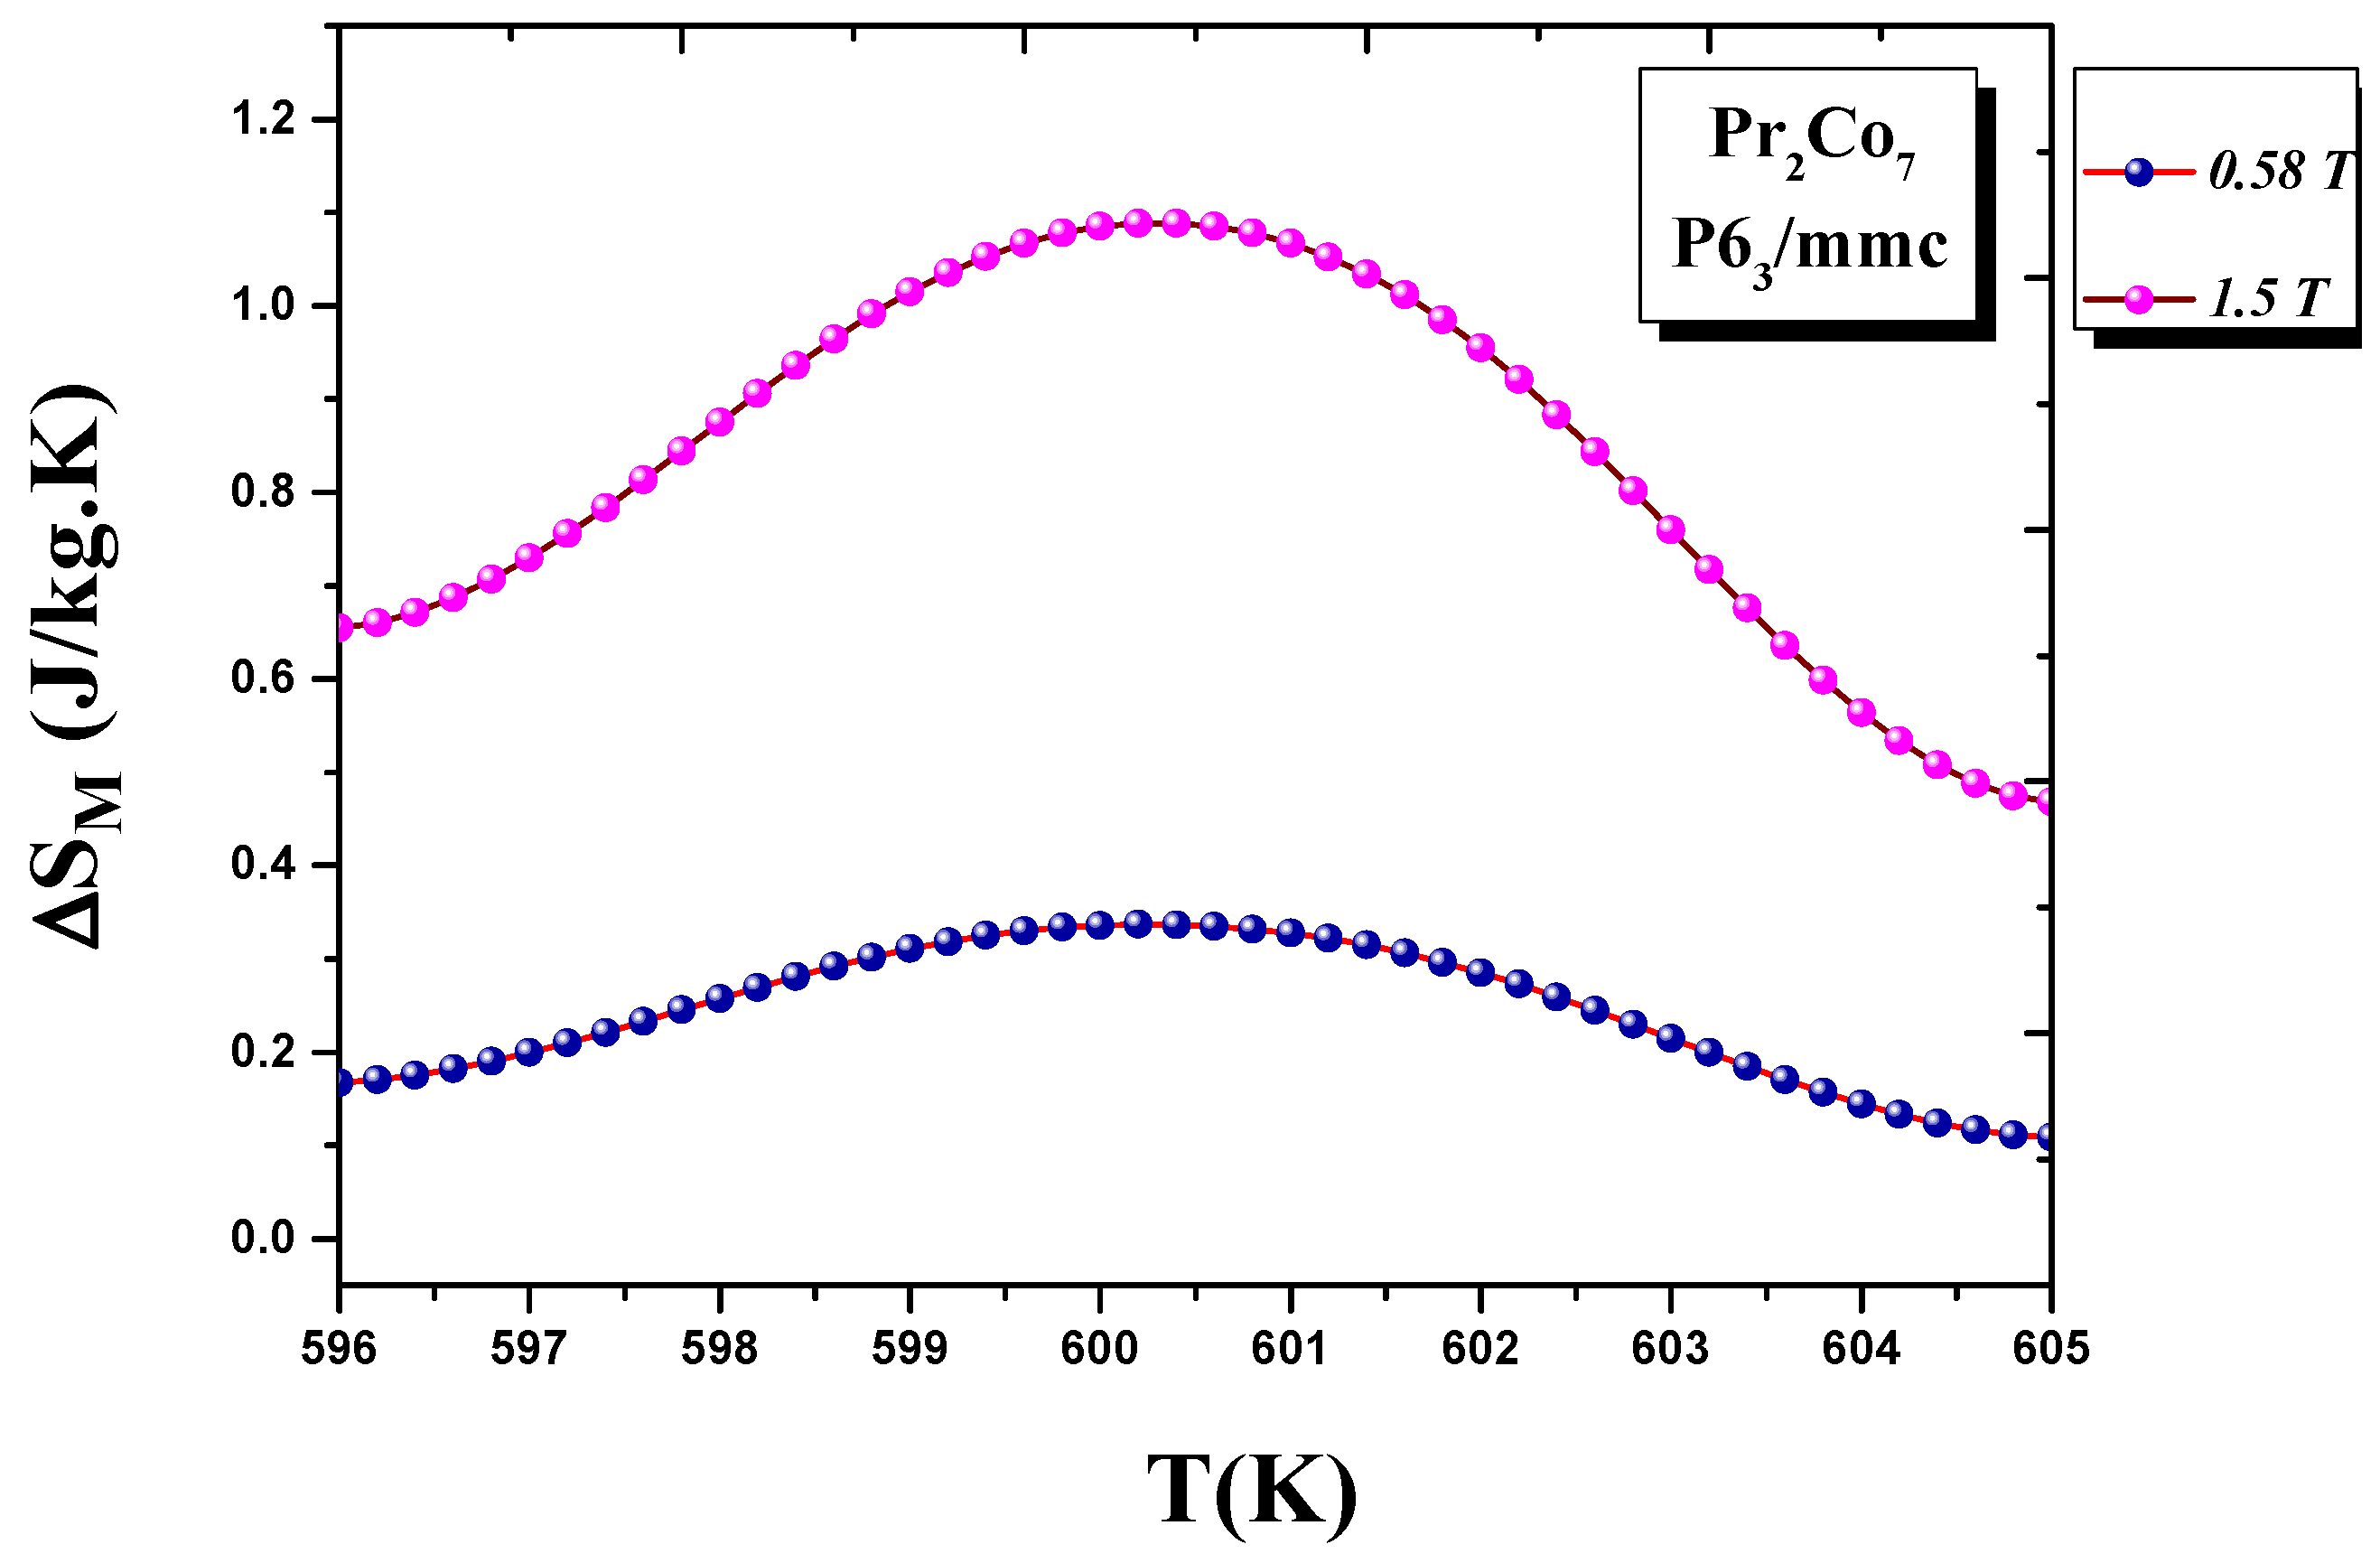
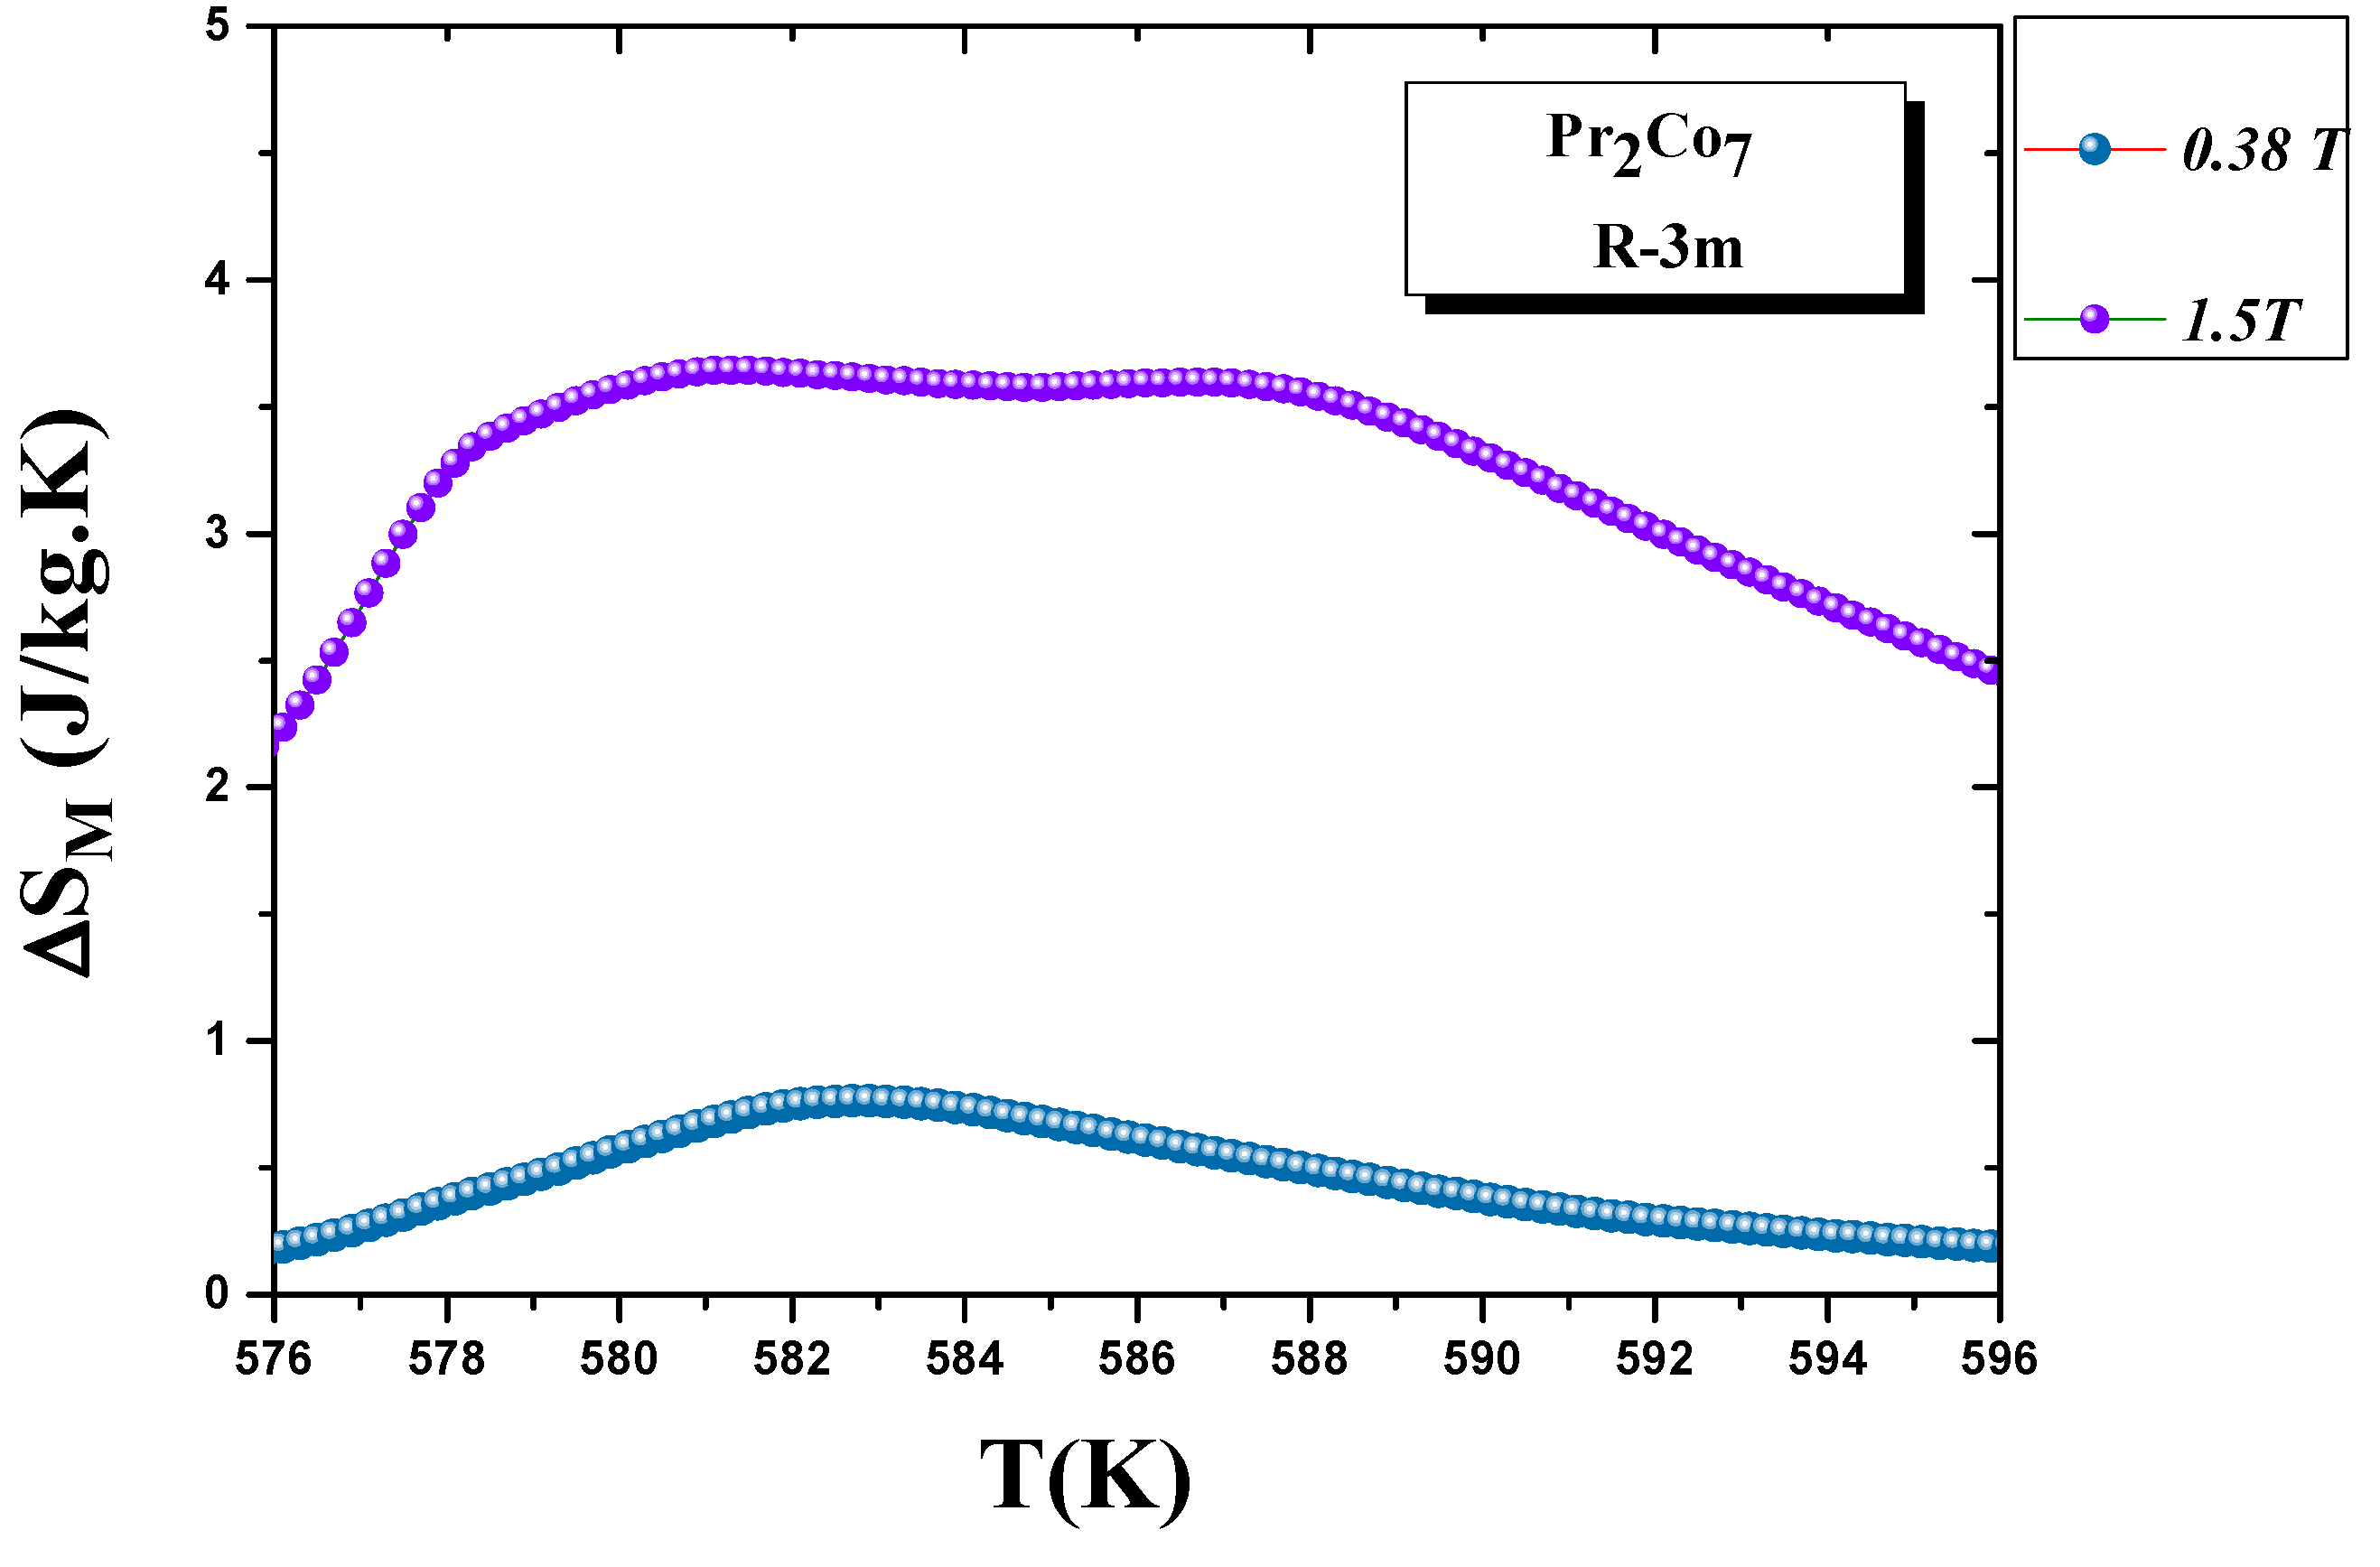
We calculated the evolution of the magnetic entropy as a function of temperature T and applied field H. Figure 12 and Figure 13 show the thermal variations in the changes in magnetic entropy for the 2:7 H and 2:7 R structures, respectively. The of the 2:7 R structure was greater than that for the 2:7 H structure. As shown in Figure 13, the maximum value was about 3.7 J/(kg.K) under a magnetic field of 0–15 kOe. There were two important contributions to the maximum change in magnetic entropy : the M and , which was the difference between two successive isotherms at a particular magnetic field around the temperature T. The peak that corresponded to became a plateau starting at T. This transition from a single peak to a plateau was seen for the first time for a second-order magnetic transition. The relative cooling power (RCP) values were 102.7 and 8.5 J/kg, respectively, for the 2:7 R and 2:7 H structures. The calculation was based on the variation of according to the equation: [8], where and are the maximum of the entropy variation and the full width at half maximum of the temperature dependence of the change in magnetic entropy .
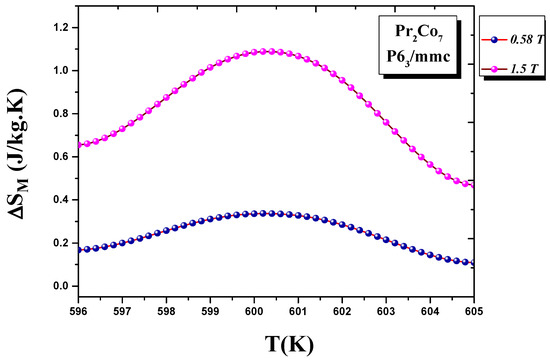
Figure 12.
Magnetic entropy (T) around the Curie temperature T for the 2:7 H structure.
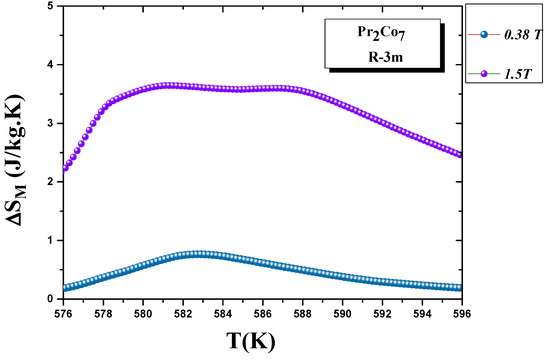
Figure 13.
Magnetic entropy (T) around the Curie temperature T for the 2:7 R structure.
6. Extrinsic Magnetic Properties
6.1. Nanocrystalline PrCoFe (x = 0, 0.25, 0.5, 0.75, and 1) Compounds
To obtain a nanocrystalline state with excellent extrinsic magnetic properties, annealing was performed at different temperatures. At each annealing temperature T, the hysteresis loops were measured. The evolution of H as a function of T initially exhibited a characteristic increase in H with T up to a maximum H value, which was followed by a decrease in H at higher temperatures of T > 973 K. The most favorable microstructure for optimal magnetic properties corresponded to T between 973 and 1073 K. The highest H obtained for the nanocrystalline PrCoFe and PrCoFe compounds was H = 11.5 kOe and H = 12 kOe, respectively. The respective values of remanent magnetization M were 43 and M = 48 emu/g. The decrease in H could mainly be due to the decrease in magnetocrystalline anisotropy after the substitution. H depended principally on the magnetocrystalline anisotropy H. The substitution of Co by Fe implied a reduction of the contribution of the axial and, thus, a decrease in H as a function of x, as has been shown by X-ray diffraction in oriented powders [71]. We studied the evolution of (BH). The (BH) value increased with T and then decreases when T increased for all values of Fe content x. Table 8 summarizes the H, M, and (BH) values as a function of content x. The nanocrystalline PrCo Fe compound annealed at 973 K can currently be useful for applications in the field of permanent magnets.

Table 8.
Extrinsic magnetic properties of PrCoFe at T = 293 K: H (kOe), M (emu/g), and (BH) (MGOe).
6.2. Nanocrystalline PrCoC (x = 0–1) Compounds
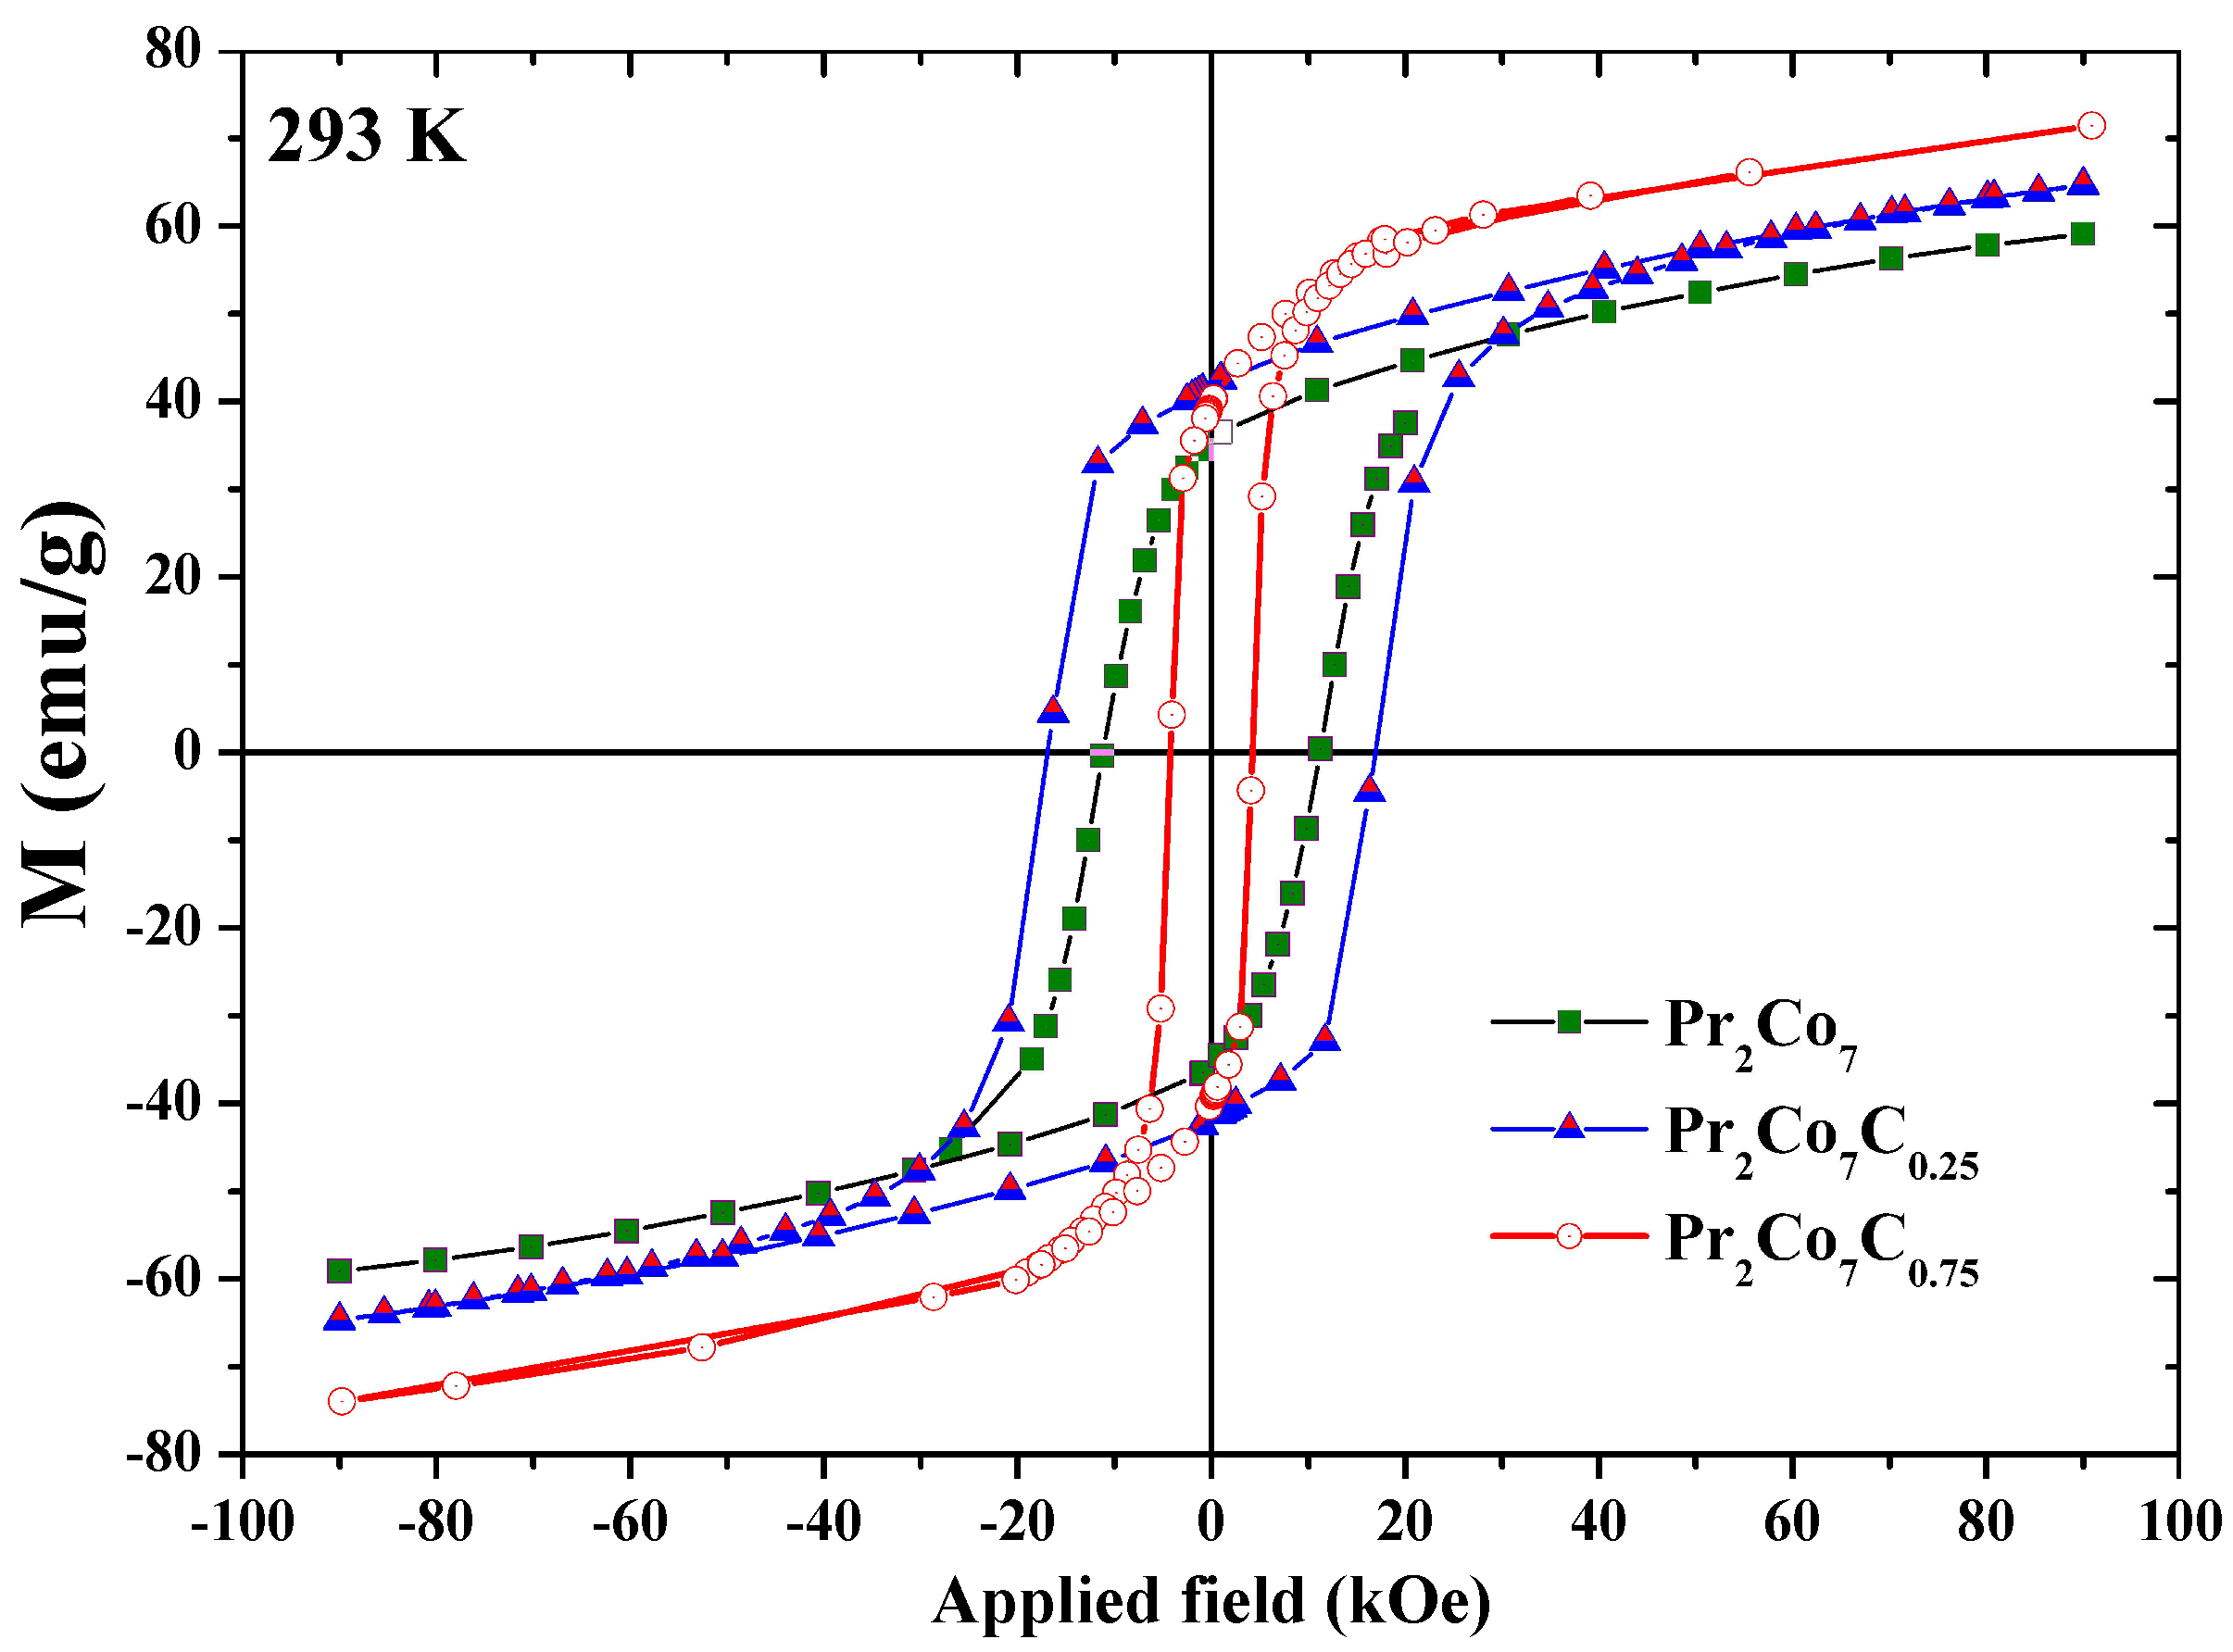
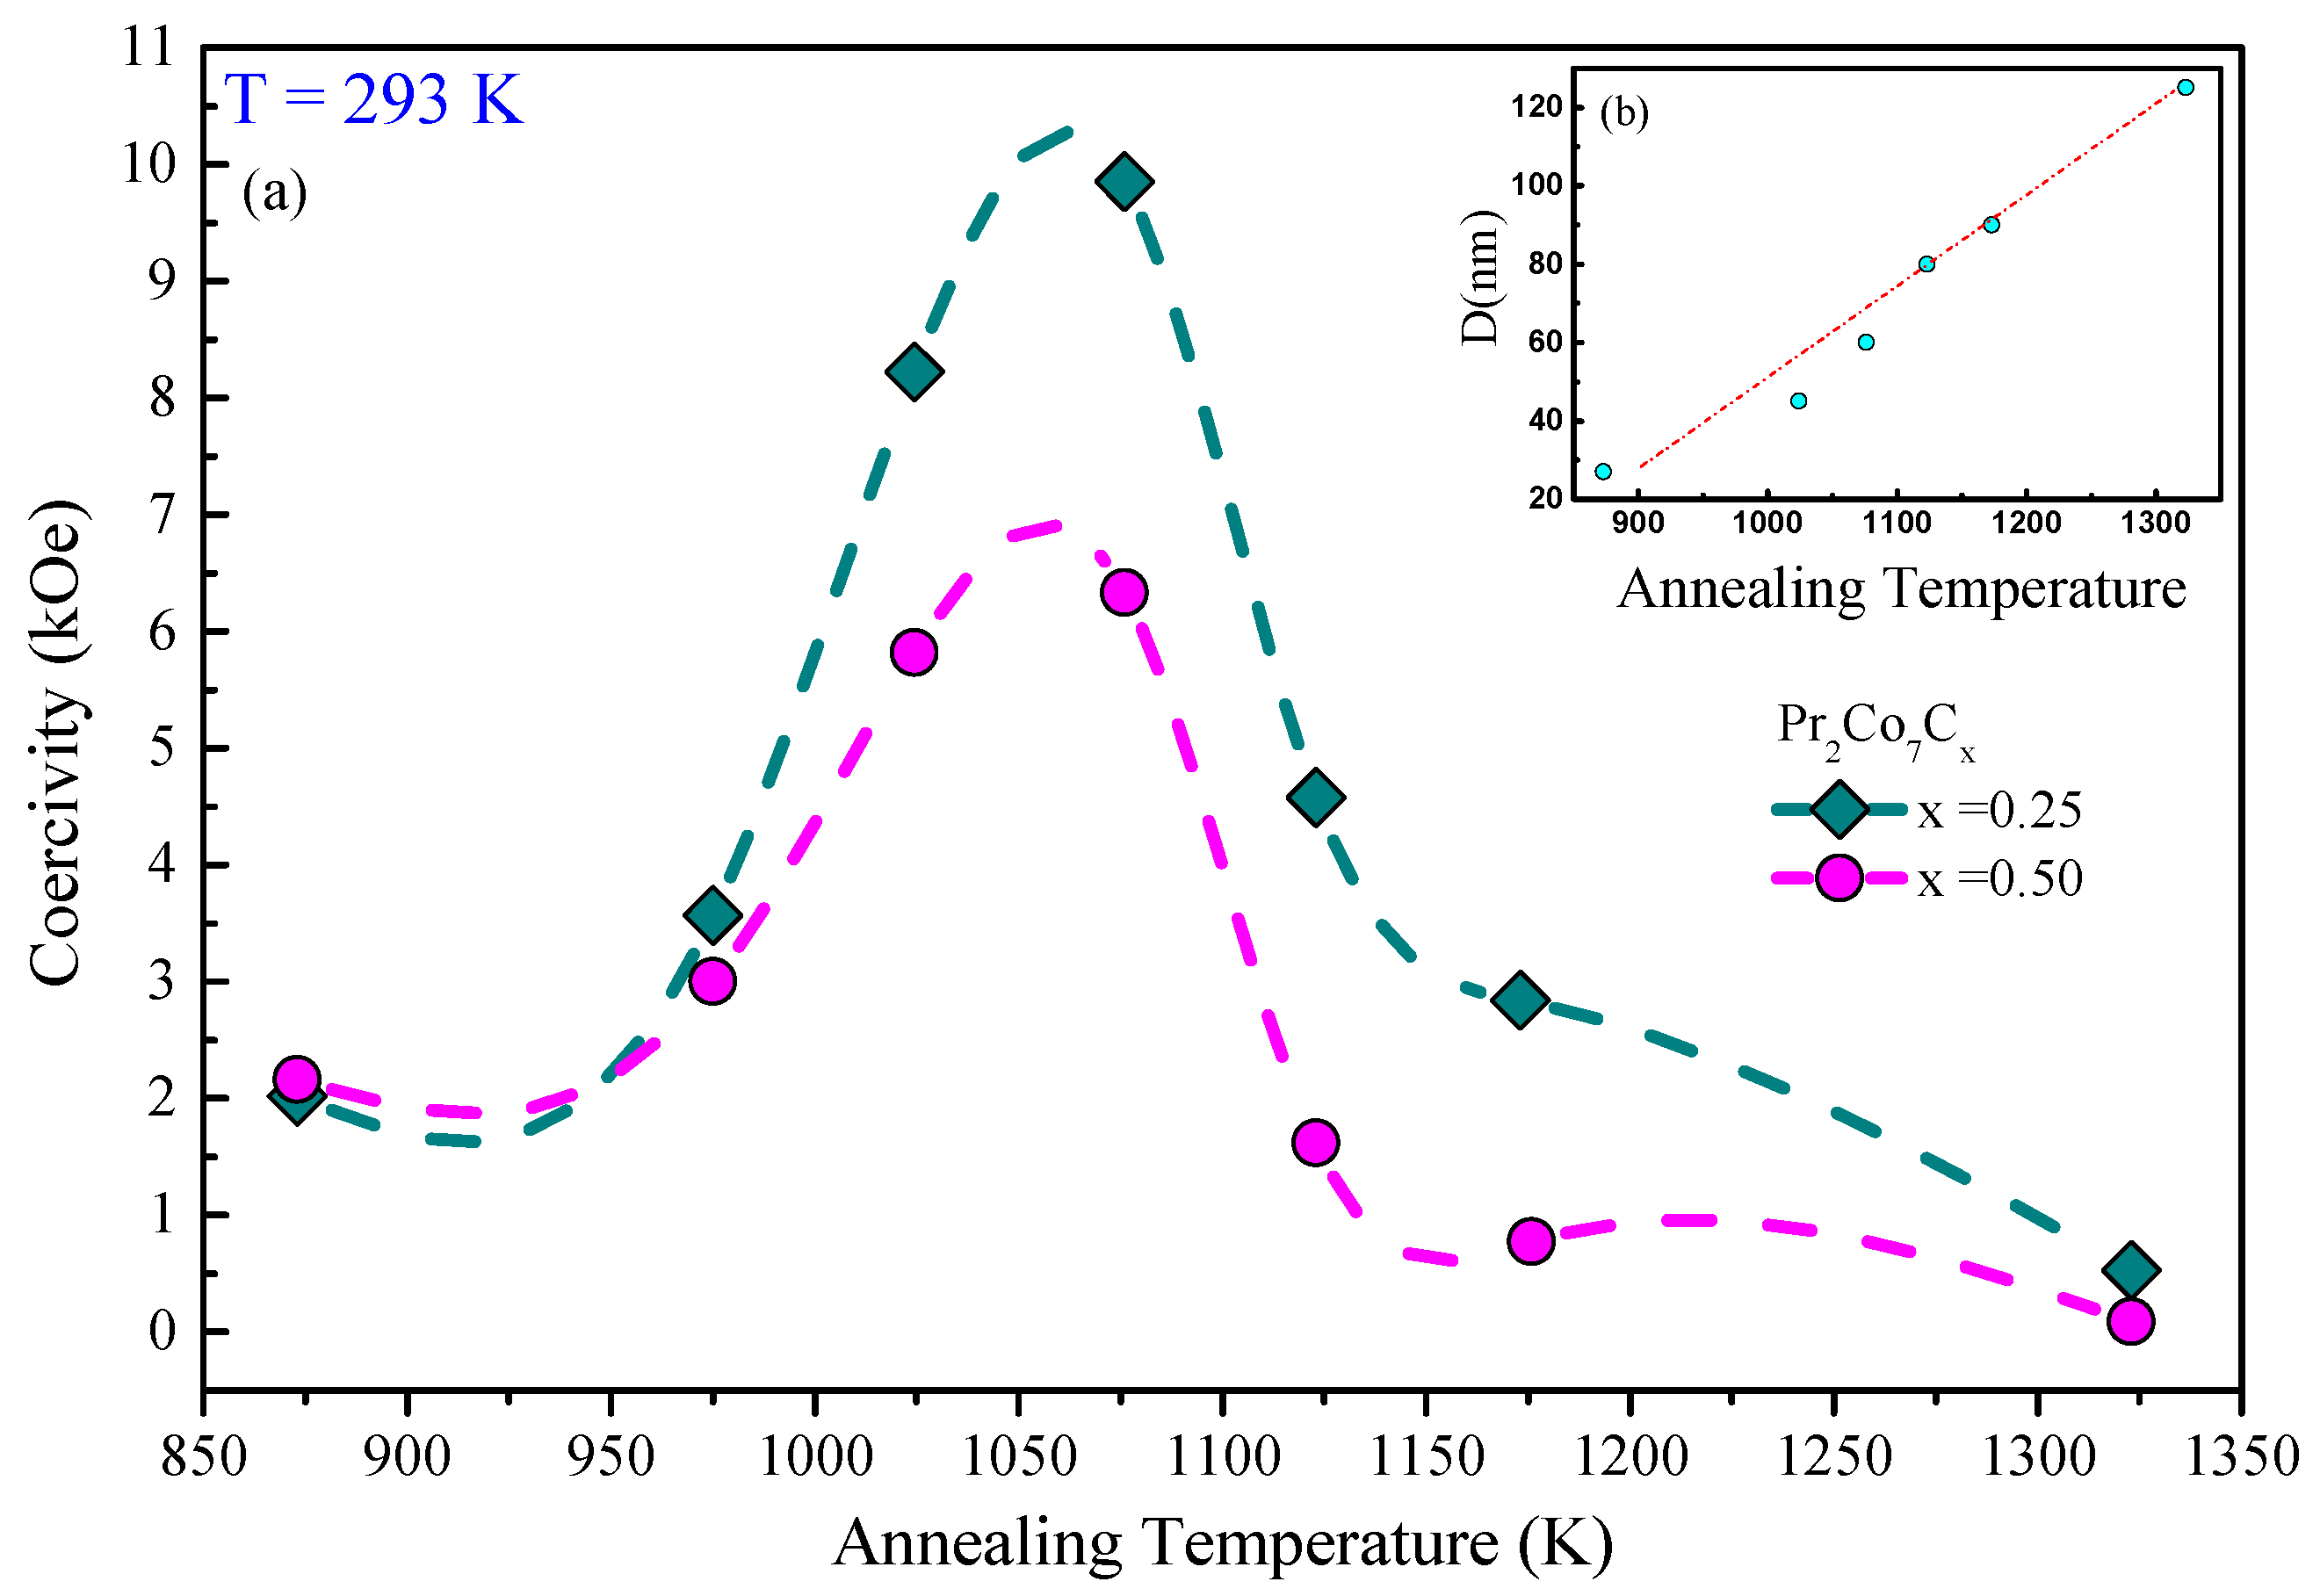
Figure 14 shows the hysteresis loops of the PrCo, PrCoC, and PrCoC compounds annealed at 1073 K and measured at 293 K. The hysteresis loops show that these compounds are isotropic and confirm that they have only one ferromagnetic phase. We present in Figure 15 the evolution of H as a function of annealing temperature T for the PrCoC compounds. The curve passes through a maximum for = 1073 K. Two regions are thus highlighted; they are correlated to the mean grain size and the defects. The H increases with T in the lattice with the 2:7 H structure, i.e., with the grain size and the reduction of the defects, until the critical value found at 1073 K. The grains get bigger and H decreases. We give in Table 9 the evolution of H, M, and (BH) as a function of x. The decrease in H is mainly due to the decrease in magnetocrystalline anisotropy H and the grain size, which becomes larger during C insertion (Figure 15). The best properties found were recorded for the the PrCoC compound that was annealed at 1075 K; the H value was equal to 17.5 kOe with an M of 43 emu/g, an M/M ratio of 0.60, and (BH) = 12.5 MGOe.
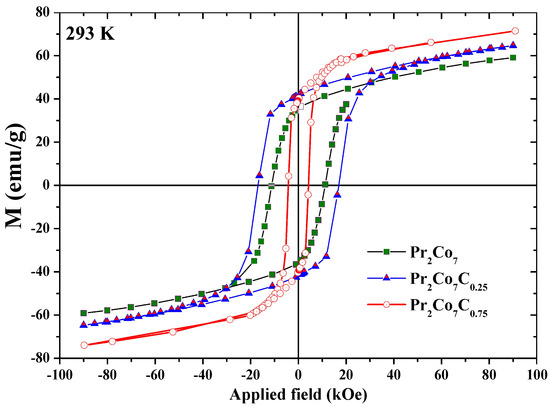
Figure 14.
Hysteresis loops of the PrCo, PrCoC, and PrCoC compounds, measured at 293 K.
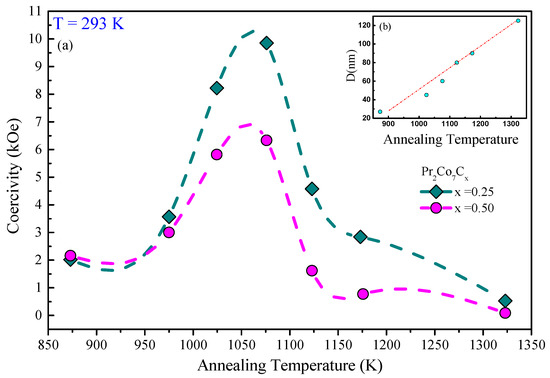
Figure 15.
(a) The evolution of the coercivity H as a function of annealing temperature T of the PrCoC compounds (). (b) The grain size as a function of C content x is shown in the inset.

Table 9.
Magnetic properties of PrCoC compounds at T = 293 K.
6.3. Nanocrystalline PrCoH (x = 0–10.8) Hydrides
The demagnetization curves found in the hysteresis loops of the PrCoH hydrides (x = 0.25, 6.1, and 10.8) were smooth, indicating a fine and uniform grain size for these hydrides [57]. The PrCoH hydride had the highest extrinsic magnetic properties compared to the other PrCoH hydrides: H = 6.1 KOe, (BH) = 5.8 MGOe, M = 40 emu/g, and remanence ratio M/M = 0.62. The H decreased with x from about 11.5 KOe at x = 0 to 0.33 KOe at x = 10.8. The M values ranged from 42.5 to 40.25 emu/g. The decrease in H and (BH) as a function of H content could mainly be due to the decrease in magnetocrystalline anisotropy resulting from the H absorption. The main interest lies in the fact that hydrogenation increased T by a factor of almost 9.1% for x = 3.75 compared with the PrCo compound. The PrCoH hydride could be considered as a soft material; it finds its applications in the field of magnetic recording or storage of information.
7. Conclusions
In this work, we studied the microstructure and magnetic properties of the nanocrystalline PrCo, PrCoFe, PrCoC, and PrCoH compounds, which were obtained by high-energy ball milling. The PrCo compound can exist in two polymorphic structures: a hexagonal one of the CeNi type with a space group of (2:7 H structure), which is stable at a relatively low temperature (T ≤ 1023 K), and a rhombohedral one of the GdCo type with a space group of (2:7 R structure), which is stable at a high temperature (T ≥ 1223 K). The T is around 600 K for the 2:7 H structure and 580 K for the 2:7 R one. The study of the magnetocaloric properties of the nanocrystalline PrCo compound showed the presence of a large reversible magnetic entropy change with a second-order magnetic transition. The maximum value (S) was about 3.7 J/(kg.K) under a magnetic field of 0–16 kOe. The relative cooling power (RCP) was equal to 102.7 J/kg and 8.5 J/kg for the 2:7 R and 2:7 H structures, respectively.
The nanocrystalline PrCoFe compounds annealed at T = 973 K crystallized into the 2:7 H structure for x ≤ 1, but for x ≥ 3.5, the 2:7 phase disappeared completely and decomposes into Pr(Co,Fe) + Pr(Co,Fe). The refinement of the EXAFS spectra for ≤1 showed that Fe atoms preferably occupied the 12k site in the PrCoFe alloys. This could be related to the fact that the 12k site is significantly more anisotropic in the c direction than the other four Co sites. The study of the magnetic properties of nanocrystalline PrCoFe compounds showed that the T was improved by 26% for x = 0.5, H = 12 kOe, M = 43 emu/g, and (BH) = 9 MGOe, as well as at 10 K, H = 53 kOe, M = 43 emu/g, (BH) = 30 MGOe. The insertion of C atoms into the PrCo cell led to a marked improvement in T of 21.6%. The greatest magnetic properties for the PrCoC compound, including an H of 10.3 kOe, a remanence ratio M/M of 0.78, and a (BH) of 11.5 MGOe, were found at T = 293 K. We investigated the microstructure, hydrogenation, and magnetic properties of nanocrystalline PrCoH hydrides. Two plateaus were found during the absorption–desorption process in the P-C isotherm. The crystal structure of the PrCo compound transformed from a hexagonal (P63/mmc) structure to an orthorhombic (Pbcn) and monoclinic (C2/c) structure during hydrogenation. The absorption of hydrogen by the PrCo compound led to an increase in T from 600 K at x = 0 to 691 K at x = 3.75. The PrCoH hydride had the best magnetic properties: H = 6.1 KOe, (BH) = 5.8 MGOe, M = 40 emu/g, and T = 607 K. We adapted the MFT and RMA methods to investigate the magnetic moments, exchange interactions, and magnetic anisotropy properties. The correlations between microstructure and magnetic properties were discussed. The obtained results could provide a reference for tailoring the magnetic properties of the PrCo, PrCoFe, PrCoC, and PrCoH compounds for potential permanent nanomagnets, high-density magnetic media, magnetic refrigeration applications, and hydrogen storage.
Author Contributions
Conceptualization, R.F., N.M. and L.B.; resources, R.F., N.M. and L.B.; data analysis and validation, R.F., N.M. and L.B.; original draft preparation, R.F., N.M. and L.B.; review and editing, R.F., N.M. and L.B. All authors have read and agreed to the published version of the manuscript.
Funding
This research received no external funding.
Institutional Review Board Statement
Not applicable.
Informed Consent Statement
Not applicable.
Data Availability Statement
Data sharing not applicable.
Acknowledgments
This research was supported by the CNRS and the “Ministère de l’Enseignement et de la Recherche Scientifique, LR99ES17”. The authors would like to acknowledge the PRF2019-D4P2 and PHC-Utique G211408 projects.
Conflicts of Interest
The authors declare no conflict of interest.
Abbreviations
| EDS | Energy-Dispersive X-ray Spectroscopy |
| EXAFS | Extended X-Ray Absorption Fine Structure |
| Coercive Field | |
| HRTEM | High-Resolution Transmission Electron Microscopy |
| Remanent Magnetization | |
| STEM | Scanning Transmission Electron Microscopy |
| Curie Temperature | |
| MFT | Mean Field Theory |
| RMA | Random Magnetic Anisotropy |
| RCP | Relative Cooling Power |
References
- Burzo, E. Exchange Interactions and Transition Metal Moments in Rare-Earth Compounds. J. Synch. Investig. 2018, 12, 431–435. [Google Scholar] [CrossRef]
- Zhang, Y. Review of the structural, magnetic and magnetocaloric properties in ternary rare earth RE2T2X type intermetallic compounds. J. Alloys Compd. 2019, 787, 1173–1186. [Google Scholar] [CrossRef]
- Wang, Y.; Guo, D.; Wu, B.; Geng, S.; zhang, Y. Magnetocaloric effect and refrigeration performance in RE60Co20Ni20 (RE = Ho and Er) amorphous ribbons. J. Magn. Magn. Mater. 2020, 498, 166179. [Google Scholar] [CrossRef]
- Li, L.; Yan, M. Recent progresses in exploring the rare earth based intermetallic compounds for cryogenic magnetic refrigeration. J. Alloys Compd. 2020, 823, 153810. [Google Scholar] [CrossRef]
- Yin, L.; Parker, D.S. Effect of atom substitutions on the magnetic properties in Ce2Fe17: Toward permanent magnet applications. J. Appl. Phys. 2021, 129, 103902. [Google Scholar] [CrossRef]
- Schafer, L.; Skokov, K.; Liu, J.; Maccari, F.; Braun, T.; Riegg, S.; Radulov, I.; Gassmann, J.; Merschroth, H.; Harbig, J.; et al. Design and Qualification of Pr-Fe-Cu-B Alloys for the Additive Manufacturing of Permanent Magnets. Adv. Funct. Mater. 2021, 31, 2102148. [Google Scholar] [CrossRef]
- Dirba, I.; Sepehri-Amin, H.; Skokov, K.; Skourski, Y.; Hono, K.; Gutfleisch, O. Magnetic properties and microstructure of Sm5Fe17-based composite magnets. Acta Mater. 2021, 212, 116912. [Google Scholar] [CrossRef]
- Jaballah, H.; Bouzidi, W.; Fersi, R.; Mliki, N.; Bessais, L. Structural, magnetic and magnetocaloric properties of (Pr,Sm)2Fe17 compound at room temperature. J. Phys. Chem. Solids 2022, 532, 110438. [Google Scholar] [CrossRef]
- Chrobak, A.; Bajorek, A.; Chełkowska, G.; Haneczok, G.; Kwiencien, M. Magnetic properties and magnetocaloric effect of the Gd(Ni1−xFex)3 crystalline compound and powder. Phys. Status Solidi 2009, 206, 731–737. [Google Scholar] [CrossRef]
- Bajorek, A.; Berger, C.; Pruzik, K.; Zubko, M.K.; Wojtyniak, M.; Chełkowska, G. Novel Ho(Ni0.8Co0.2)3 nanoflakes produced by high energy ball-milling. Mater. Charcterisation 2017, 128, 45–53. [Google Scholar]
- Lopadczak, P.; Bajorek, A.; Prusik, K.; Zubko, M.; Chełkowska, G. Magnetic hardening induced in RCo5 (R = Y, Gd, Sm) by short HEBM. Acta Phys. Pol. A 2018, 55, 2100904. [Google Scholar] [CrossRef]
- Bajorek, A.; Łopadczak, P.; Prusik, K.; Zubko, M.; Chełkowska, G. The comparison of magnetic properties at room temperature in RCo5 (R = Y, Sm, Gd) nanoflakes synthesized via time-staged HEBM. IEEE Trans. Magn. 2019, 55, 2100904. [Google Scholar] [CrossRef]
- Dahal, J.N.; Ali, K.S.S.; Mishra, S.R.; Neupane, D. Effect of Ga and Zr Substitution on the Properties of Dy2Fe17−xZrx and Dy2Fe16Ga1−xZrx (0 ≤ x ≤ 1) Intermetallic Compounds Prepared via Arc Melting Process. Magnetochemistry 2020, 6, 9. [Google Scholar] [CrossRef] [Green Version]
- Liu, K.; Wang, S.H.; Feng, Y.L.; Zhang, Y.K. Research on Phases and Morphology of Sm2Fe17 Melt-Spun Ribbon. Rare Met. Mater. Eng. 2020, 49, 3796–3802. [Google Scholar]
- Onoue, M.; Kobayashi, R.; Mitsui, Y.; Umetsu, R.Y.; Uwatoko, Y.; Koyama, K. Magnetic field-induced nitridation of Sm2Fe17. J. Alloys Compd. 2020, 835, 155193. [Google Scholar] [CrossRef]
- Veselova, S.; Tereshina, I.; Verbetsky, V.; Neznakhin, D.; Tereshina-Chitrova, E.; Kaminskaya, T.; Karpenkov, A.; Akimova, O.; Gorbunov, D.; Savchenko, A. Structure and magnetic properties of (Sm,Ho)2Fe17Nx (x = 0; 2.4). J. Magn. Magn. Mater. 2020, 502, 166549. [Google Scholar] [CrossRef]
- Kovacs, A.; Fischbacher, J.; Gusenbauer, M.; Oezelt, H.; Herper, H.C.; Vekilova, O.Y.; Nieves, P.; Arapan, S.; Schrefl, T. Computational Design of Rare-Earth Reduced Permanent Magnets. Engineering 2020, 6, 148–153. [Google Scholar] [CrossRef]
- Coey, J.M.D. Perspective and Prospects for Rare Earth Permanent Magnets. Engineering 2020, 6, 119–131. [Google Scholar] [CrossRef]
- Bajorek, A.; Łopadczak, P.; Prusik, K.; Zubko, M. Correlation between Microstructure and Magnetism in Ball-Milled SmCo5/α-Fe (5%wt. α-Fe) Nanocomposite Magnets. Materials 2021, 14, 502. [Google Scholar] [CrossRef]
- Ener, S.; Skokov, K.P.; Palanisamy, D.; Devillers, T.; Fischbacher, J.; Eslava, G.G.; Maccari, F.; Schafer, L.; Diop, L.V.B.; Radulov, I.; et al. Twins—A weak link in the magnetic hardening of ThMn12-type permanent magnets. Acta Mater. 2021, 214, 116968. [Google Scholar] [CrossRef]
- Opelt, K.; Ahmad, T.; Diehl, O.; Schonfeldt, M.; Brouwer, E.; Vogel, I.; Rossa, J.D.; Gassmann, J.; Ener, S.; Gutfleisch, O. Upscaling the 2-Powder Method for the Manufacturing of Heavy Rare-Earth-Lean Sintered didymium-Based Magnets. Adv. Eng. Mater. 2021, 23, 2100459. [Google Scholar] [CrossRef]
- Galler, A.; Ener, S.; Maccari, F.; Dirba, I.; Skokov, K.P.; Gutfleisch, O.; Biermann, S.; Pourovskii, L.V. Intrinsically weak magnetic anisotropy of cerium in potential hard-magnetic intermetallics. NPJ Quantum Mater. 2021, 2, 6. [Google Scholar] [CrossRef]
- Hosokawa, A.; Suzuki, K.; Yamaguchi, W.; Takagi, K. Mechanism of anomalous α-Fe formation from stoichiometric Sm2Fe17 jet-milled powder during post-pulverization annealing. Acta Mater. 2021, 213, 116981. [Google Scholar] [CrossRef]
- Shen, B.G.; Liang, B.; Wang, F.W.; Cheng, Z.H.; Gong, H.Y.; Zhang, S.Y.; Zhang, J.X. Magnetic Properties of Sm2Fe17−xSix and Sm2Fe17−xSixC Compounds. J. Appl. Phys. 1995, 77, 2637. [Google Scholar] [CrossRef]
- Cao, L.; Handstein, A.; Gebel, B.; Schäfer, R.; Müller, K.H. Thermostability of Sm2(FeGa)17Cy prepared by gas-solid reaction (GSR). J. Appl. Phys. 1997, 81, 4539. [Google Scholar] [CrossRef]
- van Lier, J.; Kubis, M.; Grünberger, W.; Shultz, L.; Kronmüller, H. High performance Sm2+δFe15Ga2C2 permanent magnets made by melt spinning and hot pressing. J. Appl. Phys. 1998, 83, 5549. [Google Scholar] [CrossRef]
- Kubis, M.; Eckert, D.; Gebel, B.; Müller, K.H.; Schultz, L. Intrinsic magnetic properties of Sm2Fe17−xMxNy/Cy (M = Al, Ga or Si). J. Magn. Magn. Mater. 2000, 217, 14. [Google Scholar] [CrossRef]
- Zheng, C.; Yu, D.; Li, K.; Luo, Y.; Jin, J.; Lu, S.; Li, H.; Mao, Y.; Quan, N. Effect of boron additions on phase formation and magnetic properties of TbCu7-type melt spun SmFe ribbons. J. Magn. Magn. Mater. 2016, 412, 89–94. [Google Scholar] [CrossRef]
- Luo, Y.; Zhang, K.; Li, K.S.; Yu, D.B.; Ling, J.J.; Men, K.; Dou, Q.Y.; Yan, W.L.; Xie, J.J.; Yang, Y.F. Structure and magnetic behaviors of melt-spun SmFeSiB ribbons and their nitrides. J. Magn. Magn. Mater. 2018, 405, 214–218. [Google Scholar] [CrossRef]
- Yang, W.; Zha, L.; Lai, Y.; Qiao, G.; Du, H.; Liu, S.; Wang, C.; Han, J.; Yang, Y.; Hou, Y.; et al. Structural and magnetic properties of the R10Fe90−xSix alloys with R=Y, Ce,Pr, Nd, Sm, Gd, Tb, Dy, Ho, and Er. Intermetallics 2018, 90, 8–17. [Google Scholar] [CrossRef]
- Takagi, K.; Jinno, M.; Ozaki, K. Preparation of TbCu7-type Sm-Fe powders by low-temperature HDDR treatment. J. Magn. Magn. Mater. 2018, 454, 170–175. [Google Scholar] [CrossRef]
- Wu, G.; Li, H.; Yu, D.; Li, K.; Yan, W.; Yuan, C.; Sun, L.; Luo, Y.; Zhang, K. Effect of niobium substitution on microstructures and thermalstability of TbCu7-type Sm-Fe-N magnets. J. Rare Earths 2018, 36, 281–286. [Google Scholar] [CrossRef] [Green Version]
- Yan, W.; Quan, N.; Luo, Y.; Yu, D.; Wang, Z.; Wu, G.; Zhang, K. Structure and hard magnetic properties of TbCu7-type SmFe8.95−xGa0.26Nbx nitrides. J. Rare Earths 2018, 36, 165–169. [Google Scholar] [CrossRef] [Green Version]
- Buschow, K.H.J. Magnetic anisotropy of some rare earth-cobalt compounds (R2Co7). J. Less-Common. Met. 1973, 33, 311. [Google Scholar] [CrossRef]
- Givord, D.; Lemaire, R. Magnetic Tranition and Anomalous Thermal-Expansion in R2Fe17 Compounds. IEEE Trans. Magn. 1974, 10, 109–113. [Google Scholar] [CrossRef]
- Buschow, K.H.J. Intermetallic compounds of rare-earth and 3d transition metals. Rep. Prog. Phys. 1977, 40, 1179. [Google Scholar] [CrossRef]
- Kirchmayr, H.; Poldy, C. Magnetism in rare earth—3d intermetallics. J. Magn. Magn. Mater. 1978, 8, 1–42. [Google Scholar] [CrossRef]
- Street, R.; Day, R.K.; Dunlop, J.B. Magnetic viscosity in NdFeB and SmCo5 alloys. J. Magn. Magn. Mater. 1987, 69, 106. [Google Scholar] [CrossRef]
- Coehoorn, R.; Daalderop, G.H.O. Magnetocrystalline anisotropy in new magnetic materials. J. Magn. Magn. Mater. 1992, 104, 1081–1085. [Google Scholar] [CrossRef]
- Qi, Q.; Li, Y.P.; Coey, J.M.D. Gas-phase interstitially modified intermetallics R(Fe11Ti)Z1-δ. II. 3d magnetization of the compounds Y(Fe11Ti)Z1-δ (Z = N, C). J. Phys. Condens. Matter 1992, 4, 8209. [Google Scholar] [CrossRef]
- Fischer, R.; Kronmuller, H. Static computational micromagnetism of demagnetization processes in nanoscaled permanent magnets. Phys. Rev. B 1996, 54, 7284. [Google Scholar] [CrossRef] [PubMed]
- Margarian, A.; Li, H.S.; Dunlop, J.B.; Cadogan, J.M. Structural and magnetic properties of the novel compound Dy3(Fe,Ti)29. J. Alloys Compd. 1996, 239, 27. [Google Scholar] [CrossRef]
- Cataldo, L.; Lefevre, A.; Cohen-Adad, M. Elaboration et optimisation d’alliages magnetiques: Sm-Co-Cu-Fe-Zr. Etude par diagrammes de phases. J. Chim. Phys. 1997, A94, 1087–1093. [Google Scholar] [CrossRef]
- Hu, J. Volume expansion and Curie temperature enhancement in R2Fe17Cx compounds. J. Alloys Compd. 1999, 285, 51. [Google Scholar] [CrossRef]
- Fischer, R.; Kronmuller, H. The role of the exchange interaction in nanocrystalline isotropic Nd2Fe14B-magnets. J. Magn. Magn. Mater. 1999, 191, 225. [Google Scholar] [CrossRef]
- Bessais, L.; Dorolti, E.; Djega-Mariadassou, C. Correlation between Sm2(Fe,Ga)17 and its precursor Sm(Fe,Ga)9. J. Appl. Phys. 2005, 97, 013902. [Google Scholar] [CrossRef]
- Bessais, L.; Djega-Mariadassou, C.; Beaunier, P. Effect of nanocrystallization on the structure and the magnetic properties of Nd–Fe–Co–Al–B glassy alloy. J. App. Phys. 2006, 99, 093906. [Google Scholar] [CrossRef]
- Yartys, V.; Riabov, A.; Denys, R.; Sato, M.; Delaplane, R. Novel intermetallic hydrides. J. Alloys Compd. 2006, 408, 273. [Google Scholar] [CrossRef]
- Khazzan, S.; Mliki, N.; Bessais, L. Structure and magnetic properties of nanocrystalline Sm1-s(Fe,Mo)5+2s. J. Appl. Phys. 2009, 105, 103904. [Google Scholar] [CrossRef]
- Bessais, L.; Younsi, K.; Khazzan, S.; Mliki, N. X-ray and intrinsic magnetic properties of nanocrystalline Sm2 (Fe, M) 17 (M = Si, Ga, Co, Cr, Zr or Mo). Intermetallics 2011, 19, 997–1004. [Google Scholar] [CrossRef]
- Khazzan, S.; Mliki, N.; Bessais, L.; Djega-Mariadassou, C. Rare-earth iron-based intermetallic compounds and their carbides: Structure and magnetic behaviors. J. Magn. Magn. Mater. 2010, 322, 224–229. [Google Scholar] [CrossRef]
- Kowalczyk, A. The intrinsic magnetic properties of R2Co7B3 (R= rare earth) intermetallic compounds. J. Magn. Magn. Mater. 1997, 175, 279. [Google Scholar] [CrossRef]
- Apostolov, A.; Bozukov, L.; Stanev, N.; Mydlar, T. A change in magnetic properties of R2Co7 intermetallic compounds (R = Pr, Sm, Tb and Ho) upon hydrogen absorption. J. Magn. Magn. Mater. 1990, 83, 286. [Google Scholar] [CrossRef]
- Fersi, R.; Mliki, N.; Bessais, L.; Guetari, R.; Russier, V.; Cabie, M. Effect of annealing on structural and magnetic properties of Pr2Co7 compounds. J. Alloys Compd. 2012, 14, 522. [Google Scholar] [CrossRef]
- Deryagin, A.V. 3d-4f METALLIC COMPOUNDS. Magnetic moment, magnetic anisotropy and spin-reorientation phase transition in (4f-3d)-intermetallic compounds. J. Phys. 1979, C5, 165. [Google Scholar] [CrossRef]
- Chrobak, A.; Bajorek, A.; Chełkowska, G. Effect of Tb/Gd substitution on crystal structure and exchange interactions of Gd1−xTbxNi3 intermetallic compounds. Acta Phys. Pol. A 2012, 121, 1132. [Google Scholar] [CrossRef]
- Fersi, R.; Mliki, N.; Bessais, L. Hydrogenation and the effect of H absorption on structural and magnetic properties of nanocrystalline Pr2Co7 alloys. J. Magn. Magn. Mater. 2018, 465, 220–227. [Google Scholar] [CrossRef]
- Yamkane, Z.; Fersi, R.; Rachid, F.; Moubah, R.; Lassri, H.; Mliki, N.; Bessais, L. Random magnetic anisotropy studies in nanocrystalline Pr2Co7Hx (0 < x < 3.75) hydrides. J. Magn. Magn. Mater. 2018, 449, 461–466. [Google Scholar]
- Alouhmy, M.; Moubah, R.; Yamkane, Z.; Abid, M.; Lassri, H. Random magnetic anisotropy approach in amorphous Fe(88.4)Zr1(1.6) films: Effects of hydrogen implantation. J. Non-Cryst. Solids 2021, 566, 120879. [Google Scholar] [CrossRef]
- Dunlap, R.; Small, D.; MacKay, G.; O’Brien, J.W.; Dahn, J.R.; Cheng, Z.H. Materials preparation by ball milling. J. Can. Phys 2000, 78, 211. [Google Scholar] [CrossRef]
- Fersi, R.; Cabie, M.; Mliki, N.; Bessais, L. Impact of carbon insertion on the microstructure and magnetic properties of nanocrystalline Pr2Co7 alloys. J. Alloys Compd. 2013, 576, 415–423. [Google Scholar] [CrossRef]
- Gal, L.; Charbonnier, V.; Zhang, J.; Goubault, L.; Bernard, P.; Latroche, M. Optimization of the La substitution by Mg in the La2Ni7 hydride-forming system for use as negative electrode in Ni-MH battery. Int. J. Hydrogen Energy 2015, 40, 17017–17020. [Google Scholar] [CrossRef]
- Fersi, R.; Cabie, M.; Mliki, N.; Bessais, L. Effect of annealing temperature on the microstructure of Pr2Co7 alloys and its hydrogen aborption-desorption kinetics. Int. J. Hydrogen Energy 2019, 44, 22011–22021. [Google Scholar] [CrossRef]
- Rosetti, I.; Ramis, G. Quantification of delivered H2 by a volumetric method to test H2 storage materials. Int J Hydrogen Energy 2013, 38, 13309. [Google Scholar] [CrossRef]
- Zhang, J.; Charbonnier, V.; Madern, N.; Monnier, J.; Latroche, M. Improvement of reversible H storage capacity by fine tuning of the composition in the pseudo-binary systems A2−xLaxNi7 (A = Gd, Sm, Y, Mg). J. Alloys Compd. 2021, 852, 157008. [Google Scholar] [CrossRef]
- Rietveld, H. Line profiles of neutron powder-diffraction peaks for structure refinement. Acta Crystallogr. 1967, 22, 151–152. [Google Scholar] [CrossRef]
- Rietveld, H. A profile refinement method for nuclear and magnetic structures. J. Appl. Crystallogr. 1969, 2, 65–71. [Google Scholar] [CrossRef]
- Michalowicz, A.; Moscovici, J.; Muller-Bouvet, D.; Provost, K. Max: Multiplatform applications for xafs. J. Phys. Conf. Ser. 2009, 190, 012034. [Google Scholar]
- Bez, R.; Fersi, R.; Zehani, K.; Moscovici, J.; Bessais, L.; Mliki, N.; Fonda, E.; Michalowicz, A. Phase stability, EXAFS investigation and correlation between nanostructure and extrinsic magnetic properties of nanocrystalline Pr2(Co,Fe)7. J. Alloys Compd. 2016, 666, 317. [Google Scholar] [CrossRef]
- Ankudinov, A.; Ravel, B.; Rehr, J.; Conradson, S. Real-space multiplescattering calculation and interpretation of x-ray-absorption near-edge structure. Phys. Rev. B 1998, 58, 7565. [Google Scholar] [CrossRef] [Green Version]
- Fersi, R.; Mliki, N.; Cabié, M.; Bessais, L. Intrinsic and extrinsic magnetic properties of nanocrystalline Pr2(Co,Fe)7. Phys. Status Solidi 2014, 211, 910. [Google Scholar] [CrossRef]
- Charbonnier, V.; Zhang, J.; Monnier, J.; Goubault, L.; Bernard, P.; Magén, C.; Serin, V.; Latroche, M. Structural and Hydrogen Storage Properties of Y2Ni7 Deuterides Studied by Neutron Powder Diffraction. J. Phys. Chem. C 2015, 119, 12218–12225. [Google Scholar] [CrossRef]
- Paul-Boncour, V.; Crivello, J.; Madern, N.; Zhang, J.; Diop, L.; Charbonnier, V.; Monnier, J.; Latroche, M. Correlations between stacked structures and weak itinerant magnetic properties of La2-xYxNi7 compounds. J. Phys. Condens. Matter 2020, 32, 415804. [Google Scholar] [CrossRef] [PubMed]
- Provost, K.; Beret, E.C.; Muller, D.; ans, A. Michalowicz, E.S.M. Impact of the number of fitted Debye-waller factors on exafs fitting. J. Phys. Conf. Ser. 2013, 430, 012015. [Google Scholar] [CrossRef] [Green Version]
- Mimault, J.; Fontaine, A.; Lagarde, P.; Raoux, D.; Sadoc, A.; Spanjaard, D. Elastic core effect and clustering tendency by EXAFS in as-quenched Al-Zn alloys. J. Phys. F Met. Phys. 1981, 11, 1311. [Google Scholar] [CrossRef]
- Iwase, K.; Mashii, S.; Mori, K. Hydrogenation characteristics of Ce2Ni7-type La2Co7 and its phase transformation during hydrogen absorption-desorption processes. J. Solid State Chem. 2021, 299, 122201. [Google Scholar] [CrossRef]
- Néel, L. Relation entre la constante d’anisotropie et la loi d’approche à la saturation des ferromagnétiques. Rep. Prog. Phys. 1948, 9, 148. [Google Scholar] [CrossRef]
- Masrour, R.; Jabar, A.; Khlif, H.; Jemaa, F.B.; Ellouze, M.; Hlil, E.K. Experiment, mean field theory and Monte Carlo simulations of the magnetocaloric effect in La0.67Ba0.22Sr0.11MnO3 compound. Solid State Commun. 2017, 268, 64. [Google Scholar] [CrossRef]
- Herzer, G. Grain Size Dependence of Coercivity and Permeability in Nanocrystalline Ferromagnets. IEEE Trans. Magn. 2020, 1397, 26. [Google Scholar]
- Bouzidi, W.; Mliki, N.; Bessais, L. Second-order magnetic transition and low field magnetocaloric effect in nanocrystalline Pr5Co19 compound. J. Electron. Mater. 2018, 47, 2776–2781. [Google Scholar] [CrossRef]
Publisher’s Note: MDPI stays neutral with regard to jurisdictional claims in published maps and institutional affiliations. |
© 2022 by the authors. Licensee MDPI, Basel, Switzerland. This article is an open access article distributed under the terms and conditions of the Creative Commons Attribution (CC BY) license (https://creativecommons.org/licenses/by/4.0/).

