Article

A Novel Method of Flow Curve Measurement for Magnetic Fluid Based on Plane Poiseuille Flow

1
School of Mechanical Electronic and Control Engineering, Beijing Jiaotong University, Beijing 100044, China
2
School No. 80 High School, Beijing 100102, China
3
Hebei Industrial Robot Industry, Technology Research Institute, Tangshan 063010, China
4
State Key Laboratory of Tribology, Department of Mechanical Engineering, Tsinghua University, Beijing 100084, China
*
Author to whom correspondence should be addressed.
Magnetochemistry 2022, 8(9), 98; https://doi.org/10.3390/magnetochemistry8090098
Submission received: 30 June 2022 / Revised: 19 August 2022 / Accepted: 2 September 2022 / Published: 5 September 2022
(This article belongs to the Special Issue Advanced Applications of Magnetic Field-Responsive Fluid)

Abstract

:
Accurate measurement of the flow curves of magnetic fluid under a uniform field has always been a challenge. In this article, a novel method is proposed to measure the flow curve of magnetic fluids based on plane Poiseuille flow. The measuring system was built and its performance was compared with that of a commercial rheometer. Flow curves of magnetic fluid with different zero-field viscosity were tested under various field strengths. This novel method facilitates direct observation of the flowing behaviors of magnetic fluid under different stresses. By examining the variation trend of viscosity under certain constant stress, a more reliable method to determine the dynamic yield stress of magnetic fluid was used. The dynamic yield stress of the magnetic fluid measured by the new method was larger than the value obtained by the fitting, which is more reliable from an engineering point of view.

1. Introduction

Magnetic fluid is a colloid composed of nano-magnetic particles, surfactants, and carrier fluid. The combination of the particle and surfactant guarantees its stable dispersion in the carrier fluid. As a new kind of nano-functional material, magnetic fluid simultaneously exhibits the fluidity of liquids and the magnetism of solid magnetic materials [1]. Due to its unique characteristics, magnetic fluid has been widely used in biomedical applications [2], energy applications [3], mechanical applications [4], manipulation and transport of matter [5], heat transfer [6].
As the research has gone further, people have realized that these applications of magnetic fluid are closely related to its rheological properties, especially the rheological properties under the action of a magnetic field. In magnetic hyperthermia, the increase in solution viscosity leads to a decrease in the heating rate of the nanoparticle solution [7]. Li et al. [8] have shown that viscosity is the decisive factor of the critical pressure value for magnetic-fluid seal in the water environment. In a thermo-magnetic pump, the magnetic fluid with lower viscosity can more effectively induce thermo-magnetic convection, thereby obtaining higher performance [9,10].
Of all the rheological measuring items, the flow curve is one of the most convenient and commonly adopted test types to characterize the overall rheological properties of magnetic fluid. With or without an external magnetic field, the flow curve can be obtained by measuring the viscosity under different shear rates or shear stresses. The flow curves of the magnetic fluid provide a variety of information on its magnetorheological properties, such as magnetoviscous effect, shear-thinning, and yielding, which are vital for the simulation and application of magnetic fluid. Various methods and measuring apparatus were reported to measure the flow curve of magnetic fluid. Gu et al. [11] measured the viscosity of the water-based magnetic fluid under different conditions with an Ubbelohde viscometer. The effects on viscosity of the magnetic-particle-volume fraction, surfactant-mass fraction, and temperature were studied. They found that the viscosity of the magnetic fluid increased with the increase in the volume fraction of the suspended magnetic powder, increased with the increase in the mass fraction of the surfactant, and decreased with the increase in temperature. Yang et al. [12] studied the magnetoviscous properties of both dilute and concentrated ferrofluids with a torsional oscillation cup viscometer, the study found that the relative magnetic viscosity hysteresis coefficient is positive in a high magnetic field under a horizontal toroidal magnetic field, and it is negative under the magnetic field. Yoshiyuki Matsuno et al. [13] used a lab-made capillary experimental device to draw the flow curve of the water-based magnetic fluid with and without the interaction of the magnetic field and the flowing vorticity, and studied the dynamic yield stress of the water-based magnetic fluid. They found that it was relatively small, and the calculated value was higher than the experimental value. Ren et al. [14] also used a lab-made rheometer to measure the viscosity of a sample, where the fluid was in the form of a ring, which allowed the magnetic field to be more evenly distributed in the fluid, and the measurement data were more accurate and reliable. Li et al. [15] used an MCR 302 rotational rheometer(Anton Paar, Graz, Austria) to study the effects of different factors on the thixotropy of magnetic fluid, including particle concentration, magnetic flux density, shearing time, and temperature. The research results showed that under the action of a magnetic field, a magnetic fluid with a sufficiently high particle concentration could exhibit obvious thixotropic behavior, which was related to the gradual destruction and reconstruction of drop-like and chain-like structures.
However, both the reported capillary and rotational measuring systems have certain limitations in measuring the flow curve of magnetic fluid. As the capillary measuring system was based on the continuous Poiseuille flow and the magnetic field is usually exerted on part of the flowing sample, the nonuniformity of the magnetic field at the edge of the coil will induce inevitable errors. The commercial rotational rheometer itself is of relatively high accuracy and versatility. However, the magnetic field of the commercial rheometer is generated by the equipped magnetic field module, which is essentially the magnetic field generated by a single electromagnet. Compared with the Helmholtz coils or paired electromagnets, the uniformity of the magnetic field of commercial rotational rheometer is relatively poor. In addition, thorns will occur in the tested magnetic fluid at the edge of the rotating rotor under a vertical magnetic field, owing to the instability of the surface of the magnetic fluid. As the surface contact between the magnetic fluid and the measuring rotor is uneven, the measurement data can be unstable during the flow curve measurement process.
Dynamic yield stress has always been one of the most commonly used rheological concepts in academia and industry. The definition of dynamic yield stress is based on the assumption that the ultimate stress exists before flow. When the applied stress is less than the ultimate stress, the sample exhibits a solid-like characteristic, that is, the sample produces a fully recoverable deformation [16]. In actual tests, the shear stress is usually directly extrapolated to the zero of the abscissa of the flow curve, or the flow curve is fitted with a related rheological model to determine the dynamic yield stress. However, the dynamic yield stress measured by this method is often determined subjectively. How to define dynamic yield stress is still a hot issue in rheology [17]. Based on the observation experiment of the equilibrium structures, Zubarev [18] proposed a drop model to explain the mechanics behind the dynamic yield stress of magnetic fluid. When a magnetic field is perpendicular to the flow field of the magnetic fluid, the large columnar structure inside the magnetic fluid is approximately a drop-like structure that is elongated under the action of the magnetic field. In the rheological measurement gap, the drop-like structure is connected to the upper and lower surfaces of the measuring fixture, and its destruction process leads to obvious yield stress under certain measurement conditions.
Based on some of the problems of existing measurement methods, a specially designed measuring system and related measuring method are proposed. Differently from traditional measurement methods, the new method use slope measurement. During the measurement process, the flow of fluid is always under its gravity component along the plane, thus leading to more stable and reliable results, and the visualization of the flow makes the result more intuitive. In order to ensure the uniformity of the magnetic field, a movable magnetic field compensation is necessary. As far as we know, a specially designed device to keep the sample under the uniform magnetic field zone had not been proposed prior to this study.
In this study, a new novel measuring system is proposed and the flow curves of two magnetic fluids with different viscosities are studied. The test results are compared with those measured by a commercial rotational rheometer under the same conditions. The reason behind the difference in both results is analyzed and discussed. By examining the variation trend of viscosity under a certain constant stress, a more reliable method to determine the dynamic yield stress of magnetic fluid was used. Because of its visualization, the novel method can provide more detailed information during the test process. This will help to better understand the complex rheological properties of magnetic fluids and will promote further research.

2. The Novel Measuring System

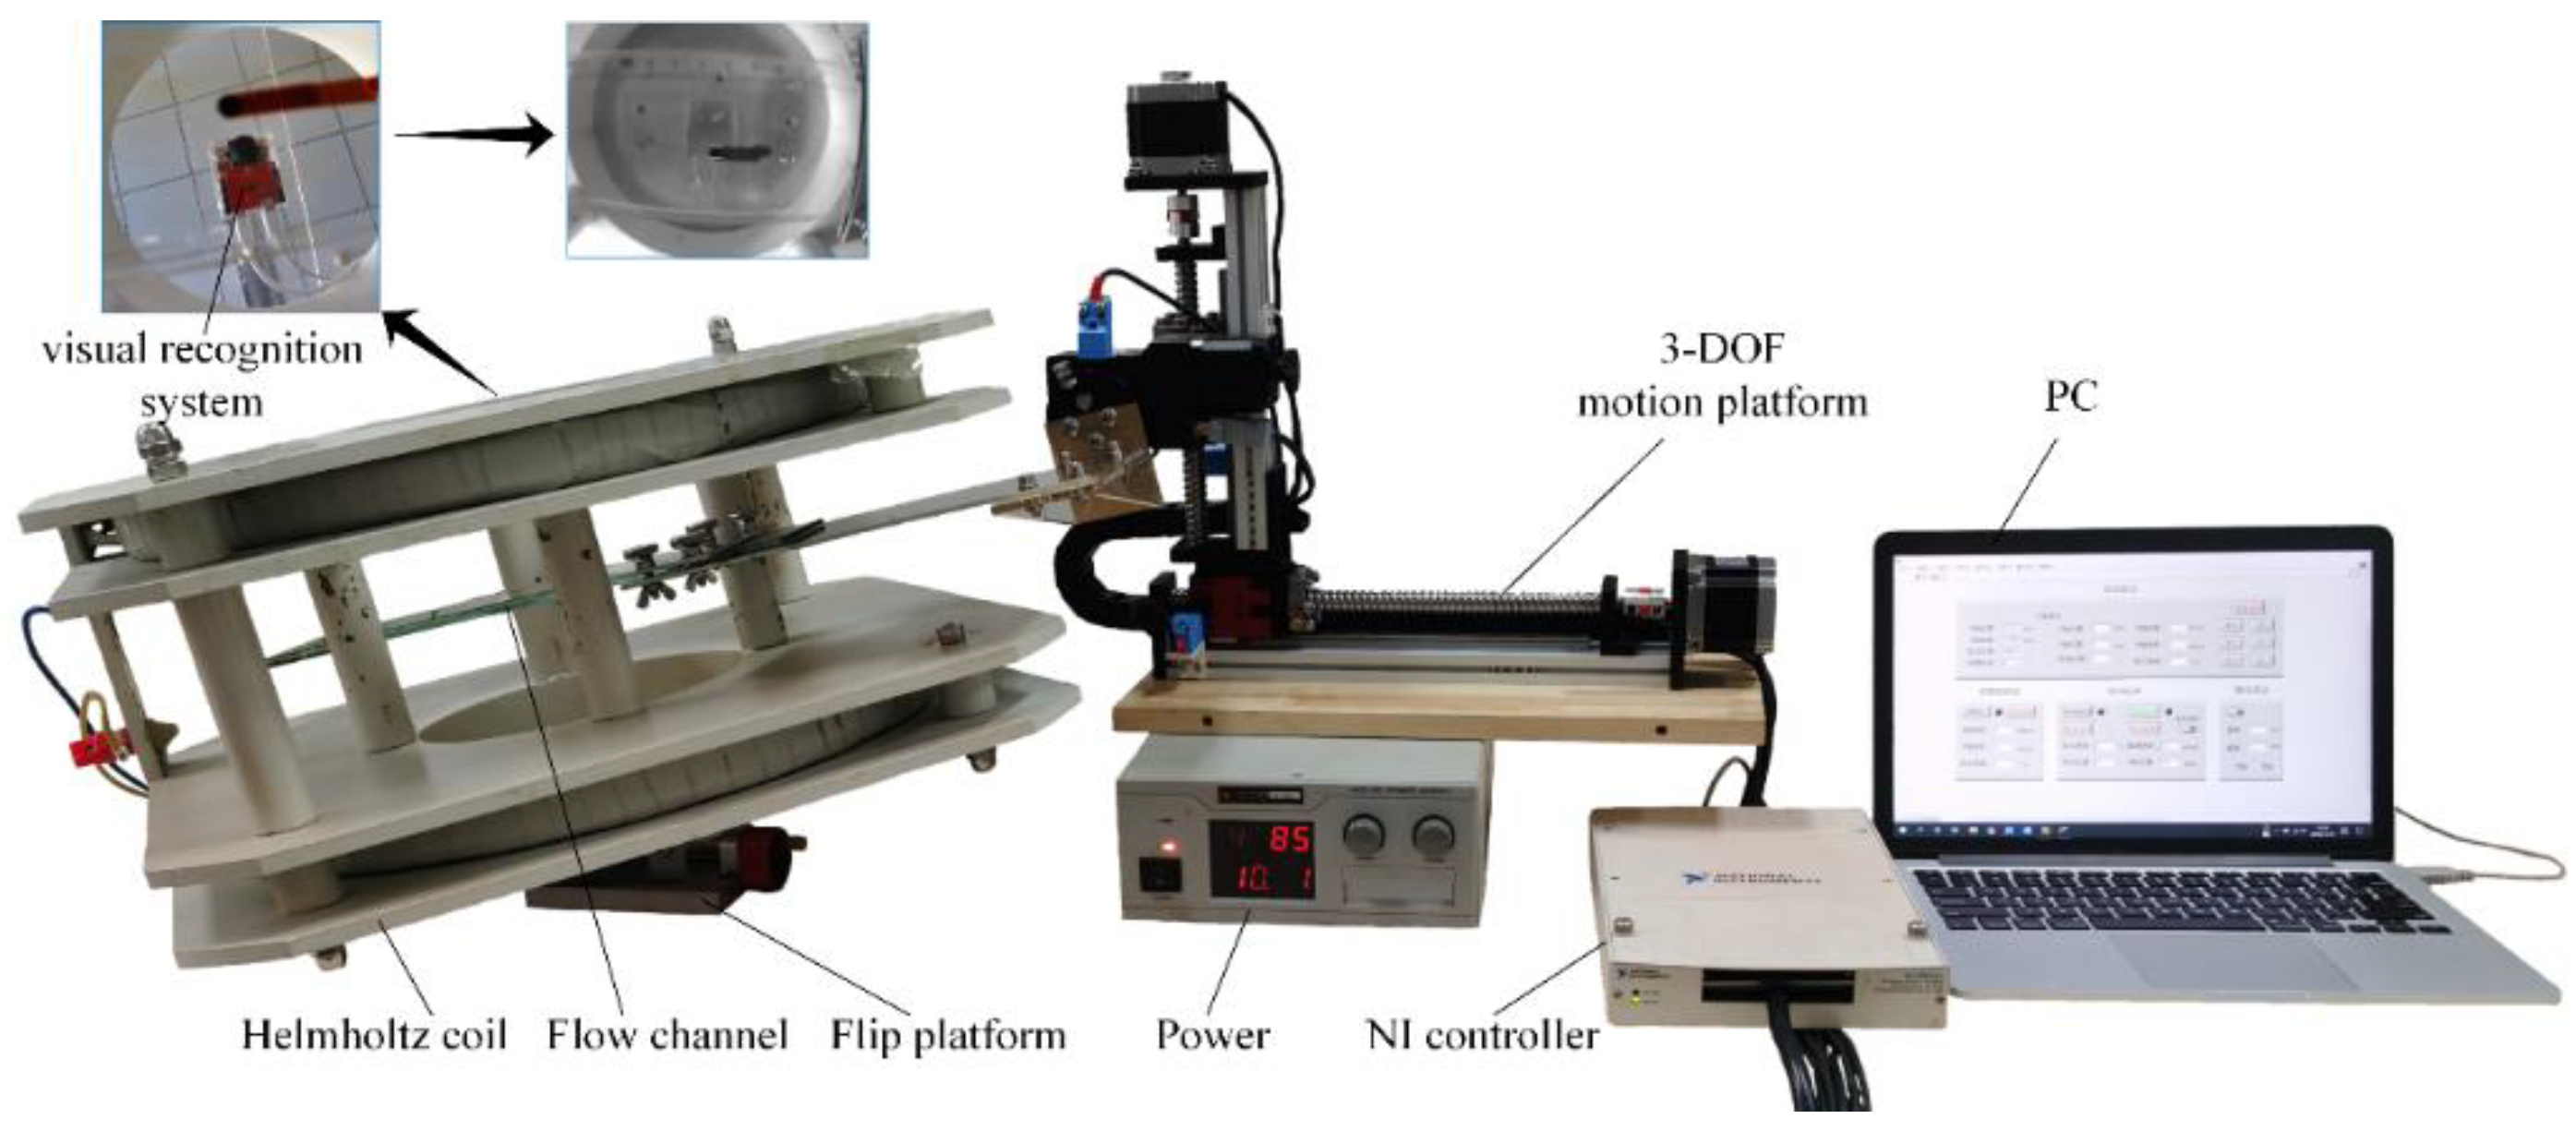
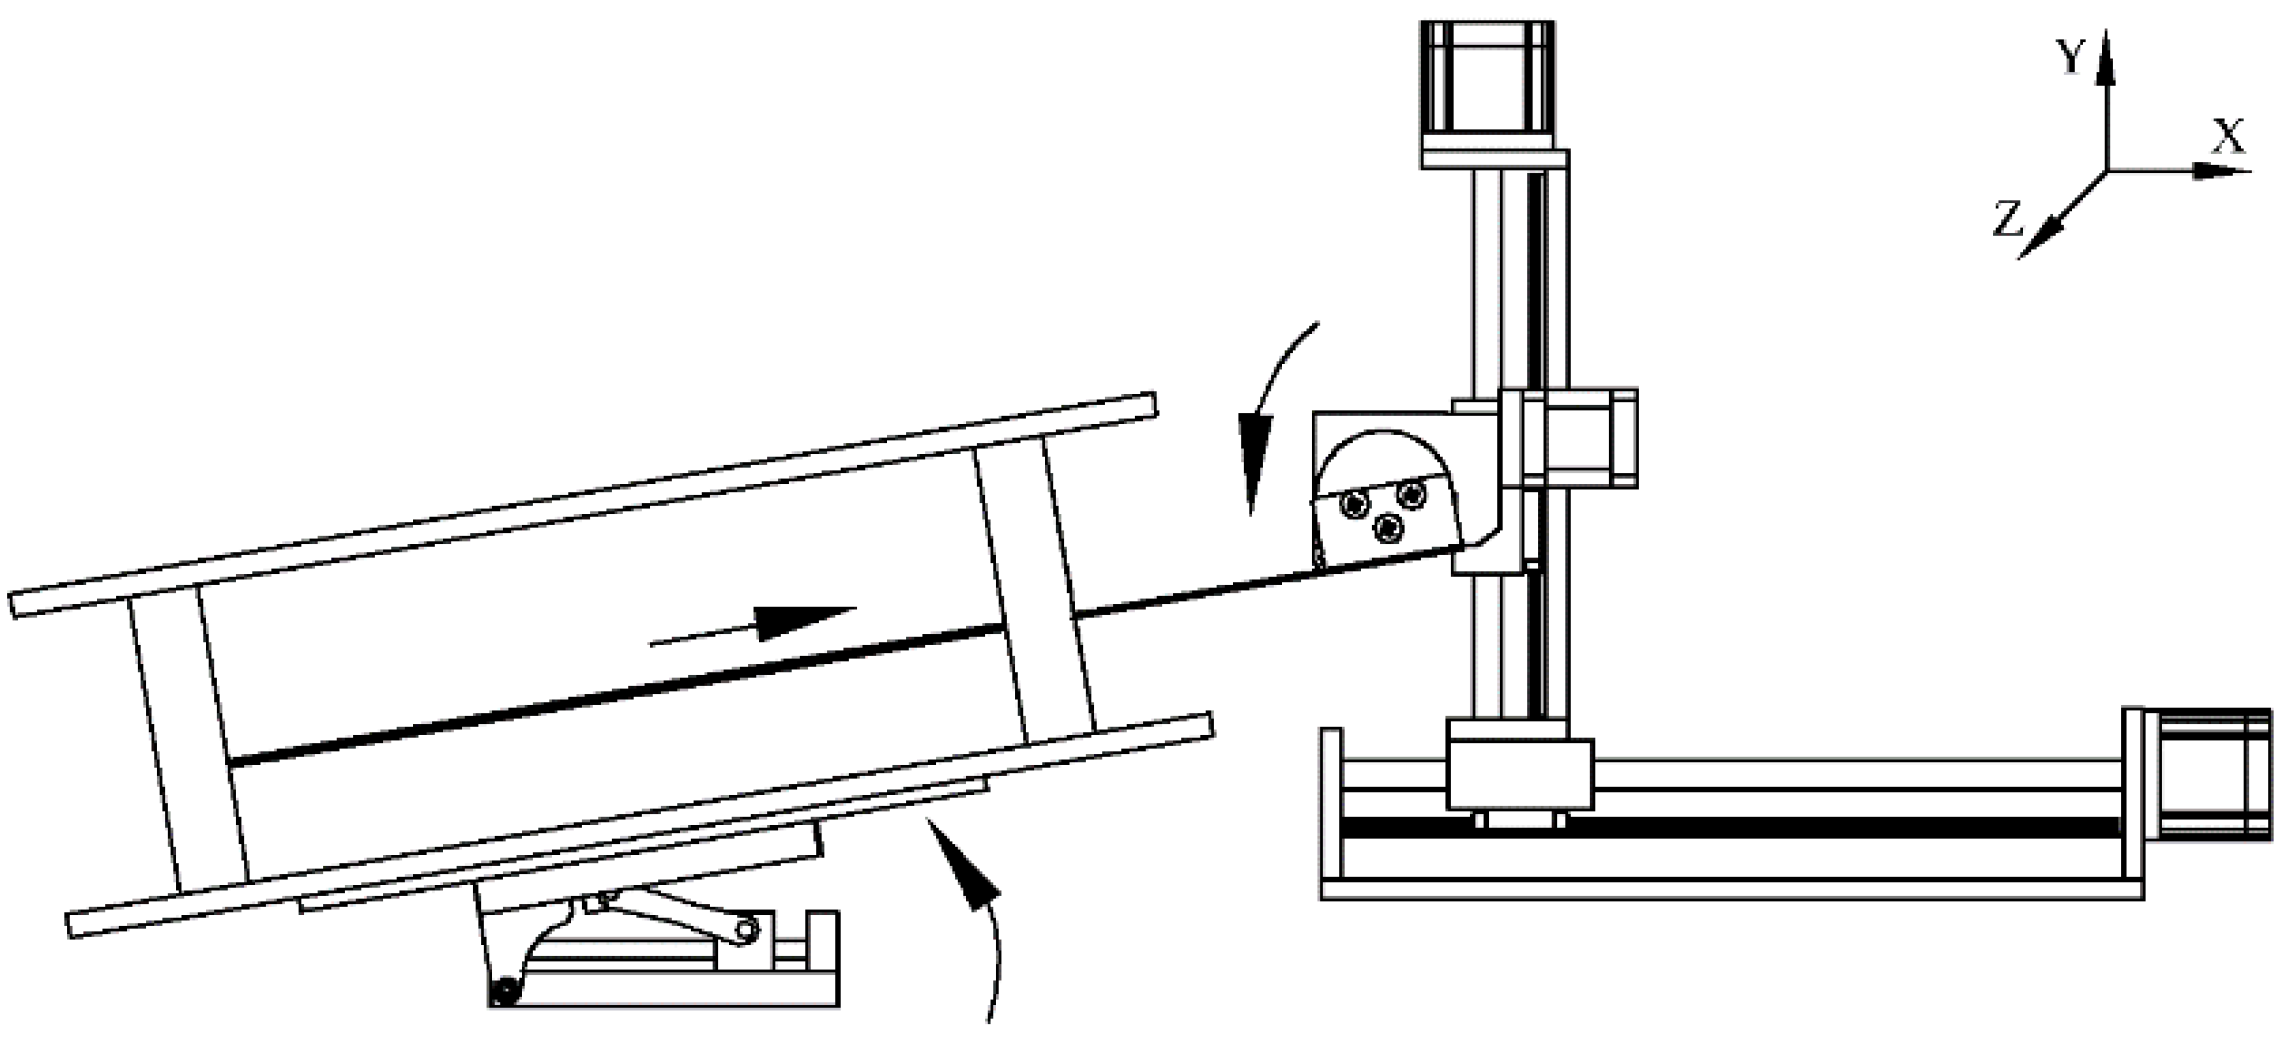
2.1. Components of the System

The novel measuring system consists of a three-degree-of-freedom (3-DOF) motion platform, a flow channel, a Helmholtz coil with a flip platform, a NI controller, and a visual recognition system. The configuration of the novel measuring system is presented in Figure 1.
The 3-DOF motion platform includes an X-axis movement, a Y-axis movement, and a Z-axis rotation, which are driven by stepping motors. To improve the measurement accuracy, a small absolute encoder is installed inside the motor. The flow channel is composed of two transparent polytetrafluoroethylene (PTFE) plates, separated by a gap-adjustment gasket. Selecting different gaskets with different thicknesses leads to the adjustment of the gap according to the viscosity of the measuring sample. The flow channel is fixed on the Z-axis of the 3-DOF motion platform, which passes through the center of the Helmholtz coil. The magnetic field is generated by the Helmholtz coils, which are composed of a pair of identical, coaxial, and parallel closely wound current coils with 2000 turns. The maximum central magnetic field reaches 24 kA/m. A laser displacement sensor is installed at the bottom of the Helmholtz coil to detect the position of the flow channel in the vertical direction inside the Helmholtz coil. The turning platform is used for the rotation of the Helmholtz coil, which can be rotated with the change of the angle of the flowing channel.
We use an OPEN MV4 H7 smart camera (OpenMV LLC, Atlanta, GA, USA) as a visual recognition system to track and locate the magnetic fluid. The system is equipped with a MicroPython interpreter and the recognition program is written by Python (Python 3.0, Guido van Rossum, San Francisco, CA, USA). Grayscale is adopted in the visual recognition system for color recognition. As the threshold value of the magnetic fluid is within 10–28, and the threshold value of the flow path is greater than 40, it is easy to determine the position of the magnetic fluid. After the magnetic fluid is selected by the frame, the frame position information is automatically generated and transmitted to the PC via serial communication. The system is controlled by a Data Acquisition Card NI-6250 built by NI Control. The rotation of the stepper motor, the document of the position of the motor, and the data of the visual recognition system is integrated and coordinated in the LabView platform(Labview 2018, National Instruments, Austin, TX, USA). There are two control modes to choose from manual mode and automatic mode. While manual mode can realize single-point viscosity measurement, multi-point viscosity measurement and the depiction of the flow curve can be conducted under automatic mode.

2.2. Rheological Model

Round cross-section capillaries are widely used in the measurement of Newtonian fluid viscosity, and the slit capillary is particularly proposed and adopted for the measurement of non-Newtonian fluid [19]. In this study, magnetic fluid flows in an approximate slit geometry, which conforms to Poiseuille’s law.
Laminar flow forms in the magnetic fluid sample between two parallel inclined plates, Figure 2 shows the velocity distribution and geometric diagram.
Under its gravity component along with the inclined plane, the magnetic fluid sample flows down along the inclined direction. The flow of magnetic fluid can be regarded as the flow of many concentric strips, and the viscous resistance caused by any layer of fluid constitutes a balance with external forces.
2 K L τ = ( K 2 h ) Δ p
where K is the width of the contact surface between magnetic fluid and parallel plate, 2h is the spacing between parallel inclined plates, among them, K h, L is the distance that the magnetic fluid flows, and Δp is the pressure drop caused by the height difference between the two ends of L in parallel inclined plates [19].
The average shear stress of the sample is
τ = ( 2 h 2 L ) Δ p = ρ g h sin α
Based on the assumption of the formation of a uniform flow field in the sample, the average shear rate can be calculated as
γ ˙ = [ 6 K ( 2 h ) 2 ] Q = 3 Q 2 K h 2
where Q is the flow rate of the magnetic fluid. Then the viscosity of the magnetic fluid is
η = τ / γ ˙ = 2 K h 3 ρ g sin α 3 Q

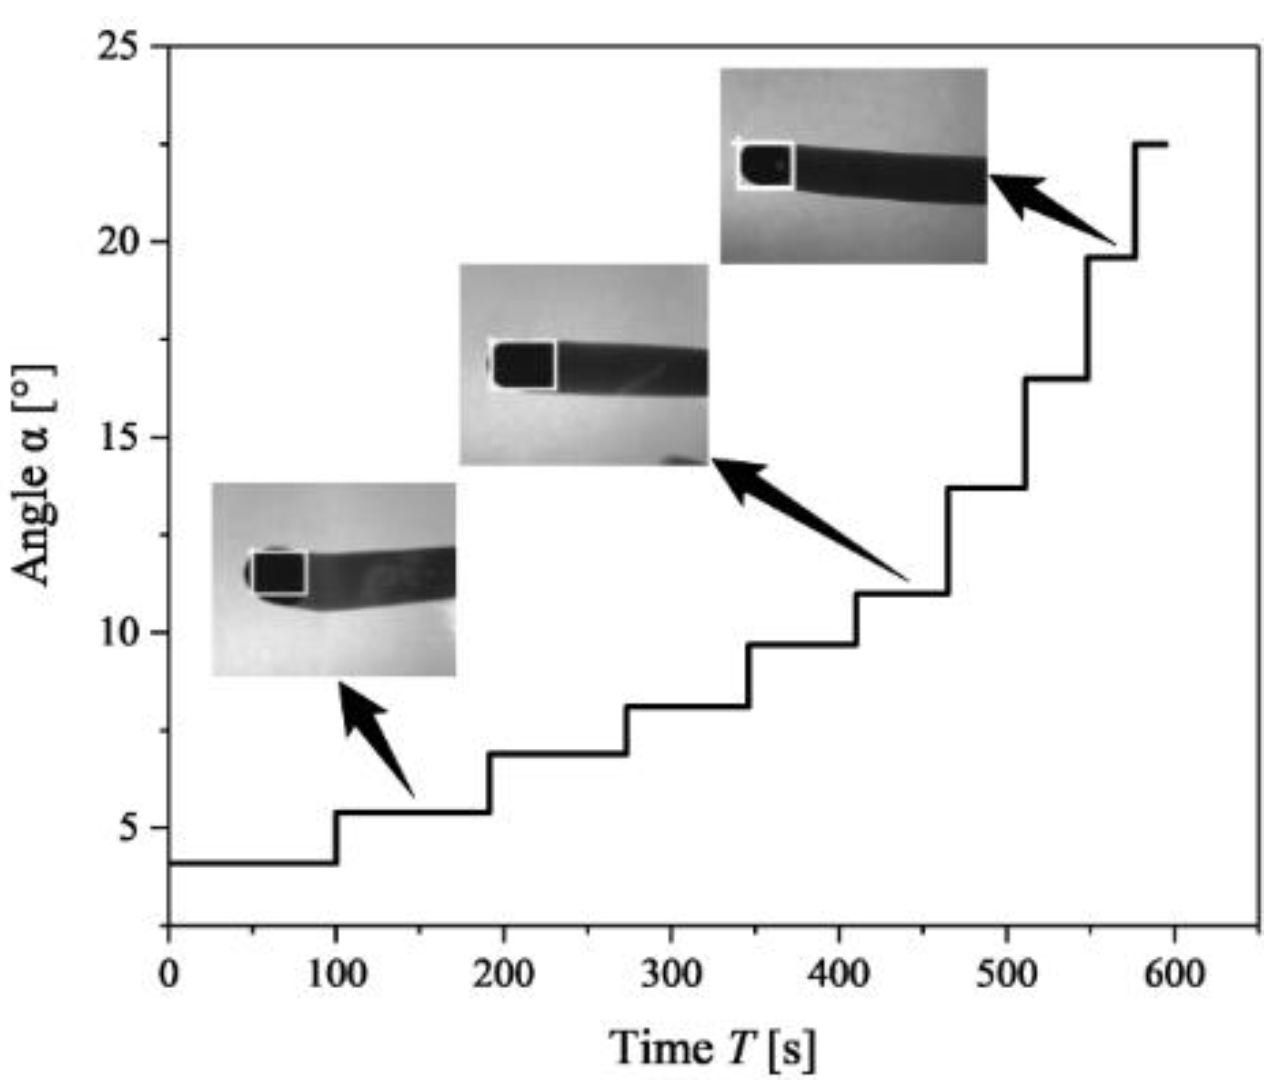
2.3. Measuring Procedure and Details
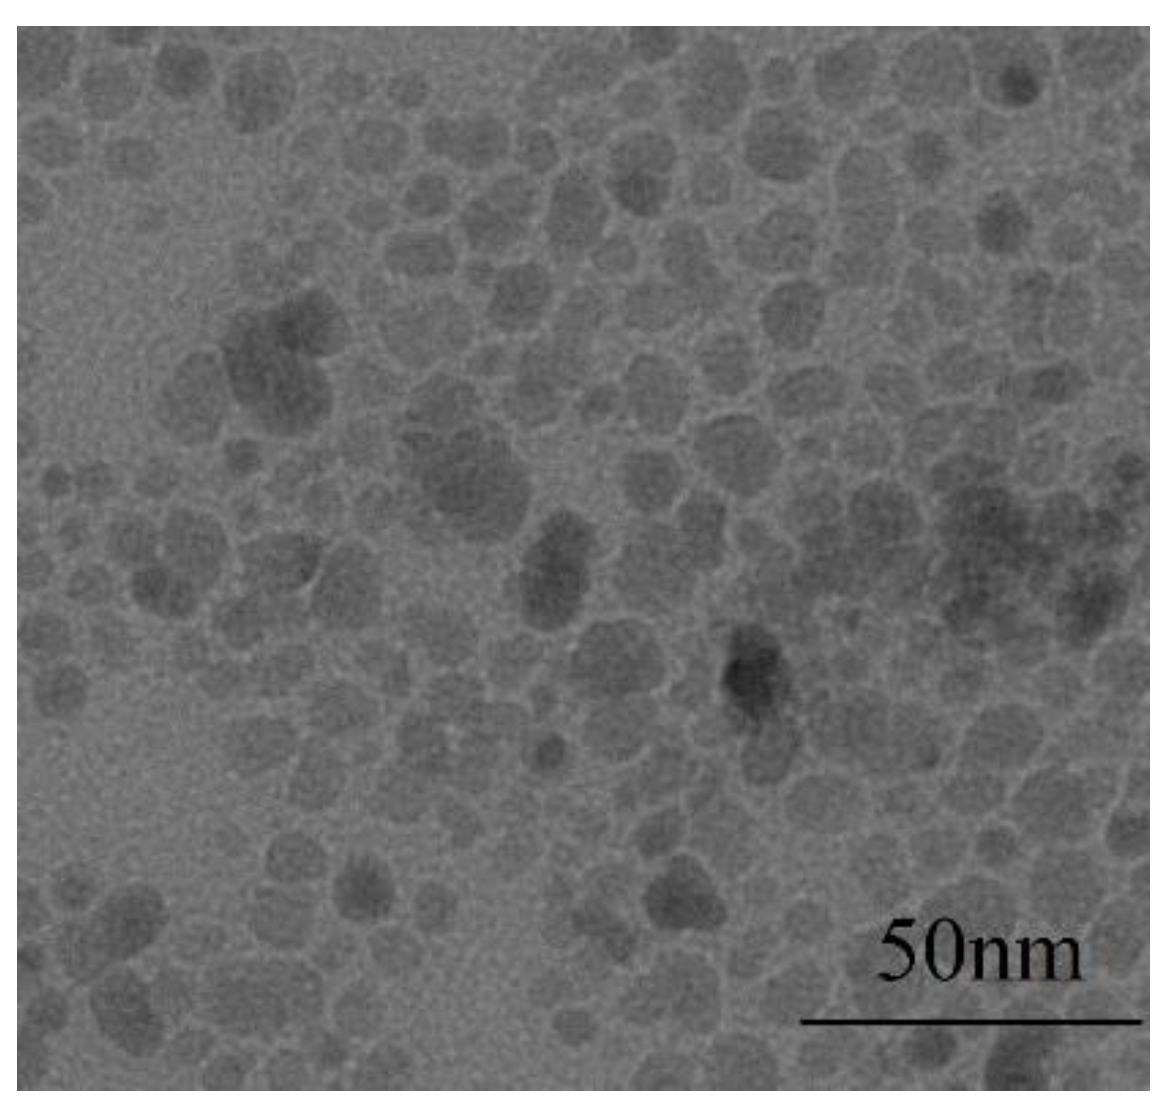
Measuring was conducted according to the following procedure: The experiment was carried out in a constant-temperature room, and the temperature was set to 20 °C. Before measuring, we used base carrier fluid to pre-wet the PTFE flow channel to change the flow performance of the magnetic fluid [21] and prevent excessive adhesion of the magnetic fluid to the flow channel during the flow process. Before each test, the flow channel and the Helmholtz coil were adjusted to the horizontal position automatically by the control system and then the starting point of the flow channel was moved to the center position of the Helmholtz coil in both horizontal and vertical directions, with the help of a laser displacement sensor placed under the coil and the Y-axis movement of the 3-DOF motion platform. After a stable magnetic field was acquired by preheating the coil for 0.5 h, a syringe was used to inject a certain amount of magnetic fluid into the flow channel composed of two parallel plates. It is worth noting that the appropriate measurement gap should be selected according to the estimated viscosity of the measured sample. For each test in this paper, the gap between the PTPE plates was 1 mm and the volume of the magnetic fluid was 0.3 mL. After that, the flow channel was kept horizontal, and the magnetic fluid was placed under the magnetic field for 120 s to form a stable structure inside, and then the measurement is started. During the measurement, the synchronous motion of the 3-DOF motion platform and the flip platform are accomplished by the sensing and control system, so that the magnetic field will always be perpendicular to the sample layer, as shown in Figure 3.
The system controls the flow channel to deflect a certain angle, and the magnetic fluid will flow downward in an inclined direction. At this time, the visual recognition system monitors the position of the magnetic fluid and calculates its flow speed in real-time based on the distance that the magnetic fluid flows within a certain period of time. Due to the inhomogeneity of the magnetic field generated by the Helmholtz coil system, and to facilitate the visual recognition system to locate the magnetic fluid, the magnetic fluid must flow in a region of uniform magnetic flux density. By using a Gauss meter, the deviation of the magnetic flux density within the radius of 40 mm from the center of the coil was within 1.3%, and this area was regarded as a uniform magnetic field. Such a small test area is not sufficient for multi-point data measurement, which requires the flow channel to move in the opposite direction of the flow of the magnetic fluid. The movement of the flow channel can be decomposed into movement along the X-axis and Y-axis, which are operated by the 3-DOF motion platform. During the flow process, the moving speed of the flow channel is adjusted according to the flow rate of the magnetic fluid calculated by the system. The system records the flow time and flow a distance of the magnetic fluid at the same time. After it flows through the set distance, the Helmholtz coil and the flow channel will rotate to a new angle. During the rotation, the Y-axis will also follow the movement, so that the flow channel is at the center of the Helmholtz coil in the vertical direction. Through multiple angle changes of the flow channel, the system will calculate and draw a complete flow curve.
The measurement time and flow images of different angles are shown in Figure 4. The flowing image clearly shows the position and flow trace of the magnetic fluid. The magnetic fluid can be easily identified by the system. As the angle increases, the color of the flow trace gradually darkens. When the flow trace threshold is close to the color threshold of the magnetic fluid, an external auxiliary light source is adopted to increase contrast.

2.4. Materials

Two magnetic fluids with different viscosities were used for comparative experiments. The physical parameters of the two samples are shown in Table 1.
The low zero-field viscosity sample EFH1 produced by Ferrotec was chosen as the commercial magnetic fluid, the high zero-field viscosity sample was from a lab-made oil- based magnetic fluid.
The basic steps for preparing the magnetic fluids are the synthesis of nanoparticles and their distribution in the base carrier fluid; the detailed preparation process has been reported elsewhere [22]. The co-precipitation method was used to synthesize the nano-powder, and oleic acid was selected as a surfactant. The base carrier fluid was L-AN46 total loss system oil produced by China Petroleum & Chemical Corporation, and its basic parameters are shown in Table 2.
The morphology of the prepared Fe3O4 nanoparticles was characterized by transmission electron microscopy (TEM). As shown in Figure 5, the polydispersity of nanoparticles can be seen through TEM images, and the size of nanoparticles was approximately 10 nm.
Figure 6 shows the magnetization curve of a lab-made magnetic fluid sample measured by a vibrating sample magnetometer (VSM). It can be seen that there is no obvious coercivity and remanence in the hysteresis loop, which indicates that the prepared Fe3O4 magnetic particles are mainly single-domain small particles, and the content of multi-domain large particles is very small. The saturation magnetization of the sample can be read from the maximum of the curves as 26.4 kA/m.

3. Results and Discussion

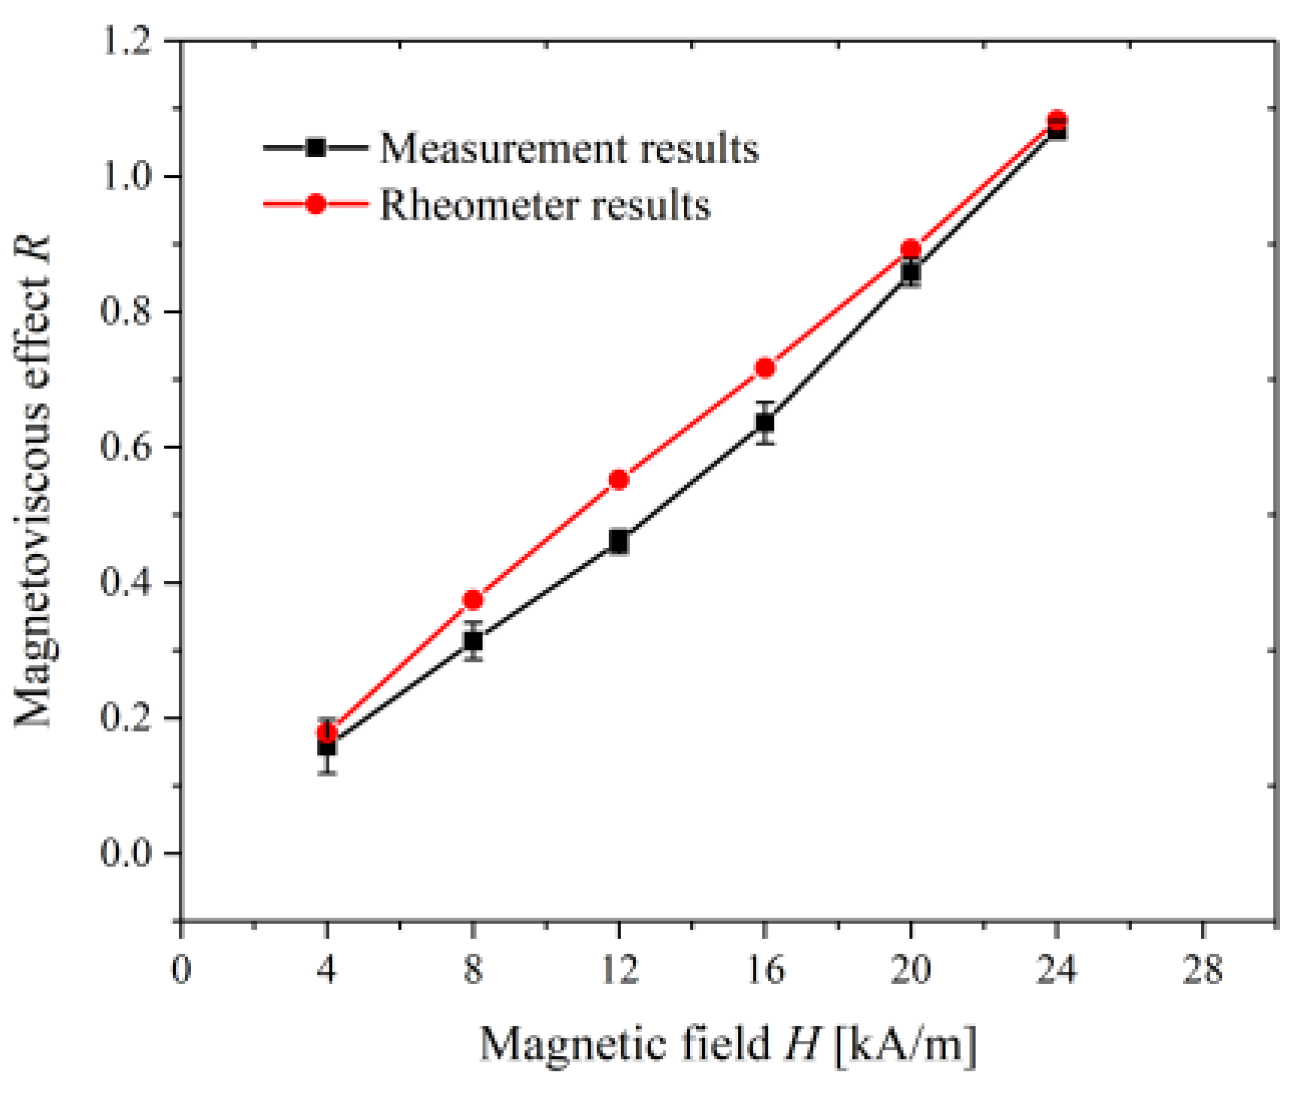
3.1. Commercial Magnetic Fluid Measurement

Figure 7 shows the difference in results between the novel measuring system and the commercial rheometer. In the commercial rheometer measurement, we used the stress-control mode to measure the viscosity of the EFH1-type magnetic fluid. The plate-plate method of 20 mm and a measuring gap of 0.2 mm was selected, the measurement time of each point was 30 s. With the commercial rheometer, the measuring viscosity decreased with the increase in the shear rate and finally approached a constant. It is worth noting that a significant non-Newtonian characteristic appeared in the sample even under zero magnetic field. Using the novel method, the viscosity remained relatively stable under zero field, and there was a gentle decreasing trend of viscosity with shear rate under magnetic flux density of 24 kA/m. In contrast, under zero magnetic field intensity, the result of the novel measuring system was closer to a certain value. Under 24 kA/m magnetic field intensity, the measurement result showed the non-Newtonian and shear thinning phenomenon of the sample. According to the zero-field viscosity value provided by the factory, the results measured by the novel system seemed to be closer to the factory value.
The commercial rotational rheometer measures the rotation of the rotor driven by DC motor through a grating encoder. The rheometer program presets a certain torque value, measures the resulting rotor speed, converts the two into shear stress and shear rate, and obtains the corresponding viscosity value [22]. In the actual measurement process, the resistance torque generated inside the low-viscosity magnetic fluid is much smaller than that of the high-viscosity magnetic fluid. At the same time, the drive motor itself also has a certain moment of inertia. When measuring low-viscosity magnetic fluid, the moment of inertia of the instrument itself is greater than the resistance torque of the magnetic fluid. Although the moment of inertia of the instrument will be removed from the result, the measurement error of the instrument will have a large effect on the measurement result. The novel measuring system is free from the influence of the motor inertia, as the shear stress of the measuring system is generated by the gravity of the magnetic fluid. This may be the main reason behind the difference in the viscosity value and trend between the results from different measuring methods. There was a certain difference between the measured value and the factory value, which may have been due to the influence of the material of the flow channel. The contact angle of the magnetic fluid on the flow channel was small, and the magnetic fluid was not uniformly distributed in the gap, which destroyed the flow model and causes the fluidity to deteriorate. By pre-wetting, the surface of the flow channel, the flow integrity of the magnetic fluid can be improved.
Under the magnetic flux density of 24 kA/m, the measurement result acquired from different setups was significantly greater than the viscosity measured under zero field, indicating the existence of a magnetoviscous effect. Compared with the rheometer, the viscosity versus shear rate curve measured by the new measuring system had a smoother downward trend. Since the measuring shear rate was in the range of 60 s−1 to 275 s−1, the structural form of the magnetic fluid manifested as single chains. The reduction in the length of the chain was relatively small, therefore a weak shear thinning effect was expected. The shear-thinning extent shown from the results of the rheometer was overestimated, which may have been caused by the uneven distribution of the magnetic field under the measuring geometry. With the help of the tracking modulus of the novel measuring system, the magnetic fluid can be kept in the center of the Helmholtz coils where the homogeneity of the magnetic field is more than 95%, so the shear-thinning extent reflected by the curve of the novel measuring system is believed to be more objective.

3.2. Lab-Made Magnetic Fluid Measurement

The basic rheological properties of the lab-made magnetic fluid under different magnetic flux densities can be seen in Figure 8. The difference between the flow curves measured by the rheometer and the novel measuring system was rather small, as can be seen in Figure 8a, where the rheometer measurement curve is individually marked in the legend. When the rheometer measures high-viscosity magnetic fluids, the resistance torque generated inside the high-viscosity magnetic fluid is much greater than the moment of inertia of the drive motor itself, so the measurement results are more accurate and reliable. As the measurement time of the novel measuring system increased, the influence of the contact angle on the flow performance decreased, and the measurement accuracy improved, when the novel measuring system measured high-viscosity magnetic fluids. The closeness of the two curves illustrates the accuracy of the measurement results of the novel measuring system. As the intensity of the magnetic field increased, the viscosity of the magnetic fluid also increased, manifesting as the increase in the slope of flow curves.
Based on the flow curves measured by shear rate or shear-stress sweep, the dynamic yield stress of soft matter is usually determined by fitting on a certain phenomenological rheological model [23]. In experimental rheology, the dynamic yield stress τ0 of magnetic fluid is most frequently determined by the fitting of the Herschel–Bulkley (H–B) model.
τ = τ 0 + k γ ˙ n
where k is the viscosity coefficient and n is the flow index.
With a maximum number of iterations of 400, the fitting results based on the H–B model were acquired, as shown in Table 3. Under the action of the magnetic field, with the increase of the magnetic field intensity, the k and n of the fitting result increased, indicating an enhancement in the degree of shear thinning. The fitted dynamic yield stress under the 8 kA/m and 16 kA/m magnetic fields was very small or even negligible, while the fitted dynamic yield stress was 10 times larger than the former two under the 24 kA/m magnetic field. It seems that significant yielding behavior only performs when the magnetic flux density is beyond a threshold. As the result of the fitting depends on the choice of the range of shear rate points, the dynamic yield stress of the magnetic fluid reflects the mathematic relation of the measuring results and a specified model, while the definition of dynamic yield stress is the minimum shear stress required for the breakage of the internal equilibrium structure of the material and formation of steady flow, which is free from the influence of the overall trend of the flow curve. Therefore, the fitting result cannot represent the true dynamic yield stress, and a more convincing method is needed.
Figure 8b shows the change of magnetic fluid viscosity under low shear stress at 24 kA/m by the novel measuring system. The points under very low shear stress in the measurement of a flow curve can be seen in Figure 8a. Before each test, the magnetic fluid was placed for a while under the corresponding magnetic field. During the period, the magnetic particles in the magnetic fluid combined and finally formed an equilibrium columnar structure connecting the upper and lower surfaces of the measuring fixture. The viscosity curve of the magnetic fluid under different stresses showed a significant peak in the initial stage, this may have been due to the response of the internal structure of the sample to stress changes. Measurement errors also have a certain impact on the occurrence of the peak in the curve. Under the action of a 24 kA/m magnetic field, the lab-made magnetic fluid exhibited obvious viscous bifurcation, which can be seen from the different trends in the viscosity curves under various shear stresses. When the shear stress was less than 0.5 Pa, the magnetic fluid aged over time and its viscosity continued to increase. Since large columnar structures arranged in a magnetic fluid are always dynamically adjusting under certain stress, and the duration of the process was very long, with the viscosity versus time monotonically increasing in the measurement range. When the shear stress was greater than 0.5 Pa, the viscosity of the magnetic fluid finally reached an equilibrium value, indicating that the magnetic fluid had undergone shear regeneration and that a stable flow state had finally been reached. It can be inferred that the dynamic yield stress of the magnetic fluid was 0.5 Pa, and the internal structure of the magnetic fluid was dominated by a chain structure at this time.
During the measurement process, the viscosity of the magnetic fluid decreased with the increase of the shear stress under different magnetic fields, as can be seen in Figure 9.
The stronger the magnetic field, the more obvious the shear thinning characteristics. It can be learned from the chain model [23] that the magnetoviscous effect is mainly caused by the resistance on the flow field by the single-chain structure composed of magnetic particles. As the single-chain structure decomposes into smaller units under high shear stress, the magnetic fluid shows the characteristics of shear thinning. The magnetic flux density determines the average length and number of single-stranded structures and affects the degree of shear-thinning of the magnetic fluid.
In practical applications, what is of importance is not the absolute viscosity, but the viscosity change caused by external influences. The magnetoviscous effect R of the magnetic fluid is defined as the ratio of the viscosity change to the initial viscosity [24].
R = η ( H ) η ( H = 0 ) η ( H = 0 ) = η r η 0
When the shear stress was 1.5 Pa, the magnetoviscous effect of the magnetic fluid changed with the change of the magnetic field strength, which is shown in Figure 10. The measurement results from the two measuring setups are compared and the data from the new measurement system’s multiple measurements averaged. As the intensity of the magnetic field increased, the magnetoviscous effect of the magnetic fluid also increased, and there were some differences in the variation trend of the two curves.
When the magnetic flux density is low, the magnetic moment of the particles tries to align along the direction of the magnetic field. The magnetic torque offsets the free rotation of the particles in the flow, increasing fluid viscosity. According to the physical model of the hindrance of rolling on the particles by Hall and Busenberg [25], the viscosity ηr of magnetic fluid under magnetic field is as follows:
η r = 3 2 ϕ η 0 α tanh α α + tanh α < sin 2 β >
α = μ 0 m H k B T
where η0 is the zero magnetic field viscosity, ϕ’ denotes the volume fraction of the particles including the surfactant, β denotes the angle between the vorticity of the flow and the magnetic field direction, α is the ratio of magnetic and thermal energy, μ0 is the vacuum permeability, m is the magnetic moment of the particle, H is the magnetic flux density, kB is the Boltzmann’s constant, T is the absolute temperature and <…> denotes the spatial average of the respective quantity.
The expression(α − tanh(α))/(α + tanh(α)) in Equation (7) can be approximated as follows:
α tanh α α + tanh α 1 6 α 2
R 1 4 ϕ α 2 H 2
Thus, for weak magnetic flux density, the magnetoviscous effect of the magnetic fluid is proportional to the square of the applied magnetic field. Under higher magnetic flux density, the magnetic potential energy between particles is far greater than the van der Waals force interaction, so the magnetic dipoles are connected end to end to form a long chain structure and are arranged along the direction of the magnetic field. The viscosity of the magnetic fluid is mainly related to the chain length. The higher the magnetic flux density, the smaller the angle between single-strand orientation and the flow vortex. Odenbach [26] considered the conditions for breaking in a single strand to obtain the maximum single strand length before its breakage. The maximum number of particles in the single-chain structure is determined by the combination of shear rate and magnetic flux density.
n max = μ 0 18 η c γ ˙ M d 3 ( d + 2 s ) 3
where M = χH, ηc is the dynamic viscosity of the carrier liquid, M is the magnetization, χ is the susceptibility, d is the average particle diameter and s is the average thickness of surfactant layer.
The theory on magnetoviscous effect corresponding to a single particle or chainlike structures indicates varying trends of viscosity on the magnetic flux density. While the viscosity varies with the square of the magnetic flux density under a low field, a proportional relationship between viscosity and magnetic flux density can be established under a relatively high field. Comparing the two measurement results, the curve measured by the rheometer was generally linear, while the measurement data of the measuring system first accelerated in a curve and then tended to be linear, which is closer to the trend predicted by theory. The error in the measurement result of the rheometer may have been caused by the uneven distribution of the magnetic field.

4. Conclusions

A new method for measuring the magnetic-fluid flow curve is proposed based on plane Poiseuille flow. Commercial magnetic fluid and lab-made magnetic fluid were measured and analyzed, and the flow curves of the two magnetic fluids under different magnetic flux densities were studied. By comparison experiments, we showed that the novel measuring system can achieve accurate measurement of the viscosity of magnetic fluids. In particular, when measuring low-viscosity magnetic fluids, the new method eliminates the influence of the starting torque of the commercial rheometer, and the measured flow curve is smoother and closer to the factory value. By examining the variation trend of viscosity under certain constant stress, a more reliable method to determine the dynamic yield stress of magnetic fluid was used. Under the action of the magnetic field of 24 kA/m, the lab-made magnetic fluid exhibited obvious viscous bifurcation, from which the true dynamic yield stress was determined to be 0.5 Pa. The dynamic yield stress of the magnetic fluid measured by the new method was larger than the value obtained by the fitting, which is more reliable from the engineering point of view.

Author Contributions

Conceptualization, Z.L.; methodology, J.D.; formal analysis, D.L.; investigation, Y.H. and B.S.; data curation, J.D.; writing—original draft preparation, J.D.; writing—review and editing, Z.L. and D.W.; supervision, D.L. and Z.S.; project administration, D.W.; funding acquisition, H.C. All authors have read and agreed to the published version of the manuscript.

Funding

This research was funded by the National Major Scientific Research Instrument Development Project No. 51927810, Beijing Natural Science Foundation No. 2222072, the Fundamental Research Funds for the Central Universities No. 2021RC278, and the Fundamental Research Funds for the Central Universities No. 2022JBMC032.

Institutional Review Board Statement

Not applicable.

Informed Consent Statement

Not applicable.

Data Availability Statement

Data are available from the authors upon reasonable request.

Conflicts of Interest

The authors declare no conflict of interest.

References

  1. Li, D. Theory and Application of Magnetic Fluid; Science Press: Beijing, China, 2003. [Google Scholar]
  2. Beik, J.; Abed, Z.; Ghoreishi, F.S.; Hosseini-Nami, S.; Mehrzadi, S.; Shakeri-Zadeh, A.; Kamrava, S.K. Nanotechnology in hyperthermia cancer therapy: From fundamental principles to advanced applications. J. Control. Release 2016, 235, 205–221. [Google Scholar] [CrossRef] [PubMed]
  3. Vasilakaki, M.; Chikina, I.; Shikin, V.B.; Ntallis, N.; Peddis, D.; Varlamov, A.A.; Trohidou, K.N. Towards high-performance electrochemical thermal energyharvester based on ferrofluids. Appl. Mater. Today 2020, 19, 100587. [Google Scholar] [CrossRef]
  4. Xu, M.; Dai, Q.; Huang, W.; Wang, X. Using magnetic fluids to improve the behavior of ball bearings under starved lubrication. Tribol. Int. 2020, 141, 105950. [Google Scholar] [CrossRef]
  5. Wang, W.; Timonen, J.V.; Carlson, A.; Drotlef, D.M.; Zhang, C.T.; Kolle, S.; Grinthal, A.; Wong, T.-S.; Hatton, B.; Kang, S.H.; et al. Multifunctional ferrofluid-infused surfaces with reconfigurable multiscale topography. Nature 2018, 559, 77–82. [Google Scholar] [CrossRef]
  6. Paul, G.; Chopkar, M.; Manna, I.; Das, P. Techniques for measuring the thermal conductivity of nanofluids: A review. Renew. Sustain. Energy Rev. 2010, 14, 1913–1924. [Google Scholar] [CrossRef]
  7. Shah, R.R.; Davis, T.P.; Glover, A.L.; Nikles, D.E.; Brazel, C.S. Impact of magnetic field parameters and iron oxide nanoparticle properties on heat generation for use in magnetic hyperthermia. J. Magn. Magn. Mater. 2015, 387, 96–106. [Google Scholar] [CrossRef]
  8. Li, Z.; Li, D.; Chen, Y.; Yang, Y.; Yao, J. Influence of Viscosity and Magnetoviscous Effect on the Performance of the Magnetic Fluid Seal in Water Environment. Tribol. Trans. 2017, 61, 367–375. [Google Scholar] [CrossRef]
  9. Bahiraei, M.; Hangi, M. Flow and heat transfer characteristics of magnetic nanofluids: A review. J. Magn. Magn. Mater. 2015, 374, 125–138. [Google Scholar] [CrossRef]
  10. Ellahi, R. The effects of MHD and temperature dependent viscosity on the flow of non-Newtonian nanofluid in a pipe: Analytical solutions. Appl. Math. Model. 2013, 37, 1451–1467. [Google Scholar] [CrossRef]
  11. Gu, H.; Tang, X.; Hong, R.; Feng, W.; Xie, H.; Chen, D.; Badami, D. Ubbelohde viscometer measurement of water-based Fe3O4 magnetic fluid prepared by coprecipitation. J. Magn. Magn. Mater. 2013, 348, 88–92. [Google Scholar] [CrossRef]
  12. Yang, C.; Bian, X.; Qin, J.; Zhao, X.; Zhang, K.; Bai, Y. An investigation of a viscosity-magnetic field hysteretic effect in nano-ferrofluid. J. Mol. Liq. 2014, 196, 357–362. [Google Scholar]
  13. Matsuno, Y.; Itoh, J. Estimation of the yield stress of a magnetic fluid from flow curves. J. Magn. Magn. Mater. 1995, 149, 22–25. [Google Scholar] [CrossRef]
  14. Ren, Z.S.; Zheng, D.; Hu, L.Y.; Huang, C.B. Design and Analysis of a Novel Magnetorheometer. Appl. Mech. Mater. 2012, 101–102, 154–157. [Google Scholar] [CrossRef]
  15. Li, Z.; Li, D.; Chen, Y.; Cui, H. Study on the thixotropic behaviors of ferrofluids. Soft Matter. 2018, 14, 3858–3869. [Google Scholar] [PubMed]
  16. Møller, P.C.F.; Mewis, J.; Bonn, D. Yield Stress and Thixotropy: On the Difficulty of Measuring Yield Stresses in Practice. Soft Matter 2006, 4, 274–283. [Google Scholar] [CrossRef] [PubMed]
  17. Barnes, H.A. The yield stress—A review or ‘παντα ρει’—Everything flows? J. Non-Newton. Fluid Mech. 1999, 81, 133–178. [Google Scholar]
  18. Zubarev, A.Y.; Iskakova, L.Y. Yield stress in thin layers of ferrofluids. Phys. A Stat. Mech. Its Appl. 2006, 365, 265–281. [Google Scholar] [CrossRef]
  19. Schramm, G. A Practical Approach to Rheology and Rheometry; Gebrueder Haake: Karlsruhe, Germany, 1994; pp. 74–76. [Google Scholar]
  20. Drenckhan, W.; Ritacco, H.; Saint-Jalmes, A.; Saugey, A.; McGuinness, P.; van der Net, A.; Langevin, D.; Weaire, D. Fluid dynamics of rivulet flow between plates. Phys. Fluids 2007, 19, 102101. [Google Scholar] [CrossRef]
  21. Song, F.Q.; Wang, J.D. Investigation of Influence of Wettability On Poiseuille Flow Via Molecular Dynamics Simulation. J. Hydrodyn. 2010, 22, 513–517. [Google Scholar] [CrossRef]
  22. Li, Z.; Li, D.; Hao, D.; Cheng, Y. Study on the creep and recovery behaviors of ferrofluids. Smart Mater. 2017, 26, 105022. [Google Scholar] [CrossRef]
  23. Martin, J.E.; Anderson, R.A. Chain model of electrorheology. J. Chem. Phys. 1996, 104, 4814. [Google Scholar] [CrossRef]
  24. Nowak, J.; Borin, D.; Haefner, S.; Richter, A.; Odenbach, S. Magnetoviscous effect in ferrofluids diluted with sheep blood. J. Magn. Magn. Mater. 2017, 442, 383–390. [Google Scholar] [CrossRef]
  25. Hall, W.F.; Busenberg, S.N. Viscosity of magnetic suspension. J. Chem. Phys. 1969, 51, 137. [Google Scholar] [CrossRef]
  26. Odenbach, S.; Störk, H. Shear dependence of field-induced contributions to the viscosity of magnetic fluids at low shear rates. J. Magn. Magn. Mater. 1998, 183, 188–194. [Google Scholar] [CrossRef]
Figure 1. Components of the novel measuring system.
Magnetochemistry 08 00098 g001
Figure 2. Plane Poiseuille flow diagram: (a) the geometry of the problem and (b) the parallel inclined plates section [20].
Magnetochemistry 08 00098 g002
Figure 3. 3-DOF motion platform and flip platform coordinated movement.
Magnetochemistry 08 00098 g003
Figure 4. Measuring time and flow images under different angles.
Magnetochemistry 08 00098 g004
Figure 5. TEM image of the magnetic nanoparticles.
Magnetochemistry 08 00098 g005
Figure 6. Magnetization curve of lab-made magnetic fluid.
Magnetochemistry 08 00098 g006
Figure 7. Comparison of commercial magnetic fluid flow curves: (a) rheometer measurement results of magnetic fluid under different magnetic flux densities and factory value and (b) novel measuring system results of magnetic fluid under different magnetic flux densities and factory value.
Magnetochemistry 08 00098 g007
Figure 8. Comparison of lab-made magnetic fluid flow curves: (a) flow curve of magnetic fluid and fitted curves under different magnetic flux densities by the novel measuring system and rheometer and (b) change in magnetic fluid viscosity under low shear stress at 24 kA/m by the novel measuring system.
Magnetochemistry 08 00098 g008
Figure 9. Viscosity changes with shear stress under different magnetic fields.
Magnetochemistry 08 00098 g009
Figure 10. The influence of magnetic flux density on the magnetoviscous effect of magnetic fluid.
Magnetochemistry 08 00098 g010
Table 1. Physical parameters of commercial and lab-made magnetic-fluid samples.
Nanoparticle TypeSaturation Magnetization
(kA/m)
Viscosity
@20 °C (mPa·s)
Density
@20 °C (kg/m3)
EFH13591.22 × 103
Lab-made334641.27 × 103
Table 2. Basic parameters of L-AN46 total loss system oil.
Standard No.Kinematical Viscosity
@20 °C (mPa·s)
Density
@20 °C (kg/m3)
Flash Point
(°C)
Pour Point
(°C)
L-AN463270.92 × 103220−28
Table 3. Herschel–Bulkley fitting results on the flow curves of lab-made magnetic fluid.
Magnetic Flux Density
(kA/m)
knFitted Dynamic Yield Stress
(Pa)
00.39361.05780.1159
80.59920.99850.039
160.67981.04150.0377
240.69761.1590.3567
Publisher’s Note: MDPI stays neutral with regard to jurisdictional claims in published maps and institutional affiliations.

